Embed Size (px)
Citation preview

157“Naše more” 65(3)/2018., pp. 157-163
The Effect of Shape of Artificial Ground on Antenna Radiation PatternUčinak oblika umjetne ravnine na dijagram zračenja antene
DOI 10.17818/NM/2018/3.5UDK 621.396.6:629.5 621.396.6:629.7Review / Pregledni radPaper accepted / Rukopis primljen: 1. 12. 2017.
Gabriel Kalapoš Faculty of aeronautics Technical University of KošiceSlovakiae-mail: [email protected]
Martin Krchňák Faculty of aeronautics Technical University of KošiceSlovakiae-mail: [email protected]
Marek ČeškovičFaculty of aeronautics Technical University of KošiceSlovakiae-mail: [email protected]
Ján LabunFaculty of aeronautics Technical University of KošiceSlovakiae-mail: [email protected]
Michal SchreinerFaculty of aeronautics Technical University of KošiceSlovakiae-mail: [email protected]
Tomáš MoravecFaculty of aeronautics Technical University of KošiceSlovakiae-mail: [email protected]
SummaryThe article deals with an effect the change of shape of non-directional antenna‘s artificial ground plane has on the shape of its radiation diagram. In naval and aerial transportation, the artificial ground plane is the plane’s fuselage or ship’s hull. Experimental measurements of antenna’s amplitude and phase ratios are presented in the article. These point to the fact that even a small change of artificial ground plane’s shape has a big impact on the shape of its radiation diagram. The shape was gradually changed from circular to ellipsoidal. This ellipsoidal shape was used because the ground plan of a plane or a ship can be simplified to a slender ellipse. It is generally known that dimensions of the artificial ground plane influence the directional diagram of the antenna. However, this change occurs as a result of phase ratios changes of emitted signal on the surface of the artificial ground plane. The knowledge gained in this area can contribute to a better understanding of the topic. This could change the view on the shapes of radiation diagrams of antennas placed on vehicles of complex shapes. The motivation of the article was a real requirement for placing an antenna of a new communication system on a complex plane fuselage. The article compares measurements of amplitude and phase ratios of two antenna systems in 2D and 3D view.
SažetakU ovome radu govori se o učinku promjene oblika umjetne ravnine neusmjerene antene na dijagram zračenja. U pomorskom i zračnom prijevozu umjetna ravnina jest trup zrakoplova ili broda. Prikazana su eksperimentalna mjerenja odnosa između amplitude i faze antene. Mjerenja upućuju na činjenicu da čak i najmanja promjena oblika umjetne ravnine znatno utječe na oblik dijagrama zračenja. Oblik se postupno mijenjao iz kružnog u elipsasti. Elipsasti oblik koristio se jer se tlocrt aviona ili broda može pojednostavnjeno prikazati kao tanka elipsa. Poznato je da dimenzije umjetne ravnine utječu na smjer dijagrama antene. Međutim, ova promjena rezultat je promjena u odnosima faze emitiranog signala na površini umjetne ravnine. Znanje stečeno u ovome području može pridonijeti boljem razumijevanju problema. Time se može promijeniti perspektiva o oblicima dijagrama zračenja antena postavljenih na vozila složenih oblika. Motivacija za ovaj rad bila je stvarna potreba za postavljanjem antene za novi komunikacijski sustav na složeni trup zrakoplova. U radu se uspoređuju odnosi izmjerenih amplituda i faza dvaju antenskih sustava prikazanih u 2D i 3D formatu.
KEY WORDSradiation patternartificial groundantennaphasemagnitude
KLJUČNE RIJEČIdijagram zračenjaumjetna ravninaantenafazamagnituda
1. INTRODUCTION / UvodCurrent knowledge about shaping of final radiation pattern in asymmetric antennas is based on the theoretical knowledge and physical characteristics of antennas themselves. The dimensions and shape of their artificial ground plane greatly influence the final radiation pattern. When placed on means
of transport, such as ship or airplane, the various shaped metal surface forms the artificial ground plane of the antenna. The position of the antenna against the complex shape of such an object creates local maxima and minima of radiation, which greatly deforms the resulting radiation characteristic [1], [2].

158 G. Kalapoš et al: The Effect of Shape...
From the safety point of view, the general requirement is for non-directional antennas to have circular radiation. In order to evaluate the final radiation characteristic of the antenna, it is currently possible to use the results either of the experimental measurements or one of the several computer simulation options [2], [11]. Both of the methods are unfortunately very time consuming. New knowledge about shaping of the phase ratios of electromagnetic waves on the complex shape of the artificial ground could significantly speed up the processing of the results. In the following illustration (Figure 1) there are two examples of different transport means in which the density of the surface currents generated by the antenna system is represented with associated colours. As can be seen in the figure, the surface current is largely influenced by the shape of the surface of means themselves.
Figure 1 Visualisation of surface currents generated from antennas mounted on jet fighter and ship [3]
Slika 1. Prikaz površinskih struja koje stvaraju antene postavljene na mlaznom borbenom zrakoplovu i brodu [3]
2. THE THEORY OF PHASE MEASUREMENT OF ANTENNA SYSTEM / Teorija o mjerenju faza antenskog sustavaIt is necessary to know the magnitude and phase of transmitted and received electromagnetic waves in order to describe the antenna radiation pattern completely. Assuming that the antenna transmits on the frequency f and the field proceeds in the direction +y, at some point, the field can be expressed as:
(1)
where A is the magnitude of x- element of the E field, B is the magnitude of z-element of the E field, D is the phase of x-element of the field and F is the phase of z-element of the field. Electric part of E field is orthogonal to direction of wave propagation in near field of radiation. If D=F, the elements are in phase and the polarisation of wave is linear. If there is a π/2 [rad] shift between D and F and amplitudes are equal, the field has circular polarisation [4].
The measurement of phase ratios requires source of reference signal and measured signal. Ideally, these sources should be in phase and coherent. The tested antenna is used as a transmitting antenna and the second (reception) antenna is used as a reference. The received signal from the antenna and the reference signal from the generator both enter into the phase evaluation circuit. The circuit determines the phase difference (the relative phase) of both signals. Measurement antenna has to have suitable polarisation to be able to receive one of the received field elements. Antenna should be twisted or another antenna with corresponding polarisation should be used in order to obtain the second element of the field [1], [2].
2. THE METODOLOGY OF MEASUREMENT OF PHASE AND AMPLITUDE CHARACTERISTICS OF ANTENNA / Metodologija mjerenja karakteristika faze i amplitude anteneThe measurement of radiation characteristics can be done at downscaled models of real transport vehicles, but the scale compliance is a must. For creation of 3D radiation pattern, it is necessary to move antenna cylindrically, spherically or planary in measurement space. The critical aspect of a precise measurement is the compliance of the same distance between transmitting and receiving antenna. This minimum distance can be determined by equation known as Fraunhofer distance [5]:
(2)
where R is the distance between transmitting and receiving antenna, D is the size of tested aperture and λ represents the wavelength [5].
In case of multiband antenna, such measurement requires to set up several virtual radiuses, each for every selected frequency band. The problem can occur when such antenna is able to radiate simultaneously in low frequency and high frequency band.
The dynamic range of the measuring device must be sufficient to cover such a wide frequency band. At low frequencies, a larger dynamic range is required due to the loss of wave energy during environment propagation.
The best method to gain the desired valid results consists of:1. Usage of the tested AUT antenna as a receiving antenna2. Letting the antenna radiate in its own bandwidth and
measure on its resonant frequency3. Usage of the transmitting antenna as a stationary and
rotating the tested AUT antenna around its phase midpoint4. Obtaining the change of distance between antennas in
such a way, that in case of usage of multiple transmitting antenna in multiple distances the tested AUT antenna will be stationary [2], [8].Evaluation devices use the phase detectors principle. Phase
detectors are commonly used as a main part of phase locked loops. In general, the phase detectors compare the phase of two signals, which are connected to the comparator input. The output of phase detector is named the error signal ve(t) and is in form of voltage, which is equal to the phase between two phases of signals from inputs :
(3)
where KD is the gain of the phase detector, ɸo is output phase of phase locked loop, ϕi phase of input signal to phase locked loop. According to [6], equation (3), which is valid only for phase locked loops can be rewritten as (4):
(4)
where KD is the gain of the phase detector, ϕi1 is a phase of first input signal, ϕi2 is a phase of second input signal.
The analogue counter or mixer can be used as a simple phase detector. The counter will execute the multiplication of two input signals:
(5)

159“Naše more” 65(3)/2018., pp. 157-163
where A is amplitude of first signal, B is amplitude of second signal, ω0 is angular frequency, t is time, ϕA and ϕB are phases of input signals. Frequency of the output is two times bigger and the direct part is equal to the cosine of phase difference. The alternating part is separated by filter at mixer output. The phase difference will appear as a DC voltage on output. The shape and gradient of characteristics can differ by the circuits needs [6]. When the phase difference is equal to π, the output voltage of detector will be equal to positive supply voltage. Zero output voltage is equal to π/2 phase difference between inputs in case of dual power supply detector. In case of single supply, this level is equal to Vdd/2.
Figure 2 The general output characteristics of XOR phase detector [6]
Slika 2. Opće izvedbene karakteristike XOR faznog detektora [6]
3. EXPERIMENT AND RESULTS / Eksperiment i rezultatiMeasurement system with IC AD8302 with two identical amplifiers in monolithic form was set for real measurements of phase ratio on antennas. The input channels are able to measure magnitude of signals within 30dB from frequencies starting at tens of MHz up to 2,7GHz. The main function for amplitude (gain) is the output in the following form:
(6)
where VA and VB are two independent signals connected to two identical input ports of AD8302, VCP is the middle point, which is defined as a value of VMAG output to level of 0 dB [7].
AD8302 is also capable of measuring the phase difference between two signals at inputs. Each of log – amplifiers generates “hard limited” output. Those signals enter the two multipliers who are realised as phase detectors with precise mutual symmetry in respect to its doubled inputs in range of 180°. The output phase ratio VPHS is given as:
(7)
where Vϕ is the voltage scaling on phase output, ϕ is the phase difference between two inputs. The choice of character depends on in what quadrant the interval of 180° is. By including this function to the AD8302, it can behave as a “vector analyser on one chip” [7].
Figure 3 The constructed vector analyserSlika 3. Konstruirani analizator vektora
3.1. Design and realisation of measurement antennas / Dizajn i izvedba antena za mjerenjeThe universal radiator with SMA connector was made for realisation of the measurements. This radiator is illustrated in picture below. It was made from brass rod with diameter of 4mm. For designated frequency of 1,2 GHz the length of 56mm was used. Simple monopole antenna is easy to made and tune for the best results. Ideal radiation diagram of monopole antenna has circular pattern so fluctuations of radiation patterns caused by shape of artificial ground should be clearly visible [9], [10].
Source: Authors archiveFigure 4 The universal radiator for frequency of 1,2 GHz
Slika 4. Univerzalni radijator za frekvenciju od 1,2 GHz
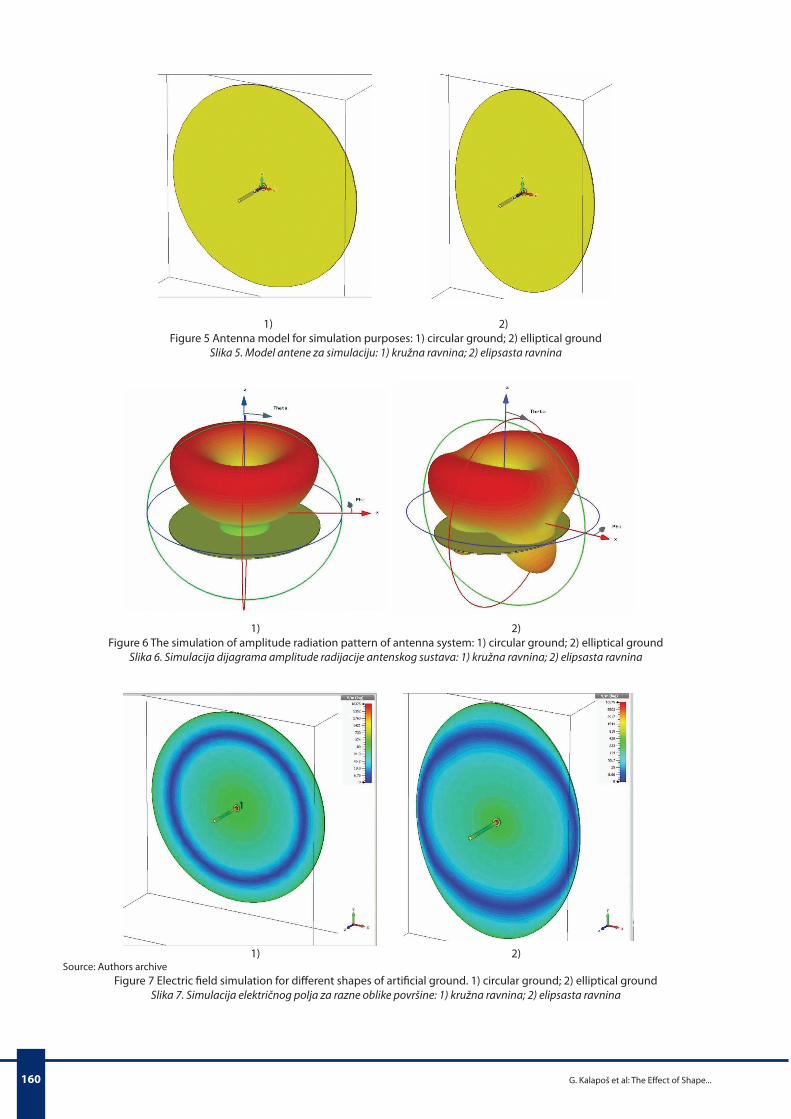
In the next step, the radiator was mounted into the centre of artificial grounds. Figure 5 show the used artificial grounds. Figure 5 part 1), shows the cylindrical artificial ground with radius of 125 mm and in Figure 5 part 2), there is an elliptical artificial ground with radius r1=125mm and r2=93,75mm. In case of antenna with cylindrical artificial ground the radiation pattern will be also cylindrical. However, on antenna with elliptical artificial ground the radiation maxima can be seen in area of extended radius r1. Also the radiation minima will appear in shortened radius r2.
Figure 7 shows the simulated electric fields of examined antenna systems fed with input signal with phase of 100°. The blue colour represents the smallest – almost zero electric field of 0 V/m and thus we can consider it as a phase leading edge. In first case we can see that the phase leading edge is spread out evenly on whole circular surface of the artificial ground. But in case of elliptical artificial ground, the leading edge is leaving the surface earlier in thinner part r2, thus for formation of phase leading edge which would leave the antenna system evenly, we need to slow down the electromagnetic wave in narrower parts r2.
160 G. Kalapoš et al: The Effect of Shape...
1) 2)Figure 5 Antenna model for simulation purposes: 1) circular ground; 2) elliptical ground
Slika 5. Model antene za simulaciju: 1) kružna ravnina; 2) elipsasta ravnina
1) 2)Figure 6 The simulation of amplitude radiation pattern of antenna system: 1) circular ground; 2) elliptical ground
Slika 6. Simulacija dijagrama amplitude radijacije antenskog sustava: 1) kružna ravnina; 2) elipsasta ravnina
1) 2)Source: Authors archive
Figure 7 Electric field simulation for different shapes of artificial ground. 1) circular ground; 2) elliptical groundSlika 7. Simulacija električnog polja za razne oblike površine: 1) kružna ravnina; 2) elipsasta ravnina

161“Naše more” 65(3)/2018., pp. 157-163
3.2. Measurement process description / Opis procesa mjerenjaThe two sets of measurements with the same types of monopole antennas tuned to frequency of 1,2GHz were done. For evaluation of the effect of artificial ground on radiated signal phase, each of used antennas had different shape of the artificial ground [10]. The antennas were gradually placed on automatic rotating platform, which was capable of rotation in range from 0 to 360° with step of 5° and with elevation angles varied from 0° to 90° with 5° step. After each step, the sample of phase and amplitude was collected by measurement system and stored into computer.
Source: Authors archiveFigure 8 Illustration of measurement setup
Slika 8. Prikaz plana mjerenja
The R&S SMA100A generator was used as a source of 1,2 GHz signal. Output amplitude was set to 0dBm. The reference signal was taken via directional coupler based on microstrip
line. Directional coupler was designed and manufactured directly for these experiments. Transmitting and receiving antenna were placed in Frankonia anechoic chamber. The ETS – Lindgren model 3155 antenna capable of operation in range from 750 MHz to 18 GHz was used as a transmitter. As a receiver, we used the antenna system constructed on our own. 16bit A/D converter with 2.2V reference value was used for precise measurements of phase comparators actual values.
For acquisition of relevant results, we have measured real amplitude and phase transmission characteristics of AD3802 phase comparator. Measurement process was automatized by using mbed platform with STM32 microcontroller and NI DAQ USB device. Control software was created in LabView IDE.
3.3. Visualisation of measured results / Vizualizacija izmjerenih rezultataThe Freemat software environment was used for processing of acquired data. Results are illustrated in 2D and 3D form. Figure 9 shows the 3D measured amplitude and phase characteristics for different shapes of artificial grounds. Amplitude (Figure 9 part A) and phase (Figure 9 part B) characteristics are valid for circular artificial ground. Similarly, Figure 9 part C and Figure 9 part D are amplitude and phase results for elliptical artificial ground. For better analysis of results, 3D diagrams are not very reliable. They show general picture of diagrams, but we are not able to get any exact values. For this reason, the 2D diagram was made. Further analysis was taken from 2D diagrams. When we compare measured results in Figure 9 part A and simulated diagrams Figure 6 part 1) we can see similarity.
Figure 10 illustrates measured and processed results in 2D form, where X axis is an angle of rotation Phi. Value of Phi is in range from 0°to 360°. On the Y axis, there is the elevation angle Theta with range from 0°to 180°. Angle Theta was measured in
Figure 9 3D amplitude and phase characteristics of antennas: A) amplitude characteristic of antenna with circular ground; B) phase characteristic of antenna with circular ground; C) amplitude characteristic of antenna with elliptical ground; D) phase
characteristic of antenna with elliptical ground
Slika 9. 3D karakteristike amplitude i faze antena: A) karakteristike amplitude antene na kružnoj ravnini; B) karakteristike faze antene na kružnoj ravnini; C) karakteristike amplitude antene na elipsastoj ravnini; D) karakteristike faze antene na elipsastoj ravnini

162 G. Kalapoš et al: The Effect of Shape...
range 0° to 90° and then mathematically offset to desired range for better illustration and comparison with results from simulation software. Figure 10 contains four different parts labelled as A1, B1, C1 and D1. Parts A1 and B1 are valid for radiator with circular artificial ground. Figure 10 part A1 is the amplitude characteristic and B1 is the phase characteristic. As in the previous case, C1 and D1 parts are valid for elliptical artificial ground.
In case of circular antenna (Figure 10 part A1), the amplitude ratios are constant in every angle of elevation. Also in case of Figure 10 part B1, the phase ratios are constant in every angle of elevation.
The second elliptical (Figure 10 part C1) antenna has the amplitude ratios with presence of two local maxima on 90° and on 270° Phi angle of rotation and on Theta 60° elevation. Two local minimums are present on Phi 0° and 180° and Theta 60° elevation. In case of (Figure 10 part D1), phase ratios are significantly visible and it confirms that where the local maxima of amplitude radiation characteristic is present, there is also maximum change of phase ratios of transmitting.
4. CONCLUSION / ZaključakAnalysis of how artificial ground planes shape influence the radiation pattern of antennas is the main topic of the submitted article. For that reasons, amplitude and phase ratios on the shaped artificial ground plane of radiated signal were investigated. It required establishing a methodology for experimenting, developing and manufacturing a special
measurement instrument for phase and amplitude ratio measurements. Frequency range 1.2 GHz for measurements was chosen by scaling dimensions of communication antenna on large transport vehicle. Available laboratory space did not allow working with large objects so scaling was necessary. By using those measurement instruments, the amplitude and phase ratio for elliptical and circular artificial ground plane were measured and evaluated. Results confirmed that phase ratio varied with angle antennas rotation and shapes of artificial ground plane. For the first antenna system with circular ground plane, a constant phase ratio at whole range from 0°to 360° was expected. It would represent a circular radiation pattern. These expectations based on theoretical facts were fulfilled for amplitude ratios as well as for phase ratios. Second antenna system with elliptical artificial ground plane has slightly a deformed radiation pattern. These patterns are showing a creating of local minimum and maximum of amplitude and phase which were not present in radiation diagrams with circular ground plane. Ellipse was created by shortening the diameter of circular ground in one axis. Signal leaves the artificial ground plane edge with different phase at the shortened edge than at the longer edge. Radiation patterns are influenced by phase differences of radiated signal from antenna system. Knowledge and understanding of theoretical physics laws of phase ratio shaping on the artificial ground, for example on the surface of a transport vehicle can allow us to approximate the shape of radiating characteristic of antenna without measurement.
Figure 10 2D amplitude and phase characteristics of antenna: A1) amplitude characteristic of antenna with circular ground; B1) phase characteristic of antenna with circular ground; C1) amplitude characteristic of antenna with elliptical ground; D1) phase
characteristic of antenna with elliptical ground
Slika 10. 2D karakteristike amplitude i faze antenna: A1) karakteristike amplitude antene na kružnoj ravnini; B1) karakteristike faze antene na kružnoj ravnini; C1) karakteristike amplitude antene na elipsastoj ravnini; D1) karakteristike faze antene na elipsastoj ravnini

163“Naše more” 65(3)/2018., pp. 157-163
REFERENCES / Literatura[1] Macnamara, T. (2010). Introduction to Antenna Placement and Installation.
Wiley. https://doi.org/10.1002/9780470686874[2] Hansen Jesper, E. (1988). Spherical Near-field Antenna Measurements. IET.
https://doi.org/10.1049/PBEW026E[3] https://altairhyperworks.com/solution/Electromagnetics [accessed: 24. 4. 2018][4] Measuring Phase. http://www.antenna-theory.com/measurements/phase.
php [accessed: 18. 10. 2017][5] Kopecky, P., Zavodny, V. (2015). “Measurement of far-field patterns of phased
array antennas”. Conference on Microwave Techniques (COMITE) 2015.https://doi.org/10.1109/COMITE.2015.7120333
[6] Long, S. (2005). Phase Locked Loop Circuits Courses. ECE Department, University of California, Santa Barbara.
[7] Analog Devices: datasheet AD8302: RF/IF Gain and Phase Detector. Rev. A 2002.
[8] Hu, C. et al. (2017). “Amplitude and Phase Errors Analysis on Spherical Multi-Probe Antenna near-Field Measurement”. 2017 IEEE Conference on Antenna Measurements & Applications (CAMA). https://doi.org/10.1109/CAMA.2017.8273373
[9] Breinbjerg, O. (2016). “Spherical near-field antenna measurements – the most accurate antenna measurement technique”. IEEE International Symposium on Antennas and Propagation, Puerto Rico, June 2016, pp. 1019-1020. https://doi.org/10.1109/APS.2016.7696217
[10] Qureshi, M., Schmidt, C., Eibert, T. (2013). “Adaptive sampling in spherical and cylindrical near-field antenna measurements”. IEEE Antennas Propag. Mag., Vol. 55, No. 1, pp. 243-249. https://doi.org/10.1109/MAP.2013.6474537
[11] Kepéši, V., Labun, J., “Radar Signal Attenuation due to Finite Radome Thickness”. OUR SEA: International Journal of Maritime Science & Technology, Vol. 62, No. 3 (Special Issue), pp. 200-203.