Embed Size (px)
Citation preview
The Effect of Stock Spam on Financial Markets
WORKING PAPER
Rainer Bohme1 and Thorsten Holz2
1 Institute for System Architecture, Technische Universitat [email protected]
2 Laboratory for Dependable Distributed Systems, University of [email protected]
Abstract. Spam messages are ubiquitous and extensive interdisciplinaryresearch has tried to come up with effective countermeasures. However,little is known about the response to unsolicited e-mail, partly becausespammers do not disclose sales figures. This paper correlates incomingspam messages that promote the investment in particular equity securi-ties with financial market data. We use multivariate regression modelsto measure the impact of stock spam on traded volume and conduct anevent study to find effects on market valuation. In both cases we havefound evidence for significant reactions to spam campaigns in the shortrun. Theoretical and practical implications of the findings are addressed.
Keywords: Stock Spam, Event Study, OTC, Unsolicited Bulk E-Mail,Economics of Information Security [JEL G14, D84, M30, C88]
1 Introduction
Unsolicited bulk e-mails (UBE) are messages sent blindly to a very large numberof recipients. This phenomenon commonly known as spam is increasingly causingproblems in communication networks and undermines the usefulness of e-mail ascommunication medium. Spammers, the individuals who send UBE, often workin secrecy. Therefore little is known about their proceeding, and almost nothingabout their success in terms of response pattern and rates.
Spam is an annoying problem for both business and private users of e-mail.A recent study reports that almost 70 % of all e-mail messages received by an av-erage Internet user are spam messages [1]. In typical spam messages, the senderadvertises goods and services, e.g., pharmaceutical products, mortgages, or ac-cess to certain websites. Besides being an annoyance, this flooding with unso-licited e-mail messages is also an information security problem. It is comparableto Distributed Denial-of-Service (DDoS) attacks that let computer systems orentire networks fail to deliver the intended functions by overloading it with a highnumber of unnecessary service requests. There exist no effective countermeasuresagainst this sort of attack. The losses caused by spam are also economically sig-nificant. The economic costs associated with spam can be broadly separated intothree classes, namely waste of bandwidth, waste of storage capacity, and wasteof human (employees’) time to sort out unsolicited messages [2].
Revision 0.5: Workshop on the Economics of Information Security (WEIS)Univ. of Cambridge, UK, June 2006
In this paper, we try to shed some light into the question whether and howrecipients react to spam messages. We do this by regarding a specific form ofspam, namely stock spam that advertises equity securities traded on over-the-counter (OTC) markets. This allows us to correlate spam arrival from a numberof probe e-mail accounts with publicly available market data and thus drawinference on the effectiveness of UBE.
The paper is structured as follows: In Section 2, we briefly review prior art onthe economic reasons for the spam problem, possible countermeasures, as well asempirical work related to our contribution. Section 3 analyzes the effect of stockspam on the stock market. We use multivariate regression models to assess theimpact of stock spam on traded volume and an event study method to measurethe influence of stock spam on market price developments. We conclude thepaper with a discussion on the limitations of our approach and directions forfuture work (Section 4).
2 Background and Related Work
Spam has a track record in the literature of many areas. Network security mainlystudies how spammers operate by taking over hundreds of badly maintained com-puters to use their bandwidth [3]. Scholars in computer-linguistics and machinelearning deal with the construction of efficient filter algorithms [4]. And socialscientists try to understand the motivations of spammers and conceive appropri-ate policy measures to tackle the problem from a legal and economic side. Herewe review only the latter aspects in more detail.
2.1 Economics of Spam and Countermeasures
It has been argued many times that spam is largely a problem of economicincentives [5, 2]. The extraordinary small costs per offer placement make it thepreferred medium for advertising products on the “long tail” of the demandcurve, which cannot be efficiently promoted with traditional means of advertising(see Table 1). As the cost per contact is so low, spammers do not bother abouttargeted distribution and already very tiny response rates let the business modelbreak even. The resulting inefficiencies due to information overflow have beenstudied both in formal economic models [6] and in laboratory experiments [7].
Besides technical solutions using filter mechanisms and laws for litigation anddeterrence, it has been suggested that increasing the cost of sending a messagewould solve the problem at its roots. In the absence of a suitable micro-paymentsystem and due to the differences in income among Internet users, Dwork andNoar [9, 10] first suggested in 1992 to use computing cycles as a unit of account.In the so-called “proof-of-work” schemes, the sender of an e-mail must enclosethe solution of a unique and computational hard problem, which is verified atthe recipient’s mail server before delivery. For legitimate use of e-mail, this com-putation should not result in unacceptable delay. However, spammers wouldnot be able to send bulk messages since their (finite) computing resources are
2
Table 1. Cost of offer placement for common approaches
Total cost Number of recipients Cost per recipientDirect mail $ 9,700 7,000 $ 1.39Telemarketing $ 160 240 $ 0.66Print - targeted $ 7,500 100,000 $ 0.075Print - general $ 30,000 442,000 $ 0.067Fax $ 30 600 $ 0.05Online ads $ 35 1,000 $ 0.035Spam $ 250 500,000 $ 0.0005
Source: [8]
constrained. One possibility to construct such hard-to-solve but easy-to-verifyproblems uses hash functions and is therefore known as hashcash [11]. Laurieand Clayton [12] criticize these proposals for two reasons. First, the additionalproblem-solving burden would also affect legitimate users to a non-negligble ex-tent. Second, spammers access insecure end-user machines to steal processingcycles and solve puzzles. Instead they suggest using CAPTCHAs [13], a classof proof-of-work puzzles that requires human interaction, which is presumablymore difficult to “steal”. Other approaches target in similar directions, such asLoder et al. [6], who propose a scheme in which the recipient of a message candecide whether or not to charge the sender, and Fahlman [14], who suggestsmaking attention to a tradable good by allocating “interrupt rights”. It is up tosee in the future whether such schemes can result in socially optimal outcomes.
2.2 The Stock Spam Business Model
The general proceeding of spammers and the underlying business model is sim-ple. Spammers act rationally and try to maximize their (risk-adjusted) expectedprofit, similar to all other types of economic agents. In contrast to other sortsof sales spam, stock spammers do not directly offer a product or service. Theyrather speculate on positive price developments of thinly traded stocks after theyhave been hyped in thousands of messages sent to possible investors. The contentof such spam messages often pretends to be a misdirected investment advice, en-riched with financial terms and recent price quotes. Especially in low liquiditymarkets with few information coverage, the mere attention of a particular stockmay stimulate an investment decision [15]. If one believes that many people fol-low such dubious “investment advices” then jumping on the bandwagon is notirrational, since virtually everybody could profit from speculative gains in theresulting bubble. The persistence of such spam, as well as the results presentedbelow, let us conclude that this pump-and-dump strategy actually works.
It might even work so well that “e-mail marketing” of stocks is openly offeredon the Internet. For example, Expedite [16] claims that
“[...] e-mail marketing .com is a full service OTC Pink Sheet Stocks e-mail mar-keting company that can e-mail out your OTC stocks newsletter to the masses.[...] With our stable and reliable network and bandwidth, we can service anysize of OTC Pink Sheet stock awareness campaign.”
Our analysis below will show how the masses react . . .
3
2.3 Stock Spam Watchers
Stock spam has been discussed so far on a number of blogs, and some websitescollect information on stock spam information. Cyr runs a Spam Stock Tracker[17] since March 2005, where he keeps track of the performance of securitiesthat have been advertised in spam messages. For each unique stock, he adds1,000 shares to a fictive portfolio. As of March 15th, 2006, he (virtually) suffereda net loss of US$ 27,827 bar transaction costs. This shows that the long-termperformance of advertised stocks has been negative on average. In contrast to thislong-term analysis, Richardson’s Stock Spam Effectiveness Monitor [18] providesa graphical summary of the intra-day development of advertised stocks. Finally,the web source [19] lists an (incomplete) collection of affected firms together withexample messages, and McIntyre [20] requests and collects comments from firmsthat were cited in stock spam messages. Hence, to the best of our knowledge,this paper seems to be the first academic study dealing with stock spam.
2.4 Related Event Studies
Later in this paper we will use the event study methodology to empirically mea-sure the influence of stock spam dissemination on the market price developmentof the affected stocks. This method is a standard approach that has been appliedto numerous research questions in finance and economics [21]. The method is alsonot novel in the context of computer security. Several authors have investigatedthe impact of public security incident reports on the stock market valuationof affected firms [22–24] and software vendors [25]. All studies consistently re-port a negative and significant market impact. The event study methodologyhas also been applied in analyses of “serious” investment advice (unlike stockspam), however with varying results. In [26] the independent variable is con-structed from recommendations of financial analysts, whereas the authors of[27] use recommendations printed in the mass media as predictor for stock pricedevelopment. We are not aware of a paper that discusses particularities of theevent study methodology for small- and micro-caps, the type of stocks we regardin our analysis.
3 Stock Market Impact of Unsolicited E-Mail
The empirical work described in this section is the core of our contribution. Westart with a presentation of the data source (3.1), then continue with descriptiveanalyses of stock spam activity (3.2) before we analyze the impact of stock spamarrival on traded volume (3.3) and market valuation (3.4). As the methodologydiffers between variables of interest, we discuss it in the respective sections.
3.1 Data Acquisition
Our empirical study is based on the following data sources. The spam eventswere downloaded from Richardson’s Stock Spam Effectiveness Monitor (SSEM)
4
archive [18]. The data comprises 21,935 stock spam messages between Novem-ber 2004 and February 2006. The messages were extracted automatically froma number of spam collecting e-mail addresses. On average, 3 % of all incomingmessages were classified as stock spam [18]. The corpus of spam messages cites391 unique stocks, which corresponds to about 5 % of all stocks listed on the rel-evant OTC markets: 68 % of the stocks in our sample are listed on the NationalQuotation Bureau’s (NBC) Pink Sheets, a financial services company distribut-ing real-time price information on over-the-counter transactions of penny stocks.The remaining part refers to stocks quoted on the OTC bulletin board (OTCBB),a similar entity for public firms that fulfill some financial reporting requirementsbut still do not meet the rigorous listing standards of the major U. S. exchanges[28]. We believe that stock spam exclusively targets small- and micro-cap securi-ties (so-called penny stocks) because the spammers bargain for a positive marketimpact due to their activity. Market impact, i.e., the reaction of the market priceon individual orders, is generally higher for low liquidity securities. To assess thevalidity of this data source we compared some of the stock spam messages inthe authors’ personal e-mail accounts to SSEM data and found a relatively goodcorrespondence with respect to the stocks cited on specific days.1
Daily price quotes for the affected tickers2 were downloaded from YahooFinance [29]. Unfortunately, no historical data was available for a number oftickers. Therefore the usable data set was reduced to 111 (28.4%) tickers and7606 (34.7 %) relevant spam messages. There is no obvious reason to suspect thatthis selection systematically affects the results due to a coverage error betweenthe stocks where data is available in Yahoo Finance and those where it is not.Future research can improve validity by acquiring more complete financial data.
To assess the contribution of a market model in the event study [21], weselected three daily market indices: Standard & Poor’s 500 and NASDAQ Com-posite were both obtained from Yahoo Finance. They are very common indicatorsfor general stock market performance in the U. S., but both are computed fromhigh liquid securities only. Therefore we decided to include Russell’s daily micro-cap index as well. Its historical data (until December 2005) has been downloadeddirectly from the data provider’s website [30].
3.2 Descriptive Data Analysis
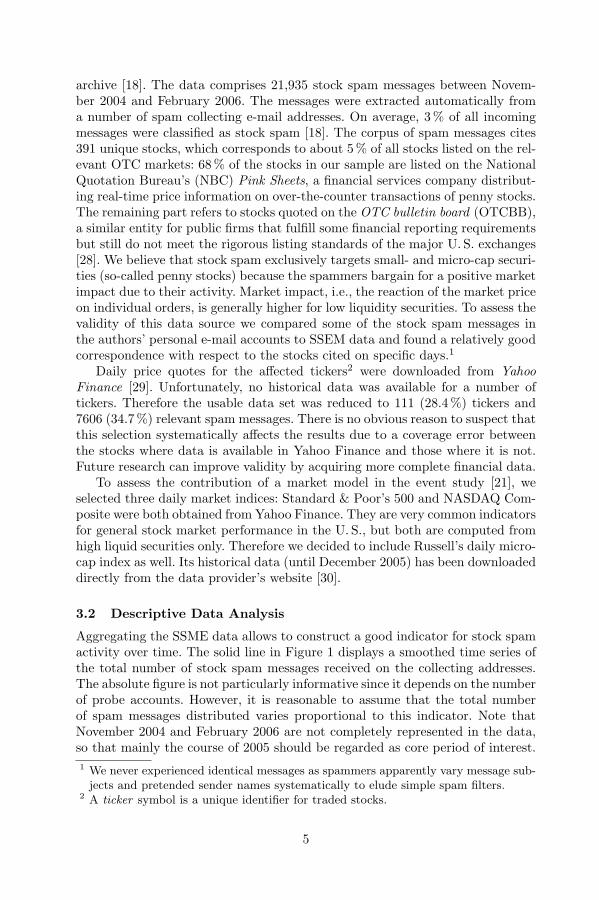
Aggregating the SSME data allows to construct a good indicator for stock spamactivity over time. The solid line in Figure 1 displays a smoothed time series ofthe total number of stock spam messages received on the collecting addresses.The absolute figure is not particularly informative since it depends on the numberof probe accounts. However, it is reasonable to assume that the total numberof spam messages distributed varies proportional to this indicator. Note thatNovember 2004 and February 2006 are not completely represented in the data,so that mainly the course of 2005 should be regarded as core period of interest.1 We never experienced identical messages as spammers apparently vary message sub-
jects and pretended sender names systematically to elude simple spam filters.2 A ticker symbol is a unique identifier for traded stocks.
5
Stock Spam Activity
Time
Inte
nsity
(30
day
s M
A, s
cale
d)
N D J F M A M J J A S O N D J F
2004 2005 2006
2004 2005 2006
Stock spam messages received (avg.=45.2, max.=368)Unique tickers cited per day (avg.=4.4, max.=14)Cumulative number of tickers cited (max.=391)
Fig. 1. Time series of total stock spam messages in the data set (n = 21, 935). Jointgraph of a) 30-day moving average of daily message arrivals (solid line), b) 30-daymoving average number of different tickers cited in one day’s total spam (dashed line),and c) cumulative number of affected companies over time (dotted line). All seriesare scaled to a unit interval. Only a small subset of these events is included in themultivariate analysis.
We are not aware of examples where more than one ticker is mentionedper spam message, but for the majority of days the data contains references toa number of different tickers in separate messages. Therefore the dashed lineshows the development of the number of unique ticker symbols being cited inthe total stock spam of each day. It would be too far-fetched to interpret thisas a sign of competition between spammers, but it is also difficult to imaginehow this “diversity” could be planned to support one single spammer’s strategy.Imagine it were a sign of competition, then we could interpret the dynamicsbetween number of unique tickets and the number of messages as a decline incompetition from August 2005 onwards. In other words, spammers concentrateagain on fewer tickers per day after they drove the number up to 14 in August2005 (here the absolute numbers make sense if we believe that the data does notsystematically miss large parts of stock spam traffic).
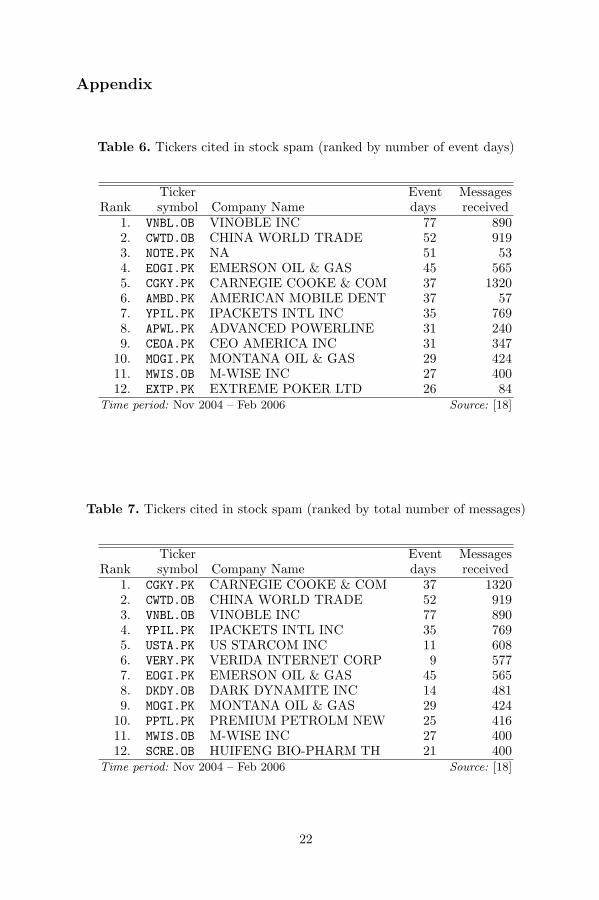
The dotted line in Figure 1 shows the cumulative number of tickers beingcited in stock spam from the beginning of the data set. It tells us that constantlynew firms become victims of stock spammers. At the same time, some stocksremain targets of spam attacks for quite a long time and thus accumulate animpressive number of messages distributed over up to 77 event days. See Tables6 and 7 in the appendix for a ranking of the most seriously hit tickers by numberof events and total messages, respectively.
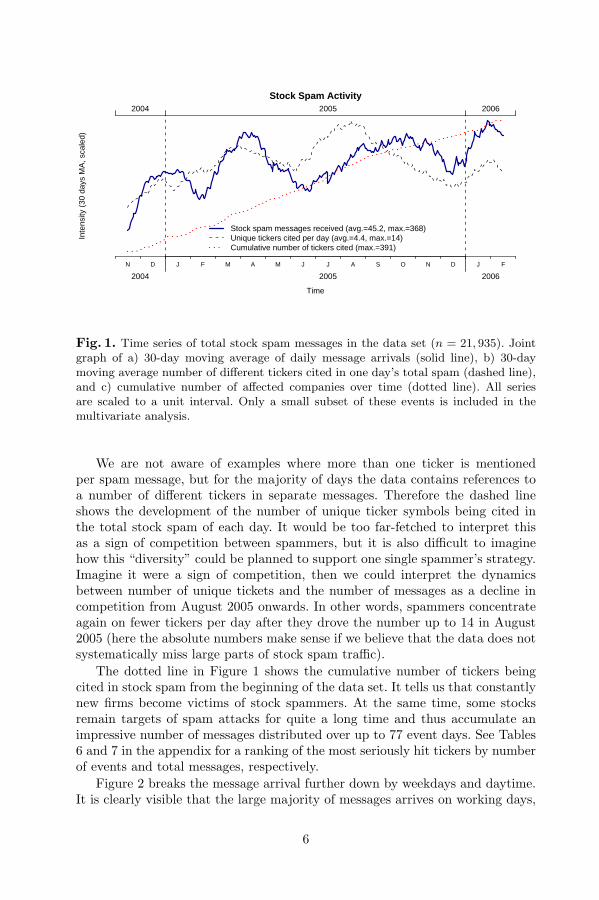
Figure 2 breaks the message arrival further down by weekdays and daytime.It is clearly visible that the large majority of messages arrives on working days,
6
Sun Mon Tue Wed Thu Fri Sat
Stock Spam by Weekday
(business days are shaded)Day
Arr
ival
rat
e (in
%)
0
5
10
15
20
25
0 2 4 6 8 11 14 17 20 23
Stock Spam by Daytime
(stock market business hours are shaded)Hour
Arr
ival
rat
e (in
%)
0
1
2
3
4
5
6
Fig. 2. Distribution of stock spam message arrivals across weekdays (left) and thecourse of a day (right, U. S. eastern time). Spamers apparently avoid weekends but donot bother a lot about market hours. In the analysis, messages received after the closeof the market are counted as events on the following business day (effective day).
although Sunday afternoon arrivals (after 4:00 p.m.) were already counted tothe Monday numbers. This is due to the processing logic that assigns messagearrivals to business days, which is automatically performed at the data collectionstage: as the Pink Sheets and OTCBB follow regular market hours, from 9:30a.m. to 4:00 p.m. US eastern time [31], all messages received after the market hadbeen closed were moved to the next business day. Therefore the effective day inour study does not necessarily match the actual calendar day of message arrival.In case of weekends and business holidays, we additionally shift the effectivearrival time by 24 hours (but not more than three times in a row).
Unless otherwise stated, we will further use the term event to express thearrival of one or more messages citing a particular ticker on a specific (effective)day. By contrast, we use the term quantity in those parts of the analysis where theactual number of messages per day citing the same stock is a relevant measure.
3.3 Effects on Traded Volume
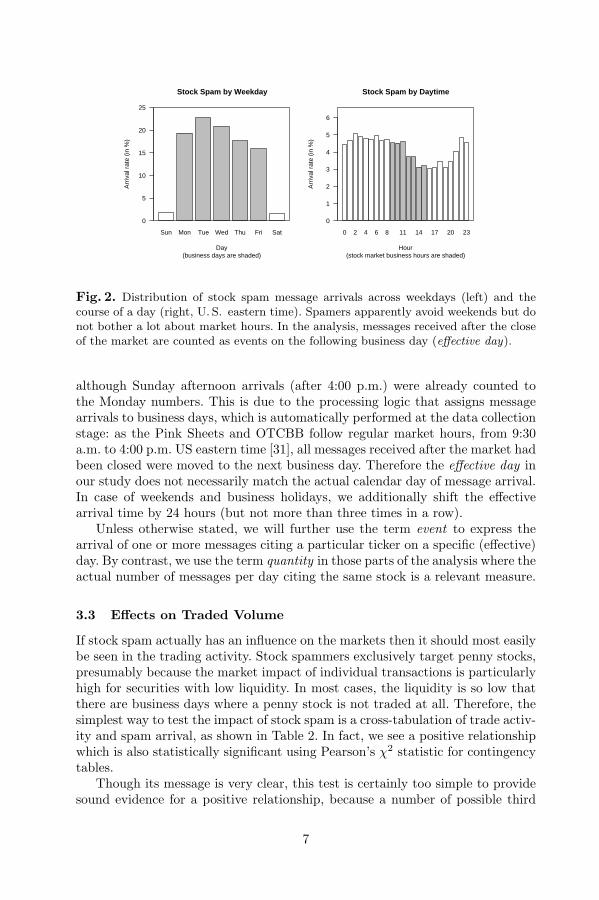
If stock spam actually has an influence on the markets then it should most easilybe seen in the trading activity. Stock spammers exclusively target penny stocks,presumably because the market impact of individual transactions is particularlyhigh for securities with low liquidity. In most cases, the liquidity is so low thatthere are business days where a penny stock is not traded at all. Therefore, thesimplest way to test the impact of stock spam is a cross-tabulation of trade activ-ity and spam arrival, as shown in Table 2. In fact, we see a positive relationshipwhich is also statistically significant using Pearson’s χ2 statistic for contingencytables.
Though its message is very clear, this test is certainly too simple to providesound evidence for a positive relationship, because a number of possible third
7
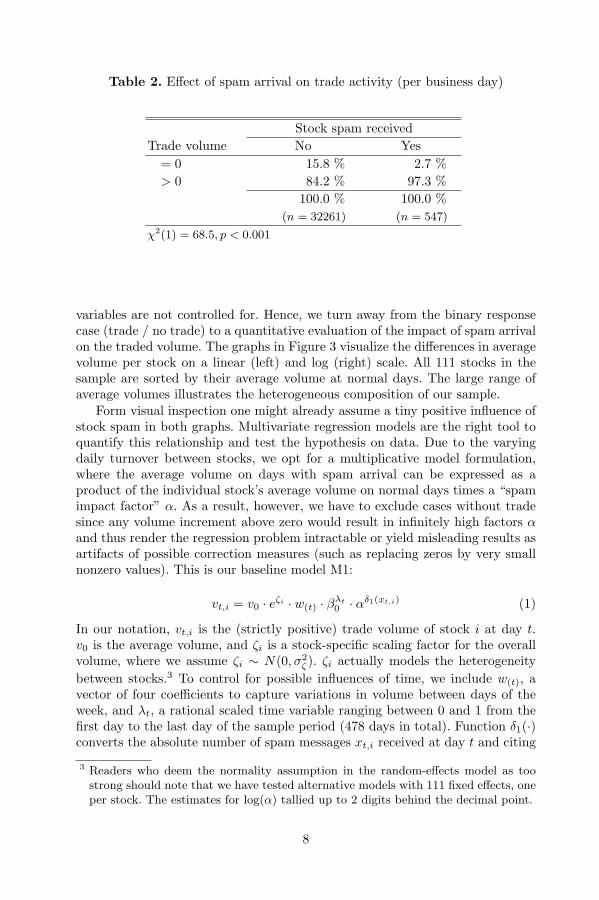
Table 2. Effect of spam arrival on trade activity (per business day)
Stock spam receivedTrade volume No Yes
= 0 15.8 % 2.7 %> 0 84.2 % 97.3 %
100.0 % 100.0 %(n = 32261) (n = 547)
χ2(1) = 68.5, p < 0.001
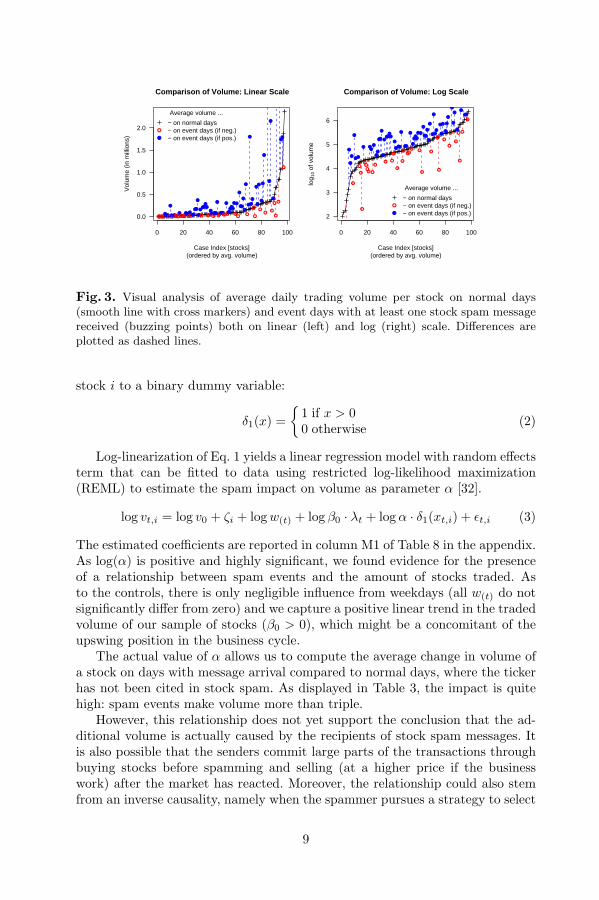
variables are not controlled for. Hence, we turn away from the binary responsecase (trade / no trade) to a quantitative evaluation of the impact of spam arrivalon the traded volume. The graphs in Figure 3 visualize the differences in averagevolume per stock on a linear (left) and log (right) scale. All 111 stocks in thesample are sorted by their average volume at normal days. The large range ofaverage volumes illustrates the heterogeneous composition of our sample.
Form visual inspection one might already assume a tiny positive influence ofstock spam in both graphs. Multivariate regression models are the right tool toquantify this relationship and test the hypothesis on data. Due to the varyingdaily turnover between stocks, we opt for a multiplicative model formulation,where the average volume on days with spam arrival can be expressed as aproduct of the individual stock’s average volume on normal days times a “spamimpact factor” α. As a result, however, we have to exclude cases without tradesince any volume increment above zero would result in infinitely high factors αand thus render the regression problem intractable or yield misleading results asartifacts of possible correction measures (such as replacing zeros by very smallnonzero values). This is our baseline model M1:
vt,i = v0 · eζi · w(t) · βλt0 · αδ1(xt,i) (1)
In our notation, vt,i is the (strictly positive) trade volume of stock i at day t.v0 is the average volume, and ζi is a stock-specific scaling factor for the overallvolume, where we assume ζi ∼ N(0, σ2
ζ ). ζi actually models the heterogeneitybetween stocks.3 To control for possible influences of time, we include w(t), avector of four coefficients to capture variations in volume between days of theweek, and λt, a rational scaled time variable ranging between 0 and 1 from thefirst day to the last day of the sample period (478 days in total). Function δ1(·)converts the absolute number of spam messages xt,i received at day t and citing
3 Readers who deem the normality assumption in the random-effects model as toostrong should note that we have tested alternative models with 111 fixed effects, oneper stock. The estimates for log(α) tallied up to 2 digits behind the decimal point.
8
0 20 40 60 80 100
0.0
0.5
1.0
1.5
2.0
Comparison of Volume: Linear Scale
(ordered by avg. volume)Case Index [stocks]
Vol
ume
(in m
illio
ns)
●●●●●●●●●
●
●●●●●●●●●●●
●●●●●●●
●●
●
●
●
●
●●●●
●●●●●●●
●
●●●●
●●
●
●●●●●
●
●
●
●
●
●●
●
●
●
●
●
●
●
●
●
●
●
●
●
●
●
●
●
●
●
●
●
●
●
●
●
●
●
●●
●
●
●
Average volume ...
− on normal days− on event days (if neg.)− on event days (if pos.)
0 20 40 60 80 100
2
3
4
5
6
Comparison of Volume: Log Scale
(ordered by avg. volume)Case Index [stocks]
log 1
0 of
vol
ume
●
●
●
●
●
●
●●
●
●
●
●
●●●●
●●
●
●
●
●●
●●
●
●
●
●
●●●●
●
●
●
●
●
●●
●
●
●
●●
●●
●
●
●
●●●
●
●
●
●
●
●●
●
●
●
●
●
●
●●
●
●
●
●
●
●
●
●
●
●
●
●
●
●
●
●●
●
●
●
●
●●
●
●
●
●
Average volume ...
− on normal days− on event days (if neg.)− on event days (if pos.)
Fig. 3. Visual analysis of average daily trading volume per stock on normal days(smooth line with cross markers) and event days with at least one stock spam messagereceived (buzzing points) both on linear (left) and log (right) scale. Differences areplotted as dashed lines.
stock i to a binary dummy variable:
δ1(x) ={
1 if x > 00 otherwise (2)
Log-linearization of Eq. 1 yields a linear regression model with random effectsterm that can be fitted to data using restricted log-likelihood maximization(REML) to estimate the spam impact on volume as parameter α [32].
log vt,i = log v0 + ζi + log w(t) + log β0 · λt + log α · δ1(xt,i) + εt,i (3)
The estimated coefficients are reported in column M1 of Table 8 in the appendix.As log(α) is positive and highly significant, we found evidence for the presenceof a relationship between spam events and the amount of stocks traded. Asto the controls, there is only negligible influence from weekdays (all w(t) do notsignificantly differ from zero) and we capture a positive linear trend in the tradedvolume of our sample of stocks (β0 > 0), which might be a concomitant of theupswing position in the business cycle.
The actual value of α allows us to compute the average change in volume ofa stock on days with message arrival compared to normal days, where the tickerhas not been cited in stock spam. As displayed in Table 3, the impact is quitehigh: spam events make volume more than triple.
However, this relationship does not yet support the conclusion that the ad-ditional volume is actually caused by the recipients of stock spam messages. Itis also possible that the senders commit large parts of the transactions throughbuying stocks before spamming and selling (at a higher price if the businesswork) after the market has reacted. Moreover, the relationship could also stemfrom an inverse causality, namely when the spammer pursues a strategy to select
9
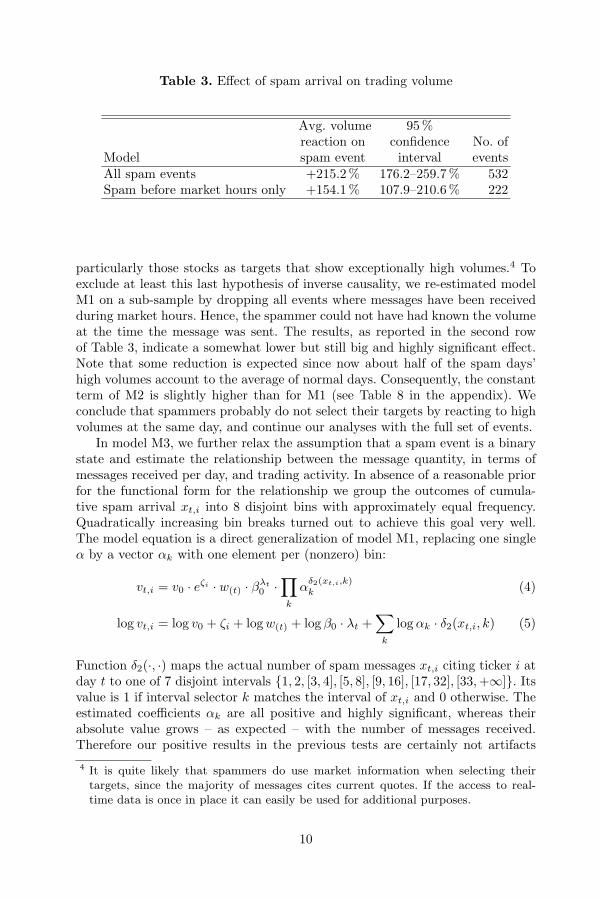
Table 3. Effect of spam arrival on trading volume
Avg. volume 95 %reaction on confidence No. of
Model spam event interval eventsAll spam events +215.2 % 176.2–259.7% 532Spam before market hours only +154.1 % 107.9–210.6% 222
particularly those stocks as targets that show exceptionally high volumes.4 Toexclude at least this last hypothesis of inverse causality, we re-estimated modelM1 on a sub-sample by dropping all events where messages have been receivedduring market hours. Hence, the spammer could not have had known the volumeat the time the message was sent. The results, as reported in the second rowof Table 3, indicate a somewhat lower but still big and highly significant effect.Note that some reduction is expected since now about half of the spam days’high volumes account to the average of normal days. Consequently, the constantterm of M2 is slightly higher than for M1 (see Table 8 in the appendix). Weconclude that spammers probably do not select their targets by reacting to highvolumes at the same day, and continue our analyses with the full set of events.
In model M3, we further relax the assumption that a spam event is a binarystate and estimate the relationship between the message quantity, in terms ofmessages received per day, and trading activity. In absence of a reasonable priorfor the functional form for the relationship we group the outcomes of cumula-tive spam arrival xt,i into 8 disjoint bins with approximately equal frequency.Quadratically increasing bin breaks turned out to achieve this goal very well.The model equation is a direct generalization of model M1, replacing one singleα by a vector αk with one element per (nonzero) bin:
vt,i = v0 · eζi · w(t) · βλt0 ·
∏k
αδ2(xt,i,k)k (4)
log vt,i = log v0 + ζi + log w(t) + log β0 · λt +∑
k
log αk · δ2(xt,i, k) (5)
Function δ2(·, ·) maps the actual number of spam messages xt,i citing ticker i atday t to one of 7 disjoint intervals {1, 2, [3, 4], [5, 8], [9, 16], [17, 32], [33,+∞]}. Itsvalue is 1 if interval selector k matches the interval of xt,i and 0 otherwise. Theestimated coefficients αk are all positive and highly significant, whereas theirabsolute value grows – as expected – with the number of messages received.Therefore our positive results in the previous tests are certainly not artifacts
4 It is quite likely that spammers do use market information when selecting theirtargets, since the majority of messages cites current quotes. If the access to real-time data is once in place it can easily be used for additional purposes.
10
●
●
●
●
●
●
●
●
More Means More
Number of spam messages received
Vol
ume
(100
= a
vg. v
olum
e w
/o s
pam
)
0
100
200
300
400
500
0 1 2 [3,4] [5,8] [9,16] [17,32] >33
(116)
(63)(45)
(97)
(73)
(63)
(75)
Fig. 4. Effect of the quantity of received messages on traded volume per business dayas given by the coefficients αk of model M3. Categories on the x-axis are quadraticallyincreasing bins. A clearly linear relationship between volume reaction and bin indexsuggests the existence of diminishing marginal response of additional spam dissemina-tion. Figures in brackets denote number of cases in each bin.
of singular cases with extremely high penetration of spam messages (up to 118citing the same ticker on a single day). Moreover, a graphical analysis of theestimated impact factors by bins reveals a good linear relationship between binnumber and impact (see Figure 4). As bin widths grow quadratically, we findthat the spammer faces diminishing marginal “utility” from additional messages.Further developing this admittedly somewhat crazy line of thought, one couldcome up with an “optimal spam amount” and – assuming that spammers actrationally and operate at that point – eventually infer their implied cost ofsending a message (see [5] and [12] for alternative ways to estimate the cost tosend spam).
To complete the analysis of effects on volume, we look at the development ofeffect strength over time. Therefore we specify model M4 as
vt,i = v0 · w(t) · eζi · βλt0 · (αβλt
1 )δ1(xt,i) . (6)
The parameters of M4 were estimated from a log-linearized form of Eq. 6, yieldinga model with interaction term. The results show positive values for both β0 andβ1, whereas only β0 is statistically significant (see Table 8 in the appendix). Thismeans that the average traded volume of stocks in the sample grew over time,but the effect of stock spam on volume has remained constant (with a slighttendency to the upside). Hence, there is no sign in the data that the “stockspam trick” is wearing out over time.
11
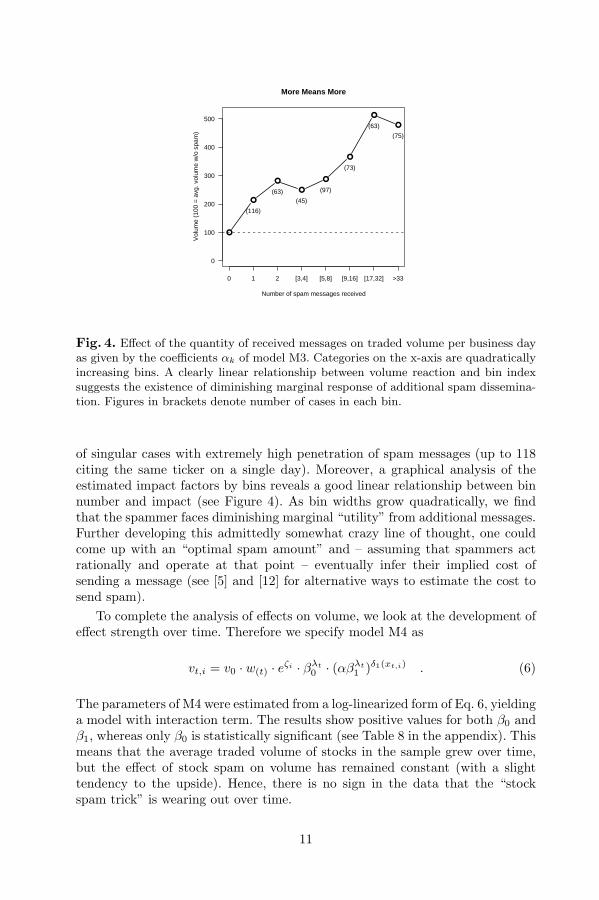
Table 4. Effect of spam arrival on intra-day stock price development
Stock spam receivedIntra-day movement No Yes
Open>Close 27.8 % 51.9 %Open=Close 47.1 % 24.3 %Open<Close 25.1 % 23.8 %
100.0 % 100.0 %(n = 32261) (n = 547)
χ2(2) = 171.5, p < 0.001
3.4 Effects on Market Valuation
To start with a simple (and naıve) way to assess the effect of stock spam onmarket valuation of cited stocks, we tabulate the intra-day price development fordays with and without spam arrival (Table 4). We find a significant relationship,which again shows that spam actually influences trading activity: the large shareof equal open and close prices on days without spam reduces by about 50 % fordays with spam messages. Moreover, the probability mass moves to the caseswhere the open price is higher than the close price, i.e., where the respectivestock looses value. However, considering this analysis as evidence for negativeimpact in general would be premature for three reasons: First, the tabulationapproach solely regards the sign and does not take into account the absolutevalue of profits and losses. If losses are frequent but systematically smaller than(less frequent) profits then the average outcome could still be positive. Second,the tabulation includes all spam events (defined as days with nonzero spamarrival rate) irrespectively of possible arrivals in the past. The interactions ofeffects from subsequent events can be very complex and may bias the result.The third concern addresses the fact that the medium-term price developmentis completely disregarded in this analysis. If a stock price has declined for severalconsecutive days then even a relatively smaller, but still negative, developmentat the event day should be regarded as a positive effect of spam arrival, and viceversa.
3.4.1 Event Study Methodology
Event study analysis is a technique borrowed from finance research that allowsto compensate for the above mentioned shortcomings (for an overview see [21]).The method defines the notion of abnormal returns ARt,i, that is the differencebetween the actual daily return Rt,i of stock i and its most normal returns,i.e., the most likely returns if the event would not have happened E(Rt,i|θi),
12
conditional to a specific prediction model with parameters θi:
ARt,i = Rt,i − E(Rt,i|θi) (7)
Daily return Rt,i are computed from daily adjusted close prices Pt,i as follows:
Rt,i =Pt,i − Pt−1,i
Pt−1,i=
Pt,i
Pt−1,i− 1 (8)
Consequently, cumulative abnormal returns (CARt,i) are defined as the sum ofabnormal returns of a number of subsequent days after an event at time t0.
CARt,i =t∑
τ=t0
ARτ,i (9)
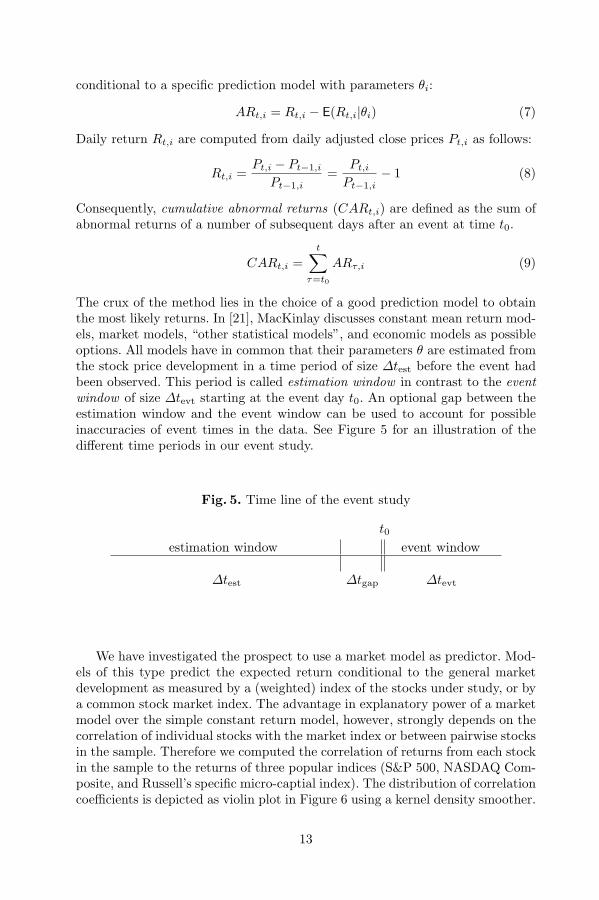
The crux of the method lies in the choice of a good prediction model to obtainthe most likely returns. In [21], MacKinlay discusses constant mean return mod-els, market models, “other statistical models”, and economic models as possibleoptions. All models have in common that their parameters θ are estimated fromthe stock price development in a time period of size ∆test before the event hadbeen observed. This period is called estimation window in contrast to the eventwindow of size ∆tevt starting at the event day t0. An optional gap between theestimation window and the event window can be used to account for possibleinaccuracies of event times in the data. See Figure 5 for an illustration of thedifferent time periods in our event study.
Fig. 5. Time line of the event study
t0
estimation window event window
∆test ∆tgap ∆tevt
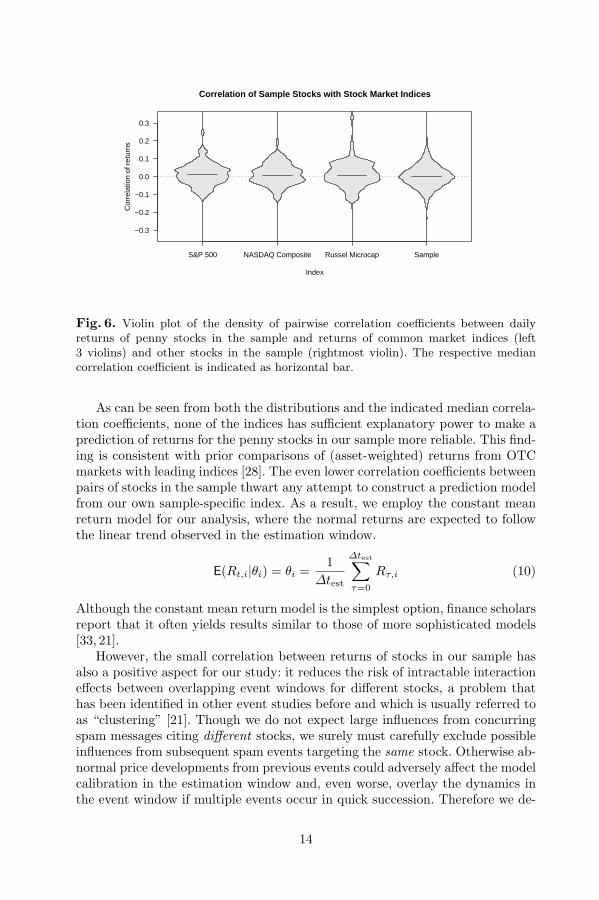
We have investigated the prospect to use a market model as predictor. Mod-els of this type predict the expected return conditional to the general marketdevelopment as measured by a (weighted) index of the stocks under study, or bya common stock market index. The advantage in explanatory power of a marketmodel over the simple constant return model, however, strongly depends on thecorrelation of individual stocks with the market index or between pairwise stocksin the sample. Therefore we computed the correlation of returns from each stockin the sample to the returns of three popular indices (S&P 500, NASDAQ Com-posite, and Russell’s specific micro-captial index). The distribution of correlationcoefficients is depicted as violin plot in Figure 6 using a kernel density smoother.
13
Correlation of Sample Stocks with Stock Market Indices
Index
Cor
rela
tion
of r
etur
ns
−0.3
−0.2
−0.1
0.0
0.1
0.2
0.3
S&P 500 NASDAQ Composite Russel Microcap Sample
Fig. 6. Violin plot of the density of pairwise correlation coefficients between dailyreturns of penny stocks in the sample and returns of common market indices (left3 violins) and other stocks in the sample (rightmost violin). The respective mediancorrelation coefficient is indicated as horizontal bar.
As can be seen from both the distributions and the indicated median correla-tion coefficients, none of the indices has sufficient explanatory power to make aprediction of returns for the penny stocks in our sample more reliable. This find-ing is consistent with prior comparisons of (asset-weighted) returns from OTCmarkets with leading indices [28]. The even lower correlation coefficients betweenpairs of stocks in the sample thwart any attempt to construct a prediction modelfrom our own sample-specific index. As a result, we employ the constant meanreturn model for our analysis, where the normal returns are expected to followthe linear trend observed in the estimation window.
E(Rt,i|θi) = θi =1
∆test
∆test∑τ=0
Rτ,i (10)
Although the constant mean return model is the simplest option, finance scholarsreport that it often yields results similar to those of more sophisticated models[33, 21].
However, the small correlation between returns of stocks in our sample hasalso a positive aspect for our study: it reduces the risk of intractable interactioneffects between overlapping event windows for different stocks, a problem thathas been identified in other event studies before and which is usually referred toas “clustering” [21]. Though we do not expect large influences from concurringspam messages citing different stocks, we surely must carefully exclude possibleinfluences from subsequent spam events targeting the same stock. Otherwise ab-normal price developments from previous events could adversely affect the modelcalibration in the estimation window and, even worse, overlay the dynamics inthe event window if multiple events occur in quick succession. Therefore we de-
14
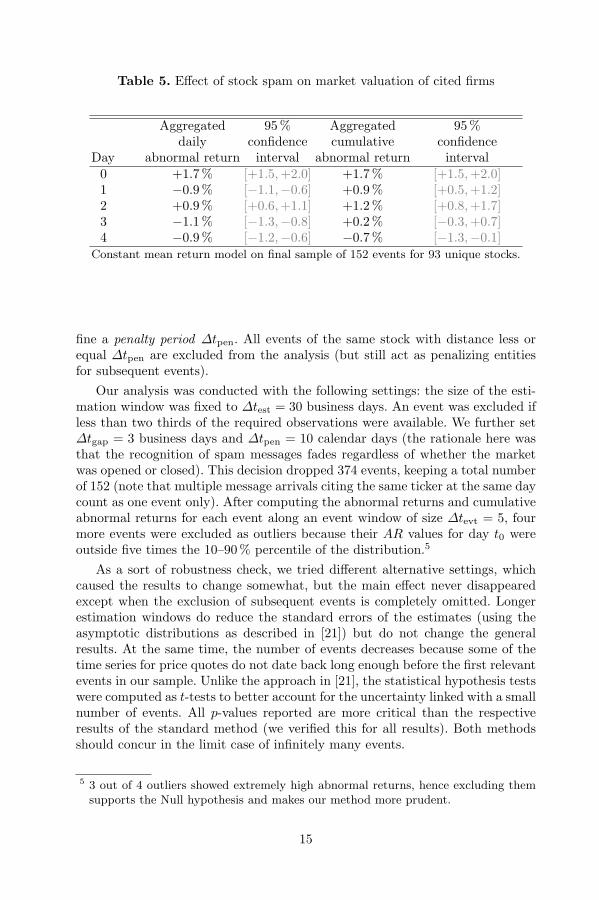
Table 5. Effect of stock spam on market valuation of cited firms
Aggregated 95 % Aggregated 95%daily confidence cumulative confidence
Day abnormal return interval abnormal return interval0 +1.7 % [+1.5,+2.0] +1.7 % [+1.5,+2.0]1 −0.9 % [−1.1,−0.6] +0.9 % [+0.5,+1.2]2 +0.9 % [+0.6,+1.1] +1.2 % [+0.8,+1.7]3 −1.1 % [−1.3,−0.8] +0.2 % [−0.3,+0.7]4 −0.9 % [−1.2,−0.6] −0.7 % [−1.3,−0.1]
Constant mean return model on final sample of 152 events for 93 unique stocks.
fine a penalty period ∆tpen. All events of the same stock with distance less orequal ∆tpen are excluded from the analysis (but still act as penalizing entitiesfor subsequent events).
Our analysis was conducted with the following settings: the size of the esti-mation window was fixed to ∆test = 30 business days. An event was excluded ifless than two thirds of the required observations were available. We further set∆tgap = 3 business days and ∆tpen = 10 calendar days (the rationale here wasthat the recognition of spam messages fades regardless of whether the marketwas opened or closed). This decision dropped 374 events, keeping a total numberof 152 (note that multiple message arrivals citing the same ticker at the same daycount as one event only). After computing the abnormal returns and cumulativeabnormal returns for each event along an event window of size ∆tevt = 5, fourmore events were excluded as outliers because their AR values for day t0 wereoutside five times the 10–90 % percentile of the distribution.5
As a sort of robustness check, we tried different alternative settings, whichcaused the results to change somewhat, but the main effect never disappearedexcept when the exclusion of subsequent events is completely omitted. Longerestimation windows do reduce the standard errors of the estimates (using theasymptotic distributions as described in [21]) but do not change the generalresults. At the same time, the number of events decreases because some of thetime series for price quotes do not date back long enough before the first relevantevents in our sample. Unlike the approach in [21], the statistical hypothesis testswere computed as t-tests to better account for the uncertainty linked with a smallnumber of events. All p-values reported are more critical than the respectiveresults of the standard method (we verified this for all results). Both methodsshould concur in the limit case of infinitely many events.
5 3 out of 4 outliers showed extremely high abnormal returns, hence excluding themsupports the Null hypothesis and makes our method more prudent.
15
3.4.2 Results
The main results are summarized in Table 5.6 We find a pattern of positive andsignificant abnormal returns for days t0 (the effective event day) and t2, as wellas significant negative abnormal returns for days t1, t3, and t4. This is perhaps anartifact of the interleaved buy- and sell orders from naıve victims (who believe inthe message and buy), spammers (who sell after they deem the market reactionis on its maximum), and smart “victims” who jump on the bandwagon andtry to buy early to sell soon and thus profit from the price hike as well. Butthe evidence for this interpretation is not very strong, though a similar patternremains stable for different subsets of events and also for different settings ofthe key parameters (not reported here). Regarding the cumulative aggregatedreturns, the picture becomes much clearer. There exists a non-negligible positivebulge directly after the event that fades over time and finally turns negative onday t4 (all estimates except t3 being statistically significant).
The finding of positive abnormal returns is consistent with the presumptionthat stock spam is on average a profitable business model (for spammers). Oth-erwise the persistent presence of stock spam would cause a puzzle. However, thisfinding does not imply that more than 50 % of the cases yield positive returns,nor that the average return is positive. Similar to the initial tabulation in Ta-ble 4, a sign test on the individual AR estimates (before aggregation but afterapplying the penalty rule) suggests the contrary: negative and positive abnormalreturns occur almost equally frequent. However, the positive outcomes tend to behigher than the negative ones. But even positive abnormal returns do not alwaysimply profits. If the stock is in a downward movement that temporarily loosespace due to spam events, then it is still difficult to make money in this situation.Let alone that spammers quite likely have to bear the transaction costs as well,which are completely disregarded in this study. (N.B. the volume analysis alonesuggests that a collusion between market makers charging transaction costs andstock spammers would probably be profitable).
As in the analysis of volume, we have broken down the set of events intosmaller subsets to shed more light in interesting subordinated research ques-tions. Similar to model M2 in Section 3.3, we exclude all events triggered bymessages that arrived after the market had opened. This allows us to rule outan alternative explanation for the results, namely that spammers deliberatelyselect stocks after they have noticed an exceptional hike in its price. The resultpattern of AR is very similar to the baseline model; its positive abnormal returnsare even slightly higher, which yields more slowly decaying cumulative abnormalreturns (see Table 9 in the appendix).
Another break-down has been conducted by liquidity. One might assumethat lower liquidity implies higher market impact and thus more favorable (i.e.,higher and more predictable) abnormal returns. This rationale also constitutesthe common argument why stock spammers target penny stocks only. As wehave no direct measure of liquidity in the data, we construct an indicator forliquidity by measuring the fraction of days where high and low prices are equal.6 For more details see Table 9 in the appendix.
16
−1 0 1 2 3 4
−2
0
2
4
6
8
10
Stock Spam Hypes Market Valuation
Day after event
Abn
orm
al r
etur
n (in
%)
●
●
●
●
●
●
●
●
●●
●
●
●
●
all eventsmore than 10 messages
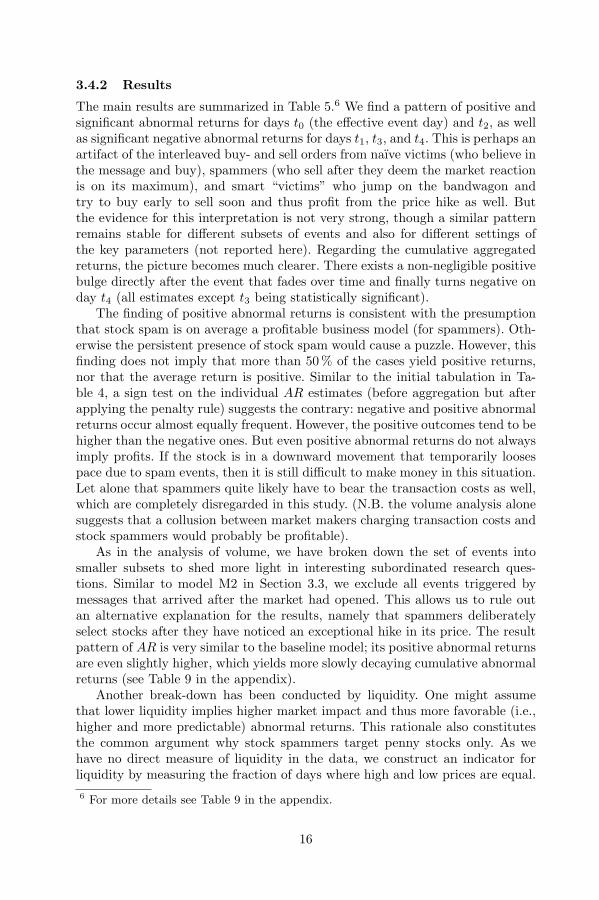
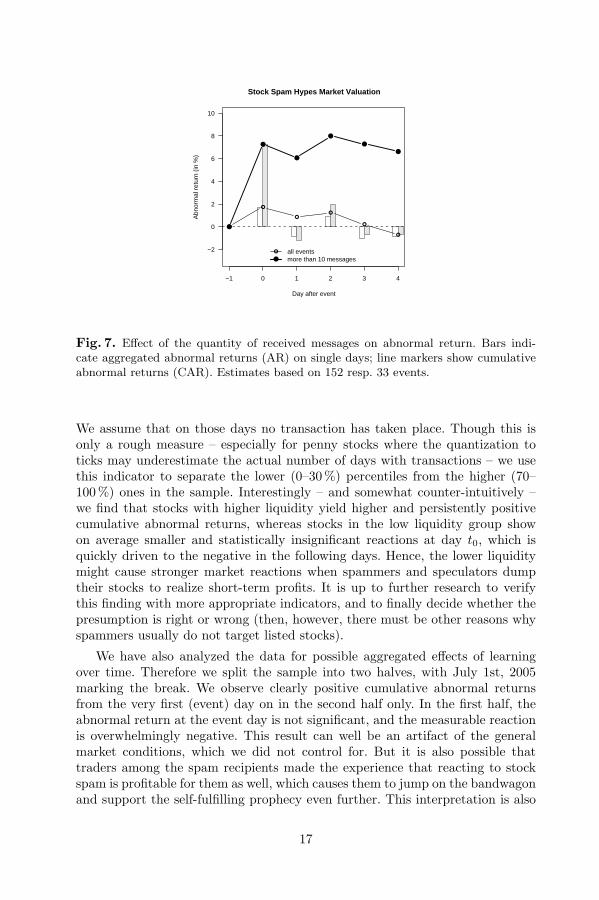
Fig. 7. Effect of the quantity of received messages on abnormal return. Bars indi-cate aggregated abnormal returns (AR) on single days; line markers show cumulativeabnormal returns (CAR). Estimates based on 152 resp. 33 events.
We assume that on those days no transaction has taken place. Though this isonly a rough measure – especially for penny stocks where the quantization toticks may underestimate the actual number of days with transactions – we usethis indicator to separate the lower (0–30 %) percentiles from the higher (70–100 %) ones in the sample. Interestingly – and somewhat counter-intuitively –we find that stocks with higher liquidity yield higher and persistently positivecumulative abnormal returns, whereas stocks in the low liquidity group showon average smaller and statistically insignificant reactions at day t0, which isquickly driven to the negative in the following days. Hence, the lower liquiditymight cause stronger market reactions when spammers and speculators dumptheir stocks to realize short-term profits. It is up to further research to verifythis finding with more appropriate indicators, and to finally decide whether thepresumption is right or wrong (then, however, there must be other reasons whyspammers usually do not target listed stocks).
We have also analyzed the data for possible aggregated effects of learningover time. Therefore we split the sample into two halves, with July 1st, 2005marking the break. We observe clearly positive cumulative abnormal returnsfrom the very first (event) day on in the second half only. In the first half, theabnormal return at the event day is not significant, and the measurable reactionis overwhelmingly negative. This result can well be an artifact of the generalmarket conditions, which we did not control for. But it is also possible thattraders among the spam recipients made the experience that reacting to stockspam is profitable for them as well, which causes them to jump on the bandwagonand support the self-fulfilling prophecy even further. This interpretation is also
17
consistent with the positive (albeit not significant) interaction term for the effecton volume over time in model M4 (Table 8).
Finally we looked at the influence of message quantity by calculating theabnormal returns for the subset of events with more than 10 messages per day(citing the same ticker). Here it is clearly visible that more messages drive theabnormal return further to the positive. A visual comparison of the cumulativeabnormal returns of the baseline model and the subset with high message quan-tity is depicted in Figure 7. This is again consistent with our findings on quantityand traded volume.
4 Conclusion
4.1 Discussion
Among all classes of unsolicited bulk e-mail, stock spam has the particular prop-erty that reactions can be observed indirectly from publicly available stock pricequotes. Our study makes use of this feature and finds evidence that spam mes-sage campaigns on average go along with a) an increase in trading activity ofthe cited stock, and b) positive cumulative abnormal returns shortly after themessages have been distributed. Hence, we conclude that the business model forstock spam actually works. The dynamics in traded volume and prices can beattributed to the sum of actions from at least three groups of individuals:
1. spammers, who trade the stock to capitalize profits from their campaign,2. naıve recipients, who believe in the pretended investment advises, and3. smart recipients, who try to participate in price hikes triggered by spammers.
With the given data we cannot disentangle the contributions from each channel.Especially the third group (smart recipients) are interesting from a theoreticalpoint of view, since they build a link to research on herd behaviour in financialmarkets [34, 35]. In addition, a game-theoretic framework suggests that spam-mers take the role of the third party in coordination games [36], and informationfrom spam messages creates focal points that guide investors to a social equilib-rium strategy.
However, it is important to note that our study completely disregards long-term effects of stock spam. Therefore possible permanent negative consequencesfor micro-cap companies do not show up in this analysis at all.7
Finally, the mere fact that a number of people obviously follow financialadvice delivered via e-mail from unknown senders, is relevant for the stabilityof the entire financial system. Consider the potential of spammers replacinginvestment hints with credible rumours about alleged solvency problems of largebanks, coupled with a call to withdraw all savings. It is conceivable that the rightmixture of reaction to such messages together with lacking crisis communication7 While browsing through individual charts with indicated spam arrivals, the authors
found some distressing cases: it appeared like stock spam systematically squeezeddown some of the victim’s market value. This fits also into the big picture of [17].
18
may actually result in a self-fulfilling prophecy, yielding bank-runs and dominoeffects with all their adverse consequences. Even if the probability of such co-occurrence is deemed low, such scenarios should certainly be on the agenda ofcrisis teams in financial supervision authorities and in cyber-terrorism defense.
4.2 Limitations and Future Work
Although our results do not leave too many puzzles and proved to be quiterobust, there exists a long list of possible improvements for future research.
Probably the most salient limitation concerns the absence of a sound methodto test causality. Though we made efforts to rule out the possibility that highabnormal returns are a result of the spammers’ ticker selection strategy, we didnot control for third variables that might affect both stock price and spammers’decision to target a particular ticker. Since basic epistemology tells us that wewill never succeed in controlling for all possible third variables, some uncertaintywill always remain and therefore we should rather think of a relationship insteadof a causal link between stock spam and market indicators.
Another shortcoming of our study is the incomplete data from publicly avail-able sources. A first step would be to collect price information for all 391 uniquetickers in the SSEM data. Improving the resolution of data (down to the ticklevel of individual transactions) would perhaps enable us to tell the orders ofspammers better apart from assumed reactions of the recipients. More consis-tent information on market capitalization could also be useful to weight theabnormal returns by firm size in the aggregation step. Possibly, we also face asubtle reactivity problem in the SSEM data collection. Since intra-day analysesof individual tickers are constantly published on Richardson’s website [18], spam-mers might use this information to exclude SSEM’s probe accounts from theirdistribution lists, and/or learn how to trick the automatic stock spam detectionalgorithm.
From a methodological point of view, the independence assumption about theresiduals in the regression models, and particularly in the event study analysis,could be replaced by more realistic (and complicated) assumptions, possibly ina proper framework for time series analysis.
We also have in mind a number of extensions. As all spam messages areavailable in plain text, computer-linguistic content analyses could reveal pos-sible clusters of origin. Moreover, the influence of specific characteristics of themessage draft on its market impact could yield interesting findings on persuasiveelements and response rates that are hard to obtain otherwise (because spam-mers usually do not disclose their response rates). Finally, a careful analysis ofproperties of the affected companies could help us to understand the spammers’strategy to select stocks. The determinants of spam attacks might also be ofinterest for CFOs of public enterprises traded on OTC markets.
To sum it all up, although we found a clear relationship in our data, we areaware that the evidence for stock spam causing people to buy a certain stockis not rock solid. Therefore this paper should be regarded as a first and modeststep into an interesting direction.
19
Acknowledgements
Leonard Richardson deserves special credit for his fabulous stock spam archivewhich served as main data source for this study.
References
1. Schneier, B., Wood, P., et al.: 2005 Attack Trends & Analysis. CounterpaneInternet Security and MessageLabs (2006) http://www.counterpane.com/dl/
attack-trends-2005-messagelabs.pdf.2. Judge, P., Alperovitch, D., Yang, W.: Understanding and reversing the profit model
of spam. In: Workshop on the Economics of Information Security (WEIS), Cam-bridge, MA (2005) http://infosecon.net/workshop/pdf/49.pdf (Rump sessiontalk).
3. Freiling, F., Holz, T., Wicherski, G.: Botnet tracking: Exploring a root-causemethodology to prevent distributed denial-of-service attacks. In S. de Capitani diVimercati et al., ed.: Proc. of ESORICS. LNCS 3679, Berlin Heidelberg, SpringerVerlag (2005) 319–335
4. Drucker, H., Vapnik, V., Wu, D.: Support vector machines for spam categorization.IEEE Transactions on Neural Networks 10 (1999) 1048–1054
5. Cobb, S.: The Economics of Spam. ePrivacy Group (2003) http://www.spamhelp.
org/articles/economics_of_spam.pdf.6. Loder, T., van Alstyne, M.W., Wash, R.: An economic answer to unsolicited
communication. In: ACM Conference on Electronic Commerce. (2004) 40–507. Kraut, R.E., Sunder, S., Telang, R., Morris, J.: Pricing electronic mail to solve the
problem of spam. Human-Computer Interaction 20 (2005) 195–2238. Ciphertrust: Spam statistics. Online Source (2004) http://www.ciphertrust.
com/resources/statistics/index.php.9. Dwork, C., Naor, M.: Pricing via processing or combatting junk mail. In: 12th
Annual International Cryptology Conference (CRYPTO’92). (1992) 139–14710. Dwork, C., Goldberg, A., Naor, M.: On memory-bound functions for fighting spam.
In: 23th Annual International Cryptology Conference (CRYPTO’03). (2003) 426–444
11. Back, A.: Hashcash – A denial of service counter-measure. Online Source (2002)http://www.hashcash.org/.
12. Laurie, B., Clayton, R.: “Proof-of-work” proves not to work. In: Workshop onthe Economics of Information Security (WEIS), Minneapolis, MN (2004) http:
//www.cl.cam.ac.uk/~rnc1/proofwork.pdf.13. Ahn, L.v., Blum, M., Langford, J.: Telling humans and computers apart. Com-
munications of the ACM 47 (2004) 57–6014. Fahlman, S.E.: Selling interrupt rights: A way to control unwanted e-mail and
telephone calls. IBM Systems Journal 41 (2002) 759–76615. Pradhuman, S.D.: Small-Cap Dynamics. Bloomberg Press, New York (2000)16. Expedite: OTC Pink Sheet stocks email marketing. Online Source (2006) http:
//www.expedite-email-marketing.com/OTCPinkSheetStocksEmailMarketin%g.
htm.17. Cyr, J.: Spam stock tracker. http://www.spamstocktracker.com/ (2005)18. Richardson, L.: Stock spam effectiveness monitor. http://www.crummy.com/
features/StockSpam/ (2005)
20
19. N.N.: Stock market schemes and penny stock offers. Online Source (2006) http:
//rjohara.net/money/stocks/.20. McIntyre, A.: Spam-advertised stocks. Online Source (2002) http://www.raingod.
com/angus/Computing/Internet/Spam/Stocks/Stocks.php.21. MacKinlay, C.A.: Event studies in economics and finance. Journal of Economic
Literature 35 (1997) 13–3922. Ettredge, M., Richardson, V.J.: Assessing the risk in e-commerce. In R. H.S.,
ed.: Proc. of the 35th Hawaii International Conference on System Sciences, LosAlamitos, CA, IEEE Press (2002)
23. Campbell, K., Gordon, L.A., Loeb, M.P., Zhou, L.: The economic cost of pub-licly announced information security breaches: Empirical evidence from the stockmarket. Journal of Computer Security 11 (2003) 431–448
24. Cavusoglu, H., Mishra, B., Raghunathan, S.: The effect of internet security breachannouncements on market value: Capital market reactions for breached firms andinternet security developers. International Journal of Electronic Commerce 9(2004) 69–104
25. Telang, R., Wattal, S.: Impact of software vulnerability announcements on themarket value of software vendors – an empirical investigation. In: Workshop onthe Economics of Information Security (WEIS), Cambridge, MA (2005) http:
//infosecon.net/workshop/pdf/telang_wattal.pdf.26. Bjerring, J.H., Lakonishok, J., Vermaelen, T.: Stock price and financial analysts’
recommendations. Journal of Finance 38 (1983) 187–20427. Liu, P., Smith, S.D., Syed, A.A.: Stock price reaction to the Wall Street Journal’s
securities recommendations. Journal of Financial and Quantitative Analysis 25(1990) 399–410
28. Larson, S., Luft, C., Levine, L.M.: Over the Counter Bulletin Board exchange:Market structure, risk, and return. Journal of Alternative Investments 3 (2001)
29. Yahoo Finance: Historical data download. http://finance.yahoo.com/ (2006)30. Frank Russell Company: U. S. equity index values. http://www.russell.com/US/
Indexes/US/index_values.asp (2006)31. Pink Sheets: Frequently asked questions. http://www.pinksheets.com/faq.jsp
(2004)32. Bates, D.M., Pinheiro, J.C.: Computational methods for multilevel models.
Bell Labs Technical Memorandum (1998) http://cm.bell-labs.com/cm/ms/
departments/sia/project/nlme/CompMulti.pd%f.33. Brown, S.J., Warner, J.B.: Using daily stock returns: The case of event studies.
Journal of Financial Economics 14 (1985) 3–3134. Banerjee, A.V.: A simple model of herd behavior. Quarterly Journal of Economics
107 (1992) 797–81735. Bikhchandani, S., Sharma, S.: Herd behavior in financial markets. IMF Staff Pa-
pers 47 (2001) 279–310 http://www.imf.org/External/Pubs/FT/staffp/2001/
01/pdf/Bikhchan.pdf.36. Schelling, T.C.: The Strategy of Conflict. Harvard University Press, Cambridge,
MA (1960)
21
Appendix
Table 6. Tickers cited in stock spam (ranked by number of event days)
Ticker Event MessagesRank symbol Company Name days received
1. VNBL.OB VINOBLE INC 77 8902. CWTD.OB CHINA WORLD TRADE 52 9193. NOTE.PK NA 51 534. EOGI.PK EMERSON OIL & GAS 45 5655. CGKY.PK CARNEGIE COOKE & COM 37 13206. AMBD.PK AMERICAN MOBILE DENT 37 577. YPIL.PK IPACKETS INTL INC 35 7698. APWL.PK ADVANCED POWERLINE 31 2409. CEOA.PK CEO AMERICA INC 31 347
10. MOGI.PK MONTANA OIL & GAS 29 42411. MWIS.OB M-WISE INC 27 40012. EXTP.PK EXTREME POKER LTD 26 84
Time period: Nov 2004 – Feb 2006 Source: [18]
Table 7. Tickers cited in stock spam (ranked by total number of messages)
Ticker Event MessagesRank symbol Company Name days received
1. CGKY.PK CARNEGIE COOKE & COM 37 13202. CWTD.OB CHINA WORLD TRADE 52 9193. VNBL.OB VINOBLE INC 77 8904. YPIL.PK IPACKETS INTL INC 35 7695. USTA.PK US STARCOM INC 11 6086. VERY.PK VERIDA INTERNET CORP 9 5777. EOGI.PK EMERSON OIL & GAS 45 5658. DKDY.OB DARK DYNAMITE INC 14 4819. MOGI.PK MONTANA OIL & GAS 29 424
10. PPTL.PK PREMIUM PETROLM NEW 25 41611. MWIS.OB M-WISE INC 27 40012. SCRE.OB HUIFENG BIO-PHARM TH 21 400
Time period: Nov 2004 – Feb 2006 Source: [18]
22
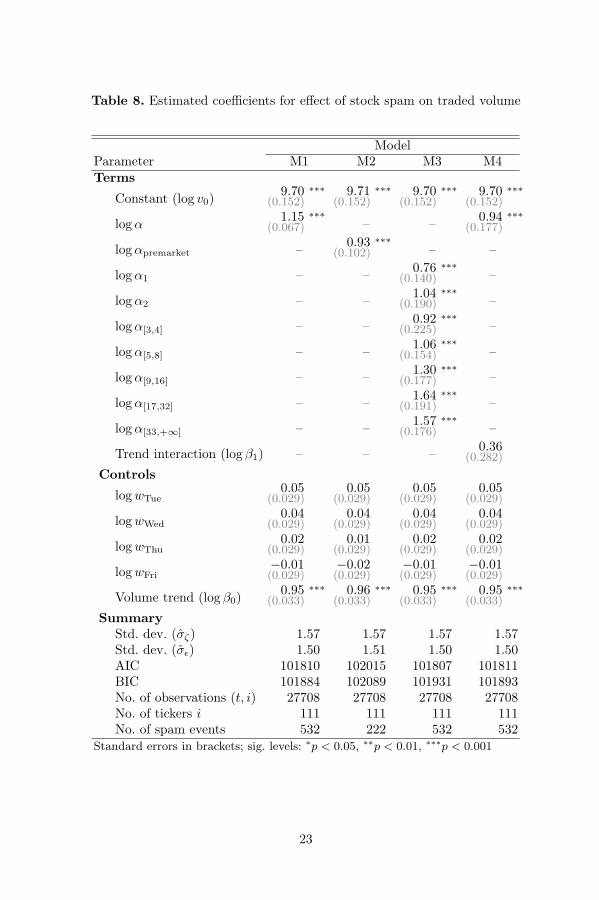
Table 8. Estimated coefficients for effect of stock spam on traded volume
ModelParameter M1 M2 M3 M4Terms
Constant (log v0)9.70 ∗∗∗
(0.152)9.71 ∗∗∗
(0.152)9.70 ∗∗∗
(0.152)9.70 ∗∗∗
(0.152)
log α1.15 ∗∗∗
(0.067) – – 0.94 ∗∗∗(0.177)
log αpremarket – 0.93 ∗∗∗(0.102) – –
log α1 – – 0.76 ∗∗∗(0.140) –
log α2 – – 1.04 ∗∗∗(0.190) –
log α[3,4] – – 0.92 ∗∗∗(0.225) –
log α[5,8] – – 1.06 ∗∗∗(0.154) –
log α[9,16] – – 1.30 ∗∗∗(0.177) –
log α[17,32] – – 1.64 ∗∗∗(0.191) –
log α[33,+∞] – – 1.57 ∗∗∗(0.176) –
Trend interaction (log β1) – – – 0.36(0.282)
Controls
log wTue0.05
(0.029)0.05
(0.029)0.05
(0.029)0.05
(0.029)
log wWed0.04
(0.029)0.04
(0.029)0.04
(0.029)0.04
(0.029)
log wThu0.02
(0.029)0.01
(0.029)0.02
(0.029)0.02
(0.029)
log wFri−0.01(0.029)
−0.02(0.029)
−0.01(0.029)
−0.01(0.029)
Volume trend (log β0)0.95 ∗∗∗
(0.033)0.96 ∗∗∗
(0.033)0.95 ∗∗∗
(0.033)0.95 ∗∗∗
(0.033)
SummaryStd. dev. (σζ) 1.57 1.57 1.57 1.57Std. dev. (σε) 1.50 1.51 1.50 1.50AIC 101810 102015 101807 101811BIC 101884 102089 101931 101893No. of observations (t, i) 27708 27708 27708 27708No. of tickers i 111 111 111 111No. of spam events 532 222 532 532
Standard errors in brackets; sig. levels: ∗p < 0.05, ∗∗p < 0.01, ∗∗∗p < 0.001
23
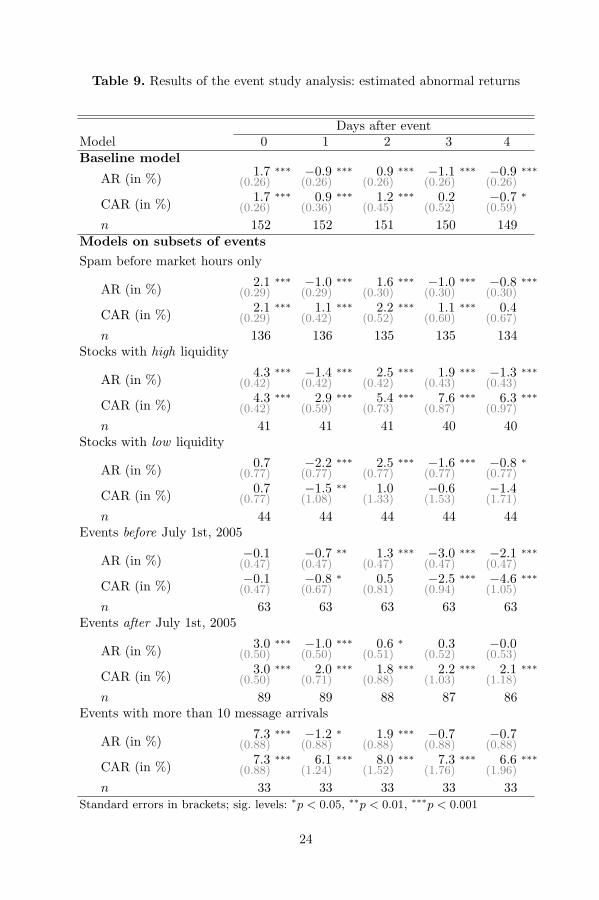
Table 9. Results of the event study analysis: estimated abnormal returns
Days after eventModel 0 1 2 3 4Baseline model
AR (in %) 1.7 ∗∗∗(0.26)
−0.9 ∗∗∗(0.26)
0.9 ∗∗∗(0.26)
−1.1 ∗∗∗(0.26)
−0.9 ∗∗∗(0.26)
CAR (in %) 1.7 ∗∗∗(0.26)
0.9 ∗∗∗(0.36)
1.2 ∗∗∗(0.45)
0.2(0.52)
−0.7 ∗(0.59)
n 152 152 151 150 149Models on subsets of eventsSpam before market hours only
AR (in %) 2.1 ∗∗∗(0.29)
−1.0 ∗∗∗(0.29)
1.6 ∗∗∗(0.30)
−1.0 ∗∗∗(0.30)
−0.8 ∗∗∗(0.30)
CAR (in %) 2.1 ∗∗∗(0.29)
1.1 ∗∗∗(0.42)
2.2 ∗∗∗(0.52)
1.1 ∗∗∗(0.60)
0.4(0.67)
n 136 136 135 135 134Stocks with high liquidity
AR (in %) 4.3 ∗∗∗(0.42)
−1.4 ∗∗∗(0.42)
2.5 ∗∗∗(0.42)
1.9 ∗∗∗(0.43)
−1.3 ∗∗∗(0.43)
CAR (in %) 4.3 ∗∗∗(0.42)
2.9 ∗∗∗(0.59)
5.4 ∗∗∗(0.73)
7.6 ∗∗∗(0.87)
6.3 ∗∗∗(0.97)
n 41 41 41 40 40Stocks with low liquidity
AR (in %) 0.7(0.77)
−2.2 ∗∗∗(0.77)
2.5 ∗∗∗(0.77)
−1.6 ∗∗∗(0.77)
−0.8 ∗(0.77)
CAR (in %) 0.7(0.77)
−1.5 ∗∗(1.08)
1.0(1.33)
−0.6(1.53)
−1.4(1.71)
n 44 44 44 44 44Events before July 1st, 2005
AR (in %) −0.1(0.47)
−0.7 ∗∗(0.47)
1.3 ∗∗∗(0.47)
−3.0 ∗∗∗(0.47)
−2.1 ∗∗∗(0.47)
CAR (in %) −0.1(0.47)
−0.8 ∗(0.67)
0.5(0.81)
−2.5 ∗∗∗(0.94)
−4.6 ∗∗∗(1.05)
n 63 63 63 63 63Events after July 1st, 2005
AR (in %) 3.0 ∗∗∗(0.50)
−1.0 ∗∗∗(0.50)
0.6 ∗(0.51)
0.3(0.52)
−0.0(0.53)
CAR (in %) 3.0 ∗∗∗(0.50)
2.0 ∗∗∗(0.71)
1.8 ∗∗∗(0.88)
2.2 ∗∗∗(1.03)
2.1 ∗∗∗(1.18)
n 89 89 88 87 86Events with more than 10 message arrivals
AR (in %) 7.3 ∗∗∗(0.88)
−1.2 ∗(0.88)
1.9 ∗∗∗(0.88)
−0.7(0.88)
−0.7(0.88)
CAR (in %) 7.3 ∗∗∗(0.88)
6.1 ∗∗∗(1.24)
8.0 ∗∗∗(1.52)
7.3 ∗∗∗(1.76)
6.6 ∗∗∗(1.96)
n 33 33 33 33 33Standard errors in brackets; sig. levels: ∗p < 0.05, ∗∗p < 0.01, ∗∗∗p < 0.001
24