Embed Size (px)
Citation preview
V-, ..:; Vl
')C ~ :t-..: c-.l '""' 0 r 1
.,. 0 ô
1 0 \I'\ 1 "' 1 .,. 1 ..J 0 ., 0 ~
v) 0 ..J 0 ~ 0 a C- 0 cr - ~ 3 u.J 3 1 1
Çl \I' u V) .'-' o... ô.. t-::r. X. ~
X :l:
ti• a> a--~ 0 0
"' 0"' a o' .,. 1 o' j :! 0 ~ :)
0 ~ 0 3 0 «: .., 1 3 - 3 1 V
Vl 1 V, i= V
Y') ~ ~ ... Q.. :J:
'>< ::t ~ 7. X
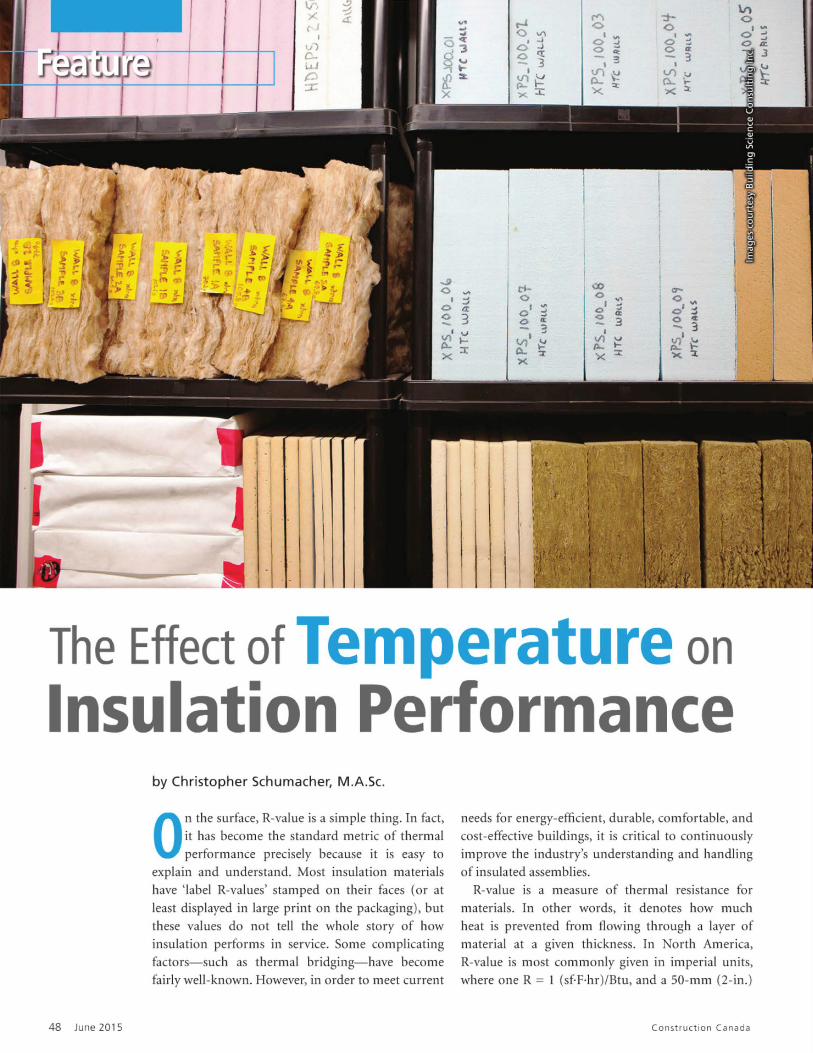
The Effect of Temperature on lnsulation Performance
48 June 2015
by Christopher Schumacher, M.A.Sc.
0 n the surface, R-value is a simple thing. In fact, it ha become the standard metric of thermal
performance precisely because it is easy to explain and understand. Most insulation materials have 'label R-values' stamped on their faces (or at
least displayed in large print on the packaging), but these values do not tell the whole story of how
insulation performs in service. Sorne complicating factors-such as thermal bridging- have become fair ly well -known. However, in order to meet current
needs for energy-efficient, durable, co mfortable, and cost-effective buildings, it is critical to continuously
improve the industry's understanding and handling of insulated a semblies.
R-value is a measure of thermal resistance for
materials. In other words, it denotes how much heat is prevented from flowing through a layer of material at a given thickne s. Tn orth America,
R-value is most commonly given in imperial units, where one R = 1 (sf·F·hr)/Btu, and a 50-mm (2-in. )
Construction Canada
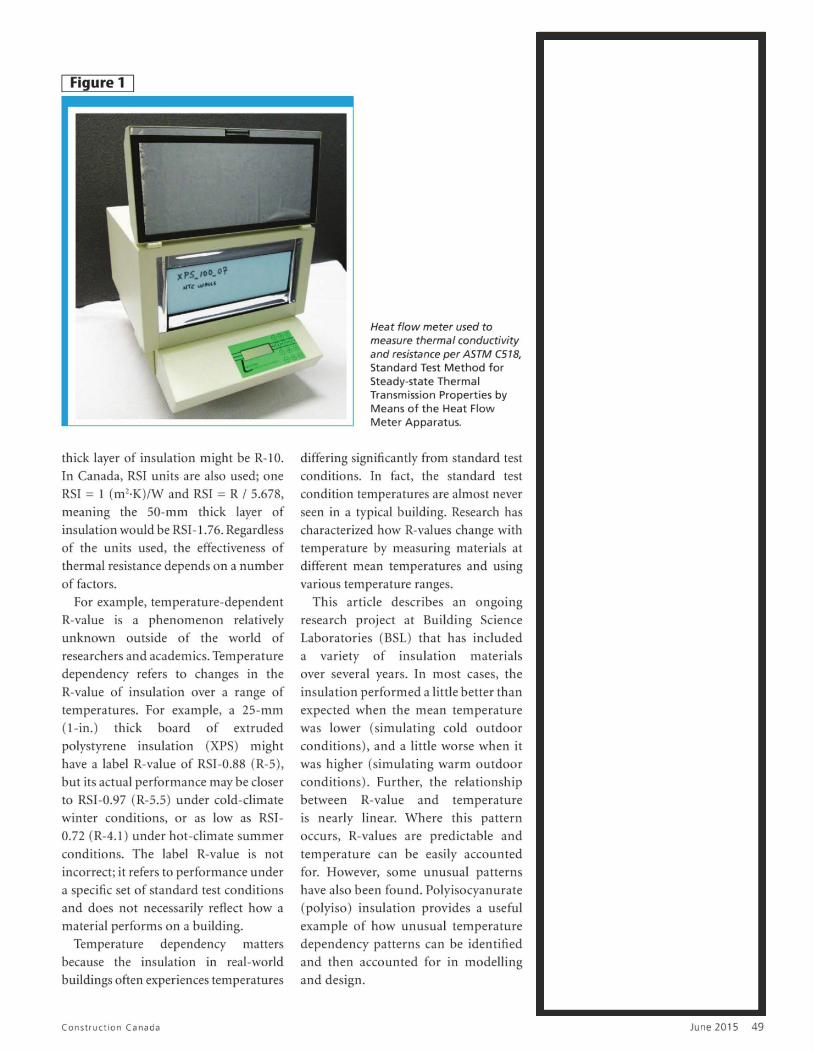
Figure 1
thick layer of insulation might be R-1 O.
In Canada, RSI units are also used; one
RSI = 1 (m 2·K)/W and RSI = R J 5.678,
meaning the 50-111111 thick layer of
in ulation would be RSI-1.76. Regardle
of the units used, the effectiveness of
thermal resistance depends on a number
of factors.
For example, temperature-dependent
R-value is a phenomenon relatively
unknown outside of the world of
researcher and academic . Temperature
dependency refers to changes in the
R-va lue of insulation over a range of
temperature . For example, a 25-mm
(! -in.) thick board of extruded
polystyrene insulation (XPS) might
have a label R-value of R I-0.88 (R-5 ),
but its actual performance may be doser to R I-0.97 (R-5.5) under cold-climate
winter conditions, or as low a RSI-
0.72 (R-4.1) under hot-climate ummer
conditions. The label R-value is not
incorrect; it refers to performance under
a specific set of standard test conditions
and does not necessarily reflect how a
material performs on a building.
Temperature dependency matter because the insulation in real-world
buildings often experiences temperatures
Construc t ion Canada
Heat flow meter used to measure thermal conductivity and resistance per ASTM C518, Standard Test Method for Steady-state Therma l Transmission Properties by Means of the Heat Flow Meter Apparatus.
differing significantly from standard test
conditions. In fact, the standard test
condition temperatures are almost never
seen in a typical building. Research bas
characterized how R-value change with
temperature by measuring materials at
different mean temperatures and using
various temperature ranges.
Thi article de cribes an ongoing
research project at Building Science
Laboratories (BSL) that has included
a variety of in ulation materials
over several years. In most cases, the
in ulation performed a little better than
expected when the mean temperature
was lower (simulating cold outdoor
conditions), and a little worse when it
wa higher ( imulating warm outdoor
conditions). Further, the relationship
between R-value and temperature
is near ly linear. Where this pattern
occurs, R-value are predictable and
temperature can be easily accounted
for. However, orne unusual patterns
have also been found. Polyisocyanurate
(polyiso) insulation provides a useful
example of how unusual temperature
dependency pattern can be identified
and then accounted for in modelling
and design.
June 2015 49
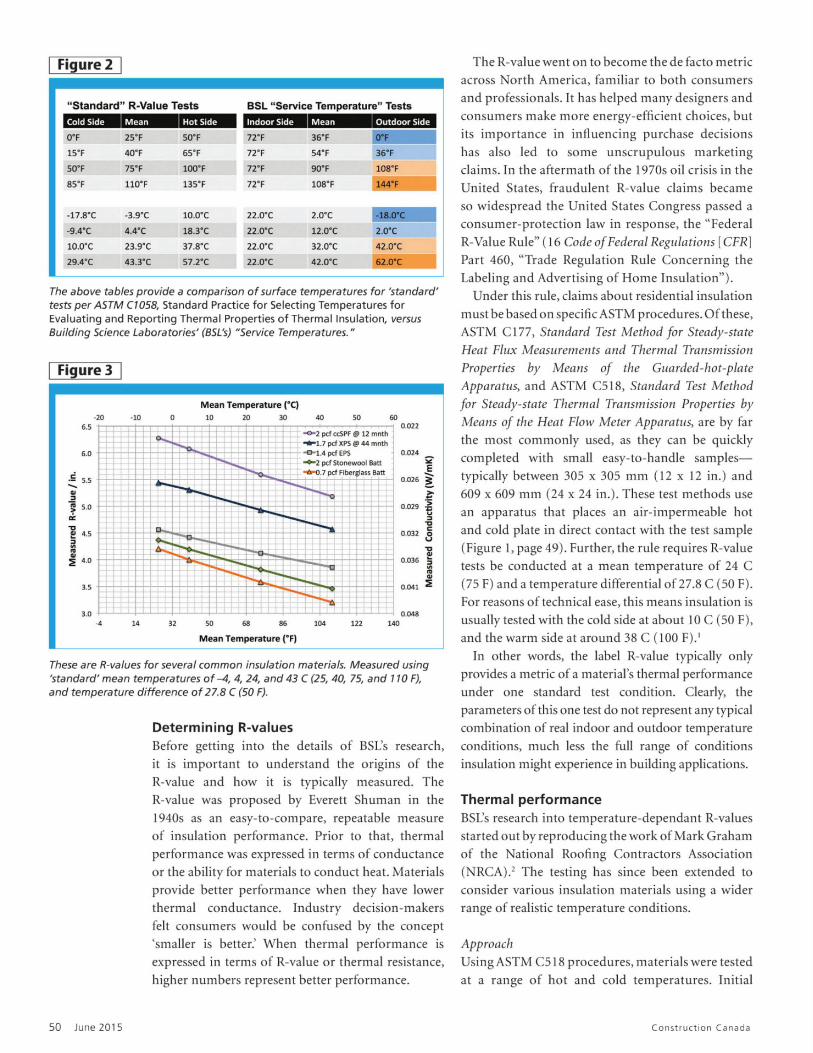
Figure 2
" Standard" R-Value Tests BSL " Service Temperature" Tests
Cold Side Mean Hot Side lndoor Side Mean i•MEW%N O"F 25"F SO"F 72"F 36"F O"F
lS"F 40"F 65"F 72"F 54"F 36"F
SO"F 7S"F lOO"F 72"F 90"F 108"F
SS"F llO"F 13S"F 72"F 108"F 144"F
-17.8"( -3.9"C 10.o·c 22 .o·c 2.o·c
-9 .4"C 4.4"C 18.3"C 22 .o·c 12.o·c 2.o· c
10.o·c 23.9"C 37.S"C 22 .o· c 32.0"C 42 .0"C
29.4"C 43.3"C 57.2"C 22 .o·c 42.0"C 62.0"C
The above tables provide a comparison of surface temperatures for 'standard' tests per ASTM C1058, Standard Practice for Selecting Temperatures for Evaluating and Reporting Thermal Properties of Therma l lnsulation, versus Building Science Laboratories' (BSL's) "Service Temperatures. "
Figure 3
Mean Temperature (' Cl -20 -10 0 10 20 30 40 50 60
6.5 0.022 - 2 pcf ccSPF ~ 12 mnth - 1.7 pcf XPS ~ 44 mnth
6.0 1.4 pcf EPS 0.024 -2 pcf Stonewool Batt ;.--O. 7 pcf Fibergtass Batt E
-~ 5.5 0.026 ~ -.. ~ ::,
j 5.0 0.029 :~
"' ::, ~
~ C ~ 4.5 0.032 0
a u .. ~ .. 0.036 ~ :E 4.0 a .. ..
3.5 0.041 :E
3.0 0.048 -4 14 32 50 68 86 104 122 140
Mean Temperature ("F)
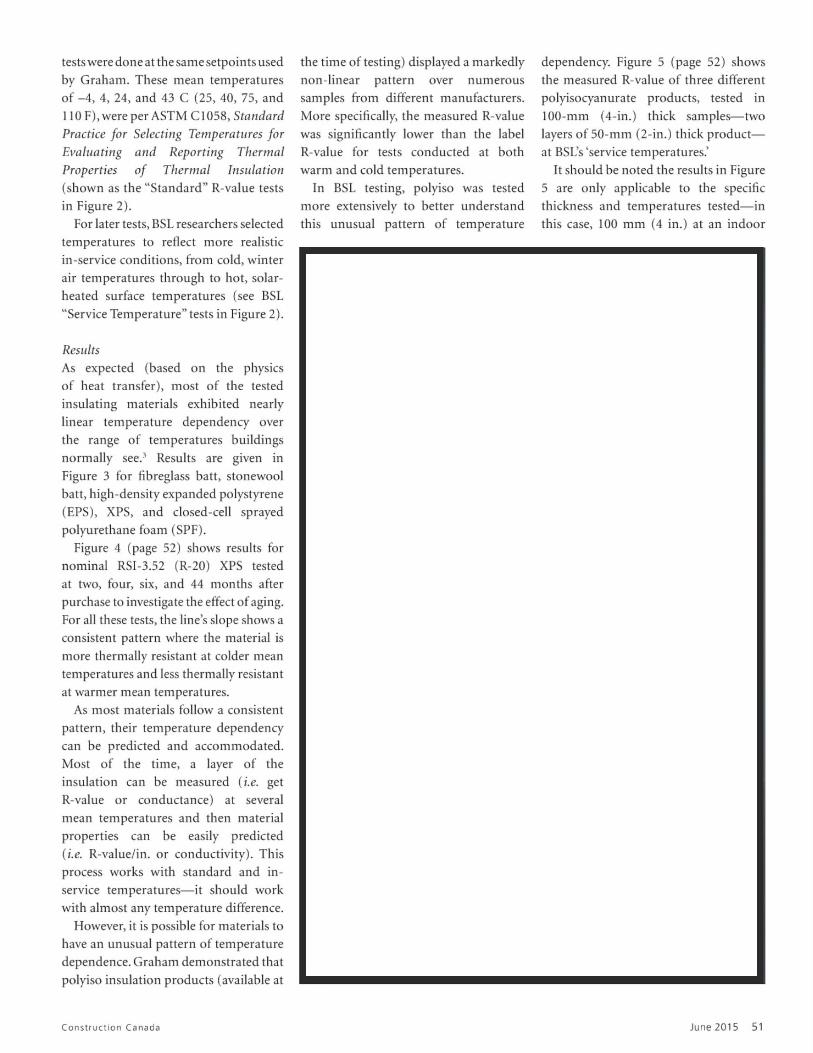
These are R-values for several common insulation materials. Measured using 'standard' mean temperatures of-4, 4, 24, and 43 C (25, 40, 75, and 110 F), and temperature difference of 27.8 C (50 F).
50 June 2015
Determining R-values Before getting into the details of BSL's research, it i important to understand the origin of the R-value and how it i typically measured. The
R-value was proposed by Everett Shuman in the
1940s as an easy-to-compare, repeatable measure of in ulation performance. Prior to that, thermal performance was expressed in terms of conductance
or the ability for materials to conduct heat. Material provide better performance when they have lower thermal conductance. Industry decision-makers
fe lt consumers wou ld be confused by the concept ' maller i better.' When thermal performance i expressed in terms of R-value or thermal resistance,
higher numbers represent better performance.
The R-value went on to become the de facto metric acros orth America, fami liar to both consumers
and professionals. Tt has helped many designers and consumers make more energy-efficient choices, but
it importance in inAuencing purchase deci ion has also led to some unscrupulous marketing
daims. In the aftermath of the 1970s oil crisis in the United tate , fraudu lent R-value daim became
so widespread the United States Congress passed a consumer-protection law in response, the "Ferlerai
R-Value Rule" ( 16 Code of Federal Regulations [ CFRl Part 460, "Trade Regulation Rule Concerning the
Labeling and Advertising of Home Insulation") . Under thi mie, daims about residential insulation
mu t be ba ed on pecificASTM procedures. Ofthese, ASTM C 177, Standard Test Method for Steady-state Heat Flux Measurements and Thermal Transmission Properties by Means of the G11arded-hot-plate Apparat-us, and ASTM C518, Standard Test Method for Steady-state Thermal Transmission Properties by Means of the Heat Flow Meter Apparatus, are by far the most commonly used, as they can be quickly completed with small easy-to-handle samples
typically between 305 x 305 mm ( 12 x 12 in.) and
609 x 609 mm (24 x 24 in.) . The e test methods u e an apparatus that places an air-impermeable hot and cold plate in direct contact with the te t ample (Figure 1, page 49). Further, the rule require R-value
tests be conducted at a mean temperature of 24 (75 F) and a temperature differential of27.8 C (50 F).
For rea on of technica l ea e, thi mean in ulation i usually tested with the cold sicle at about 10 C (50 F), and the warm sicle at around 38 C (100 F). 1
In other word , the label R-value typically only provides a metric of a material 's thermal performance
under one standard test condition. Clearly, the parameters of thi one test do not repre ent any typical
combination of real indoor and outdoor temperature conditions, much less the full range of conditions
in ulati n might experience in building application .
Thermal performance BSL's research into temperature-dependant R-va lue tarted out by reproducing the work of Mark Graham
of the ational Roofing Contractors Association (NRCA).2 The te ting ha since been extended to consider various insulation mater.ials using a wider range of realistic temperature conditions.
Approach Using ASTM C5 l 8 procedures, materials were tested
at a range of hot and cold temperatures. Initia l
Construction Canada
testswere doneat the samesetpoints used
by Graham. These mean temperatures of -4, 4, 24, and 43 C (25, 40, 75, and
110 F) , were per ASTM C l 058, Standard Practice for Selecting Temperatures for Evaluating and Reporting Thermal Properties of Thermal Insulation ( hown a the " tandard" R-value te t in Figure 2).
For la ter tests, B L researchers selected temperatures to reflect more realistic in- ervice conditions, from cold, winter
air temperatures through to hot, solarheated surface temperatures ( ee B L "Service Temperature" test in Figure 2).
Results A expected (ba ed on the phy ics of heat transfer), most of the tested insulating materials exhibited nearly
linear temperature dependency over the range of temperatures buildings
normally see.3 Results are given in
Figure 3 for fibreglass batt, stonewool batt, high-density expanded polystyrene (EPS), XPS, and closed-cell sprayed polyurethane foam (SPF).
Figure 4 (page 52) shows results for nominal R I-3.52 (R-20) XPS tested at two, four, six, and 44 months after
purchase to inve tigate the effect of aging. For ail these tests, the line's slope shows a consistent pattern where the material is
more thermally resistant at colder mean temperatures and less thermally resistant
at warmer mean temperatures. A 1110 t materials fo llow a con i tent
pattern, their temperature dependency
can be predicted and accommodated. Mo t of the time, a layer of the insulation can be measured (i. e. get R-value or conductance) at several
mean temperatures and then material propertie can be ea ily predicted (i.e. R-value/in. or conductivity). This
proce works with standard and inservice temperatures-it should work with almost any temperature difference.
However, it is possible for materials to have an unu ual pattern of temperature
dependence. Graham demonstrated that polyiso insulation products (available at
Construc t ion Canada
the time of testing) displayed a markedly non- linear pattern over numerous
samples from different manufacturers. More specifically, the measured R-value
was significantly lower than the label R-value for tests conducted at both
warm and cold temperatures. In B L te ting, polyi o wa te ted
more extensively to better understand
this unusual pattern of temperature
dependency. Figure 5 (page 52) shows the measured R-value of three different
polyisocyanurate products, tested in 100-mm (4-in. ) thick samples- two
layers of 50-mm (2-in. ) thick productat B L's 'service temperatures.'
It should be noted the results in Figure 5 are only applicable to the pecific thickness and temperatures tested-in this case, 100 mm (4 in.) at an indoor
June 2015 5 1
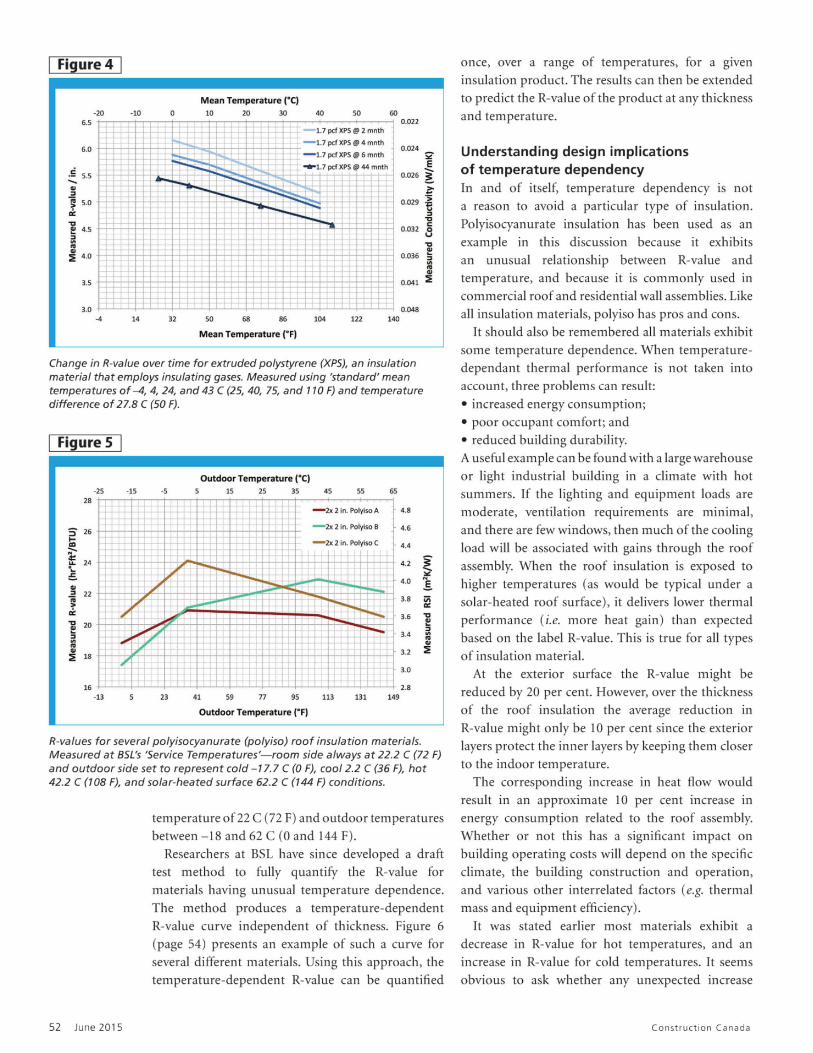
Figure 4
Mean Temperature (' C) -20 -10 0 10 20 30 40 50 60 6.5 ________ ....,_ ____ ....... ________ 0.022
-4 14 32 50 68 86
Mean Temperature (' FI
1. 7 pcf XPS @ 2 mnth
- 1.7 pcf XPS@ 4 mnth
- 1.7 pcf XPS@ 6 mnth
104 122 140
Change in R-value over time for extruded po/ystyrene (XPS), an insulation material that employs insulating gases. Measured using 'standard' mean temperatures of -4, 4, 24, and 43 C (25, 40, 75, and 110 F) and temperature difference of 27.8 C (50 F).
1 Figure 5 1
Outdoor Temperature (' Cl .25 ·15 .5 15 25 35 45 55 65
28 - 2x 2 in. Polyiso A 4.8
s 26 - 2x 2 in. Polyiso 8 4.6
lii - 2x 2 in. Polyiso C 4.4 ;;--~
24 i ... 4.2
~ 4.0 1 .. :, 22 li 3.8 iii > a: a: 3.6 ... ... 20 ~ ~ :,
3.4 .. 1;l .. .. .. .. 3.2 :!: :!: 18
3.0
16 2.8 .13 23 41 59 n 95 113 131 149
Outdoor Temperature (' F)
R-va/ues for several polyisocyanurate (po/yiso) roof insulation materia/s. Measured at BSL's 'Service Temperatures'-room side always at 22.2 C (72 F) and outdoor side set to represent cold - 17.7 C (0 F), cool 2.2 C (36 F), hot 42.2 C (108 F), and solar-heated surface 62.2 C (144 F) conditions.
52 June 2015
temperature of22 C (72 F) and outdoor temperatures between - 18 and 62 (0 and 144 F).
Researchers at BSL have since developed a draft
te t method to fully quantify the R-value for materia ls having unusuaJ temperature dependence.
The method produces a temperature-dependent R-value curve independent of thickness. Figure 6 (page 54) pre ent an example of uch a curve for
several different materials. Using this approach, the temperature-dependent R-value can be quantified
once, over a range of temperatures, for a given in ulation product. The re ult can then be extended to predict the R-value of the product at any thickness
and temperature.
Understanding design implications of temperature dependency In and of it elf, temperature dependency not a reason to avoid a particular type of insulation.
Polyisocyanurate insulation has been used as an example in this discussion because it exhibits
an unu ual relationship between R-value and temperature, and because it is commonly used in
commercial roof and residential wall assemblies. Like ail insuJation materials, polyi o has pro and con .
It should also be remembered al) materials exhibit some temperature dependence. When temperature
dependant thermal performance i not taken into account, three problems can result:
• increased energy consumption;
• poor occupant comfort; and • reduced building durability. A useful example can be found with a large warehouse or light indu trial building in a climate with hot
ummer . If the lighting and equipment loads are moderate, ventilation requirements are minimal, and there are few window , then much of the cooling
Joad will be as ociated with gains through the roof assembly. When the roof insulation is exposed to
higher temperatures (as would be typica l under a olar-heated roof urface), it del iver lower thermal
performance (i.e. more heat gain) than expected
based on the label R-value. This is true for all types of in ulation material.
At the exterior surface the R-value might be reduced by 20 per cent. However, over the thickness
of the roof in ulation the average reduction in
R-vaJue might only be 10 percent since the exterior layers protect the in ner layers by keeping them doser
to the indo r temperature. The corresponding increase in heat flow wouJd
result in an approximate 10 per cent increase in
energy consumption related to the roof assembly. Whether or not thi has a significant impact on
building operating costs will depend on the specific climate, the building con truction and operation, and various other interrelated factors (e.g. thermal mass and equipment efficiency).
It was stated earlier most materials exhibit a decrea e in R-value for hot temperature , and an increase in R-value for cold temperatures. It seems
obvious to ask whether any unexpected increa e
Construction Canada
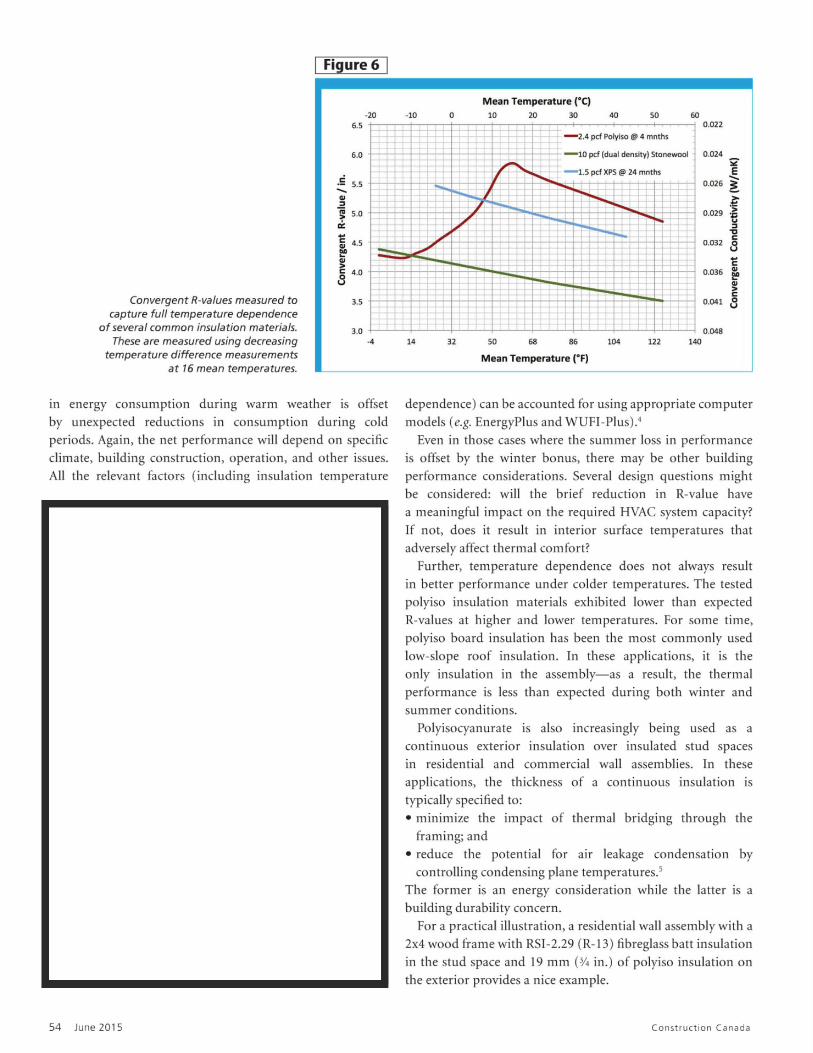
Figure 6
Mean Temperature ("C) ·20 ·10 0 10 20 30 40 50 60
6.5 +---t-----i----t---+---+----+----+-----i 0.022
Convergent R-values measured to capture full temperature dependence
of several common insulation materials. These are measured using decreasing
temperature difference measurements at 16 mean temperatures.
6.0
.. !il 4.5 ~ ~ 8 4.0
-4
in energy consumption during warm weather is offset
by unexpected reduction in con umption during cold periods. Again, the net performance will depend on specific climate, building construction, operation, and other issues.
Ali the relevant factor (including in ulation temperature
54 June 20 15
- 2.4 pcf Polyiso@ 4 mnths
14 32 50 68 86 104 122
Mean Temperature (°F)
140
0.024 ~ E
0.026 ! -~ > 0.029 ·e :J
"D C
0.032 8 .. C
0.036 ~
~ C
0.041 8
0.048
dependence) can be accounted for using appropria te computer mode) (e.g. EnergyPlu and WUFI-Plus). 4
Even in those cases where the summer loss in performance is offset by the winter bonus, there may be other building performance considerations. Severa! design questions might be considered: will the brief reduction in R-value have a meaningfül impact on the required HVAC system capacity?
If not, doe it re ult in interior urface temperature that adversely affect thermal comfort?
Further, temperature dependence does not always result
in better performance under colder temperatures. The tested polyi o in ulation material exhibited lower than expected R-values at higher and lower temperatures. For some time,
polyiso board insulation has been the most common ly used low- lope roof in ulation. In the e application , it is the
only insulation in the assembly- as a result, the thermal performance is le than expected during both winter and
summer conditions. Polyisocyanurate is also increasingly being used as a
continuous exterior insulation over insulated stud spaces
in re idential and commercial wall a emblie . In the e applications, the thickness of a continuous insulation is typically specified to:
• minimize the impact of thermal bridging through the framing; and
• reduce the potential for air leakage condensation by controll ing condensing plane temperatures.5
The former is an energy consideration while the latter is a building durability concern.
For a practica l illustration , a residential wall assembly with a 2x4 wood frame with R I-2.29 (R-13) fibregla batt in ulation in the stud space and 19 mm (3/4 in.) of polyiso insulation on the exterior provides a nice example.
Constru ct io n Canada
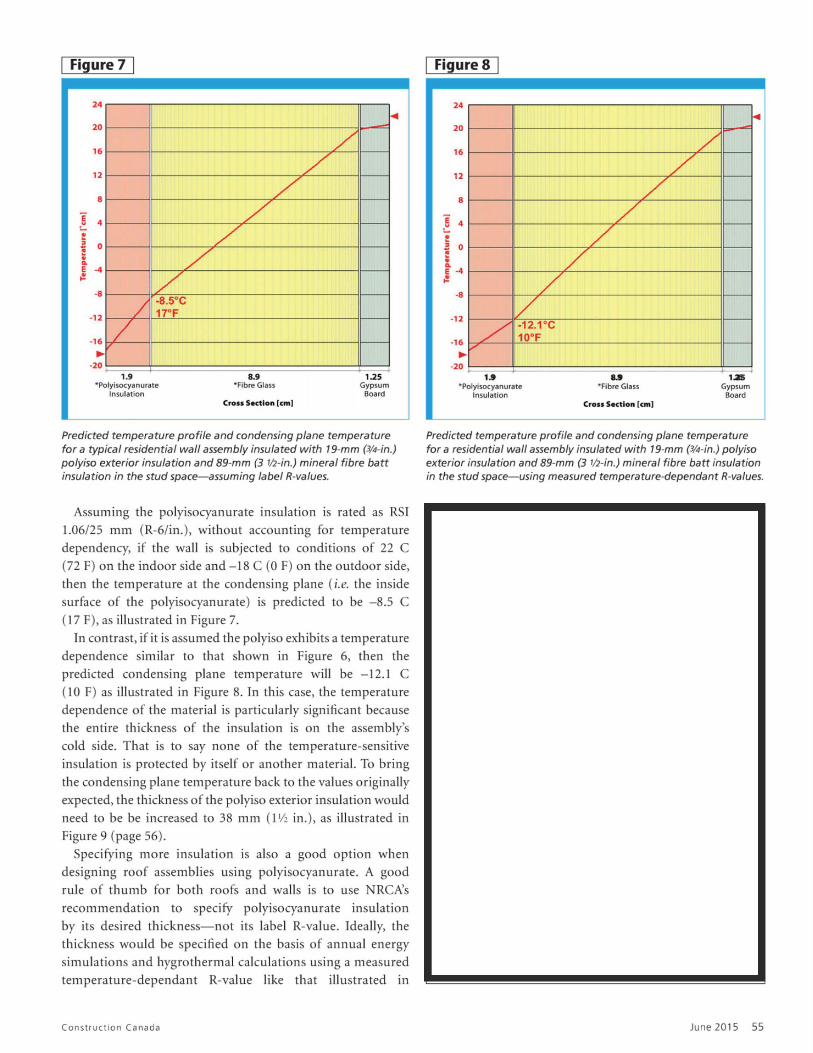
Figure 7
24
20
16
12
8
] 4 :... ! ! 0 • ... E -4 ~
/ /
/ -s.s•c -8
-12
-16 ... -20
/
17°F
/ 1.9
•Polyisocyanurate lnsulatlon
/ /
/
8.9 •Fibre Glass
Cross Section [cm)
/ /
1.25 Gypsum
Board
Predicted temperature profile and condensing plane temperature for a typical residential wa/1 assembly insulated with 19-mm (3/4-in.) polyiso exterior insulation and 89-mm (3 1/i-in.) minerai fibre batt insula tion in the stud space-assuming label R-values.
Assuming the polyisocyanurate insulation is rated as RSI 1.06/25 mm (R-6/in. ), without accounting for temperature dependency, if the wall is subjected to conditions of 22 C (72 F) on the indoor side and - 18 C (0 F) on the outdoor side, then the temperature at the condensing plane (i.e. the inside
urface of the polyi ocyanurate) i predicted to be -8.5 C (17 F), as illustrated in Figure 7.
In contrast, if it is assumed the polyiso exhibits a temperature dependence imilar to that shown in Figure 6, then the predicted condensing plane temperature will be - 12.1 C (10 F) as ilJustrated in Figure 8. In this case, the temperature
dependence of the material i particularly ignificant becau e the entire thickness of the insulation is on the assembly's
cold side. That is to say none of the temperature-sensitive in ulation i protected by itself or another materia l. To bring
the condensing plane temperature back to the values originally expected, the thickness of the polyiso exterior insulation would
need to be be increased to 38 mm (1 Yz in.), as illustrated in Figure 9 (page 56).
Specifying more insulation is also a good option when de igning roof a emblies u ing polyi ocyanurate. A good rule of thumb for both roofs and walls is to use RCA's
recom mendation to specify polyisocyanurate insulation by its desired thickness-not its label R-value. Ideally, the
thickne would be pecified on the ba i of annual energy simulations and hygrothermal calculations using a measured temperature-dependant R-va lue like that illustrated in
Construc t ion Ca nada
Figure 8
24
20
16
12
8
Ê 4 i: • ? 0 ! • ... E ~
-4
·8
-12
·16 ... -20
/ :/
1.9
/ V -12.1°c 10°F
*Polyisocyanurate lnsulation
/
/ /
u *Fibre Glass
/
Cro11 Section [cm]
/ /
, .. Gypsum Board
...
Predicted temperature profile and condensing plane temperature for a residential wa/1 assembly insulated with 19-mm (3/4-in.) polyiso exterior insulation and 89-mm (3 1/i-in.) minerai fibre batt insulation in the stud space-using measured temperature-dependant R-values.
June 2015 SS
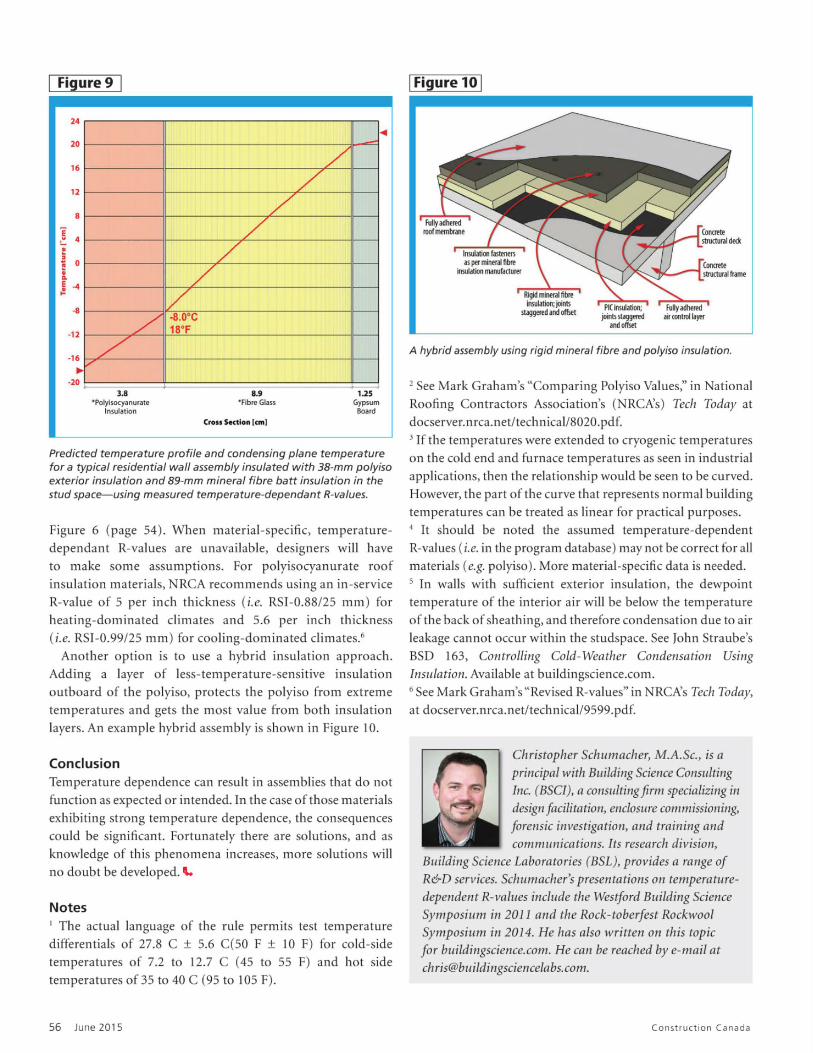
Figure 9
24
20
16
12
8
Ë L. 4
e ! 0 • ... 1 -4
-12
-16
... ·20
/ /
/
1,-3.8
·Polyisocyanurate lnsulatlon
/ 1/
•8 .0°C 18°F
/ /
/
8.9 "Fibre Glass
Cross Section [cm)
/ /
-
1.25 Gypsum
Board
Predieted temperature profile and condensing plane temperature for a typical residential wa/1 assembly insulated with 38-mm polyiso exterior insulation and 89-mm minerai fibre batt insulation in the stud space-using measured temperature-dependant R-values.
Figure 6 (page 54). When material - pecific, temperaturedependant R-values are unavailable, designers will have to make some assumptions. For polyisocyanurate roof
insulation materials, RCA recommends using an in -service R-value of 5 per inch thickne ( i.e. R T-0.88/25 mm ) for
heating-dominated climates and 5.6 per inch thickness (i .e. R T-0.99/25 mm ) for cooling-dominated cl imates.6
Another option i to u e a hybrid insulation approach. Adding a layer of less-temperature-sensitive insulation
outboard of the polyiso, protects the polyiso from extreme temperature and get the mo t value from both in ulati n
layers. An example hybrid assembly is shown in Figure 10.
Conclusion Temperature dependence can result in assemblies that do not function as expected or intended. In the case of those materials
exhibiting strong temperature dependence, the con equences could be ignificant. Fortunately there are olution , and a knowledge of this phenomena increases, more solutions will
no doubt be developed. IL.
Notes 1 The actual language of the rule permits test temperature differential of 27.8 ± 5.6 C(50 F ± 10 F) for cold- ide temperatures of 7.2 to 12.7 C ( 45 to 55 F) and hot side
temperatures of 35 to 40 (95 to 105 F).
56 June 20 15
1 Figure 10 !
Rigid minerai fibre lnsulation; joints
staggeœd and ot!,et
A hybrid assembly using rigid minerai fibre and polyiso insulation.
2 See Mark Graham's "Comparing Polyiso Values," in National Roofing Contractors Association's ( RCA's) Tech Today at
docserver.nrca.net/ technical/8020.pdf. 3 If the temperatures were extended to cryogenic temperatures on the cold end and furnace temperatures as seen in industrial applications, then the relationship would be seen to be curved.
However, the part of the curve that repre ents normal building temperatures can be treated as linear for practical purposes. 4 It hould be noted the a sumed lemperature-dependent
R-values ( i.e. in the program data base) may not be correct for ail materials (e.g. polyiso). More material-specific datais needed. 5 In walls with sufficient exterior insu lation, the dewpoint temperature of the interior air will be below the temperature
of the back of sheathing, and therefore condensation due to air leakage cannot occur within the studspace. See John traube's BSD 163, Controlling Cold-Weather Condensation Using Ins11/ation. Avai lable at bui ldingscience.com. 6 See Mark Graham's "Revised R-values" in RCA's Tech Today, at doc erver.nrca.net/technical/9599.pdf.
Christopher chumacher, M.A. c., is a principal with Building Science Consulting Tnc. (B CT), a consultingfirm specializing in design facilitation, enclosure commissioning, forensic investigation, and training and comnmnications. Its research division,
Building Science Laboratories (BSL), provides a range of R&D services. Schumacher's presentations on temperaturedependent R-values include the Westford Building Science Symposium in 2011 and the Rock-toberfest Rockwool Symposium in 2014. He has a/sa written on this tapie for b11ildingscie11ce.com. He can be reached bye-mail at [email protected].
Constru ct io n Canada