Embed Size (px)
Citation preview
Eastern Michigan UniversityDigitalCommons@EMU
Master's Theses and Doctoral Dissertations Master's Theses, and Doctoral Dissertations, andGraduate Capstone Projects
2008
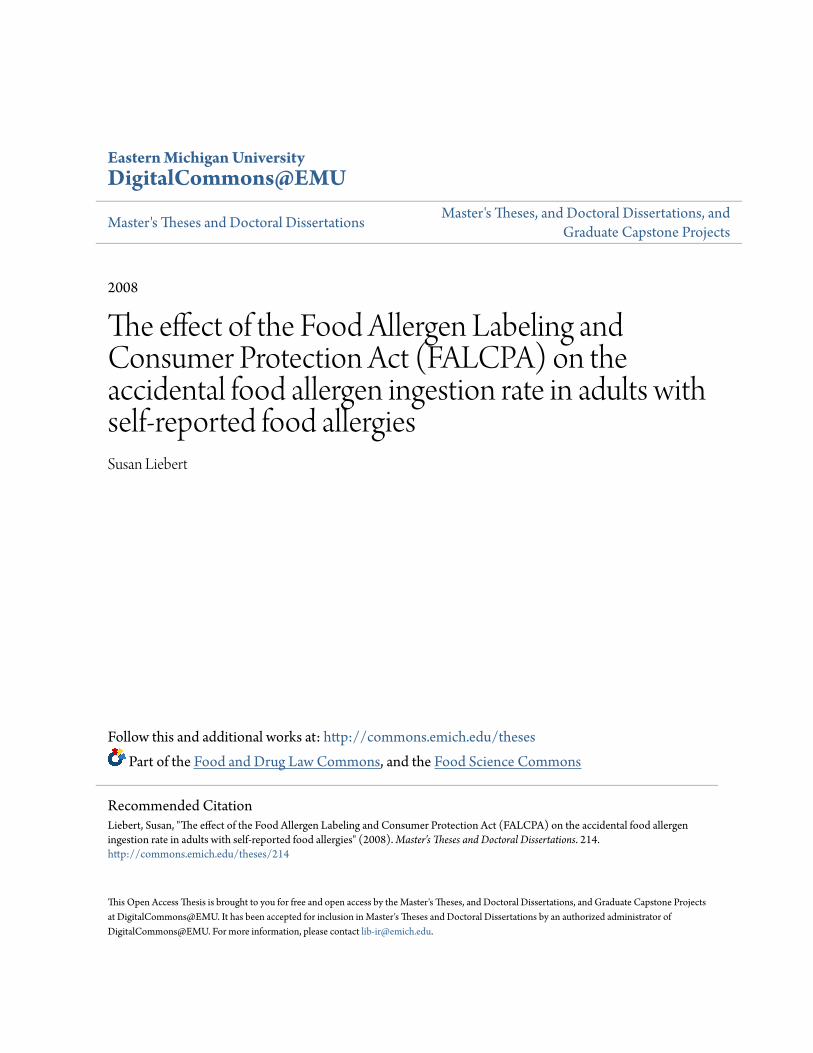
The effect of the Food Allergen Labeling andConsumer Protection Act (FALCPA) on theaccidental food allergen ingestion rate in adults withself-reported food allergiesSusan Liebert
Follow this and additional works at: http://commons.emich.edu/theses
Part of the Food and Drug Law Commons, and the Food Science Commons
This Open Access Thesis is brought to you for free and open access by the Master's Theses, and Doctoral Dissertations, and Graduate Capstone Projectsat DigitalCommons@EMU. It has been accepted for inclusion in Master's Theses and Doctoral Dissertations by an authorized administrator ofDigitalCommons@EMU. For more information, please contact [email protected].
Recommended CitationLiebert, Susan, "The effect of the Food Allergen Labeling and Consumer Protection Act (FALCPA) on the accidental food allergeningestion rate in adults with self-reported food allergies" (2008). Master's Theses and Doctoral Dissertations. 214.http://commons.emich.edu/theses/214

The Effect of the Food Allergen Labeling and Consumer Protection Act (FALCPA) on
the Accidental Food Allergen Ingestion Rate in Adults with Self-reported Food
Allergies
by
Susan Liebert
Thesis
Submitted to the Department of Health and Human Services
Eastern Michigan University
in partial fulfillment of the requirements
for the degree of
MASTER OF SCIENCE
in
Human Nutrition
Thesis Committee:
George Liepa, PhD, Chair
Alice Jo Rainville, PhD, RD
Lee Tincher, RD, MS
May 12, 2008
Ypsilanti, Michigan
ii
ACKOWLEDGEMENTS
I would like to thank my graduate thesis advisor, Dr. George Liepa, for guiding
me through the process of designing, implementing, and writing my research study
and thesis. I would also like to thank the other two members of my thesis
committee, Dr. Alice Jo Rainville and Lee Tincher, for their helpful feedback and
suggestions. Finally, I would like to thank Dr. David Bugg for the statistical analysis
of the research data as well as for taking many hours to speak with me regarding the
specifics of the analysis.
iii
ABSTRACT
Background: The Food Allergen Labeling and Consumer Protection Act (FALCPA)
recently required bolded allergens or “contains” statements on food product labels.
Very few U.S. studies have looked at the accidental food allergen ingestion rate in
adults. Since the emotional and medical costs of allergic reactions can be high, it is
important to determine if the FALCPA is helping to reduce the accidental food
allergen ingestion rate in adults with self-reported food allergies.
Objectives: The primary research objective of this study was to determine whether
the new allergen labeling requirements of the FALCPA law has had an effect on the
accidental food allergen ingestion rate of adults with self-reported food allergies.
Secondary objectives were to determine both the prevalence of self-reported food
allergies in adults and the frequency of food product label reading in those who had
self-reported food allergies.
Methods: Surveys were completed by adult mall shoppers (n=386) in Northern
California including 57 adults with self-reported food allergies.
Results: The overall prevalence of self-reported food allergies for the top 8 allergens
covered by FALCPA was found to be 12.4%. Respondents with self-reported food
allergies were found to much more frequently read both allergen information and
manufacturer warning statements on product labels than people without food
allergies. The annual accidental food allergen ingestion rate of adults decreased by
iv
a significant 24.4% in the two years since the FALCPA was passed. Additionally,
the percent of accidental food allergen ingestion events due to store-bought food
decreased while the percent from restaurant-prepared food increased. Restaurant-
prepared food was the number one cited reason for accidental ingestion both prior to
and after the passage of the FALCPA.
Conclusions: Adults with self-reported food allergies are reading the allergen
information and warning statements on food product labels. Data suggest that
passage of the FALCPA is helping to reduce the accidental food allergen ingestion
rate in adults with self-reported food allergies, especially from store-bought food
products.
v
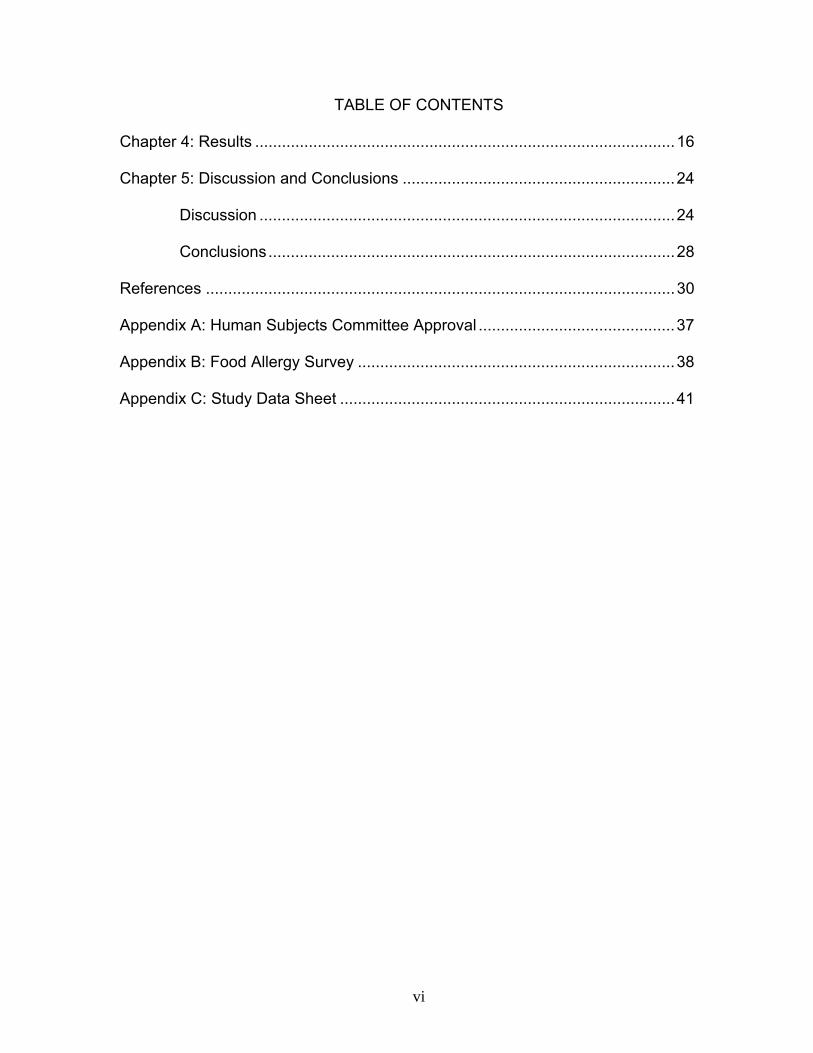
TABLE OF CONTENTS
Acknowledgements............................................................................................... ii
Abstract.................................................................................................................iii
Chapter 1: Introduction and Background ..............................................................1
Introduction ................................................................................................1
Allergic Reaction Mechanism.....................................................................2
Diagnosis of a Food Allergy .......................................................................4
Threshold Dose..........................................................................................4
Prevention ..................................................................................................5
Research Statement ..................................................................................5
Rationale for the Study...............................................................................6
Chapter 2: Review of Related Literature ...............................................................8
Allergen and Product Labeling Laws..........................................................8
Good Manufacturing Processes .................................................................9
Manufacturer Warnings and Consumer Perception of Risk........................9
Accidental Ingestion of Food Allergens ....................................................11
Chapter 3: Research Design and Methodology ..................................................13
Research Objectives ................................................................................13
Population Description .............................................................................13
Research Design......................................................................................13
Research Instrument and Data Collection................................................14
Statistical Analysis ...................................................................................14
Sample Confidentiality and Consent ........................................................15
vi
TABLE OF CONTENTS
Chapter 4: Results ..............................................................................................16
Chapter 5: Discussion and Conclusions .............................................................24
Discussion .............................................................................................24
Conclusions...........................................................................................28
References .........................................................................................................30
Appendix A: Human Subjects Committee Approval ............................................37
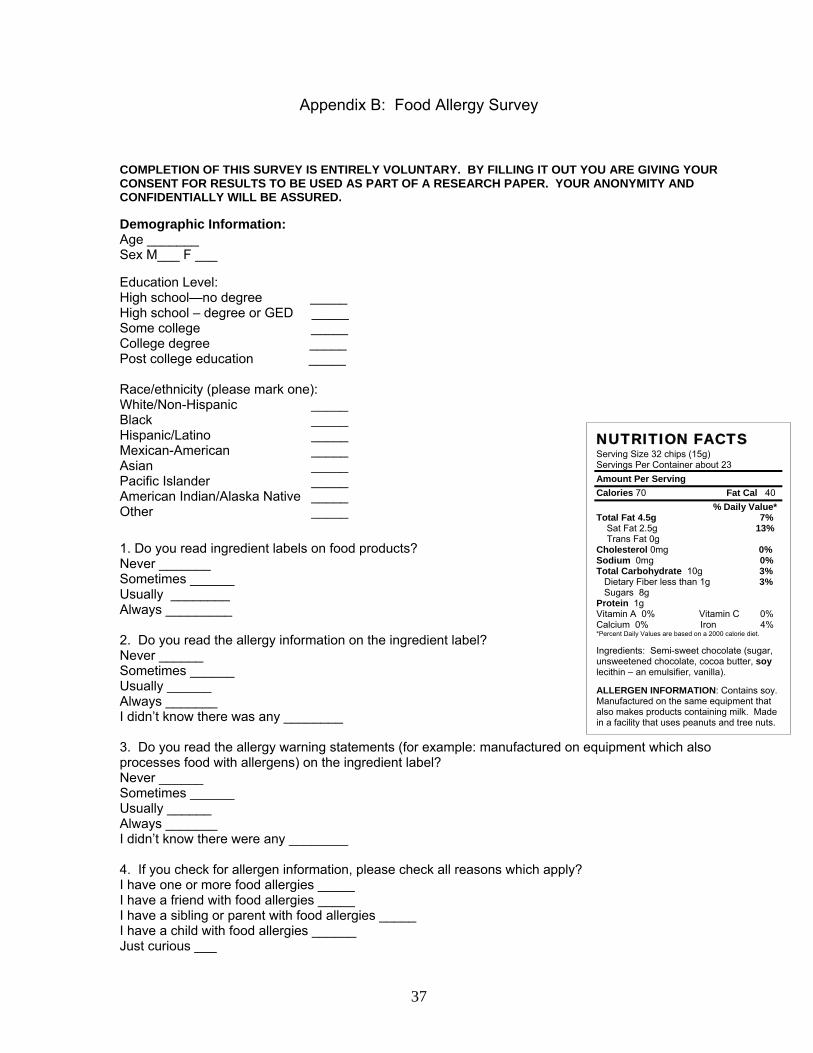
Appendix B: Food Allergy Survey .......................................................................38
Appendix C: Study Data Sheet ...........................................................................41
vii
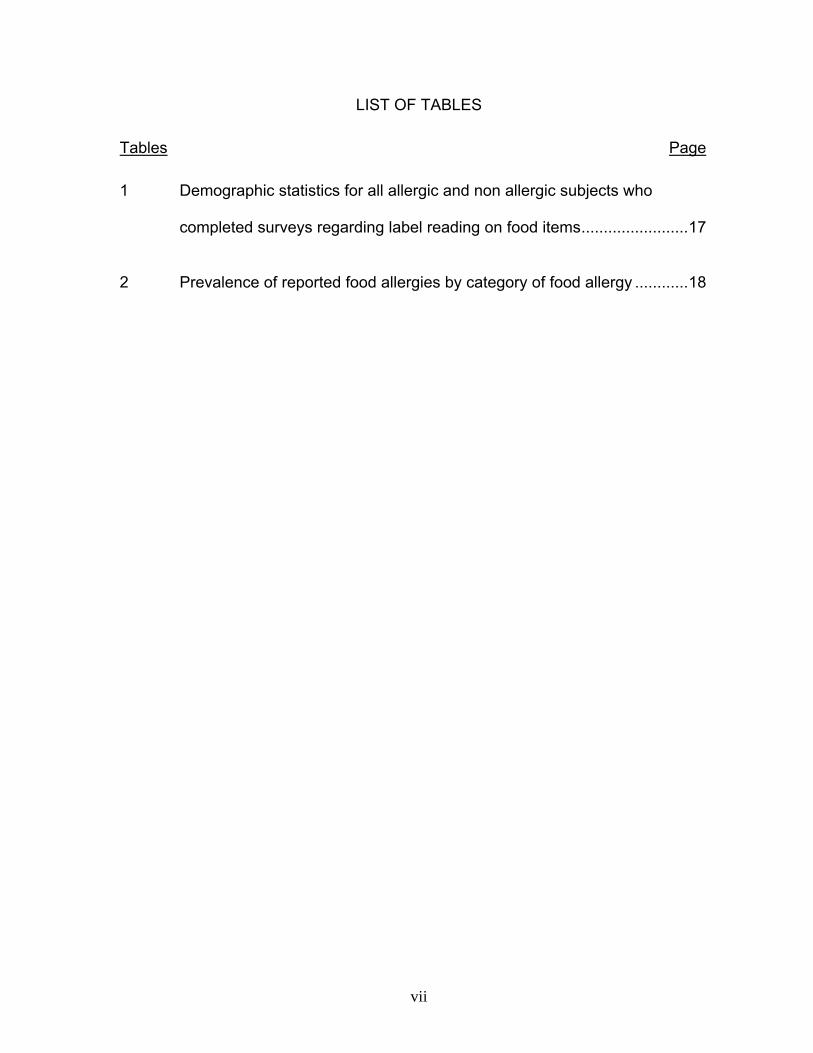
LIST OF TABLES
Tables Page
1 Demographic statistics for all allergic and non allergic subjects who
completed surveys regarding label reading on food items........................17
2 Prevalence of reported food allergies by category of food allergy ............18
viii
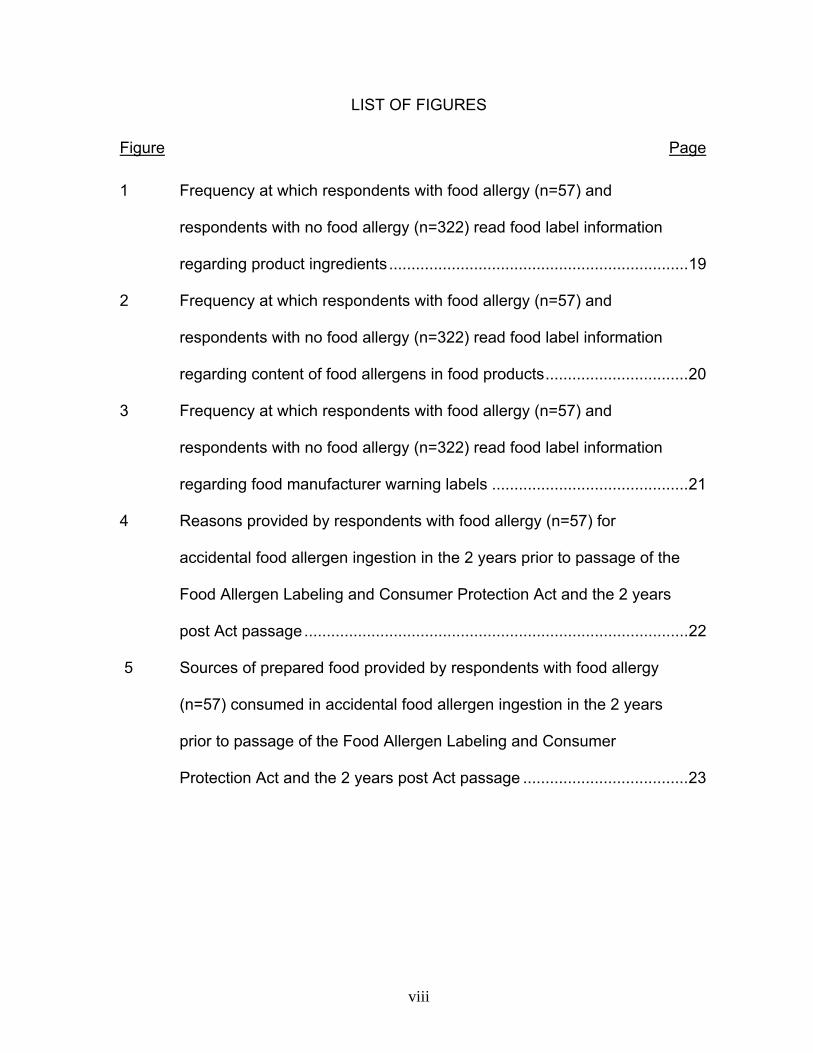
LIST OF FIGURES
Figure Page
1 Frequency at which respondents with food allergy (n=57) and
respondents with no food allergy (n=322) read food label information
regarding product ingredients...................................................................19
2 Frequency at which respondents with food allergy (n=57) and
respondents with no food allergy (n=322) read food label information
regarding content of food allergens in food products................................20
3 Frequency at which respondents with food allergy (n=57) and
respondents with no food allergy (n=322) read food label information
regarding food manufacturer warning labels ............................................21
4 Reasons provided by respondents with food allergy (n=57) for
accidental food allergen ingestion in the 2 years prior to passage of the
Food Allergen Labeling and Consumer Protection Act and the 2 years
post Act passage......................................................................................22
5 Sources of prepared food provided by respondents with food allergy
(n=57) consumed in accidental food allergen ingestion in the 2 years
prior to passage of the Food Allergen Labeling and Consumer
Protection Act and the 2 years post Act passage .....................................23
1
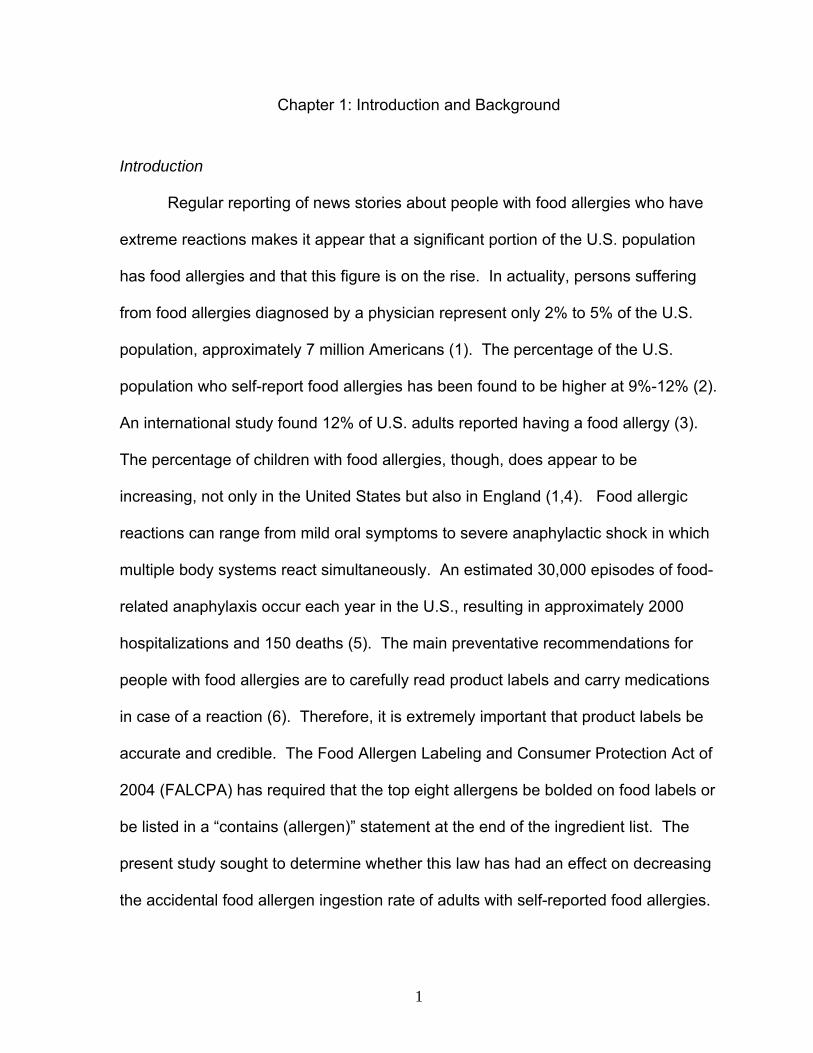
Chapter 1: Introduction and Background
Introduction Regular reporting of news stories about people with food allergies who have
extreme reactions makes it appear that a significant portion of the U.S. population
has food allergies and that this figure is on the rise. In actuality, persons suffering
from food allergies diagnosed by a physician represent only 2% to 5% of the U.S.
population, approximately 7 million Americans (1). The percentage of the U.S.
population who self-report food allergies has been found to be higher at 9%-12% (2).
An international study found 12% of U.S. adults reported having a food allergy (3).
The percentage of children with food allergies, though, does appear to be
increasing, not only in the United States but also in England (1,4). Food allergic
reactions can range from mild oral symptoms to severe anaphylactic shock in which
multiple body systems react simultaneously. An estimated 30,000 episodes of food-
related anaphylaxis occur each year in the U.S., resulting in approximately 2000
hospitalizations and 150 deaths (5). The main preventative recommendations for
people with food allergies are to carefully read product labels and carry medications
in case of a reaction (6). Therefore, it is extremely important that product labels be
accurate and credible. The Food Allergen Labeling and Consumer Protection Act of
2004 (FALCPA) has required that the top eight allergens be bolded on food labels or
be listed in a “contains (allergen)” statement at the end of the ingredient list. The
present study sought to determine whether this law has had an effect on decreasing
the accidental food allergen ingestion rate of adults with self-reported food allergies.
2
Allergic Reaction Mechanism
A food allergic reaction is the body’s exaggerated response to a food protein
(7). As the protein is viewed as a foreign entity, specific antibodies are produced to
destroy it. The majority of food allergic reactions are immunoglobulin E (IgE)
antibody-mediated reactions (class 1 food allergies) in which the sensitization of the
allergen occurs in the gastrointestinal tract (8). Sensitization can also occur to
allergens which have cross-reactivity with IgE plant protein allergens, especially
fruits (class 2 food allergies) (9). Class 2 food allergies include pollen food allergy
syndrome in which birch, ragweed, and mugwort pollens cross-react with proteins in
carrots, celery, apples, pears, and kiwi (9), and latex-associated food allergy
syndrome, in which allergen proteins in latex cross-react with proteins in avocado,
banana, kiwi, and papaya (10).
In class 1 food allergies, as a food is digested for the first time, allergenic
proteins are absorbed in the intestine, prompting certain intestinal cells to produce
specific IgE. The IgE antibodies link to receptors on mast cells, located in the
mucosa and the skin, as well as to basophils circulating in the blood (8). Mast cells
store mediators, mainly histamine. The next time the food is eaten, the contact of
the allergens with the IgEs stimulates the mast cells to release histamine as well as
make new potent eiconosoid mediators (prostaglandins, leukotrienes, and cytokines)
(8). Oral tolerance, an absence of an immunological response to a food allergen
after first contact, prevents an allergic reaction in most people (8).
3
IgE mediated reactions involve the skin, respiratory system, gastrointestinal
tract, and cardiovascular system. These reactions have a distinctive pattern in that
they are variable and unpredictable in both symptoms and severity (8). The
mediator, histamine, binds to a variety of target cells via H1 and H2 receptors (7)
causing vasodilation, tissue inflammation, muscle contraction, and mucous secretion
(8). The most frequent food allergen response is urticaria (hives) which is usually
linked to both gastrointestinal symptoms (stomach pain, nausea, and vomiting) and
respiratory symptoms. Oral allergy syndrome (OAS) is very common and includes
itching of the mouth, lip swelling, and swelling of the larynx, mouth, and throat (8).
Anaphylaxis is a rare but potentially fatal reaction caused by several different body
systems reacting simultaneously to the histamine release – skin, respiratory system,
gastrointestinal, and cardiovascular system – causing throat swelling, hives,
breathing difficulties, and decreased blood pressure (11).
The most common food allergies are related to proteins found in milk, eggs,
peanuts, and fish (8). Allergies to egg and milk are usually outgrown in childhood
(up to 80% of infants with egg allergy and 85% with cow’s milk allergy are tolerant by
age 5), but peanut protein sensitivity is usually not outgrown (12), although there are
conflicting studies on this topic. One such study found 21.5% of subjects aged 4 to
20 had negative food challenge results and had therefore outgrown their peanut
allergy (12). The recurrence of a peanut allergy after a negative food challenge test
may have to do with the amount and frequency of peanut ingestion post challenge.
Fleischer et al. (13) found an overall recurrence rate of 7.9% in children who had
4
outgrown their peanut allergy but a 20% rate for those children who had only eaten
peanuts infrequently after outgrowing their allergy.
Diagnosis of a Food Allergy
Diagnosis of a food allergy is based on a medical history, an objective
examination, allergy tests, and both elimination diet and food challenge tests. A
medical history is critical as often allergy tests indicate food allergies that do not
manifest clinically. Both of the main diagnostic tests, skin prick tests (SPT) and IgE
blood tests, have relatively high false positive rates due to cross-reactivity (when IgE
antibodies recognize similar structures in another allergenic source). The double-
blind, placebo-controlled food challenge (DBPCFC) is the only validated test for
diagnosing food allergies (8). The food challenge is used in patients for determining
if there is a need for the permanent avoidance of foods essential to the diet, such as
milk, eggs, or nuts.
Threshold Dose
Because of the potential severity of accidental peanut ingestion, many studies
have been done to determine the threshold dose of nut proteins that elicit an allergic
reaction. In one study, adults with positive SPT and IgE levels for peanut protein
underwent DBPCFC tests with increasing doses of peanut protein (14). The
threshold dose was defined as the dose when objective (lip swelling, vomiting,
laryngeal edema) or repetitive (itching of mouth, stomach pain) subjective reactions
occurred. The threshold dose for subjective reactions ranged from 100 ug up to 1
5
gram of peanut protein. A 3 mg dose (1/50 peanut) was the dose at which 50% of
the population with peanut allergy would have a subjective allergic reaction. The
threshold dose for objective reactions was established for only 6 patients, ranging
from 10 gm for 1 subject and 30 mg for the 5 others. Another double blind, placebo
controlled threshold dose study (15) that involved hazelnut-allergic adults found that
the threshold dose for subjective reactions ranged from 1 mg up to 100 mg of
hazelnut protein (6.4-640 mg hazelnut meal). A 6 mg dose (1/25 hazelnut) was the
dose at which 50% of the hazelnut allergic population would suffer a subjective
allergic reaction.
Prevention
As there are currently no vaccines or medications to prevent food allergic
reactions, the main recommendations include the following: strict avoidance of the
allergenic food, careful reading of ingredient labels, not eating products that lack a
nutritional label, wearing of an ID bracelet that indicates the type of food allergy, and
keeping a self-injectable epinephrine pen (epi-pen) on hand for accidental ingestion
of allergens (6).
Research Statement
With the costly and sometimes fatal consequences of a food allergic reaction,
an important area in which research is critically needed is the study of the effect that
the passage of the Food Allergen Labeling and Consumer Protection Act has had on
the accidental food allergen ingestion rate of adults with self-reported food allergies.
6
Rationale for the Study
Peanuts are one of the most allergenic foods and cause the most
unpredictable reactions. They are the most common cause of death by food
anaphylaxis in the U.S. (16). Among children who had only a mild reaction to peanut
protein on the first exposure, almost 50% had anaphylactic reactions on a later
exposure (7). Another study found 31% of subsequent food allergic reactions were
more severe than the initial reaction, with about 1/3 of peanut allergic patients
having severe reactions after peanut ingestion (17).
There is presently no agreement as to the prevalence of food allergies in the
U.S. population, but many studies have found that the percentage of people with
food allergies is increasing. A study that analyzed data from a 2001 U.S. Food and
Drug Administration (FDA) food safety survey found the prevalence of self-reported
food allergies to be 9.1%, with 5.3% of the respondents self-reporting a doctor-
diagnosed food allergy (2). Another study found the self-reporting of peanut and/or
tree nut allergies specifically was 1.2% (approximately 3 million people), similar to
the figure obtained in a survey that was done 5 years prior (1). The percentage of
children under age 18 with a peanut and/or tree nut allergy, though, had doubled
from .6% to 1.2% in the same time period. Sixty-six percent reported that they had
had more than 5 reactions during their lifetimes. The Food Allergy and Anaphylaxis
Network estimates that close to 7 million Americans (2% adults, 6% children) have
physician-diagnosed food allergies, with approximately 3 million having allergies to
peanuts and/or tree nuts (18).
7
It is difficult to estimate the prevalence of food anaphylactic reactions since a
health problem classification code (known as the International Classification of
Diseases, edition 9 or ICD-9) for food anaphylaxis or food allergy was not
established until 1999. An estimated 30,000 episodes of anaphylaxis occur each
year in the U.S., resulting in 2000 hospitalizations and approximately 150 deaths (5).
Very few studies exist on the subject, but the literature suggests that emergency
room medical records underreport anaphylaxis by as much as 50% (19,20). Healthy
People 2010 has a developmental objective to reduce deaths from anaphylaxis
caused by food allergies (21).
With the high cost both medically and emotionally of food allergic reactions, it
is important to know whether the passage of the Food Allergen Labeling and
Consumer Protection Act (effective January 1, 2006) has had an effect on the
accidental food allergen ingestion rate in adults with self-reported food allergies.
8
Chapter 2: Review of Related Literature
Allergens and Product Labeling Law
Since the most effective strategy to prevent food allergic reactions, including
anaphylaxis, is the careful reading of food labels to avoid accidental allergen
ingestion, product labeling is an important area of concern for public policy. The
U.S. Food and Drug Administration (FDA) is the department that administers the
Food, Drug and Cosmetic Act (FDCA), under which the product labeling code is
outlined. Prior to January 1, 2006, the FDCA required a complete listing of all
ingredients of a food of two or more ingredients with two exceptions (22). Spices,
flavorings, and colorings could be declared collectively (“natural flavors”), and
incidental additives present in insignificant levels and having no technological or
functional effect in the finished product could be omitted from the label. The FDCA
also initially allowed ingredient labels to contain technical and scientific terms for
common allergens (e.g. ammonium caseinate for milk, albumin for egg).
The Food Allergy and Anaphylaxis Network (FAAN) was instrumental in
lobbying the FDA to list allergens on product labels in plain language regardless of
amount (18). The Food Allergen Labeling and Consumer Protection Act (FALCPA)
of 2004, effective January 1, 2006, amended section 403 of the FDCA to read that
any foods (except for raw agricultural products) that contained a major food allergen
must have either the word “contains” followed by the name of the food source from
which the major food allergen was derived, or the common name of the allergen
followed in parentheses by the name of the food source, in the list of ingredients on
9
the label. Flavorings, colorings, or incidental additives that contained a major food
allergen were also subject to the law (23). The 8 major food or food groups covered
by the new law and accounting for more than 90% of food allergies were milk, egg,
fish, shellfish, tree nuts, peanuts, wheat, and soybeans. The goal of the law was to
ensure that foods containing one of the top 8 allergens (or derivative) used the
common or usual name of the allergen source on the product label (18).
Good Manufacturing Processes
In addition to following the FALCPA, manufacturers were required to abide by
the good manufacturing practices (GMP) that were codified in Title 21 of the Code of
Federal Regulations (24). These practices described methods, equipment, facilities,
and controls that were needed to produce safe and wholesome food under sanitary
conditions. Food manufacturers voluntarily began to use warning statements to
indicate if a product could possibly contain contamination from food allergens (e.g.
manufactured on equipment that also processes products containing nuts) although
the FDA had advised manufacturers that these statements did not take the place of
strict adherence to GMP (22). A spokesperson for the FAAN has stated that they
think the warning statements are too broad and confusing, especially due to the
proliferation of these statements since passage of the FALCPA (25).
Manufacturer Warnings and Consumer Perception of Risk
In the past two years, there have been a few studies that have looked at
product food allergen labeling warnings and consumer perception of the risk
associated with the consumption of these products. A recent study found only about
10
63% of the people who had self-reported allergies read labels to avoid foods to
which they were allergic (2).
In one FDA-commissioned survey (part of the July 2006 report to Congress
on issues with GMPs and product labeling), consumers with food allergies were
shown to prefer the proposed warning “Allergy Information: may contain peanuts” to
any of the five basic advisory warnings used by manufacturers (26). In a conflicting
FDA-commissioned survey, consumers with food allergies indicated that they found
the two statements – “Manufactured on equipment that also produces peanuts” and
“Produced in a facility which processes peanuts” – more believable and helpful and
thought the food with this label would be less likely to contain peanuts than the two
statements – “May contain peanuts” and “Allergy Information: may contain peanuts.”
In one of the few post-FALCPA surveys, 64% of respondents noticed that
major food allergens had been added to ingredient lists in 2006, and 83% noticed
the new language “contains (specified allergen)” (27). The same study also found
that consumer avoidance of products depended upon the perceived risk of the
manufacturer’s allergen warning, although the warning statements were not accurate
reflections of the actual risk of peanut residue in the products. Compared to a
survey done in 2003, survey participants were more likely to purchase food products
with precautionary statements in 2006 (27). The study showed 8 different peanut
advisory labels to parents of children with food allergies and consumers with food
allergies. Ninety-one percent indicated they would never purchase products with
labels that read “may contain peanuts” or “may contain traces of peanuts”; 85%
stated they would never purchase products with “manufactured with same
11
equipment as peanuts”; 70% said they would never purchase products with
“manufactured in a facility that also processes peanuts”; and 65% stated they would
never purchase products with a label warning “packaged in a facility that also
packages peanuts.” In the same study (27), packaged foods with the above
advisory labels were purchased and analyzed. Residual peanut protein of between
3 and 4000 parts per million was detected in 7% of the lots overall, (4% of products
with “may contain” warnings, 5.2% of products with “shared equipment,” and 10.3%
of products with “shared facility” warning statements). At the recommended serving
size for each product, an estimated dose of between 0.1 and 180 mg peanut would
be ingested, a level at which highly sensitive individuals would react.
Accidental Ingestion of Food Allergens
A number of studies have surveyed children with food allergies (and their
parents) to determine the accidental food allergen ingestion rate. Yu et al. (17)
found 50% of children with peanut allergies had an accidental exposure in the prior
year and 75% within the past 5 years, giving an annual accidental ingestion rate of
14.3%. Nowak-Wegrzyn et al. (28) reported that 57% of children with food allergies
had experienced an accidental ingestion within the past 2 years, with 38% having at
least one acute reaction to food at school. In a study of U.S. adults, Vierk et al. (2)
found that 78.2% had their last allergic reaction to food less than 5 years ago and
28% less than one month prior.
The most frequently mentioned locations for accidental ingestion of food
allergens have been the home (reported by approximately 65% of those with food
12
allergies versus 40% of those with peanut allergy specifically), a relative’s or friend’s
home (34%), restaurants (10-15%), and the work site (10%) (2,17,28). An Internet-
based survey conducted by Eigenmann et al. (29) also found the home to be the
number one site for accidental food allergen ingestion (25.5%), followed by
restaurants (17.6%), and relative/friend’s home (14%). In the study, 44% of those
who had accidental ingestions in restaurants had informed the restaurant staff of
their allergy prior to ordering their food.
The Internet study also found that 30% of the accidental ingestions in the
home were due to the consumption of processed food. Another survey found that a
prepared food had caused the last reaction in about 50% of survey respondents
while a packaged food caused it in 28% (2).
With the high rate of accidental food allergen ingestion, especially in regards
to labeled food products, as well as the confusion over manufacturers’ warning
labels, there is a need to determine if the new allergen labeling law has had an effect
on reducing the accidental food allergen reaction rate in adults. Previous literature
in this area has focused on identification of changes necessary for ingredient labels
post passage of the FALCPA as well as the consumers’ presumed level of risk with
the consumption of products with various manufacturer warning allergen labels.
There is clearly a gap in the literature regarding the effect of the new labeling law on
reducing the accidental food allergen ingestion rate in adults with self-reported food
allergies. This research question is the primary focus of the present study.
13
Chapter 3: Research Design and Methodology
Research Objectives
The primary research objective of the present study was to determine if the
new allergen labeling requirements of FALCPA (effective January 1, 2006) has had
an effect on the accidental food allergen ingestion rate of adults with self-reported
food allergies. Secondary objectives were to determine both the prevalence of self-
reported food allergies in adults and the frequency of food product label reading in
those who had self-reported food allergies.
Population Description
The study sample included 386 subjects aged 18 or older who volunteered to
take the survey. The survey was distributed on five weekdays in December 2007
inside the Roseville Galleria, a mall located in Northern California. As approximately
9% to 12% of the U.S. population have self-reported food allergies (2,3), the survey
intended to capture data from a minimum of 35 individuals with food allergies or
parents of children with food allergies.
Research Design
The descriptive observational study was designed to determine if passage of
the Food Allergen Labeling and Consumer Protection Act has had an effect on the
accidental food allergen ingestion rate in adults with self-reported food allergies.
The study was developed to establish if an association existed between the
14
independent variable of the new allergen law changes to the food ingredient label
and the outcome variable of annual accidental food allergen ingestion rate in the 2
years prior to passage of the FALCPA and the 2 years post Act passage. The study
was approved by the Human Subjects Committee at Eastern Michigan University
(Appendix A).
Research Instrument and Data Collection
A survey instrument was developed to include questions that dealt with both
demographic information and food allergies (Appendix B). Areas of demographic
information included age, sex, race/ethnicity, and education level. Food allergy
questions pertained to ingredient and allergen label reading frequency, number and
type of food allergies, number of accidental food allergen ingestions of the top 8 food
allergens both prior to passage of the FALCPA and post Act passage, reasons for
accidental food allergen ingestion events, and suggestions for improvements to the
allergen section of the food product label. Data were collected from adult shoppers
in the Roseville Galleria mall located in Northern California, on five weekdays in
December 2007.
Statistical Analysis
The SPSS statistical package for Windows (15.0) was used for all data
analyses. Descriptive statistics consisting of percentages were calculated for
demographic data. To test the strength of the relationships between the
demographic variables and frequency of label reading, Phi coefficients were
15
calculated. Phi coefficients are suitable for use with frequency data such as the
demographic factors and the allergy variable used in this research. The annual
accidental food allergen ingestion rate was expressed as the number of incidents
divided by the number of person-years at risk (n=57 multiplied by 2 years).
Sample Confidentiality and Consent
The survey instrument did not include any subject-identifying information. It
did include a statement of implied consent as well as an assurance of anonymity and
confidentiality of the information provided. A data sheet containing contact
information for the study researchers as well as the statement that the study had
been approved by the Human Subjects Committee at Eastern Michigan was
provided to subjects (Appendix C).
16
Chapter 4: Results
Adult mall shoppers (n=386) were asked to complete surveys regarding food
allergies. Fifty-seven of the respondents were adults with self-reported food
allergies and seven were parents responding for their children who had food
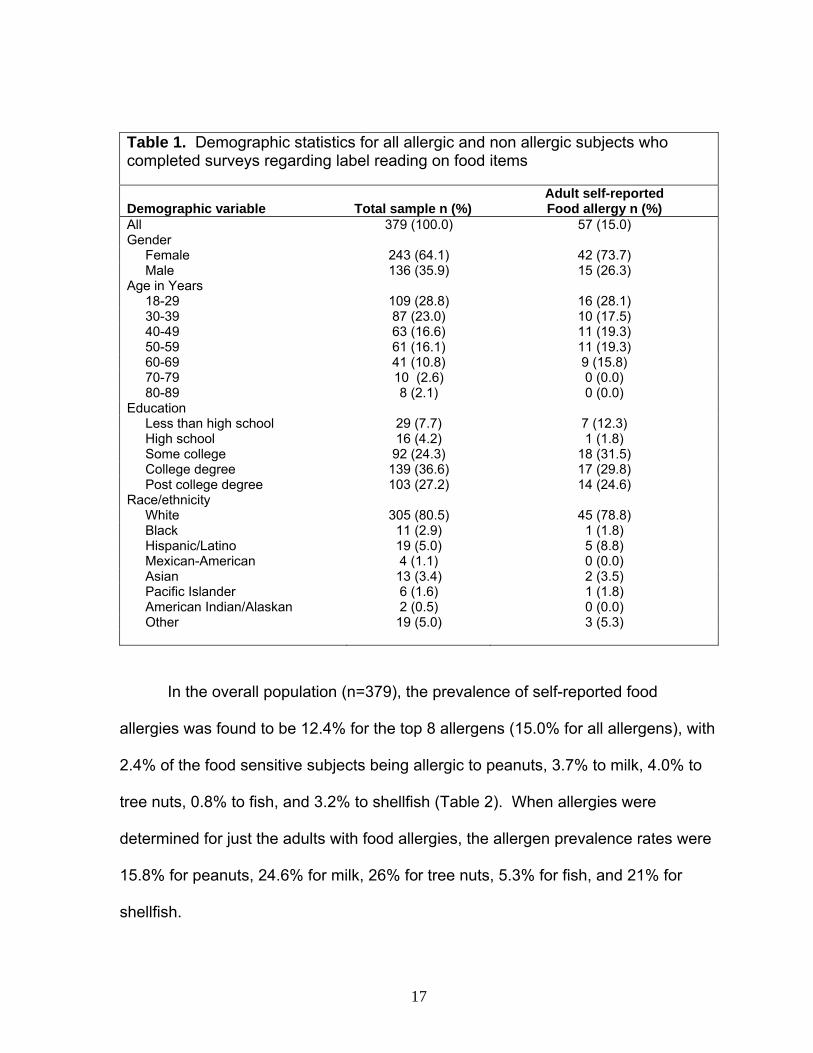
allergies. The demographic composition of adult respondents with self-reported food
allergies (n=379) is shown in Table 1. The predominant demographic characteristics
of subjects with food allergies were that they were white, female, and college-
educated. As the category of parents responding for their children with food
allergies amounted to only 11% of the total population with food allergies, the data
from these surveys were excluded in final statistical analysis in order to maintain a
more homogeneous population of people with self-reported food allergies.
17
Table 1. Demographic statistics for all allergic and non allergic subjects who completed surveys regarding label reading on food items
Demographic variable Total sample n (%) Adult self-reported Food allergy n (%)
All 379 (100.0) 57 (15.0) Gender Female 243 (64.1) 42 (73.7) Male 136 (35.9) 15 (26.3) Age in Years 18-29 109 (28.8) 16 (28.1) 30-39 87 (23.0) 10 (17.5) 40-49 63 (16.6) 11 (19.3) 50-59 61 (16.1) 11 (19.3) 60-69 41 (10.8) 9 (15.8) 70-79 10 (2.6) 0 (0.0) 80-89 8 (2.1) 0 (0.0) Education Less than high school 29 (7.7) 7 (12.3) High school 16 (4.2) 1 (1.8) Some college 92 (24.3) 18 (31.5) College degree 139 (36.6) 17 (29.8) Post college degree 103 (27.2) 14 (24.6) Race/ethnicity White 305 (80.5) 45 (78.8) Black 11 (2.9) 1 (1.8) Hispanic/Latino 19 (5.0) 5 (8.8) Mexican-American 4 (1.1) 0 (0.0) Asian 13 (3.4) 2 (3.5) Pacific Islander 6 (1.6) 1 (1.8) American Indian/Alaskan 2 (0.5) 0 (0.0) Other 19 (5.0) 3 (5.3)
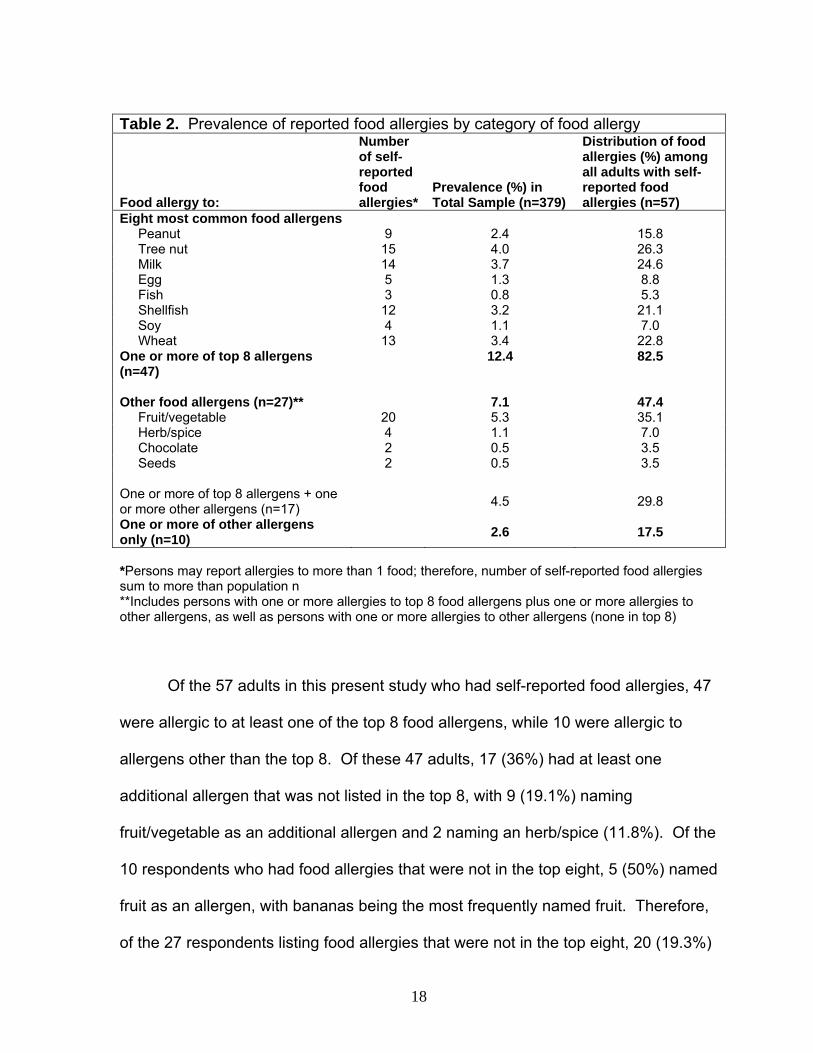
In the overall population (n=379), the prevalence of self-reported food
allergies was found to be 12.4% for the top 8 allergens (15.0% for all allergens), with
2.4% of the food sensitive subjects being allergic to peanuts, 3.7% to milk, 4.0% to
tree nuts, 0.8% to fish, and 3.2% to shellfish (Table 2). When allergies were
determined for just the adults with food allergies, the allergen prevalence rates were
15.8% for peanuts, 24.6% for milk, 26% for tree nuts, 5.3% for fish, and 21% for
shellfish.
18
Table 2. Prevalence of reported food allergies by category of food allergy
Food allergy to:
Number of self-reported food allergies*
Prevalence (%) in Total Sample (n=379)
Distribution of food allergies (%) among all adults with self-reported food allergies (n=57)
Eight most common food allergens Peanut 9 2.4 15.8 Tree nut 15 4.0 26.3 Milk 14 3.7 24.6 Egg 5 1.3 8.8 Fish 3 0.8 5.3 Shellfish 12 3.2 21.1 Soy 4 1.1 7.0 Wheat 13 3.4 22.8 One or more of top 8 allergens (n=47)
12.4 82.5
Other food allergens (n=27)** 7.1 47.4 Fruit/vegetable 20 5.3 35.1 Herb/spice 4 1.1 7.0 Chocolate 2 0.5 3.5 Seeds 2 0.5 3.5 One or more of top 8 allergens + one or more other allergens (n=17) 4.5 29.8
One or more of other allergens only (n=10)
2.6 17.5
*Persons may report allergies to more than 1 food; therefore, number of self-reported food allergies sum to more than population n **Includes persons with one or more allergies to top 8 food allergens plus one or more allergies to other allergens, as well as persons with one or more allergies to other allergens (none in top 8)
Of the 57 adults in this present study who had self-reported food allergies, 47
were allergic to at least one of the top 8 food allergens, while 10 were allergic to
allergens other than the top 8. Of these 47 adults, 17 (36%) had at least one
additional allergen that was not listed in the top 8, with 9 (19.1%) naming
fruit/vegetable as an additional allergen and 2 naming an herb/spice (11.8%). Of the
10 respondents who had food allergies that were not in the top eight, 5 (50%) named
fruit as an allergen, with bananas being the most frequently named fruit. Therefore,
of the 27 respondents listing food allergies that were not in the top eight, 20 (19.3%)
19
named a fruit/vegetable as their food allergen, making it the most frequently named
food allergen with an overall prevalence in the total population of 5.3%.
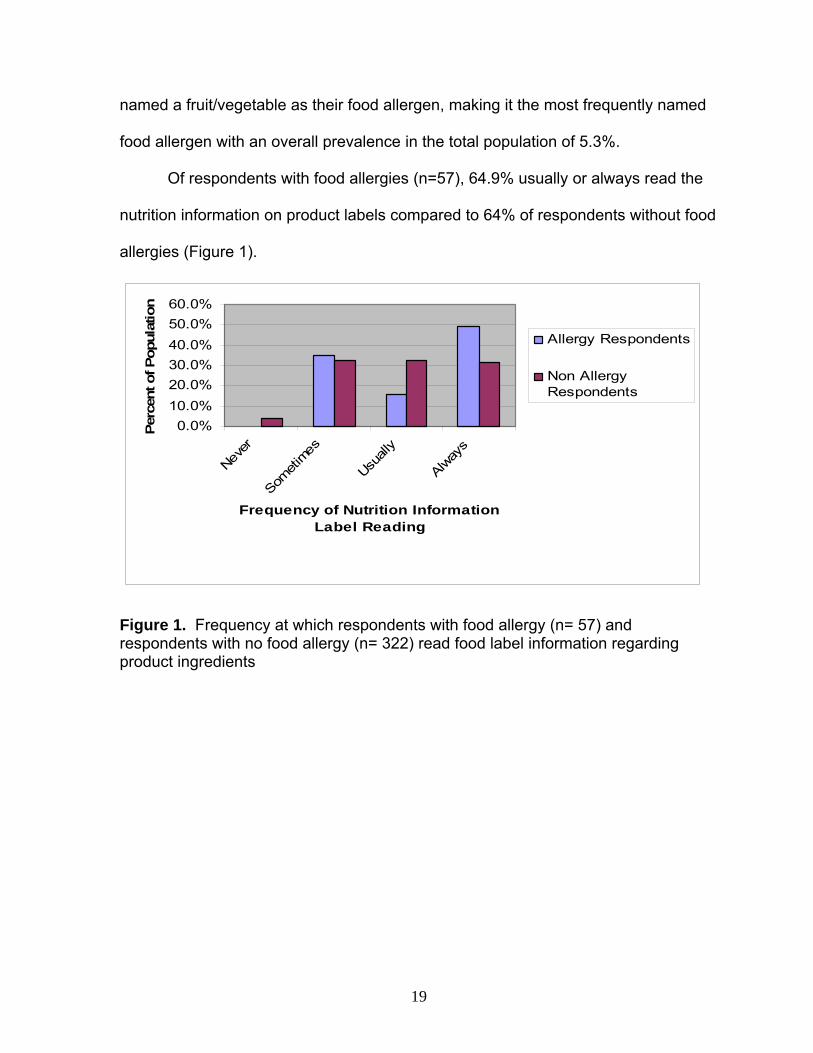
Of respondents with food allergies (n=57), 64.9% usually or always read the
nutrition information on product labels compared to 64% of respondents without food
allergies (Figure 1).
0.0%10.0%20.0%30.0%40.0%50.0%60.0%
Never
Someti
mes
Usuall
y
Alway
s
Frequency of Nutrition Information Label Reading
Per
cent
of P
opul
atio
n
Allergy Respondents
Non AllergyRespondents
Figure 1. Frequency at which respondents with food allergy (n= 57) and respondents with no food allergy (n= 322) read food label information regarding product ingredients
20
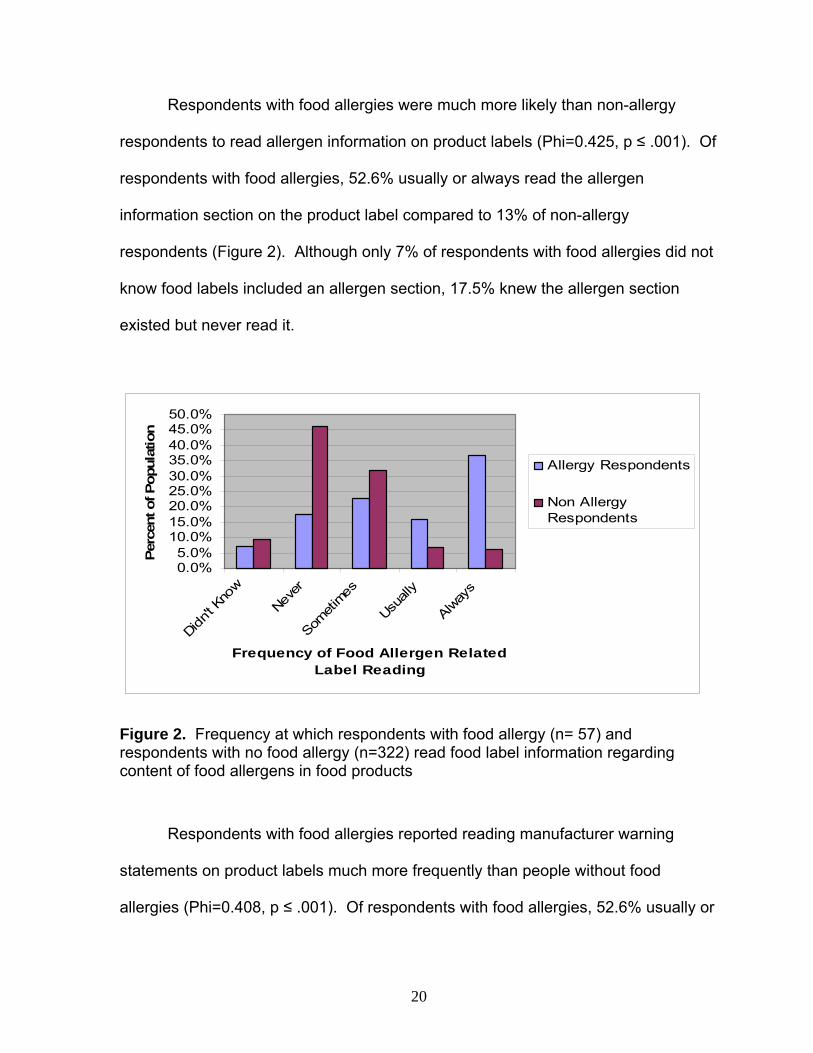
Respondents with food allergies were much more likely than non-allergy
respondents to read allergen information on product labels (Phi=0.425, p ≤ .001). Of
respondents with food allergies, 52.6% usually or always read the allergen
information section on the product label compared to 13% of non-allergy
respondents (Figure 2). Although only 7% of respondents with food allergies did not
know food labels included an allergen section, 17.5% knew the allergen section
existed but never read it.
0.0%5.0%
10.0%15.0%20.0%25.0%30.0%35.0%40.0%45.0%50.0%
Didn't K
now
Never
Someti
mes
Usuall
y
Alway
s
Frequency of Food Allergen Related Label Reading
Perc
ent o
f Pop
ulat
ion
Allergy Respondents
Non AllergyRespondents
Figure 2. Frequency at which respondents with food allergy (n= 57) and respondents with no food allergy (n=322) read food label information regarding content of food allergens in food products
Respondents with food allergies reported reading manufacturer warning
statements on product labels much more frequently than people without food
allergies (Phi=0.408, p ≤ .001). Of respondents with food allergies, 52.6% usually or
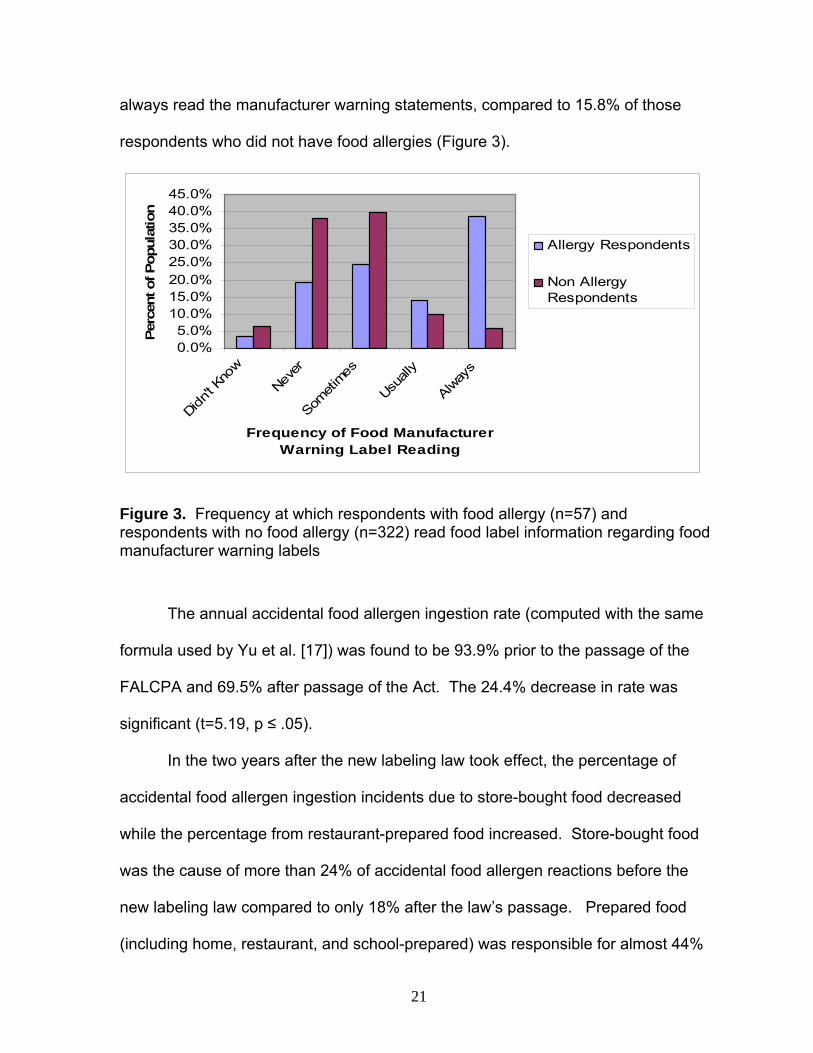
21
always read the manufacturer warning statements, compared to 15.8% of those
respondents who did not have food allergies (Figure 3).
0.0%5.0%
10.0%15.0%20.0%25.0%30.0%35.0%40.0%45.0%
Didn't K
now
Never
Someti
mes
Usuall
y
Alway
s
Frequency of Food Manufacturer Warning Label Reading
Perc
ent o
f Pop
ulat
ion
Allergy Respondents
Non AllergyRespondents
Figure 3. Frequency at which respondents with food allergy (n=57) and respondents with no food allergy (n=322) read food label information regarding food manufacturer warning labels
The annual accidental food allergen ingestion rate (computed with the same
formula used by Yu et al. [17]) was found to be 93.9% prior to the passage of the
FALCPA and 69.5% after passage of the Act. The 24.4% decrease in rate was
significant (t=5.19, p ≤ .05).
In the two years after the new labeling law took effect, the percentage of
accidental food allergen ingestion incidents due to store-bought food decreased
while the percentage from restaurant-prepared food increased. Store-bought food
was the cause of more than 24% of accidental food allergen reactions before the
new labeling law compared to only 18% after the law’s passage. Prepared food
(including home, restaurant, and school-prepared) was responsible for almost 44%
22
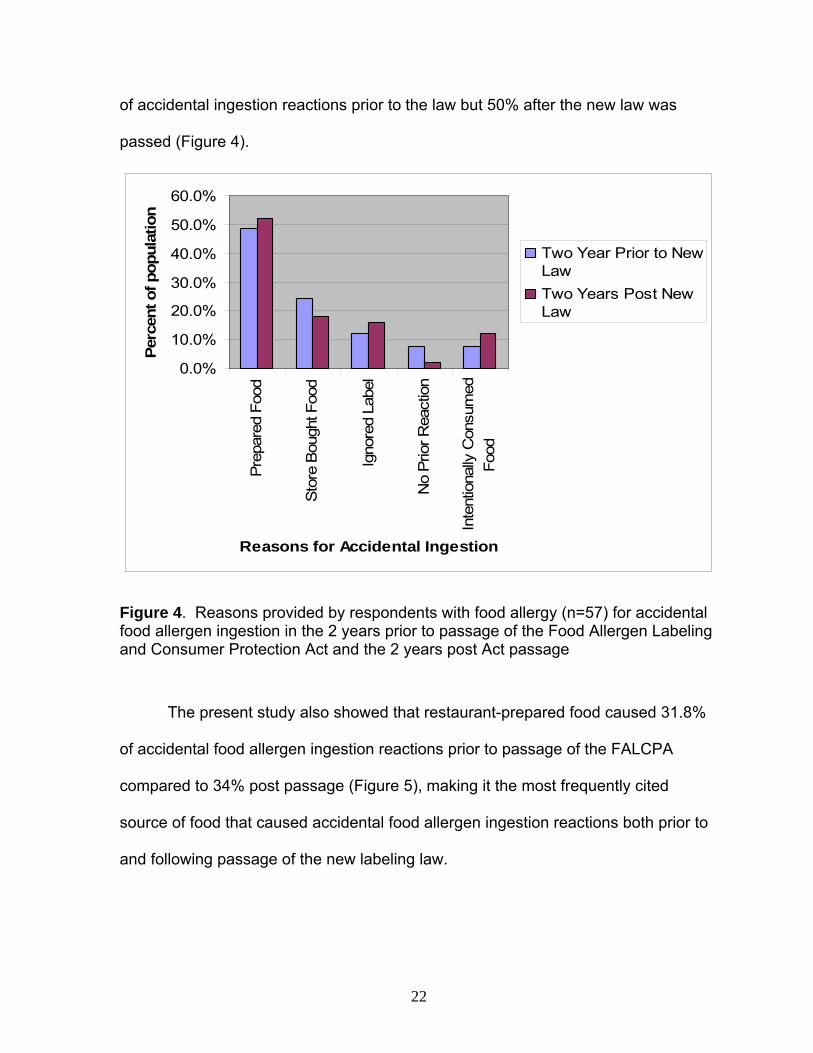
of accidental ingestion reactions prior to the law but 50% after the new law was
passed (Figure 4).
0.0%
10.0%
20.0%
30.0%
40.0%
50.0%
60.0%
Prep
ared
Foo
d
Sto
re B
ough
t Foo
d
Igno
red
Labe
l
No
Prio
r Rea
ctio
n
Inte
ntio
nally
Con
sum
edFo
od
Reasons for Accidental Ingestion
Perc
ent o
f pop
ulat
ion
Two Year Prior to NewLawTwo Years Post NewLaw
Figure 4. Reasons provided by respondents with food allergy (n=57) for accidental food allergen ingestion in the 2 years prior to passage of the Food Allergen Labeling and Consumer Protection Act and the 2 years post Act passage
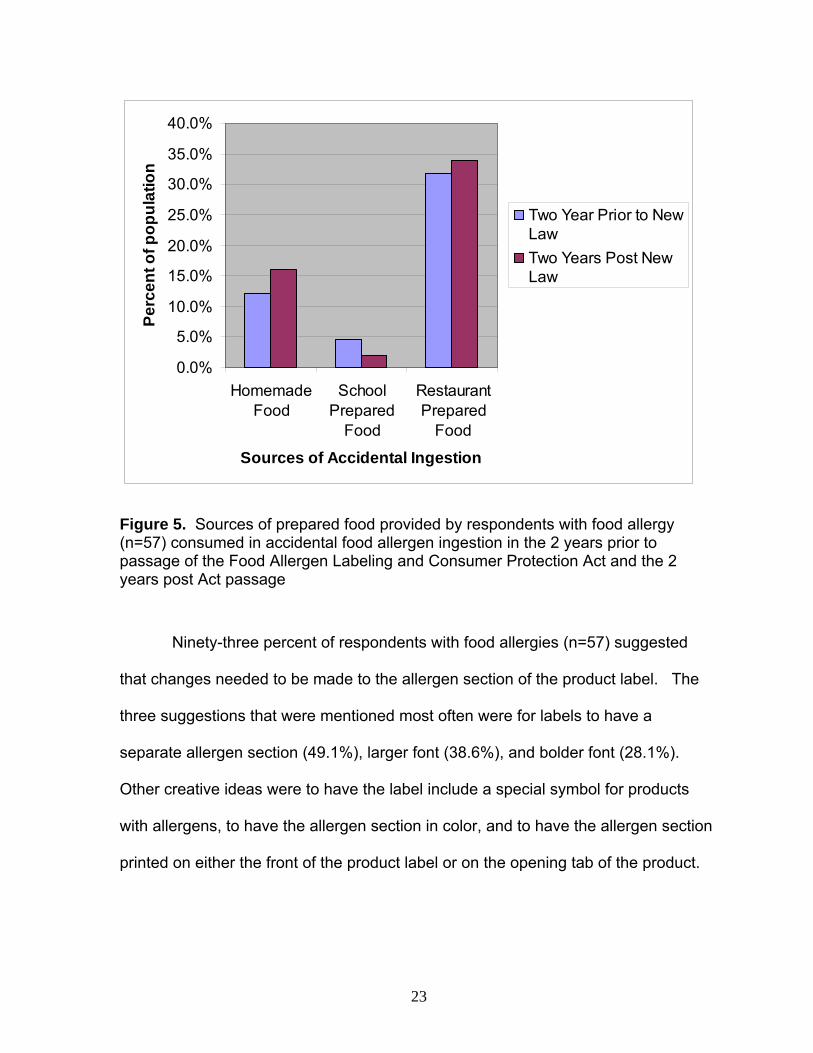
The present study also showed that restaurant-prepared food caused 31.8%
of accidental food allergen ingestion reactions prior to passage of the FALCPA
compared to 34% post passage (Figure 5), making it the most frequently cited
source of food that caused accidental food allergen ingestion reactions both prior to
and following passage of the new labeling law.
23
0.0%
5.0%
10.0%
15.0%
20.0%
25.0%
30.0%
35.0%
40.0%
HomemadeFood
SchoolPrepared
Food
RestaurantPrepared
Food
Sources of Accidental Ingestion
Perc
ent o
f pop
ulat
ion
Two Year Prior to NewLawTwo Years Post NewLaw
Figure 5. Sources of prepared food provided by respondents with food allergy (n=57) consumed in accidental food allergen ingestion in the 2 years prior to passage of the Food Allergen Labeling and Consumer Protection Act and the 2 years post Act passage
Ninety-three percent of respondents with food allergies (n=57) suggested
that changes needed to be made to the allergen section of the product label. The
three suggestions that were mentioned most often were for labels to have a
separate allergen section (49.1%), larger font (38.6%), and bolder font (28.1%).
Other creative ideas were to have the label include a special symbol for products
with allergens, to have the allergen section in color, and to have the allergen section
printed on either the front of the product label or on the opening tab of the product.
24
Chapter 5: Discussion and Conclusions
Discussion
The present study surveyed a population of Northern California adults with
self-reported food allergies who were predominantly white, female, and college-
educated. Similar demographic characteristics of adults with food allergies were
reported by Vierk et al. (2) and Sicherer et al. (1).
In the overall adult population, the prevalence of self-reported food allergies
was found to be 15.0%, with tree nuts (4.0%), milk (3.7%), wheat (3.4%), and
shellfish (3.2%) being the most prevalent of the top 8 food allergens. Of the food
allergic adult population specifically, 26.3% were allergic to tree nuts, 24.6% to milk,
22.8% to wheat, and 21.1% to shellfish.
The 15.0% overall prevalence in the present study is slightly higher than
percentages reported in studies by both Woods et al. (3) and Vierk et al. (2), which
found self-reported food allergy prevalence in U.S. adults to be 12.0% and 9.1%,
respectively. Additionally, Vierk et al. found that allergies to milk (2.0%), shellfish
(1.5%), fish (0.7%), and tree nuts (0.5%) were the most prevalent of the top 8 food
allergens in the total population. As to the food-allergic population specifically, the
same food allergies were most prevalent, with 22.0% of food-sensitive participants
allergic to milk, 17.0% to shellfish, 8.0% to fish, and 6.0% to tree nuts. An Internet
study (29) of adults with physician-diagnosed (versus self-reported) food allergies
found the prevalence of peanut allergy to be the most common (47.1%), followed by
milk (23.5%), tree nuts (11.8%), and fish/shellfish (9.8%).
25
The present study included a higher percentage of women and college-
educated respondents than either the Woods or Vierk study, which may partially
explain why a higher overall prevalence of self-reported food allergies was found.
In addition, as the above studies indicated, although self-reported food allergy
prevalence is in the range of 9.0 to15.0% of the total population, the prevalence of
each of the top 8 food allergens varied widely between surveys.
The most frequently named food allergen in the present study that was not in
the top 8 food allergens was the category fruit/vegetable. With prevalence in the
overall adult population of 5.3%, it was the food allergen most often reported. This
somewhat surprising finding was also reported by Vierk et al. (2). A study of food
allergic events from U.S. emergency rooms (19) found that fruits and vegetables
composed 12% of the food allergic reactions (number one being shellfish at 24%) in
persons aged 6 and older. Fruits and vegetables are not covered by the FALCPA
law as they are not considered one of the top 8 allergens.
Of adults with self-reported food allergies, 100% reported that they read
nutrition information on food product labels. Although more than three-fourths of this
population also read allergen information (75.4%) and manufacturer warning
statements (77.2%), almost 18% never read either of them. In addition, 7% of
adults with food allergies did not know the new allergen section was part of the food
label. These figures are higher than surveys of U.S. adults conducted by both Vierk
et al. (2) and Hefle et al. (27). Vierk et al. (2) found 63% of adults with self-reported
food allergies read labels to avoid foods for which they were allergic, although the
study did not differentiate between adults who read ingredient label information and
26
those who read the allergen section as did the present study. Hefle et al. (27)
reported that 17% of consumers with food allergies had not noticed the new allergen
language on food product labels that appeared after passage of the FALCPA,
although 75% of them heeded manufacturer allergen warning statements. While
the 75% figure was similar to the present study’s finding of 77%, the report of 17% of
consumers with food allergies not noticing the new allergen content information on
product labels was higher than the 7% the present study found. As more than
three-fourths of respondents with food allergies read manufacturer warning
statements, there is a need to ensure that these voluntary warnings are consistent
and accurate. The FDA does not instruct food manufacturers on the use of these
warning statements, but many studies have found confusion on the part of
consumers as to their meaning (2, 26, 27, 31).
The annual accidental food allergen ingestion rate in adults significantly
declined 24.4% from 93.9% prior to passage of the FALCPA to 69.5% after passage
of the Act. While these annual accidental ingestion rates are high, there is a scarcity
of studies that report accidental ingestion rates in adults. Vierk et al. (2) found that
28% of adults with self-reported food allergies had a reaction less than one month
prior to the survey. Studies of children with a diagnosed peanut allergy have found
that accidental ingestion rates ranged from 14.3% to 58.0% (17,30).
The percentage of accidental ingestion events related to store-bought foods
after the new labeling law took effect decreased 6.2%, from 24.2% to 18%, while the
percentage due to ingestion of prepared food increased by 6.1%, from 43.9% to
50.0%. In addition, the percentage of incidents due to adults with food allergies
27
ignoring allergen information on product labels increased almost 4%, from 12.1% to
16%. The most frequently reported reason for accidental food allergen ingestion
both prior to passage of the FALCPA and after passage of the Act was from
restaurant-prepared food, which increased by 2.2%, from 31.8% to 34.0%. Because
the present study did not gather data on site-specific reactions (e.g. restaurant,
home, school), but rather food-specific reactions (homemade food, restaurant-
prepared food, school-prepared food), the results are only comparable to the Vierk
et al. (2) study, which found 48% of accidental reactions due to ingestion of prepared
food with 35% specifically due to restaurant-prepared food. Vierk’s findings are in
agreement with the present study’s observation of 50% of accidental food allergen
ingestions occurring with consumption of prepared food and 34% from food
prepared in restaurants. An Internet survey by Eigenmann et al. (29), which
reported site-specific reactions, found 25.5% of food allergic reactions happened at
home, 17.6% in restaurants, and 13.7% in a relative or friend’s home. Almost half of
the respondents who had allergic reactions in restaurants had informed the
restaurant staff of their allergy before ordering.
Although the new labeling law appears to have had an impact on the
percentage of accidental ingestions due to labeled food products, the above studies
suggest a need to also control for accidental food allergen ingestions from prepared
food, especially restaurant-prepared food. A number of states have bills in progress
that require restaurants with a specified number of locations in the state to post
nutrition information on menus and menu boards (32), but none of the proposed
28
laws include the requirement to post allergen information. This is an important area
for future study.
Ninety-three percent of respondents with food allergies thought changes
needed to be made to the allergen section of the food product label, including larger
and bolder font, and a separate allergen section. An international study of
consumers with food allergies (31) reported these same suggestions in a survey
taken following implementation of new European food product label laws.
One of the limitations of the present study was that it included data from a
number of respondents who intentionally ingested food allergens. These
respondents either answered “none” to the two questions regarding accidental
ingestion prior to passage of the FALCPA and post passage (as they did not have
any “accidental” ingestions) or gave a high number (as if they intentionally
“accidentally” ingested allergenic foods daily or weekly). Future research should
consider this subset of the adult population with self-reported food allergies.
Another limitation of the present study was its retrospective nature.
Respondents answered questions regarding the number of accidental allergen
ingestion reactions for the two years before the passage of the FALCPA and after
passage of the Act. Possible recall error as to the number of allergic reactions may
have had an impact on the high accidental allergen ingestion rate computed.
Conclusions
The present study concluded that more than 75% of adults with food allergies
read the allergen information and manufacturer warning statements on product
29
labels compared to less than 56% of the non allergic respondents. This indicates
that the new allergen labeling requirements of the FALCPA have reached their target
population of adults with food allergies. Further research to improve the design of
the allergen section as well as manufacturer warning statements may help decrease
the 16% of accidental allergic reactions specifically due to people ignoring the
allergen information. With the finding of a significant decrease in the accidental food
allergen ingestion rate in adults after passage of the FALCPA and the associated
decline in accidental food allergen ingestion events due to store bought foods, the
present study provides evidence that the new allergen labeling law has contributed
to the decrease in the accidental food allergen ingestion rate of adults with self-
reported food allergies. With the high rate of accidental allergen ingestion due to
restaurant-prepared food specifically, future studies should evaluate whether
inclusion of allergen information in restaurants and on fast food menus would help to
further decrease the accidental food allergen ingestion rate in adults with food
allergies.
30
References
1. Sicherer SH, Munoz-Furlong A, Sampson HA. Prevalence of peanut and tree
nut allergy in the United States determined by means of a random digit dial
telephone survey: a 5-year follow-up study. J Allergy Clin Immunol.
2003;112:1203-1207.
2. Vierk KA, Koehler KM, Fein SB, Street DA. Prevalence of self-reported food
allergy in American adults and use of food labels. J Allergy Clin Immunol.
2007;119:1504-1510.
3. Woods RK, Abramson M, Bailey M, Walters EH. International prevalences of
reported food allergies and intolerances. Comparisons arising from the
European Community Respiratory Health Survey (ECRHS) 1991-1994. Eur J
Clin Nutr. 2001;55:298-304.
4. Halliday J. Peanut pregnancy advice caused consternation for UK lords. Food
Navigator Web site. September 26, 2007. Available at:
http://www.foodnavigator.com/news/ng.asp?id=80094. Accessed September
26, 2007.
5. Sampson HA. Anaphylaxis and emergency treatment. Pediatrics.
2003;111:1601-1608.
6. Frequently asked questions. The Food Allergy and Anaphylaxis Network Web
site. Available at: www.foodallergy.org/questions.html. Accessed September
22, 2007.
7. Thompson K, Chandra RK. The management and prevention of food
anaphylaxis. Nutrition Research. 2002;22:89-110.
31
8. Ortolani C, Pastorello EA. Food allergies and food intolerances. Best Practice
and Research Clinical Gastroenterology. 2005;20(3):467-483.
9. Sampson HA. Update on food allergy. J Allergy Clin Immunol. 2004;113:805-
819.
10. Crespo JF, Rodriguez J. Food allergy in adulthood. Allergy. 2003;58:98-113.
11. Food allergies and asthma. International Food Information Council Web site.
November, 2006. Available at: www.ific.org/food/allergy/index.cfm. Accessed
September 22, 2007.
12. Skolnick HS, Conover-Walker M, Koemer CB, Sampson HA, Burks AW, Wood
RA. The natural history of peanut allergy. J Allergy Clin Immunol.
2001;107:367-374.
13. Fleischer DM, Conover-Walker M, Christie L, Burks AW, Wood RA. Peanut
allergy: recurrence and its management. J Allergy Clin Immunol.
2004;114:1195-1201.
14. Wensing M, Penninks AH, Hefle SL, Koppelman SJ, Bruijnzeel-Koomen CA,
Knulst AC. The distribution of individual threshold doses eliciting allergic
reactions in a population with peanut allergy. J Allergy Clin Immunol.
2002;110:915-920.
15. Wensing M, Penninks AH, Hefle SL, Akkerdaas JH, Van Ree R, Koppelman SJ,
Bruijnzeel-Koomen CA, Knulst AC. The range of minimum provoking doses in
hazelnut-allergic patients as determined by double-blind, placebo-controlled
food challenges. Clin Exp Allergy. 2002;32:1757-1762.
32
16. Steinman HA. “Hidden” allergens in foods. J Allergy Clin Immunol.
1996;98(2):241-250.
17. Yu JW, Kagan R, Verreault N, Nicolas N, Joseph L, St. Pierre Y, Clarke A.
Accidental ingestions in children with peanut allergy. J Allergy Clin Immunol.
2006;118:466-472.
18. FAAN’s response to the FDA’s public hearing on the labeling of food products
containing allergens. Food Allergy and Anaphylaxis Network Web site. August
13, 2001. Available at: http://foodallergy.org/Advocacy/advocacy2.html.
Accessed October 2, 2007.
19. Ross MP, Ferguson M, Street D, Klontz K, Schroeder T, Luccioli S. Analysis of
food-allergic and anaphylactic events in the National Electronic Injury
Surveillance System (NEISS). J Allergy Clin Immunol. 2008;121:166-171.
20. McKinnon D, Brown A, Chu K. Emergency department anaphylaxis: a review of
142 patients in a single year. J Allergy Clin Immunol. 2001;108:861-866.
21. U.S. Department of Health and Human Services, Office of Disease Prevention
and Health Promotion. Healthy People 2010. Section 10. Healthy People Web
site. Available at: www.healthypeople.gov/Document/pdf/Volume1/10Food.pdf.
Accessed September 30, 2007.
22. Center for Food Safety and Applied Nutrition. Notice to manufacturers: label
declaration of allergenic substances in foods. Food and Drug Administration
Web site. June 10, 1996. Available at: www.cfsan.fda.gov/%7Elrd/allerg7.html.
Accessed October 2, 2007.
33
23. Center for Food Safety and Applied Nutrition. Food allergen labeling and
consumer protection act of 2004. Food and Drug Administration Web site.
August 2, 2004. Available at: www.cfsan.fda.gov/~dms/alrgact.html. Accessed
October 2, 2007.
24. Center for Food Safety and Applied Nutrition. Manufacturing practices for the
21st century- food processing. Food and Drug Administration Web site. August
9, 2004. Available at: www.cfsan.fda.gov/~dms/gmp-1.html. Accessed October
2, 2007.
25. Schmit J. More food labels take an ominous tone on allergens. USA Today.com
Web site. December 26, 2007. Available at:
www.usatoday.com/money/industries/food/2007-12-26-food-
labels_N.htm?csp=34. Accessed December 27, 2007.
26. U.S. Department of Health and Human Services, Center for Food Safety and
Applied Nutrition. Report to the Committee on Health, Education, Labor and
Pensions, U.S. Senate and the Committee on Energy and Commerce, U.S.
House of Representatives. Food and Drug Administration Web site. July 2006.
Available at: www.cfsan.fda.gov/~acrobat/alrgrep.pdf. Accessed September 26,
2007.
27. Hefle SL, Furlong TJ, Niemann L, Lemon-Mule H, Sicherer S, Taylor SL.
Consumer attitudes and risks associated with packaged foods having advisory
labeling regarding the presence of peanuts. J Allergy Clin Immunol.
2007;120:171-176.
34
28. Nowak-Wegrzyn A, Isenberg H, Wood RA. Allergic reactions to foods in the
school. J Allergy Clin Immunol. 2000;105(1):S182.
29. Eigenmann PA, Zamora SA. An internet-based survey on the circumstances of
food-induced reactions following diagnosis of IgE-mediated food allergy.
Allergy. 2002;57:449-453.
30. Vander Leek TK, Liu AH, Stefanski K, Blacker B, Bock SA. The natural history
of peanut allergy in young children and its association with serum peanut-
specific IgE. J Pediatr. 2000;137:749-755.
31. Cornelisse-Vermaat JR, Voordouw J, Yiakoumaki V, Theodoridis G, Frewer LJ.
Food-allergic consumers’ labeling preferences: a cross-cultural comparison.
Eur J Public Health. 2008;18:115-120.
32. Buchanan W. S.F. expected pass law on nutrition disclosure. San Francisco
Chronicle Web site. February 29, 2008. Available at:
http://www.sfgate.com/cgi-
bin/article.cgi?f=/c/a/2008/02/29/MNR9VASHU.DTL&hw=nutrition+disclosure&s
n=001&sc=1000. Accessed March 3, 2008.

35
APPENDICES
36
Appendix A: Human Subjects Committee Approval
37
Appendix B: Food Allergy Survey
COMPLETION OF THIS SURVEY IS ENTIRELY VOLUNTARY. BY FILLING IT OUT YOU ARE GIVING YOUR CONSENT FOR RESULTS TO BE USED AS PART OF A RESEARCH PAPER. YOUR ANONYMITY AND CONFIDENTIALLY WILL BE ASSURED. Demographic Information: Age _______ Sex M___ F ___ Education Level: High school—no degree _____ High school – degree or GED _____ Some college _____ College degree _____ Post college education _____ Race/ethnicity (please mark one): White/Non-Hispanic _____ Black _____ Hispanic/Latino _____ Mexican-American _____ Asian _____ Pacific Islander _____ American Indian/Alaska Native _____ Other _____
1. Do you read ingredient labels on food products? Never _______ Sometimes ______ Usually ________ Always _________ 2. Do you read the allergy information on the ingredient label? Never ______ Sometimes ______ Usually ______ Always _______ I didn’t know there was any ________ 3. Do you read the allergy warning statements (for example: manufactured on equipment which also processes food with allergens) on the ingredient label? Never ______ Sometimes ______ Usually ______ Always _______ I didn’t know there were any ________ 4. If you check for allergen information, please check all reasons which apply? I have one or more food allergies _____ I have a friend with food allergies _____ I have a sibling or parent with food allergies _____ I have a child with food allergies ______ Just curious ___
NUTRITION FACTS Serving Size 32 chips (15g) Servings Per Container about 23 Amount Per Serving Calories 70 Fat Cal 40 % Daily Value* Total Fat 4.5g 7% Sat Fat 2.5g 13% Trans Fat 0g Cholesterol 0mg 0% Sodium 0mg 0% Total Carbohydrate 10g 3% Dietary Fiber less than 1g 3% Sugars 8g Protein 1g Vitamin A 0% Vitamin C 0% Calcium 0% Iron 4% *Percent Daily Values are based on a 2000 calorie diet. Ingredients: Semi-sweet chocolate (sugar, unsweetened chocolate, cocoa butter, soy lecithin – an emulsifier, vanilla). ALLERGEN INFORMATION: Contains soy. Manufactured on the same equipment that also makes products containing milk. Made in a facility that uses peanuts and tree nuts.
38
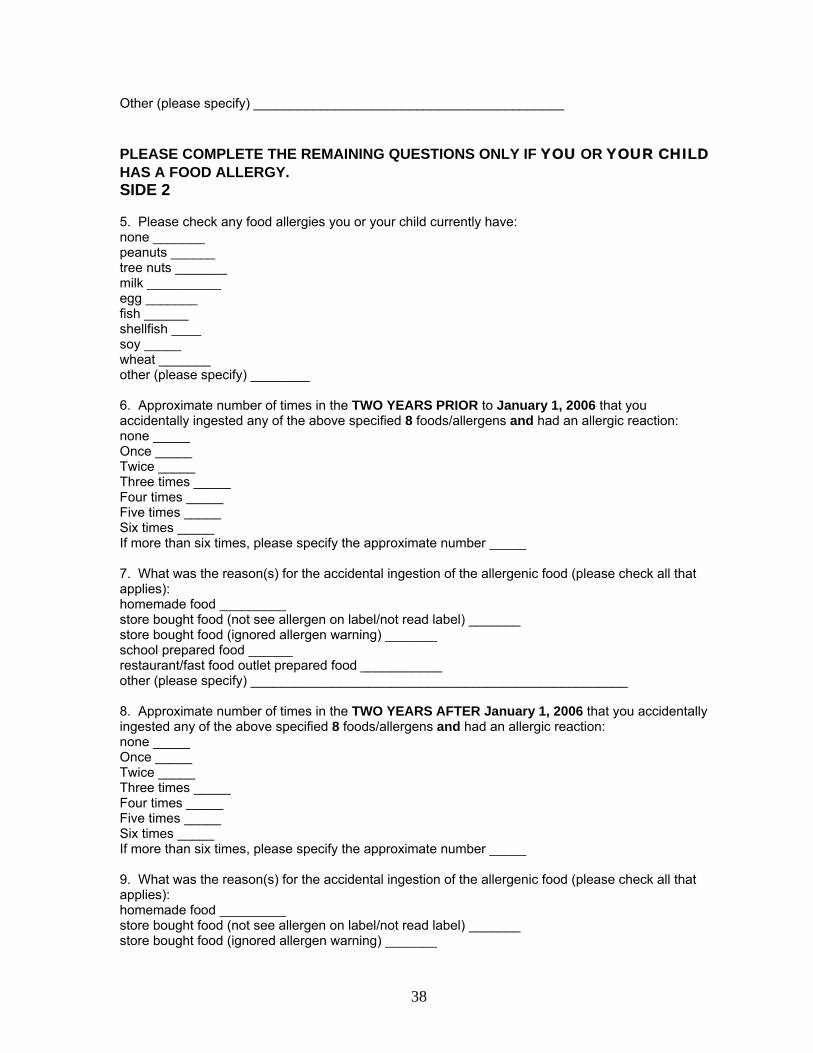
Other (please specify) __________________________________________ PLEASE COMPLETE THE REMAINING QUESTIONS ONLY IF YOU OR YOUR CHILD HAS A FOOD ALLERGY. SIDE 2 5. Please check any food allergies you or your child currently have: none _______ peanuts ______ tree nuts _______ milk __________ egg _______ fish ______ shellfish ____ soy _____ wheat _______ other (please specify) ________ 6. Approximate number of times in the TWO YEARS PRIOR to January 1, 2006 that you accidentally ingested any of the above specified 8 foods/allergens and had an allergic reaction: none _____ Once _____ Twice _____ Three times _____ Four times _____ Five times _____ Six times _____ If more than six times, please specify the approximate number _____ 7. What was the reason(s) for the accidental ingestion of the allergenic food (please check all that applies): homemade food _________ store bought food (not see allergen on label/not read label) _______ store bought food (ignored allergen warning) _______ school prepared food ______ restaurant/fast food outlet prepared food ___________ other (please specify) ___________________________________________________ 8. Approximate number of times in the TWO YEARS AFTER January 1, 2006 that you accidentally ingested any of the above specified 8 foods/allergens and had an allergic reaction: none _____ Once _____ Twice _____ Three times _____ Four times _____ Five times _____ Six times _____ If more than six times, please specify the approximate number _____ 9. What was the reason(s) for the accidental ingestion of the allergenic food (please check all that applies): homemade food _________ store bought food (not see allergen on label/not read label) _______ store bought food (ignored allergen warning) _______
39
school prepared food ______ restaurant/fast food outlet prepared food ___________ other (please specify) ___________________________________________________ 10. What additional/different information on food ingredient labels would help you notice the allergen information: larger print _______ bolder print ______ separate allergen section _______ no changes _________ other (please specify) ______________________________________________________ Thank you for your time.
40
Appendix C: Study Data Sheet
DATA SHEET STUDY: EFFECT OF THE FOOD ALLERGEN LABELING AND CONSUMER PROTECTION ACT ON THE ACCIDENTAL FOOD ALLERGEN INGESTION RATE IN ADULTS WITH SELF-REPORTED FOOD ALLERGIES INQUIRIES ABOUT STUDY RESULTS: PLEASE CONTACT THESIS CHAIR DR. GEORGE LIEPA, PROFESSOR OF HUMAN NUTRITION, EASTERN MICHIGAN UNIVERSITY 734-487-2499


![Consumer-friendly food allergen detection: moving …...damaging extraction solutions such as 2-mercaptoethanol (2-ME) have been applied in food allergen extraction [65]. In order](https://img.pdfslide.net/doc/110x75/5fda15a69bc80b24524a901c/consumer-friendly-food-allergen-detection-moving-damaging-extraction-solutions.jpg)