Embed Size (px)
Citation preview
Finance and Economics Discussion SeriesDivisions of Research & Statistics and Monetary Affairs
Federal Reserve Board, Washington, D.C.
The Effect of the PPPLF on PPP Lending by Commercial Banks
Sriya Anbil, Mark Carlson, and Mary-Frances Styczynski
2021-030
Please cite this paper as:Anbil, Sriya, Mark Carlson, and Mary-Frances Styczynski (2021). “The Effect of thePPPLF on PPP Lending by Commercial Banks,” Finance and Economics DiscussionSeries 2021-030. Washington: Board of Governors of the Federal Reserve System,https://doi.org/10.17016/FEDS.2021.030.
NOTE: Staff working papers in the Finance and Economics Discussion Series (FEDS) are preliminarymaterials circulated to stimulate discussion and critical comment. The analysis and conclusions set forthare those of the authors and do not indicate concurrence by other members of the research staff or theBoard of Governors. References in publications to the Finance and Economics Discussion Series (other thanacknowledgement) should be cleared with the author(s) to protect the tentative character of these papers.
The Effect of the PPPLF on PPP Lending by Commercial Banks
Sriya Anbil Mark Carlson
Mary-Frances Styczynski*
We analyze whether the Federal Reserve’s Paycheck Protection Program Liquidity Facility (PPPLF) was successful in bolstering the ability of commercial banks to provide credit to small businesses under the Small Business Administration’s Paycheck Protection Program (PPP). Using an instrumental variables approach, we find a causal effect of the facility boosting PPP lending. On average, commercial banks that used the PPPLF extended over twice as many PPP loans, relative to their total assets, as banks that did not use the PPPLF. Our instrument is a measure of banks’ familiarity with the operation of the Federal Reserve’s discount window; this measure is strongly related to both the propensity to sign up for and to utilize the PPPLF. Further, using a similar instrumental variables approach, we find evidence that the availability of the facility as a backstop source of funds may also have supported bank PPP lending, especially for larger banks.
April 20, 2021
Keywords: COVID-19, PPP, PPPLF, Federal Reserve, central bank lending
JEL Codes: E58, G21, H81
* Anbil: [email protected]; Board of Governors of the Federal Reserve System. Carlson: [email protected]; Board of Governors of the Federal Reserve System. Styczynski: [email protected], Board of Governors of the Federal Reserve System. We thank Alyssa Anderson, Margaret DeBoer, Benjamin Kay, Marco Macchiavelli, Matthew Malloy, Camelia Minoiu, Bernd Schlusche and Zeynep Senyuz for valuable comments. The views expressed in this paper are solely those of the authors and do not necessarily reflect the views of the Board of Governors of the Federal Reserve System or its staff. All remaining errors are our own.
1
Many small businesses suffered significantly during the COVID-19 public health crisis as social distancing adversely affected their operations and sales. In response, the federal government established the Paycheck Protection Program (PPP) through which banks and other lenders made low-cost, potentially forgivable loans to small businesses. Guarantees of PPP loans by the Small Business Administration (SBA) ensured that the PPP lenders were repaid. Numerous studies have found this program was successful in supporting small businesses during the economic disruption associated with the pandemic (Bartik, Cullen, Glaeser, Luca, Stanton and Sunderam (2020); Autor, Cho, Crane, Goldar, Lutz, Montes, Peterman, Ratner, Villar & Yildirmaz (2020); Doniger and Kay (2021) among others).
To bolster the ability of banks to extend PPP loans, the Federal Reserve established the Paycheck Protection Program Liquidity Facility (PPPLF). This facility provided low-cost funds to PPP lenders where the amount and maturity of the funds from the Federal Reserve exactly matched the amount and maturity of the PPP loans made by the PPP lender.1
In this paper, we investigate the extent to which the PPPLF boosted PPP lending by commercial banks.2 The PPPLF may have done so by providing access to low-cost stable funding to banks, especially if the banks (accurately) believed that customer demand to use the proceeds from their PPP loans would be very strong in the near term and that this demand could potentially outstrip these banks efforts to raise sufficient deposits to be able to fund those loans. To the extent that obtaining relatively low-cost funds from the facility in a timely fashion was crucial in promoting the extension of PPP loans, then we would expect that, all else equal, banks that used the PPPLF would have made more PPP loans. We test this directly and find evidence that banks that used the facility made nearly twice as many PPP loans relative to their asset base as banks that did not use the facility. It is also possible that simply by being available as a backstop, the PPPLF may have provided banks the confidence that funding would be available if needed, and that this confidence enabled them to extend more PPP loans. Analyzing this aspect of the facility is harder, but we are able to provide suggestive evidence that supports this idea by looking at whether banks that took steps to be ready to use the facility made more PPP loans than banks that did not take such steps.
Clearly it is a challenge to determine whether the PPPLF had a causal effect on banks’ PPP lending. Banks had a choice in whether to access the facility and may simply have used it to obtain low-cost funding for PPP loans the banks had already decided to extend. In this case, any linkage between higher lending and PPPLF usage may simply be a consequence of banks already deciding to lend more, rather than the presence of the PPPLF causing an increase in bank
1 The fact that the PPP loans were fully guaranteed by the SBA meant that the Federal Reserve could provide PPPLF loans for the full value of the PPP loan collateral; that is, despite no haircut on the collateral, the Federal Reserve was not taking on any credit risk. 2 The PPPLF was available to other institutions besides banks. From the start, the facility was open to all depository institutions, which includes other institutions such as credit unions which are not banks. Not long after it began operating, the facility was also made available to an even broader set of institutions that included non-depository institutions. We focus on commercial banks because of the amount of data available about these institutions.
2
lending. To solve this endogeneity problem, we use an instrumental variable approach. Our instrument for PPPLF usage is the familiarity of banks with the operation of the Federal Reserve’s discount window prior to the onset of the COVID-19 public health crisis. In particular, we look at the practice of pledging loan collateral. This process can be quite involved as it includes steps such as working with the Federal Reserve to make sure that the Federal Reserve is able to establish a claim on the loans, as well as submitting paperwork on a monthly basis on the change in the value of the pledged loans. Moreover, the process of pledging loan collateral to the discount window in ordinary times is nearly identical to the process that was required for pledging PPP loans for the PPPLF. Hence there is a clear mechanism by which familiarity with discount window operations would have made banks more likely to consider the PPPLF as a potential source of funding, while at the same time not being subject to endogeneity concerns. As such, our measure of familiarity serves as a useful instrumental variable.
The first step is to test whether our instrument is related to whether banks actually used the PPPLF. The results of this first step are interesting in their own right as they provide insights into the value of familiarity with the discount window in preparedness planning. Key for our analysis, we find a strong linkage between familiarity with the discount window and use of the PPPLF; experience pledging loan collateral increased a bank’s probability of using the PPPLF by 8 percentage points, such that these banks had an overall probability of using the PPPLF of 26 percent. The relationship between familiarity and use of the PPPLF is particularly strong for smaller community banks. Moreover, additional analysis indicates that familiarity with pledging loan collateral reduced the time until the banks accessed the PPPLF.
When combined with bank balance sheet and other control variables, this analysis also provides insights into the banks for whom the support from the Federal Reserve was most valuable. For instance, we find that banks that had Federal Home Loan Bank (FHLB) loans outstanding at the end of 2019 were also more likely to use the PPPLF. This result suggests that there were some banks for whom funding support was quite important, even as deposits were generally flowing into the banking system (Glancy, Gross and Ionescu (2020)). In addition, banks that, on average, had higher funding costs were more likely to borrow from the PPPLF; this is perhaps not too surprising given the low rate on PPPLF advances. Finally, we also find that larger banks and banks that had more unused C&I loan commitments relative to their total C&I loan exposures (loans on the balance sheet plus unused commitments) were more likely to have made more use of the PPPLF.
Next, we investigate the role the PPPLF may have played by acting as a backstop facility. We measure whether a bank was prepared to use the facility by checking whether the bank had submitted the paperwork to use the PPPLF.3 Submitting the necessary paperwork required action by the bank and thus serves as a signal that the bank was incorporating the PPPLF into their funding planning. We find that our measure of a bank’s familiarity with the discount window also increases the probability that a bank took steps to be prepared to use the PPPLF.
3 Legal documents to sign up for the PPPLF can be found here.

3
Banks that had pledged loan collateral to the discount window prior to the onset of COVID-19 were 16 percentage points more likely to file paperwork necessary to borrow from the PPPLF, which translates to a 51 percent probability of signing up for the PPPLF overall.
Having established a link between familiarity with pledging discount window collateral and banks’ use of the PPPLF, we turn to the second stage of the analysis. We start by looking at whether banks that borrowed from the facility extended more PPP loans than other banks. PPP loan extensions are measured using data from the June 2020 Call Report.4 Simple summary statistics indicate that at the end of June 2020, on average, banks that used the PPPLF had extended PPP loans of about 10 percent of their assets as of the end of 2019 while banks that participated in the PPP but did not use the facility had ratios of PPP loans relative to their assets of about half that amount.5
We test whether there is a causal effect of PPPLF using our instrumental variables approach. Our results indicate that this is indeed the case. We find that use of the facility increased PPP lending relative to the asset base of the banks by roughly 5 percentage points. As the unconditional average ratio of PPP loans to assets in June at banks that did not use the facility was 5 percent, our result suggests that use of the facility about doubled the amount of PPP loans extended by the banks and that nearly all the difference in the simple means can be interpreted as being the result of the PPPLF. Looking at the effect of the PPPLF by bank size, we find that the boost provided by the facility for PPP lending is particularly strong for smaller community banks, those with assets of $600 million or less. The relationship for larger community banks is positive, but the relationship is very imprecisely estimated and is not distinguishable from zero.
We next look at whether the availability of the PPPLF as a backstop may have supported PPP lending. We do so by repeating our instrumental variable approach but using our indicator for whether the bank had filed facility-related legal documents (instrumented by familiarity) rather than actual use of the PPPLF. Because banks that actually borrowed from the PPPLF must have filed the paperwork, we are especially interested in comparing these results to the previous results to see whether filing the paperwork made the PPPLF a readily accessible funding backstop, and provided an additional boost beyond the funds it extended (i.e. we look to see whether the coefficients are larger in this specification). For small community banks we find the coefficients are little changed, which suggests that, for these banks, the support provided by the PPPLF was largely from the funds actually disbursed. However, for larger banks, we find that PPP lending relative to assets was boosted by filing paperwork—by an amount equal to 3 percent of their asset base—whereas actual facility use had not had much effect. Large
4 The Call report measures the dollar volume of PPP loan extensions rather number of PPP loans extended. Moreover, the Call report indicates the value of such loans on banks books at the end of the month. Comparisons to data provided by the SBA on the value of loans extended by banks indicate that these two measures are extremely highly correlated. We discuss this point in more depth below. 5 Throughout our analysis, we consider only banks that made PPP loans. The decision by banks to participate in the PPP is a separate, but no less interesting, question. For an analysis of the factors associated with that decision, see Lopez and Spiegel (2021).
4
community banks that did not file paperwork extended PPP loans equal to, on average, 7 percent of their assets, so the boost is economically quite meaningful. We interpret this as indicating that the backstop role of the PPPLF was important for these larger banks.
We also find evidence that the other bank balance sheets measures associated with PPP lending are in line with previous research, such as Li and Strahan (2020). Banks that had more unused lines of credit relative to their C&I loan exposures at the end of 2019 tended to make more PPP loans. Further, banks that had more unused C&I loan commitments relative to total C&I exposures at the end of 2019 tended to make more PPP loans. Funding structure also seems to matter. Banks with a greater share of core deposits relative to total assets tended to make more PPP loans, which suggests that stability of funding was beneficial. We also find that banks with more liquid assets relative to total assets tended to make more PPP loans, again suggesting that liquidity may have played a role.
Our paper is closely related to a small but growing literature on the effectiveness of the PPPLF and its interaction with the PPP program. Beauregard, Lopez, and Spiegel (2020) find that small banks were important in providing PPP loans, and that the facility did support bank lending. They do not establish a causal relationship. We build on their work using an instrumental variables approach to provide evidence of causation. Relatedly, Lopez and Spiegel (2021) look at how participation in the PPP and the PPPLF, as instrumented by prior interactions between the bank and the SBA, affected bank lending to small businesses and find that such participation boosted lending. In this paper, we look more closely at the factors shaping banks’ decisions to use the PPPLF and quite specifically at whether the PPPLF supported the implementation of the PPP. That is a somewhat different, though clearly a very related question, and these papers seem highly complementary without being substitutes.
The remainder of the paper is organized as follows. We start, in Section 2, by providing some background information on the operation of the PPP and PPPLF, describing available data that we will use to analyze them, and reviewing some simple summary statistics. The description of the variable we use as our instrument and the extent to which familiarity with the discount window resulted in banks being more likely to use the PPPLF is in Section 3. These results are important on their own as they provide some indication of the value of operational readiness and crisis preparedness. In Sections 4 and 5, we describe the specification and analysis of the extent to which the PPPLF bolstered PPP lending, respectively. Section 6 concludes.
2. Operations of the PPP and PPPLF
This section provides more details on the operations of the PPP and PPPLF and discusses the data that we use in the analysis. We also review the literature on the PPP, which generally supports the view that this program was valuable for small businesses and reinforces the importance of determining whether the Federal Reserve’s lending facility provided important support for the PPP.

5
2.1 The Paycheck Protection Program (PPP)
The PPP was a part of the Coronavirus Aid, Relief, and Economic Security Act (or CARES Act) passed by the U.S. Congress in response to the economic disruptions caused by efforts to contain the COVID-19 pandemic. 6 The PPP was geared toward providing support for smaller businesses. Indeed, the entities that are eligible to participate in the program include small business concerns as defined by the SBA: sole-proprietors, independent contractors, and self-employed persons, among others. For simplicity, we use the term "small business" to refer to all eligible entities. The program also featured rules designed to promote employee retention.
Rather than distribute funds directly to businesses, the program used private sector lenders and the SBA to deliver support. In particular, private sector lenders were encouraged to make loans to eligible small businesses and those loans would be guaranteed by the SBA. Hence, the SBA oversees the PPP but uses private sector lenders to process loan applications and disperse funding. The loans reside on the balance sheets of the private sector lenders, but these lenders do not incur any credit risk associated with the loans as any payments not made by the borrower, due to either default or forgiveness, are covered by the SBA. In addition, the guarantee from the SBA has allowed for regulatory relief that reduces the capital requirements associated with these loans. Finally, lenders are paid a fee for originating loans which further incentivizes them to do so.
While this study focuses on bank lenders that originated PPP loans, other types of private sector lenders are also eligible to offer these loans. A non-exhaustive list of non-bank eligible lenders includes small business lending companies (SBLCs), which are regulated by the SBA; credit unions; farm credit associations; and financial technology companies (FinTechs).
Small businesses are incentivized to participate because of the low cost of funding and the possibility that the loans might be forgiven. The interest rate on PPP loans was set at 1 percent and is fixed until the loan matures (initially two years but extended to five years in early June 2020). Moreover, small businesses that are approved for a loan may be eligible for loan forgiveness if they meet the employee retention criteria and use loan proceeds for eligible expenses.
The rapidly growing literature on the PPP has generally found that it was beneficial in terms of helping businesses continue to operate and keeping people employed, although the size of the estimated impact varies notably (Bartik, Cullen, Glaeser, Luca, Stanton and Sunderam (2020); Autor, Cho, Crane, Goldar, Lutz, Montes, Peterman, Ratner, Villar & Yildirmaz (2020); Chetty, Friedman, Hendren, and Stepner (2020); Doniger and Kay (2021) among others). A related literature focuses on the roles of banks in PPP lending. Granja, Makridis, Yannelis and
6 In fact, funds allocated to the PPP came in several installments. The first installment was in March 2020, where Congress set aside $349 billion in funding for the PPP. That funding ran out in mid-April. On April 24, 2020, an additional $310 billion in funding was allocated as part of the Paycheck Protection Program and Health Care Enhancement Act. A third installment that provided an additional $284 billion was included in the Consolidated Appropriations Act that was signed into law in December 2020. Our analysis period ends in June 2020 and thus only includes information from the first two installments.
6
Zwick (2020) find evidence that banks played an important role in mediating program targeting. Humphries, Neilson and Ulyssea (2020) show that smaller businesses found it more difficult to obtain a PPP loan because of information frictions between banks and small businesses. Li and Strahan (2020) examine how the supply of PPP credit depended on banks’ preexisting relationships with customers, and how this relationship affected the supply of PPP credit extended by banks. Finally, James, Lu and Sun (2021) document the large role that community banks played in extending loans through the PPP program.
2.2 The Paycheck Protection Program Liquidity Facility (PPPLF)
On April 9, 2020, shortly after the official launch of the PPP, the Federal Reserve announced plans to establish the PPPLF to enhance the ability of depository institutions to lend to small businesses via the PPP.7 The PPPLF enhances the ability of lenders to make PPP loans by offering low-cost financing; loans extended under the facility have a rate of 0.35 percent. PPPLF loans must be collateralized by a PPP loan. Due to the full guarantee of the PPP loans provided by the SBA, the amount of each loan extended under the facility is equal to the value of the PPP loans pledged as collateral, and PPPLF loans are able to be extended on a non-recourse basis to the PPP lenders.8 Moreover, the maturity of the facility loans is set to match that of the PPP loans so that the PPP lender does not face any liquidity risk.
On April 30, 2020, the Federal Reserve announced amendments to the terms of the PPPLF.9 One change was an expansion of the eligibility to borrow from the facility to include all private sector lenders making PPP loans. A second change was to allow eligible facility borrowers to pledge PPP loans that they had purchased, rather than only PPP loans that they had originated.
There are a couple reasons why the PPPLF might be expected to support PPP lending. One reason is the interest rate. The rate at the PPPLF was a bit below those on other funding sources. For example, FHLB rates appear to have been on the order of 0.60 to 0.90 during this period, slightly higher than the rates at the PPPLF.10 Access to lower cost funding than was available elsewhere would have boosted the return on extended PPP loans and thus may have made them more attractive to originate.
The PPPLF may also have supported PPP lending through its role as a backstop. In particular, the facility may have reassured banks about the availability of funding at a known price in the event, for instance, that the rapid influx of deposits that occurred around the onset of
7 More information is available in the related press release https://www.federalreserve.gov/newsevents/pressreleases/monetary20200409a.htm. 8 The PPPLF was established under the Federal Reserve's emergency lending authority, rather than the standard lending authority, which enables these unusual lending terms. 9 More information is available in the related press release https://www.federalreserve.gov/newsevents/pressreleases/monetary20200430b.htm. 10 See the information provided at https://www.fhlbdm.com/products-services/advances/rate-history-tool/.

7
the stress period reversed just as rapidly or if the bank’s typical source of market funding were to suddenly prove less available than anticipated. Amid the generally heightened uncertainty in the first few months following the pandemic related shutdown, the certainty provided by the funding from the facility may have made banks more willing to provide PPP loans.
2.3 Participation in PPP and PPPLF
Our dataset is composed of data from the Federal Financial Institutions Examination Council (FFIEC) and from the Federal Reserve for 4,225 commercial banks that we identified as PPP lenders. (Thus, as noted above, all the banks in our sample had decided to participate in the PPP.) Commercial banks are identified as a PPP lender based on their reporting on the FFIEC’s Consolidated Reports of Condition and Income (Call Reports) for June 30, 2020.11 The June 2020 Call Report, asked respondents to report on their participation in the PPP. Banks with PPP loans outstanding greater than zero as of June 30, 2020, are flagged for inclusion in the analysis.12 Using this approach, the banks in our sample account for over 90 percent of the $521 billion in net PPP issuance as of June 30, 2020.13
While we look at the loans that are on banks books in June 2020, it is worth noting that these data are highly correlated with the bank level data on PPP loan originations from the SBA. Thus, even though we our data consist of bank holdings of PPP loans on a particular date, one can also think of these as reflecting PPP loan originations.
For each bank in our sample, we gather information on their PPPLF usage between April 16, 2020 and June 30, 2020 based on internal Federal Reserve records on the facility.14 We create an indicator that flags whether a bank borrowed from the facility at least once at any point between April 9, 2020 and June 30, 2020. We only consider usage of the facility prior to (or on) June 30, 2020 to align with our data on PPP loans.
Using the June 30, 2020 data is the most straightforward because, after August 10, 2020 when the PPP program ended, loan borrowers could ask for loan forgiveness. As a result, the PPP loan amount outstanding as of the September Call Report would be reduced by the amount of loan forgiveness. Consequently, it would be more difficult to reconcile the loan amounts outstanding with the amounts of loans originated and make it more difficult to test whether the PPPLF had boosted lending.
11 We used three versions of the Call Reports: FFIEC 031 (for banks with domestic and foreign offices), FFIEC 041 (for banks with domestic offices only), and FFIEC 051 (for banks with domestic offices only and total assets less than $5 billion). 12 Item 17, sub-item b on Schedule RC-M, Memoranda of the Call Report is where banks are asked to report their outstanding balance of PPP loans on the Call Reports. 13 The SBA reported on its website that net PPP issuance on June 20, 2020 was $521 billion here. The remaining 10 percent of PPP issuance was by non-bank lenders. 14 Please note that the Federal Reserve publicly discloses PPPLF borrowings by lender once a month. Data on PPPLF loans issued between April 16, 2020 and June 30, 2020 are available on the Board of Governors’ public website here. There is no difference between these public and the internal data used in this analysis.
8
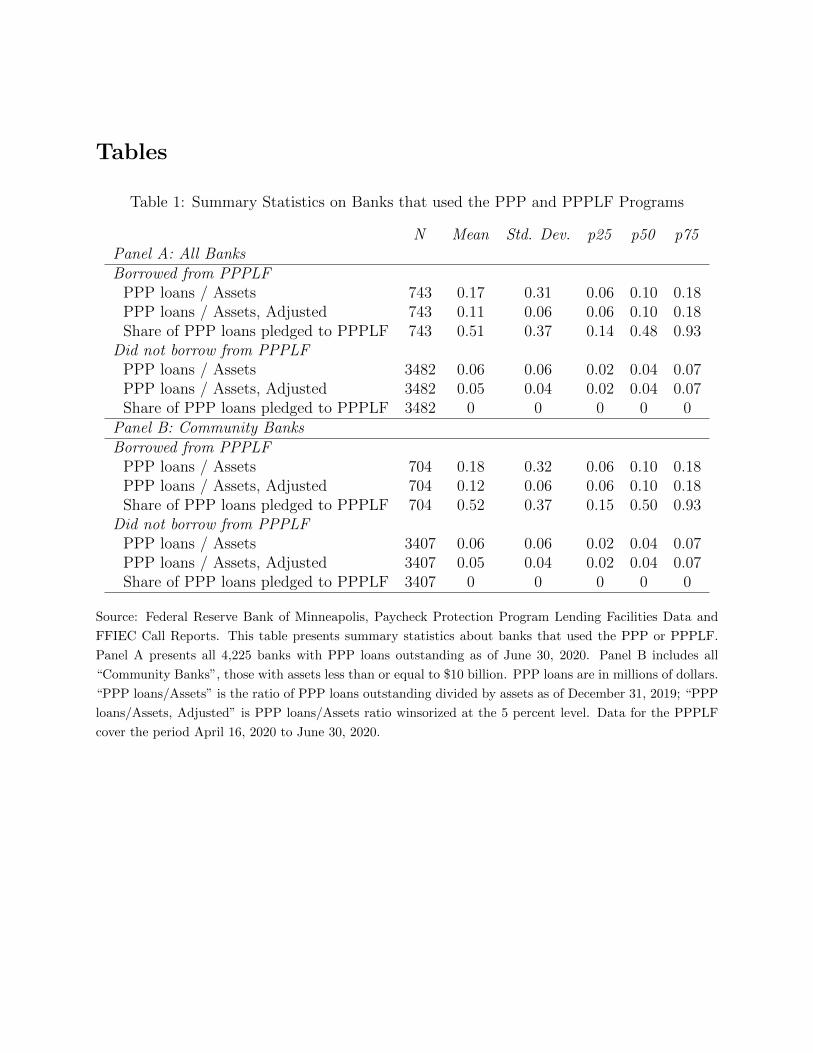
Table 1 presents summary statistics for banks that used the PPP and PPPLF programs. Of the commercial banks in our sample, 743 borrowed from the PPPLF at least once between April 16, 2020, and June 30, 2020 (Panel A). This group represents about 18 percent of all commercial banks with PPP loans outstanding as of June 30, 2020.
Banks that used the PPPLF tended to issue more PPP loans, on average, than banks that did not participate in the PPPLF. For instance, for banks that were PPPLF borrowers, the median bank had PPP loans on their balance sheet in June 2020 in amounts that were 10 percent of their assets at the end of December 2019 (Panel A). By contrast, the median bank that was not a PPPLF borrower had PPP loans on their balance sheet that represented less than 5 percent of their assets at the end of 2019.
A few banks held very large amounts of PPP loans relative to their assets in June 2020. In a number of these cases, this accumulation was the result of the banks acquiring at significant portion of these loans in conjunction with their relationships with FinTech firms.15 The PPPLF was important for funding many of these loans. While this dynamic is important and highlights the support provided by the facility, this effect was limited to a few banks and we are concerned that the very large ratios of PPP loans relative to assets reported by these few banks might distort our results and not allow us to capture the relationship between the PPP and PPPLF that prevailed for most of the banking industry. To avoid having the activities of a few banks drive our findings, we winsorize the data at the 5 percent level. The impact can be clearly seen on the ratios for banks that used the PPPLF where the average ratio of PPP loans to assets falls from 0.17 to 0.11 for “PPP loans to assets, Adjusted” in Table 1, Panel A (the winsorized data).
Next, given the interest in the role of community banks in providing PPP loans (as discussed, for instance, by James, Lu and Sun 2021) we consider a subsample of banks with assets of $10 billion or less as of December 31, 2020, which we refer to as our sample of community banks. Panel B of Table 1 presents summary statistics for community banks. Nearly 95 percent of PPPLF borrowers are community banks. Among community banks, the median bank that was a PPPLF borrower had PPP loans on their balance sheet in amounts that were 10 percent of their assets. In comparison, the median community bank that was not a PPPLF borrower had PPP loans of 4 percent.
We further provide information on PPP lending and PPPLF usage by large and small community banks. Table 2 presents summary statistics on large community banks (those with assets less than or equal to $10 billion but more than $600 million) and small community banks (those with assets less than or equal to $600 million). We choose $600 million as our cutoff because $600 million is set by the SBA and used by federal regulators to assess burden of regulatory changes on smaller banks.
15 We observe a handful of banks with ratios of PPP loans to assets that are greater than 1. These banks bought PPP loans from FinTechs in the secondary market to facilitate FinTechs lending PPP loans to small businesses (Erel and Libersohn (2020)). FinTechs were not allowed direct access to the PPPLF until April 30, 2020 and were operating with little balance sheet capacity until this date.
9
As shown in Table 2 Panel B, the average small community bank issued nearly 2.5x the amount of PPP loans relative to assets (using the winsorized data) if they borrowed from the PPPLF relative to those that did not borrow. The differences are also apparent, but not as large, for large community banks (Panel A). The average large community bank that accessed the PPPLF issued 1.4x the amount of PPP loans relative to assets as a large community bank that did not access the PPPLF (using the winsorized data).
2.4 Control variables
We also gather a variety of other balance sheet information from the Call Reports that will help us control for other bank characteristics that might influence the provision of PPP loans. Many of these control variables follow Li and Strahan (2020). All variables are measured as of December 31, 2019, prior to the onset of the pandemic event.
The first variable we include is the size of the bank as measured by log assets. In normal times, a larger share of the balance sheets of smaller banks are devoted to loans to small businesses. Thus, one might expect that smaller banks would provide more PPP loans. However, there were notable challenges associated with getting the infrastructure in place to originate PPP loans, so larger banks might have had an advantage. Consistent with that idea, Beauregard, Lopez, and Spiegel (2020) find evidence that the PPP significantly boosted lending to small businesses by banks of all sizes, though perhaps disproportionately at large and medium-sized banks.
Another variable we use is the ratio of undrawn lines of credit for C&I loans relative to the sum of undrawn lines of credit plus drawn C&I loans, again measured as of December 31, 2019. During the turmoil in financial markets in March 2020, many businesses drew down lines of credit they had with banks. These draws were subsequently paid back as financial markets stabilized (Li and Strahan (2020)). Nevertheless, these dynamics may have affected the ability of banks to originate PPP loans. Moreover, unused commitments have been found to be associated with bank-borrower relationships (Berger and Udell 1995); Li and Strahan (2020) find that relationships, as indicated by unused commitments, are associated with more PPP lending. In addition to overall C&I loans, we also include a measure of each bank’s engagement in small business C&I loans as a share of total C&I loans as of December 31, 2019. Since the PPP was targeted toward small businesses, the extent to which a bank was already focused on lending to this group may affect its PPP lending.
The final variable reflecting the asset side of the balance sheet that we use is the ratio of liquid assets to total assets. A variety of studies have noted that bank liquidity is important determinant of bank lending, especially amid stress events (Cornett et. al (2011); Li, Strahan, and Zhang (2020)). Banks that had more liquid assets—cash (including central bank balances) and U.S. Treasury securities—may have been more readily able to use these assets in the stress event
10
to originate loans. Thus, this variable might affect both the likelihood of using the PPPLF as well as PPP lending.
We also include a variety of funding measures. The reliance of banks on core funding, such as checking and savings deposits of individuals, has been found to support bank lending over the credit cycle (Berlin and Mester (1999)), and may provide stability of funding which would promote PPP lending. The Federal Home Loan Banks, FHLBs, serve as a fairly low-cost source of liquidity for many banks (see Ashcraft, Bech, and Frame (2010)) and we include a variable indicating whether banks had outstanding loans from the FHLBs at the end of 2019. Access to funding from the FHLBs might have allowed banks to originate more loans; Davidson and Simpson (2016) find evidence of such an effect. Another source of market-based funding used by banks are large-time deposits. It is possible that such funding was less readily available in the early days of the pandemic, so banks more reliant on this source of funding may not have been able to fund PPP loan originations to the same extent as other banks.
In addition, the proportions of the funding from different sources, we also include a measure of funding costs associated with deposits relative to industry averages. For each bank in the analysis, a deposit rate is imputed based on reported interest expenses and average deposit balances for December 31, 2019. Then the imputed rate for each bank is compared to the sample average, as a proxy for the industry average. Banks with higher funding costs may have been less likely to originate PPP loans as the interest rates on these loans was fixed at a fairly low rate. This variable may also be relevant for our first stage as banks with an imputed rate above the industry average may turn to the PPPLF for funding more so than banks that have an imputed rate below the average.
As a final control variable, we include the Tier 1 capital ratio of the bank. Banks that have less of a capital cushion and are closer to the regulatory requirements might be more reluctant to expand their lending (see, for instance, Gambacorta and Mistrulli (2004); Carlson, Shan, and Warusawitharana (2013); Rice and Rose (2016); Kapan and Minoiu (2018)). While the capital relief associated with PPP loans should mean that the capital requirements should play less of a role than they would normally, these requirements may still have played some role in banks decisions about expanding lending.16
Table 3 presents summary statistics of our balance sheet control variables for all banks, large community banks, and small community banks. Focusing on community banks, we observe that the balance sheet characteristics across large and small community banks appear quite similar, except that large community banks borrow more from FHLBs.
16 The interim final rule related to capital requirement exemptions is available here.

11
3. Familiarity with the discount window
Our focus in this paper is understanding the extent to which the PPPLF bolstered PPP lending by commercial banks. As noted above when discussing the summary statistics, banks that used the facility had a greater amount of such loans on their books in June 2020 relative to their assets in December 2019 than banks that did not use the facility. It is quite plausible that access to the low-cost stable funding provided through the PPPLF did indeed encourage banks to extend more PPP loans. Alternatively, it could also be the case that PPP lenders were simply taking advantage of the facility as a cheap alternative source of funding, and that this source was more attractive the more PPP loans banks needed to fund.17 In this alternative, the availability of the PPPLF would not change how many PPP loans banks planned to issue. These motivations are not mutually exclusive, and it could be the case that both are operating to some extent.
3.1 Measuring familiarity with the Federal Reserve’s discount window
In order to distinguish between these two explanations for the association of the PPPLF with greater PPP lending, we use an instrumental variable approach to model the effect of the facility on bank lending. The instrument is based on a measure of bank familiarity with the Federal Reserve’s ordinary discount window lending program prior to the onset of the COVID-19 pandemic. The process of pledging collateral (which would be a PPP loan) in order to borrow from the PPPLF is very similar to the process for the discount window. Being familiar with the operation of the discount window, and knowing how to pledge collateral, would, most likely, increase the familiarity with PPPLF operations, and thus may have bolstered bank PPP lending. This causal relationship also goes one way; there is not a way that a bank that makes more PPP loans now could go back in time and become more familiar with the operation of the discount window in a previous time. Further, it does not seem likely that being familiar with the operation of the discount window would have boosted PPP lending other than by making banks more willing to use Federal Reserve lending support to do so.
Moreover, understanding whether banks that were more familiar with the operation of the discount window program were more likely to utilize the PPPLF is useful in its own right. Finding such a relationship suggests that being familiar with the operation of the discount window would better enable the window to serve as a source of liquidity in emergency situations. It also points to the potential value for banks to take steps to become familiar with the operation of the discount window such as pre-pledging and maintaining collateral, or by going through steps to test access to the window.
17 Even here though, the lack of causality may be a bit of an extreme interpretation. Presumably a profit maximizing bank would seek to lend more when faced with a lower cost of funds. If the PPPLF lowers the marginal cost of funding for banks—and paying 0.35 percent for 5 years is quite cheap—then the PPPLF would still have a causal effect on their loan growth through this channel.
12
There are a few ways to measure bank familiarity with the discount window. One simple indicator is having the required paperwork on file. Each bank that would like to borrow at the window must complete the Operating Circular No. 10 agreements.18 However, while having the document completed is necessary to borrow, it may not be sufficient to ensure that the banks are familiar with the borrowing process. A far more involved step is for banks to have pre-pledged loans as discount window collateral. We focus on the pledging of loans because the process is more involved than the process for pledging securities, and because borrowing from the PPPLF requires pledging a PPP loan, not a security.
Pledging loans to the discount window means taking steps so that the Federal Reserve is able to have appropriate custody for the loans serving as collateral and so that the Federal Reserve is able to ensure that there are no other claims on the collateral as part of its due diligence process. There is also a fair amount of ongoing maintenance associated with pledging loans as banks must submit paperwork on a monthly basis on the change in the value of the pledged loans.19 Hence, an indicator that banks have pledged loan collateral to the discount window suggests that bank staff are likely more familiar with the operation of the discount window, and they would know how to pledge a PPP loan against borrowing from the PPPLF to support their PPP lending.20 If bank staff are unfamiliar with these processes, it might be the case that the unknown administrative hurdle associated with pledging loan collateral may have deterred banks from signing up for the PPPLF. (Moreover, banks are required to repay funds obtained from the PPPLF as the PPP loans are forgiven. Banks familiar with pledging and submitting revised values for loan collateral may well have viewed this process as straightforward while banks less familiar with this process may have viewed this step as yet another administrative burden.)
Based on this reasoning, our instrument is then whether a bank has discount window borrowing documents on file as of year-end 2019 and has loan collateral pledged to the Federal Reserve as of January 31, 2020. We use a confidential, internal dataset that allows us to observe whether banks have their borrowing documents filed, and what collateral they have pledged to the Federal Reserve.
A benefit of this measurement approach is that it automatically embeds banks with prior borrowing experience but expands the group to include those with borrowing documents and collateral pledged. Table 4 presents the counts of banks that have loan collateral pledged to the
18 These agreements may be found here. 19 We also considered whether pledging securities, instead of loans, was also a useful indicator of familiarity. We find consistent results using this indicator, though not as strong. We believe pledging loan collateral is more predictive of PPPLF participation because obtaining a PPPLF loan requires a PPP loan as collateral. 20 We also considered whether borrowing from the discount window is a useful indicator of familiarity. We find generally similar, though not quite as strong, results if we use an indicator for whether the bank had borrowed from the discount window in the past few years as our measure of familiarity. We speculate that the act of pledging loan collateral is the key hurdle for determining PPPLF participation, and that taking the extra step to actually call the local Federal Reserve Bank to request a loan offers only a marginal benefit, and may not be taken by all banks that have taken many steps internally to practice borrowing.
13
Federal Reserve. We identify 764 banks with positive loan collateral positions at a Federal Reserve Bank as of January 31, 2020. Of these 764 banks, approximately 30 percent borrowed from the PPPLF. Further, 35 percent and 55 percent had borrowed primary credit at least once in the last 6 months and 1 year, respectively (not shown).21
Table 4 also presents counts of banks that had submitted paperwork to participate in the PPPLF, conditioned on having loan collateral pledged. Borrowing from the facility required some additional paperwork in addition to the borrowing documents already on file for the discount window. Having the paperwork on file to borrow from the facility did not mean that the bank borrowed. From Table 4, we observe that 445 banks did have PPPLF borrowing documents on file, yet only 233 borrowed. Among large and small community banks that had PPPLF documents on file, 48 percent and 58 percent borrowed from the facility, respectively. Table 4 highlights a notable difference between the behavior of large and small community banks. Many large community banks had PPPLF documents on file but did not actually borrow. This statistic is important for our later instrumental variable analysis.
4. Instrumental Variable (IV) Specification
In this section, we investigate the relationship between our measure of familiarity with the discount window and how the bank approached the PPPLF.
4.1 First Stage: Predicting the use of the PPPLF
We start by investigating the relationship between our measure of familiarity with the discount window and whether the bank borrowed from the PPPLF. To do so, we use a probit regression. We use this approach as the first stage regression in the IV analysis so the specification shown here uses all the control variables ultimately used in the second stage of the IV analysis. Table 5 presents the results of the probit regression as marginal effects at the means. The most important result is in the first line of the table; our measure of “Familiarity with DW” is positively associated with use of the PPPLF and is quite precisely estimated. We find that for all banks, being familiar with the discount window increased the likelihood of using the PPPLF by 8 percentage points. This effect is strongest for smaller community banks where being familiar with the discount window is associated with an increase in the likelihood of using the facility by 11 percentage points. Given that the baseline probability of a small community bank using the facility is 14 percent, familiarity with the discount window operations nearly doubles the probability that a small community bank used the PPPLF.
21 The Federal Reserve publicly discloses primary credit loans issued to depository institutions with roughly a two-year lag. These disclosures also include the collateral that has been posted at the time of the loans. The disclosures are available on the Board of Governors’ public website here.
14
Many of our control variables are associated with use of the PPPLF. Banks that had borrowed from the FHLBs as of the end of 2019 were also more likely to use the facility. Being an FHLB borrower increased the likelihood of borrowing from the facility by about as much as our measure of being familiar with the discount window. That finding supports the idea that non-market sources of funding were important for supporting the activities of some banks despite the high level of deposit inflows to the banking system during this period (Glancy, Gross and Ionescu (2020)). Further, and not too surprisingly, we find that banks with high average funding costs tended to be more likely to use the PPPLF, which—especially given the term for which funds were available—offered attractively price funds.
We also find that banks that had more unused C&I loan commitments relative to C&I loan exposures at the end of 2019 were more likely to use the PPPLF. It is possible that these banks were more likely to be facing funding pressures if they needed to fund draws on these lines and were also trying to originate PPP loans. Somewhat surprisingly, we find that banks with higher ratios of small business lending to total C&I loans as of 2019 were less likely to use the facility. The coefficient relating the ratio of liquid assets relative to total assets has the expected negative sign, consistent with having more liquid assets reducing the likelihood that the bank borrowed from the facility. However, the coefficient is not significant.
The relationship between bank size and PPPLF use is slightly complicated. We find that bank size, as measured by log assets, is positively associated with use of the PPPLF. However, this positive association is not apparent for all size categories of banks. For instance, we do observe a positive relationship between bank size and PPPLF usage for the smallest community banks (those with assets of $600 million or less). However, we do not observe such a relationship for larger community banks (those with assets of more than $600 million but less than $10 billion).
In summary, our analysis suggests that “Familiarity with the DW” is a good instrumental variable for PPPLF usage, especially for small community banks. However, this variable may not be appropriate as an instrumental variable for large community banks (the coefficient in column 3 is insignificant). We hypothesize that this is because large community banks had many alternate sources of funding, such as deposit inflows (shown in Table 3). Therefore, it is possible that large community banks thought of the PPPLF differently than small community banks; we explore this possibility next.
4.2 Familiarity with the discount window and signing up for the PPPLF
The PPPLF may have bolstered banks’ PPP lending not only by serving as an actual source of funding, but also as a backstop source of funding. Simply by reassuring banks that funding would be available should it be needed, the banks may have felt more comfortable moving ahead with extending PPP loans. The PPPLF would have been most readily available as a backstop source of funds to banks that had filed the paperwork necessary to borrow from the
15
facility. Moreover, the fact that filing the paperwork required action on the part of the banks means that it provides a positive signal that these banks were in fact considering the PPPLF as a funding source. From Table 4, we observe that 445 banks had the necessary paperwork to borrow from the facility, yet only 233 did.22
We look at whether our measure of familiarity with the discount window—whether the bank had previously pledged loan collateral to the discount window—is related to whether the bank filed the paperwork to be able to borrow from the PPPLF. The results of this alternative probit regression are presented in Table 6; we again present marginal effects at the means. We find a positive and significant coefficient on “Familiarity with DW” indicating that banks that were familiar with pledging loan collateral were more likely to sign up to participate in the PPPLF. Indeed, familiarity boosted this likelihood by about 16 percentage points.
Notably, we find that there is a relationship between discount window familiarity and filing paperwork for large community banks that was not evident in Table 5. Being familiar with the discount window increased the probability of large community banks filing the necessary paperwork to borrow from the PPPLF by 9 percentage points. We interpret this result as indicating that being familiar with the discount window made large community banks more willing to incorporate use of PPPLF into their funding options which may then in turn affected their decisions on PPP lending, even if they did not actually borrow from the facility. One possible reason that the option to access the facility might have been more important to large community banks versus small community banks is because large community banks experienced higher levels of deposit inflows during this period, but the permanence of those inflows may have been uncertain.23 Regardless, it is informative to test whether PPP lending was influenced by the decision to file paperwork to enable borrowing from the PPPLF in addition to looking at whether there was an impact from actually using the facility.
4.3 Familiarity with the discount window and the time until banks turned to the PPPLF
We supplement the analysis of the factors associated with use of the PPPLF with analysis of the factors that determined the speed with which banks turned to the PPPLF. How quickly banks turned to the facility is measured by the number of days between the day that the PPPLF started making loans and the day that the bank actually borrowed; banks that do not borrow by June 30, 2020 have observations that are censored on that day. We analyze this data using survival analysis. Because survival analysis utilizes additional information (time until the bank borrowed, rather than just whether or not the bank borrowed) and controls for the censored nature of the data (that on June 30, 2020 we stop observing whether or not the bank borrowed
22 These statistics are conditioned on the banks having loan collateral pledged as of January 31, 2020, and do not reflect the total number of banks with PPPLF paperwork in place. 23 While they look at somewhat different size categories than we do, Glancy, Gross and Ionescu (2020) do note that larger banks experienced more significant increases in deposits than did smaller banks in the early days of the COVID-19 episode.
16
from the PPPLF), this approach enhances our understanding of the factors that contributed to PPPLF usage.
The results, shown in Table 7, support the previous analysis. We expect that familiarity with the discount window should reduce the time until a bank borrows from the PPPLF, and that is exactly what we find. Indeed, the effect is quite strong. Banks that were more familiar with the discount window turned to the facility 1.6 times faster than banks that were not as familiar with the discount window turned to the facility. To put this result in context, the average bank in our sample borrowed from the PPPLF within 15 days of the facility start. Banks familiar with the discount window borrowed within 6 days of the facility start.
With respect to our control variables, all the control variables that affected the likelihood of use also affected the speed with which banks turned to the PPPLF in a consistent fashion: factors that increased the likelihood of use are also associated with faster use. Interestingly, we find that holding more liquid assets significantly increased the length of time until a bank borrowed from the PPPLF. This finding is consistent with Berger et. al. (2017) who found that indications of liquidity condition were strongly associated with use of Federal Reserve liquidity facilities, such as the Term Auction Facility and the discount window, in the 2007-2009 financial crisis.
5. Effect of the PPPLF on PPP Lending
We now turn to the question of whether the PPPLF bolstered PPP lending. We look at this by examining the extent to which banks that used the facility had more PPP loans on their books as of June 30, 2020 than banks that did not use the facility.
5.1 Two stage approach to estimating the effect of the PPPLF on PPP Lending
To analyze the effect of using the facility on PPP lending, we estimate the following 2SLS cross-sectional regression for 4,225 banks where i denotes bank:
𝛽 𝛽 1 𝑖 𝑃𝑃𝑃𝐿𝐹𝐵𝑜𝑟𝑟𝑜𝑤𝑒𝑟 𝛿 𝜖 (1)
1 𝑖 𝑃𝑃𝑃𝐿𝐹𝐵𝑜𝑟𝑟𝑜𝑤𝑒𝑟 𝛼 𝛼 1 𝑖 𝐹𝑎𝑚𝑖𝑙𝑖𝑎𝑟𝑖𝑡𝑦𝑤𝑖𝑡ℎ𝐷𝑊 𝛾 Γ (2)
Equation 1 represents the second stage of our 2SLS regression where we examine the effect of borrowing from the PPPLF on PPP lending. The dependent variable is PPP lending as of June 30, 2020 divided by assets as of December 31, 2019. The coefficient of interest is β1. A positive coefficient indicates that borrowing from the PPPLF increased PPP lending. δ1 is a vector of our control variables presented in Section 2.4 and measured as of December 31, 2019.
17
They include the log of assets, unused C&I loans divided by total C&I loans, small business C&I loans divided by total C&I loans, the amount of liquid assets divided by assets, and the bank’s Tier 1 capital ratio.
Equation 2 represents the first stage of our 2SLS regression where we instrument for 1(i = PPPLF Borrower) in Equation 1 using the indicator variable 1(i = Familiarity with DW) that equals 1 if bank i is familiar with the discount window using our measures. γ1 is a vector of our control variables and measured as of December 31, 2019. They include core deposits divided by assets, large time deposits divided by assets, deposit funding costs, and an indicator variable that equals 1 if bank i was an FHLB borrower.
Section 5.2 Results when using all banks
As noted above, the dependent variable we use is the amount of PPP loans reported on the June 30, 2020 call report scaled by the total assets of the banks as of December 31, 2019. We think of this ratio as relating the banks’ involvement with the PPP to a broad measure of the size of the banks’ operations and hence their ability to provide PPP loans.24 Also as noted above, for a few banks, this ratio is quite large and so we use data winsorized at the 5 percent level. (Estimating our regressions without winsorizing the PPP loans to assets ratio results in larger, and less precisely estimated, coefficients, though these coefficients continue to be statistically significant.)
We start by looking at all banks and at whether actual borrowing from the PPPLF is associated with greater PPP lending. The results are shown in Table 8. We show both the IV results and the ordinary least squares (OLS) results. In both sets of results, borrowing from the PPPLF is associated with notable increase in the amount of PPP loans on the banks’ books relative to their assets at the end of the preceding year. The OLS estimates suggest that this ratio was about 6 percentage points higher for banks that used the PPPLF and the IV estimates confirm this finding. Based on our estimated coefficient along with the assets as of December 31, 2019 for 4,225 banks, a back-of-the-envelope calculation suggests that, all else equal, banks extended about $53 billion more PPP loans because they could borrow from the facility.
The IV results suggest that we should interpret the OLS coefficient, and indeed the differences in the means/medians from Table 1, as reflecting a causal impact of the PPPLF on PPP lending. Moreover, the closeness of the IV and OLS point estimates and the strength of the Wald chi2 test provide support for the validity of our instrument. If there was strong residual endogenity that our instrumental variable could not address in the first stage, then the point estimates between the OLS and IV regressions would be worringly different. The closeness of
24 Using data on PPP loan originations based on data from the SBA produces similar results. We prefer using Call Report data because we are more confident in our ability to match data on PPP activity to balance sheet data at the end of 2019. However, it is once again useful to know that our findings regarding the effect of the PPPLF on the amount of PPP loans on banks’ books also applies to the originations of PPP loans.
18
our estimates from both models suggest that our instrumental variable is strong enough to overcome any residual endogeneity concerns.
The other coefficients are generally in line with our expectations. In our OLS specification, we find some support for the idea that the liability structure of the banks mattered for PPP participation. Banks that funded their assets to a greater extent with core deposits tended to have more PPP loans; this result is in line with other research on the PPP (such as Li and Strahan (2020)) and with the benefits of core deposit funding more generally (Berlin and Mester (1999); Cornett et. al (2011)). This effect is economically modest but still meaningful; a one standard deviation increase in the ratio of core deposits to total assets boosted the ratio of PPP loans to total loans by 0.1 percentage points. We do not find a relationship between use of large time deposits or being an FHLB borrower and PPP lending.
In our IV specification, we include the control variables describing the liability structure of the bank in our first-stage regression. Core deposits, large time deposits, being an FHLB borrower, and deposit funding costs likely have a more direct effect on whether the bank became a PPPLF borrower, rather than the amount of PPP loans outstanding.25
The idea that providing banks with longer-term low-cost funding supports their lending is in line with work on the effect of Federal Reserve lending programs for banks in the financial crisis of 2008. For instance, Berger, Black, Bouwman and Dlugosz, (2017) study the provision of liquidity to banks using the Term Auction Facility (or TAF) which auctioned discount window funding for periods of up to 84 days in amounts large enough that the auction price was fairly low. They also find that this liquidity provision tool was quite valuable in supporting bank lending including small business lending at smaller banks.
Additionally, we find that, all else equal, banks that had more unused C&I loan commitments relative to their total C&I loan exposures (commitments plus loans on the balance sheet) at the end of 2019 also tended to make more PPP loans relative to their total assets; this result is in line with Li and Strahan (2020). We also find that banks that had more liquid assets made more PPP loans. This result is consistent with Cornett et. al. (2011) and Li, Strahan, and Zhang (2020) as well as with the idea that the liquidity of banks may have played some role in making PPP loans as banks. Curiously, we do not find a relationship between the extent to which a bank’s C&I loans consisted of small business loans at the end of 2019 and their PPP lending.
25 Including core deposits, large time deposits, deposit funding costs, and being an FHLB borrower in the second stage of the IV specification indicates a larger causal impact of the PPPLF bolstering PPP lending (the coefficient on “PPPLF Borrower” is larger). We therefore include these funding control variables in the first stage because we believe it is a more conservative approach.
19
5.3 Comparisons by bank size
We repeat our IV regressions for banks of different sizes to better understand the relationship between bank size and the impact of the PPPLF. We focus on all community banks, large community banks, and small community banks as we are most interested in their behavior.
As shown in Table 9, we find a strong and significant effect of use of the PPPLF in boosting the PPP lending by smaller community banks. The coefficient in column 3 of the table is quite a bit larger than the one for all community banks (column 1), and for the IV regression using all banks (Table 8, column 2). The larger size of the coefficient is consistent with the larger difference in PPP loans to assets between PPPLF borrowers and non-borrowers in Table 1, and this result points to the importance of these banks in generating our overall result. The coefficient in the regression using larger community banks is positive but not significant; recall from Table 2 that our measure of familiarity was not strongly associated with PPPLF usage for these banks.
In general, the relationships between the control variables and PPP lending are similar to those for the whole sample. Banks that had more unused C&I loan commitment relative to total C&I exposures and that had more liquid assets tended to make more PPP loans. Having more core deposits is associated with borrowing from the PPPLF by larger community banks; the coefficient is positive for smaller community banks but is not significant.
Next, we turn to our additional analysis that examines how banks’ preparedness to use the facility, rather than actual usage, affected PPP lending. As noted in Section 4.2, preparedness to use the PPPLF may reflect its value as a backstop facility. The results of this analysis are reported in Table 10. (We again limit the analysis to community banks.) From the first row of the table, we see that having borrowing documents in place boosts PPP lending. In columns 1 and 3, the effect is about as much as with using the PPPLF. As having documents in place is a pre-requisite to borrowing, we interpret this result—especially for small community banks—as suggesting there is only a minimal, if any, additional impact from the potential to borrow relative to actual borrowing.
The results for large community banks are shown in column 2. Here we find an effect on PPP lending from having document in place. The coefficient on “Has PPPLF docs in place” indicates that large community banks increased their PPP lending by 3.4 percentage points relative to other large community banks that did not have their documents in place. Recall that in Table 9 we had not found an effect from actual borrowing. Moreover, from Tables 5 and 6, familiarity with discount window operations was more strongly associated with whether large community banks had their PPPLF documents on file versus whether they borrowed from the facility. These results suggest that, for large banks it was the availability of the PPPLF as a backstop source of funding that mattered. Indeed, based on our estimated coefficient along with the assets as of December 2019 for 1,009 large community banks, a back-of-the-envelope calculation suggests that, all else equal, these banks extended $15 billion more PPP loans because of the presence of the facility.
20
6. Conclusion
In this paper, we study the PPPLF and whether it had an impact on bank PPP lending. We start by looking at the factors associated with facility usage among banks that participated in the PPP program. We find that prior familiarity with the discount window, such as going through the process of pledging loan collateral, is strongly predictive of whether the bank used the PPPLF. This is true even after accounting for the other factors associated with an increased likelihood of using the PPPLF such as whether the bank had recently borrowed from an FHLB, the dependence on core funding versus wholesale funding, and the average rate the bank paid on its deposit liabilities. Moreover, being familiar with the process of pledging loan collateral appears to have encouraged banks to take steps to be ready to use the PPPLF as indicated by their completion of the paperwork to enable borrowing.
Familiarity with the discount window thus serves as a useful instrument that helps us determine whether the PPPLF bolstered bank PPP lending or whether the facility was simply a relatively cheap source of funding to which banks turned. Using this instrumental variable approach, we find that PPPLF had a statistically and economically significant impact on PPP lending by banks. These results support the idea that the boost in PPP lending activity at banks that used the PPPLF was importantly enabled by the PPPLF. We find that use of the facility was particularly important in boosting the PPP lending of smaller community banks, those with assets of $600 million or less. For large community banks, our results suggest that it was the availability of backstop funding provided by the facility that had a greater effect on boosting their lending. Thus, the PPPLF appears to have bolstered bank PPP lending through two channels: providing low-cost term funding and providing reassurance that funding would be available if it were needed.

21
References
Autor, David, David Cho, Leland D. Crane, Mita Goldar, Byron Lutz, Joshua Montes, William B. Peterman, David Ratner, Daniel Villar, and Ahu Yildirmaz (2020). “An Evaluation of the Paycheck Protection Program Using Administrative Payroll Microdata,” Working Paper, MIT.
Ashcraft, Adam, Morten L. Bech, and W. Scott Frame (2010). “The Federal Home Loan Bank System: The Lender of Next-to-Last Resort?” Journal of Money, Credit, and Banking, vol. 42(4), pp. 551-583.
Bartik, Alexander W., Zoe B. Cullen, Edward L. Glaeser, Michael Luca, Christopher T. Stanton, and Adi Sunderam (2020). “The Targeting and Impact of Paycheck Protection Program Loans to Small Businesses,” NBER Working Paper Series, 27623.
Beauregard, Remy, Jose A. Lopez, and Mark M. Spiegel (2020). “Small Business Lending During COVID-19,” FRBSF Economic Letter, 2020-35.
Berger, Allen, Lamont Black, Christa Bouwman, and Jennifer Dlugosz (2017). “Bank Loan Supply Responses to Federal Reserve Emergency Liquidity Facilities,” Journal of Financial Intermediation, vol. 32, pp. 1-15.
Berger, Allen and Udell, Gregory, 1995 “Relationship lending and lines of credit in small firm finance,” Journal of Business vol. 68, pp. 351-82
Berlin, Mitchell and Loretta J. Mester, 1999, “Deposits and Relationship Lending,” Review of Financial Studies vol. 12(3), pp. 579-607.
Carlson, Mark, Hui Shan, and Missaka Warusawitharana (2013). “Capital Ratios and Bank Lending: A Matched Bank Approach,” Journal of Financial Intermediation, vol. 22(4).
Chetty, Raj, John N Friedman, Nathaniel Hendren, Michael Stepner, and The Opportunity Insights Team (2020) “How Did COVID-19 and Stabilization Policies Affect Spending and Employment? A New Real-Time Economic Tracker Based on Private Sector Data,” NBER Working Paper, 27431.
Cornett, Marcia Millon, Jamie John McNutt, Philip Strahan, and Hassan Tehranian (2011). “Liquidity Risk Management and Credit Supply in the Financial Crisis,” Journal of Financial Economics, vol. 101(2), pp. 297-312.
Davidson, Travis and W. Gary Simpson (2016). “Federal Home Loan Bank Advances and Small Business Lending,” Journal of Entrepreneurial Finance, vol. 18(1), pp. 1-21.
Doniger, Cynthia and Benjamin Kay (2021). “Ten Days Late and Billions of Dollars Short: The Employment Effects of Delays in Paycheck Protection Program Financing,” Finance and Economics Discussion Series 2021-003. Washington: Board of Governors of the Federal Reserve System, https://doi.org/10.17016/FEDS.2021.003
22
Erel, Isil and Jack Liebersohn (2020). “Does FinTech Substitute for Banks? Evidence from the Paycheck Protection Program,” NBER Working Paper, 27659.
Gambacorta, Leonardo and Paulo Mistrulli (2004). “Does Bank Capital Affect Lending Behavior?” Journal of Financial Intermediation, vol. 13(4), pp. 436-457.
Glancy, David, Max Gross, and Felicia Ionescu (2020). “How Did Banks Fund C&I Drawdowns at the Onset of the Covid-19 Crisis?,” FEDS Notes. Washington: Board of Governors of the Federal Reserve System, July 31, https://doi.org/10.17016/2380-7172.2601.
Granja, Joao, Christos Makridis, Constantine Yannelis, and Eric Zwick (2020). “Did the Paycheck Protection Program Hit the Target?” NBER Working Paper, 27095.
Hubbard, R. Glenn and Michael Strain (2020). “Has the Paycheck Protection Program Succeeded,” NBER Working Paper, 28032.
Humphries, John Eric, Christopher A Neilson, and Gabriel Ulyssea (2020). “Information frictions and access to the Paycheck Protection Program.” Journal of Public Economics, vol. 190, Article 104244.
James, Christopher, Jing Lu, and Yangfan Sun (2021). “Time is Money: Real Effects of Relationship Lending: Evidence form Community Bank Lending in the Paycheck Protection Program,” unpublished mimeo, Available at SSRN: https://ssrn.com/abstract=3633339 or http://dx.doi.org/10.2139/ssrn.3633339
Kapan, Tümer and Camelia Minoiu (2018). “Balance Sheet Strength and Bank Lending: Evidence from the Global Financial Crisis,” Journal of Banking and Finance, vol. 92, pp. 35-50.
Li, Lei and Philip Strahan (2020). “Who Supplies PPP Loans (and Does It Matter)? Banks, Relationships, and the Covid Crisis,” unpublished mimeo.
Li, Lei, Philip Strahan, and Song Zhang (2020). “Banks as Lenders of First Resort: Evidence from the Covid-19 Crisis,” NBER Working Paper, 27256.
Lopez, Jose A., and Mark M. Spiegel (2021). “Small Business Lending Under the PPP and PPPLF Covid-Related Government Programs,” Federal Reserve Bank of San Francisco Working Paper, 2021-10.
Rice, Tara and Jonathan Rose (2016). “When good investments go bad: The contraction in community bank lending after the 2008 GSE takeover,” Journal of Financial Intermediation, vol. 27, pp. 68-88.
Tables
Table 1: Summary Statistics on Banks that used the PPP and PPPLF Programs
N Mean Std. Dev. p25 p50 p75Panel A: All BanksBorrowed from PPPLF
PPP loans / Assets 743 0.17 0.31 0.06 0.10 0.18PPP loans / Assets, Adjusted 743 0.11 0.06 0.06 0.10 0.18Share of PPP loans pledged to PPPLF 743 0.51 0.37 0.14 0.48 0.93
Did not borrow from PPPLFPPP loans / Assets 3482 0.06 0.06 0.02 0.04 0.07PPP loans / Assets, Adjusted 3482 0.05 0.04 0.02 0.04 0.07Share of PPP loans pledged to PPPLF 3482 0 0 0 0 0
Panel B: Community BanksBorrowed from PPPLF
PPP loans / Assets 704 0.18 0.32 0.06 0.10 0.18PPP loans / Assets, Adjusted 704 0.12 0.06 0.06 0.10 0.18Share of PPP loans pledged to PPPLF 704 0.52 0.37 0.15 0.50 0.93
Did not borrow from PPPLFPPP loans / Assets 3407 0.06 0.06 0.02 0.04 0.07PPP loans / Assets, Adjusted 3407 0.05 0.04 0.02 0.04 0.07Share of PPP loans pledged to PPPLF 3407 0 0 0 0 0
Source: Federal Reserve Bank of Minneapolis, Paycheck Protection Program Lending Facilities Data and
FFIEC Call Reports. This table presents summary statistics about banks that used the PPP or PPPLF.
Panel A presents all 4,225 banks with PPP loans outstanding as of June 30, 2020. Panel B includes all
“Community Banks”, those with assets less than or equal to $10 billion. PPP loans are in millions of dollars.
“PPP loans/Assets” is the ratio of PPP loans outstanding divided by assets as of December 31, 2019; “PPP
loans/Assets, Adjusted” is PPP loans/Assets ratio winsorized at the 5 percent level. Data for the PPPLF
cover the period April 16, 2020 to June 30, 2020.
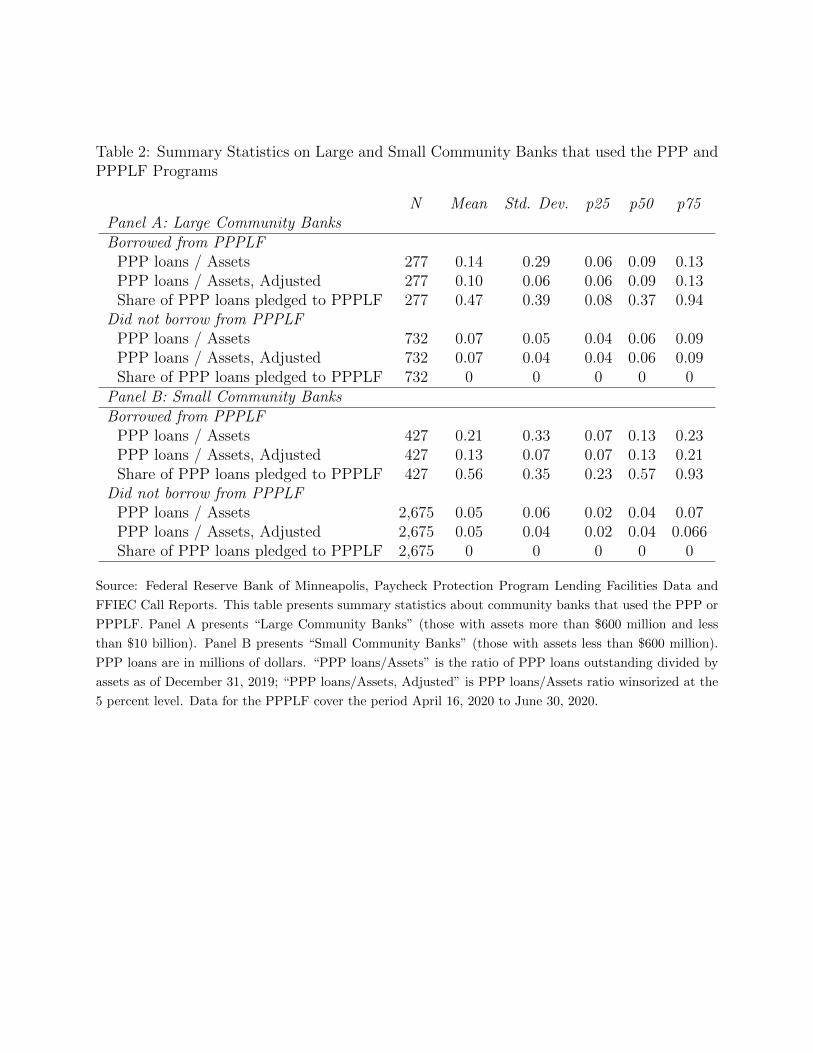
Table 2: Summary Statistics on Large and Small Community Banks that used the PPP andPPPLF Programs
N Mean Std. Dev. p25 p50 p75Panel A: Large Community BanksBorrowed from PPPLF
PPP loans / Assets 277 0.14 0.29 0.06 0.09 0.13PPP loans / Assets, Adjusted 277 0.10 0.06 0.06 0.09 0.13Share of PPP loans pledged to PPPLF 277 0.47 0.39 0.08 0.37 0.94
Did not borrow from PPPLFPPP loans / Assets 732 0.07 0.05 0.04 0.06 0.09PPP loans / Assets, Adjusted 732 0.07 0.04 0.04 0.06 0.09Share of PPP loans pledged to PPPLF 732 0 0 0 0 0
Panel B: Small Community BanksBorrowed from PPPLF
PPP loans / Assets 427 0.21 0.33 0.07 0.13 0.23PPP loans / Assets, Adjusted 427 0.13 0.07 0.07 0.13 0.21Share of PPP loans pledged to PPPLF 427 0.56 0.35 0.23 0.57 0.93
Did not borrow from PPPLFPPP loans / Assets 2,675 0.05 0.06 0.02 0.04 0.07PPP loans / Assets, Adjusted 2,675 0.05 0.04 0.02 0.04 0.066Share of PPP loans pledged to PPPLF 2,675 0 0 0 0 0
Source: Federal Reserve Bank of Minneapolis, Paycheck Protection Program Lending Facilities Data and
FFIEC Call Reports. This table presents summary statistics about community banks that used the PPP or
PPPLF. Panel A presents “Large Community Banks” (those with assets more than $600 million and less
than $10 billion). Panel B presents “Small Community Banks” (those with assets less than $600 million).
PPP loans are in millions of dollars. “PPP loans/Assets” is the ratio of PPP loans outstanding divided by
assets as of December 31, 2019; “PPP loans/Assets, Adjusted” is PPP loans/Assets ratio winsorized at the
5 percent level. Data for the PPPLF cover the period April 16, 2020 to June 30, 2020.

Table 3: Summary Statistics on Bank Balance Sheet Characteristics
N Mean Std. Dev. p25 p50 p75All Banks
Log of Assets 4,225 5.79 1.42 4.87 5.62 6.48Unused C&I / Total C&I 4,225 0.15 0.10 0.07 0.14 0.21Small Business C&I / Total C&I 4,225 0.63 0.29 0.43 0.66 0.89Liquid Assets / Assets 4,225 0.10 0.10 0.04 0.07 0.13Core deposits / Assets 4,225 0.69 0.11 0.64 0.71 0.77Large time deposits / Assets 4,225 0.14 0.09 0.08 0.13 0.19Deposit funding costs 4,225 -0.004 0.12 -0.09 -0.013 0.064FHLB borrower 4,225 0.56 0.50 0.00 1.00 1.00T1 Capital Ratio 4,225 0.18 0.20 0.13 0.15 0.19
Large Community BanksLog of Assets 1,009 7.25 0.68 6.72 7.07 7.62Unused C&I / Total C&I 1,009 0.19 0.10 0.12 0.18 0.24Small Business C&I / Total C&I 1,009 0.47 0.22 0.30 0.46 0.61Liquid Assets / Assets 1,009 0.07 0.06 0.03 0.05 0.09Core deposits / Assets 1,009 0.69 0.11 0.64 0.71 0.76Large time deposits / Assets 1,009 0.13 0.09 0.07 0.12 0.17Deposit funding costs 1,009 0.001 0.118 -0.081 -0.011 0.070FHLB borrower 1,009 0.72 0.45 0.00 1.00 1.00T1 Capital Ratio 1,009 0.14 0.05 0.12 0.13 0.15
Small Community BanksLog of Assets 3,102 5.15 0.76 4.65 5.22 5.75Unused C&I / Total C&I 3,102 0.13 0.10 0.06 0.12 0.19Small Business C&I / Total C&I 3.102 0.70 0.28 0.55 0.76 0.97Liquid Assets / Assets 3,102 0.11 0.10 0.04 0.08 0.14Core deposits / Assets 3.102 0.69 0.11 0.63 0.71 0.77Large time deposits / Assets 3,102 0.15 0.09 0.08 0.13 0.19Deposit funding costs 3,102 -0.004 0.116 -0.086 -0.011 0.064FHLB borrower 3,102 0.49 0.50 0.00 0.00 1.00T1 Capital Ratio 3,102 0.19 0.23 0.13 0.16 0.20
Source: Federal Reserve Bank of Minneapolis, Paycheck Protection Program Lending Facilities Data and
FFIEC Call Reports. This table presents summary statistics on banks from their December 31, 2019 Call
Report. “Large Community Banks” are banks with assets greater than $600 million and less than $10
billion. “Small Community Banks” are banks with assets less than $600 million. We calculate “Deposit
funding costs” as a bank’s interest expenses divided by their average deposit levels (both numbers retrieved
from the bank’s Call Report) minus the average ratio of the other 4,225 banks.
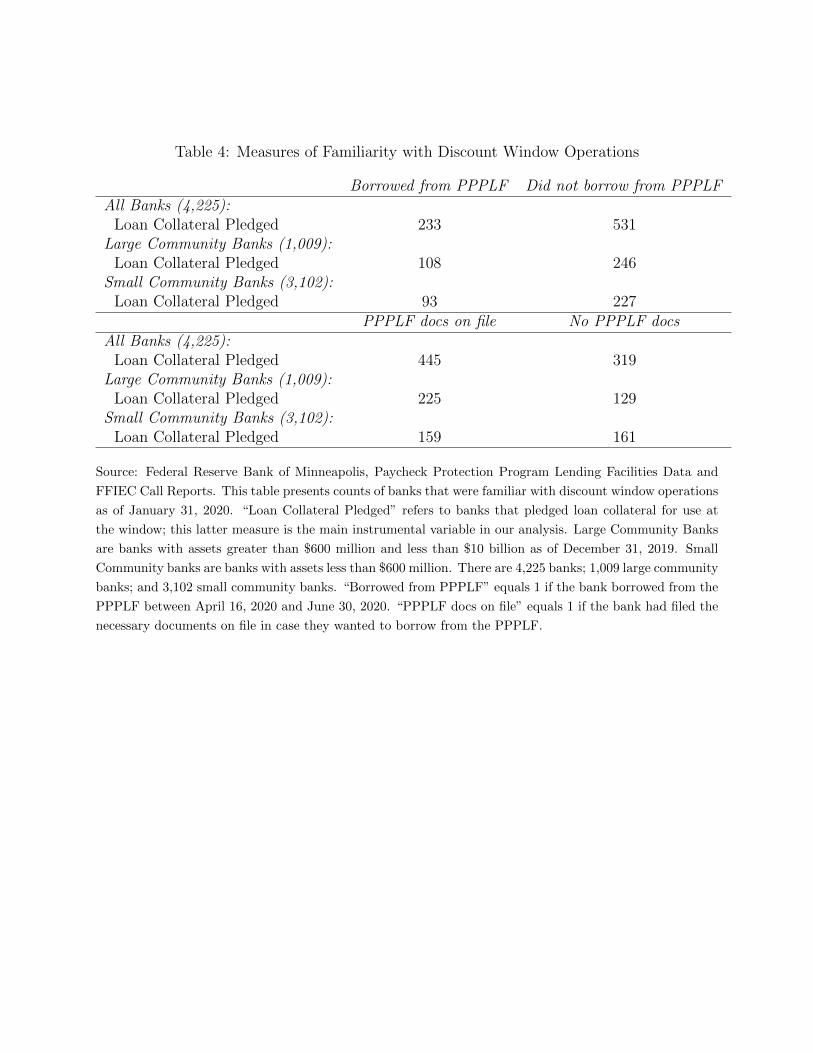
Table 4: Measures of Familiarity with Discount Window Operations
Borrowed from PPPLF Did not borrow from PPPLFAll Banks (4,225):
Loan Collateral Pledged 233 531Large Community Banks (1,009):
Loan Collateral Pledged 108 246Small Community Banks (3,102):
Loan Collateral Pledged 93 227PPPLF docs on file No PPPLF docs
All Banks (4,225):Loan Collateral Pledged 445 319
Large Community Banks (1,009):Loan Collateral Pledged 225 129
Small Community Banks (3,102):Loan Collateral Pledged 159 161
Source: Federal Reserve Bank of Minneapolis, Paycheck Protection Program Lending Facilities Data and
FFIEC Call Reports. This table presents counts of banks that were familiar with discount window operations
as of January 31, 2020. “Loan Collateral Pledged” refers to banks that pledged loan collateral for use at
the window; this latter measure is the main instrumental variable in our analysis. Large Community Banks
are banks with assets greater than $600 million and less than $10 billion as of December 31, 2019. Small
Community banks are banks with assets less than $600 million. There are 4,225 banks; 1,009 large community
banks; and 3,102 small community banks. “Borrowed from PPPLF” equals 1 if the bank borrowed from the
PPPLF between April 16, 2020 and June 30, 2020. “PPPLF docs on file” equals 1 if the bank had filed the
necessary documents on file in case they wanted to borrow from the PPPLF.
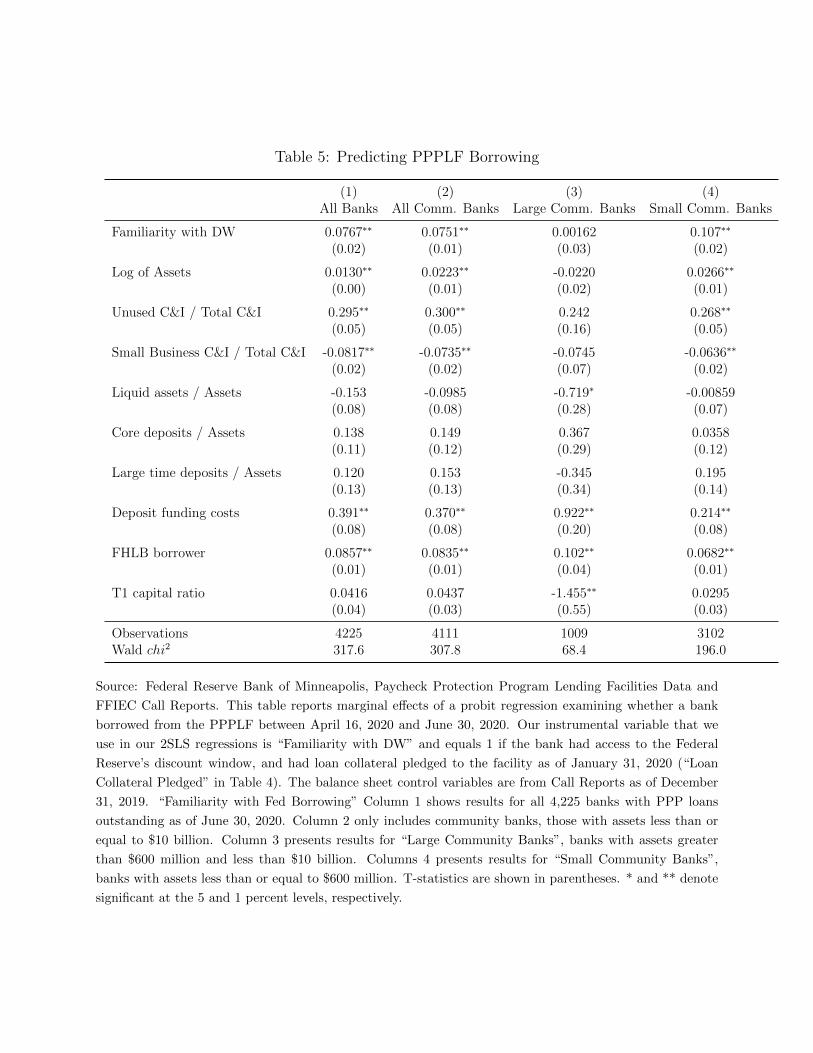
Table 5: Predicting PPPLF Borrowing
(1) (2) (3) (4)All Banks All Comm. Banks Large Comm. Banks Small Comm. Banks
Familiarity with DW 0.0767∗∗ 0.0751∗∗ 0.00162 0.107∗∗
(0.02) (0.01) (0.03) (0.02)
Log of Assets 0.0130∗∗ 0.0223∗∗ -0.0220 0.0266∗∗
(0.00) (0.01) (0.02) (0.01)
Unused C&I / Total C&I 0.295∗∗ 0.300∗∗ 0.242 0.268∗∗
(0.05) (0.05) (0.16) (0.05)
Small Business C&I / Total C&I -0.0817∗∗ -0.0735∗∗ -0.0745 -0.0636∗∗
(0.02) (0.02) (0.07) (0.02)
Liquid assets / Assets -0.153 -0.0985 -0.719∗ -0.00859(0.08) (0.08) (0.28) (0.07)
Core deposits / Assets 0.138 0.149 0.367 0.0358(0.11) (0.12) (0.29) (0.12)
Large time deposits / Assets 0.120 0.153 -0.345 0.195(0.13) (0.13) (0.34) (0.14)
Deposit funding costs 0.391∗∗ 0.370∗∗ 0.922∗∗ 0.214∗∗
(0.08) (0.08) (0.20) (0.08)
FHLB borrower 0.0857∗∗ 0.0835∗∗ 0.102∗∗ 0.0682∗∗
(0.01) (0.01) (0.04) (0.01)
T1 capital ratio 0.0416 0.0437 -1.455∗∗ 0.0295(0.04) (0.03) (0.55) (0.03)
Observations 4225 4111 1009 3102Wald chi2 317.6 307.8 68.4 196.0
Source: Federal Reserve Bank of Minneapolis, Paycheck Protection Program Lending Facilities Data and
FFIEC Call Reports. This table reports marginal effects of a probit regression examining whether a bank
borrowed from the PPPLF between April 16, 2020 and June 30, 2020. Our instrumental variable that we
use in our 2SLS regressions is “Familiarity with DW” and equals 1 if the bank had access to the Federal
Reserve’s discount window, and had loan collateral pledged to the facility as of January 31, 2020 (“Loan
Collateral Pledged” in Table 4). The balance sheet control variables are from Call Reports as of December
31, 2019. “Familiarity with Fed Borrowing” Column 1 shows results for all 4,225 banks with PPP loans
outstanding as of June 30, 2020. Column 2 only includes community banks, those with assets less than or
equal to $10 billion. Column 3 presents results for “Large Community Banks”, banks with assets greater
than $600 million and less than $10 billion. Columns 4 presents results for “Small Community Banks”,
banks with assets less than or equal to $600 million. T-statistics are shown in parentheses. * and ** denote
significant at the 5 and 1 percent levels, respectively.

Table 6: Predicting PPPLF Documents on File
(1) (2) (3) (4)All Banks All Comm. Banks Large Comm. Banks Small Comm. Banks
Familiarity with DW 0.158∗∗ 0.155∗∗ 0.0909∗∗ 0.107∗∗
(0.02) (0.02) (0.04) (0.02)
Log of Assets 0.0568∗∗ 0.0825∗∗ 0.0212 0.0266∗∗
(0.01) (0.01) (0.03) (0.01)
Unused C&I / Total C&I 0.600∗∗ 0.593∗∗ 0.312 0.268∗∗
(0.08) (0.08) (0.19) (0.05)
Small Business C&I / Total C&I -0.0469 -0.0350 -0.153 -0.0636∗∗
(0.03) (0.03) (0.09) (0.02)
Liquid assets / Assets -0.300∗∗ -0.189 -1.170∗∗ -0.00859(0.11) (0.11) (0.31) (0.07)
Core deposits / Assets 0.479∗∗ 0.436∗∗ 0.728∗ 0.0358(0.16) (0.16) (0.35) (0.12)
Large time deposits / Assets 0.403∗ 0.364 -0.178 0.195(0.19) (0.19) (0.40) (0.14)
Deposit funding costs 0.384∗∗ 0.383∗∗ 0.645∗∗ 0.214∗∗
(0.10) (0.10) (0.22) (0.08)
FHLB borrower 0.127∗∗ 0.120∗∗ 0.137∗∗ 0.0682∗∗
(0.02) (0.02) (0.04) (0.01)
T1 capital ratio 0.123∗ 0.119∗ -2.405∗∗ 0.0295(0.05) (0.05) (0.60) (0.03)
Observations 4225 4111 1009 3102Wald chi2 470.7 515.7 118.5 196.0
Source: Federal Reserve Bank of Minneapolis, Paycheck Protection Program Lending Facilities Data and
FFIEC Call Reports. This table reports marginal effects of a probit regression examining whether a bank
had PPPLF documents on file between April 16, 2020 and June 30, 2020. Our instrumental variable that
we use in our 2SLS regressions is “Familiarity with DW” and equals 1 if the bank had access to the Federal
Reserve’s discount window, and had loan collateral pledged to the facility as of January 31, 2020 (“Loan
Collateral Pledged” in Table 4). The balance sheet control variables are from Call Reports as of December
31, 2019. Column 1 shows results for all 4,225 banks with PPP loans outstanding as of June 30, 2020.
Column 2 only includes community banks, those with assets less than or equal to $10 billion. Column 3
presents results for “Large Community Banks”, banks with assets greater than $600 million and less than
$10 billion. Columns 4 presents results for “Small Community Banks”, banks with assets less than or equal
to $600 million. T-statistics are shown in parentheses. * and ** denote significant at the 5 and 1 percent
levels, respectively.

Table 7: Time to First PPPLF Loan
(1) (2) (3) (4)All Banks All Comm. Banks Large Comm. Banks Small Comm. Banks
Analysis time when record endsFamiliarity with DW 1.589∗∗ 1.560∗∗ 1.017 2.271∗∗
(0.14) (0.14) (0.13) (0.27)
Log of Assets 1.062 1.151∗∗ 0.876 1.261∗∗
(0.03) (0.05) (0.09) (0.10)
Unused C&I / Total C&I 6.557∗∗ 7.450∗∗ 3.269 8.740∗∗
(2.29) (2.66) (2.26) (3.75)
Small Business C&I / Total C&I 0.584∗∗ 0.618∗∗ 0.688 0.604∗∗
(0.09) (0.09) (0.22) (0.11)
Liquid assets / Assets 0.284∗ 0.450 0.0491∗ 0.870(0.16) (0.26) (0.07) (0.55)
Core deposits / Assets 2.311 2.798 3.774 1.524(1.78) (2.22) (4.91) (1.48)
Large time deposits / Assets 2.253 3.162 0.185 7.211(1.99) (2.87) (0.28) (8.06)
Deposit funding costs 14.01∗∗ 13.49∗∗ 57.51∗∗ 6.043∗∗
(6.64) (6.63) (45.68) (3.83)
FHLB borrower 1.795∗∗ 1.793∗∗ 1.566∗ 1.779∗∗
(0.18) (0.18) (0.28) (0.21)
T1 capital ratio 0.865 1.047 0.000818∗∗ 1.209(0.58) (0.55) (0.00) (0.32)
Observations 4225 4111 1009 3102LR chi2 350.0 340.6 85.6 222.0
Exponentiated coefficients; Standard errors in parentheses∗ p < 0.05, ∗∗ p < 0.01
Source: Federal Reserve Bank of Minneapolis, Paycheck Protection Program Lending Facilities Data and
FFIEC Call Reports. This table reports time ratios from a survival analysis regression that examines the
amount of time a bank takes to borrow their first PPPLF loan. The dependent variable is the number of
days until a bank accessed the PPPLF. Observations are censored at June 30, 2020, the last day of our
sample period, meaning if the bank did not borrow from the PPPLF, the dependent variable for that bank
equals 75 calendar days (the first day the PPPLF originated loans was April 16, 2020). The instrumental
variable that we use in our 2SLS regressions is “Familiarity with DW” and equals 1 if the bank had access
to the Federal Reserve’s discount window, and had loan collateral pledged to the facility as of January 31,
2020 (“Loan Collateral Pledged” in Table 4). The balance sheet control variables are from Call Reports as of
December 31, 2019. Column 1 shows results for all 4,225 banks with PPP loans outstanding as of June 30,
2020. Column 2 only includes community banks, those with assets less than or equal to $10 billion. Column
3 presents results for “Large Community Banks”, banks with assets greater than $600 million and less than
$10 billion. Columns 4 presents results for “Small Community Banks”, banks with assets less than or equal
to $600 million. T-statistics are shown in parentheses. * and ** denote significant at the 5 and 1 percent
levels, respectively.
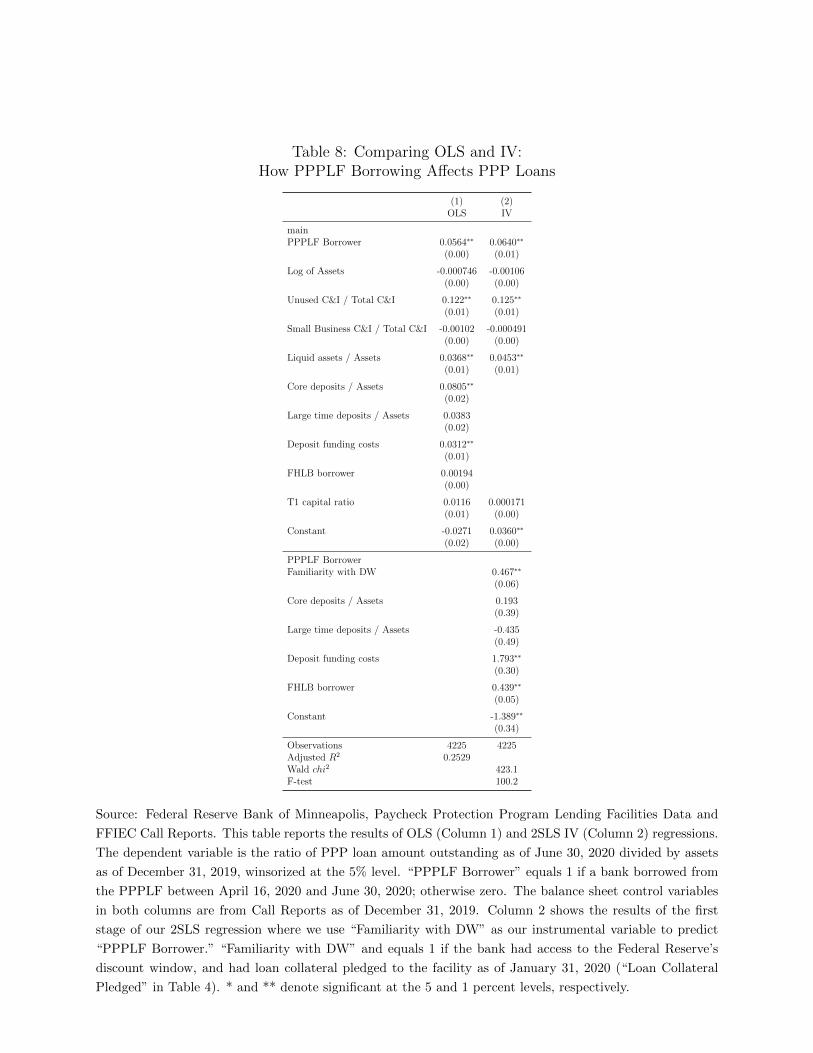
Table 8: Comparing OLS and IV:How PPPLF Borrowing Affects PPP Loans
(1) (2)OLS IV
mainPPPLF Borrower 0.0564∗∗ 0.0640∗∗
(0.00) (0.01)
Log of Assets -0.000746 -0.00106(0.00) (0.00)
Unused C&I / Total C&I 0.122∗∗ 0.125∗∗
(0.01) (0.01)
Small Business C&I / Total C&I -0.00102 -0.000491(0.00) (0.00)
Liquid assets / Assets 0.0368∗∗ 0.0453∗∗
(0.01) (0.01)
Core deposits / Assets 0.0805∗∗
(0.02)
Large time deposits / Assets 0.0383(0.02)
Deposit funding costs 0.0312∗∗
(0.01)
FHLB borrower 0.00194(0.00)
T1 capital ratio 0.0116 0.000171(0.01) (0.00)
Constant -0.0271 0.0360∗∗
(0.02) (0.00)
PPPLF BorrowerFamiliarity with DW 0.467∗∗
(0.06)
Core deposits / Assets 0.193(0.39)
Large time deposits / Assets -0.435(0.49)
Deposit funding costs 1.793∗∗
(0.30)
FHLB borrower 0.439∗∗
(0.05)
Constant -1.389∗∗
(0.34)
Observations 4225 4225Adjusted R2 0.2529Wald chi2 423.1F-test 100.2
Source: Federal Reserve Bank of Minneapolis, Paycheck Protection Program Lending Facilities Data and
FFIEC Call Reports. This table reports the results of OLS (Column 1) and 2SLS IV (Column 2) regressions.
The dependent variable is the ratio of PPP loan amount outstanding as of June 30, 2020 divided by assets
as of December 31, 2019, winsorized at the 5% level. “PPPLF Borrower” equals 1 if a bank borrowed from
the PPPLF between April 16, 2020 and June 30, 2020; otherwise zero. The balance sheet control variables
in both columns are from Call Reports as of December 31, 2019. Column 2 shows the results of the first
stage of our 2SLS regression where we use “Familiarity with DW” as our instrumental variable to predict
“PPPLF Borrower.” “Familiarity with DW” and equals 1 if the bank had access to the Federal Reserve’s
discount window, and had loan collateral pledged to the facility as of January 31, 2020 (“Loan Collateral
Pledged” in Table 4). * and ** denote significant at the 5 and 1 percent levels, respectively.
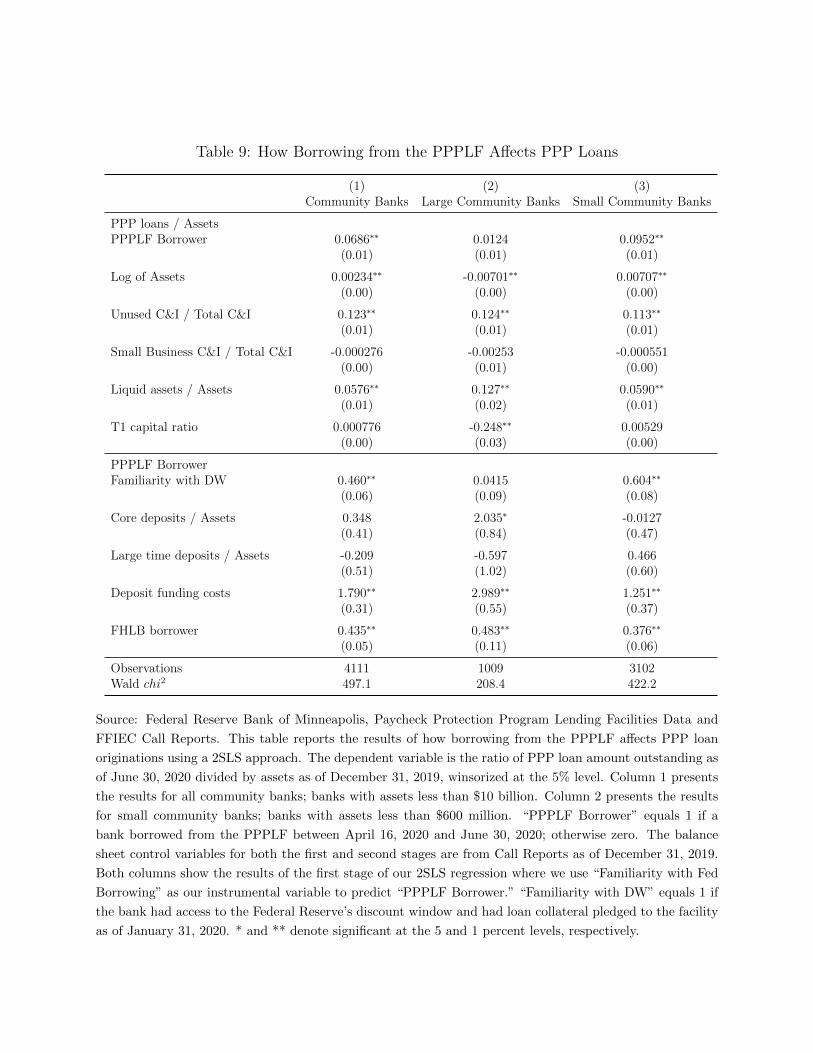
Table 9: How Borrowing from the PPPLF Affects PPP Loans
(1) (2) (3)Community Banks Large Community Banks Small Community Banks
PPP loans / AssetsPPPLF Borrower 0.0686∗∗ 0.0124 0.0952∗∗
(0.01) (0.01) (0.01)
Log of Assets 0.00234∗∗ -0.00701∗∗ 0.00707∗∗
(0.00) (0.00) (0.00)
Unused C&I / Total C&I 0.123∗∗ 0.124∗∗ 0.113∗∗
(0.01) (0.01) (0.01)
Small Business C&I / Total C&I -0.000276 -0.00253 -0.000551(0.00) (0.01) (0.00)
Liquid assets / Assets 0.0576∗∗ 0.127∗∗ 0.0590∗∗
(0.01) (0.02) (0.01)
T1 capital ratio 0.000776 -0.248∗∗ 0.00529(0.00) (0.03) (0.00)
PPPLF BorrowerFamiliarity with DW 0.460∗∗ 0.0415 0.604∗∗
(0.06) (0.09) (0.08)
Core deposits / Assets 0.348 2.035∗ -0.0127(0.41) (0.84) (0.47)
Large time deposits / Assets -0.209 -0.597 0.466(0.51) (1.02) (0.60)
Deposit funding costs 1.790∗∗ 2.989∗∗ 1.251∗∗
(0.31) (0.55) (0.37)
FHLB borrower 0.435∗∗ 0.483∗∗ 0.376∗∗
(0.05) (0.11) (0.06)
Observations 4111 1009 3102Wald chi2 497.1 208.4 422.2
Source: Federal Reserve Bank of Minneapolis, Paycheck Protection Program Lending Facilities Data and
FFIEC Call Reports. This table reports the results of how borrowing from the PPPLF affects PPP loan
originations using a 2SLS approach. The dependent variable is the ratio of PPP loan amount outstanding as
of June 30, 2020 divided by assets as of December 31, 2019, winsorized at the 5% level. Column 1 presents
the results for all community banks; banks with assets less than $10 billion. Column 2 presents the results
for small community banks; banks with assets less than $600 million. “PPPLF Borrower” equals 1 if a
bank borrowed from the PPPLF between April 16, 2020 and June 30, 2020; otherwise zero. The balance
sheet control variables for both the first and second stages are from Call Reports as of December 31, 2019.
Both columns show the results of the first stage of our 2SLS regression where we use “Familiarity with Fed
Borrowing” as our instrumental variable to predict “PPPLF Borrower.” “Familiarity with DW” equals 1 if
the bank had access to the Federal Reserve’s discount window and had loan collateral pledged to the facility
as of January 31, 2020. * and ** denote significant at the 5 and 1 percent levels, respectively.

Table 10: Regression Results by Bank Size for Banks that had PPPLF Documents on file
(1) (2) (3)Community Banks Large Community Banks Small Community Banks
PPP loans / AssetsHas PPPLF docs in place 0.0647∗∗ 0.0344∗∗ 0.0869∗∗
(0.01) (0.01) (0.01)
Log of Assets -0.000833 -0.00892∗∗ 0.00304∗∗
(0.00) (0.00) (0.00)
Unused C&I / Total C&I 0.111∗∗ 0.121∗∗ 0.100∗∗
(0.01) (0.01) (0.01)
Small Business C&I / Total C&I -0.00236 -0.00140 -0.00367(0.00) (0.01) (0.00)
Liquid assets / Assets 0.0609∗∗ 0.136∗∗ 0.0598∗∗
(0.01) (0.02) (0.01)
T1 capital ratio -0.000424 -0.212∗∗ 0.00366(0.00) (0.03) (0.00)
Has PPPLF docs in placeFamiliarity with DW 0.667∗∗ 0.312∗∗ 0.659∗∗
(0.05) (0.09) (0.08)
Core deposits / Assets 0.692∗ 2.810∗∗ 0.341(0.35) (0.78) (0.40)
Large time deposits / Assets -0.272 -0.233 0.358(0.45) (0.97) (0.52)
Deposit funding costs 1.261∗∗ 1.924∗∗ 1.042∗∗
(0.27) (0.53) (0.32)
FHLB borrower 0.470∗∗ 0.581∗∗ 0.355∗∗
(0.05) (0.10) (0.05)
Observations 4111 1009 3102Wald chi2 472.9 217.2 365.8
Source: Federal Reserve Bank of Minneapolis, Paycheck Protection Program Lending Facilities Data and
FFIEC Call Reports. This table reports the results of how having PPPLF documents on file affects PPP loan
originations using a 2SLS approach. The dependent variable is the ratio of PPP loan amount outstanding as
of June 30, 2020 divided by assets as of December 31, 2019, winsorized at the 5% level. Column 1 presents
the results for all community banks; banks with assets less than $10 billion. Column 2 presents the results
for small community banks; banks with assets less than $600 million. “Has PPPLF docs on file” equals 1 if
a bank had PPPLF documents on file, and was ready to borrow from the PPPLF between April 16, 2020
and June 30, 2020; otherwise zero. The balance sheet control variables for both the first and second stages
are from Call Reports as of December 31, 2019. Both columns show the results of the first stage of our 2SLS
regression where we use “Familiarity with DW” as our instrumental variable to predict ‘Has PPPLF docs
on file.” “Familiarity with DW” equals 1 if the bank had access to the Federal Reserve’s discount window
and had loan collateral pledged to the facility as of January 31, 2020. * and ** denote significant at the 5
and 1 percent levels, respectively.