Embed Size (px)
Citation preview
The Effect of the Unit Dose Dispensing System on Medication Preparation and
Administration Errors in Intravenous (IV) Drugs in a Chinese Hospital: Inpatient
by
Qian Ding
A dissertation submitted to the Graduate Faculty of
Auburn University
in partial fulfillment of the
requirements for the Degree of
Doctor of Philosophy
Auburn, Alabama
May 7, 2012
Keywords: intravenous, total parenteral nutrition (TPN), medication preparation and
administration errors, unit dose, inpatient
Copyright 2012 by Qian Ding
Approved by
Kenneth N. Barker, Chair, Professor Emeritus of Pharmacy Care Systems
Elizabeth A. Flynn, Affiliate Associate Research Professor of Pharmacy Care Systems
Salisa C. Westrick, Associate Professor of Pharmacy Care Systems
Kimberly Braxton-Lloyd, Associate Professor of Pharmacy Practice
Robert E. Thomas, Professor Emeritus of Industrial and Systems Engineering
ii
Abstract
Intravenous (IV) errors are considered dangerous since IV drugs usually go
directly into the patient’s vein. Chinese patients receive more than twice the IVs of all
other patients, yet the nature of “medication errors” is understudied.
The purpose was to study and test a method for reducing medication errors
involving IVs in a Chinese hospital.
The objectives were to (1) explore and measure the frequency of medication
errors and identify clues to the causes of medication errors in Chinese hospital inpatient
units, (2) identify the clinical relevance of the errors, and (3) investigate the effect of a
Unit Dose Dispensing System on medication errors involving IV drugs.
A General Surgery Patient Ward in a tertiary hospital with more than 1,300 beds
in Beijing was selected as a convenience sample. An exploratory study was conducted for
4 weeks. Then a Cluster Randomized Trial design was used for an explanatory study of
the effect of installing a Unit Dose Dispensing System. The patients’ doses for the two
units on the study ward were randomly assigned to the Control group or the Experimental
group by flipping a coin.
The direct observation method was used on the day shift from 8 AM to 3 PM to
detect medication errors. The preparation and administration processes for Total
Parenteral Nutrition (TPN) doses were directly observed by the Principal Investigator for
10 consecutive days for each group, both before and after the Unit Dose Dispensing
iii
System was installed in the Experimental group. An Analysis of Covariance (ANCOVA)
showed a statistically significant effect on reducing overall medication error rates (F1,17 =
19.77, P = 0.0004), wrong dose error rates (F1,17 = 12.37, P = 0.0026), and omission error
rates (F1,17 = 5.52, P = 0.03).
The Unit Dose Dispensing System produced a significantly higher accuracy in the
preparation and administration of TPN doses.

iv
Acknowledgments
The author is thankful for all the professors and persons who have provided help
and suggestions during the doctoral study years in the Department of Pharmacy Care
Systems at the Auburn University Harrison School of Pharmacy.
This dissertation would not be finished without the superior direction of Dr.
Kenneth Barker, my advisor. Great appreciation is expressed to Dr. Elizabeth Flynn for
the observational training and the suggestions on the data collections. Appreciation is
also expressed to Dr. Salisa Westrick on the suggestions of power analysis, Dr. Jan
Kavookjian on the Cochrane Literature Review, and Dr. Brent Fox on the suggestions of
automation and technologies in IV medication preparation. The author is also thankful for
the financial support during the data collection granted by the Department of Pharmacy
Care Systems.
The statistical advice from Mr. Hao Li, a graduate student in the Department of
Statistics and Dr. Margaret Ross, a professor in the Department of Education of
Foundation is gratefully recognized.
The author appreciated the extra time spent by my committee members (Dr.
Kenneth Barker, Dr. Elizabeth Flynn, Dr. Salisa Westrick, Dr. Kimberly Braxton-Lloyd,
and Dr. Robert Thomas) and the University Reader Dr. Richard Sesek in reviewing each
page and supplementing their corrections with constructive suggestions which
v
demonstrated ways to improve the quality of the dissertation. Thank you to each faculty
in this team, with all my heart!
The accomplishment of this dissertation is a gift for my grandmother, Xiuying
Yuan, who passed away ten years ago. I love you and miss you for ever.
The financial and spiritual support from my family: Yanhao Ding (father), Yaping
Li (mother), Yuzhou Ding (grandfather), Zhen Li (husband), and Qingyao Li (son)
throughout the whole doctoral study years were precious and invaluable to me.
vi
Table of Contents
Abstract ............................................................................................................................... ii
Acknowledgments.............................................................................................................. iv
List of Tables ................................................................................................................... xiii
List of Figures .................................................................................................................. xvi
List of Abbreviations ..................................................................................................... xviii
Chapter 1: Introduction ........................................................................................................1
General Problem ......................................................................................................1
Significance..............................................................................................................5
Scope ........................................................................................................................6
Chapter 2: Statement of the Problem ...................................................................................8
Study Objectives ......................................................................................................8
Research Questions ..................................................................................................8
Research Hypotheses ...............................................................................................9
Concepts ...................................................................................................................9
Operational Definitions ..........................................................................................13
Chapter 3: Literature Review .............................................................................................18
The Medication Use System in Inpatient Units in Hospitals .................................19
System, Medication Use System, and System Safety ................................19
Drug Distribution System in Hospitals ......................................................21

vii
Floor Stock System ........................................................................22
Patient Prescription System ...........................................................22
Unit Dose Dispensing System .......................................................23
The Unit Dose Concept in Medication Use Systems .............................................24
Centralized Unit Dose Dispensing System (CUDD) .................................24
Exploratory Study ..........................................................................24
Explanatory Study ..........................................................................27
Decentralized Unit Dose Dispensing .........................................................29
Operational Definitions: Differences .............................................29
Subsequent Studies of the Unit Dose Dispensing System .........................31
Advantages and Disadvantages of the Unit Dose Dispensing System ......35
The Intravenous (IV) Medication Use Systems .....................................................37
Evaluation of Medication Use System Performance .............................................38
Problem of Medication Administration Errors and Detection Technologies ........40
Clinical Significance ..................................................................................41
Medication Errors Detection Methods .......................................................42
Observation ....................................................................................42
Chart Review .................................................................................44
Incident Report...............................................................................45
Errors in IV Medication Use ..................................................................................46
Effect of Automation and Technology on IV Medication Use ..............................56
Computerized Prescription Order Entry (CPOE) ......................................57
Bar Code Medication Administration (BCMA) ........................................58

viii
Automated Dispensing Machines (ADMs) ................................................62
Chinese Health Care Systems ................................................................................63
Chinese Health Care System Summary .....................................................63
Chinese Health Care System 1949-1978 .......................................64
Chinese Health Care System 1978-2002 .......................................65
Chinese Health Care System 2002-Now........................................68
Rationale of the Study ............................................................................................69
Chapter 4: Methodology ....................................................................................................72
Study Setting ..........................................................................................................72
Exploratory Level Study ........................................................................................75
Description of the Existing System........................................................................75
Explanatory Level Study........................................................................................82
Population ..................................................................................................82
Sample........................................................................................................82
Sample Size Calculation ............................................................................82
Independent Variable (IV) and Dependent Variable (DV) ........................83
Research Design.........................................................................................83
Structure .....................................................................................................85
Controls ......................................................................................................85
Selection Bias.................................................................................85
Random Errors ...............................................................................87
Internal Validities...........................................................................87
Data Collection Methods ...........................................................................87

ix
Chapter 5: Results ..............................................................................................................90
Data Collection ......................................................................................................90
Study Subjects ............................................................................................90
Excluded Doses for Observation: Non-TPN, PRN and Chemotherapy ....91
Included Doses for Observation: TPN doses .............................................93
Deficiencies of the Current System .......................................................................97
Handwritten Transcriptions .......................................................................97
Lacking Insulin Volume Label ..................................................................97
Limited Shelf Space ...................................................................................98
Lacking Double Check before the Preparation ..........................................98
Error Descriptions Summary .................................................................................98
Negotiations of the Experimental System Changes for Unit Dose ......................111
Description of Errors Detected ............................................................................118
Errors with Potential Clinical Importance ...........................................................120
Statistical Analysis ...............................................................................................123
Descriptive of Means ...............................................................................124
Medication Errors Overall ...........................................................124
Wrong Dose Errors ......................................................................125
Omission Errors ...........................................................................126
Statistical Significance between Groups ..................................................127
Medication Errors Overall ...........................................................127
Wrong Dose Errors ......................................................................128
Omission Errors ...........................................................................129

x
Mean Difference and 95% Confidence Interval ......................................130
Medication Errors Overall ...........................................................130
Wrong Dose Errors ......................................................................130
Omission Errors ...........................................................................131
Required Assumptions Evaluation for ANCOVA ...................................132
Medication Errors Overall ...........................................................133
Wrong Dose Errors ......................................................................136
Omission Errors ...........................................................................139
Boxplot of Error Rates .............................................................................142
Medication Errors Overall ...........................................................142
Wrong Dose Errors ......................................................................144
Omission Errors ...........................................................................146
Outliers .....................................................................................................148
Chapter 6: Conclusions and Discussion ...........................................................................149
Conclusions ..........................................................................................................149
Effect of the Unit Dose Dispensing System on IV Error Rates ...............149
Effect of the Unit Dose Dispensing System on IV Error Rates, by
Error Types ........................................................................................150
Discussion ............................................................................................................151
Effect of the Unit Dose Dispensing System on Deficiencies of the
Current System...................................................................................151
Handwritten transcriptions ...........................................................151
Lacking Insulin Volume Label ....................................................151
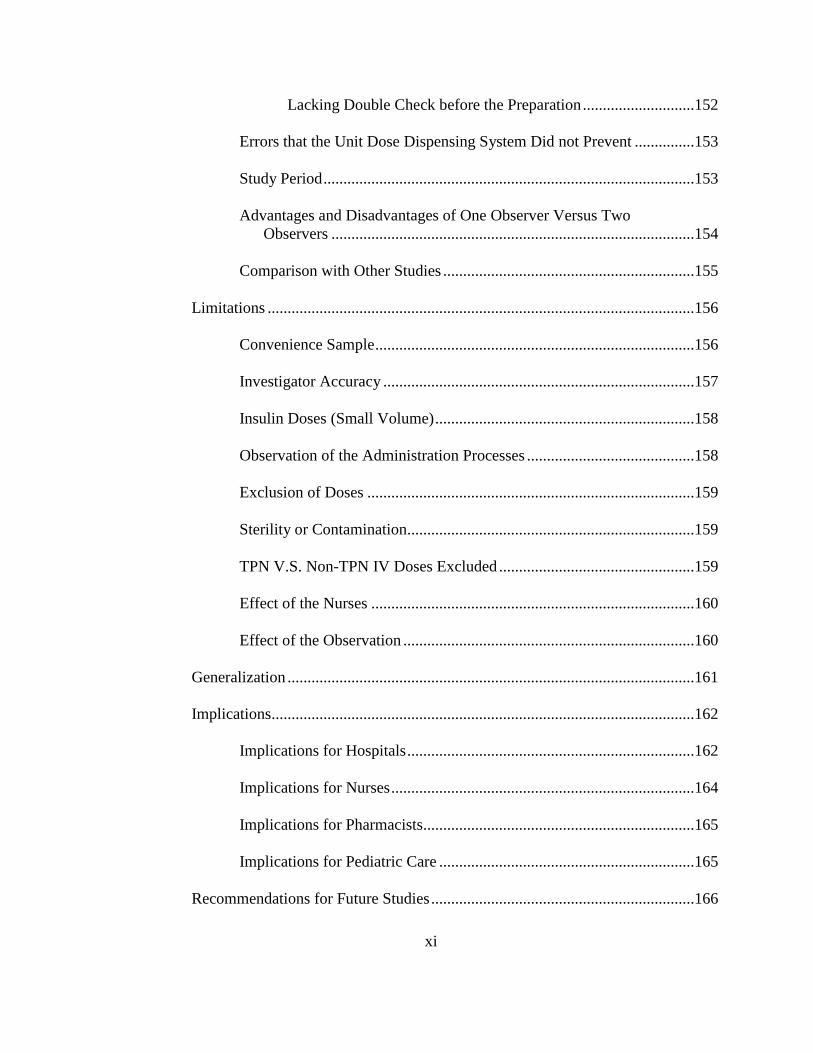
Limited shelf space ......................................................................152
xi
Lacking Double Check before the Preparation ............................152
Errors that the Unit Dose Dispensing System Did not Prevent ...............153
Study Period .............................................................................................153
Advantages and Disadvantages of One Observer Versus Two
Observers ...........................................................................................154
Comparison with Other Studies ...............................................................155
Limitations ...........................................................................................................156
Convenience Sample ................................................................................156
Investigator Accuracy ..............................................................................157
Insulin Doses (Small Volume) .................................................................158
Observation of the Administration Processes ..........................................158
Exclusion of Doses ..................................................................................159
Sterility or Contamination........................................................................159
TPN V.S. Non-TPN IV Doses Excluded .................................................159
Effect of the Nurses .................................................................................160
Effect of the Observation .........................................................................160
Generalization ......................................................................................................161
Implications..........................................................................................................162
Implications for Hospitals ........................................................................162
Implications for Nurses ............................................................................164
Implications for Pharmacists ....................................................................165
Implications for Pediatric Care ................................................................165
Recommendations for Future Studies ..................................................................166

xii
References ........................................................................................................................167
Appendix A: Conversations with the Director of the Hospital Pharmacy .......................178
Appendix B: Official IRB Approval Letter from the Hospital ........................................185
Appendix C: Informed Consent Letter (English and Chinese Versions) .........................188
Appendix D: Renewed IRB Form....................................................................................193
Appendix E: Data Collection Forms ................................................................................195
Appendix F: SAS Codes ..................................................................................................199
Appendix G: Medication Error Rates by Each Observational Day .................................208
Appendix H: Figures in the Study ...................................................................................211
Appendix I: Patients’ TPN File in the Unit Dose System for the Experimental Group ..220
Appendix J: Pictures of the Unit Dose Dispensing System in Other Military Hospitals 229
xiii
List of Tables
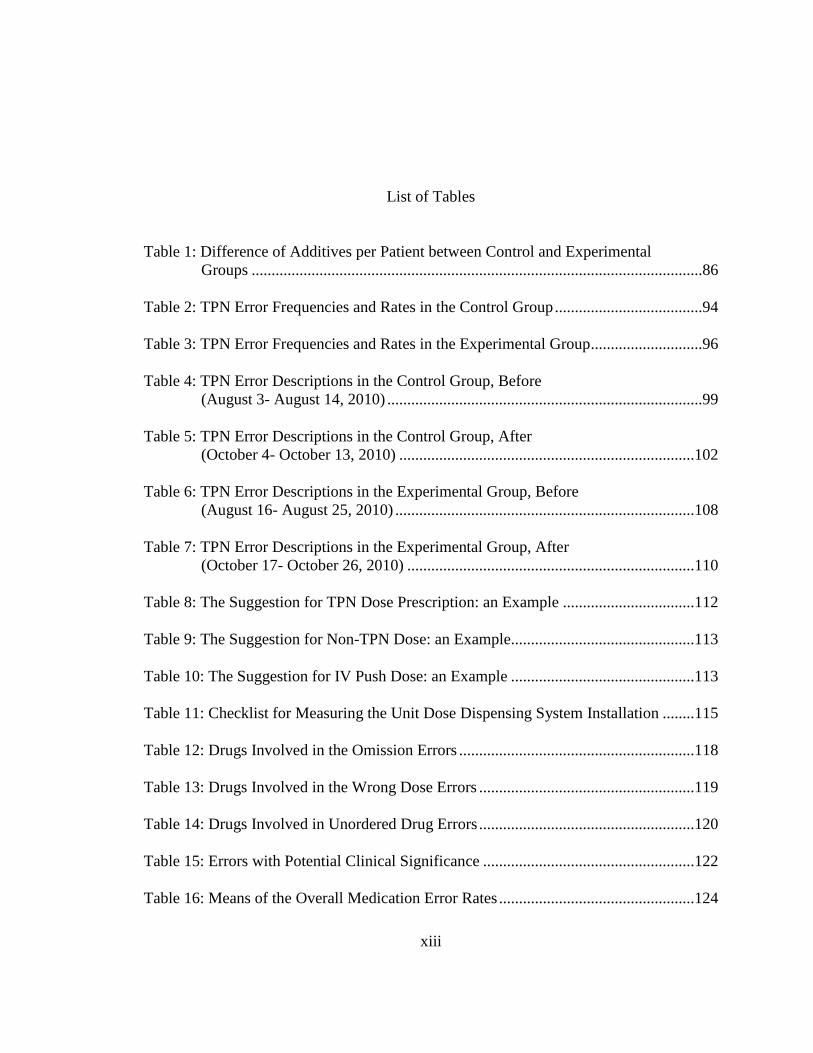
Table 1: Difference of Additives per Patient between Control and Experimental
Groups .................................................................................................................86
Table 2: TPN Error Frequencies and Rates in the Control Group .....................................94
Table 3: TPN Error Frequencies and Rates in the Experimental Group ............................96
Table 4: TPN Error Descriptions in the Control Group, Before
(August 3- August 14, 2010) ...............................................................................99
Table 5: TPN Error Descriptions in the Control Group, After
(October 4- October 13, 2010) ..........................................................................102
Table 6: TPN Error Descriptions in the Experimental Group, Before
(August 16- August 25, 2010) ...........................................................................108
Table 7: TPN Error Descriptions in the Experimental Group, After
(October 17- October 26, 2010) ........................................................................110
Table 8: The Suggestion for TPN Dose Prescription: an Example .................................112
Table 9: The Suggestion for Non-TPN Dose: an Example ..............................................113
Table 10: The Suggestion for IV Push Dose: an Example ..............................................113
Table 11: Checklist for Measuring the Unit Dose Dispensing System Installation ........115
Table 12: Drugs Involved in the Omission Errors ...........................................................118
Table 13: Drugs Involved in the Wrong Dose Errors ......................................................119
Table 14: Drugs Involved in Unordered Drug Errors ......................................................120
Table 15: Errors with Potential Clinical Significance .....................................................122
Table 16: Means of the Overall Medication Error Rates .................................................124
xiv
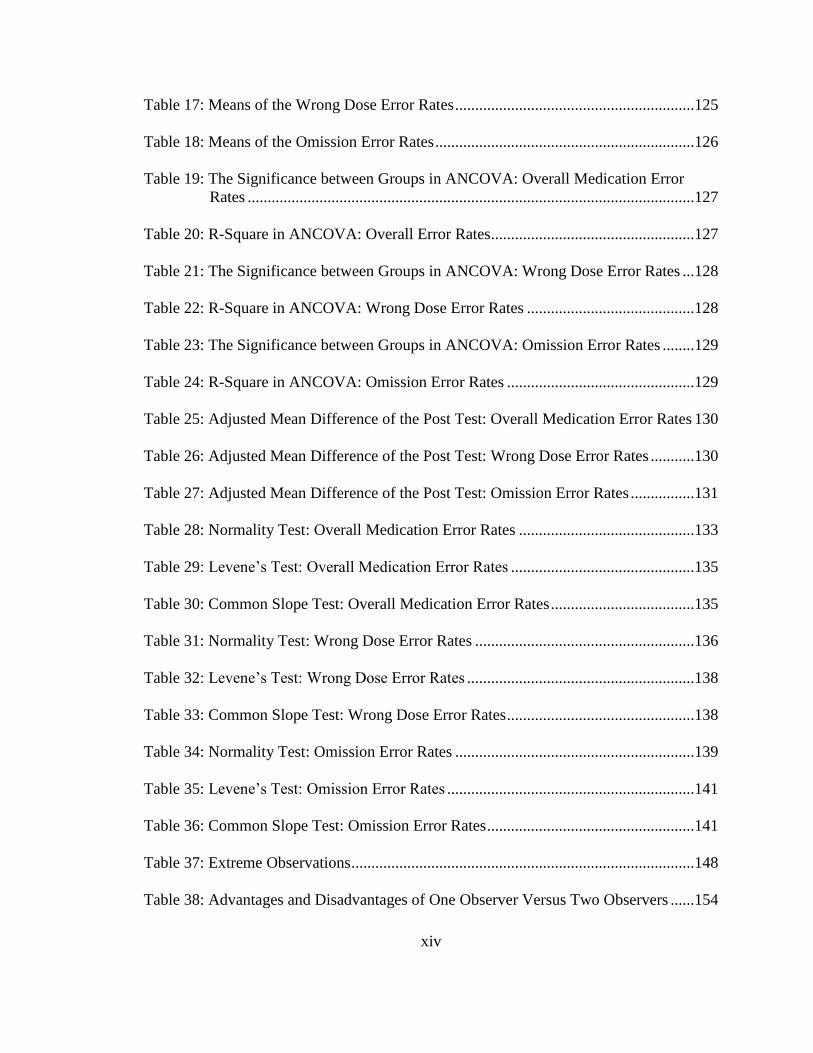
Table 17: Means of the Wrong Dose Error Rates ............................................................125
Table 18: Means of the Omission Error Rates .................................................................126
Table 19: The Significance between Groups in ANCOVA: Overall Medication Error
Rates ................................................................................................................127
Table 20: R-Square in ANCOVA: Overall Error Rates ...................................................127
Table 21: The Significance between Groups in ANCOVA: Wrong Dose Error Rates ...128
Table 22: R-Square in ANCOVA: Wrong Dose Error Rates ..........................................128
Table 23: The Significance between Groups in ANCOVA: Omission Error Rates ........129
Table 24: R-Square in ANCOVA: Omission Error Rates ...............................................129
Table 25: Adjusted Mean Difference of the Post Test: Overall Medication Error Rates 130
Table 26: Adjusted Mean Difference of the Post Test: Wrong Dose Error Rates ...........130
Table 27: Adjusted Mean Difference of the Post Test: Omission Error Rates ................131
Table 28: Normality Test: Overall Medication Error Rates ............................................133
Table 29: Levene’s Test: Overall Medication Error Rates ..............................................135
Table 30: Common Slope Test: Overall Medication Error Rates ....................................135
Table 31: Normality Test: Wrong Dose Error Rates .......................................................136
Table 32: Levene’s Test: Wrong Dose Error Rates .........................................................138
Table 33: Common Slope Test: Wrong Dose Error Rates ...............................................138
Table 34: Normality Test: Omission Error Rates ............................................................139
Table 35: Levene’s Test: Omission Error Rates ..............................................................141
Table 36: Common Slope Test: Omission Error Rates ....................................................141
Table 37: Extreme Observations ......................................................................................148
Table 38: Advantages and Disadvantages of One Observer Versus Two Observers ......154
xv
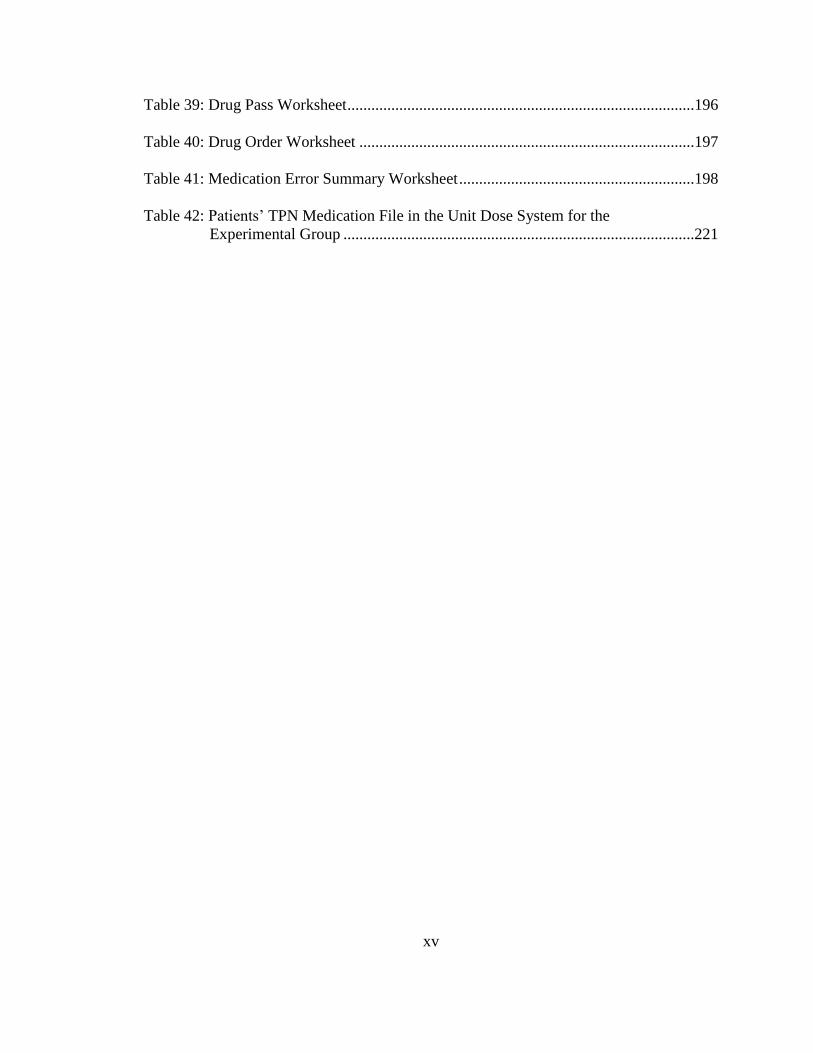
Table 39: Drug Pass Worksheet .......................................................................................196
Table 40: Drug Order Worksheet ....................................................................................197
Table 41: Medication Error Summary Worksheet ...........................................................198
Table 42: Patients’ TPN Medication File in the Unit Dose System for the
Experimental Group ........................................................................................221

xvi
List of Figures
Figure 1: ISMP List of High-Alert Medications ............................................................... 48
Figure 2: Floor Layout of the Study Patient Ward ........................................................... 74
Figure 3: Routine Medication Orders ............................................................................... 76
Figure 4: Non-Routine Medication Order......................................................................... 77
Figure 5: Flowchart of the Drug Distribution System in the Control Group .................... 81
Figure 6: Standard Control and Experimental Design with Random Assignment ........... 85
Figure 7: Control and Experimental Design with Cluster Random Assignment .............. 85
Figure 8: Layout of the IV Preparation Room and Location of the Observer .................. 89
Figure 9: Physician Station of the HIS ........................................................................... 111
Figure 10: Flowchart of the Drug Distribution System in the Experimental Group ...... 117
Figure 11: Probability Plot for Normality: Overall Medication Error Rates .................. 134
Figure 12: Probability Plot for Normality: Wrong Dose Error Rates ............................. 137
Figure 13: Probability Plot for Normality: Omission Error Rates .................................. 140
Figure 14: ANOVA of Mean Difference: Overall Medication Error Rates before the
Unit Dose Dispensing .................................................................................... 142
Figure 15: ANOVA of Mean Difference: Overall Medication Error Rates after the
Unit Dose Dispensing .................................................................................... 143
Figure 16: ANOVA of Mean Difference: Wrong Dose Error Rates before the Unit
Dose Dispensing ............................................................................................ 144

xvii
Figure 17: ANOVA of Mean Difference: Wrong Dose Error Rates after the Unit
Dose Dispensing ............................................................................................ 145
Figure 18: ANOVA of Mean Difference: Omission Error Rates before the Unit Dose
Dispensing ...................................................................................................... 146
Figure 19: ANOVA of Mean Difference: Omission Error Rates after the Unit Dose
Dispensing ...................................................................................................... 147
Figure 20: Error Rates in Each Observational Day: Control Group before-after ........... 209
Figure 21: Error Rates in Each Observational Day: Experimental Group before-after .. 210
Figure 22: Error Example 1 -- Vitamin C 2 g or 3 g....................................................... 212
Figure 23: Error Example 2 -- 10% NaCl 10 ampoules or 10 ml ................................... 213
Figure 24: Source of Error involving the Volume of Insulin.......................................... 214
Figure 25: Syringe (1 ml) for Insulin .............................................................................. 215
Figure 26: Old Label in the Existing System .................................................................. 216
Figure 27: Printable Unit Dose Label of TPN for One Patient and Handwritten Label . 217
Figure 28: Basket for the Unit Dose Dispensing ............................................................ 218
Figure 29: A Pharmacist Checked Doses before the TPN Preparation .......................... 219
Figure 30: Checking IV Label and Dispensing Unit Dose ............................................. 230
Figure 31: Pharmacy Intravenous Admixture Center Service (PIVAS) Windows
(In-Out) .......................................................................................................... 231
Figure 32: IV Unit Dose Ready for Admixture .............................................................. 232

xviii
List of Abbreviations
ADEs Adverse Drug Events
ADM Automated Dispensing Machine
ANCOVA Analysis of Covariance
ANOVA Analysis of Variance
ASHP American Society of Health-System Pharmacists
BCMA Bar-Code Medication Administration
BID Twice Daily
BMI Basic Medical Insurance List
CDSS Clinical Decision Support System
CPOE Computerized Prescription Order Entry
EAMC East Alabama Medical Center
EHR Electronic Health Record
E-MAR Electronic Medication Administration Record
FDA Food and Drug Administration
GIS Government Insurance Scheme
HIS Hospital Information System
ICU Intensive Care Unit
IRB Institutional Review Board
xix
ISMP Institute for Safe Medication Practices
IU International Unit
IV Intravenous
JCAHO Joint Commission on Accreditation of Healthcare Organizations
LIS Labor Insurance Scheme
MAR Medication Administration Record
MERP Medication Errors Reporting Program
MOH Ministry of Health
MRI Magnetic Resonance Imaging
NCMS New Cooperative Medical System
NICU Neonatal Intensive Care Unit
PIVAS Pharmacy Intravenous Admixture Center Service
SOE State-Owned Enterprise
TID Three Times Daily
T.O.E. Total Opportunity for Error
TPN Total Parenteral Nutrition
USP The United States Pharmacopeia
WHO World Health Organization
1
Chapter 1: Introduction
General Problem
High volume usage of intravenous (IV) continuous infusion therapy can be considered as
a unique aspect of the culture of Chinese healthcare. In the 18th Meeting of the 11th National
People's Congress, Zhixin Zhu, the Deputy Director of the National Development and Reform
Commission, revealed that China used 10.4 billion infusion bottles annually in 2009 (China
Daily, 2011). This number of infusions was the equivalent to approximately 8 infusion bottles
per capita for 1.3 billion Chinese people, much higher than 2.5 - 3.3 bottles of the international
level (China Daily, 2011).
Given the high frequency of the use of intravenous medications in daily practice, it is
surprising the degree to which information regarding the safety of these intravenous drug
administrations for Chinese patients is limited. The Chinese people now don’t have a very clear
picture of the concept of IV medication errors: how frequently do IV medication errors happen
and what variables affect IV medication errors?
Flynn and colleagues (Flynn, Pearson, & Barker, 1997) reported that the mean error rate
in IV admixture compounding detected by observation at five U.S. hospital pharmacies was 9%.
The study showed that for total parenteral nutrition solutions (TPN) that were prepared manually
had 37% error rate and 22% error rate prepared partly using automation. If the error rate of 9%
was applied to the Chinese hospitals where intravenous infusions were administered, about 900
2
million errors involving intravenous infusions would have occurred annually in Chinese
hospitals in 2009.
The preparation and administration of intravenous drugs is a complex process with
multiple steps which include the selection of correct drugs, the selection of correct diluents (if
needed), the dissolving of powder, and the transfer of injectable fluid from the original vial or
ampoule into a base solution infusion bag.
Since IV drugs usually go directly into the patient’s vein via injection or infusion, IV
drugs are considered as high-risk-harm drugs. Data between 2002 and 2006 from the United
States Pharmacopeia’s (USP’s) MEDMARX program, a central internet-based voluntary
reporting system that was designed to report, track and help users detect trends in medication
errors by using a standardized-entry form and allowing anonymous error data comparisons
between the facilities enrolled, showed that parenteral medication errors were nearly three times
as likely to cause harm or death (3%) compared with other drug form errors (1.2%)
(MEDMARX Database 2002-2006, 2008). The majority (79%) of harmful or fatal parenteral
errors involved IV route of administration. Fifty eight percent of the parenteral errors originated
during the administration step of the medication-use process (MEDMARX Database 2002-2006,
2008).
The wide range of error rates from 6 to 83% (Hartley & Dhillon, 1998; O’Hara, Bradley,
Gallagher, & Shields, 1995; Taxis & Barber, 2003b; Thur, Miller, & Latiolais, 1972; Van den
Bemt, Fijn, van der Voort, Gossen, Egberts, & Brouwers, 2002) in preparing and administering
intravenous drugs suggest the need for more exploratory studies. Those studies yielded a wide
error rate range because they combined the IV medication errors in both the preparation and
administration processes. However IV medication administration errors should be studied as a
3
terminal outcome of medication safety because the errors that happen in the preparation
processes might be corrected before the medications reach the patient.
A Council of Europe report attributed these IV errors to the lack of unit-dose injectable
medications and insufficient pharmacy staffing resources (Armitage & Knapman, 2003). In
2002, the Chinese Ministry of Health mandated that unit dose based dispensing should be used
for oral drugs in all hospital inpatient pharmacies. Zhang and colleagues first introduced the unit
dose dispensing concept to a Chinese hospital pharmacy in 2005. Several Chinese hospital
inpatient pharmacies such as the Shanghai Institute of Hepatobiliary Surgery and Fuzhou
Hospital have used the Unit Dose Dispensing System in oral medicines for the inpatients since
2005 and 2006, respectively. According to one Chinese pharmacy director, about 60-70% of
inpatients and 80% of outpatients use intravenous drugs in Chinese hospitals (Jing Zhang, 2008).
However, the unit dose dispensing concept has not been widely accepted for IV drugs in Chinese
hospital pharmacies. Nurses continue to prepare or mix the IV drugs in the treatment room in the
patient wards as they have done traditionally. One study (Li, Huang, Li, Sun, & Ying, 2009)
surveyed hospitals by questionnaire and reported that only 19.1% (9 out of 47) of hospitals in
Beijing had a unit dose based Pharmacy Intravenous Admixture Center Service (PIVAS).
The Unit Dose Dispensing System concept and applications were developed by Barker
and Heller in 1963-1964 (Barker & Heller, 1963a). Their study showed that a Unit Dose
Dispensing System can effectively reduce medication errors in a hospital. A “unit dose” is
defined as “the physical quantity of a drug specified by a prescriber to be administered to a
specified patient at one time, in a labeled ready-to-administer form with no further physical or
chemical alterations required” (Barker & Heller, 1963a). Further, the Unit Dose Dispensing
System proposed by Barker and Heller (Barker & Heller, 1963a) must have all unit-doses stored
4
in a central pharmacy and all drugs in a unit dose form at the time they are dispensed . The use of
the word “dispensed” assumed the involvement of a pharmacist. From 1964 to 1976, four
published studies reported the reduction of medication errors based on the Unit Dose Dispensing
System compared to the conventional dispensing system (Barker, 1969; Hynniman, Conrad,
Urch, Rudnick, & Parker, 1970; Means, Derewicz, & Lamy, 1975; Schnell, 1976). Today the
Unit Dose Dispensing System is widely adopted in many hospitals in the US. A 2008 national
survey of drug dispensing and administration practice (Pedersen, Schneider, & Scheckelhoff,
2009) indicated that about 86.7% hospitals dispensed a majority of oral medications in a unit
dose form for noncritical care patients and about 69.6% hospitals dispensed a majority of
injectable medications in a unit dose form for critical care and noncritical care patients, in which
a unit dose was defined as a dose dispensed by the pharmacy that is ready to administer to a
patient (e.g., no further dosage calculation or manipulation is required).
The above results were based on reports from hospitals in western countries, however it
was uncertain if a unit dose system that works for United States hospitals for example would
work for Chinese hospitals. Because of very limited information available regarding the effects
of unit dose systems on medication errors in Chinese hospitals, such research is needed.
The first goal of this study was to explore the frequency of intravenous medication errors
and identify clues to their cause. The second goal was to identify the potential clinical relevance
of the detected errors. The third goal was to investigate the effect of a Unit Dose Dispensing
System on medication administration errors for IV drugs.

5
Significance
IV medications are considered to be particularly dangerous because of the immediate
onset of systemic effects, low therapeutic index of many IV medications, and difficulty reversing
pharmacologic effects after IV administration (MEDMARX Database 2002-2006, 2008). Despite
these dangers, China has an overwhelming usage of IVs compared to other countries and the
nature of “medication errors” is poorly examined and understood.
The following two examples illustrate this. First, death of a two and half year old boy in
Hainan Province involving a IV medication labeled with the wrong patient’s name on the bottle
was reported (Gao, 2011). The hospital didn’t consider it as a medication error, and claimed that
the bottle which was labeled with the wrong patient’s name was a sealed bottle of 5% Glucose
Solution without adding any additive. The explanation given by the hospital to the death was
“unpreventable infusion allergy event”. Second, a one-year-old boy in Anhui Province died
during the infusion of Cefathiamidine without any previous skin allergy test (Dragon TV, 2010).
However, the physician said that the allergy test was not necessary this time because this boy has
previously used Cefathiamidine. Thus, due to the lack of the knowledge of the existence and
nature of medication errors, the reasons for the deaths were unclear to the hospitals, the patients’
family, as well as the public. The normal processes for such cases are to analyze the chemicals in
the infused bottle and examine the dead body for pathology evidence, which can be very costly.
Medication errors have been understudied in China. Although the Regulation of Hospital
Pharmacy Administration has required hospital pharmacies to dispense medications in a unit
dose since 2002, the Unit Dose Dispensing System has been slowly adopted. The first unit dose
system was installed for use with oral medications in a Chinese hospital in 2005. No study was
conducted to study the effect of the new system on medication errors.

6
Unlike medication error reporting systems used in the United States (e.g., USP’s
MEDMARX, the ISMP Medication Error Reporting Program, or FDA’s MedWatch in the US)
there is no national medication error reporting system in China. Thus the absence of research to
describe the nature and frequency of medication errors in the Chinese healthcare system is not
surprising. Without the knowledge of the nature and frequency of IV medication errors, the
patients to whom they administered are at high risk. Better understanding of the nature,
frequency and causes of IV medication errors may help guide hospital administrators to improve
their system to enhance the quality of care provided to the Chinese.
This research used the undisguised observation method to detect and measure the rate of
medication errors, which is capable of producing the most valid results compared to other
methods. Measuring the effect of a new IV drug distribution system can provide valuable
information for healthcare evaluate and redesign an optimum IV drug distribution systems for
Chinese hospitals. The results may also serve to analyze and highlight the potential clinical
importance which will hopefully increase the attention of the public to medication administration
errors and thereby improve the safety of inpatients in Chinese hospitals.
Scope
This study involved the following two phases:
Phase I: Exploratory Study
1. An exploratory review of the literature was performed to identify the variables and
interventions that may contribute to reducing medication errors. The operational
definitions of the independent variable and dependent variables were developed during
this phase. The hospital to be studied was identified by offering the opportunity to
7
participate in the study to the director of the pharmacy who attended the ASHP midyear
meeting at Anaheim, California in 2007. The sample size was estimated using the effect
size calculations and power analysis.
2. The direct observation was used during the first visit in December 2009 in order to
obtain the detailed information on describing the TPN medication distribution system
used by this hospital. The operational definitions were tested, refined and retested. The
flow chart of TPN drug distribution processes was produced using Microsoft Visio.
3. The selection of a patient ward for study was discussed with the Director of the
Pharmacy. A General (Gastrointestinal) Surgery Patient Ward was offered by the
hospital.
4. Direct observation was used again in July 2010 to improve the familiarity of the observer
with the observation environment before the explanatory study.
5. The plan for installing a Unit Dose Dispensing System was discussed with the Director
of the Pharmacy and the Chief Head Nurse on the study ward. Only TPN doses were
approved by the hospital for the unit dose trial.
Phase II: Explanatory study
The effect of a Unit Dose Dispensing System on TPN medication errors was studied
based on a cluster randomized control-experimental design in a General Surgery Patient Ward in
a tertiary hospital in Beijing.
8
Chapter 2: Statement of the Problem
Study Objectives
The first objective of this study was to explore the frequency of intravenous medication
errors and identify the clues that may cause medication errors in Chinese hospital inpatient units.
The second objective was to identify the potential clinical relevance of the detected
errors.
The third objective was to investigate the effect of a Unit Dose Dispensing System on
medication administration errors for IV drugs.
Research Questions
1. What is the nature and frequency of IV preparation and administration errors among
Chinese hospital inpatients?
2. What are the clues that may contribute to IV medication preparation and administration
errors among Chinese hospital inpatients?
3. What is the effect of a Unit Dose Dispensing System upon IV preparation and
administration errors in a Chinese hospital: inpatient?
4. What is the potential clinical significance of the detected medication preparation and
administration errors?
9
Research Hypotheses
HA0: A Unit Dose Dispensing System will not significantly affect overall IV preparation and
administration errors for inpatients in a Chinese hospital.
HA1: A Unit Dose Dispensing System will significantly reduce IV preparation and administration
errors overall for inpatients in a Chinese hospital.
HB0: A Unit Dose Dispensing System will not significantly affect IV preparation and
administration errors, by error types, for inpatients in a Chinese hospital.
HB1: A Unit Dose Dispensing System will significantly reduce IV preparation and administration
errors, by error types, for inpatients in a Chinese hospital.
Concepts
1. Unit dose (Barker & Heller, 1963a): Any physical quantity of a drug specified by a
physician to be administered to a patient at one time, and not requiring any significant
physical or chemical alterations before being administered.
2. Unit dose dispensing: The IV drugs to be administered to one patient at one time are
prepared (premixed) in the pharmacy, packaged in an individual package, labeled, and
delivered in ready-to-use form to the patient unit within 1-2 hours before the
administration time is due.
3. Medication Administration Error (Barker & McConnell, 1962): A deviation from the
physician’s interpretable orders as written on the patient’s chart.

10
4. An Opportunity for Error (O.E.) (Barker, Kimbrough, & Heller, 1966): The basic unit of
data, defined as any dose observed to be given by an observed nurse, or any dose ordered
but omitted. One opportunity for error can be only correct, or incorrect in one or more
ways.
5. Total Opportunities for Error (T.O.E.s) (Barker, Kimbrough, & Heller, 1966): The total
doses ordered (including omissions) plus the number of unordered doses given.
6. Medication administration error rate (Barker, Kimbrough, & Heller, 1966): The number
of detected medication errors is divided by the Total Opportunities for Error with the
result multiplied by 100.
Flynn and Barker noted that the error categories may not be mutually exclusive;
therefore, the rates for different error types cannot always be simply added to obtain an
overall error rate (Allan & Barker, 1990).
7. Medication Error Categories (Allan & Barker, 1990; Flynn & Barker, 2000; Flynn,
Pearson, & Barker, 1997):
The allowable deviation from the physician’s order for measured doses and the
range of acceptable times for medication administration must be clearly stated (Allan &
Barker, 1990).
An unordered or unauthorized drug error: The administration of a dose of medication
that was never ordered for that patient.
An extra dose error: A dose is given in excess of the total number of times ordered by
the physician, such as a dose given on the basis of an expired order, after a drug has
been discontinued, or after a drug has been put on hold. For example, if a physician
11
orders a drug to be given only in the morning and the patient receives a dose in the
evening as well, an extra dose error has occurred.
Omission error: A patient fails to receive a dose of medication that was ordered
before the next dose is due. If the patient refuses the medication, it is not generally
counted as an omission error or an opportunity for error (O.E.). Doses withheld
according to conditional order or policy (e.g., “nothing by mouth before surgery”) are
not counted as errors or O.E.s.
A wrong dose or wrong strength error: A dose is given that contains the wrong
number of preformed dosage units (such as tablets) or is, in the judgment of the
observer, more than 17% greater or less than the correct dosage. The origin of the use
of plus or minus 17% was derived from the error commonly encountered by the
researchers in the measuring devices commonly supplied to the nurses by the hospital
for measuring out oral doses. For injectable doses, a narrower definition was used -
any dose that is more than 10% different from the correct dosage would be in error.
Wrong dose errors are counted for the intravenous medications and base-solutions
(the volume and concentration of the medication) only when the dose was
quantitatively specified by the physician and quantitatively measurable by the
observer, e.g., Sodium Chloride Injection Concentrate (10%) 20 ml or Sodium Chloride
Injection (0.9%) 10 ml was give when Sodium Chloride Injection Concentrate (10%) 10 ml
was ordered.
Wrong route error: A medication is administered by a route that is different from the
one ordered, such as giving the patient Sodium Chloride Injection Concentrate (10%) 10
ml by mouth which was ordered intravenously.

12
Wrong time error: The administration of a dose more than 30 minutes before or after
the scheduled time of administration in the absence of an acceptable reason, e.g.,
when the patient is not in his or her room because of undergoing a procedure
elsewhere in the hospital. Although each hospital may determine its own acceptable
time range for administration of a dose, 30 minutes is commonly used because it has
been shown that nurses can usually administer all their medications within 1 hour.
The schedule programmed into the pharmacy’s computer system may be used to
define correct administration times. If the physician didn’t record the time at which an
order was written, wrong time errors shouldn’t be recorded for doses given on that
day until a second dose is given. The first dose given according to the standard
administration schedule is considered to establish the schedule in effect, and
subsequent doses on the same day may then be examined for wrong time errors.
Wrong form error: The container used to deliver the dose to the patient is incorrect.
For example, a syringe was used for the dose instead of a 50 ml IV mini bag.
Wrong administration rate error: The rate of administration of Infusions of
intravenous fluids differs from the rate specified by the physician. An infusion given
as a bolus can be defined in this category. An intravenous infusion rate exceeding 20
meq/hr of a solution containing potassium chloride can lead to hyperkalemia and,
ultimately, cardiac arrhythmias.
A deteriorated drug error: The physical or chemical integrity of a medication dosage
form has been compromised, as with expired drugs or intravenous medications
requiring refrigeration that are left at room temperature.
13
Wrong administration technique error: an inappropriate procedure during
administration of a drug. For example, not wiping an injection site with alcohol is
included in this category.
Wrong preparation technique error: Aseptic technique is violated (e.g., needle
contamination, improper decontamination of vials and materials, improper syringe
selection, not using a filter needle to inject the reconstituted product when this is
normal procedure, improper needle use, lack of hand washing, improper air injection,
improper vial venting, improper shaking), or there are deviations from hospital
policies and procedures that affected the accuracy or sterility of the final product.
Wrong reconstitution procedure: The volume or solution used to reconstitute the
product is contraindicated in medication’s package insert or reconstitution is
incomplete.
Operational Definitions
1) IV Preparation and Administration Error: The TPN preparation and administration
processes by the trained IV preparation nurses were observed, noted and compared with
the interpretable physician’s orders of TPN drugs written on the patient chart in the
General Surgery Patient Ward by an observer trained to detect an error.
2) Total Opportunities for Error (T.O.E.s): TPN doses ordered by the physician,
interpretable to the observer, plus unordered TPN doses observed to be given to the
patients in the General Surgery Patient Ward.
3) Medication error rate: The detected medication errors are divided by the Total
Opportunities for Error with the result multiplied by 100.

14
4) Categories of IV Medication Administration Errors are listed as below:
An unordered drug error: A dose was added in the Kabiven PI bag (1440 ml) and
administered to the patient that was not ordered for that patient.
An omission error: An additive, which was ordered to be added in the Kabiven PI bag
(1440 ml) as a group, was failed to be mixed in the Kabiven PI bag (1440 ml) and
administered to the patient.
A wrong dose error: An additive, which was ordered in a group of TPN, was given
more than 10% volume and concentration greater or less than the correct dosage, in
the judgment of the observer.
An extra-dose error: A dose given in excess of the total number of times ordered by
the physician, such as a dose given on the basis of an expired order, after a drug has
been discontinued, or after a drug has been put on hold.
A wrong time error: The mixed Kabiven PI bag (1440 ml) was administered more
than 60 minutes before or after the scheduled administration time.
A wrong route error: The mixed Kabiven PI bag (1440 ml) was administered via a
different location or site on the patient’s body than was ordered.
A wrong administration rate error: The mixed Kabiven PI bag (1440 ml) was
administered at a ±17% deviation as the ordered rate.
5) Procedures of a Unit Dose System
A. Order Processing
1. A pharmacist reviews paper drug orders for prescribing accuracy, consulting with
physician if necessary.
2. Orders are re-entered into the master order file (Excel Office 2007) by a pharmacist

15
for each patient including patient's full name, age, bed number, dosage form, dosage
(insulin dosage is calculated into volume), and administration time.
3. Medication orders are filed, updated and sent to the nurse division.
4. Orders are printed out by a pharmacist in cumulative list of all active drug orders for
each patient (drug list or pick list) at both the pharmacy (drug profile) and the nursing
division Medication Administration Record (MAR).
B. IV Dispensing
1. The auxiliary worker uses the pick list to pick all doses scheduled for administration
to each patient at one administration time, places them in a separate basket for each
patient, signs or initials on the labels, and has them verified by a pharmacist.
1.1. A pharmacist checks doses for deterioration visually, and expiry date, before
admixture.
2. Label is generated, reviewed by pharmacist for changes needed, comparing label to
order.
2.1. Name and bed number are prominent on top of label.
2.2. Name of base fluid is on label.
2.3. Name of each active ingredient and the amount of dose with unit of concentration
are on label.
2.4. Brand name is close to generic name.
2.5. Administration time is on label.
2.6. Initials of pickers, preparing admixture technicians and review pharmacist are on
label.
2.7. Signature space for administration nurse name is on label.
16
2.8. Date Dispensed is on label
3. Labeled Refrigerate is stored in refrigerator
C. IV Preparation
1. The drugs dispensed are checked with the drug list before the preparation.
2. Doses are admixed and labeled by the IV preparation nurse.
2.1. Sealed disposable syringe contains only one drug
2.2. Sterile drugs will be prepared in laminar air flow hood (when available) using
aseptic technique
3. Final product is verified by a pharmacist, corrected if needed, and signed initial on the
label.
D. IV Delivery
1. IVs prepared are delivered in separate compartments (ex. drawer) labeled with patient
name, I.D. number if possible, bed number and nursing unit name.
2. Doses are delivered 1-2 hours before administration time.
3. New/updated Medication Administration Record (MAR) is delivered to the nursing
station.
4. Dispensing, inventory & financial records are updated in pharmacy.
E. IV Administration
1. Checks the label of each prepared IV received with the MAR Drug List for each
patient.
2. Places all drugs in an individual compartment labeled with patient name and bed
17
number.
3. Proceeds down the hall and to administer the doses.
3.1. Checks patient name, I.D. number if possible, and bed number on the patient
such as on a wrist band.
3.2. IV Push: the label is checked for the correct rate of administration.
3.3. Administers doses.
3.4. Signs initials and administration time on the MAR at patient bedside
F. Other Changes
1. All changes are limited to TPN IVs only, unless and until notified otherwise
2. Doses ordered PRN, chemotherapy and the patient's own drugs may require special
handling.
3. For solutions pre-mixed by the manufacturer, records the lot numbers.
4. All communications are typed through the computer without handwritten (Excel
Office 2007).
5. The nurse records all doses at the time of administration.
6. Dispensing includes picking by the IV nurses (or technicians) if checked by
pharmacist.
7. The label on dose dispensed will match that in edited and pharmacist-reviewed order.
8. Bar coding is recommended for dose and patient identification if available.
18
Chapter 3: Literature Review
Both English and Chinese articles were reviewed to illustrate the significance of this
study and the rationale for conducting it. The purposes were to obtain a broad background
relevant to the research topics, to critique the articles that addressed the questions relevant to the
research questions, and to identify the gaps of the previous studies on IV preparation and
administration errors.
Online databases, Google Scholar and manual searches were performed. The following
databases and sources were used to conduct the literature search:
International Pharmaceutical Abstracts (1970 to March 2011)
Ovid MEDLINE(R) (1948 to March Week 4 2011)
Auburn Journals Ovid
Journals Ovid Full Text (Updated to April 1 2011)
Cochrane Database of Systematic Reviews
CINAHL (1982 to present)
PsycINFO (1806 to present)
Dissertations & Theses Abstracts
CNKI -China Academic Literature Full-text Database (1960 to March 2011)
CNKI- China Doctoral Dissertations Full-text Database (1999 to Present)
CNKI- China Masters’ Theses Full-text Database (1999 to Present)
The following keywords were cross linked to conduct the literature search:
19
“Medication Error(s)”
“Inpatient(s)”
“Medication Use System” or “Medication Delivery System”
“Safety” or “Patient Safety”
“Intravenous” or “Infusion” or “IV”
“Unit Dose” or “Unit Dose Dispensing”
“Observation”
The Medication Use System in Inpatient Units in Hospitals
System, Medication Use System, and System Safety
A system is defined as “A combination of people, procedures, facility, and/or equipment
all functioning within a given or specified working environment to accomplish a specific task or
set of tasks” (Stephenson, 1991).
System safety is defined as “ A sub-discipline of systems engineering, that applies
scientific engineering, and management principles to ensure adequate safety, the timely
identification of hazard risk, and initiation of actions to prevent or control those hazards
throughout the life cycle and within the constraints of operational effectiveness, time, and cost”
(Stephenson, 1991).
The comprehensive drug system was summarized as a chain of multiple steps, beginning
at the manufacturer and ending at the patient’s bedside, as shown below (Aspden, 2007; Barker
& Pearson, 1986).
At the manufacturer:
1. Drug research and development

20
2. Drug approval by the FDA agent
3. Order processing
4. Production and filling
5. Marketing and distribution
At the physician office:
6. Patient assessment
7. Order formulated
At the pharmacy:
8. Ordering/receiving
9. Storing
10. Preparation for dispensing (including compounding, measuring, packaging, and labeling)
11. Dispensing
12. Transportation to nursing unit
At the nursing unit:
13. Ordering/receiving
14. Storing
15. Preparation for administration (including compounding, measuring, packaging, and
labeling)
16. Administration to patient
17. Monitoring the patients
The medication use system when medications are ordered for inpatients contains steps 6-
17 in the hospital. The perspective of the medication use system for the health care providers was
to collaboratively promote efforts to achieve the optimal therapeutic goals and encourage the

21
enhancement of high-reliable and high-quality care, which was the six key dimensions identified
by the Committee on Quality of Health Care in America in the 2001 IOM report, as listed below
(Committee on Quality of Health Care in America Institute of Medicine, 2001; Corrigan,
Donaldson, Kohn, Maguire, & Pike, 2001).
Safe: avoiding injuries to patients from the care that is intended to help them.
Effective: providing services based on scientific knowledge to all who could benefit, and
refraining from providing services to those not likely to benefit.
Patient-centered: providing care that is respectful of and responsive to individual patient
preferences, needs, and values, and ensuring that patient values guide all clinical
decisions.
Timely: reducing waits and sometimes harmful delays for both those who receive and
those who give care.
Efficient: avoiding waste, including waste of equipment, supplies, ideas, and energy.
Equitable: providing care that does not vary in quality because of personal characteristics
such as gender, ethnicity, geographic location, and socioeconomic status.
Drug Distribution System in Hospitals
In general, there are three types of drug distributions systems for the inpatients in
hospitals: (1) the floor stock system, (2) the patient prescription system, and (3) the Unit Dose
Dispensing System. The role of the hospital pharmacists is changing from the dispensing-
oriented to the professional knowledge- based and patient-centered.
22
Floor Stock System
Historically multiple doses were dispensed as a bulk supply of drug products from the
pharmacy to the patient care units at one time, known as the floor stock system. In this system,
the nurses prepared all doses of medications (including compounding of IV admixtures) near the
patient’s bedside when the administration was due. Although the lines of communication for
drug orders and dose preparations are short and decentralized (the pharmacist is excluded) and
distribution from the pharmacy to the patient care units can be done on a batch rather than a
continuous basis, this system didn’t work well because the drug knowledge required in the dose
preparation processes was beyond that of the typical nurse and the drug inventory management
requirements exceeded the capabilities of the nursing personnel managing the typical unit
(Barker & Pearson, 1986).
As the automated dispensing devices such as Pyxis are used on the nursing units in many
hospitals today, current floor stock is also be called “Automated Floor Stock System”.
Patient Prescription System
The patient prescription system is distinguished from the floor stock system by the facts
that the pharmacists reviewed the original order without relevant patient information and
multiple doses were labeled for a specific patient in each container. In this system, the doses
were usually sent in 2 to 5-day supply, and the nurse maintained the bottles in stock and used a
reminder system to determine when the medication was to be administered (Black & Nelson,
1992). This system fell closer to the Unit Dose Dispensing System when the doses were in single
unit form and multiple doses of different drugs (e.g., a 24- hour supply) were sent all at one time
23
(Barker & Pearson, 1986). This is consistent with the ASHP statement on unit dose drug
distribution (American Society of Hospital Pharmacists, 1989): “for most medications not more
than a 24 hour supply of doses is delivered to or available at the patient care area at any time.”
In both the floor stock system and the patient prescription system, the nurse rather than
the pharmacist played the major role in drug order evaluation and drug preparation (Black &
Nelson, 1992).
Unit Dose Dispensing System
The Unit Dose Dispensing System as a revolution activating and expanding the role of
pharmacist in the hospital drug distribution system, was created and investigated at the
University of Arkansas Medical Center in 1960s, and soon afterwards at the University of Iowa
(Barker & Heller, 1963a, 1963b, 1964; Barker, Heller, & Brennan, 1964; Barker, Heller,
Brennan, & Sheldon, 1964; Barker, Heller, & Sheldon, 1964; Black & Tester, 1964).
The fundamental elements of the Unit Dose Dispensing System were summarized by
Barker and Pearson as follows: (1) theoretically, the unit dose form could be created anywhere
along the chain of steps beginning with the delivery by the pharmaceutical manufacturer and
ending with the nurse who administered the unit dose; (2) All drugs were retained in the
pharmacy until just 1-2 hours prior to use. In the model system at the University of Arkansas
Medical Center, this was calculated to require as many as 14 deliveries a day according to the
model distribution curve of the demand for doses by time of day; (3) All medication orders were
edited in the pharmacy before dispensing; and (4) all Drug Distribution Control Information
would come from this source only (Barker & Pearson, 1986).

24
The Unit Dose Concept in Medication Use Systems
Two major pioneering research teams devoted themselves to developing applications of
the unit-dose dispensing system concept from 1961 to 1964. A centralized Unit Dose Dispensing
System project was developed at the University of Florida in 1961 (McConnell, Barker, &
Garrity, 1961) and continued at the University of Arkansas Medical Center featured the
preparation of all medications in the pharmacy (Barker, 1969; Barker & Heller, 1963a, 1963b,
1964; Barker, Heller, & Brennan, 1964; Barker, Heller, Brennan, & Sheldon, 1964; Barker,
Heller, & Sheldon, 1964). A decentralized model of a Unit Dose Dispensing System was
developed and tested at the University of Iowa in which the medication was prepared by a
pharmacist on each nursing floor (Tester, 1964).
Centralized Unit Dose Dispensing System (CUDD)
Exploratory Study
The purpose of developing a centralized unit dose dispensing (CUDD) system was to
improve medication administration accuracy (Barker & McConnell, 1962), establish an effective
information program to support the nurses in medication administration (McConnell, Barker, &
Garrity, 1961), and reduce the waste of medications on the floor (Barker & Heller, 1963b).
The procedures of the Unit Dose Dispensing System were established for an exploratory
study on the pediatric floor (35 beds) of the University of Florida Teaching Hospital (250 beds),
as shown below (McConnell, Barker, & Garrity, 1961):
1. A carbon copy of the order was simultaneously produced when a physician wrote a
medication order, and was sent by the floor clerk to the pharmacy by pneumatic tube.
25
2. A central secretary in the pharmacy received the copy of the order, transcribed the drug
order, order change, or discontinued order onto a patient medication record. Both the
copy of the order and the transcribed patient medication record were checked for
accuracy and initialed by the pharmacist. After checking, the central secretary placed a
signal tab on the top margin of the patient medication record to indicate the time of day
the next dose was due.
3. One hour before medication were scheduled to be given, the central secretary pulled all
patient medication records and wrote medicine cards for each dose due for every patient
the next hour. Medication cards were used and filled by the pharmacy technician.
4. The pharmacy technician prepared the individual packaged medications and placed each
dose in a properly identified plastic drawer of a special metal cabinet mounted on a
wheeled cart. Each drawer was identified with the patient’s name, hospital number, and
location. An appropriate pharmacy note for the nurse was placed in each drawer with
each dose.
5. The checking pharmacist checked each dose and medicine card in the filled cabinet
against the patient medication record and validated the medicine card by stamping the
date, time of day, and her initial.
6. The pharmacy messenger delivered the cabinets, which also contained an assortment of
disposable needles, syringes, cotton swabs, alcohol, pencils, and note paper to the
appropriate patient care unit.
7. The nurse wheeled the cabinet to the door of the patient’s room and gave the medications
to the patient. With each dose of medication the nurse was supplied a single dose of
correct medication except in the use of multiple dose vials, a medicine card in the
26
traditional format with dilutions pre-calculated and any special remarks included, and
pharmacy notes for the nurse - a card-size resume of drug information pertinent to
administration and observation of effects of the drug.
8. After administration, the nurse kept the pharmacy notes for reference (in case of unusual
symptoms or reactions in the patient) and the medicine cards for charting her medicines.
She removed the PRN medications from the cabinet by placing them in the patient’s
cubicle at the nursing station, and placed the drug cabinet in position for returning to the
pharmacy. The medicine cards were to be destroyed after use. If the medication cards
were to be re-used, instead of a white card, a yellow medicine card was prepared by the
central secretary.
9. The pharmacy technicians cleared the returned cabinets, placing returned and unused
medications and extra pharmacy notes for the nurse in a special section where they
remained for the subsequent dose of the same medication to be given. Special notes
placed in the drawers by the nurses were given to the pharmacist, such as those
requesting duplicate doses to be sent for a patient who frequently loses the first one.
10. At the end of each day the central secretary pulled the copies of each patient medication
record, priced the doses listed and sent the charge to the business office.
11. Special provisions for special situations: (1) Stat orders and orders requiring
compounding: these were separated from the rest of the Unit Dose Dispensing System.
(2) PRN orders: the nurse was instructed to transfer the medication and drug information
card from the cabinet to the patient’s cubicle at the nursing station. (3) Narcotics,
Barbiturates, Sedatives, and PRN analgesics: these were kept as floor stock. Emergency
drugs were also kept as floor stock for emergency night orders or by the on-call

27
pharmacist. (4) Night orders: those written after 5 PM were filled by the night or on-call
pharmacist with enough medication to last till morning.
No measure of the Medication Errors comparing the two systems (centralized Unit Dose
Dispensing System and floor stock system) was obtained as this was considered outside the
scope of this exploratory study to test the workability of the system (McConnell, Barker, &
Garrity, 1961).
The time study data were not sufficient to support the hypothesis that the Unit Dose
Dispensing System can reduce the nursing time required, due to the small sample size of
medications administered on a pediatric floor (McConnell, Barker, & Garrity, 1961).
Explanatory Study
In the fall of 1961, an explanatory investigation of the effect of a fully developed
centralized Unit Dose Dispensing System was funded by the U.S. Public Health Service, and
conducted in the University of Arkansas Medical center (Heller, 1964). For this study, the
pharmacy was remodeled as a small pharmaceutical manufacturing firm to prepare the packaging
of all doses as unit doses: an automated conveyor elevator system delivered the doses to all
floors, and the pharmacy stuff was expended and retrained to include new personnel such as
pickers.
The qualitative results confirmed that the centralized unit dose dispensing process under
the pharmacy permitted three important improvements (Barker & Heller, 1963b): (1) use of
efficient and accurate mechanical and electronic equipment, (2) an improved working
environment for personnel performing this task, and (3) supervision of the process by a
pharmacist.
28
The quantitative results (Barker, 1969; Barker, Heller, Brennan, & Sheldon, 1964)
showed that the centralized Unit Dose Dispensing System significantly reduced medication
errors. The pilot study (Barker, Heller, Brennan, & Sheldon, 1964) results showed that the
average error rates with wrong time errors were 16.1% in the control period and 7.2% in the
experimental period (14.4% in the control period and 1.8% in the experimental group if wrong
time errors were excluded). The error rates by types showed that the Unit Dose Dispensing
System effectively reduced errors of omission, wrong dose, extra dose, unordered drug, and
wrong route. Wrong time errors were not reduced significantly.
The utilization of nurse and pharmacist time was improved (Barker, Heller, & Sheldon,
1964). Nursing time spent in drug preparation was reduced 13.7% by the experimental systems,
and 57% of the saved time (7.7% of total time) was transferred into such desirable categories as
bedside nursing, administration of drugs, and division management. The pharmacists' time saved
was 39.4%, of which 63% (24.9% of total time) was transferred to the desirable tasks of editing
medication files and providing drug information to assist the physicians in the selection of drugs
and direct the nurses for the proper administration.
The control period (floor stock system) was studied for 6 months on 6 nursing divisions
in 1964. The experimental period (unit dose system) was studied for 2 months on 2 nursing
divisions in 1965 due to the limitation of funds (Barker, 1969). The results showed that
medication error rate with wrong time errors but excluding “wrong brand” as errors was 25.9%
in the control group and 12% in the experimental group (13% in the control group and 1.9% in
the experimental group without wrong time errors and “wrong brand errors”). The authors of the
study also recognized that extraneous factors such as historical events occurring between the two
periods could have influenced the data due to the time lapse between the two evaluation periods.
29
Decentralized Unit Dose Dispensing
The goals of a research group at the University of Iowa were to study a version of the
Unit Dose dispensing concept operationalized around a pharmacy substations on each nursing
floor, as shown below (Tester, 1964):
1. Reduction of medication errors,
2. Reduction of nursing time devoted to medication activities,
3. Increased utilization of pharmacists in line with their training,
4. Reduction of drug inventory,
5. Greater control over drugs,
6. Provision of a check by a pharmacist on prescriptions written by medical staff, and
7. Evaluation of the system by medical, nursing, and pharmacy staffs.
Operational Definitions: Differences
The operational definitions of terms related to medication errors and unit dose dispensing
were defined somewhat differently in studies subsequent to the original definitions proposed by
Barker and colleagues (Barker, Kimbrough, & Heller, 1966).
Unit dose packaging was defined as the process of enclosing a single dose of medication
within a single compartment including proper identification of this compartment (Black &
Tester, 1964).
Unit dose dispensing was defined as the practice of providing to the nursing station a
quantity of medication sufficient for one dose in a single compartment, just prior to the
scheduled administration time (Black & Tester, 1964).
30
Decentralized pharmacy was defined as a pharmacy substation which replaced the drug
storage areas in four nursing stations and provided pharmacy service on a 24-hour basis directly
to these four wards (Black & Tester, 1964, 1967).
Medication error was defined as any deviation during the demonstration period of
interpretation and transcription, preparation and administration (Black & Tester, 1967). This
definition of medication error defined by Black and Tester was found to be difficult to replicate
because it is confusing regarding how many errors should be counted in when an error happened
in the period of transcription and was not prevented in the period of preparation and
administration, and what the denominator of the error rate was if one dose experienced three
different errors during that period.
The results of this study were reported as follows (Black & Tester, 1967):
1. Medication errors dropped from 2.2% in the conventional system to 0.5% in the
decentralized unit dose system, and discrepancies were reduced from 1.1 to 0.3%.
2. The amount of nursing time required for medication activities was reduced by an average
of 14.49 hours per day for the four medical wards.
3. The availability and utilization of the pharmacist as a drug consultant to the physician and
nurse was perceived to be improved. But no evidence was offered.
4. The revenue loss to the hospital as a result of patient charges lost showed 0.028 of each
dollar lost as compared to 0.377 in the conventional system.
5. The drug inventory throughout the hospital was claimed to be minimized as drug
deterioration, obsolescence, pilferage, and capital investment were reduced.
31
6. The amount of floor space required for medication storage on each nursing station was
reduced. The pharmacy substation occupied 183.5 square feet plus 85.0 additional square
feet for storage, as compared to 325.2 square feet within the wards areas.
Although this research group reported using observation as a method to detect medication
errors, no details were provided on the methods or the results obtained. No statistical analysis
was applied to compare the two systems.
Subsequent Studies of the Unit Dose Dispensing System
Subsequent studies testing the effect of the Unit Dose Dispensing System were reported,
and positive results were obtained (Hynniman, Conrad, Urch, Rudnick, & Parker, 1970; Means,
Derewicz, & Lamy, 1975; Schnell, 1976). The following describes these studies.
Hynniman and colleagues compared the error rate at the University of Kentucky Hospital
which used a Unit Dose Dispensing System with the error rates in four hospitals of similar bed
size (Hynniman, Conrad, Urch, Rudnick, & Parker, 1970). The hospital with a Unit Dose
Dispensing System had an error rate of 3.5% compared with error rates ranging from 8.3 to
20.6% (specifically 8.3%, 9.9%, and 20.6%) in the three hospitals with the prescription order
system and 11.5% in the hospital with the floor stock system. A significant limitation was that
the observers didn’t accompany the nurse to the patient’s bedside. Hence, several types of errors
including wrong route, wrong administration rate, and wrong administration technique errors
couldn’t be captured by the observer. Also, the denominator for calculating the medication error
rate was defined as the number of medication doses administered but not including those ordered
but omitted. This study would have yielded a larger percentage of error rate than what was
reported if Barker’s definition of total opportunities for errors (T.O.E.s) was used.

32
Means et al (1975) compared the medication error rates of a multi-dose dispensing
system with a computer-based Unit Dose Dispensing System in the Johns Hopkins Hospital.
Two similar adult, medical, 30-bed patient care units, each serviced by a different drug
distribution system (multi-dose and computer-based unit dose distribution system), were studied
for 60 days. The error rates were 7.35% in the patient care unit with multi-dose dispensing
system and 1.61% in the patient care unit with the computer-based Unit Dose Dispensing
System. The limitation included the exclusion of omission errors. The author explained that
omission errors were not included because the observer couldn’t observe all the doses
administered and the doses might be administered by a physician or another nurse without the
knowledge of the observer. The author commented that if omission errors had been included, the
medication administration error rate for the study hospital would be higher.
Schnell and colleagues measured the error rates for two months in two phases before and
after the installation of the Unit Dose Dispensing System in four Canadian hospitals (Schnell,
1976). The overall error rates in Hospital B, C, and D decreased from 42.9 to 23.3%, 20.1 to
7.8%, and 38.5 to 23.1% (14.5 to 12.9%, 7.7 to 2.0%, and 9.6 to 3.7%, excluding wrong-time
errors). However, the error rate was unexpectedly increased from 37.2 to 38.5% in hospital A
(8.9 to 14.6%, excluding wrong-time errors). The author explained that the increase in hospital A
was due to an increase in the number of extra dose errors which were caused by less strict
adherence to procedures of enforcement of the hospital’s automatic stop order policy by the
pharmacist in the unit dose system. If the wrong-time errors and extra dose errors were excluded
in hospital A, the error rates would be 8.5% before and 5.8% after the installation of the Unit
Dose Dispensing System. For all hospitals the mean error rates would be 10.3% before and 5.9%
after the installation of the Unit Dose Dispensing System excluding wrong-time errors. Schnell
33
graded errors for potential clinical significance by assigning a number on a scale of 0 to 100
according to the error categories. The overall index of significance was calculated by adding the
numbers the number of errors in each category multiplied by its index value and the sum of the
total was divided by the total number of errors. Schell calculated the index of clinical
significance at the range from 28 to 47.1 in the Unit Dose Dispensing System and from 32.8 to
38.6 in the traditional multi-dose drug distribution system. If wrong time errors with an index
value of 20 which influenced the index of significance to less severe were excluded, the index of
clinical significance would jump to the range from 63 to 69.9 in the Unit Dose Dispensing
System and from 68.4 to 73.5 in the traditional multi-dose drug distribution system.
Barker and colleagues evaluated a Unit Dose Dispensing System at a large teaching
hospital, proposed recommendations to improve the existing system and re-evaluated the new
system after the recommendations were implemented to varying extents (Barker, Harris,
Webster, Stringer, Pearson, Mikeal, Glotzhober, & Miller, 1984a, 1984b, 1984c). Four nursing
units were studied over 17-day period observations in the initial study (Barker et al., 1984a). The
total medication error rate for initial study was 9% excluding wrong-time errors. The error rate
excluding wrong-time errors was 3-5 times greater than the rates in other five hospitals in 1960-
1970s after they installed unit dose system (Barker, Heller, Brennan, & Sheldon, 1964; Barker,
Kimbrough, & Heller, 1966; Hynniman, Conrad, Urch, Rudnick, & Parker, 1970; Means,
Derewicz, & Lamy, 1975; Schnell, 1976). The consultant group proposed 14 recommendations
for improving the existing Unit Dose Dispensing System (Barker et al., 1984c). The hospital
fully implemented three recommendations: cancellation of the use of pharmacy substations,
assigning pharmacy to prepare and maintain the primary medication order records, and creation
of strategic workload attack teams to go to nursing units during the peak workload periods. The

34
last two recommendations were expected to reduce error rates and response time. Six
recommendations were partially implemented. Four of them were expected to reduce error rate:
using dispensing envelopes, increase unit dose packaging, increasing the frequency of deliveries,
and dispensing PRN medications on request. Five recommendations were not implemented:
using computer to control medication and communicate, increasing the use of pneumatic tube,
redesigning pharmacy facilities, reduction of lead time for IV orders, and developing and
posting operational definitions for the terms “stat”, “now”, and “emergency” throughout the
hospital. One and half years after the fourteen recommendations were implemented to different
extents, another study was conducted to measure the medication error rates and the response
times (Barker et al., 1984b). Response times for routine medication orders decreased by 55%. No
significant differences in medication error rates for any of the error types were found. The errors
were evaluated again to find the clues that explained the failure to achieve a significant reduction
in medication errors. The errors were primarily attributed to the failure of implementation of
these recommendations: computer printing and sorting of orders, use of dispensing envelopes for
medications delivered in true unit dose form, and packaging of all medications in unit dose form.
This in-depth evaluation indicated the importance of fully implementation of the Unit Dose
Dispensing System and the need for close monitoring the performance standards to achieve the
expected lowest error rate.
Dean et al compared the medication error rates (mostly oral drugs) in a U.S. hospital
with those in a U.K. hospital (Dean, Allan, Barber, & Barker, 1995). The U.K. hospital had a
ward-based system without transcription of orders in which a pharmacist visited each ward
several times daily, reviewed each patient’s medication chart, and wrote additional instructions
to the nurse regarding administration. The U.S. hospital used a partially automated Unit Dose
35
Dispensing System with a MedStation device for controlled drugs, some first doses, and PRN
doses. The medication error rate in the U.S. hospital was 6.9%, significantly higher than the
3.0% rate in the U.K. hospital. The authors attributed the difference of error rates in two health
care systems to (1) The U.K. hospital eliminated transcription process which reduce the risk of
errors induced by transcription, and (2) The U.K. hospital had the greater availability of
pharmacists on the ward.
In 2005, Zhang et al reported that they had first introduced an application of the unit dose
dispensing concept to oral medications in a Chinese hospital pharmacy (Zhang, Zhao, Li, Wang,
& Gong, 2005). The authors introduced the background and implementation of the Unit Dose
Dispensing System in US hospital pharmacies and described the trends and likelihood of the Unit
Dose Dispensing System in Chinese hospital pharmacies. However, the effect of their Unit Dose
Dispensing System on medication errors was not reported in the article.
Advantages and Disadvantages of the Unit Dose Dispensing System
The advantages of the unit dose system over alternative distribution procedures were
cited as follows in the official statement of the American Society of Hospital Pharmacists (ASHP)
(American Society of Hospital Pharmacists, 1975):
1. A reduction in the incidence of medication errors,
2. A decrease in the total cost of medication-related activities,
3. A more efficient usage of pharmacy and nursing personnel, allowing for more direct
patient-care involvement by pharmacists and nurses,
4. The improvement of overall drug control and drug use monitoring,
5. More accurate patient billings for drugs,

36
6. The elimination or minimization of drug credits,
7. Greater control by the pharmacist over pharmacy workload patterns and staff scheduling,
8. A reduction in the size of drug inventories located in patient-care areas, and
9. Greater adaptability to computerized and automated procedures.
The ASHP 1975 Statement identified and summarized four distinctive elements common
to all the Unit Dose Dispensing Systems (American Society of Hospital Pharmacists, 1975).
1. Medications are contained in, and administered from, single unit or unit dose packages;
2. Medications are dispensed in ready-to-administer form to the extent possible;
3. Not more than a 24-hour supply of doses is provided to or available at the patient-care
area at any time for most medications; and
4. A patient medication profile is concurrently maintained in the pharmacy for each patient.
The growth of the Unit Dose Dispensing System was tracked by the ASHP in a national
survey repeated every few years. The ASHP’s statement and periodic survey demonstrated
confusion among hospital pharmacists about the concept of the Unit Dose Dispensing System
and the variety of the system’s implementations (Barker & Pearson, 1986).
The limitations of the the Unit Dose Dispensing System then being implemented were
summarized, as shown below (Barker & Pearson, 1986):
1. The frequency of scheduled deliveries was lower than the expectation to be more or equal
to 9-10 times per day based on the average number of patient doses administered in the
hospital. The frequency of dose delivery times in the model system in the study at UAMC
was 14 times/day. The evidence showed that infrequent deliveries produced the need for
a greater number of adjustment doses to be sent to the floor for placement in the cart by
37
the nurses, which had the effect of increasing the rate of medication errors (Barker &
Pearson, 1986).
2. The first dose of PRN orders was not being sent to the patient care areas in advance of
need, which increased the opportunity for omission errors.
3. Another limitation of systems claimed to be unit dose was the extent to which not all
doses were dispensed in true unit dose packages. The dosage forms such as injectables,
ointments, eye drops, and oral liquids were more difficult for the pharmacist to measure
and package (Barker & McConnell, 1962).
The ASHP national survey in 2008 reported that 86.7% of hospitals dispensed a majority
of oral medications in unit dose form and 70% of hospitals dispensed a majority of injectable
medications in unit dose form (Pedersen, Schneider, & Scheckelhoff, 2009). However, the
results were confounded with the percentage of hospitals who also claimed to have Automated
Dispensing Cabinets (ADCs) using the original Pyxis matrix drawer configuration that allows
access to all medications stocked in that drawer, which falls closer to the definition of floor
stock. The survey in 2008 reported that a majority of hospitals (83%) used automated dispensing
cabinets (ADCs) in their medication distribution systems (Pedersen, Schneider, & Scheckelhoff,
2009). However, only 51.5% of hospitals used individually secured pockets in a matrix drawer
while 48.5% of hospitals used the original Pyxis matrix drawer configuration that allows access
to all medications stocked in that drawer (Pedersen, Schneider, & Scheckelhoff, 2009).
The Intravenous (IV) Medication Use Systems
Intravenous (IV) medication administration refers to the process of giving medication
directly into a patient's vein (Martelli, 2002). Methods of administering IV medication may
38
include giving the medication by rapid injection (push) into the vein using a syringe, giving the
medication intermittently over a specific amount of time using an IV secondary line, or giving
the medication continuously mixed in the main IV solution. IV medications are most often given
through a peripheral line or saline IV lock, but may also be administered direct IV, through an
implanted vascular access port or through a central line (Martelli, 2002).
The administration techniques on IV medication delivery usually included IV push,
retrograde system, volumetric-chamber set, piggyback systems, and syringe pump (Reilly, 1987).
IV drug delivery systems currently include manufacturer-prepared products, pharmacy-
based IV admixture system, point-of-care activated systems, IV push systems, augmented IV
push systems (such as syringe pumps), and volume-control chambers (Sanborn, Gabay, &
Moody, 2009). The systems were ranked using a decision analysis methodology by an
independent, interdisciplinary experts panel based on 4 domains: safety, cost, simplicity of use,
and education and training needed for operation (Sanborn, Gabay, & Moody, 2009).
Manufacture prepared products were considered to be the safest drug delivery systems overall.
However, the recent event of TPN contamination in six hospitals in Alabama resulting in over 10
deaths showed that IV products prepared by outsourcing this service to centralized providers
may not be safe as expected (Institute for Safe Medication Practices, 2011).
Evaluation of Medication Use System Performance
The theoretical principles recommended for the design and evaluation of a medication
use system were summarized by Barker and Pearson as below (Barker & Pearson, 1986):
1. The law of requisite variety,
2. Simplification,

39
3. Standardization,
4. Mechanization and automation,
5. Specialization,
6. Improved utilization of personnel, and
7. Centralization
The criteria for the measurement of the performance of a medication use system were
cited by Barker and Pearson as below (Barker & Pearson, 1986).
1. Quality (accuracy),
2. Efficiency,
3. Control of inventory,
4. Utilization of personnel,
5. Lost inventory, and
6. Lost charges
Medication error or medication accuracy was considered as the No. 1 objective to
measure for the performance of the medication use system (Barker & Pearson, 1986). Traditional
efforts at error reduction have focused on individuals and episodes, using training, exhortation,
rules and sanctions to improve performance (Leape, 1994). Human factors specialists and error
experts reject this traditional approach, noting that it is more effective to change the system as a
whole to reduce the likelihood of accidents (Moray, 1994). Focusing on the nurse’s individual
performance merely to give the right medication to the right patient in the right dose by the right
route at the right time (5 rights) was far from enough to ensure the safety of medication use
system. Poor system design makes errors difficult to detect in order for them to be intercepted
before injury occurs (Leape, Bates, Cullen, Cooper, Demonaco, Gallivan, Hallisey, Ives, Laird,

40
& Laffel, 1995). Although an individual’s performance may be identified as the proximate cause
of the event, an assessment of the entire system is necessary to identify risk points, or weak links,
that may have facilitated the individual’s less-than-optimal performance (Cousins, 1998).
Problem of Medication Administration Errors and Detection Technologies
Although errors can happen at any stage of the medication use system, the ultimate
outcome measure of the medication use system from the patient’s perspective is the rate of errors
which reach the patient at the point of administration. This was first offered as the measure of the
quality of a hospital medication system at the time when a Unit Dose Dispensing System was
being developed. Thus, prescribing errors, transcribing errors, dispensing errors and self-
administration errors were excluded from the focus of this dissertation. The study of prescribing
errors for example typically involves expert judgment on whether each medication was
prescribed appropriately and effectively for treating the disease state of particular patients.
In 1962, the frequency of medication errors was first studied by Barker and McConnell
by disguised direct observation method at a rate of 16.2% (1 error every 6 doses administered)
and 14.7% without wrong time errors (Barker & McConnell, 1962). Between 1960 and 1990,
medication error studies were mostly focused on the diffusion of the Unit Dose Dispensing
System in hospitals. After 1990, medication error studies were focusing on the effect of
environmental factors, automations, and technologies.
The operational definitions and categories of medication administration errors are
important to critique the validity of the research on medication errors, which were described
under the Concepts and Operational Definition.

41
Clinical Significance
The issue of measuring and comparing the relative severity of errors has been addressed
in numerous studies. The operational definitions used have differed widely. Barker and
colleagues’ study indicated that 66.1 to 74.2% of all medication errors could be considered
serious depending upon whether wrong time errors were included or not (Barker, Kimbrough, &
Heller, 1966). Hynniman et al. reported that 59.1% of medication administration errors detected
were considered as serious (Hynniman, Conrad, Urch, Rudnick, & Parker, 1970). Schnell
reported that the index of clinical significance of medication administration errors they created
ranged from 28.0 to 47.1 (including wrong-time errors) and from 63.0 to 73.5 (excluding wrong-
time errors) (Schnell, 1976). Dean and Barber developed a method of scoring the severity of
medication errors on the basis of potential clinical outcomes without the knowledge of patient
outcomes (Dean & Barber, 1999). Thirty professional from four U.K. hospitals scored potential
patient outcomes of 50 selected medication errors on the scale of 0 to 10, where 0 represented a
case with no potential clinical effect on the patient and 10 represented a case with potential
clinical effects of death. The results showed that 57.5% agreement on the severity of a
medication error between any two assessments, regardless of the judge and the occasion on
which the case was assessed. In order to achieve a Generalizability Coefficient of 0.8, at least
four judges would have to score each case, each on one occasion, with the mean score used as a
severity indicator. The reliability and validity were not affected by the professions of the judges
or the number of the occasions on which the errors were assessed.

42
Medication Errors Detection Methods
The methods that have been used or proposed were summarized by Flynn and Barker as
below (Flynn & Barker, 2007):
1. Direct observation,
2. Chart review,
3. Incident reports,
4. The critical incident technique,
5. Anonymous self-reports,
6. Attending medical rounds to listen for clues that an error has occurred,
7. Detecting omission errors on the basis of doses returned on the medication cart,
8. Urine testing - omitted or unauthorized drugs,
9. Examination of death certificates,
10. Stimulated self-report using interview,
11. MAR comparison to physician orders,
12. Computer-assisted monitoring,
13. Attending nurses change-of-shift report,
14. Comparison of drugs removed from automated dispensing device for a patient with
physician orders , including override, and
15. Data mining
Observation
A direct observation technique which was capable of capturing more valid medication
errors in the medication use system than other error detection methods was widely accepted and
used in medication error studies since 1960s.
43
The disguised direct observation technique in the medication error study was developed
by Barker and McConnell (Barker & McConnell, 1962). In this study, an observer randomly
selected a nurse giving medication and witnessed the preparation and administration of each
dose. The nurses selected for observing were only told that the purpose of the study was to
optimize the medication distribution system and were not aware of the real purpose of the error
study. If the nurse was aware of the goal of error study, an undisguised direct observation
method was used. The observer wrote notes on what the subject did in the preparation and
administration processes. The notes were later compared with the physician’s order. An error
was counted if the nurse didn’t carry out the order accurately. The results estimated that 51,200
errors probably occurred when extrapolating the 2-week data collected by direct observation on
morning, evening, and night shifts, compared with 36 official incident reports in the hospital
over a one year period.
A study of medication administration errors by direct observation was conducted in 36
health care facilities (Barker, Flynn, Pepper, Bates, & Mikeal, 2002). The medication
administration error rate was reported as 19% (excluding wrong time errors, the rate was 10%).
The most frequent errors were wrong time errors (43%), omission errors (30%), wrong dose
errors (17%), and unordered drug errors (4%).
The direct observation method was recognized as superior due to the following
advantages (Barker, Flynn, & Pepper, 2002):
Knowledge of errors by subjects is not required,
Willingness to report is not required,
Remembering is not required,
The ability to communicate is not required,
44
Selective perception of subjects is unrelated,
Observer inference is involved, and
The effect of the observer on the observed is not significant when the observer is trained
to be non-intrusive and the subject is busy at work.
The major disadvantages of direct observation method are fatigue and Hawthorne Effect
(Note: the alteration of behavior by the subjects of a study because they are being observed) of
the observer on the subjects (Dean & Barber, 2001; Flynn & Barker, 2000). Dean and Barber
conducted a study on the validity and reliability of observational methods for studying
medication errors at a U.K. hospital (Dean & Barber, 2001). The results showed that observation
of nurses during drug administration and discreet intervention by the observer didn’t
significantly affect the medication administration error rate. It has been demonstrated that
individuals and groups adapt quickly to an observer’s presence and act as they would usually act
and if the observer takes care to be unobtrusive and not to give the subjects observed the feeling
that judgments are being made, the observer as an influential stimulus is nullified (Kerlinger &
Lee, 1999).
Chart Review
Chart review was often used in the studies of Adverse Drug Events (ADEs) (Leape et al.,
1995) and the clinical significance of medication errors (Flynn & Barker, 2000). The limitation
of chart review is that sometime the drug use related symptoms were not always listed on the
patient chart.
45
Incident Report
In the United States today, medication error reports collected and analyzed on national
level are (1) JCAHO Sentinel Event Reporting System, (2) MedWatch, which is operated by the
Food and Drug Administration (FDA), (3) U.S. Pharmacopeia Institute for Safe Medication
Practice Medication Errors Reporting Program (USP-ISMP MERP), and (4) MEDMARX, a
national database of medication errors for use by hospitals (Cousins & Calnan, 2000; Smetzer &
Cohen, 2007). The goal of the USP-ISMP MERP and MedWatch is to identify the circumstances
in which errors occur and to educate the health professional so that the chances of recurring
errors are lessened (Cousins & Calnan, 2000).
Error reports should be categorized to the severity of patient outcome according to the
index from the National Coordinating Council for Medication Error Reporting and Prevention
(NCC MERP), as shown below (Cousins & Calnan, 2000):
No Error
Category A: Circumstance or events that have the capacity to cause error
Error, No Harm
Category B: An error occurred but the error didn’t reach the patient
Category C: An error occurred that reached the patient but didn’t cause patient harm
Category D: An error occurred that resulted in the need for increased patient monitoring
but no patient harm.
Error, Harm
Category E: An error occurred that resulted in the need for treatment or intervention and
caused temporary patient harm.

46
Category F: An error occurred that resulted in initial or prolonged hospitalization and
caused temporary patient harm.
Category G: An error occurred that resulted in permanent patient harm.
Category H: An error occurred that resulted in a near death event.
Error, Death
Category I: An error occurred that resulted in patient death.
The limitation of the self-report is that the person is aware that an error occurred and is
willing to report. Barker and McConnell found that even though the nurse is aware of the error,
she is still hesitant to report it if a physician advises against reporting the error, the nurse believes
that the error will not harm the patient, or the error is omission or wrong time error.
The direct observation method was confirmed to be able to detect more medication errors
than the other two methods: chart review and incident report (Flynn, Barker, Pepper, Bates, &
Mikeal, 2002). In this study, observers detected 300 of 457 pharmacist-confirmed errors made on
2556 doses (11.7% error rate) compared with 17 errors detected by chart reviewers (0.7% error
rate) and 1 error detected by incident report review (0.04% error rate).
Errors in IV Medication Use
There are 41 steps in the path from the prescription of an infusion to its administration
(Fraind, Slagle, Tubbesing, Hughes, & Weinger, 2002). Medication errors may be introduced
during any of these steps of this complex process.
Recently, serious and life-threatening IV medication errors have been heavily reported.
For example, in 2006, 1,000 times stronger than recommended dosages of IV heparin caused the
deaths of three infants in Methodist Hospital in Indianapolis (Davies, 2006). Similarly in 2007, a
47
massive overdose of heparin was given to three infants at Cedars-Sinai Medical Center in
Hollywood (Phend, 2007). In 2008, more than 100 times the recommended dosage of IV heparin
was given to 17 children in Neonatal Intensive Care Unit (NICU) at a hospital in Corpus Christi,
Texas (Gray, 2008).
The USP’s MEDMARX database between 2002 and 2006 revealed that parenteral
medication errors were nearly three times as likely to cause harm or death (3.0%) compared with
other drug form errors reported (1.2%). The majority (79%) of harmful or fatal parenteral errors
involved the IV route of administration, and 58% of parenteral errors originated during their
administration (MEDMARX Database 2002-2006, 2008).
Based on self reports submitted to the USP-ISMP MERP, the ISMP created and
periodically updated a list of potential high-alert medications (Institute for Safe Medication
Practices, 2008). During February-April 2007, 770 practitioners responded to an ISMP survey
designed to identify which medications were most frequently considered high-alert drugs by
individuals and organization.
Most of the high-alert medications were IV drugs, which are highlighted in Figure 1.
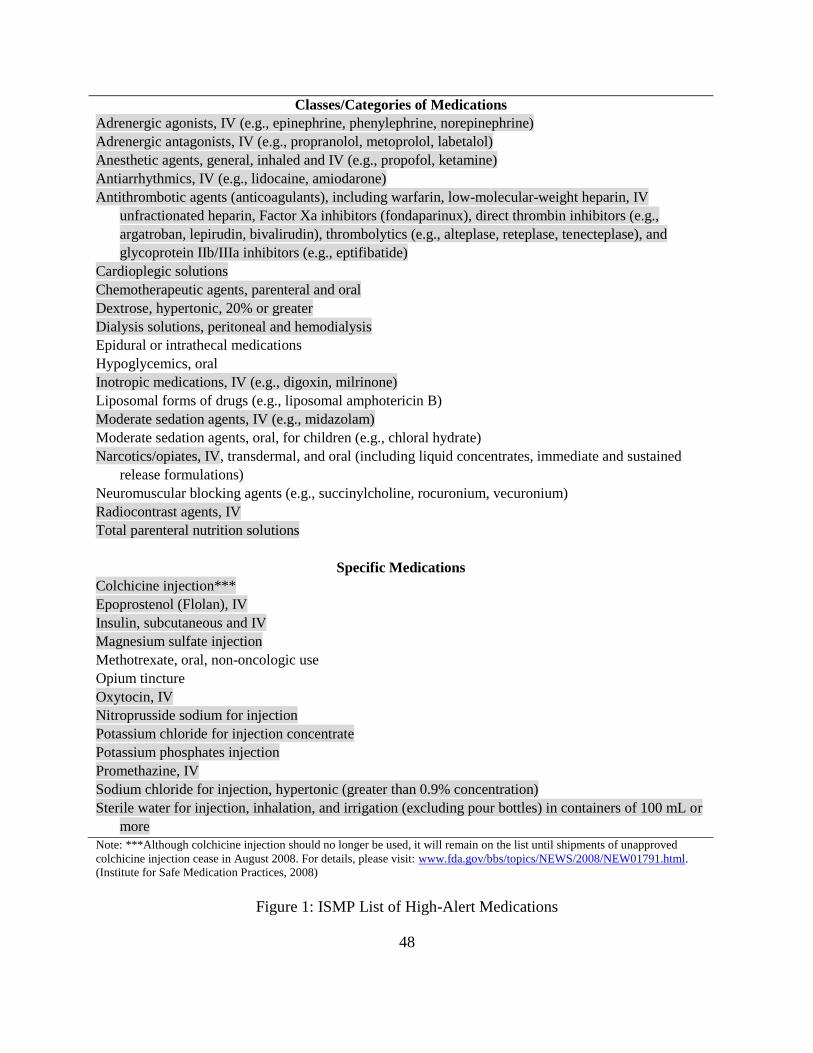
48
Classes/Categories of Medications
Adrenergic agonists, IV (e.g., epinephrine, phenylephrine, norepinephrine)
Adrenergic antagonists, IV (e.g., propranolol, metoprolol, labetalol)
Anesthetic agents, general, inhaled and IV (e.g., propofol, ketamine)
Antiarrhythmics, IV (e.g., lidocaine, amiodarone)
Antithrombotic agents (anticoagulants), including warfarin, low-molecular-weight heparin, IV
unfractionated heparin, Factor Xa inhibitors (fondaparinux), direct thrombin inhibitors (e.g.,
argatroban, lepirudin, bivalirudin), thrombolytics (e.g., alteplase, reteplase, tenecteplase), and
glycoprotein IIb/IIIa inhibitors (e.g., eptifibatide)
Cardioplegic solutions
Chemotherapeutic agents, parenteral and oral
Dextrose, hypertonic, 20% or greater
Dialysis solutions, peritoneal and hemodialysis
Epidural or intrathecal medications
Hypoglycemics, oral
Inotropic medications, IV (e.g., digoxin, milrinone)
Liposomal forms of drugs (e.g., liposomal amphotericin B)
Moderate sedation agents, IV (e.g., midazolam)
Moderate sedation agents, oral, for children (e.g., chloral hydrate)
Narcotics/opiates, IV, transdermal, and oral (including liquid concentrates, immediate and sustained
release formulations)
Neuromuscular blocking agents (e.g., succinylcholine, rocuronium, vecuronium)
Radiocontrast agents, IV
Total parenteral nutrition solutions
Specific Medications
Colchicine injection***
Epoprostenol (Flolan), IV
Insulin, subcutaneous and IV
Magnesium sulfate injection
Methotrexate, oral, non-oncologic use
Opium tincture
Oxytocin, IV
Nitroprusside sodium for injection
Potassium chloride for injection concentrate
Potassium phosphates injection
Promethazine, IV
Sodium chloride for injection, hypertonic (greater than 0.9% concentration)
Sterile water for injection, inhalation, and irrigation (excluding pour bottles) in containers of 100 mL or
more
Note: ***Although colchicine injection should no longer be used, it will remain on the list until shipments of unapproved
colchicine injection cease in August 2008. For details, please visit: www.fda.gov/bbs/topics/NEWS/2008/NEW01791.html.
(Institute for Safe Medication Practices, 2008)
Figure 1: ISMP List of High-Alert Medications
49
The concerns about the safety of intravenous drug therapy due to their severity were
reported in the late 1960s. A survey conducted by Patterson et al in Louisville Veterans
Administration Hospital showed that 86% of intravenous fluids infused to the inpatients
contained more than one drug (some contained as many as 5 drugs) and the author expressed the
concerns about drug incompatibilities and the length of time between preparation and
administration (Patterson & Nordstrom, 1968).
Thur and colleagues in 1972 observed 331 parenteral admixtures prepared by nurses for a
10-day period on two medical-surgical nursing units in a 350-bed nongovernmental, general,
short-term teaching hospital (Thur, Miller, & Latiolais, 1972). Error categories included the
preparation of wrong drug or IV solution, wrong dosage, unordered drugs or preparation of
admixtures containing incompatible drugs. Omission errors and wrong time errors were not
included in the study. The inclusion criteria for wrong dosage errors and the calculation of error
rates were not provided in the study. The results reported that the error rate of preparation of
parenteral admixture by nurses was 21%. The major factors leading to parenteral admixture
medication errors were non-adherence to written nursing procedures, transcription errors
involving medication cards, number of interruptions during each admixture and non-use of
available information sources.
A study by Perlstein et al evaluated Medical personnel (nurses, physicians, and
pharmacists) on their ability to correctly calculate drug doses for sick newborns in a pediatric
center (Perlstein, Callison, White, Barnes, & Edwards, 1979). Five registered pharmacists who
were tested demonstrated far better computational skills than either the nursing or physician
group. The five pharmacists had a higher mean score of drug calculation (96%) than the eleven
pediatricians (89%) and the twenty seven nurses (75.6%). A repeat evaluation of 95 nurses

50
showed an 86.2% accuracy rate, with experienced nurses performing no better than
inexperienced nurses.
O’Hara reported that 168 doses had at least one error in 179 observed IV doses (94%), Of
the 132 doses given by senior house officers, 129 (98%) had at least one error, compared with 39
of the 47 doses (83%) given by nurses (O’Hara, Bradley, Gallagher, & Shields, 1995). This study
indicate the accuracy problem in IV preparation and administration processes, but the data could
not be compared with other studies because no details of medication errors were provided and
the the error categories (Incorrect time, Incorrect rate, Incorrect volume, Incorrect diluents,
Incorrect method, Dose duplication, and Dose omission) were different from other studies.
An observation study (Flynn, Pearson, & Barker, 1997) of errors in IV admixture
compounding at five large hospital pharmacies detected a 9% error rate (147 errors per 1679
doses). The rate of errors that were potentially clinically significant was 1.5%. The most
common type of error was wrong-dose, defined as a deviation of 5% or more from the dose listed
on the pharmacy label. The product type with the highest error rate was Total Parenteral
Nutrition (TPN) solutions (37% with manual preparation and 22% when some automation was
used).
Schneider et al conducted an undisguised observation study of IV medication errors in
the PICU at the university hospital in Lausanne, Switzerland (Schneider, Cotting, & Pannatier,
1998). The error categories were based on Guidelines on Preventing Medication Errors in
Hospitals in 1993 (American Society of Hospital Pharmacists, 1993) and the error categories
described by Allan and Barker in 1990 (Allan & Barker, 1990). The deviation of wrong dose
error was defined as a dosage varying by ±20% to the medical instruction which is larger
compared with the operational definition by Allan and Barker. The definitions of wrong

51
administration technique error and wrong preparation error were not clearly defined. Including
wrong time errors, 74 errors were identified in the total opportunities for error of 275 (an error
rate of 26.9%). When the wrong time errors were excluded, 50 errors were identified (an error
rate of 18.2%). The most frequent errors were wrong time errors (32.4%), wrong administration
technique errors (32.4%), and preparation errors (23%).
Hartley and Dhillon conducted a disguised observation study of IV medication
administration errors at two general surgical wards (each with 26 beds) and one general medical
ward in a 800-bed general hospital in the United Kingdom (Hartley & Dhillon, 1998). Excluding
timing errors, 86 errors were observed in the total of 323 IV infusions observations, giving an intravenous
medication error rate of 26.9%. The most frequent errors were omission errors (46.5%), wrong
preparation technique (26.7%), wrong dose error (10.5%), and wrong administration technique (10.5%).
The limitations of the article included that omission errors with acceptable reasons such as patients away
from the ward were counted in but the denominator of the error rate didn’t include omission errors. In
addition, the deviation of wrong dose preparation error was not defined clearly such as not all
powder dissolved.
Tissot et al conducted a 30 days undisguised observation study of medication errors
described by the American Society of Health System Pharmacists in Guidelines on Preventing
Medication Errors in Hospitals in 1993 (American Society of Hospital Pharmacists, 1993) in
three 15-bed ICU units at a university hospital in France (Tissot, Cornette, Demoly, Jacwuet,
Barale, & Capellier, 1999). The results showed that 132 errors were detected in 2009 observed
nurses acts (6.6% error rate). The denominator was observed nurses’ acts which differed from
“Total opportunities for error” defined by Barker and McConnell (Barker & McConnell, 1962).
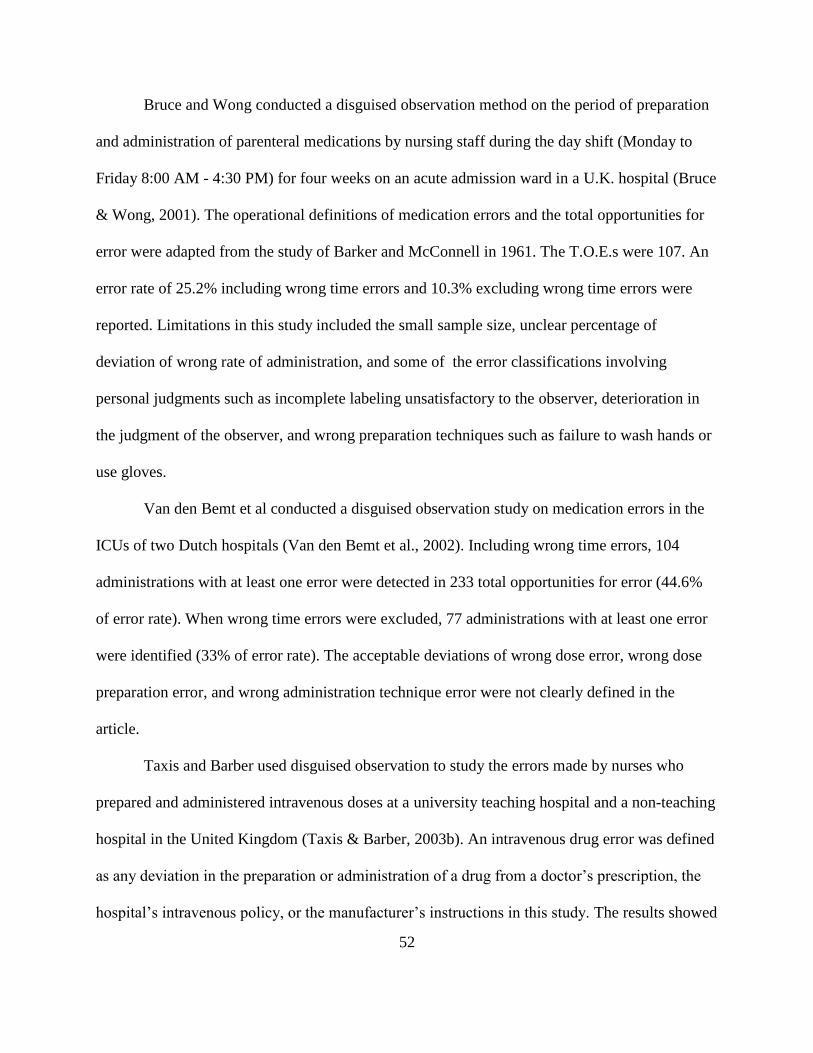
52
Bruce and Wong conducted a disguised observation method on the period of preparation
and administration of parenteral medications by nursing staff during the day shift (Monday to
Friday 8:00 AM - 4:30 PM) for four weeks on an acute admission ward in a U.K. hospital (Bruce
& Wong, 2001). The operational definitions of medication errors and the total opportunities for
error were adapted from the study of Barker and McConnell in 1961. The T.O.E.s were 107. An
error rate of 25.2% including wrong time errors and 10.3% excluding wrong time errors were
reported. Limitations in this study included the small sample size, unclear percentage of
deviation of wrong rate of administration, and some of the error classifications involving
personal judgments such as incomplete labeling unsatisfactory to the observer, deterioration in
the judgment of the observer, and wrong preparation techniques such as failure to wash hands or
use gloves.
Van den Bemt et al conducted a disguised observation study on medication errors in the
ICUs of two Dutch hospitals (Van den Bemt et al., 2002). Including wrong time errors, 104
administrations with at least one error were detected in 233 total opportunities for error (44.6%
of error rate). When wrong time errors were excluded, 77 administrations with at least one error
were identified (33% of error rate). The acceptable deviations of wrong dose error, wrong dose
preparation error, and wrong administration technique error were not clearly defined in the
article.
Taxis and Barber used disguised observation to study the errors made by nurses who
prepared and administered intravenous doses at a university teaching hospital and a non-teaching
hospital in the United Kingdom (Taxis & Barber, 2003b). An intravenous drug error was defined
as any deviation in the preparation or administration of a drug from a doctor’s prescription, the
hospital’s intravenous policy, or the manufacturer’s instructions in this study. The results showed

53
that one or more preparation or administration errors were detected in 212 of 430 prescribed IV
doses observed, for an error rate of 49%. Three doses (1%) had potentially severe errors and 126
doses (29%) had potentially moderate errors. The error rates were overestimated due to the
reasons that the denominator didn’t include the unauthorized IV doses which were given to the
patients, the percentage deviation of the dosage to be considered as a wrong dose error was not
given, and percentage deviation of administration rate to be considered as a fast administration of
bolus dose error was not given. The author concluded that at a 400-bed hospital with 300
intravenous doses administered per day, at least one patient is likely to experience a potentially
serious IV error every day. The analysis showed that the two weak stages in the IV delivery
system were (1) drugs that required multiple step preparation, and (2) administration of doses as
a bolus.
A similar study was conducted on a surgical ward and a surgical intensive care unit in a
German hospital by Taxis and Barber in 2004 (Taxis & Barber, 2004). The results showed that
one or more preparation or administration errors were detected in 58 of 122 prescribed IV doses
observed, for an error rate of 48%. About one-third of all IV doses were associated with a
potentially harmful error. One of the strategies to reduce potentially harmful errors was the
reduction in the number of ward-based IV drug preparations.
In another article, Taxis and Barber analyzed the causes of the detected intravenous
medication errors using human error theory as a framework (Taxis & Barber, 2003a). A total of
265 errors were identified in 483 IV drug preparations and 447 drug administrations. Active
failures were categorized as human errors of slips/lapses and mistakes, and violations. A main
active failure was identified in 256 (97%) of the errors. There were 25 (10%) slips and lapses, 60
(23%) mistakes, and 171 (67%) violations. Most violations (n = 168, 98%) were fast
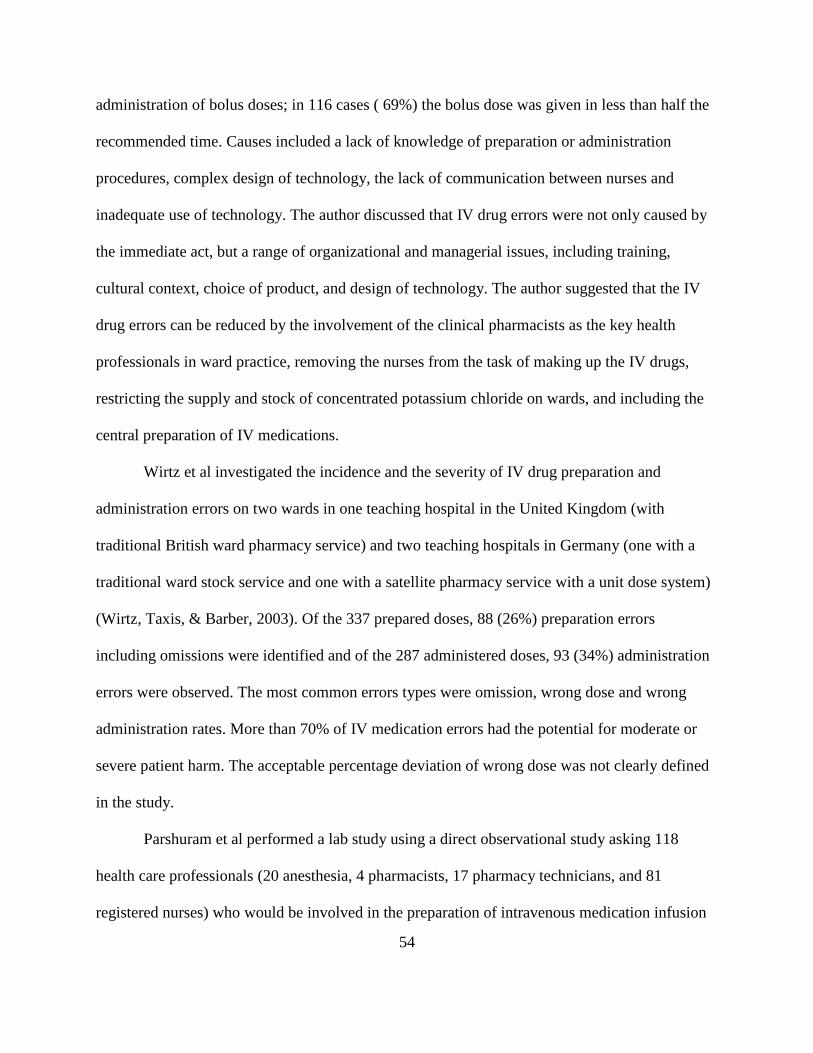
54
administration of bolus doses; in 116 cases ( 69%) the bolus dose was given in less than half the
recommended time. Causes included a lack of knowledge of preparation or administration
procedures, complex design of technology, the lack of communication between nurses and
inadequate use of technology. The author discussed that IV drug errors were not only caused by
the immediate act, but a range of organizational and managerial issues, including training,
cultural context, choice of product, and design of technology. The author suggested that the IV
drug errors can be reduced by the involvement of the clinical pharmacists as the key health
professionals in ward practice, removing the nurses from the task of making up the IV drugs,
restricting the supply and stock of concentrated potassium chloride on wards, and including the
central preparation of IV medications.
Wirtz et al investigated the incidence and the severity of IV drug preparation and
administration errors on two wards in one teaching hospital in the United Kingdom (with
traditional British ward pharmacy service) and two teaching hospitals in Germany (one with a
traditional ward stock service and one with a satellite pharmacy service with a unit dose system)
(Wirtz, Taxis, & Barber, 2003). Of the 337 prepared doses, 88 (26%) preparation errors
including omissions were identified and of the 287 administered doses, 93 (34%) administration
errors were observed. The most common errors types were omission, wrong dose and wrong
administration rates. More than 70% of IV medication errors had the potential for moderate or
severe patient harm. The acceptable percentage deviation of wrong dose was not clearly defined
in the study.
Parshuram et al performed a lab study using a direct observational study asking 118
health care professionals (20 anesthesia, 4 pharmacists, 17 pharmacy technicians, and 81
registered nurses) who would be involved in the preparation of intravenous medication infusion
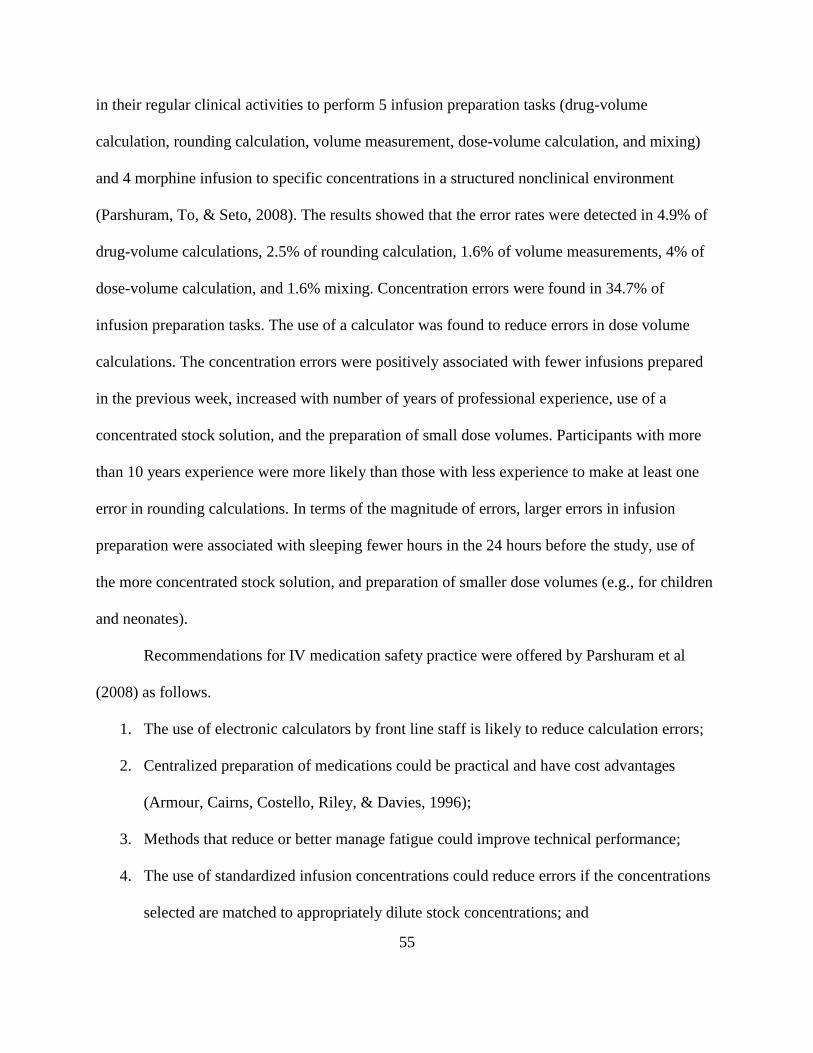
55
in their regular clinical activities to perform 5 infusion preparation tasks (drug-volume
calculation, rounding calculation, volume measurement, dose-volume calculation, and mixing)
and 4 morphine infusion to specific concentrations in a structured nonclinical environment
(Parshuram, To, & Seto, 2008). The results showed that the error rates were detected in 4.9% of
drug-volume calculations, 2.5% of rounding calculation, 1.6% of volume measurements, 4% of
dose-volume calculation, and 1.6% mixing. Concentration errors were found in 34.7% of
infusion preparation tasks. The use of a calculator was found to reduce errors in dose volume
calculations. The concentration errors were positively associated with fewer infusions prepared
in the previous week, increased with number of years of professional experience, use of a
concentrated stock solution, and the preparation of small dose volumes. Participants with more
than 10 years experience were more likely than those with less experience to make at least one
error in rounding calculations. In terms of the magnitude of errors, larger errors in infusion
preparation were associated with sleeping fewer hours in the 24 hours before the study, use of
the more concentrated stock solution, and preparation of smaller dose volumes (e.g., for children
and neonates).
Recommendations for IV medication safety practice were offered by Parshuram et al
(2008) as follows.
1. The use of electronic calculators by front line staff is likely to reduce calculation errors;
2. Centralized preparation of medications could be practical and have cost advantages
(Armour, Cairns, Costello, Riley, & Davies, 1996);
3. Methods that reduce or better manage fatigue could improve technical performance;
4. The use of standardized infusion concentrations could reduce errors if the concentrations
selected are matched to appropriately dilute stock concentrations; and

56
5. The use of pre-filled syringes or ready-mixed infusions prepared to industry standards
could improve the accuracy of medication dosing and would better serve the therapeutic
needs of children.
A major limitation of this study was that the participants performed preparation in a
structured nonclinical environment without disturbances or distractions in normal work.
Effect of Automation and Technology on IV Medication Use
Automation and technologies offer the ability to relieve humans from highly repetitive
and tedious workloads and enhance the reliability of their work. They also have the potential to
reduce medication errors and improve system efficiency and safety. The human can then focus
on the work that requires the abstract, thinking, judgment, and higher level cognitive processes at
which humans excel (Felkey & Barker, 1995). However, technology by itself will rarely prevent
medication errors unless it is effectively integrated into the existing medication use system and
appropriately managed for it to positively impact patient safety (Rough & Temple, 2006). Full
implementation of these technologies will take years to accomplish based on their relative
advantage, compatibility, complexity or simplicity, trialablity, and observability (Rogers, 1995).
If the automation or technologies were not implemented appropriately or implemented without
dedicated oversight on management, training, quality assurance and ongoing support and
maintenance, new sources of errors might prevail and the automated system may be less safe
than the manual system it replaced (Felkey & Barker, 2005; Rough & Temple, 2006).
Automation and technologies have been widely used in medication use systems for the
primary function of entering prescriptions electronically and with decision support, dispensing
doses, counting doses, packaging medications into unit dose, labeling, admixing IVs by a robot,

57
scanning the bar code for the correct medication and the correct patient’s IDs, and setting up the
rate through IV pump. The automations and technologies related to IV medication use are
summarized as: Computerized Prescription Oder Entry (CPOE) or Clinical Decision Support
System (CDSS), Electronic Medication Administration Record (E-MAR), Bar Code Medication
Administration (BCMA), Smart infusion pump, Automated Dispensing Machine (ADM), and
automated admixture robot.
Franklin et al conducted an observational study before and after a closed-loop distribution
system including electronic prescribing, automated dispensing, barcode patient identification and
electronic medication administration record in a 28-bed general surgery patient ward of a
London teaching hospital (Franklin, O’Grady, Donyai, Jacklin, & Barber, 2007). The results
showed that the medication administration error rate reduced from 7.0% of 1,473 non-
intravenous doses pre-intervention to 4.3% of 1,139 afterwards (P = 0.005). The generalization
of this study is limited, because the impact an individual technology system on medication
administration errors was not provided in this article if the hospital only installed one technology
system.
Computerized Prescription Order Entry (CPOE)
CPOE technology was first designed and tried at the Brigham and Women's Hospital, a
720-bed major urban teaching hospital in Boston, in order to reduce response time and
transcription problems (Teich, Hurley, Beckley, & Aranow, 1992). The cost of implementing
CPOE in a large 500-bed hospital with 25,000 admissions annually was estimated at $7.9 million
of initial cost plus $1.35 million of annual operating cost (First Consulting Group, 2003).
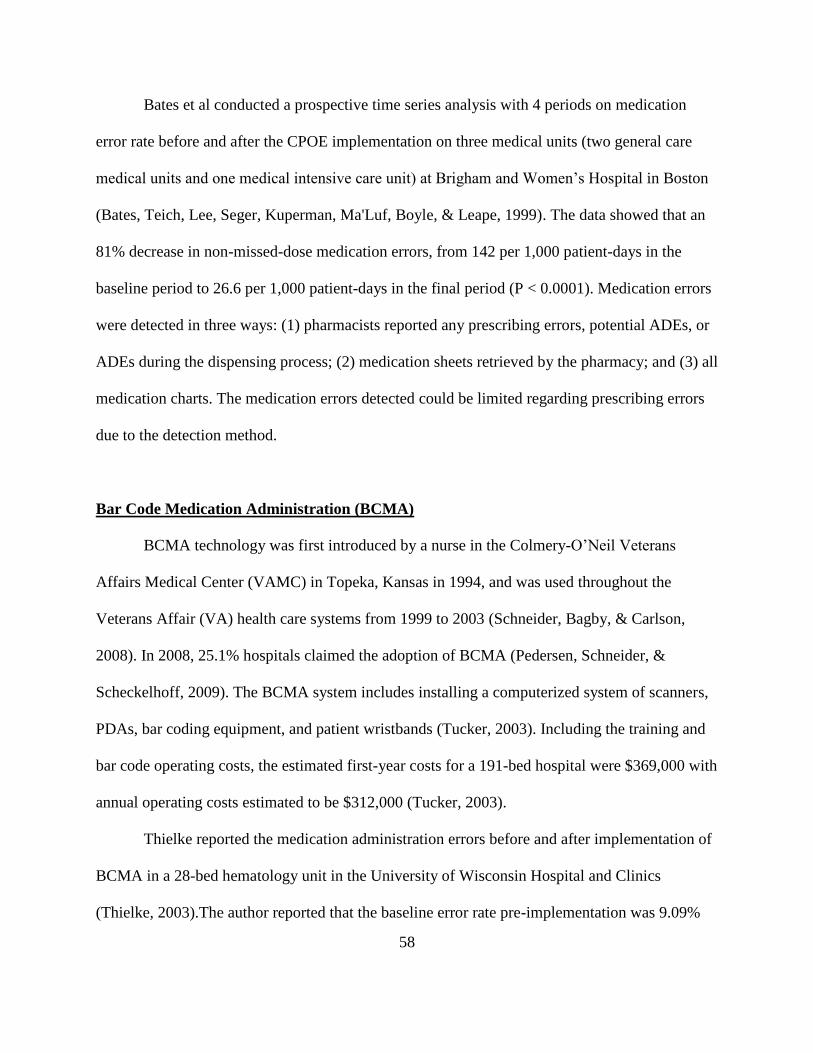
58
Bates et al conducted a prospective time series analysis with 4 periods on medication
error rate before and after the CPOE implementation on three medical units (two general care
medical units and one medical intensive care unit) at Brigham and Women’s Hospital in Boston
(Bates, Teich, Lee, Seger, Kuperman, Ma'Luf, Boyle, & Leape, 1999). The data showed that an
81% decrease in non-missed-dose medication errors, from 142 per 1,000 patient-days in the
baseline period to 26.6 per 1,000 patient-days in the final period (P < 0.0001). Medication errors
were detected in three ways: (1) pharmacists reported any prescribing errors, potential ADEs, or
ADEs during the dispensing process; (2) medication sheets retrieved by the pharmacy; and (3) all
medication charts. The medication errors detected could be limited regarding prescribing errors
due to the detection method.
Bar Code Medication Administration (BCMA)
BCMA technology was first introduced by a nurse in the Colmery-O’Neil Veterans
Affairs Medical Center (VAMC) in Topeka, Kansas in 1994, and was used throughout the
Veterans Affair (VA) health care systems from 1999 to 2003 (Schneider, Bagby, & Carlson,
2008). In 2008, 25.1% hospitals claimed the adoption of BCMA (Pedersen, Schneider, &
Scheckelhoff, 2009). The BCMA system includes installing a computerized system of scanners,
PDAs, bar coding equipment, and patient wristbands (Tucker, 2003). Including the training and
bar code operating costs, the estimated first-year costs for a 191-bed hospital were $369,000 with
annual operating costs estimated to be $312,000 (Tucker, 2003).
Thielke reported the medication administration errors before and after implementation of
BCMA in a 28-bed hematology unit in the University of Wisconsin Hospital and Clinics
(Thielke, 2003).The author reported that the baseline error rate pre-implementation was 9.09%

59
based on observation; the post-implementation error rate was 1.21% based on seventeen days
data collection. The author estimated that 11,518 errors per year were eliminated on this unit.
The overall error rate was reduced by 87%. The wrong dose and wrong dosage form errors were
decreased 100%, followed by decreases for omitted dose (92%), wrong time (77%), and wrong
drug (51%). The limitation of this article was that no details of methods and the timeframe were
specifically stated.
Paoletti et al conducted a prospective direct observational study on medication
administration errors before and after the implementation of electronic medication records
(EMARs) and BCMA in a general hospital (Paoletti, Suess, Lesko, Feroli, Kennel, Mahler, &
Sauders, 2007). The control group was a 20-bed cardiac telemetry unit. Intervention group 1 was
also a 20-bed cardiac telemetry unit. Intervention group 2 was a 36-bed medical surgical unit. A
35.9% reduction of medication administration errors was found after EMARs and BCMA were
installed in the intervention group 2, with 15.6% error rate in the Pre-implementation phase and
10% error rate in the Post-implementation phase. The reduction of medication errors was 54% if
the wrong time and wrong technique errors were excluded, with 6.3% error rate in the Pre-
implementation phase and 2.9% error rate in the Post-implementation phase. The author
explained that the intervention group 1 was not as valid as a comparator with the control group
because it had a lower variation in medication orders because of the aggregated cardiac patients
and use of standardized order sets and a double-check by two nurses to verify the transcription of
all medication orders. However, this does not make sense based on the results that no significant
reduction of medication errors was found in the intervention group 1, with 25.3% error rate in the
Pre-implementation phase and 19.2% error rate in the Post-implementation phase (with 1.6%
error rate in the Pre-implementation phase and 1.6% error rate in the Post-implementation phase,

60
if wrong time and wrong technique errors were excluded). This study didn’t give more details of
the effects of EMARs and BCMA on reducing the subtypes of errors. Another limitation is that
BCMA was embedded in the EMARs system.
Helmons et al conducted a prospective observational study of medication administration
errors before and after the implementation of bar code assisted medication administration
(BCMA) on two medical-surgical units and two medical and surgical intensive care units (ICUs)
in a 386-bed academic teaching hospital (Helmons, Wargel, & Daniels, 2009). The results
showed that more than 90% of medication administrations occurred during the 9 AM medication
round in the medical-surgical units and medical and surgical ICUs. No differences were found
for the overall error rate (12.6% before BCMA and 13.5% after BCMA), the error rate excluding
wrong time errors (11.0% before BCMA and 9.9% after BCMA), and the error types (omission
errors, wrong dose errors, wrong technique, and unauthorized drugs) before and after BCMA
implementation on the ICUs. Increased wrong time errors after BCMA were observed in both the
medical-surgical units and ICUs. Decreased omission errors were observed after BCMA in the
medical surgical units.
DeYoung et al conducted a prospective direct observational study of medication
administration errors in a 38-bed adult medical ICU in a 744-bed community teaching hospital
before and after the implementation of BCMA (DeYoung, VanderKooi, & Barletta, 2009). The
results showed that BCMA was most effective at reducing wrong administration time errors
(reduced by 56% after the implementation of BCMA). There were no significant differences in
omission errors, wrong dose errors, wrong drug errors, wrong route errors, and unauthorized
drug errors before and after the BCMA.
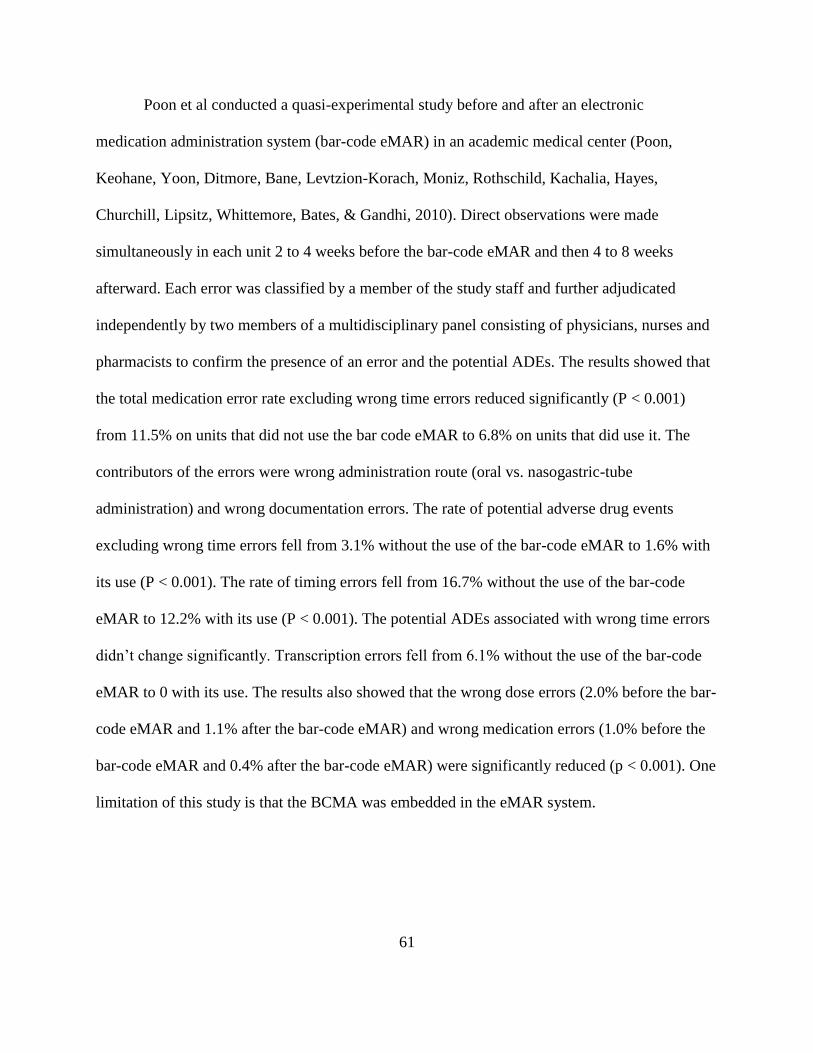
61
Poon et al conducted a quasi-experimental study before and after an electronic
medication administration system (bar-code eMAR) in an academic medical center (Poon,
Keohane, Yoon, Ditmore, Bane, Levtzion-Korach, Moniz, Rothschild, Kachalia, Hayes,
Churchill, Lipsitz, Whittemore, Bates, & Gandhi, 2010). Direct observations were made
simultaneously in each unit 2 to 4 weeks before the bar-code eMAR and then 4 to 8 weeks
afterward. Each error was classified by a member of the study staff and further adjudicated
independently by two members of a multidisciplinary panel consisting of physicians, nurses and
pharmacists to confirm the presence of an error and the potential ADEs. The results showed that
the total medication error rate excluding wrong time errors reduced significantly (P < 0.001)
from 11.5% on units that did not use the bar code eMAR to 6.8% on units that did use it. The
contributors of the errors were wrong administration route (oral vs. nasogastric-tube
administration) and wrong documentation errors. The rate of potential adverse drug events
excluding wrong time errors fell from 3.1% without the use of the bar-code eMAR to 1.6% with
its use (P < 0.001). The rate of timing errors fell from 16.7% without the use of the bar-code
eMAR to 12.2% with its use (P < 0.001). The potential ADEs associated with wrong time errors
didn’t change significantly. Transcription errors fell from 6.1% without the use of the bar-code
eMAR to 0 with its use. The results also showed that the wrong dose errors (2.0% before the bar-
code eMAR and 1.1% after the bar-code eMAR) and wrong medication errors (1.0% before the
bar-code eMAR and 0.4% after the bar-code eMAR) were significantly reduced (p < 0.001). One
limitation of this study is that the BCMA was embedded in the eMAR system.
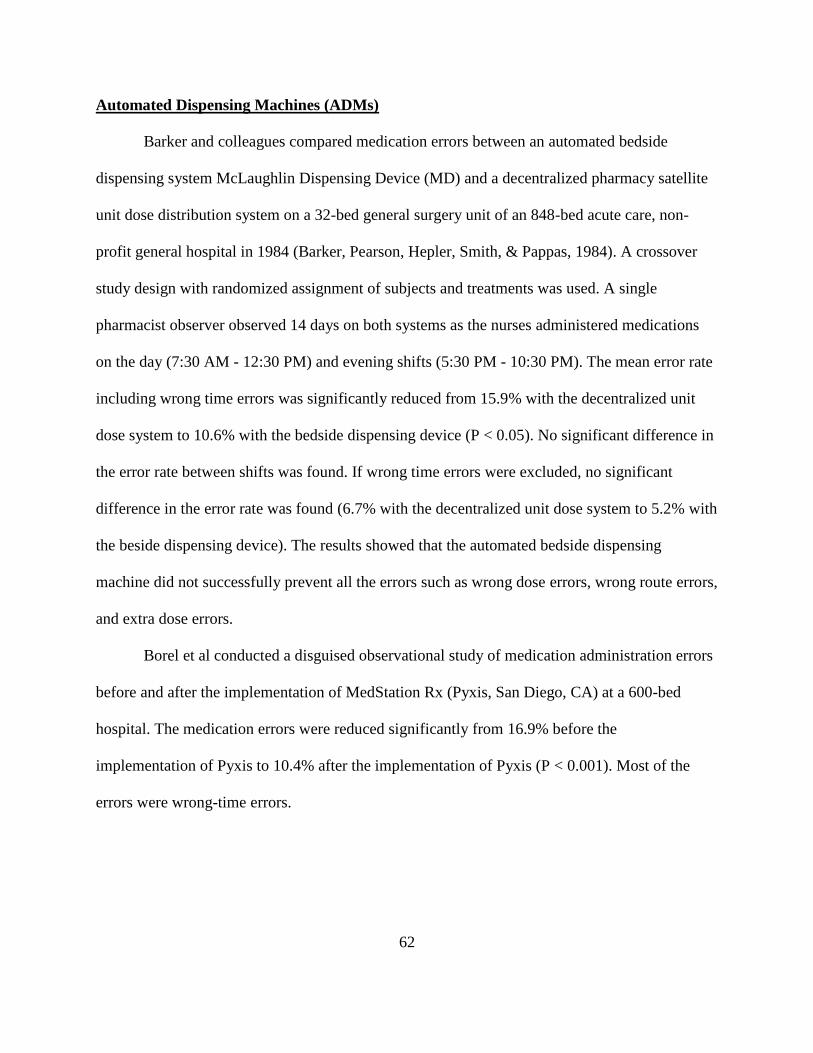
62
Automated Dispensing Machines (ADMs)
Barker and colleagues compared medication errors between an automated bedside
dispensing system McLaughlin Dispensing Device (MD) and a decentralized pharmacy satellite
unit dose distribution system on a 32-bed general surgery unit of an 848-bed acute care, non-
profit general hospital in 1984 (Barker, Pearson, Hepler, Smith, & Pappas, 1984). A crossover
study design with randomized assignment of subjects and treatments was used. A single
pharmacist observer observed 14 days on both systems as the nurses administered medications
on the day (7:30 AM - 12:30 PM) and evening shifts (5:30 PM - 10:30 PM). The mean error rate
including wrong time errors was significantly reduced from 15.9% with the decentralized unit
dose system to 10.6% with the bedside dispensing device (P < 0.05). No significant difference in
the error rate between shifts was found. If wrong time errors were excluded, no significant
difference in the error rate was found (6.7% with the decentralized unit dose system to 5.2% with
the beside dispensing device). The results showed that the automated bedside dispensing
machine did not successfully prevent all the errors such as wrong dose errors, wrong route errors,
and extra dose errors.
Borel et al conducted a disguised observational study of medication administration errors
before and after the implementation of MedStation Rx (Pyxis, San Diego, CA) at a 600-bed
hospital. The medication errors were reduced significantly from 16.9% before the
implementation of Pyxis to 10.4% after the implementation of Pyxis (P < 0.001). Most of the
errors were wrong-time errors.
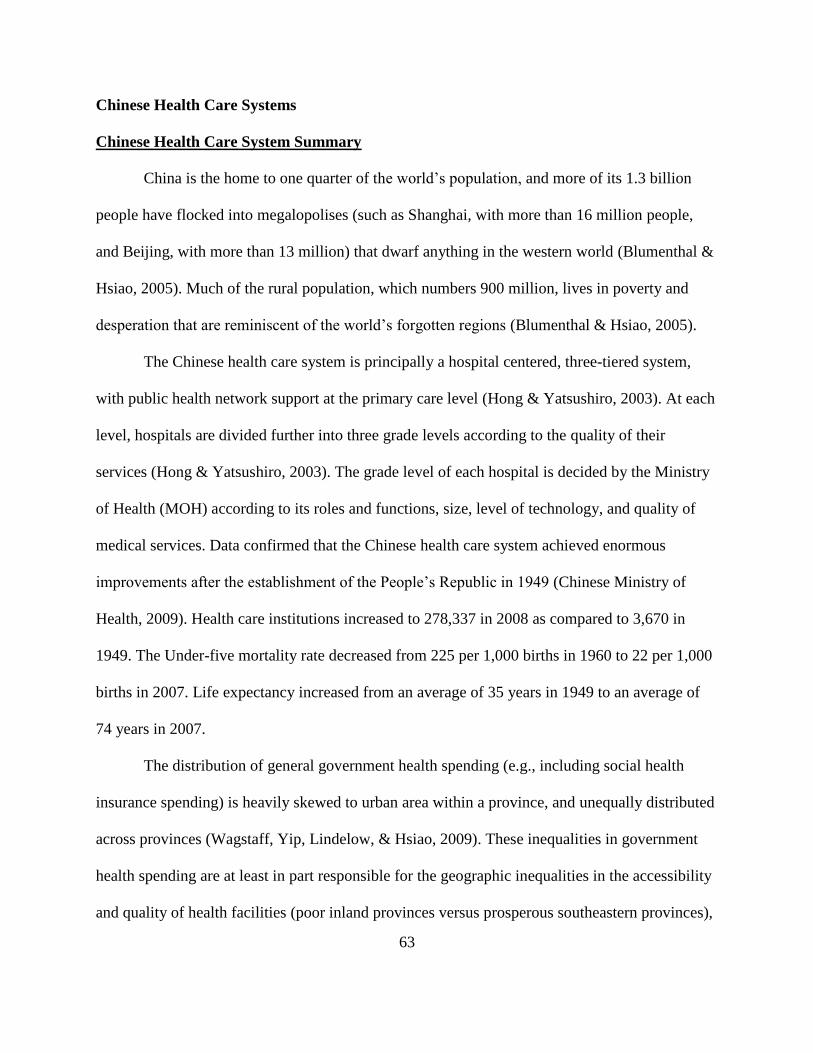
63
Chinese Health Care Systems
Chinese Health Care System Summary
China is the home to one quarter of the world’s population, and more of its 1.3 billion
people have flocked into megalopolises (such as Shanghai, with more than 16 million people,
and Beijing, with more than 13 million) that dwarf anything in the western world (Blumenthal &
Hsiao, 2005). Much of the rural population, which numbers 900 million, lives in poverty and
desperation that are reminiscent of the world’s forgotten regions (Blumenthal & Hsiao, 2005).
The Chinese health care system is principally a hospital centered, three-tiered system,
with public health network support at the primary care level (Hong & Yatsushiro, 2003). At each
level, hospitals are divided further into three grade levels according to the quality of their
services (Hong & Yatsushiro, 2003). The grade level of each hospital is decided by the Ministry
of Health (MOH) according to its roles and functions, size, level of technology, and quality of
medical services. Data confirmed that the Chinese health care system achieved enormous
improvements after the establishment of the People’s Republic in 1949 (Chinese Ministry of
Health, 2009). Health care institutions increased to 278,337 in 2008 as compared to 3,670 in
1949. The Under-five mortality rate decreased from 225 per 1,000 births in 1960 to 22 per 1,000
births in 2007. Life expectancy increased from an average of 35 years in 1949 to an average of
74 years in 2007.
The distribution of general government health spending (e.g., including social health
insurance spending) is heavily skewed to urban area within a province, and unequally distributed
across provinces (Wagstaff, Yip, Lindelow, & Hsiao, 2009). These inequalities in government
health spending are at least in part responsible for the geographic inequalities in the accessibility
and quality of health facilities (poor inland provinces versus prosperous southeastern provinces),
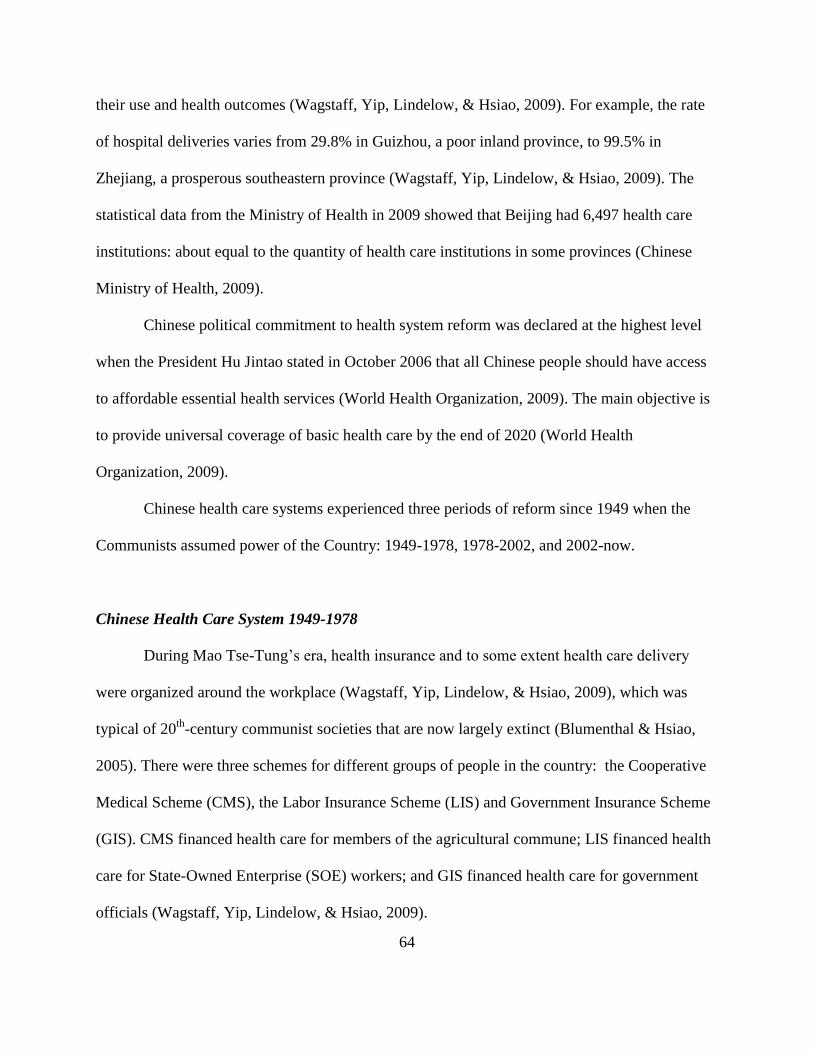
64
their use and health outcomes (Wagstaff, Yip, Lindelow, & Hsiao, 2009). For example, the rate
of hospital deliveries varies from 29.8% in Guizhou, a poor inland province, to 99.5% in
Zhejiang, a prosperous southeastern province (Wagstaff, Yip, Lindelow, & Hsiao, 2009). The
statistical data from the Ministry of Health in 2009 showed that Beijing had 6,497 health care
institutions: about equal to the quantity of health care institutions in some provinces (Chinese
Ministry of Health, 2009).
Chinese political commitment to health system reform was declared at the highest level
when the President Hu Jintao stated in October 2006 that all Chinese people should have access
to affordable essential health services (World Health Organization, 2009). The main objective is
to provide universal coverage of basic health care by the end of 2020 (World Health
Organization, 2009).
Chinese health care systems experienced three periods of reform since 1949 when the
Communists assumed power of the Country: 1949-1978, 1978-2002, and 2002-now.
Chinese Health Care System 1949-1978
During Mao Tse-Tung’s era, health insurance and to some extent health care delivery
were organized around the workplace (Wagstaff, Yip, Lindelow, & Hsiao, 2009), which was
typical of 20th
-century communist societies that are now largely extinct (Blumenthal & Hsiao,
2005). There were three schemes for different groups of people in the country: the Cooperative
Medical Scheme (CMS), the Labor Insurance Scheme (LIS) and Government Insurance Scheme
(GIS). CMS financed health care for members of the agricultural commune; LIS financed health
care for State-Owned Enterprise (SOE) workers; and GIS financed health care for government
officials (Wagstaff, Yip, Lindelow, & Hsiao, 2009).
65
“Barefoot doctors” were farmers who received minimal basic medical and paramedical
training to provide the basic medical needs of villagers in rural areas, and were attached to the
agricultural commune and workplace clinics when they provided first-level care. Second-level
care was provided in Township Health Centers (THCs) in rural areas and in district hospitals and
enterprise hospitals in urban areas (Wagstaff, Yip, Lindelow, & Hsiao, 2009). Tertiary care was
provided in county and city hospitals, and pharmacies were typically integrated into these
facilities (Wagstaff, Yip, Lindelow, & Hsiao, 2009).
Communes, local and central governments all collected taxes which were used to pay
demand-side subsidies to the health insurance programs and supply-side subsidies to providers
(Wagstaff, Yip, Lindelow, & Hsiao, 2009). It was a near-universal health insurance with minimal
out-of-pocket payments.
Chinese Health Care System 1978-2002
At the beginning of the 1980s, China was undergoing the epidemiologic transition seen in
Western countries: infectious diseases were giving way to chronic diseases (e.g., heart disease,
cancer, and stroke) as leading causes of illness and death (Chinese Ministry of Health, 2004).
In 1978, the second leader of China, Deng Xiaoping, reformed the command-and-control
economy to the market-oriented economy. Within a few years, Chinese health care system
transformed into the profit-making health system too. The agricultural commune was quickly
replaced by household production, profit-making village and township enterprises were set up,
and SOE was granted substantial financial autonomy (Wagstaff, Yip, Lindelow, & Hsiao, 2009).
The breakup of the commune led to the almost total collapse of the CMS (Hsiao, 1984; Liu,
66
2004b). Financial autonomy for SOE meant many fell into financial difficulty; a large number
closed and SOE employment levels fell (Cai, Park, & Zhao, 2008).
In 1990s, the central government focused its efforts on urban health insurance. Yip
reported that government spending in urban areas was five to six times higher than in rural areas
(Yip, 2009). Insurance coverage plummeted in rural areas, and declined in urban areas (Gao,
Tang, Tolhurst, & Rao, 2001). From 1978 to 1999, the central government’s share of national
health care spending fell from 32% to 15% (Liu, 2004a). Out-of-pocket expenses accounted for
58% of health care spending in 2002, as compared with 20% in 1978 (Liu, Rao, & Hsiao, 2003).
In order to regulate the price of drugs, a new scheme to cover all urban formal-sector workers
(not including their dependents) was launched known as Basic Medical Insurance (BMI) in 1995.
From 1978 to 2002, the annual per capita spending on personal health services in China
increased by a factor of 40, from roughly $1.35 to $55 (Blumenthal & Hsiao, 2005). Half of
Chinese health care spending was devoted to drugs (as compared with 10% in the United States)
(Hesketh & Zhu, 1997).
These consequences accompanied the transition to the market-oriented health care system, as
shown below (Wagstaff, Yip, Lindelow, & Hsiao, 2009):
1. Heavy investment in high-tech equipment and a consequent shift from labor-intensive to
capital-intensive care
a. Liu and Hsiao identified the rapid adoption of new technology as a major driver of
the cost growth in Chinese health care system (Liu & Hsiao, 1995).
b. In Shanghai, Caesarean sections increased faster than could be explained by increases
in risk factors (Cai, Marks, Chen, Zhuang, Morris, & Harris, 1998).

67
c. In the late 1990s, China had more Magnetic Resonance Imaging (MRI) scanners per
million people than more affluent Thailand or Mexico and around two and a half
times as many as would be expected on the basis of its per capita income at the time
(Wagstaff, Lindelow, Wang, & Zhang, 2009).
2. A high share of spending on drugs
a. In 2003, nearly 45% of total health spending was on drugs , compared with the
Organization for Economic and Co-operation and Development (OECD) average of
around 15% (Wagstaff, Lindelow, Wang, & Zhang, 2009).
3. The delivery of medically unnecessary care
a. For profit reasons, flu patients were often given unnecessary IV injections in
dilapidated clinics (Yip, 2009).
b. About 75% of patients suffering from a common cold and 79% of hospital patients
were prescribed antibiotics, compared with an international average of 30% (Yip,
2009).
c. Providers over-prescribed drugs and tests, and hospitals raced to introduce high-tech
services and expensive imported drugs that gave them higher profit margins (Liu &
Mills, 1999).
d. In order to increase their profits, village doctors bought fake or expired drugs at a
cheap price and sold them to patients at the higher official price (Blumenthal &
Hsiao, 2005).
4. Rapid cost escalation
a. Between 2003 and 2004, the average cost per case increased by as much as 15–20%
in central and general township health centers and county hospitals, even after
68
adjusting for case mix (relative numbers of inpatient, emergency and outpatient care)
and other factors such as bed stock and local income per capita (Wagstaff, Lindelow,
Wang, & Zhang, 2009).
5. A larger share of out-of-pocket health spending
a. Using data from the National Health Survey (NHS), Yip reported that the out-of-
pocket expenses associated with a single inpatient admission increased from 70 to
80% of per capita income in 1993 to more than 200% in 2003 (Yip, 2009).
b. Out-of-pocket spending as a share of total health spending grew from 29% in 1978 to
over 60% in 2000 (Wagstaff, Lindelow, Wang, & Zhang, 2009).
Chinese Health Care System 2002-Now
In 2003, the Chinese government initiated the New Cooperative Medical System
(NCMS), a government-run voluntary insurance program, with government subsidies targeting
the poorer Western and Central regions (Central Committee of Communist Party of China,
2002). The primary goals of the NCMS are to prevent rural Chinese from being impoverished by
medical expenses and to reduce inequalities in care between Chinese rich and poor areas (Yip &
Hsiao, 2009).
Chinese political commitment to health system reform was declared at the highest level
when President Hu, Jintao stated in October 2006 that all Chinese people should have access to
affordable essential health services (World Health Organization, 2009). After three years of
deliberation, in 2009, the government announced their national health reform blueprint with the
main objective to provide universal coverage of basic health care by the end of 2020 (World
Health Organization, 2009). Reforms are proposed in five areas: the public health system, the
69
medical care delivery system, the health security system, the pharmaceutical system, and pilot
hospital reform (World Health Organization, 2009).
In the latest Basic Medical Insurance List (BMI), more than half of the drugs are in
injectable dosage forms, which are common or high frequency drugs (Chinese Ministry of Labor
and Social Security, 2004).
Rationale of the Study
The need for a broad descriptive study of the nature and frequency of IV medication
errors that will identify clues to cause and suggest the potential clinical relevance of such errors
is evident. The majority of observational studies of IV medication errors conducted in Europe
had a broad error rate range from 6.6% to 50%, gathering at the error rate of 20%-50% (Bruce &
Wong, 2001; Hartley & Dhillon, 1998; Schneider, Cotting, & Pannatier, 1998; Taxis & Barber,
2003a, 2003b; Taxis & Barber, 2004; Tissot et al., 1999; Van den Bemt et al., 2002; Wirtz, Taxis,
& Barber, 2003). Two studies with higher error rates of 21% (Thur, Miller, & Latiolais, 1972)
and 83% (O’Hara, Bradley, Gallagher, & Shields, 1995) in the US didn’t give details of error
categories and error rate calculation. One study in Canada was conducted in a nonclinical
environment (Parshuram, To, & Seto, 2008). One study in the US provided a description of IV
admixture compounding errors and said the most common type of error was wrong-dose. TPNs
had the highest error rate with 22% even when prepared by some automation in the centralized
IV preparation room in the hospital pharmacies (Flynn, Pearson, & Barker, 1997).
Some studies didn’t clearly define the extent of deviation in the operational definitions of
wrong dose errors (Hartley & Dhillon, 1998; Van den Bemt et al., 2002; Wirtz, Taxis, & Barber,
2003), wrong dose preparation errors (Hartley & Dhillon, 1998; Schneider, Cotting, & Pannatier,

70
1998; Van den Bemt et al., 2002), and wrong rate of administration errors (Bruce & Wong,
2001). Also, some studies gave inappropriate or vague definitions or involved personal
judgments in the operational definitions of omission errors (Hartley & Dhillon, 1998), wrong
preparation technique errors (Bruce & Wong, 2001), wrong administration technique error
(Hartley & Dhillon, 1998; Schneider, Cotting, & Pannatier, 1998; Van den Bemt et al., 2002),
deteriorated drugs (Bruce & Wong, 2001; Hartley & Dhillon, 1998), incomplete labeling (Bruce
& Wong, 2001), and the total opportunities for error (Hartley & Dhillon, 1998; Tissot et al.,
1999).
Some studies observed and analyzed IV preparation and administration errors separately
(Taxis & Barber, 2003a, 2003b; Taxis & Barber, 2004; Wirtz, Taxis, & Barber, 2003). These
studies would limit the wrong dose errors detection in the measurement of medication
administration errors if the wrong dose errors were introduced in IV admixture preparation
processes.
This dissertation used standardized operational definitions of medication errors with clear
deviation percentages, total opportunities for error as the denominator, and error rate calculation.
Both preparation and administration processes were observed in order to detect the wrong dose
errors that may have occurred at the beginning of the preparation, but only medication
administration errors were measured as the outcome at the end point of medication use system.
The direct observation method was used in this dissertation to capture medication errors. This
technique has been shown to be more valid than chart review and self report (Barker, Flynn, &
Pepper, 2002; Dean & Barber, 2001).
Automation has been used and studied to prevent medication errors since the 1990s, but
its effects on medication errors are still under study with results unproven.
71
CPOE automation was evaluated to achieve the potential effects on reducing prescribing
errors, transcribing errors, and ADEs by the chart review method (Bates et al., 1999). However,
the cost of implementing CPOE was not affordable by most non-profit hospitals as well as most
Chinese hospitals with an estimation of $7.9 million of initial cost plus $1.35 million of annual
operating cost of in a large 500-bed US hospital with 25,000 admissions annually (First
Consulting Group, 2003).
One study in a general hospital showed that the integrated BCMA and EMAR system
reduced medication errors significantly in one experimental group, but didn’t reduce medication
errors significantly in the other experimental group (Paoletti et al., 2007). Poon et al study in an
academic medical center showed that BCMA reduced the total medication error rate significantly,
but the contributors of the errors were wrong administration route (oral vs. nasogastric-tube
administration) and wrong documentation errors (Poon et al., 2010). Two studies in ICUs
showed that BCMA did not significantly reduce overall errors as well as subtypes of errors
(omission errors, wrong dose errors, wrong technique errors, and unauthorized drug errors)
(DeYoung, VanderKooi, & Barletta, 2009; Helmons, Wargel, & Daniels, 2009).
Two studies in hospitals showed that ADMs significantly reduced wrong time errors
(Barker, Pearson, Hepler, Smith, & Pappas, 1984; Borel & Rascati, 1995).
The Unit Dose Dispensing System has already been installed as interventions for
reducing oral medication dispensing errors in some Chinese hospitals since 2004, but its main
effect on reducing medication errors has never been investigated and measured.
In summary, this study considered the current medication use system, labor and culture in
the Chinese hospitals and then selected for testing the inexpensive intervention of the unit dose
dispensing concept as tested and found effective in many US hospitals.
72
Chapter 4: Methodology
Study Setting
The study site is a General (Gastrointestinal) Surgery Patient Ward with 53 beds in two
units, located at a tertiary A-level hospital with more than 1,300 beds in Beijing. The floor layout
(not to scale) of the study Patient Ward is shown in Figure 2. The hospital offers integrated
eastern-western medicinal therapy, which is a clinical medical research and teaching hospital.
The background of the hospital and the study site was obtained by the Principal
Investigator from the exploratory study in December 2009. The hospital had five pharmacies: the
Traditional Chinese Outpatient Pharmacy, the Traditional Chinese Inpatient Pharmacy, the
Western Outpatient Pharmacy, the Western Inpatient Pharmacy, and the Special Pharmacy for
the Children Emergency, the Infectious Disease, and the International Medical Departments. A
total of 12 pharmacists in the Western Inpatient Pharmacy were responsible for dispensing all the
injectable drugs to the inpatients in the hospital. Clinical pharmacists were only assigned to the
Departments of Endocrinology, Hematology, Nephrology, and the Intensive Care Unit.
The research protocol was reviewed and approved by the Director of the Outpatient
Pharmacy and the Clinical Research Ethical Review Board at the hospital, and the Auburn
University Institutional Review Board (IRB) for the Use of Human Subjects in Research in May
2010 (Appendices B and C). The IRB was renewed in September 2011 (Appendices D).
The Director of the Outpatient Pharmacy agreed to provide collaborative support for the
study. The General (Gastrointestinal) Surgery Patient Ward was offered by the hospital. This

73
patient ward housed 50% of cancer patients, served by 13 physicians and 18 employed nurses.
No clinical pharmacist was currently assigned to this ward. The majority (90%) of the prescribed
orders for the patients on this ward were for IV drugs.
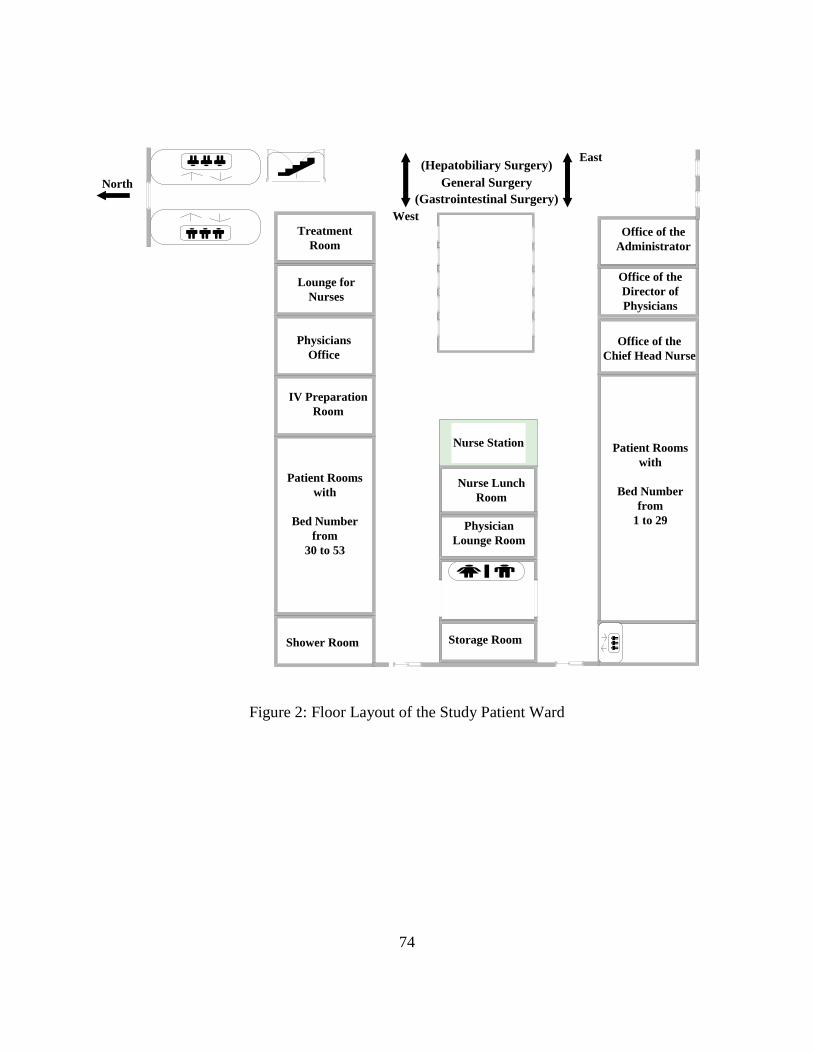
74
办公室
13 sq. m.
Physicians
Office
Patient Rooms
with
Bed Number
from
30 to 53
Shower Room
Office of the
Chief Head Nurse
Lounge for
Nurses
Nurse Lunch
Room
Physician
Lounge Room
Storage Room
Nurse Station
Treatment
Room
IV Preparation
Room
Patient Rooms
with
Bed Number
from
1 to 29
Office of the
Director of
Physicians
Office of the
Administrator
North General Surgery
(Gastrointestinal Surgery)
(Hepatobiliary Surgery)
West
East
Figure 2: Floor Layout of the Study Patient Ward
75
Exploratory Level Study
Undisguised observation was performed in the western inpatient pharmacy and
the study patient ward during the first visit from December 16 to December 30, 2009 and
the second visit from July 12 to July 30, 2010. The objectives of the exploratory study
were to obtain the information as follows:
1. Understand the current IV drug distribution process,
2. Understand the current IV drug preparation and administration processes,
3. Test the operational definition of medication administration errors,
4. Find the information needed to test the observation method,
5. Estimate the nature and rate of IV medication administration errors, and
6. Locate the source of the information of drug usage needed to identify the
population of IV medications dispensed to each patient ward, and to estimate the
sample size to be used in the explanatory study.
The characteristics of the independent variables and dependent variables of initial
interest were defined at the level of an exploratory study.
Description of the Existing System
A new Hospital Information System (HIS), including nursing station and
physician station, was installed on the General (Gastrointestinal) Surgery Patient Ward
(the study site) in July 2010. However, handwriting on the patient charts was still the
primary method of prescriptions.
Two printed forms were used by the ward: routine medication orders and non-
routine medication orders.

76
The form for routine medication orders is shown in Figure 3. Routine medication
orders were those given at regular and standardized intervals and were generally repeated
more than twice, which were usually prescribed before 11 AM everyday. These orders
were written on the form in black color. The patient identification number was on the top
right corner of the page. The patient name, gender, age, the name of the department, the
room number, and the bed number were required to appear on the top of the table. The
medication orders included the starting date and time, drug names, dosage, route,
administration frequency, discontinued date and time, and the signatures of the physician,
the primary nurse, and the medical nurse. The physician, the primary nurse and the
medicine nurse were required to sign after the starting time and the discontinuance time
for routine orders.
Figure 3: Routine Medication Orders
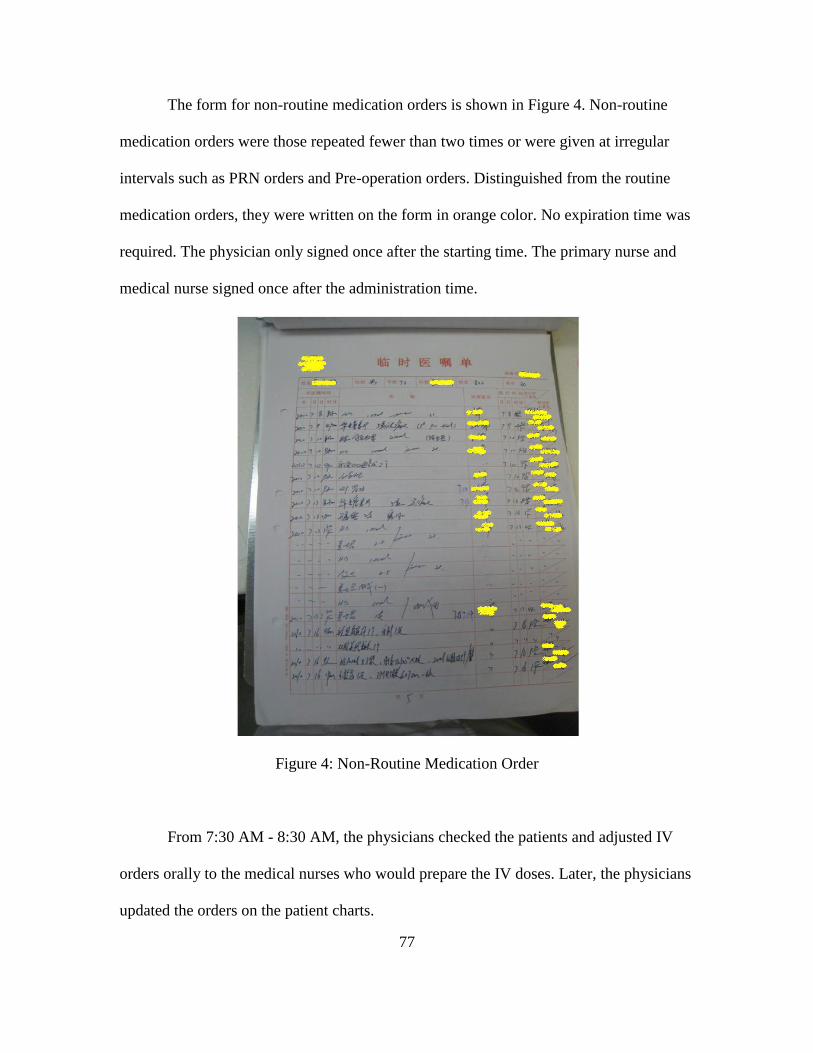
77
The form for non-routine medication orders is shown in Figure 4. Non-routine
medication orders were those repeated fewer than two times or were given at irregular
intervals such as PRN orders and Pre-operation orders. Distinguished from the routine
medication orders, they were written on the form in orange color. No expiration time was
required. The physician only signed once after the starting time. The primary nurse and
medical nurse signed once after the administration time.
Figure 4: Non-Routine Medication Order
From 7:30 AM - 8:30 AM, the physicians checked the patients and adjusted IV
orders orally to the medical nurses who would prepare the IV doses. Later, the physicians
updated the orders on the patient charts.
78
The total IV doses were about 200-250 doses per day. Once daily was the most
frequent administration (150-180 doses), followed by twice daily (BID) (30-40 doses)
and three times daily (TID) (10-20 doses). The time for the once daily administration was
9 AM. The time for the BID administration was 9 AM and 3 PM. The time for the TID
administration was 9 AM, 3 PM, and 9 PM.
TPN doses, which were all given peripherally by once daily, contained multiple
additives such as Vitamin C injection, Sodium chloride injection concentrate (10%), Compound
Amino Acid Injection (15-HBC) 250 ml, etc in the Kabiven TM PI fat emulsion bag. All the
TPN doses were placed along the transcribed TPN doses the medication inspection sheet
for each patient on the counter closely by an auxiliary worker. No label was provided on
the Kabiven TM PI fat emulsion bag. The medical nurses prepared the TPN doses
according to the transcribed TPN doses the medication inspection sheet. They transferred
the ampoule additives into the glass solution bottles such as Compound Amino Acid
Injection (15-HBC) 250 ml, and combined the glass solution bottles into the Kabiven TM
PI fat emulsion bag using gravity flow. The patient name and the bed number were added
on the Kabiven TM PI fat emulsion bag after the transferring process finished.
Non-TPN doses, which were given peripherally by once daily, BID or TID,
contained one additive such as an antibiotic in a base solution of 250 ml of 5% Glucose
Solution or 100 ml 0.9% Sodium Chloride Solution. The name of the additive, the dosage
of the additive and the administration time were written on the back of the base solution
bag. No patient information was marked on the base solution bag. The nurse added the
additive into the base solution and mixed them as an assembly line. The patient name and
79
the bed number were added at the bedside before administering the mixed Non-TPN
dose.
The orders for injectable medications were sent to the pharmacy before 11 AM
through the HIS in an accumulated format on ward basis. In general, the delivery process
would be finished within one hour, but during the rush hour it might take as long as two
hours. The pharmacy delivered the accumulated injectable medications to each patient
ward before 12 PM on a daily basis. For any emergency need, the HIS “prescription”
would arrive at the pharmacy immediately. The average delivery times for non-routine
injectable medication orders was 3-4 times/day.
The pharmacists were responsible for (1) receiving the medication orders from the
nursing stations on the patient ward, (2) dispensing the IV drugs in bulk form upon their
requisition, (3) dispensing the oral medicines in unit-dose forms upon their requisition,
(4) maintaining the drug storage in the pharmacy, (5) providing clinical drug information
to the nurses, and (6) collecting reports of adverse drug reactions from the patient wards.
Nurses were divided into four categories according to their duties: primary nurse,
medicine nurse, medical nurse, and nursing care nurse.
The primary nurse was responsible for (1) attending the meeting with the
physicians in the morning 7:30 - 8:30 AM, (2) transcribing the medical orders on the
patient charts, (3) receiving new patients, transferring departments, changing beds and
checking-out patients, (4) maintaining the medical item storage in the nursing station, and
(5) assisting the communications among the physicians, the medicine nurses, and the
medical nurses.
80
The medicine nurse was responsible for (1) receiving and confirming medication
orders on the HIS, (2) comparing and checking the medication orders on the patient
charts and on the HIS, (3) generating a whole list of medication orders for the entire day
on the HIS, (4) sending the electronic whole list of medication orders to the pharmacy,
(5) picking up the bulk package of medications from the pharmacy at 11:00 AM - 12:00
PM, and (6) checking the storage of medications in the unit.
The medical nurses were responsible for (1) transcribing IV medication orders to
the medication inspection sheet with a carbon copy for each patient and putting the
carbon copy on a patient’s clip board, (2) transcribing IV medication orders for a whole
day into a piece of paper as a “To Do List” for administration drugs, (3) preparing IV
doses, (4) administering IV doses, checking the “To Do List” and signing the infusion
speed and the signature on the patient clip board, and (5) circulating around the patient
rooms to change the infusion bags as needed.
The Flowchart of the current medication distribution system is shown in Figure 5.
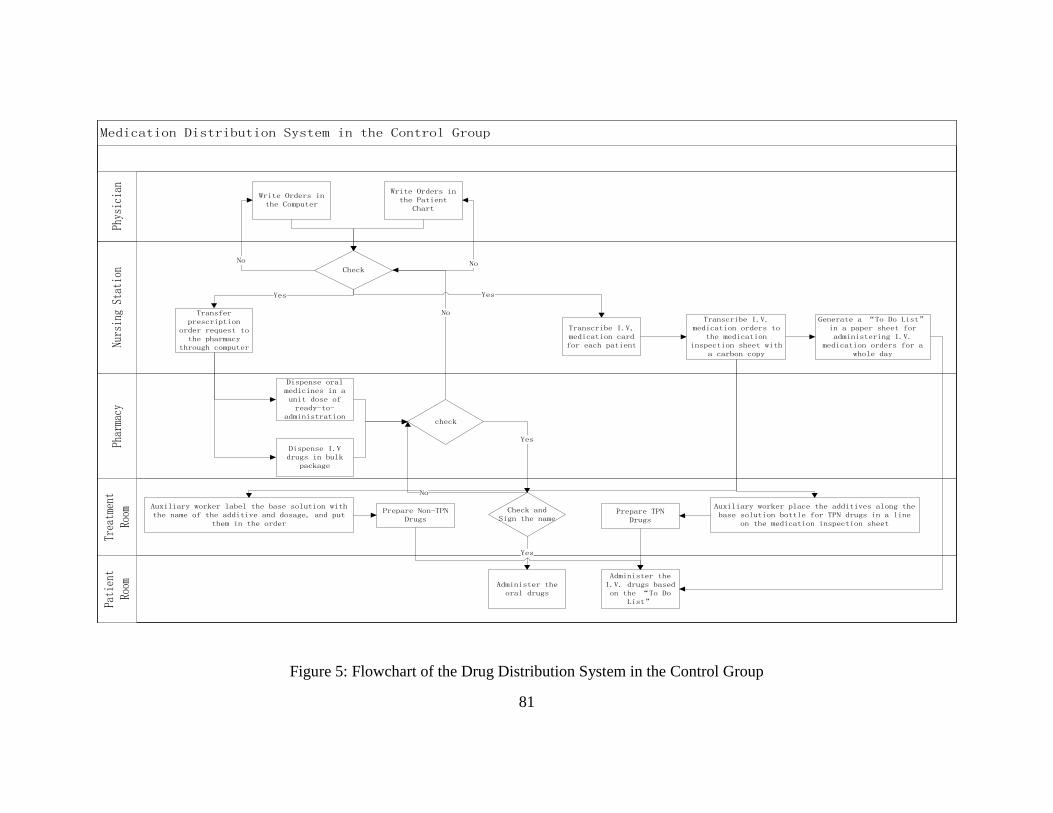
81
Medication Distribution System in the Control Group
Treatment
Room
Nursing Station
Pharmacy
Patient
Room
Physician
Write Orders in the Computer
Check
Write Orders in the Patient
Chart
Transfer prescription
order request to the pharmacy
through computer
Dispense oral medicines in a unit dose of ready-to-
administration
Generate a “To Do List” in a paper sheet for administering I.V.
medication orders for a whole day
Transcribe I.V. medication orders to
the medication inspection sheet with
a carbon copy
Yes
check
Yes
Dispense I.V drugs in bulk
package
No No
No
Yes
Auxiliary worker place the additives along the base solution bottle for TPN drugs in a line
on the medication inspection sheet
Prepare TPN Drugs
Check and Sign the name
Transcribe I.V, medication card for each patient
Auxiliary worker label the base solution with the name of the additive and dosage, and put
them in the order
Prepare Non-TPN Drugs
Administer the I.V. drugs based on the “To Do
List”
Yes
Administer the oral drugs
No
Figure 5: Flowchart of the Drug Distribution System in the Control Group
82
Explanatory Level Study
Population
The target population was defined as the TPN doses ordered, prepared and
administered for the patients in the General Surgery Patient Ward during the observation
period.
The 53 beds were 75%-90% occupied with 40 to 48 patients during the
observation period. The TPN doses were about 50-100 doses for 10-15 patients per day
and were all given once daily.
Sample
The sample was defined as the observed TPN doses, which were ordered,
prepared and administered for the patients on the General Surgery Patient Ward.
The day shift from 8 AM to 3 PM was chosen for observation due to the high
volume of IV administration doses given at this time period. A total of 517 ordered doses
plus 4 unordered doses were observed in the Control group, 41.7% of the total prescribed
TPN doses during the time periods of August 3 to August 13, 2011 and October 4 to
October 13, 2011. A total of 675 ordered doses were observed in the Experimental group,
44.4% of the total prescribed TPN doses during the time periods of August 16 to August
25, 2011 and October 17 to October 26, 2011.
Sample Size Calculation
Cohen's d (Cohen, 1988) is defined as the difference between two means divided
by a pooled standard deviation (S) for the data, shown in the following formula.
83
where and
Based on the pilot study that was used for the development of a Unit Dose
Dispensing System with medication error rates for each individual observation period
(shift) in the control and experimental groups at the University of Arkansas Medical
Center by Barker and Colleagues (Barker, Heller, Brennan, & Sheldon, 1964), the effect
size (Cohen’s d) was calculated as 1.2 for two-tail test with of 0.05. The sample size
was estimated as 12 observation periods for each group with an average of 48 doses in
each observation period with the power of 0.80.
Independent Variable (IV) and Dependent Variable (DV)
The Independent Variable was the intervention of the Unit Dose Dispensing
System, which was installed in the Experimental group.
The Dependent Variable was medication errors of the TPN doses, which were
observed and detected in the preparation and the administration processes.
The detailed characteristics of independent variable and dependent variable were
described in the Concepts and Operational Definitions in Chapter 2.
Research Design
This study used Control and Experimental Design with the Cluster as the unit of
84
Randomization. A Cluster Randomized Trial or Group Randomized Trial (GRT) is a
common design in clinical health care research in which clusters of individuals rather
than individuals are randomly assigned into study groups (e.g., the group is randomly
assigned, not the individual) (Murray, 1998).
The main reason to choose a Cluster Randomized Trial in this study was that the
intervention of a Unit Dose Dispensing System could not be installed on individual basis.
The clusters of doses for two units with 29 beds in one unit and 24 beds in the other unit
on the General Surgery Ward were randomly assigned to the Control group or
Experimental group by flipping a coin. It was also an administratively convenient design
because the patients who had already been assigned into the beds according to their
physicians were not affected by the group assignment.
The doses within each group were observed individually when they were prepared
by the same group of medication nurses and administered to the patients at the routine
time. Medication preparation and administration processes were directly observed by the
Principal Investigator for each group both before and after the intervention of the Unit
Dose Dispensing System was installed in the Experimental group. No changes were made
in the Control group. The details of the observation method were described in the Data
Collection Chapter.
The effect of the Unit Dose Dispensing System was measured by the Analysis of
Covariance (ANCOVA) controlling the before-test as a covariate to find the difference of
after-test between the Control and Experimental groups.

85
Structure
The structure of the study is shown in Figure 6 and Figure 7.
R O O
R O X O
R: Random Assignment
O: Measurement (Direct Observation)
X: Intervention in the Experimental group
Figure 6: Standard Control and Experimental Design with Random Assignment
Unit T1 T2 T3 T4 T5
Cluster Random Assignment 1 Control O1 No Change O3
2 Experimental O2 Unit Dose O4
T1, T2, T3, T4, T5: Time 1, Time 2, Time 3, Time 4, Time 5
O1 and O2: Observations before the intervention of Unit Dose
O3 and O4: Observations after the intervention of Unit Dose
Figure 7: Control and Experimental Design with Cluster Random Assignment
Controls
Selection Bias
The two units were selected from the same patient ward. The patients occupancy
rates were similar in the two units.
The patients were assigned into the unit based on their physicians. Although the
physicians in charge of each unit were different, the doses ordered in the two units had
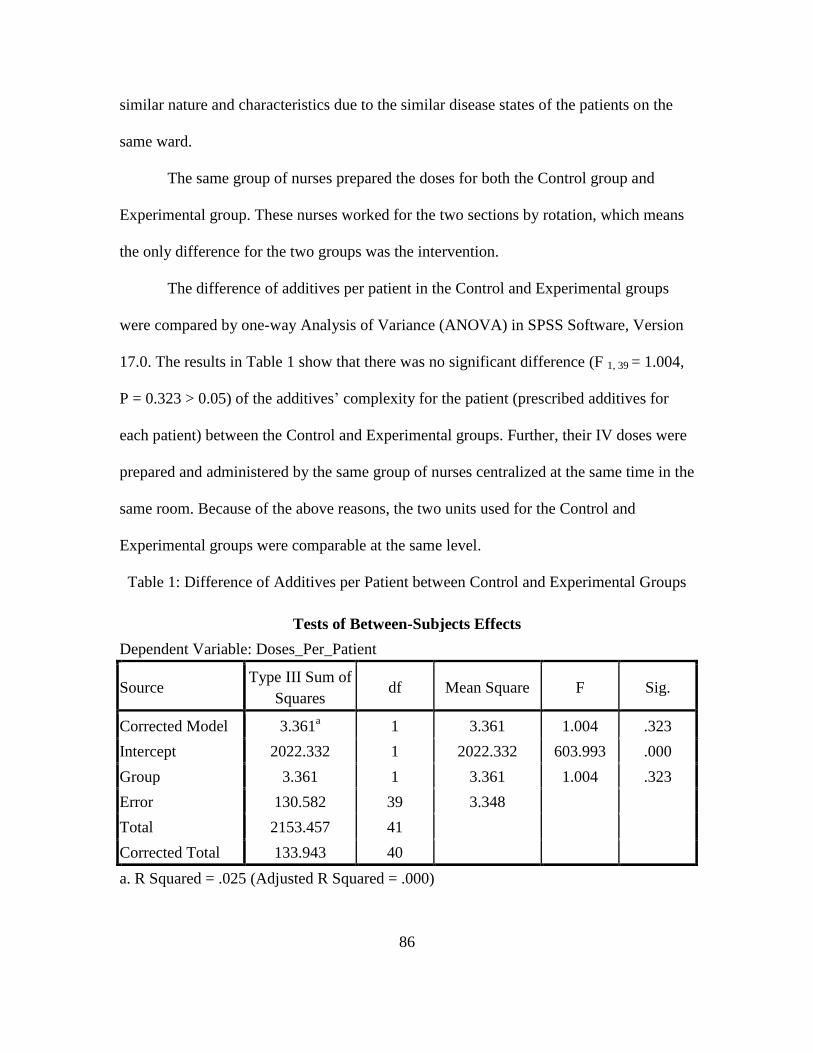
86
similar nature and characteristics due to the similar disease states of the patients on the
same ward.
The same group of nurses prepared the doses for both the Control group and
Experimental group. These nurses worked for the two sections by rotation, which means
the only difference for the two groups was the intervention.
The difference of additives per patient in the Control and Experimental groups
were compared by one-way Analysis of Variance (ANOVA) in SPSS Software, Version
17.0. The results in Table 1 show that there was no significant difference (F 1, 39 = 1.004,
P = 0.323 > 0.05) of the additives’ complexity for the patient (prescribed additives for
each patient) between the Control and Experimental groups. Further, their IV doses were
prepared and administered by the same group of nurses centralized at the same time in the
same room. Because of the above reasons, the two units used for the Control and
Experimental groups were comparable at the same level.
Table 1: Difference of Additives per Patient between Control and Experimental Groups
Tests of Between-Subjects Effects
Dependent Variable: Doses_Per_Patient
Source Type III Sum of
Squares df Mean Square F Sig.
Corrected Model 3.361a 1 3.361 1.004 .323
Intercept 2022.332 1 2022.332 603.993 .000
Group 3.361 1 3.361 1.004 .323
Error 130.582 39 3.348
Total 2153.457 41
Corrected Total 133.943 40
a. R Squared = .025 (Adjusted R Squared = .000)

87
Random Errors
The doses in the two units were randomly assigned to the Control or Experimental
group.
Internal Validities
During the observational periods, the observed nurses experienced no training or
external education on medication safety and the observation instrument.
The purpose of the Control group was to minimize the external threats from
maturation and instrumentation in the Experimental group. The doses were prepared and
administered by the same group of medication nurses in both Control and Experimental
groups, except for the difference of the Unit Dose Dispensing System. If the observed
nurses in the Control group experienced influence from the maturation and observation
instrument in the study, the effects should also be reflected in the Experimental group.
Data Collection Methods
The direct disguised observation method was first used as a method of detecting
medication errors by Barker and McConnell (Barker & McConnell, 1962). In this study
the direct undisguised observation method was used in both the preparation and
administration processes to detect and measure the outcome of IV medication errors. The
data collection forms are shown in Appendix E. After the purpose of the study was given
to the observed nurses initially, the term “medication error” was purposely replaced by
the term “medication accuracy” for acceptability to the observed nurses.

88
The observer was a current Ph.D. candidate in the Department of Pharmacy Care
Systems at Auburn University, who obtained a B.S. of pharmacy from Shenyang
Pharmaceutical University in China in 2000 and was trained and certified in the direct
observation method (and skills) in July of 2008 at East Alabama Medical Center (EAMC)
by Dr. Elizabeth Flynn.
The observation was performed in a non-judgmental and unobtrusive way. The
observer accompanied the nurse who prepared the IV medications, witnessed the
preparation processes, and recorded the information of the IV bag number, preparation
time, patient’s initial, room number and bed number, the base solution name, the volume
of the base solution, the additive name, dosage form, strength, and the volume of the dose
that the nurses added into the base solution bag. If the patient’s information was not given
on the base solution, the Principal Investigator put a number on the base solution bag as
an identificator in order to match the the doses which were prepared and administered for
the patient.
When the nurse administered the IV medications to the patients, the observer
accompanied the nurse who delivered the IV bags and administered the IV bags at the
bedside, wrote the patients’ information and the administered IV information or the
number marked on the IV bag by the Principal Investigator. The preparation notes and the
administration notes were combined and matched for each patient and were later
compared with the physician’s orders to detect any IV medication errors.
The location of the observer and the layout (not to scale) of the IV preparation
room are shown in Figure 8.
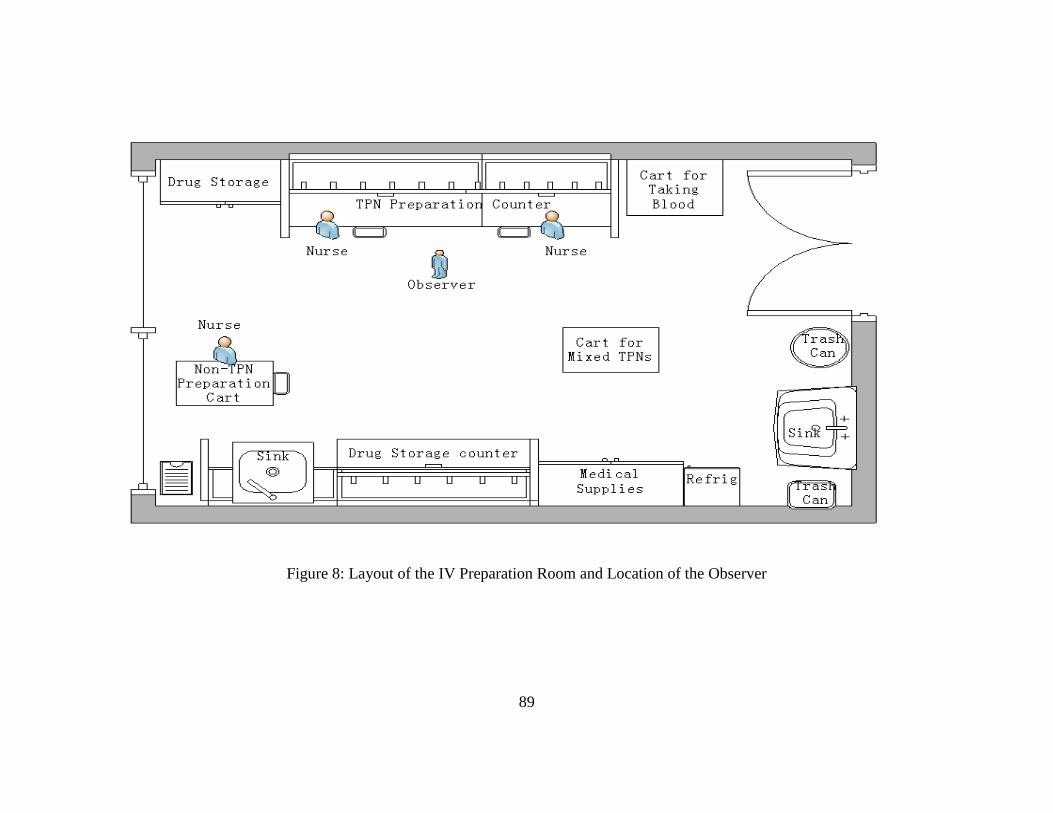
89
Figure 8: Layout of the IV Preparation Room and Location of the Observer

90
Chapter 5: Results
Data Collection
Study Subjects
After obtaining permission from the study hospital and approval from the Auburn
University IRB (16-weeks of full board review process) on May 28, 2010, the summer months of
2010 were finally selected based on the convenience of the Principal Investigator.
After a lengthy discussion with the Director of pharmacy, a General Surgery Patient
Ward with a high volume of IV medication orders was offered and approved for observation.
The beds on this Patient Ward were divided into the two sides of the hallway (Racetrack design:
rooms with #1-#29 beds on one side and rooms with #30-#53 beds on the other side). A Cluster
Randomized Trial was selected for this study by flipping a coin to assign the beds on one side to
the Control group and the beds on the other side to the Experimental group. The direct
observation method was used to detect and measure medication errors.
Prior to data collection, the Principal Investigator had a meeting with the nurses who
worked in the selected ward and who met the study inclusion criteria. The study inclusion criteria
are described as follows:
1. Received a 3-year secondary nursing education and the Nursing Practice Certificate from
the Ministry of Health,
2. Regularly employed more than one year at the study site,
3. Regularly prepared IV doses at the study site,

91
4. Regularly administered the IV doses at the study site, and
5. Age 19 or older.
Practical nursing students and new employees were excluded. Participating nurses were
informed that their normal medication preparation and administration processes would be
observed. The study was to evaluate the effect of the system changes, instead of the effect of the
performance of individuals. Their personal information would not be released to anyone else
including their supervisor. Confidentiality of data was established by coding the names of the
nurses and the patients. The data were locked in a cabinet kept in the Principal Investigator’s
department with access by only the Principal Investigator herself. The observed nurses were
those who agreed to participate in the investigation. Three out of the seventeen nurses were
excluded due to pregnancy. The participants were told that they could withdraw from study at
any time without jeopardizing the relationships between the participants and their employer. The
observed nurses were asked not to change any of their normal routines and to continue their
normal working performance during the observation.
Excluded Doses for Observation: Non-TPN, PRN and Chemotherapy
The Chief Head Nurse refused to install the Unit Dose Dispensing System on Non-TPN
doses because of the concerns described as follows.
1. Extra workload might be involved if the Unit Dose Dispensing System is installed. If the
Non-TPN doses were discontinued by the physician, the same doses can be kept for the
use with another patient who was prescribed the same drugs without any extra work such
as replacing the new label with a new patient’s information.
2. The preparation time might be longer than the time in the existing system.
92
3. Nurses may be dissatisfied if they have to do extra work.
4. Currently, the Non-TPN doses were mixed as an assembly line; hence, the nurse used the
same syringe to add the same additives to the same base solutions. If a unit dose system
was installed, it may consume extra 50-60 syringes per day.
5. The current Non-TPN doses were labeled only with the additive to be added and the time
of administration on the base solution bag. For example, the nurse only labeled
“Orinidazole 2 ampoule, 9 AM” or “Orinidazole 2 ampoule, 3 PM” on the bag of 5%
Glucose Solution. No patient’s information was labeled on the bag. Thus, if such an order
for one patient is discontinued or changed, the mini bag can be kept for using without any
label change for another patient who was ordered the same IV drugs. The Chief Head
Nurse said that this would reduce the likelihood of complaint from rising incorrect patient
information on the label.
PRN doses were excluded from the study because very few doses were ordered as PRN.
Chemotherapy doses were also excluded from the study because of the safety issue. After regular
IV doses were mixed, a medical nurse who prepared the chemotherapy drugs would ask other
staff to leave the treatment room when she prepared the chemotherapy drugs. The protections
included two layers of gloves (plastic and rubber gloves), cotton mask, and opening the
windows. No laminar air flow hood was provided in the treatment room to prepare such
chemotherapy drugs. This protocol would prohibit the observer from being present in the room
while chemotherapy doses were prepared.
93
Included Doses for Observation: TPN doses
The Unit Dose Dispensing System was installed only on TPN doses. The data analysis
was limited to TPN doses.
The day shift from 8 AM to 3 PM was chosen for observation due to the high volume of
IV administration doses given at this time period. Since there was only one observer, each group
was observed in sequence, both before and after the intervention was installed.
The observation of the Control group occurring before the intervention of the Unit-Dose
Dispensing System was conducted from August 3 to August 13, 2010. The observation of the
Control group occurring after the intervention of Unit-Dose Dispensing System was conducted
from October 4 to October 13 2010. The Principal Investigator excluded 7 doses (pre-test) and
11 doses (post-test) from the T.O.E.s in the Control group because they did not meet apriori
operational definitions. A final total of 517 ordered doses plus 4 unordered doses were analyzed
for the statistical analysis in the Control group, 41.7% of the total prescribed TPN doses. The
error frequencies detected for the Control group are shown in Table 2.
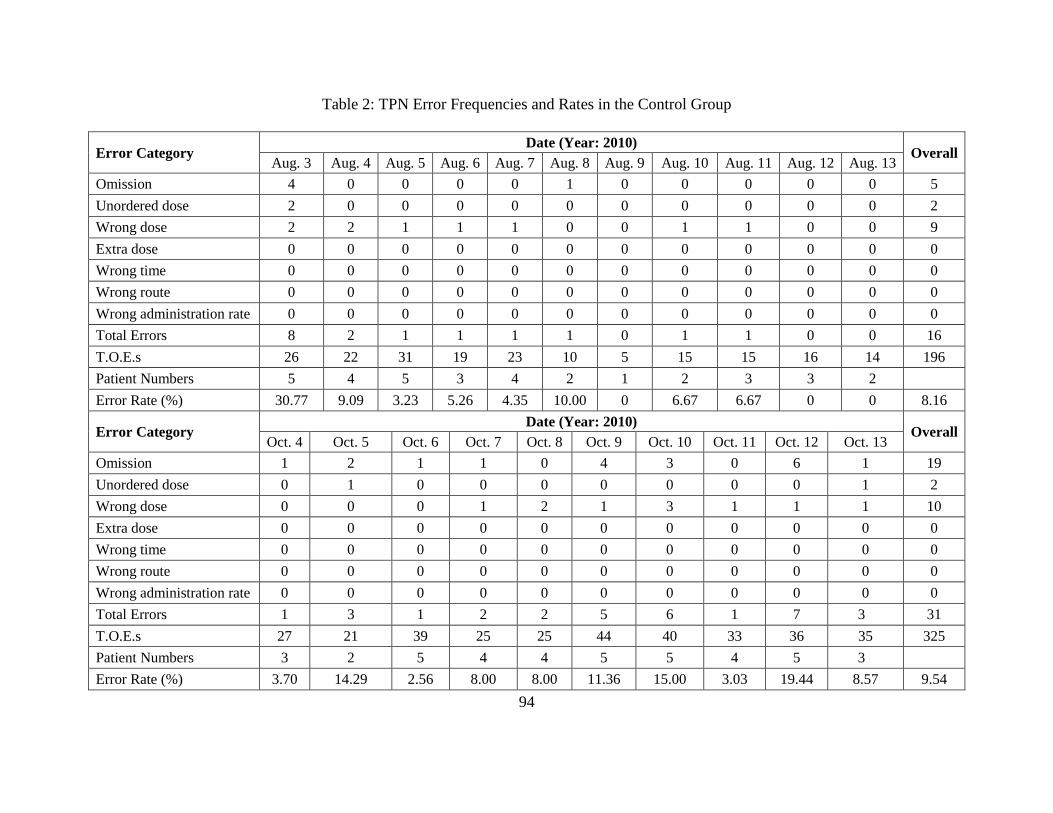
94
Table 2: TPN Error Frequencies and Rates in the Control Group
Error Category Date (Year: 2010)
Overall Aug. 3 Aug. 4 Aug. 5 Aug. 6 Aug. 7 Aug. 8 Aug. 9 Aug. 10 Aug. 11 Aug. 12 Aug. 13
Omission 4 0 0 0 0 1 0 0 0 0 0 5
Unordered dose 2 0 0 0 0 0 0 0 0 0 0 2
Wrong dose 2 2 1 1 1 0 0 1 1 0 0 9
Extra dose 0 0 0 0 0 0 0 0 0 0 0 0
Wrong time 0 0 0 0 0 0 0 0 0 0 0 0
Wrong route 0 0 0 0 0 0 0 0 0 0 0 0
Wrong administration rate 0 0 0 0 0 0 0 0 0 0 0 0
Total Errors 8 2 1 1 1 1 0 1 1 0 0 16
T.O.E.s 26 22 31 19 23 10 5 15 15 16 14 196
Patient Numbers 5 4 5 3 4 2 1 2 3 3 2
Error Rate (%) 30.77 9.09 3.23 5.26 4.35 10.00 0 6.67 6.67 0 0 8.16
Error Category Date (Year: 2010)
Overall Oct. 4 Oct. 5 Oct. 6 Oct. 7 Oct. 8 Oct. 9 Oct. 10 Oct. 11 Oct. 12 Oct. 13
Omission 1 2 1 1 0 4 3 0 6 1 19
Unordered dose 0 1 0 0 0 0 0 0 0 1 2
Wrong dose 0 0 0 1 2 1 3 1 1 1 10
Extra dose 0 0 0 0 0 0 0 0 0 0 0
Wrong time 0 0 0 0 0 0 0 0 0 0 0
Wrong route 0 0 0 0 0 0 0 0 0 0 0
Wrong administration rate 0 0 0 0 0 0 0 0 0 0 0
Total Errors 1 3 1 2 2 5 6 1 7 3 31
T.O.E.s 27 21 39 25 25 44 40 33 36 35 325
Patient Numbers 3 2 5 4 4 5 5 4 5 3
Error Rate (%) 3.70 14.29 2.56 8.00 8.00 11.36 15.00 3.03 19.44 8.57 9.54
95
The observation of the Experimental group occurring before the intervention of Unit-
Dose Dispensing System was conducted from August 16 to August 25, 2010. The observation of
the experiment group occurring after the intervention of Unit-Dose Dispensing System was
conducted from October 17 to October 26 2010. The Principal Investigator excluded 14 doses
(post-test) from the T.O.E.s because because they did not meet apriori operational definitions. A
final total of 675 ordered doses were kept as the final observations for the statistical analysis in
the Experimental group, 44.4% of the total prescribed TPN doses. The error frequencies detected
for the Experimental group are shown in Table 3.
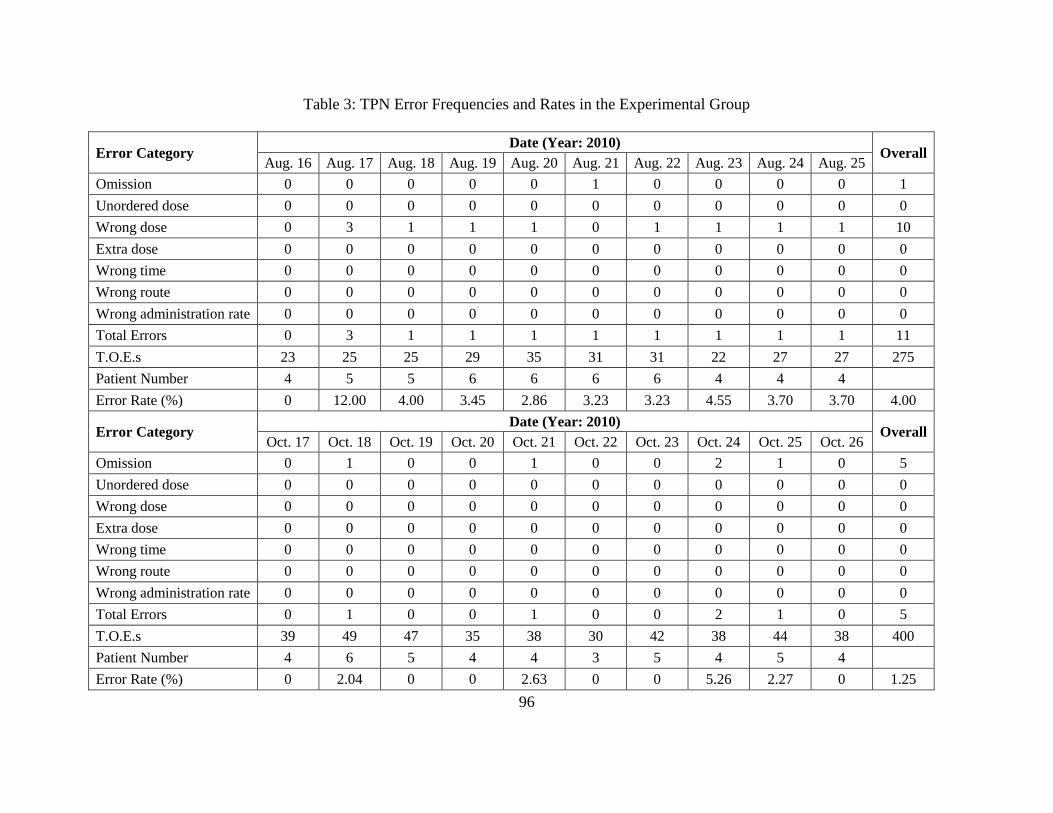
96
Table 3: TPN Error Frequencies and Rates in the Experimental Group
Error Category Date (Year: 2010)
Overall Aug. 16 Aug. 17 Aug. 18 Aug. 19 Aug. 20 Aug. 21 Aug. 22 Aug. 23 Aug. 24 Aug. 25
Omission 0 0 0 0 0 1 0 0 0 0 1
Unordered dose 0 0 0 0 0 0 0 0 0 0 0
Wrong dose 0 3 1 1 1 0 1 1 1 1 10
Extra dose 0 0 0 0 0 0 0 0 0 0 0
Wrong time 0 0 0 0 0 0 0 0 0 0 0
Wrong route 0 0 0 0 0 0 0 0 0 0 0
Wrong administration rate 0 0 0 0 0 0 0 0 0 0 0
Total Errors 0 3 1 1 1 1 1 1 1 1 11
T.O.E.s 23 25 25 29 35 31 31 22 27 27 275
Patient Number 4 5 5 6 6 6 6 4 4 4
Error Rate (%) 0 12.00 4.00 3.45 2.86 3.23 3.23 4.55 3.70 3.70 4.00
Error Category Date (Year: 2010)
Overall Oct. 17 Oct. 18 Oct. 19 Oct. 20 Oct. 21 Oct. 22 Oct. 23 Oct. 24 Oct. 25 Oct. 26
Omission 0 1 0 0 1 0 0 2 1 0 5
Unordered dose 0 0 0 0 0 0 0 0 0 0 0
Wrong dose 0 0 0 0 0 0 0 0 0 0 0
Extra dose 0 0 0 0 0 0 0 0 0 0 0
Wrong time 0 0 0 0 0 0 0 0 0 0 0
Wrong route 0 0 0 0 0 0 0 0 0 0 0
Wrong administration rate 0 0 0 0 0 0 0 0 0 0 0
Total Errors 0 1 0 0 1 0 0 2 1 0 5
T.O.E.s 39 49 47 35 38 30 42 38 44 38 400
Patient Number 4 6 5 4 4 3 5 4 5 4
Error Rate (%) 0 2.04 0 0 2.63 0 0 5.26 2.27 0 1.25
97
Deficiencies of the Current System
The Principal Investigator tabulated all the errors and listed the details (e.g., clues to
cause) about the deviations from the physician orders. In the baseline of the Control and
Experimental groups, deficiencies of the current system were summarized based on clues to the
causes of the errors: (1) handwritten transcriptions, (2) lacking insulin volume label, (3) limited
shelf space, and (4) lacking double check before the preparation.
Clues to the causes of the errors provided the information of deficiencies of the current
system which were considered to design a Unit Dose Dispensing System for this Chinese
hospital.
Handwritten Transcriptions
Among the 27 detected errors, 9 errors (33%) were due to miscommunication of badly
handwritten transcriptions. Unit of volume was another big issue involved in badly handwritten
transcriptions. Some nurses transcribed ampoule as the unit; some nurses transcribed
International Unit (IU) as the unit; some nurses did not transcribe the unit; and some nurses
transcribed Milliliter (ml) as the unit. Clues to the causes of errors indicated that the unit which
was transcribed by the nurses caused confusion to the auxiliary worker who placed the doses on
the counter before the preparation, resulting in errors.
Lacking Insulin Volume Label
Among the 27 detected errors, 9 wrong dose errors (33%) were due to wrong calculation
of the insulin volume and 1 omission error (4%) was contributed by two nurses -- both of whom
forgot to add insulin for the patient.
98
Physicians prescribed only the ratio of insulin to glucose -- the insulin volumes were not
calculated when the nurses transcribed the orders. The preparation nurses calculated the insulin
volume just at the time when they mixed the TPNs.
Limited Shelf Space
Among the 27 detected errors, 4 errors (15%) may have been due to limited shelf space.
Some ampoules for one patient were accidently mixed with the doses of the adjacent patient. The
nurse usually opened all the ampoules to be added in the TPNs and placed them closely together.
The opened ampoule sometimes fell over and the dose spilled on the counter.
Lacking Double Check before the Preparation
Among the 27 detected errors, 2 errors (7%) may have been prevented by a double check
after the auxiliary worker failed to place the doses on the counter before the preparation.
Although the preparation nurses were asked to double check the doses before the preparation,
however, this activity was usually omitted during the rush hours in the morning or was
interrupted by other on-call tasks, such as a telephone call, a question from a physician, or
withdrawal of the patients’ blood.
Error Descriptions Summary
The error descriptions for the Control group are shown in Table 4 and 5. The error
descriptions for the Experimental group are shown in Table 6 and 7.

99
Table 4: TPN Error Descriptions in the Control Group, Before (August 3- August 14, 2010)
Day Error
Number Patient Order Dose given
Error
Category Implications (Clues to cause)
1 1 2
15% KCl 10 ml,
added in the TPN,
once daily
15% KCl 8 ml
was added in the
TPN
Wrong
dose
The nurse's elbow was hit by somebody
accidently when withdrawing the liquid
1 2 8
15% KCl 20 ml,
added in the TPN,
once daily
None Omission
Reasons: 1. This patient's doses were mixed with
the adjacent patient's doses; 2. The nurse was
helping a new nurse to mix the TPN and missed
checking the list
1 3 8
10% NaCl 20 ml,
added in the TPN,
once daily
None Omission
Reasons: 1. This patient's doses were mixed with
the adjacent patient's doses; 2. The nurse was
helping a new nurse to mix the TPN and missed
checking the list
1 4 8
Vitamin C 3 g
(7.5 ml), added in
the TPN, once
daily
None Omission
Reasons: 1. The auxiliary worker failed to place
this dose on the counter; 2. The nurse was helping
a new nurse to mix the TPN and missed checking
the list
1 5 22
15% KCl 10 ml,
added in the TPN,
once daily
15% KCl 30 ml
was added in the
TPN
Wrong
dose
Reasons: 1. Adjacent patient's doses were mixed
with this patient's doses; 2. The nurse didn't check
the list and added them all.
1 6 22 None
10% NaCl 20 ml
was added in the
TPN
Unordered
dose
Reasons: 1. Adjacent patient's doses were mixed
with this patient's doses; 2. The nurse didn't check
the list and added them all.
1 7 23
Vitamin K1 20
mg, added in the
TPN, once daily
None Omission Handwritten of “VK1 2 ampoules” looked like
“V/C, 2 ampoules”.
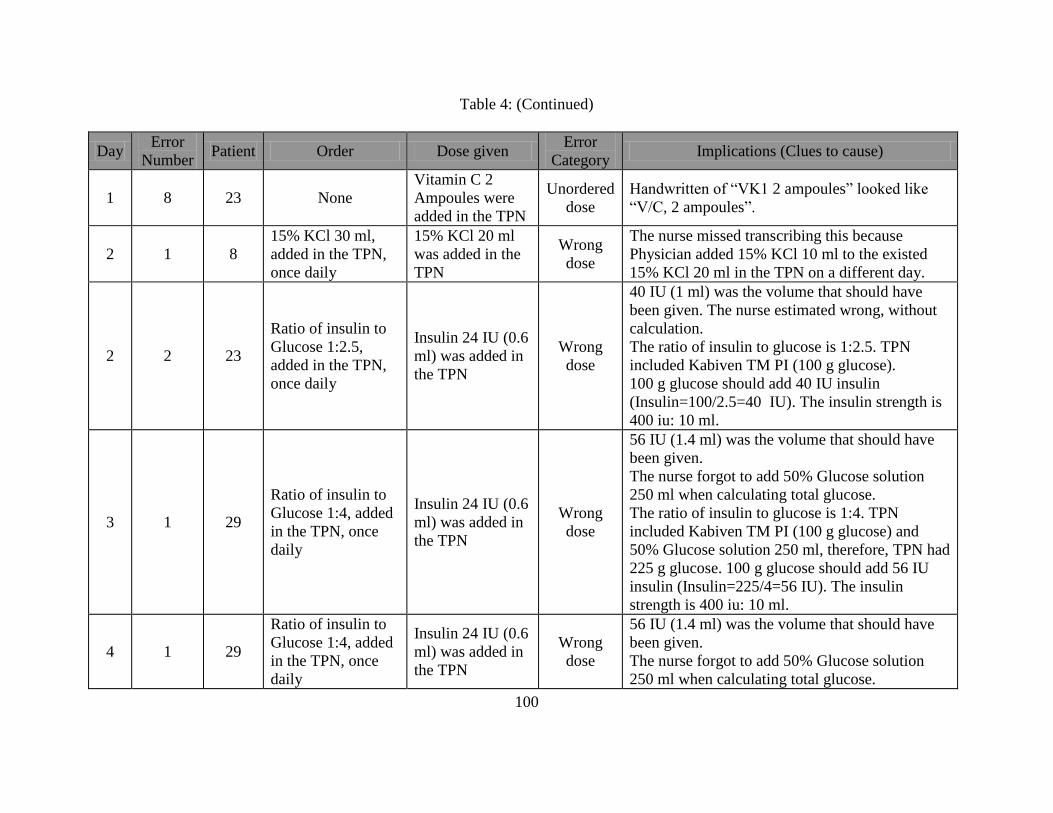
100
Table 4: (Continued)
Day Error
Number Patient Order Dose given
Error
Category Implications (Clues to cause)
1 8 23 None
Vitamin C 2
Ampoules were
added in the TPN
Unordered
dose
Handwritten of “VK1 2 ampoules” looked like
“V/C, 2 ampoules”.
2 1 8
15% KCl 30 ml,
added in the TPN,
once daily
15% KCl 20 ml
was added in the
TPN
Wrong
dose
The nurse missed transcribing this because
Physician added 15% KCl 10 ml to the existed
15% KCl 20 ml in the TPN on a different day.
2 2 23
Ratio of insulin to
Glucose 1:2.5,
added in the TPN,
once daily
Insulin 24 IU (0.6
ml) was added in
the TPN
Wrong
dose
40 IU (1 ml) was the volume that should have
been given. The nurse estimated wrong, without
calculation.
The ratio of insulin to glucose is 1:2.5. TPN
included Kabiven TM PI (100 g glucose).
100 g glucose should add 40 IU insulin
(Insulin=100/2.5=40 IU). The insulin strength is
400 iu: 10 ml.
3 1 29
Ratio of insulin to
Glucose 1:4, added
in the TPN, once
daily
Insulin 24 IU (0.6
ml) was added in
the TPN
Wrong
dose
56 IU (1.4 ml) was the volume that should have
been given.
The nurse forgot to add 50% Glucose solution
250 ml when calculating total glucose.
The ratio of insulin to glucose is 1:4. TPN
included Kabiven TM PI (100 g glucose) and
50% Glucose solution 250 ml, therefore, TPN had
225 g glucose. 100 g glucose should add 56 IU
insulin (Insulin=225/4=56 IU). The insulin
strength is 400 iu: 10 ml.
4 1 29
Ratio of insulin to
Glucose 1:4, added
in the TPN, once
daily
Insulin 24 IU (0.6
ml) was added in
the TPN
Wrong
dose
56 IU (1.4 ml) was the volume that should have
been given.
The nurse forgot to add 50% Glucose solution
250 ml when calculating total glucose.

101
Table 4: (Continued)
Day Error
Number Patient Order Dose given
Error
Category Implications (Clues to cause)
5 1 29
Ratio of insulin to
Glucose 1:4, added
in the TPN, once
daily
Insulin 24 IU (0.6
ml) was added in
the TPN
Wrong
dose
56 IU (1.4 ml) was the volume that should have
been given.
The nurse forgot to add 50% Glucose solution
250 ml when calculating total glucose.
6 1 3
Ratio of insulin to
Glucose 1:5, added
in the TPN, once
daily
None Omission
The first nurse added additives (Vitamin K1 2
mg, Vitamin C 2 g, and Potassium Aspartate and
Magnesium Aspartate Injection 50 ml) into the
bottle of N(2)-L-alanyl-L-glutamine for injection,
except insulin. The second nurse forgot to add
insulin when she filled the liquid in the bottle of
N(2)-L-alanyl-L-glutamine for injection into the
1440 ml bag of Kabiven TM PI bag.
7 None None None None None None
8 1 29
Ratio of insulin to
Glucose 1:4, added
in the TPN, once
daily
Insulin 24 IU (0.6
ml) was added in
the TPN
Wrong
dose
56 IU (1.4 ml) was the volume that should have
been given.
The nurse forgot to add 50% Glucose solution
250 ml when calculating total glucose.
9 1 2
Ratio of insulin to
Glucose 1:6, added
in the TPN, once
daily
Insulin 8 IU (0.2
ml) was added in
the TPN
Wrong
dose
16 IU (0.4 ml) was the volume that should have
been given.
Nurse estimated wrong, without calculation.
The ratio of insulin to glucose is 1:6. TPN has
Kabiven TM PI (100 g glucose). 100 g glucose
should add 16 IU insulin (Insulin=100/6=16 IU).
The insulin strength is 400 iu: 10 ml.
10 None None None None None None
11 None None None None None None

102
Table 5: TPN Error Descriptions in the Control Group, After (October 4- October 13, 2010)
Day Error Patient Order Dose given Error
Category Implications (Clues to cause)
1 1 23
Ratio of insulin to
Glucose 1:5,
added in the TPN
None Omission
One nurse left insulin to be added by the next nurse.
It happened that both nurses didn’t add insulin in the
TPN.
2 1 7
Ratio of insulin to
Glucose 1:5,
added in the TPN
None Omission
One nurse left insulin to be added by the next nurse.
It happened that both nurses didn’t add insulin in the
TPN.
2 2 15
Water-Soluble
Vitamin For
Injection 0.5 g,
added in the TPN,
once daily
None Omission
This dose was not placed on the counter by the
auxiliary worker because there was no supply.
The nurse intended to give the drug of Compound 12-
Vitamins for Injection.
2 3 15 None
Compound 12-
Vitamins for
Injection 0.5 g
was added in
the TPN
Unordered
dose
The nurse intended to give the drug of Compound 12-
Vitamins for Injection for Injection because the
Water-Soluble Vitamin for Injection was no delivered
from the pharmacy.
3 1 17
Ratio of insulin to
Glucose 1:4,
added in the TPN,
once daily
None Omission
Insulin dose was transcribed on the top line of the
TPNs, instead of the bottom line as normal, therefore,
the nurse may not notice it when preparing.
4 1 7
Ratio of insulin to
Glucose 1:5,
added in the TPN,
once daily
Insulin 28 IU
(0.7 ml) was
added in the
TPN
Wrong
dose
20 IU (0.5 ml) was the volume that should be given.
The nurse estimated wrong, without calculation.
The ratio of insulin to glucose is 1:5. TPN included
Kabiven TM PI (100 g glucose). 100 g glucose
should add 20 IU insulin (Insulin=100/5=20 IU). The
insulin strength is 400 iu: 10 ml.

103
Table 5: (Continued)
Day
Error
Number Patient Order Dose given
Error
Category Implications (Clues to cause)
4 2 8
Vitamin C 3 g (7.5
ml), added in the
TPN, once daily
None Omission
The auxiliary worker failed to place this dose on the
counter. The nurse checked but didn’t find it when
preparing.
5 1 7
Ratio of insulin to
Glucose 1:5,
added in the TPN,
once daily
Insulin 24 IU
(0.6 ml) was
added in the
TPN
Wrong
dose
20 IU (0.5 ml) was the volume that should have been
given.
The volume was estimated by the nurse without
calculation. The ratio of insulin to glucose is 1:5. TPN
included Kabiven TM PI (100 g glucose). 100 g
glucose should add 20 IU insulin (Insulin=100/5=20
IU). The insulin strength is 400 iu: 10 ml.
5 2 10
Vitamin C 3 g (7.5
ml), added in the
TPN, once daily
Vitamin C 4
ml was added
in the TPN
Wrong
dose
The opened vitamin C ampoule fell over and some
liquid spilled due to limited shelf space.
6 1 12
Ratio of insulin to
Glucose 1:5,
added in the TPN,
once daily
None Omission The nurse was talking to another preparation nurse.
The insulin 20 IU (0.5 ml) was not given in the TPN.
6 13
Vitamin C 3 g (7.5
ml), added in the
TPN, once daily
One ampoule
of already
turned yellow.
Other One ampoule of Vitamin C turned yellow. The nurse
didn’t change it.
6 2 13
Vitamin K1 20 mg
(2 ml), add in the
TPN, once daily
None Omission
Usually Vitamin K1 will not be placed on the counter
in order to avoid the sunshine. The preparation nurse
only mixed the doses dispensed on the counter.
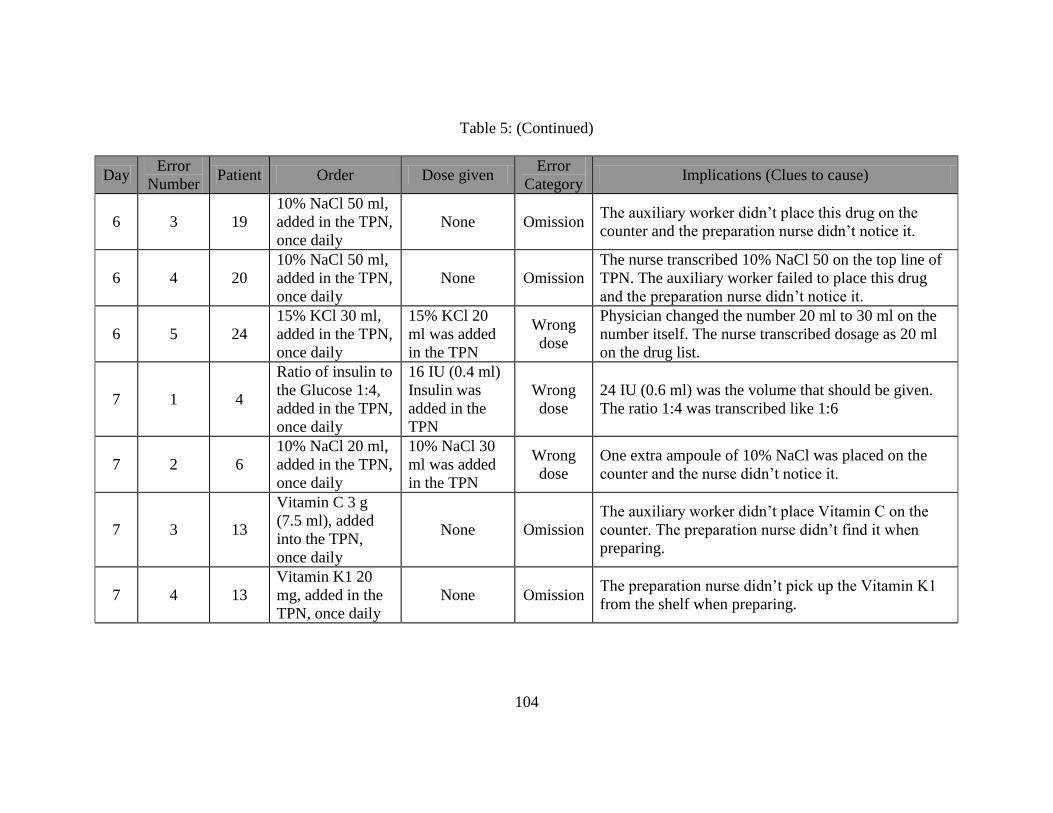
104
Table 5: (Continued)
Day Error
Number Patient Order Dose given
Error
Category Implications (Clues to cause)
6 3 19
10% NaCl 50 ml,
added in the TPN,
once daily
None Omission The auxiliary worker didn’t place this drug on the
counter and the preparation nurse didn’t notice it.
6 4 20
10% NaCl 50 ml,
added in the TPN,
once daily
None Omission
The nurse transcribed 10% NaCl 50 on the top line of
TPN. The auxiliary worker failed to place this drug
and the preparation nurse didn’t notice it.
6 5 24
15% KCl 30 ml,
added in the TPN,
once daily
15% KCl 20
ml was added
in the TPN
Wrong
dose
Physician changed the number 20 ml to 30 ml on the
number itself. The nurse transcribed dosage as 20 ml
on the drug list.
7 1 4
Ratio of insulin to
the Glucose 1:4,
added in the TPN,
once daily
16 IU (0.4 ml)
Insulin was
added in the
TPN
Wrong
dose
24 IU (0.6 ml) was the volume that should be given.
The ratio 1:4 was transcribed like 1:6
7 2 6
10% NaCl 20 ml,
added in the TPN,
once daily
10% NaCl 30
ml was added
in the TPN
Wrong
dose
One extra ampoule of 10% NaCl was placed on the
counter and the nurse didn’t notice it.
7 3 13
Vitamin C 3 g
(7.5 ml), added
into the TPN,
once daily
None Omission
The auxiliary worker didn’t place Vitamin C on the
counter. The preparation nurse didn’t find it when
preparing.
7 4 13
Vitamin K1 20
mg, added in the
TPN, once daily
None Omission The preparation nurse didn’t pick up the Vitamin K1
from the shelf when preparing.

105
Table 5: (Continued)
Day Error
Number Patient Order Dose given
Error
Category Implications (Clues to cause)
7 5 15
10% Calcium
Gluconate 10 ml,
added in the TPN,
once daily
10% Calcium
Gluconate 2 ml
was added in
the TPN
Wrong
dose
The nurse usually opened all the ampoules to be added
in the TPN and placed them closely. The opened
ampoule fell over and the drug spilled on the counter.
7 6 18
Trace Elements
for Injection
(Addammel) 10
ml, added in the
TPN, once daily
None Omission The auxiliary worker failed to place this dose on the
counter. The nurse didn’t notice the omitted dose.
8 1 7
Ratio of insulin to
Glucose 1:5,
added in the TPN,
once daily
Insulin 24 IU
(0.6 ml) was
added in the
TPN
Wrong
dose
30 IU (0.75 ml) was the volume that should be given.
The nurse estimated wrong, without calculation.
The ratio of insulin to glucose is 1:5. TPN included
Kabiven TM PI and 10% Glucose solution 500 ml.
Therefore, TPN had 150 g glucose. 100 g glucose
should add 30 IU insulin (Insulin=150/5=30 IU). The
insulin strength is 400 iu: 10 ml.
9 1 8
Sodium
Glycerophosphate
Injection 10 ml,
added in the TPN,
once daily
None Omission The auxiliary worker failed to place this dose on the
counter. The nurse didn’t find it.
9 2 18
15% KCl 20 ml,
added in the TPN,
once daily
None Omission The nurse didn’t transcribe this dose on the drug list.
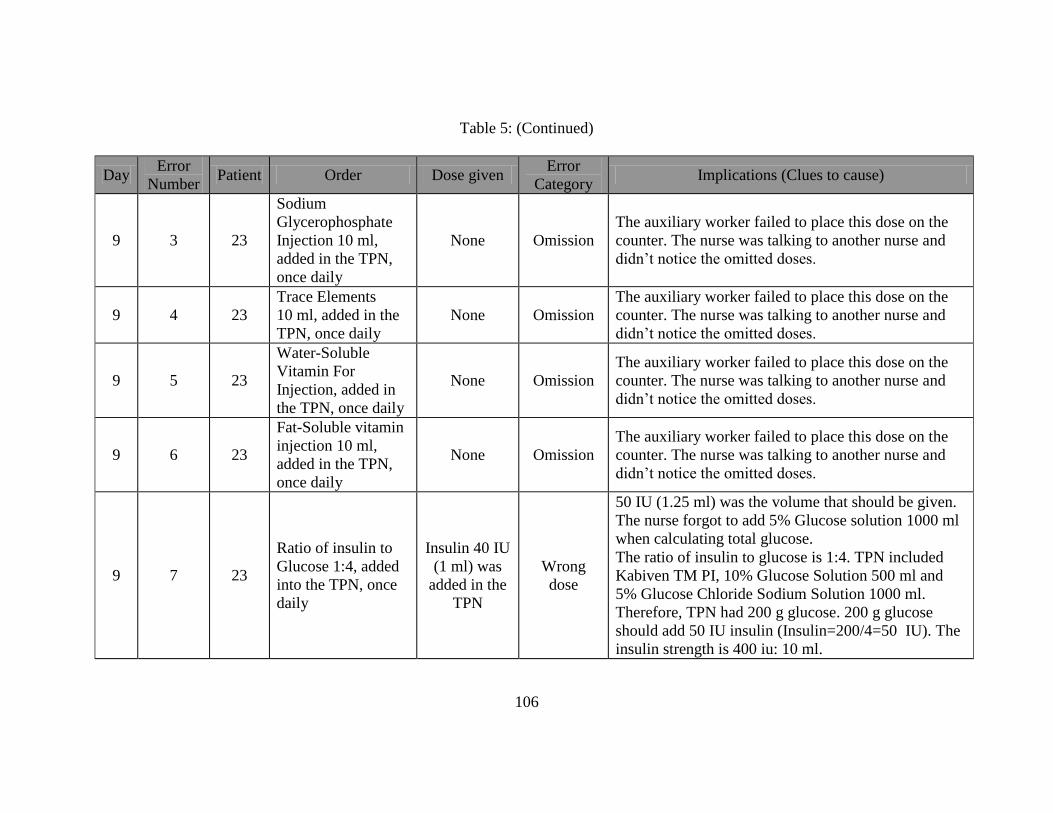
106
Table 5: (Continued)
Day Error
Number Patient Order Dose given
Error
Category Implications (Clues to cause)
9 3 23
Sodium
Glycerophosphate
Injection 10 ml,
added in the TPN,
once daily
None Omission
The auxiliary worker failed to place this dose on the
counter. The nurse was talking to another nurse and
didn’t notice the omitted doses.
9 4 23
Trace Elements
10 ml, added in the
TPN, once daily
None Omission
The auxiliary worker failed to place this dose on the
counter. The nurse was talking to another nurse and
didn’t notice the omitted doses.
9 5 23
Water-Soluble
Vitamin For
Injection, added in
the TPN, once daily
None Omission
The auxiliary worker failed to place this dose on the
counter. The nurse was talking to another nurse and
didn’t notice the omitted doses.
9 6 23
Fat-Soluble vitamin
injection 10 ml,
added in the TPN,
once daily
None Omission
The auxiliary worker failed to place this dose on the
counter. The nurse was talking to another nurse and
didn’t notice the omitted doses.
9 7 23
Ratio of insulin to
Glucose 1:4, added
into the TPN, once
daily
Insulin 40 IU
(1 ml) was
added in the
TPN
Wrong
dose
50 IU (1.25 ml) was the volume that should be given.
The nurse forgot to add 5% Glucose solution 1000 ml
when calculating total glucose.
The ratio of insulin to glucose is 1:4. TPN included
Kabiven TM PI, 10% Glucose Solution 500 ml and
5% Glucose Chloride Sodium Solution 1000 ml.
Therefore, TPN had 200 g glucose. 200 g glucose
should add 50 IU insulin (Insulin=200/4=50 IU). The
insulin strength is 400 iu: 10 ml.

107
Table 5: (Continued)
Day Error
Number Patient Order Dose given
Error
Category Implications (Clues to cause)
10 1 3
Ratio of insulin to
Glucose 1:3,
added in the TPN,
once daily
Insulin 32 IU
(0.8 ml) was
added in the
TPN
Wrong
dose
42 IU (1.05 ml) was the volume that should be given.
The nurse forgot to add 5% Glucose solution 500 ml
when calculating total glucose.
The ratio of insulin to glucose is 1:3. TPN included
Kabiven TM PI (100 g glucose) and 5% Glucose
solution 500 ml. Therefore, TPN had 125 g glucose.
125 g glucose should add 42 IU insulin
(Insulin=125/3=42 IU). The insulin strength is 400
iu: 10 ml.
10 2 23
Water-Soluble
Vitamin Powder
for Injection 0.5
g, added in the
TPN, once daily
None Omission
The auxiliary worker failed to place this dose on the
counter because of no supply.
The nurse omitted the dose of Water-Soluble Vitamin
for injection because there was no supply. She gave
the dose of 12 Vitamins for Injection instead.
10 3 23 None
Compound 12
Vitamins for
Injection 0.5 g
was dissolved
and added in
the TPN
Unordered
dose
The auxiliary worker failed to place this dose on the
counter because of no supply.
The nurse omitted the dose of Water-Soluble Vitamin
for injection because there was no supply. She gave
the dose of 12 Vitamins for Injection instead.

108
Table 6: TPN Error Descriptions in the Experimental Group, Before (August 16- August 25, 2010)
Day Error
Number Patient Order Dose given
Error
Category Implications (Clues to cause)
1 None None None None None None
2 1 50
10% NaCl 100
ml, added in the
TPN, once daily
10% NaCl 10 ml
was added in the
TPN
Wrong
dose
(10 fold)
Reasons: 1. The nurse transcribed as 10% NaCl 10,
without a unit along with the number.
2. The auxiliary worker only dispensed 10 ml (1
ampoule) of 10% NaCl.
2 2 51
Vitamin C 3 g
(7.5 ml), added
in the TPN, once
daily
Vitamin C 5 ml
was added in the
TPN
Wrong
dose
7.5 ml was the volume should be added in the TPN.
The handwritten 3 g looked like 2 g.
2 3 53
Vitamin C 3 g
(7.5 ml), added
in the TPN, once
daily
Vitamin C 5 ml
was added in the
TPN
Wrong
dose
7.5 ml was the volume should be added in the TPN.
Reason: The handwritten 3 g looked like 2 g.
3 1 50
10% NaCl 100
ml, added in the
TPN, once daily
10% NaCl 10 ml
was added in the
TPN
Wrong
dose
(10 fold)
Reasons: 1. The nurse transcribed as 10% NaCl 10,
without a unit along with the number.
2. The auxiliary worker only dispensed 10 ml (1
ampoule) of 10% NaCl
4 1 50
10% NaCl 100
ml, added in the
TPN, once daily
10% NaCl 10 ml
was added in the
TPN
Wrong
dose
(10 fold)
Reasons: 1. The nurse transcribed as 10% NaCl 10,
without a unit along with the number.
2. The auxiliary worker only dispensed 10 ml (1
ampoule) of 10% NaCl
5 1 50
10% NaCl 100
ml, added in the
TPN, once daily
10% NaCl 10 ml
was added in the
TPN
Wrong
dose
(10 fold)
Reasons: 1. The nurse transcribed as 10% NaCl 10,
without a unit along with the number.
2. The auxiliary worker only dispensed 10 ml (1
ampoule) of 10% NaCl

109
Table 6: (Continued)
Day Error
Number Patient Order Dose given
Error
Category Implications (Clues to cause)
6 1 44
15% KCl 10 ml,
added in the TPN,
once daily
None Omission The 15% KCl was not placed on the counter by the
auxiliary worker.
7 1 40
N(2)-L-alanyl-L-
glutamine for
injection 100 ml,
added in the TPN,
once daily
N(2)-L-alanyl-
L-glutamine
for injection
150 ml was
added in the
TPN
Wrong
dose
Previous nurse added additives of Vitamin C 3 g, and
10% NaCl 50 ml in the bottle of N(2)-L-alanyl-L-
glutamine for injection 50 ml. The second nurse took an
extra new N(2)-L-alanyl-L-glutamine for injection 50
ml, because she assumed that bottle only had additives.
8 1 44
Ratio of insulin to
Glucose 1:6,
added in the TPN,
once daily
Insulin 20 IU
(0.5 ml) was
added in the
TPN
Wrong
dose
16 IU (0.4 ml) was the volume that should be given.
The nurse estimated wrong, without calculation.
The ratio of insulin to glucose is 1:6. TPN included
Kabiven TM PI (100 g glucose). 100 g glucose should
add 16 IU insulin (Insulin=100/6=16 IU). The insulin
strength is 400 iu: 10 ml.
9 1 44
Ratio of insulin to
Glucose 1:6,
added in the TPN,
once daily
Insulin 20 IU
(0.5 ml) was
added in the
TPN
Wrong
dose
16 IU (0.4 ml) was the volume that should be given.
The volume was estimated by the nurse without
calculation. The ratio of insulin to glucose is 1:6. TPN
has Kabiven TM PI(100 g glucose). 100 g glucose
should add 16 IU insulin (Insulin=100/6=16 IU). The
insulin strength is 400 iu: 10 ml.
10 1 30
Ratio of insulin to
Glucose 1:2.5,
added in the TPN,
once daily
Insulin 56 IU
(1.4 ml) was
added in the
TPN
Wrong
dose
50 IU (1.25 ml) was the volume that should be given.
The nurse estimated wrong, without calculation.
The ratio of insulin to glucose is 1:2.5. TPN included
Kabiven TM PI and 5% Glucose and Sodium Chloride
solution 500 ml. Therefore, TPN had 125 g glucose. 125
g glucose should add 50 IU insulin (Insulin=125/2.5=50
IU). The insulin strength is 400 iu: 10 ml.
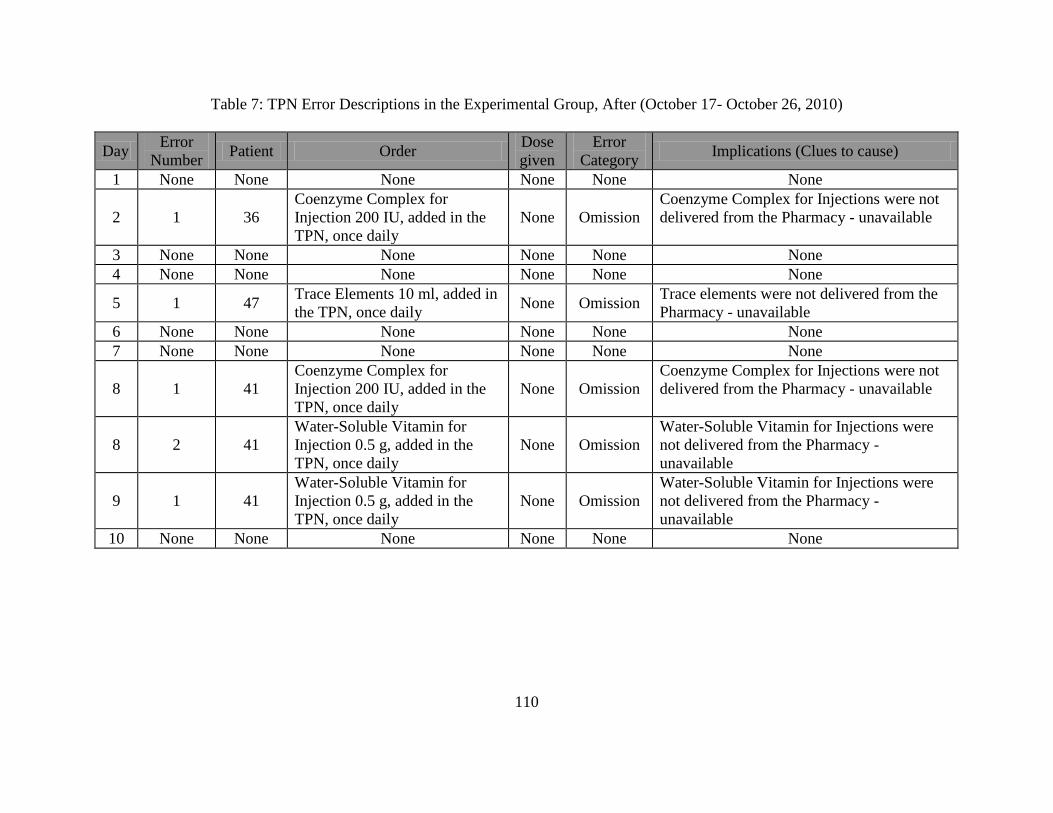
110
Table 7: TPN Error Descriptions in the Experimental Group, After (October 17- October 26, 2010)
Day Error
Number Patient Order
Dose
given
Error
Category Implications (Clues to cause)
1 None None None None None None
2 1 36
Coenzyme Complex for
Injection 200 IU, added in the
TPN, once daily
None Omission
Coenzyme Complex for Injections were not
delivered from the Pharmacy - unavailable
3 None None None None None None
4 None None None None None None
5 1 47 Trace Elements 10 ml, added in
the TPN, once daily None Omission
Trace elements were not delivered from the
Pharmacy - unavailable
6 None None None None None None
7 None None None None None None
8 1 41
Coenzyme Complex for
Injection 200 IU, added in the
TPN, once daily
None Omission
Coenzyme Complex for Injections were not
delivered from the Pharmacy - unavailable
8 2 41
Water-Soluble Vitamin for
Injection 0.5 g, added in the
TPN, once daily
None Omission
Water-Soluble Vitamin for Injections were
not delivered from the Pharmacy -
unavailable
9 1 41
Water-Soluble Vitamin for
Injection 0.5 g, added in the
TPN, once daily
None Omission
Water-Soluble Vitamin for Injections were
not delivered from the Pharmacy -
unavailable
10 None None None None None None

111
Negotiations of the Experimental System Changes for Unit Dose
After studying the HIS physician station information (Figure 9), the Principal Investigator
found that it was possible to print electronic IV orders from the computer in the nurse’s station.
Figure 9: Physician Station of the HIS
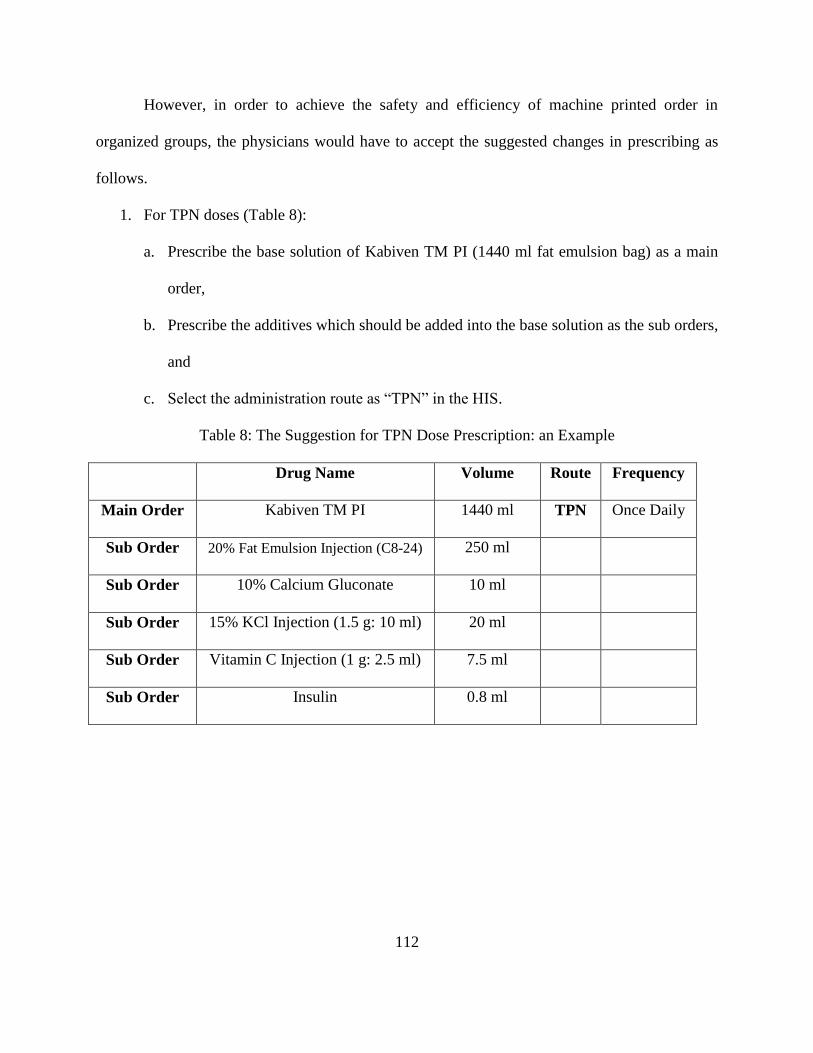
112
However, in order to achieve the safety and efficiency of machine printed order in
organized groups, the physicians would have to accept the suggested changes in prescribing as
follows.
1. For TPN doses (Table 8):
a. Prescribe the base solution of Kabiven TM PI (1440 ml fat emulsion bag) as a main
order,
b. Prescribe the additives which should be added into the base solution as the sub orders,
and
c. Select the administration route as “TPN” in the HIS.
Table 8: The Suggestion for TPN Dose Prescription: an Example
Drug Name Volume Route Frequency
Main Order Kabiven TM PI 1440 ml TPN Once Daily
Sub Order 20% Fat Emulsion Injection (C8-24) 250 ml
Sub Order 10% Calcium Gluconate 10 ml
Sub Order 15% KCl Injection (1.5 g: 10 ml) 20 ml
Sub Order Vitamin C Injection (1 g: 2.5 ml) 7.5 ml
Sub Order Insulin 0.8 ml
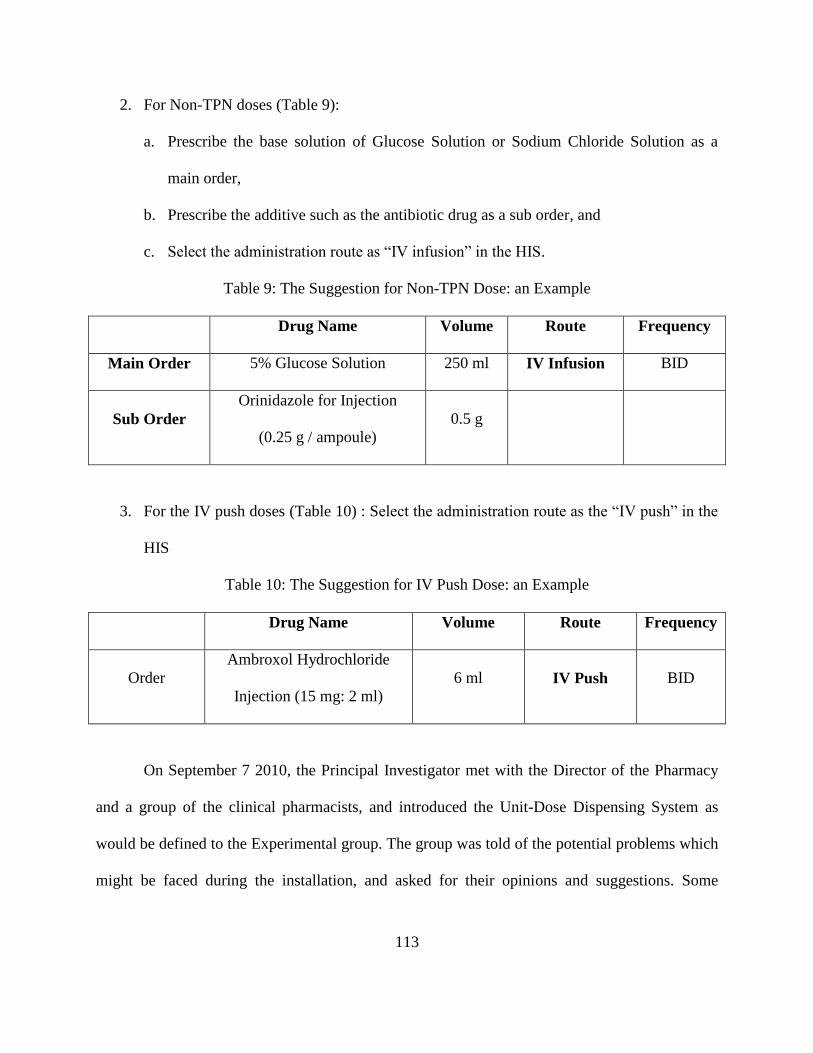
113
2. For Non-TPN doses (Table 9):
a. Prescribe the base solution of Glucose Solution or Sodium Chloride Solution as a
main order,
b. Prescribe the additive such as the antibiotic drug as a sub order, and
c. Select the administration route as “IV infusion” in the HIS.
Table 9: The Suggestion for Non-TPN Dose: an Example
Drug Name Volume Route Frequency
Main Order 5% Glucose Solution 250 ml IV Infusion BID
Sub Order
Orinidazole for Injection
(0.25 g / ampoule)
0.5 g
3. For the IV push doses (Table 10) : Select the administration route as the “IV push” in the
HIS
Table 10: The Suggestion for IV Push Dose: an Example
Drug Name Volume Route Frequency
Order
Ambroxol Hydrochloride
Injection (15 mg: 2 ml)
6 ml IV Push BID
On September 7 2010, the Principal Investigator met with the Director of the Pharmacy
and a group of the clinical pharmacists, and introduced the Unit-Dose Dispensing System as
would be defined to the Experimental group. The group was told of the potential problems which
might be faced during the installation, and asked for their opinions and suggestions. Some

114
examples of errors detected were shown to the clinical pharmacists, after all were asked and
agreed not to release any information about the errors to any nurse in the study patient ward.
After agreement on the changes to be made to the Unit Dose Dispensing System to be
installed, a clinical pharmacist was assigned to assist as a part of the Unit Dose Dispensing
System. Other agreements during this meeting which became part of the operational definition of
the new system are as follows:
If the doctor disagreed to the suggested changes in prescribing, the clinical pharmacist
would try to help enter and generate a printable prescription (drug list and label).
The Director of the Pharmacy would help the Principal Investigator discuss the
preparation and administration changes with the Chief Head Nurse.
The Director of the Pharmacy would help the Principal Investigator discuss physician
cooperation with the Director of the Physicians on the study ward.
The Director of the Pharmacy arranged a meeting to negotiate the changes in the IV
preparation and administration processes with the Chief Head Nurse. The Principal Investigator
showed the Chief Head Nurse the evidence of some of the errors detected and the evidence of
how such errors were typically prevented by Unit-Dose Dispensing Systems. The Chief Head
Nurse only showed a great interest in the potential of machine-printed labels and the electronic
IV orders to replace the handwritten transcriptions and improve the efficiency of their work, but
she insisted on the status quo of the existing preparation and administration system procedures.
On September 14, 2010, the Director of Physicians agreed for the Principal Investigator
to make a 10-minute PowerPoint presentation about the few changes the physicians would be
asked to make in prescribing. Unfortunately, the presentation of the proposed changes was
interrupted by the Director of the Physicians because he said there was no obvious improvement

115
in the efficiency for the physicians.
The Principal Investigator returned to the original idea of manually reentering each order
in the Excel file (Office 2007). The Principal Investigator and the clinical pharmacist set up the
medicine Excel file (Office 2007) for the patients on September 16-17, 2010. After the
discussion with the Chief Head Nurse, the Unit-Dose Dispensing Concept was tested on the
TPNs in the Experimental group from September 18-September 30, 2010 (Appendix I).
A checklist used to measure the progress of the installation of the Unit Dose Dispensing
System is described in Table 11.
Table 11: Checklist for Measuring the Unit Dose Dispensing System Installation
A. IV ORDER
1. Pharmacist reviews paper drug orders for prescribing accuracy, consulting
with physician if necessary. Checked
2. Orders are re-entered into the master order file (Excel Office 2007) for
each patient including patient's full name, age, bed number, dosage form,
dosage (insulin dosage is calculated into volume), and administration
time.
Checked
3. Medication orders are filed, updated and sent to the nurse division. Checked
4. Orders are printed out in cumulative list of all active drug orders for each
patient (drug list or pick list) at both the pharmacy (drug profile) and the
nursing division Medication Administration Record (MAR).
Checked
B. IV DISPENSING
1. IV nurse (or auxiliary worker) uses Pick List to pick all doses scheduled
for administration to each patient at one administration time, places them
in a separate basket for each patient, signs or initials on the labels, and has
them verified by a pharmacist.
Checked
1.1. Pharmacist checks doses for deterioration visually, and expiry date,
before admixture. Checked
2. Label is generated, reviewed by pharmacist for changes needed,
comparing label to order. Checked
2.1. Name and bed number are prominent on top of label. Checked
2.2. Name of base fluid is on label Checked
2.3. Name of each active ingredient and the amount of dose with unit of
concentration are on label Checked
2.4. Brand name is close to generic name. Not Applicable
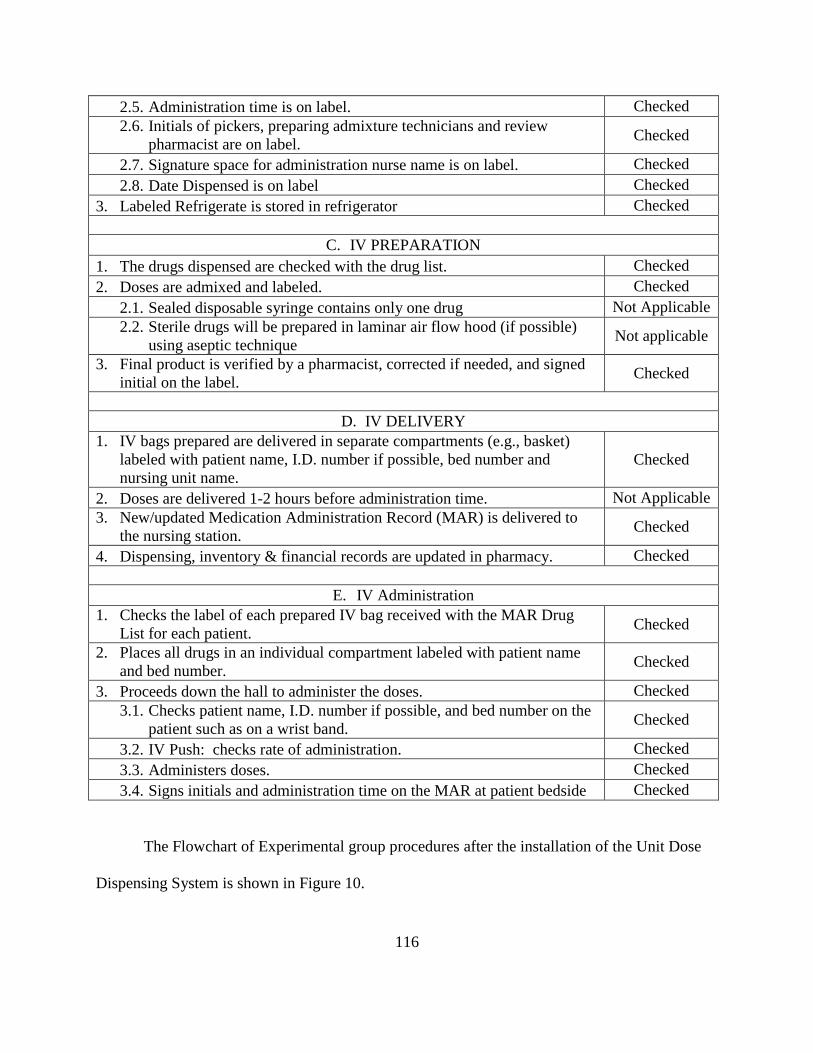
116
2.5. Administration time is on label. Checked
2.6. Initials of pickers, preparing admixture technicians and review
pharmacist are on label. Checked
2.7. Signature space for administration nurse name is on label. Checked
2.8. Date Dispensed is on label Checked
3. Labeled Refrigerate is stored in refrigerator Checked
C. IV PREPARATION
1. The drugs dispensed are checked with the drug list. Checked
2. Doses are admixed and labeled. Checked
2.1. Sealed disposable syringe contains only one drug Not Applicable
2.2. Sterile drugs will be prepared in laminar air flow hood (if possible)
using aseptic technique Not applicable
3. Final product is verified by a pharmacist, corrected if needed, and signed
initial on the label. Checked
D. IV DELIVERY
1. IV bags prepared are delivered in separate compartments (e.g., basket)
labeled with patient name, I.D. number if possible, bed number and
nursing unit name.
Checked
2. Doses are delivered 1-2 hours before administration time. Not Applicable
3. New/updated Medication Administration Record (MAR) is delivered to
the nursing station. Checked
4. Dispensing, inventory & financial records are updated in pharmacy. Checked
E. IV Administration
1. Checks the label of each prepared IV bag received with the MAR Drug
List for each patient. Checked
2. Places all drugs in an individual compartment labeled with patient name
and bed number. Checked
3. Proceeds down the hall to administer the doses. Checked
3.1. Checks patient name, I.D. number if possible, and bed number on the
patient such as on a wrist band. Checked
3.2. IV Push: checks rate of administration. Checked
3.3. Administers doses. Checked
3.4. Signs initials and administration time on the MAR at patient bedside Checked
The Flowchart of Experimental group procedures after the installation of the Unit Dose
Dispensing System is shown in Figure 10.
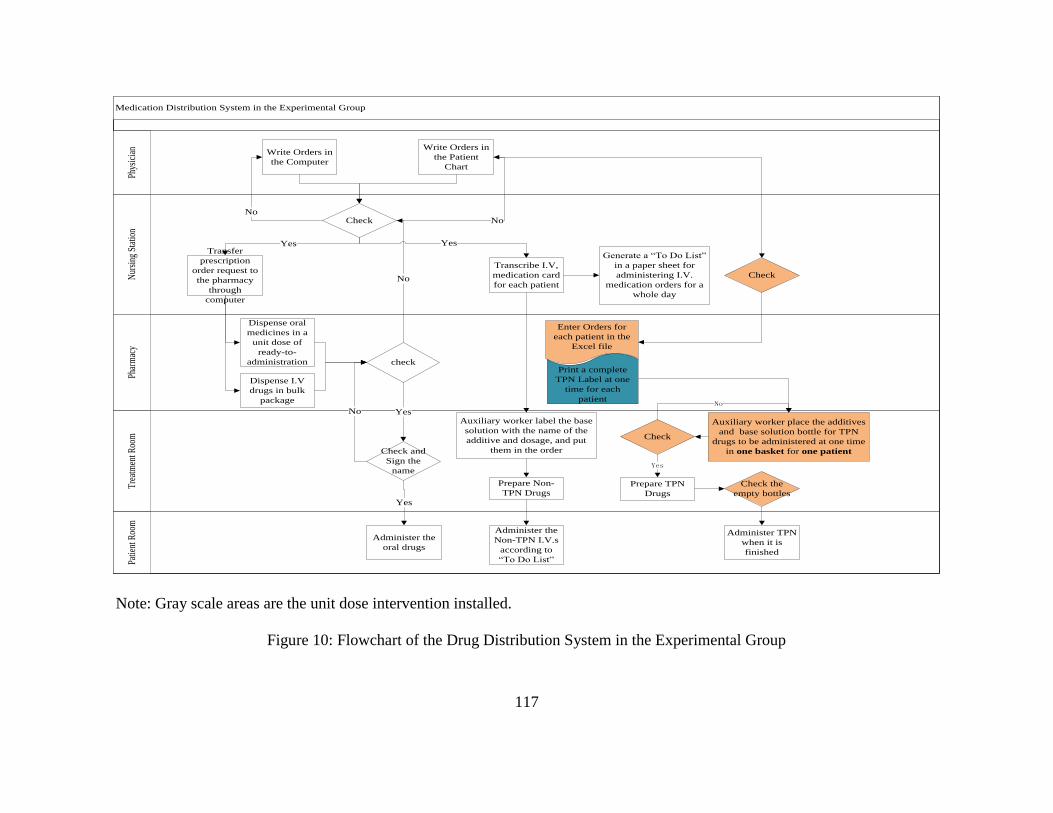
117
Medication Distribution System in the Experimental Group
Tre
atm
ent R
oom
Nur
sing
Sta
tion
Phar
mac
yPa
tient
Roo
mPh
ysic
ian
Write Orders in
the Computer
Check
Write Orders in
the Patient
Chart
Transfer
prescription
order request to
the pharmacy
through
computer
Dispense oral
medicines in a
unit dose of
ready-to-
administration
Generate a “To Do List”
in a paper sheet for
administering I.V.
medication orders for a
whole day
Yes
check
Yes
Dispense I.V
drugs in bulk
package
NoNo
No
Yes
Auxiliary worker place the additives
and base solution bottle for TPN
drugs to be administered at one time
in one basket for one patient
Prepare TPN
Drugs
Check and
Sign the
name
Transcribe I.V,
medication card
for each patient
Auxiliary worker label the base
solution with the name of the
additive and dosage, and put
them in the order
Prepare Non-
TPN Drugs
Administer the
Non-TPN I.V.s
according to
“To Do List”
Yes
Administer the
oral drugs
No
Enter Orders for
each patient in the
Excel file
Print a complete
TPN Label at one
time for each
patient
Check
Check
Yes
Check the
empty bottles
Administer TPN
when it is
finished
No
Note: Gray scale areas are the unit dose intervention installed.
Figure 10: Flowchart of the Drug Distribution System in the Experimental Group
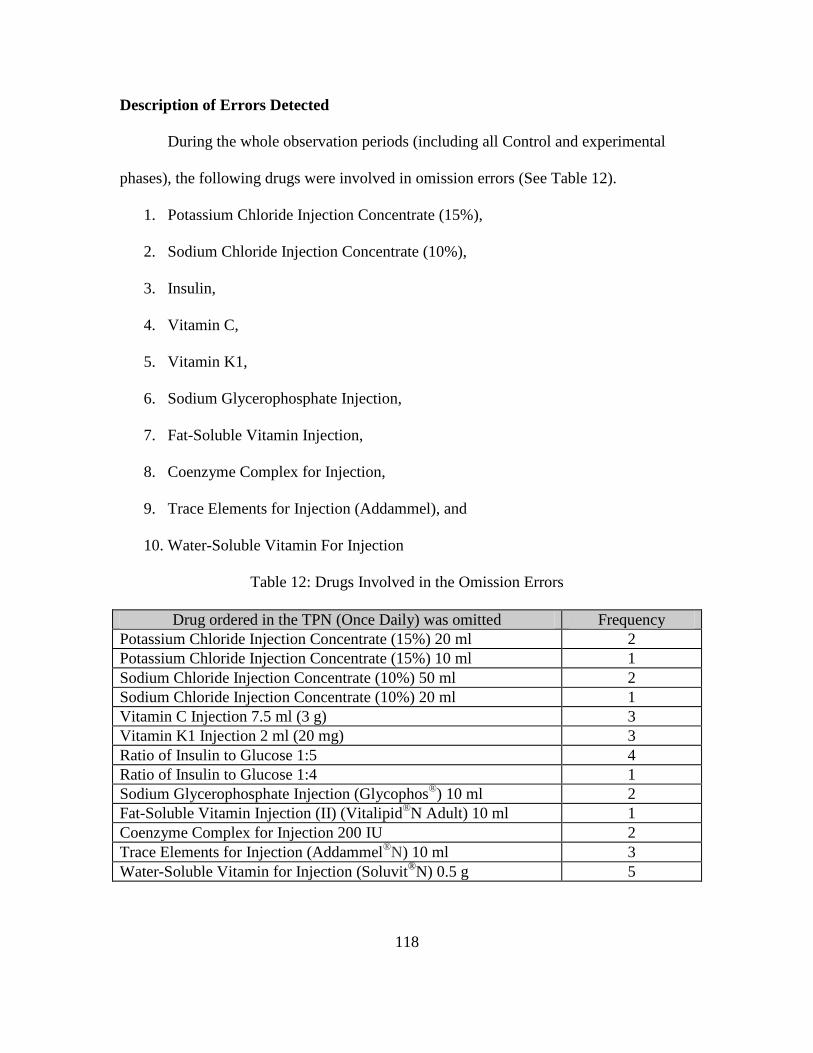
118
Description of Errors Detected
During the whole observation periods (including all Control and experimental
phases), the following drugs were involved in omission errors (See Table 12).
1. Potassium Chloride Injection Concentrate (15%),
2. Sodium Chloride Injection Concentrate (10%),
3. Insulin,
4. Vitamin C,
5. Vitamin K1,
6. Sodium Glycerophosphate Injection,
7. Fat-Soluble Vitamin Injection,
8. Coenzyme Complex for Injection,
9. Trace Elements for Injection (Addammel), and
10. Water-Soluble Vitamin For Injection
Table 12: Drugs Involved in the Omission Errors
Drug ordered in the TPN (Once Daily) was omitted Frequency
Potassium Chloride Injection Concentrate (15%) 20 ml 2
Potassium Chloride Injection Concentrate (15%) 10 ml 1
Sodium Chloride Injection Concentrate (10%) 50 ml 2
Sodium Chloride Injection Concentrate (10%) 20 ml 1
Vitamin C Injection 7.5 ml (3 g) 3
Vitamin K1 Injection 2 ml (20 mg) 3
Ratio of Insulin to Glucose 1:5 4
Ratio of Insulin to Glucose 1:4 1
Sodium Glycerophosphate Injection (Glycophos®) 10 ml 2
Fat-Soluble Vitamin Injection (II) (Vitalipid®N Adult) 10 ml 1
Coenzyme Complex for Injection 200 IU 2
Trace Elements for Injection (Addammel®N) 10 ml 3
Water-Soluble Vitamin for Injection (Soluvit®N) 0.5 g 5
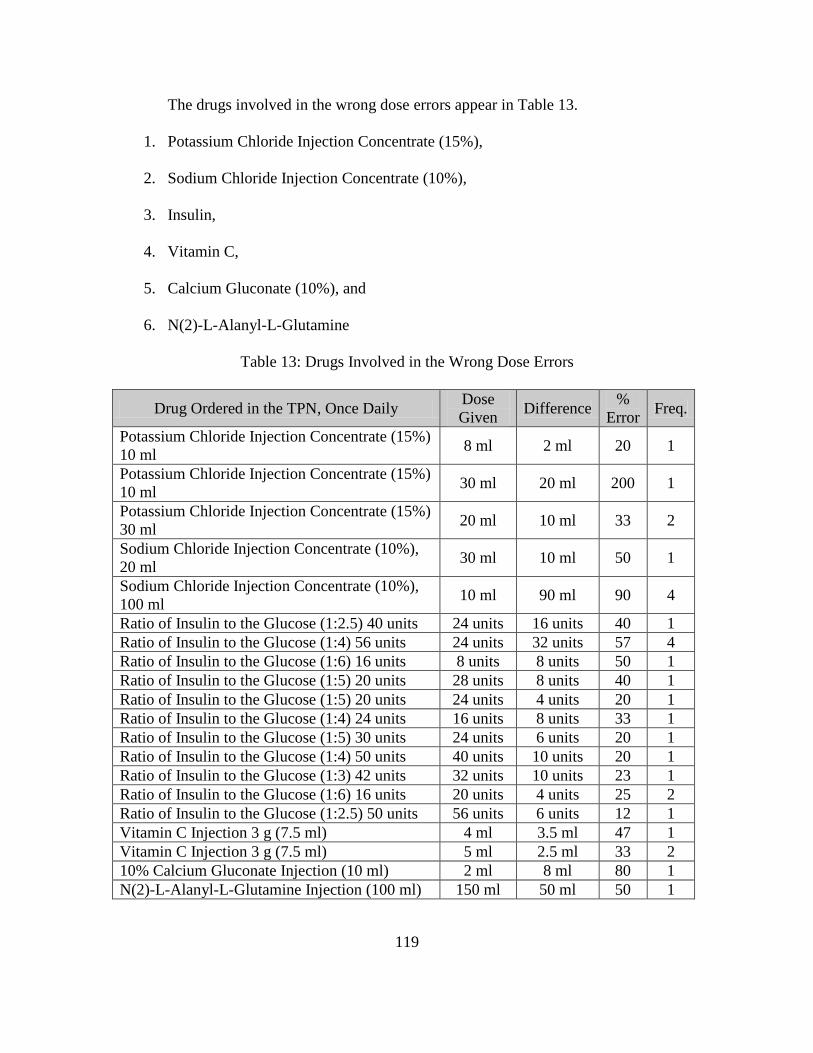
119
The drugs involved in the wrong dose errors appear in Table 13.
1. Potassium Chloride Injection Concentrate (15%),
2. Sodium Chloride Injection Concentrate (10%),
3. Insulin,
4. Vitamin C,
5. Calcium Gluconate (10%), and
6. N(2)-L-Alanyl-L-Glutamine
Table 13: Drugs Involved in the Wrong Dose Errors
Drug Ordered in the TPN, Once Daily Dose
Given Difference
%
Error Freq.
Potassium Chloride Injection Concentrate (15%)
10 ml 8 ml 2 ml 20 1
Potassium Chloride Injection Concentrate (15%)
10 ml 30 ml 20 ml 200 1
Potassium Chloride Injection Concentrate (15%)
30 ml 20 ml 10 ml 33 2
Sodium Chloride Injection Concentrate (10%),
20 ml 30 ml 10 ml 50 1
Sodium Chloride Injection Concentrate (10%),
100 ml 10 ml 90 ml 90 4
Ratio of Insulin to the Glucose (1:2.5) 40 units 24 units 16 units 40 1
Ratio of Insulin to the Glucose (1:4) 56 units 24 units 32 units 57 4
Ratio of Insulin to the Glucose (1:6) 16 units 8 units 8 units 50 1
Ratio of Insulin to the Glucose (1:5) 20 units 28 units 8 units 40 1
Ratio of Insulin to the Glucose (1:5) 20 units 24 units 4 units 20 1
Ratio of Insulin to the Glucose (1:4) 24 units 16 units 8 units 33 1
Ratio of Insulin to the Glucose (1:5) 30 units 24 units 6 units 20 1
Ratio of Insulin to the Glucose (1:4) 50 units 40 units 10 units 20 1
Ratio of Insulin to the Glucose (1:3) 42 units 32 units 10 units 23 1
Ratio of Insulin to the Glucose (1:6) 16 units 20 units 4 units 25 2
Ratio of Insulin to the Glucose (1:2.5) 50 units 56 units 6 units 12 1
Vitamin C Injection 3 g (7.5 ml) 4 ml 3.5 ml 47 1
Vitamin C Injection 3 g (7.5 ml) 5 ml 2.5 ml 33 2
10% Calcium Gluconate Injection (10 ml) 2 ml 8 ml 80 1
N(2)-L-Alanyl-L-Glutamine Injection (100 ml) 150 ml 50 ml 50 1

120
During the observation period, the drugs involved in unordered drug errors are
shown in Table 14.
1. Sodium Chloride Injection Concentrate (10%),
2. Vitamin C, and
3. Compound 12-Vitamins Injection Powder
Table 14: Drugs Involved in Unordered Drug Errors
Unordered Drug was Given in the TPN Frequency
Sodium Chloride Injection Concentrate (10%) 20 ml 1
Vitamin C Injection 2 ml 1
Compound 12-Vitamins Injection (powder) 0.5 g 2
Errors with Potential Clinical Importance
Because this study didn’t include patient monitoring after administration, only the
potential clinical severity of the errors to harm the patients could be assessed. The criteria
for judging potential clinical importance was appearance in the ISMP’s List of High-
Alert Medications for 2008. The consequence of such error is a heightened risk of
causing significant harm to the patient (Institute for Safe Medication Practices, 2008).
Potassium chloride for injection concentrate (15%), Sodium chloride for injection
concentrate (10%), and Insulin errors were the most frequently occurring errors in the
existing drug distribution systems involving both omission errors and wrong dose errors.
Those three drugs were among the specific medications listed in the ISMP’s High-Alert
Medications in 2008 (Institute for Safe Medication Practices, 2008).
Both potassium chloride for injection concentrate and sodium chloride for
injection concentrate are important for the maintenance of the body fluid and electrolyte

121
balance. The errors involving electrolyte drugs can cause electrolyte imbalance,
extravasation or heart arrest.
The physician ordered insulin in a “Ratio of Insulin to the Glucose” format. The
preparation nurses were required to calculate the actual volume of the insulin needed in
the TPN at the time when they prepared the doses. Miscalculation appeared to be the
cause of wrong dose errors of insulin. The dose discrepancy of insulin varied from 12%
to 57%, and commonly occurred at 20% and above. The insulin was prescribed when the
patient was considered in danger of experiencing hyperglycemia or extreme increases in
blood sugar levels. The patient was at the risk for hypoglycemia when over-dosing
insulin, hyperglycemia when under-dosing or omitted of insulin, or complications due to
either hypoglycemia or hyperglycemia.
The Joint Commission on Accreditation of Healthcare Organizations (JCAHO)
considered insulin to be one of the top three “high-risk medications” in the inpatient
setting (Institute for Safe Medication Practices, 2008). Analysis of data reported to USP’s
MEDMARX reporting program over a two-year period (2000-2001) uncovered a total of
4,764 insulin errors with approximately 6.6% (N = 320) of these causing harm to the
patient (Institute for Safe Medication Practices, 2003). Historically, the average harm
threshold for error reports submitted to MEDMARX has been approximately 2.8%,
indicating that when an insulin product is involved, it may be twice as likely to result in
harm (Categories E-I) (Institute for Safe Medication Practices, 2003). Hellman found that
33% of the medical errors that caused death within 48 hours of the error involved insulin
therapy and administration in the care of a hospitalized patient (Hellman, 2004).
Table 15 lists all the errors considered to have potential clinical significance.

122
Table 15: Errors with Potential Clinical Significance
Drug and Dose Ordered in the TPN, Once Daily Prepared Dose
Insulin
Ratio of Insulin to the Glucose (1:2.5) 40 units 24 units
Ratio of Insulin to the Glucose (1:4) 56 units 24 units
Ratio of Insulin to the Glucose (1:6) 16 units 8 units
Ratio of Insulin to the Glucose (1:5) 20 units 28 units
Ratio of Insulin to the Glucose (1:5) 20 units 24 units
Ratio of Insulin to the Glucose (1:4) 24 units 16 units
Ratio of Insulin to the Glucose (1:5) 30 units 24 units
Ratio of Insulin to the Glucose (1:4) 50 units 40 units
Ratio of Insulin to the Glucose (1:3) 42 units 32 units
Ratio of Insulin to the Glucose (1:6) 16 units 20 units
Ratio of Insulin to the Glucose (1:2.5) 50 units 56 units
Ratio of Insulin to the Glucose (1:5) Omitted
Ratio of Insulin to the Glucose (1:4) Omitted
Electrolytes: Potassium Chloride Injection Concentrate (15%)
Potassium Chloride Injection Concentrate (15%) 10 ml 30 ml
Potassium Chloride Injection Concentrate (15%) 30 ml 20 ml
Potassium Chloride Injection Concentrate (15%) 20 ml Omitted
Potassium Chloride Injection Concentrate (15%) 10 ml Omitted
Electrolytes: Sodium Chloride Injection Concentrate (10%)
Sodium Chloride Injection Concentrate (10%) 20 ml 30 ml
Sodium Chloride Injection Concentrate (10%) 100 ml 10 ml
Sodium Chloride Injection Concentrate (10%) 50 ml Omitted
Sodium Chloride Injection Concentrate (10%) 20 ml Omitted
Unordered Sodium
Chloride Injection
Concentrate (10%) 20ml
Other
N(2)-L-Alanyl-L-Glutamine Injection (100 ml) 150 ml
Vitamin K1 Injection 2 ml (20 mg) Omitted
10% Calcium Gluconate Injection (10 ml) 2 ml
Vitamin C Injection 3 g (7.5 ml) 4 ml
Vitamin C Injection 3 g (7.5 ml) 5 ml
Vitamin C Injection 7.5 ml (3 g) Omitted
Sodium Glycerophosphate Injection (Glycophos®) 10 ml Omitted
Fat-Soluble Vitamin Injection (II) (Vitalipid®N Adult) 10 ml Omitted
Coenzyme Complex for Injection 200 IU Omitted
Trace Elements for Injection (Addammel®
N) 10 ml Omitted
Water-Soluble Vitamin for Injection (Soluvit®N) 0.5 g Omitted
123
Statistical Analysis
Statistical analyses were performed with the use of SAS software, version 9.2 (SAS
Institute). SAS codes are shown in Appendix F. The main effect of the Unit Dose Dispensing
System, an independent variable randomly installed in the Experimental group, was evaluated by
using the pre-test scores as a covariate in the Analysis of Covariance (ANCOVA). The alpha
level was set at 0.05. The advantages of ANCOVA are the ability to reduce the error variance in
the outcome measure and the ability to measure group differences after allowing for other
differences between subjects (Munro, 2005). The result shows that the mean error rate differed
between the Control group and the Experimental group before the installation of the Unit Dose
Dispensing System. Therefore, the error variance is reduced by controlling for variation of pre-
test in ANCOVA.
T-Test or ANOVA of the gain scores between the Control and Experimental groups or
repeated measures ANOVA with one between-subjects factor (group) and one within-subjects
factor (pre-post test) could not be used in this study because the error rate in the pre-test and
post-test were based on the observational day instead of the same nurse or the same patient.
The assumptions for ANCOVA were summarized by Munro (2005):
1. The groups should be mutually exclusive.
2. The variances of the groups should be equivalent (homogeneity of variance).
3. The Dependent Variable should be normally distributed.
4. The covariate should be a continuous variable.
5. Required Assumption of the homogeneity of regression slopes across groups.
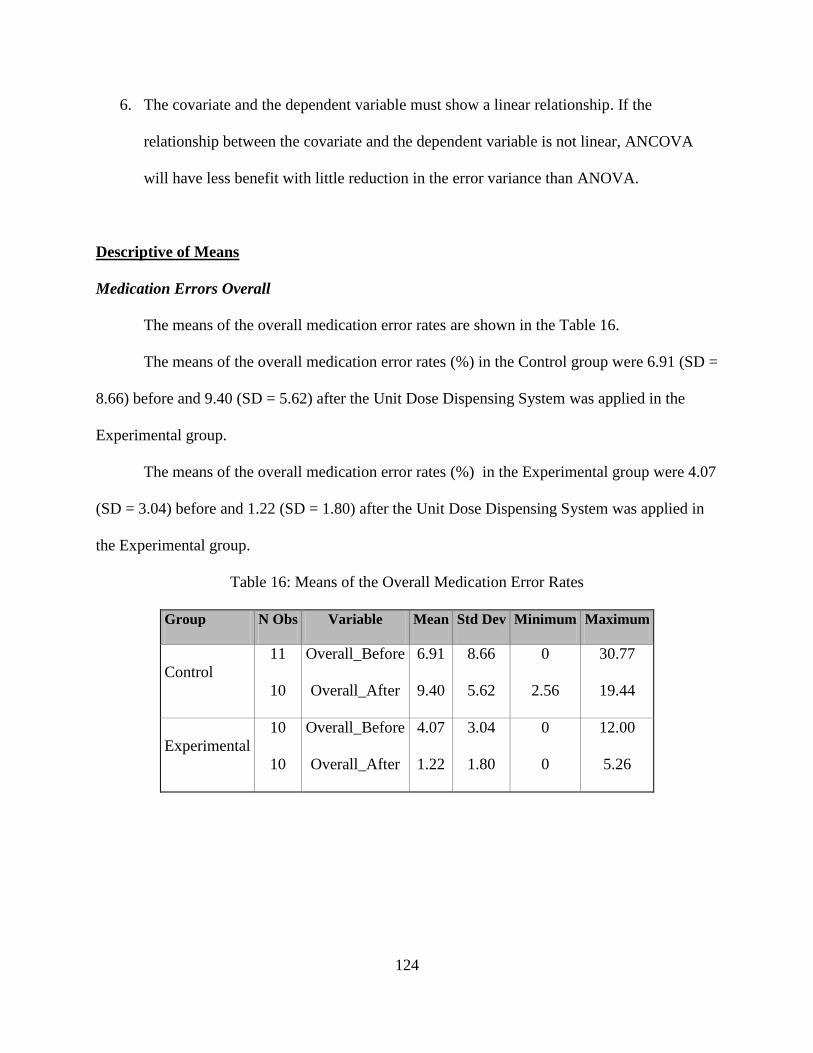
124
6. The covariate and the dependent variable must show a linear relationship. If the
relationship between the covariate and the dependent variable is not linear, ANCOVA
will have less benefit with little reduction in the error variance than ANOVA.
Descriptive of Means
Medication Errors Overall
The means of the overall medication error rates are shown in the Table 16.
The means of the overall medication error rates (%) in the Control group were 6.91 (SD =
8.66) before and 9.40 (SD = 5.62) after the Unit Dose Dispensing System was applied in the
Experimental group.
The means of the overall medication error rates (%) in the Experimental group were 4.07
(SD = 3.04) before and 1.22 (SD = 1.80) after the Unit Dose Dispensing System was applied in
the Experimental group.
Table 16: Means of the Overall Medication Error Rates
Group N Obs Variable Mean Std Dev Minimum Maximum
Control
11
10
Overall_Before
Overall_After
6.91
9.40
8.66
5.62
0
2.56
30.77
19.44
Experimental
10
10
Overall_Before
Overall_After
4.07
1.22
3.04
1.80
0
0
12.00
5.26
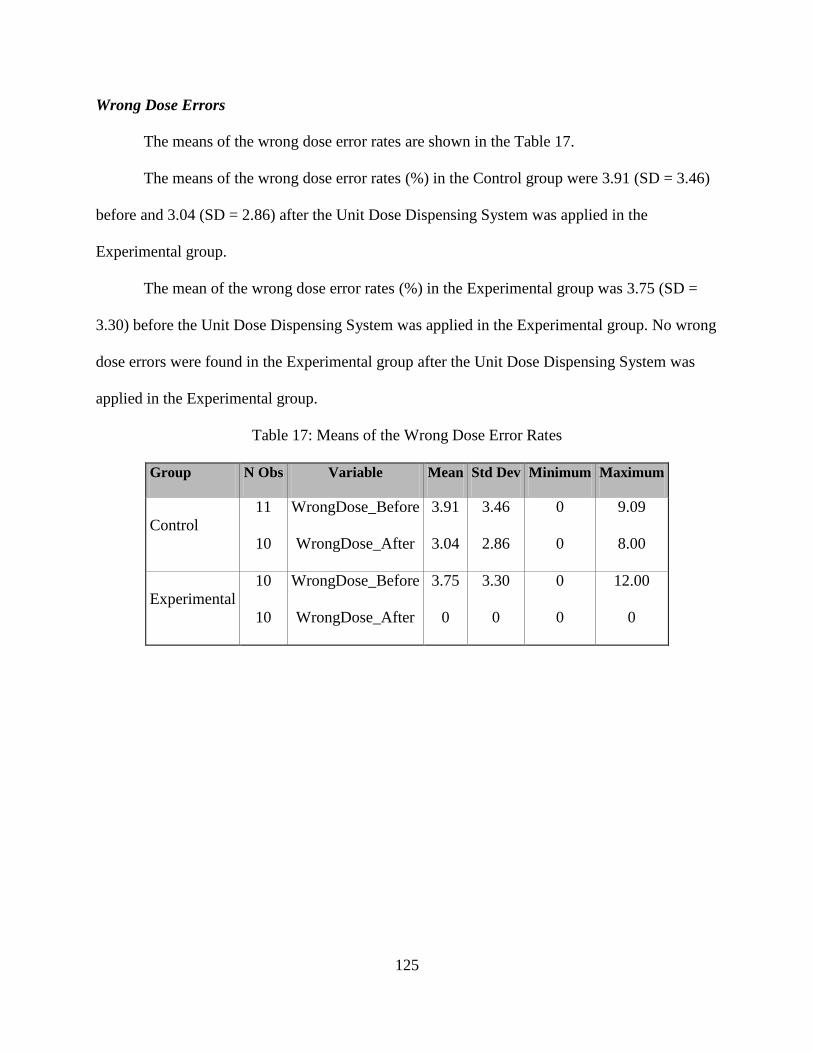
125
Wrong Dose Errors
The means of the wrong dose error rates are shown in the Table 17.
The means of the wrong dose error rates (%) in the Control group were 3.91 (SD = 3.46)
before and 3.04 (SD = 2.86) after the Unit Dose Dispensing System was applied in the
Experimental group.
The mean of the wrong dose error rates (%) in the Experimental group was 3.75 (SD =
3.30) before the Unit Dose Dispensing System was applied in the Experimental group. No wrong
dose errors were found in the Experimental group after the Unit Dose Dispensing System was
applied in the Experimental group.
Table 17: Means of the Wrong Dose Error Rates
Group N Obs Variable Mean Std Dev Minimum Maximum
Control
11
10
WrongDose_Before
WrongDose_After
3.91
3.04
3.46
2.86
0
0
9.09
8.00
Experimental
10
10
WrongDose_Before
WrongDose_After
3.75
0
3.30
0
0
0
12.00
0
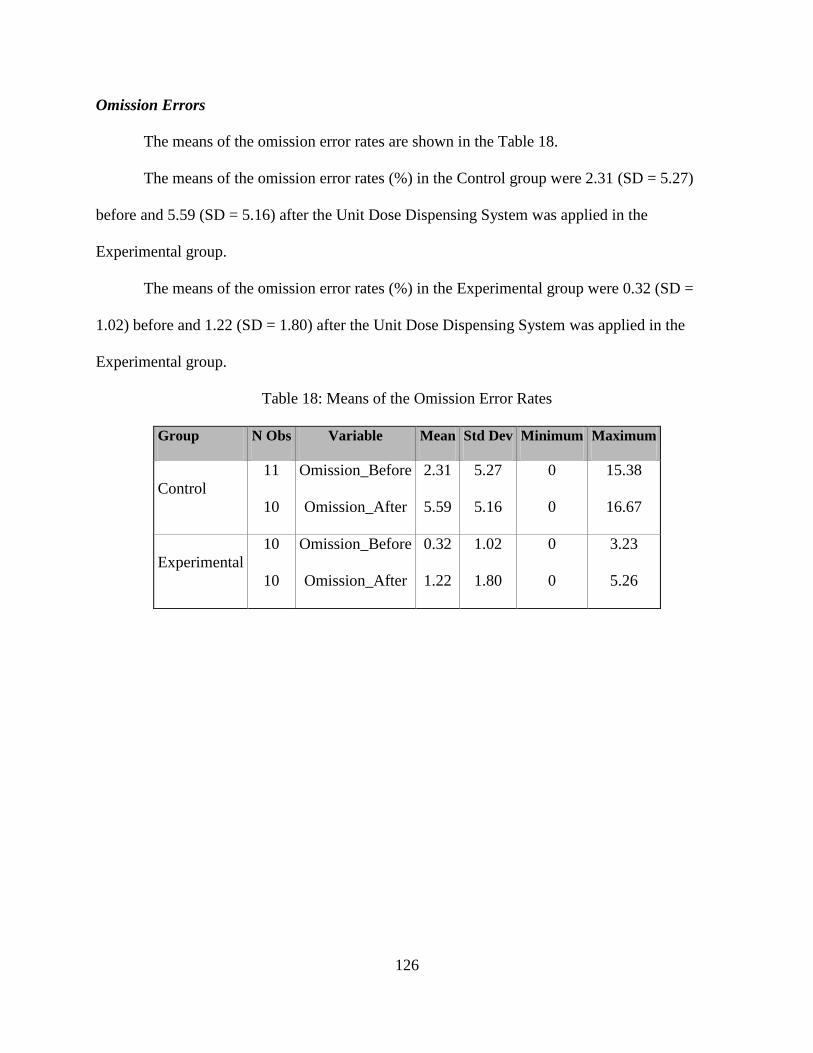
126
Omission Errors
The means of the omission error rates are shown in the Table 18.
The means of the omission error rates (%) in the Control group were 2.31 (SD = 5.27)
before and 5.59 (SD = 5.16) after the Unit Dose Dispensing System was applied in the
Experimental group.
The means of the omission error rates (%) in the Experimental group were 0.32 (SD =
1.02) before and 1.22 (SD = 1.80) after the Unit Dose Dispensing System was applied in the
Experimental group.
Table 18: Means of the Omission Error Rates
Group N Obs Variable Mean Std Dev Minimum Maximum
Control
11
10
Omission_Before
Omission_After
2.31
5.59
5.27
5.16
0
0
15.38
16.67
Experimental
10
10
Omission_Before
Omission_After
0.32
1.22
1.02
1.80
0
0
3.23
5.26
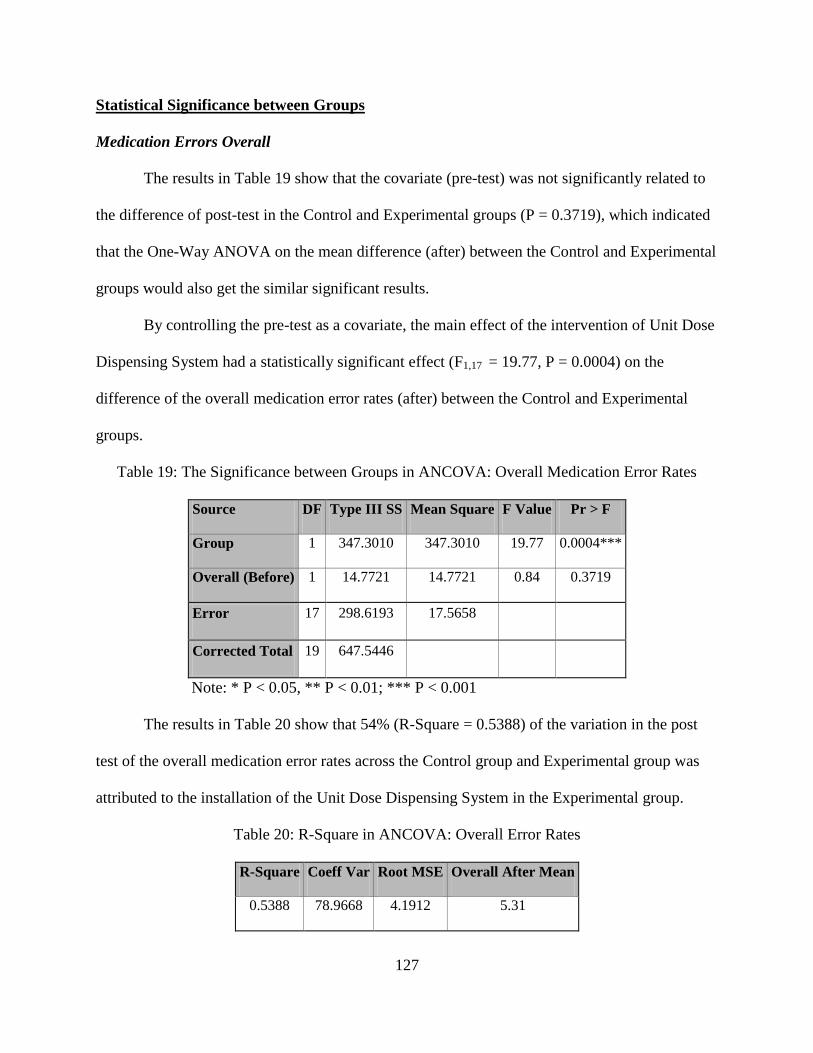
127
Statistical Significance between Groups
Medication Errors Overall
The results in Table 19 show that the covariate (pre-test) was not significantly related to
the difference of post-test in the Control and Experimental groups (P = 0.3719), which indicated
that the One-Way ANOVA on the mean difference (after) between the Control and Experimental
groups would also get the similar significant results.
By controlling the pre-test as a covariate, the main effect of the intervention of Unit Dose
Dispensing System had a statistically significant effect (F1,17 = 19.77, P = 0.0004) on the
difference of the overall medication error rates (after) between the Control and Experimental
groups.
Table 19: The Significance between Groups in ANCOVA: Overall Medication Error Rates
Source DF Type III SS Mean Square F Value Pr > F
Group 1 347.3010 347.3010 19.77 0.0004***
Overall (Before) 1 14.7721 14.7721 0.84 0.3719
Error 17 298.6193 17.5658
Corrected Total 19 647.5446
Note: * P < 0.05, ** P < 0.01; *** P < 0.001
The results in Table 20 show that 54% (R-Square = 0.5388) of the variation in the post
test of the overall medication error rates across the Control group and Experimental group was
attributed to the installation of the Unit Dose Dispensing System in the Experimental group.
Table 20: R-Square in ANCOVA: Overall Error Rates
R-Square Coeff Var Root MSE Overall After Mean
0.5388 78.9668 4.1912 5.31
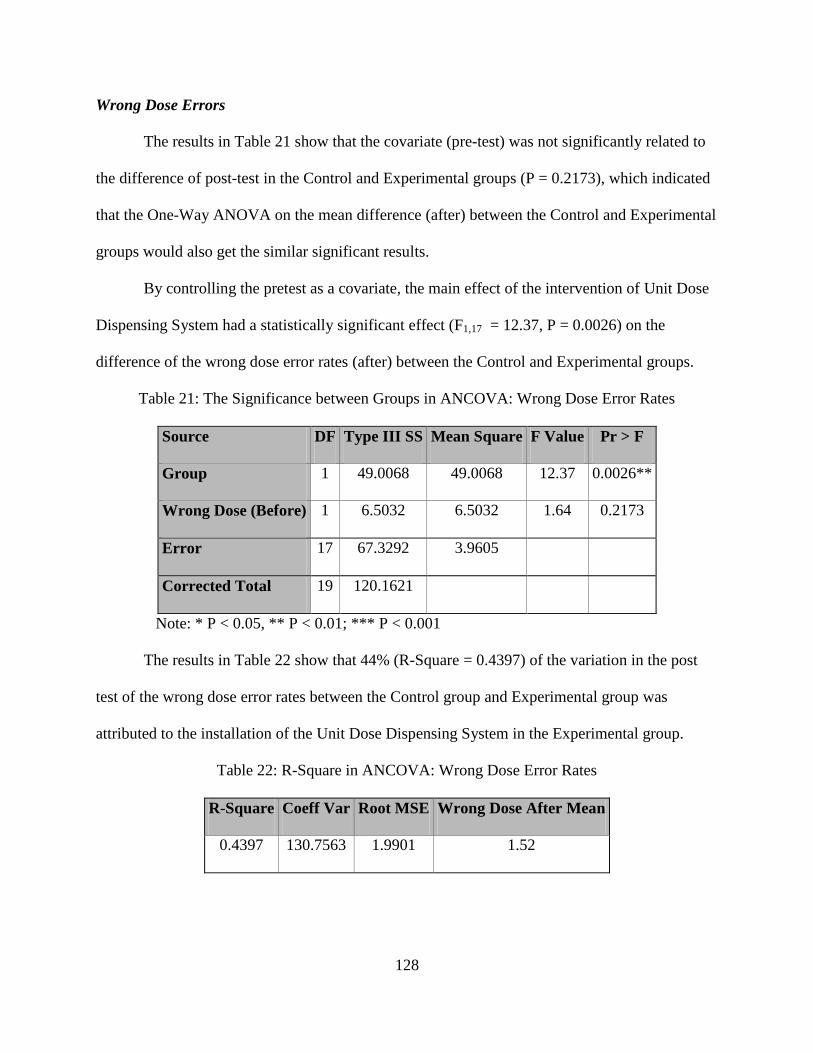
128
Wrong Dose Errors
The results in Table 21 show that the covariate (pre-test) was not significantly related to
the difference of post-test in the Control and Experimental groups (P = 0.2173), which indicated
that the One-Way ANOVA on the mean difference (after) between the Control and Experimental
groups would also get the similar significant results.
By controlling the pretest as a covariate, the main effect of the intervention of Unit Dose
Dispensing System had a statistically significant effect (F1,17 = 12.37, P = 0.0026) on the
difference of the wrong dose error rates (after) between the Control and Experimental groups.
Table 21: The Significance between Groups in ANCOVA: Wrong Dose Error Rates
Source DF Type III SS Mean Square F Value Pr > F
Group 1 49.0068 49.0068 12.37 0.0026**
Wrong Dose (Before) 1 6.5032 6.5032 1.64 0.2173
Error 17 67.3292 3.9605
Corrected Total 19 120.1621
Note: * P < 0.05, ** P < 0.01; *** P < 0.001
The results in Table 22 show that 44% (R-Square = 0.4397) of the variation in the post
test of the wrong dose error rates between the Control group and Experimental group was
attributed to the installation of the Unit Dose Dispensing System in the Experimental group.
Table 22: R-Square in ANCOVA: Wrong Dose Error Rates
R-Square Coeff Var Root MSE Wrong Dose After Mean
0.4397 130.7563 1.9901 1.52

129
Omission Errors
The results in Table 23 show that the covariate (pre-test) was not significantly related to
the difference of post-test in the Control and Experimental groups (P = 0.9765), which indicated
that the One-Way ANOVA on the mean difference (after) between the Control and Experimental
groups would also get the similar significant results.
By controlling the pretest as a covariate, the main effect of the intervention of Unit Dose
Dispensing System had a statistically significant effect (F1,17 = 5.52, P = 0.03) on the difference
of the omission error rates (after) between the Control and Experimental groups.
Table 23: The Significance between Groups in ANCOVA: Omission Error Rates
Source DF Type III SS Mean Square F Value Pr > F
Group 1 87.2024 87.20242 5.52 0.0311*
Omission (Before) 1 0.0141 0.0141 0.00 0.9765
Error 17 268.3405 15.7847
Corrected Total 19 363.8391
Note: * P < 0.05, ** P < 0.01; *** P < 0.001
The results in Table 24 show that 26% (R-Square = 0.2625) of the variation in the post
test of the omission error rates between the Control group and Experimental group was attributed
to the installation of the Unit Dose Dispensing System in the Experimental group.
Table 24: R-Square in ANCOVA: Omission Error Rates
R-Square Coeff Var Root MSE Omission After Mean
0.2625 116.6814 3.9730 3.405

130
Mean Difference and 95% Confidence Interval
Medication Errors Overall
By controlling the pretest as a covariate, the adjusted post test mean difference of the
overall medication error rates between the Control group and the Experimental group was 8.66%
with a 95% Confidence Interval of 4.55 to 12.77% (Table 25).
Table 25: Adjusted Mean Difference of the Post Test: Overall Medication Error Rates
Least Squares Means for Effect Group
i j Difference Between Means 95% Confidence Limits for LSMean(i)-LSMean(j)
1 2 8.66 4.55 12.77
Wrong Dose Errors
By controlling the pretest as a covariate, the adjusted post test mean difference of the
wrong dose error rates between the Control group and the Experimental group was 3.14% with a
95% Confidence Interval of 1.26 to 5.03% (Table 26).
Table 26: Adjusted Mean Difference of the Post Test: Wrong Dose Error Rates
Least Squares Means for Effect Group
i j Difference Between Means 95% Confidence Limits for LSMean(i)-LSMean(j)
1 2 3.14 1.26 5.03

131
Omission Errors
By controlling the pretest as a covariate, the adjusted post test mean difference of the
omission error rates between the Control group and the Experimental group was 4.35% with a 95%
Confidence Interval of 0.45 to 8.26% (Table 27).
Table 27: Adjusted Mean Difference of the Post Test: Omission Error Rates
Least Squares Means for Effect Group
i j Difference Between Means 95% Confidence Limits for LSMean(i)-LSMean(j)
1 2 4.35 0.45 8.26
132
Required Assumptions Evaluation for ANCOVA
The assumptions for ANCOVA were tested for the normality, Levene’s test for equal
variances between the groups, and the homogeneity regression slopes across the groups as
follows:
1. The normality of the residuals was evaluated by Shapiro-Wilk Test and Graphical method
of Probability Plot in the Univariate Analysis.
2. The Levene’s test of the adjusted post test means was evaluated by one-way ANOVA.
3. The Required Assumption of the homogeneity regression slopes across the groups: the
slopes relating post-test scores to pre-test scores, which are assumed to be parallel for
both the Control group and the Experimental group, were tested by the adding the
interaction of Group*Pre-Test in the model of ANCOVA.
Some caution must be excised in interpreting the results if the assumptions of normality
and the Levene’s test for equal variance were violated. However, ANCOVA procedures are
robust to mild to moderate violations of these assumptions.
The required assumption of the homogeneity regression slopes must be checked before
using ANCOVA, because if that assumption is violated, ANCOVA can lead to improper
interpretation of the results.
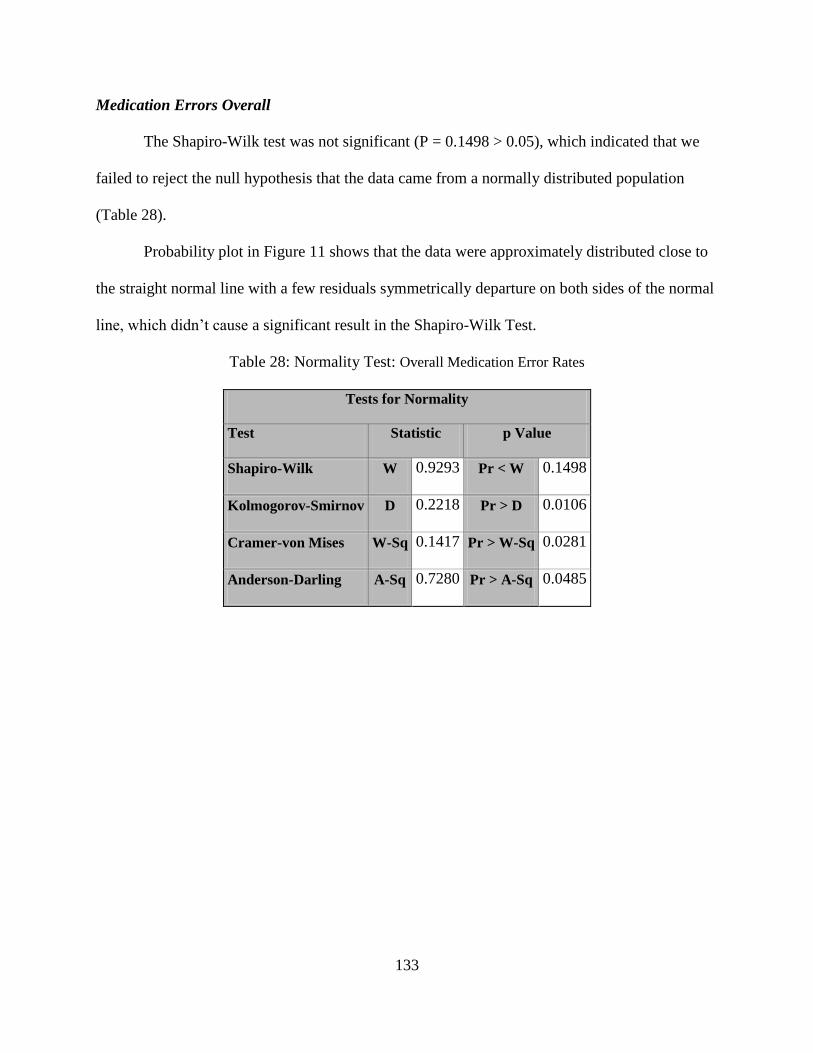
133
Medication Errors Overall
The Shapiro-Wilk test was not significant (P = 0.1498 > 0.05), which indicated that we
failed to reject the null hypothesis that the data came from a normally distributed population
(Table 28).
Probability plot in Figure 11 shows that the data were approximately distributed close to
the straight normal line with a few residuals symmetrically departure on both sides of the normal
line, which didn’t cause a significant result in the Shapiro-Wilk Test.
Table 28: Normality Test: Overall Medication Error Rates
Tests for Normality
Test Statistic p Value
Shapiro-Wilk W 0.9293 Pr < W 0.1498
Kolmogorov-Smirnov D 0.2218 Pr > D 0.0106
Cramer-von Mises W-Sq 0.1417 Pr > W-Sq 0.0281
Anderson-Darling A-Sq 0.7280 Pr > A-Sq 0.0485
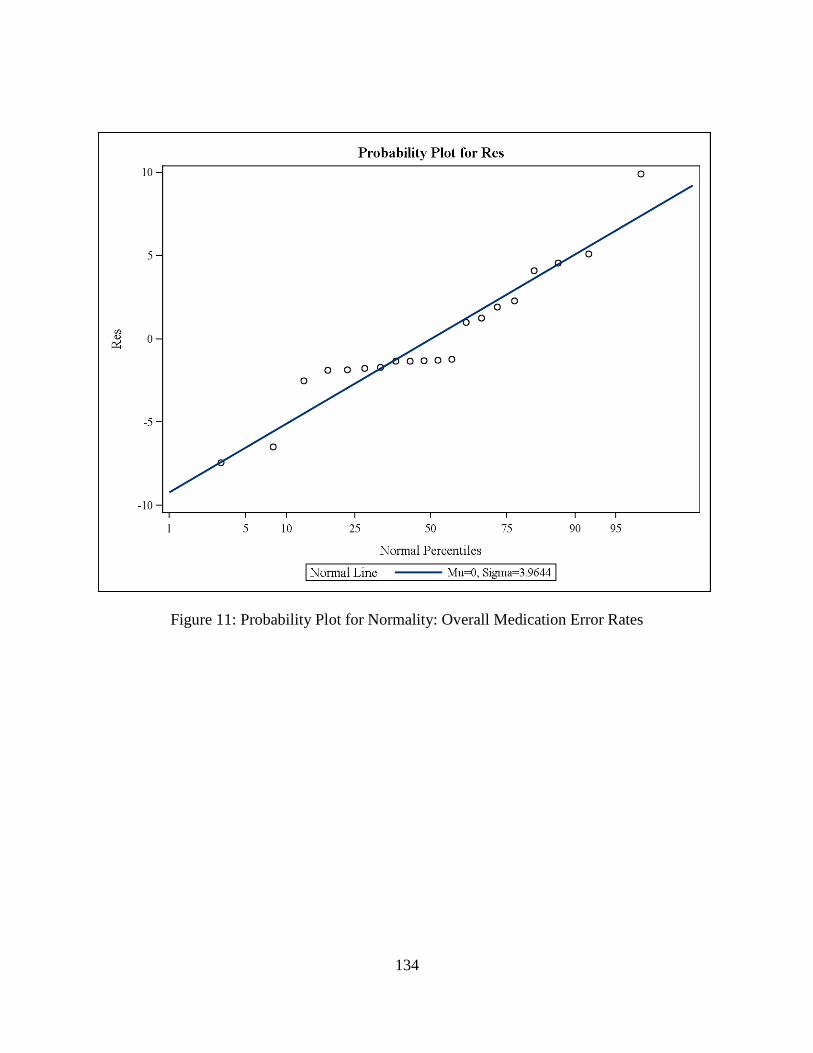
134
Figure 11: Probability Plot for Normality: Overall Medication Error Rates
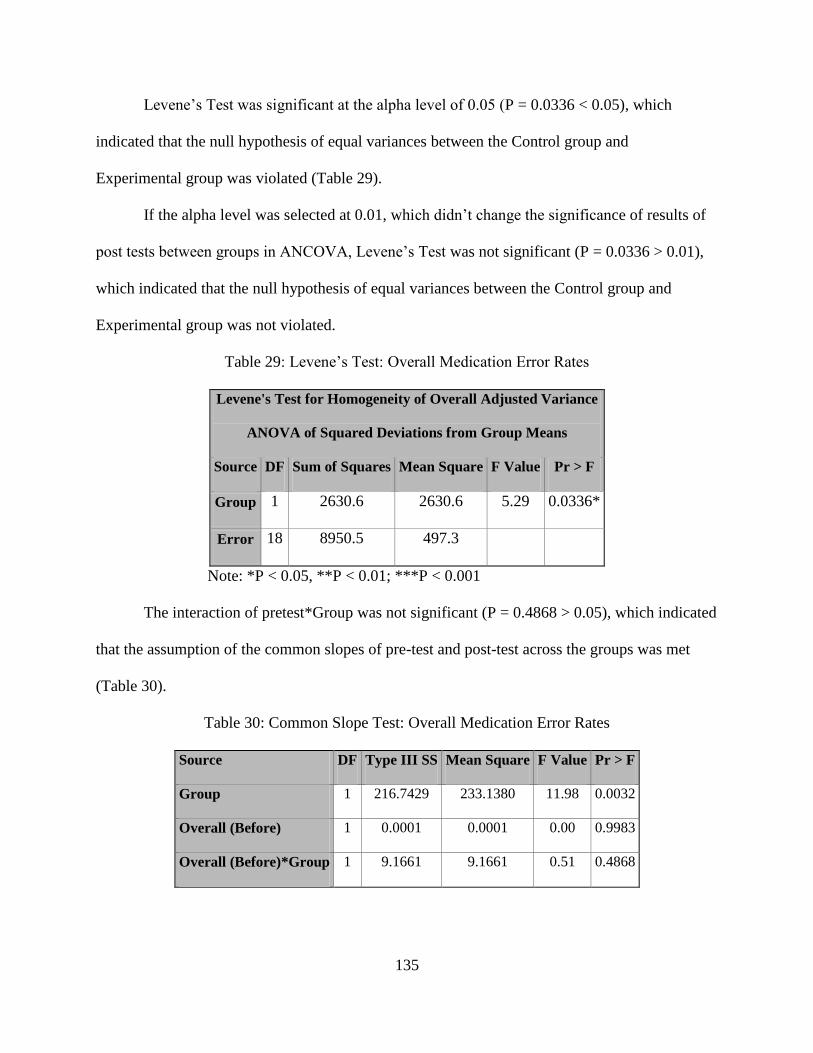
135
Levene’s Test was significant at the alpha level of 0.05 (P = 0.0336 < 0.05), which
indicated that the null hypothesis of equal variances between the Control group and
Experimental group was violated (Table 29).
If the alpha level was selected at 0.01, which didn’t change the significance of results of
post tests between groups in ANCOVA, Levene’s Test was not significant (P = 0.0336 > 0.01),
which indicated that the null hypothesis of equal variances between the Control group and
Experimental group was not violated.
Table 29: Levene’s Test: Overall Medication Error Rates
Levene's Test for Homogeneity of Overall Adjusted Variance
ANOVA of Squared Deviations from Group Means
Source DF Sum of Squares Mean Square F Value Pr > F
Group 1 2630.6 2630.6 5.29 0.0336*
Error 18 8950.5 497.3
Note: *P < 0.05, **P < 0.01; ***P < 0.001
The interaction of pretest*Group was not significant (P = 0.4868 > 0.05), which indicated
that the assumption of the common slopes of pre-test and post-test across the groups was met
(Table 30).
Table 30: Common Slope Test: Overall Medication Error Rates
Source DF Type III SS Mean Square F Value Pr > F
Group 1 216.7429 233.1380 11.98 0.0032
Overall (Before) 1 0.0001 0.0001 0.00 0.9983
Overall (Before)*Group 1 9.1661 9.1661 0.51 0.4868

136
Wrong Dose Errors
Shapiro-Wilk Test was significant at the alpha level of 0.05 (P = 0.0434 < 0.05), which
indicated that the null hypothesis that the data came from a normally distributed population was
rejected (Table 31).
The Probability Plot in Figure 12 shows that 70% of the residuals were closely distributed
to the straight normal line, while at the upper right section 10% of the residuals departure to the
right of the line and another 20% of the residuals departure to the left of the line, which caused
the significant result in the Shapiro-Wilk Test.
Table 31: Normality Test: Wrong Dose Error Rates
Tests for Normality
Test Statistic p Value
Shapiro-Wilk W 0.9012 Pr < W 0.0434*
Kolmogorov-Smirnov D 0.2155 Pr > D 0.0160
Cramer-von Mises W-Sq 0.1661 Pr > W-Sq 0.0139
Anderson-Darling A-Sq 0.8844 Pr > A-Sq 0.0204
Note: * P < 0.05, ** P < 0.01; *** P < 0.001
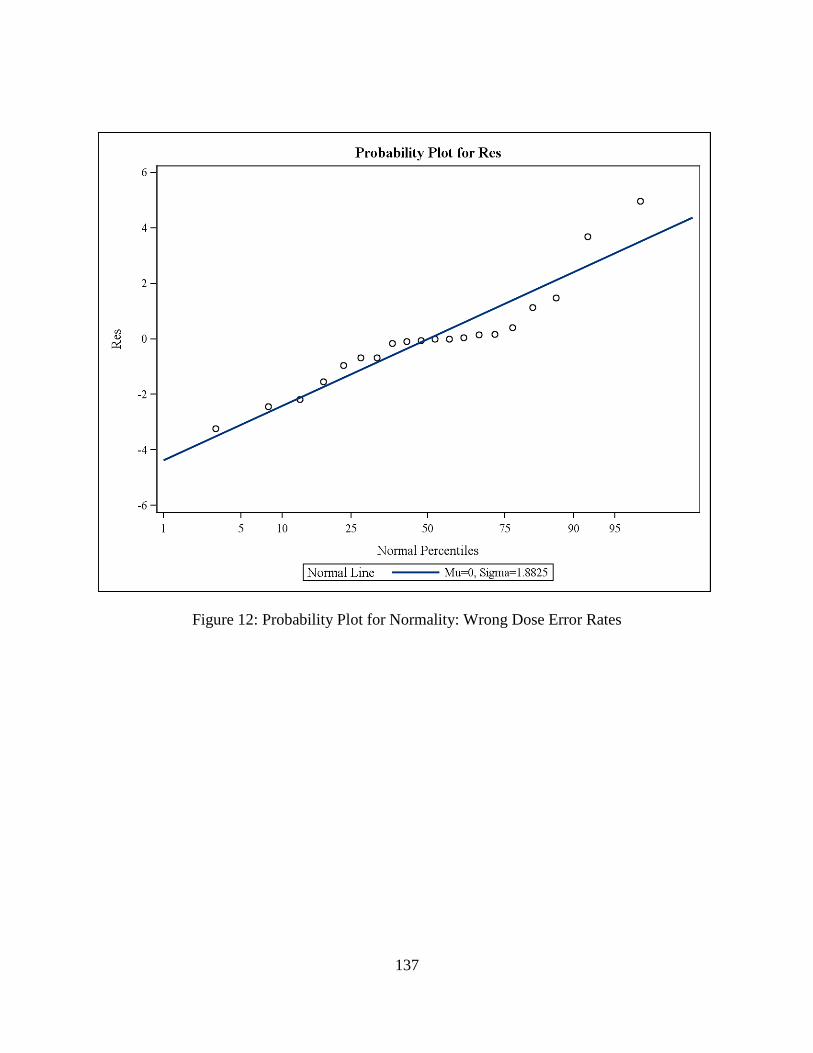
137
Figure 12: Probability Plot for Normality: Wrong Dose Error Rates

138
Levene’s Test was significant at the alpha level of 0.05 (P = 0.025 < 0.05), which
indicated that the null hypothesis of equal variances between the Control group and
Experimental group was violated (Table 32).
If the alpha level was selected at 0.01, which didn’t change the significant result of post
tests between groups in ANCOVA, Levene’s Test was not significant (P = 0.025 > 0.01), which
indicated that the null hypothesis of equal variances between the Control group and
Experimental group was not violated.
Table 32: Levene’s Test: Wrong Dose Error Rates
Levene's Test for Homogeneity of WrongDose Adjusted Variance
ANOVA of Squared Deviations from Group Means
Source DF Sum of Squares Mean Square F Value Pr > F
Group 1 186.0 186.0 5.98 0.025*
Error 18 560.3 31.1303
Note: * P < 0.05, ** P < 0.01; *** P < 0.001
The interaction of pretest*Group was not significant (P = 0.2218 > 0.05), which indicated
that the assumption of the common slopes of pre-test and post-test across the groups was met
(Table 33).
Table 33: Common Slope Test: Wrong Dose Error Rates
Source DF Type III SS Mean Square F Value Pr > F
Group 1 39.6449 39.6449 12.12 0.0053
Wrong Dose (Before) 1 6.1780 6.1780 1.62 0.2218
Wrong Dose (Before)*Group 1 6.1780 6.1780 1.62 0.2218
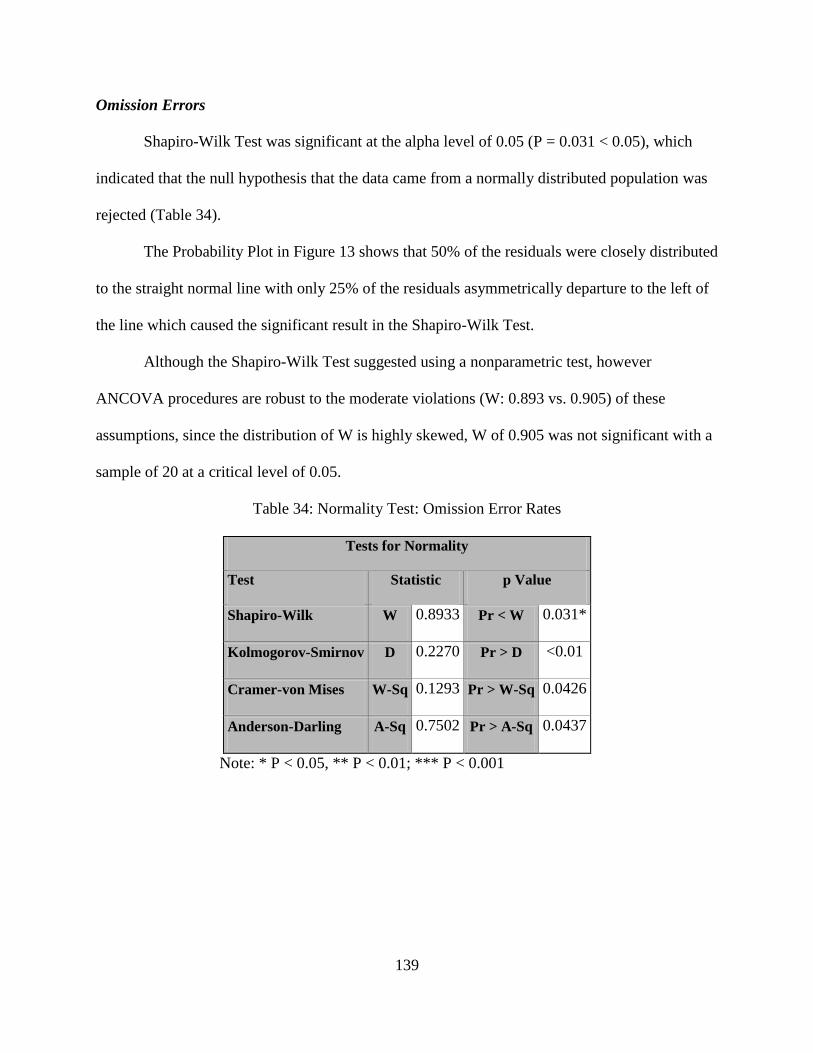
139
Omission Errors
Shapiro-Wilk Test was significant at the alpha level of 0.05 (P = 0.031 < 0.05), which
indicated that the null hypothesis that the data came from a normally distributed population was
rejected (Table 34).
The Probability Plot in Figure 13 shows that 50% of the residuals were closely distributed
to the straight normal line with only 25% of the residuals asymmetrically departure to the left of
the line which caused the significant result in the Shapiro-Wilk Test.
Although the Shapiro-Wilk Test suggested using a nonparametric test, however
ANCOVA procedures are robust to the moderate violations (W: 0.893 vs. 0.905) of these
assumptions, since the distribution of W is highly skewed, W of 0.905 was not significant with a
sample of 20 at a critical level of 0.05.
Table 34: Normality Test: Omission Error Rates
Tests for Normality
Test Statistic p Value
Shapiro-Wilk W 0.8933 Pr < W 0.031*
Kolmogorov-Smirnov D 0.2270 Pr > D <0.01
Cramer-von Mises W-Sq 0.1293 Pr > W-Sq 0.0426
Anderson-Darling A-Sq 0.7502 Pr > A-Sq 0.0437
Note: * P < 0.05, ** P < 0.01; *** P < 0.001
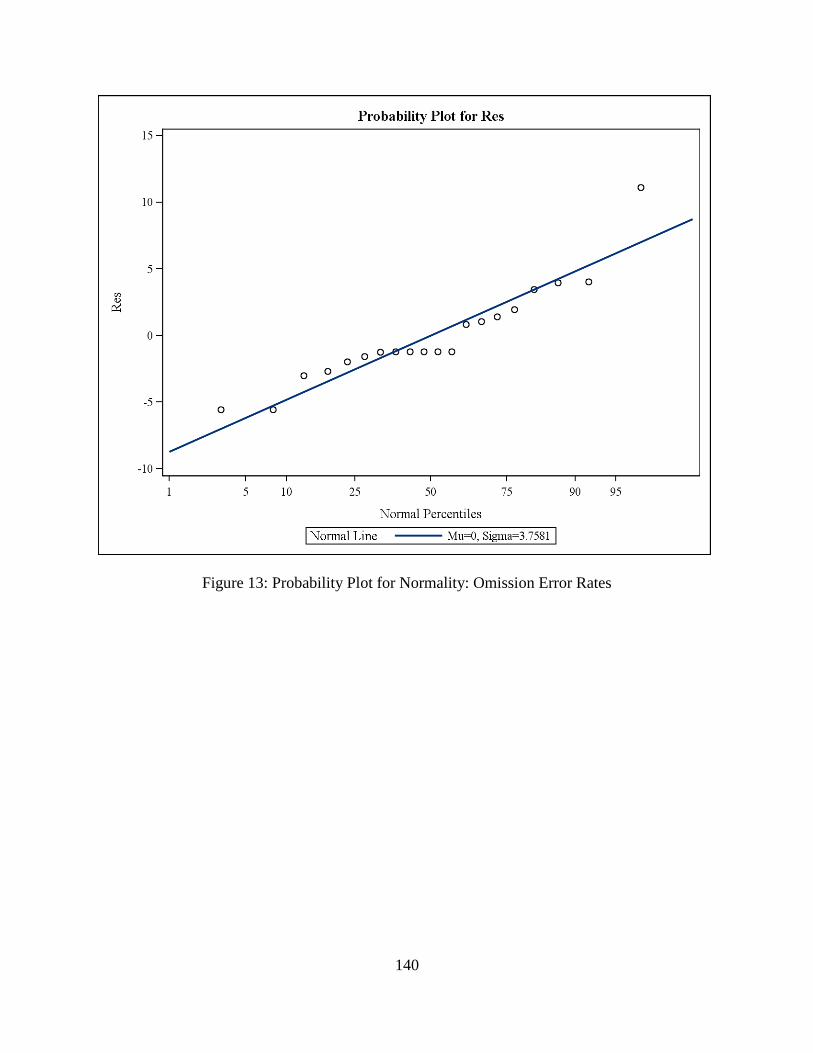
140
Figure 13: Probability Plot for Normality: Omission Error Rates

141
Levene’s Test was not significant at the alpha level of 0.05 (P = 0.0869 > 0.05), which
indicated that the null hypothesis of equal variances between the Control group and
Experimental group was not violated (Table 35).
Table 35: Levene’s Test: Omission Error Rates
Levene's Test for Homogeneity of Omission_Adjusted Variance
ANOVA of Squared Deviations from Group Means
Source DF Sum of Squares Mean Square F Value Pr > F
Group 1 2209.2 2209.2 3.28 0.0869
Error 18 12129.8 673.9
The interaction of pretest*Group was not significant (P = 0.7488 > 0.05), which indicated
that the assumption of the common slopes of pre-test and post-test across the groups was met
(Table 36).
Table 36: Common Slope Test: Omission Error Rates
Source DF Type III SS Mean Square F Value Pr > F
Group 1 74.3885 74.3885 4.46 0.0507
Omission (Before) 1 1.4369 1.4369 0.09 0.7728
Omission (Before)*Group 1 1.7690 1.7690 0.11 0.7488
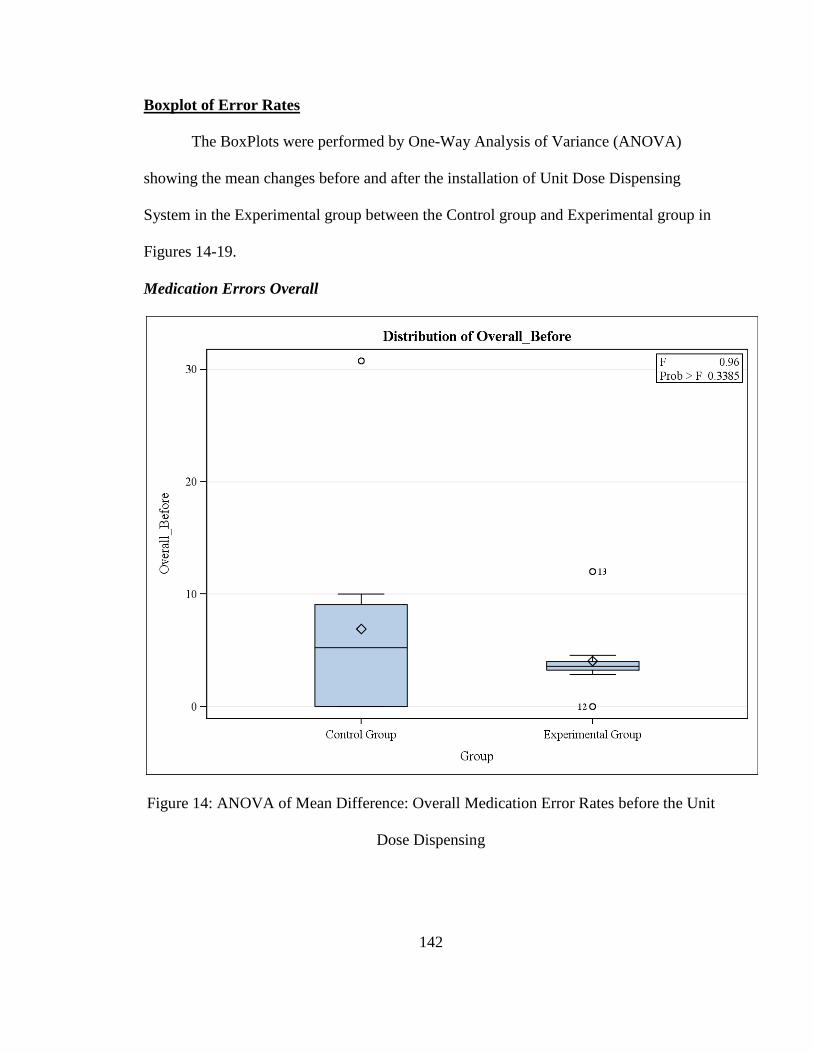
142
Boxplot of Error Rates
The BoxPlots were performed by One-Way Analysis of Variance (ANOVA)
showing the mean changes before and after the installation of Unit Dose Dispensing
System in the Experimental group between the Control group and Experimental group in
Figures 14-19.
Medication Errors Overall
Figure 14: ANOVA of Mean Difference: Overall Medication Error Rates before the Unit
Dose Dispensing
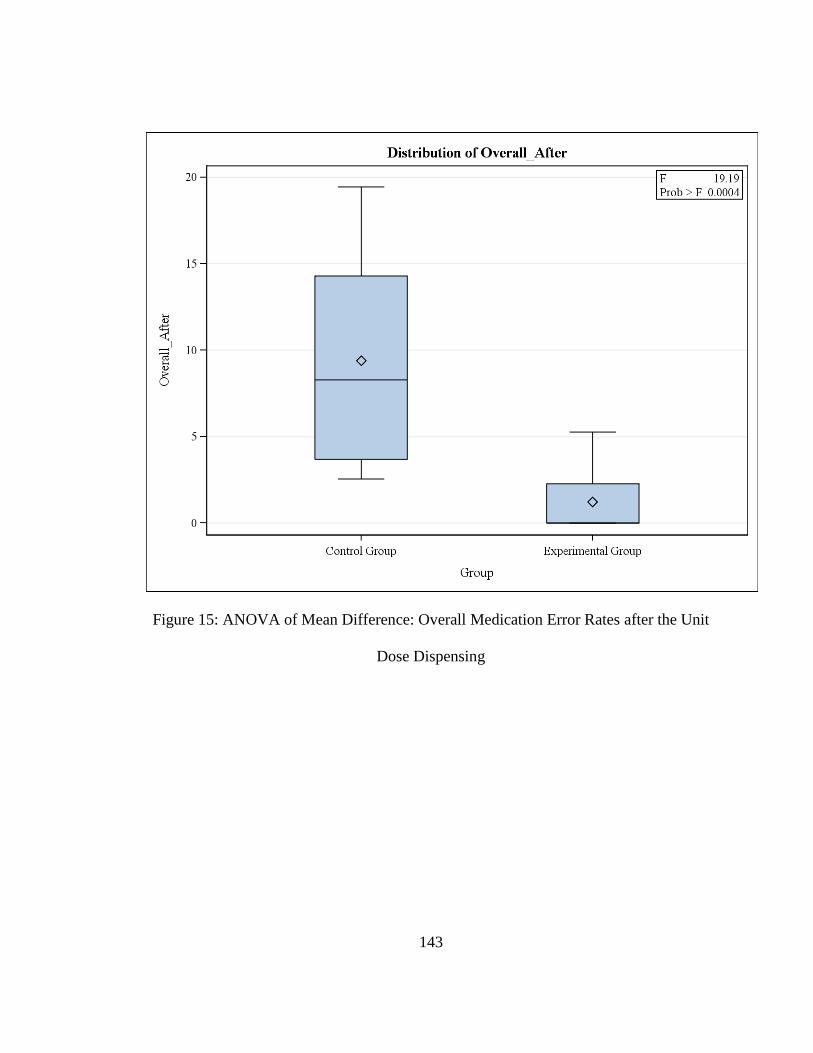
143
Figure 15: ANOVA of Mean Difference: Overall Medication Error Rates after the Unit
Dose Dispensing
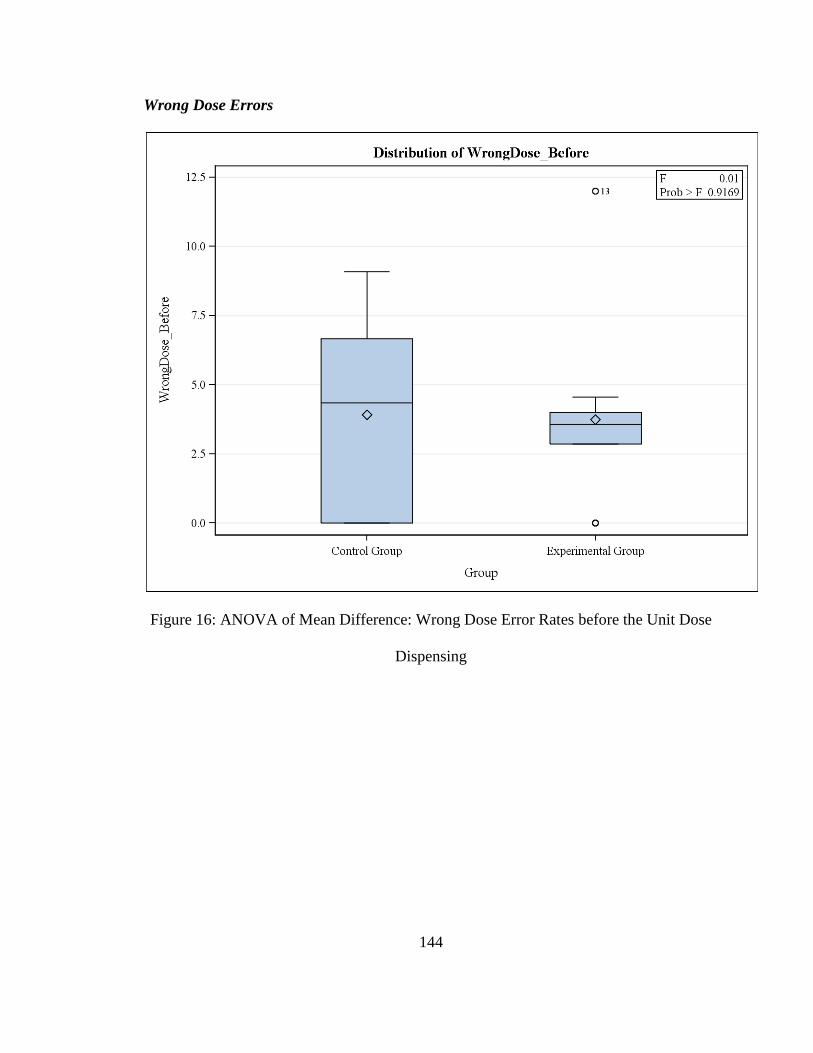
144
Wrong Dose Errors
Figure 16: ANOVA of Mean Difference: Wrong Dose Error Rates before the Unit Dose
Dispensing
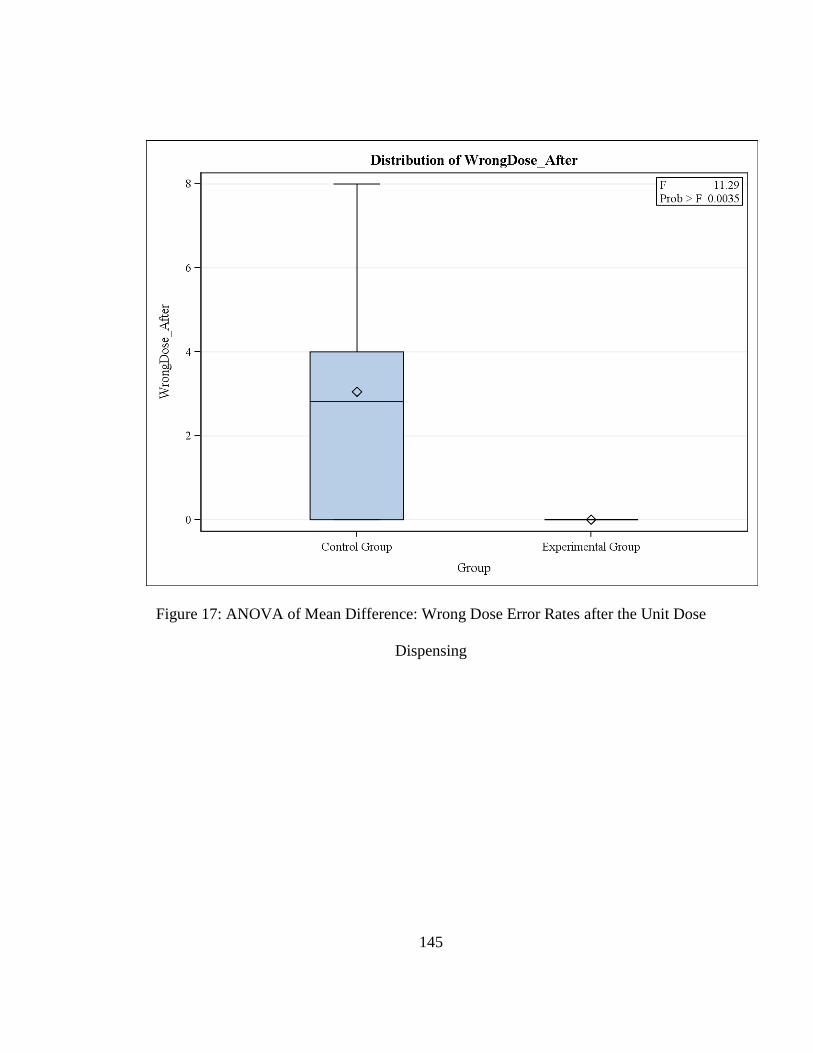
145
Figure 17: ANOVA of Mean Difference: Wrong Dose Error Rates after the Unit Dose
Dispensing
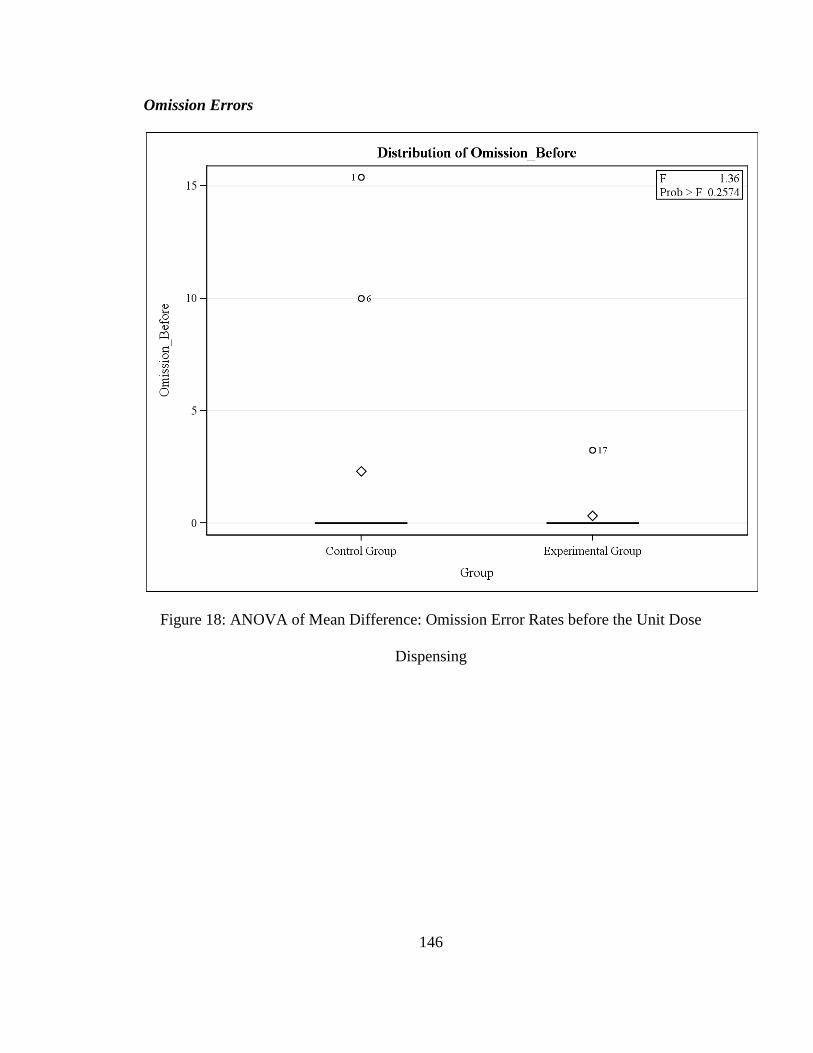
146
Omission Errors
Figure 18: ANOVA of Mean Difference: Omission Error Rates before the Unit Dose
Dispensing

147
Figure 19: ANOVA of Mean Difference: Omission Error Rates after the Unit Dose
Dispensing

148
Outliers
The outliers detected in the Univariate analysis are shown in Table 37. The errors
were evaluated by a panel of two persons, the Principal Investigator who conducted the
observations and her advisor (Dr. Kenneth Barker), who is a recognized expert on this
subject. The errors all appeared valid for reflecting the real medication processes and
were included in the statistical analysis. The error for the first observation day in the
Control group was more than 5 times the mean error rate. The statistical analysis was re-
run after removing this extreme data, and the significant results didn’t change.
The medication error rates by each observation day are presented in Appendix G.
Table 37: Extreme Observations
Overall Error Rate
Extreme Observations
Wrong Dose Error Rate
Extreme Observations
Omission Error Rate
Extreme Observations
Lowest Highest Lowest Highest Lowest Highest
Value Obs Value Obs Value Obs Value Obs Value Obs Value Obs
0 41 12 13 0 41 7.5 28 0 41 9.09 27
0 38 14.29 23 0 40 7.69 1 0 38 9.52 23
0 37 15 28 0 39 8 26 0 37 10 6
0 35 19.44 30 0 38 9.09 2 0 35 15.38 1
0 34 30.77 1 0 37 12 13 0 34 16.67 30

149
Chapter 6: Conclusions and Discussion
Conclusions
An ANCOVA test was conducted for the difference between two means of the
Control and Experimental groups, following the intervention of a Unit Dose Dispensing
System. This was conducted for all error types combined at the 0.05 level of significance,
where a the null hypothesis of no significant difference was rejected. Similar hypotheses
were tested for individual error types and rejected except for unauthorized drug errors,
wrong administration rate errors, and wrong time errors due to insufficient data.
Effect of the Unit Dose Dispensing System on IV Error Rates
The Unit Dose Dispensing System, compared with the existing system, ensured a
higher accuracy during the IV preparation and administration processes as evidenced by
reducing IV medication errors significantly in the Experimental group.
By controlling the pre test as a covariate, the adjusted post test mean difference of
the overall medication error rates between the Control group and the Experimental group
was 8.66% with a 95% Confidence Interval of 4.55 to 12.77%. The Unit Dose Dispensing
System had a statistically significant effect (F1,17 = 19.77, P = 0.0004) on reducing the
post test of the medication error rates in the Experimental group, by explaining 54% of
the variation (R-Square = 0.5388) of the post test of the overall medication error rates
between the Control group and Experimental group.
150
Effect of the Unit Dose Dispensing System on IV Error Rates, by Error Types
The results supported the hypotheses that the Unit Dose Dispensing System had a
significant effect on IV preparation and administration errors, as well as on the sub types
of the errors.
The adjusted post test mean difference of the wrong dose error rates between the
Control group and the Experimental group was 3.14% with a 95% Confidence Interval of
1.26 to 5.03%. The Unit Dose Dispensing System had a statistically significant effect
(F1,17 = 12.37, P = 0.0026) on reducing the post test of the wrong dose error rates in the
Experimental group, by explaining 44% (R-Square = 0.4397) of the variation in the post
test of the wrong dose error rates between the Control group and Experimental group.
The adjusted post test mean difference of the omission error rates between the
Control group and the Experimental group was 4.35% with a 95% Confidence Interval of
0.45 to 8.26%. The Unit Dose Dispensing System had a statistically significant effect
(F1,17 = 5.52, P = 0.03) on reducing of post test of the omission error rates in the
Experimental group, by explaining 26% (R-Square = 0.2625) of the variation in the post
test of the omission error rates between the Control group and Experimental group.
Due to insufficient data on other types of errors, the effect of the Unit Dose
Dispensing System on unauthorized drug errors, wrong administration rate errors, and
wrong time errors could not be evaluated in this study.
151
Discussion
Effect of the Unit Dose Dispensing System on Deficiencies of the Current System
This study indicated that the Unit Dose Dispensing System was effective in
targeting the deficiencies of the current system.
Handwritten transcriptions
In the baseline of the Control and Experimental groups, 9 errors (33% of the total
detected errors) appeared to be due to miscommunication via badly handwritten
transcriptions. Handwritten transcriptions were eliminated in the Unit Dose Dispensing
System. All the TPN orders were entered in the Excel file (Office 2007), and the labels of
the TPN doses were generated from the Excel file (Office 2007). The unit of volume for
liquids was standardized as a Milliliter (ml). The volume of the insulin was calculated
and the unit for insulin volume was given by both Milliliter (ml) and International Unit
(IU). The unit of volume for powder was standardized as mg or vial if the weight of the
compounded powder was not given on the product.
Lacking Insulin Volume Label
In the baseline of the Control and Experimental groups, 9 wrong dose errors (33%
of the total detected errors) were due to wrong calculation and 1 error (4% of the total
detected errors) occurred when both nurses forgot to add insulin for the patient.
In the Unit Dose Dispensing System, the exact volume of the insulin was
calculated in the Excel file (Office 2007) and the unit for insulin volume was given by
both ml and iu. No extra calculations were needed by the preparation nurses before

152
mixing the TPN doses. This change may have prevented the omission errors and wrong
dose errors for insulin doses under the current system.
Limited shelf space
In the baseline of the Control and Experimental groups, 4 errors (15% of the total
detected errors) were likely due to limited shelf space. In the Unit Dose Dispensing
System, all doses for one patient at one time were placed in a single container, and only
one container was delivered to the preparation nurse at one time. This change avoided
having all TPN doses placed closely together on the counter at one time and reduced the
possibilities that one patient’s doses were mixed with those for the adjacent patient.
Lacking Double Check before the Preparation
In the baseline of the Control and Experimental groups, 2 errors (7% of the total
detected errors) lacked the required double check after the auxiliary worker failed to
place the doses on the counter before the preparation. Even though the current system did
ask for a double check, it was not performed by the preparation nurses assigned to do this
double check before the task of mixing. In the Unit Dose Dispensing System, this task
was assigned to a pharmacist (who did not prepare the TPN doses). Errors of extra or
missing vials that appeared to be caused by the failure of the auxiliary worker were
reduced in the Experimental group.
153
Errors that the Unit Dose Dispensing System Did not Prevent
The omission errors caused by the failure of the pharmacy to deliver the doses
when due were not expected to be effected by the Unit Dose Dispensing System.
The wrong dose errors which occurred when the preparation nurse’s elbow was
hit by another nurse accidently was not be prevented by the Unit Dose Dispensing
System as installed, although such errors were not detected in the Experimental group
after the intervention of the Unit Dose Dispensing System. However, it seems reasonable
to speculate that such errors could be prevented by the ideal Unit Dose Dispensing
System using a laminar flow hood.
The unauthorized dose error of compound 12-vitamins for injection which was
given by a nurse as a substitute for water-soluble vitamin without the permission of the
physician might have been caught and prevented by the involvement of the pharmacist in
the Unit Dose Dispensing System.
Study Period
This study was planned such that both groups would be observed for 14
consecutive days before and after the intervention, and the time for the installation
intervention of the Unit Dose Dispensing System would be 6 months. However, after the
observer arrived on site and explained the plan again, serious disagreement occurred.
After negotiation with the Director of the Physicians and the Chief Head Nurse, it was
agreed that the intervention of the Unit Dose Dispensing System would be limited to TPN
doses, and the study period compressed into a 3-month period with 10 consecutive days
of the observation period for each group.
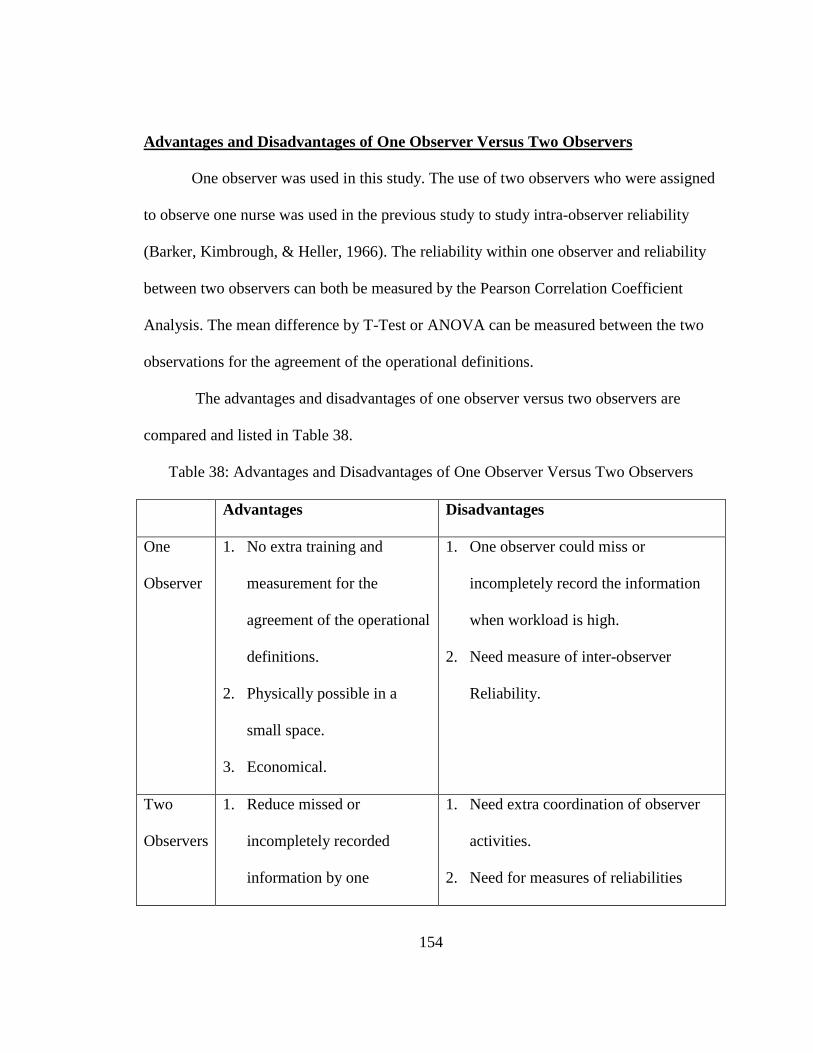
154
Advantages and Disadvantages of One Observer Versus Two Observers
One observer was used in this study. The use of two observers who were assigned
to observe one nurse was used in the previous study to study intra-observer reliability
(Barker, Kimbrough, & Heller, 1966). The reliability within one observer and reliability
between two observers can both be measured by the Pearson Correlation Coefficient
Analysis. The mean difference by T-Test or ANOVA can be measured between the two
observations for the agreement of the operational definitions.
The advantages and disadvantages of one observer versus two observers are
compared and listed in Table 38.
Table 38: Advantages and Disadvantages of One Observer Versus Two Observers
Advantages Disadvantages
One
Observer
1. No extra training and
measurement for the
agreement of the operational
definitions.
2. Physically possible in a
small space.
3. Economical.
1. One observer could miss or
incompletely record the information
when workload is high.
2. Need measure of inter-observer
Reliability.
Two
Observers
1. Reduce missed or
incompletely recorded
information by one
1. Need extra coordination of observer
activities.
2. Need for measures of reliabilities
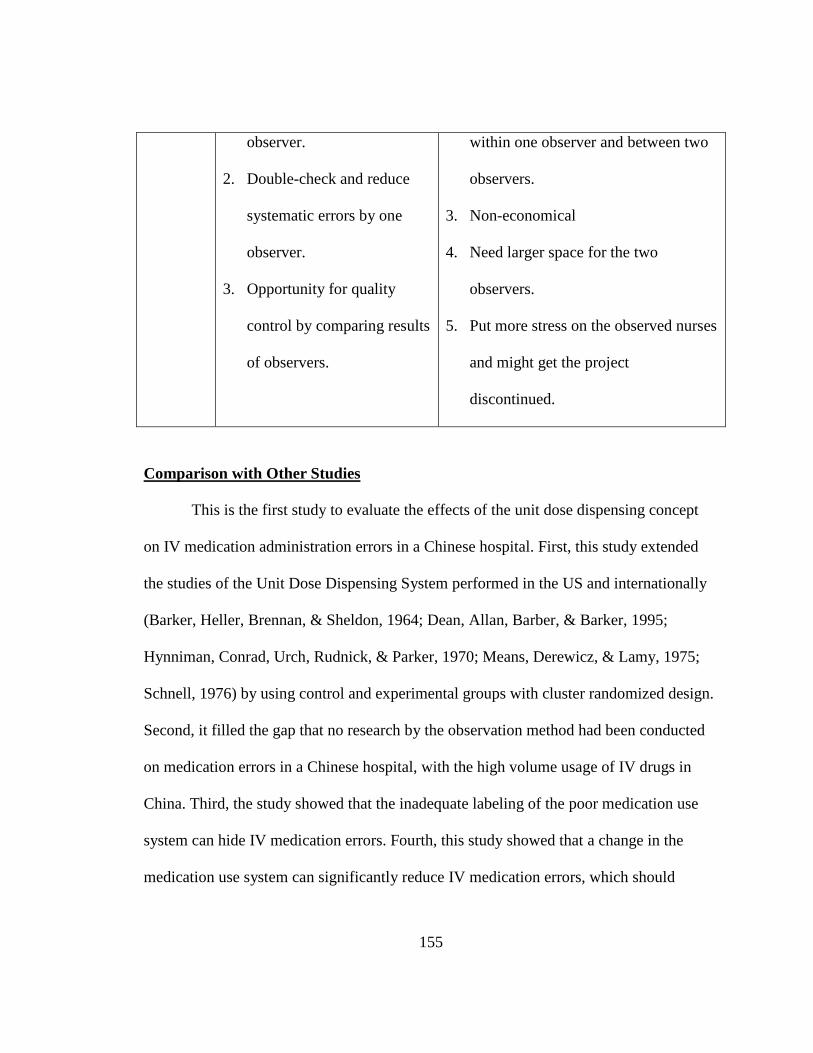
155
observer.
2. Double-check and reduce
systematic errors by one
observer.
3. Opportunity for quality
control by comparing results
of observers.
within one observer and between two
observers.
3. Non-economical
4. Need larger space for the two
observers.
5. Put more stress on the observed nurses
and might get the project
discontinued.
Comparison with Other Studies
This is the first study to evaluate the effects of the unit dose dispensing concept
on IV medication administration errors in a Chinese hospital. First, this study extended
the studies of the Unit Dose Dispensing System performed in the US and internationally
(Barker, Heller, Brennan, & Sheldon, 1964; Dean, Allan, Barber, & Barker, 1995;
Hynniman, Conrad, Urch, Rudnick, & Parker, 1970; Means, Derewicz, & Lamy, 1975;
Schnell, 1976) by using control and experimental groups with cluster randomized design.
Second, it filled the gap that no research by the observation method had been conducted
on medication errors in a Chinese hospital, with the high volume usage of IV drugs in
China. Third, the study showed that the inadequate labeling of the poor medication use
system can hide IV medication errors. Fourth, this study showed that a change in the
medication use system can significantly reduce IV medication errors, which should

156
attract the Chinese public and healthcare providers’ attention to improve medication use
safety.
This study improved the development and use of operational definition thus
minimizing the use of subjective judgments (Bruce & Wong, 2001), and the unclear
deviation percentage of wrong dose errors which were common in previous studies on IV
medication errors (Bruce & Wong, 2001; Hartley & Dhillon, 1998; Van den Bemt et al.,
2002; Wirtz, Taxis, & Barber, 2003). This study used standardized operational definitions
of medication errors with clear deviation percentages, a defined total opportunities for
error, and error rate calculations capable of providing comparable results for IV
medication errors.
If the IV preparation processes and administration processes are studied
separately, the results may compromise any clues to the causes of errors that reach the
patients finally (Taxis & Barber, 2003a, 2003b; Taxis & Barber, 2004; Wirtz, Taxis, &
Barber, 2003). In this study, although the preparation processes were observed, only the
medication administration errors were measured and reported as the outcome at the
endpoint of the medication use system.
Limitations
Convenience Sample
The study patient ward offered for the study was located in a teaching tertiary
hospital was selected as a convenience in Beijing, the capital of China. Thus this was a
convenience sample.
157
The distribution of general government health spending in China (e.g., including
social health insurance spending) is heavily skewed to urban area within a province, and
unequally distributed across provinces. (Wagstaff, Yip, Lindelow, & Hsiao, 2009). These
inequalities in government health spending were at least in part responsible for the
geographic inequalities in the accessibility and quality of health facilities (poor inland
provinces versus prosperous southeastern provinces), their use and health outcomes
(Wagstaff, Yip, Lindelow, & Hsiao, 2009). The statistical data from the Ministry of
Health in 2009 showed that Beijing has 6,497 health care institutions: about equal to the
quantity of health care institutions in some provinces (Chinese Ministry of Health, 2009).
Therefore, the generalization of the results from this hospital to other hospitals of
different levels in other provinces may be limited.
Investigator Accuracy
The Principal Investigator accuracy was considered as a potential limitation
because there was only one observer who observed and recorded the prescriptions, the
preparation processes in the narrow IV preparation room, and the administration
processes during a busy time. However, all the medication errors were considered valid
after being double checked by the Principal Investigator and evaluated again by the major
advisor, and the complete details of each error are included in this report for the scrutiny
of the reader.
If the Principal Investigator failed to capturing all possible IV medication
preparation and administration errors, then the under reporting could have contributed to
158
the systematic errors. However, the effect of this kind of systematic error should be
minimized by the design with a Control group.
Insulin Doses (Small Volume)
When the preparation nurses added the insulin doses quickly, the small volume of
insulin doses was difficult to observe. A total of 17 wrong dose errors were observed in
the 39 ordered insulin doses in the Control group. Assuming that some of the rest
corrected insulin doses (22 doses) were not accurately observed, a maximum estimation
of such insulin doses was 4% of the ordered doses in the Control group. A total of 3
wrong dose errors were observed in the 16 ordered insulin doses in the Experimental
group before the intervention of the Unit Dose Dispensing System. A maximum
estimation of the incomplete insulin doses was 5% of the ordered doses. The insulin
doses in the Experimental group after the intervention of the Unit Dose Dispensing
System were not evaluated, because the doses of insulin were calculated and given in the
volume before the preparation.
Observation of the Administration Processes
Not the entire process of the infusion was always observed. The observer didn’t
always know whether a TPN dose was stopped late in the day after the observation-
period.

159
Exclusion of Doses
A total of 18 doses (3% of the ordered doses in the Control group) and 14 doses
(2% of the ordered doses in the Experimental group) were excluded from the study
(T.O.E.s) as falling outside of the operational definitions of the error categories. These
thirty two errors involved the introduction of un-measurable volumes of liquids when
sharing the tube and needle in transferring similar doses into the Kabiven TM PI bag
(1440 ml) by gravity.
Sterility or Contamination
Sterility or Contamination problems were outside the scope of this study. The
contamination errors were excluded by the observer in the study, because the operational
definition required that any amount extra would be measurable, and measured. For
example, the nurses used the discarded bottles of N (2)-L-alanyl-L-glutamine for
injection or Compound Amino Acid Injection (15-HBC) which were used for the
previous patient to transfer the ingredients into the Kabiven PI bag for the second or the
third patient. However, these errors were not included in the statistical analysis because
the observer could not detect what ingredients and the volumes were left in the reused
bottle. The number of such doses was 18 doses (3% of the ordered doses) in the Control
group and 14 doses (2% of the ordered doses) in the Experimental group.
TPN V.S. Non-TPN IV Doses Excluded
The nursing staff changed their mind and decided late in the study that they
wanted Non-TPNs to be excluded. They decided that they would allow the Unit Dose

160
Dispensing System to be installed for TPN doses only (despite prolonged negotiations).
Thus, Non-TPN doses including prefilled injectable syringes and the base solution
containing one additive of antibiotics were excluded.
In the baseline observation, a total of 790 Non-TPN T.O.E.s were observed for an
error rate of 10.5%.
Effect of the Nurses
No measure of the effect of individual nurses on the preparation and
administration processes was recorded due to the possibilities that the doses for one
patient could be prepared and administered by more than two nurses. Therefore, no intra-
cluster correlation coefficients were analyzed. Even in the preparation process and
especially in the Control group, the doses in a group of TPN orders for one patient could
be prepared by two nurses. For example, one nurse transferred the additives from the
ampoules into the 5% Glucose Solution and the second nurse continued by adding the
insulin and transferring the liquid from the glucose solution bottle into the Kabiven TM
PI bag (1440 ml) by gravity.
Effect of the Observation
The use of the observation method is always subject to the possibility of an effect
of the observer upon the observed. Overall medication error rates were plotted by each
observational day for both the Control group and the Experimental group in Appendix G.
The error rate on Day 1 was the highest among the observational days. Except for this, a
trend of increase or decrease of the error rates in two groups over the observational days
161
was not found on the graphs, which has been taken to indicate that such the “Hawthorne
Effect” (the tendency that the subjects work nervously and poorly or perform better when
they are under the observation in an experiment) was not found in the study.
Generalization
The study site was a patient ward in a teaching tertiary hospital in Beijing, the
capital of China. The distribution of general government health spending (e.g., including
social health insurance spending) is heavily skewed to urban area within a province, and
unequally distributed across provinces. (Wagstaff, Yip, Lindelow, & Hsiao, 2009). These
inequalities in government health spending were at least in part responsible for the
geographic inequalities in the accessibility and quality of health facilities (poor inland
provinces versus prosperous southeastern provinces), their use and health outcomes
(Wagstaff, Yip, Lindelow, & Hsiao, 2009). The statistical data from the Ministry of
Health in 2009 showed that Beijing has 6,497 health care institutions: about equal to the
quantity of health care institutions in some provinces (Chinese Ministry of Health, 2009).
Therefore, the generalization of the results from this hospital to other hospitals of
different levels in other provinces may be limited.
Before the change to the Unit Dose Dispensing System, the HIS computerized
system was already installed at both the physician’s station and the nurse’s station.
Generalization to hospitals without this HIS system must be made with caution. It should
be noted that the HIS system was used as a communication tool for requesting IV
medications to be delivered in batch from the pharmacy, and for the charge process when
the patient checked out from the patient ward. The existing IV preparation and
162
administration processes was generally representative of the current IV preparation and
administration processes in the majority of large hospital without printable labels from
the HIS system and a Centralized Pharmacy Intravenous Admixture Service (PIVAS) in
pharmacy.
Therefore, the results are believed to be useful as the basis for considering the
widespread introduction of the Unit Dose Dispensing System in the IV centralized
preparation and administration processes.
Implications
Implications for Hospitals
The Chinese health care system is principally a hospital centered, three-tiered
system, with public health network support at the primary care level (Hong & Yatsushiro,
2003). At each level, hospitals are divided further into three grade levels according to the
quality of their services (Hong & Yatsushiro, 2003). The grade level of each hospital is
decided by the Ministry of Health according to its roles and functions, size, level of
technology, and quality of medical services.
The results of this study indicated that the current centralized IV preparation by
the nurses in an IV preparation room in this tertiary A-level Chinese hospital had a high
error rate. So, the quality of medication accuracy in the first and second tiered hospitals
could be worse.
The total number of TPN medication errors observed in the Control and
Experimental groups for the baseline study was 27 (T.O.E.s = 475), resulting in a total
error rate of 6%.

163
The errors involving the clinically significant drugs in the ISMP high alert drugs
list were: Potassium chloride injection concentrate (15%), Sodium chloride injection
concentrate (10%), and Insulin. The clues to the causes of the errors suggested badly
handwritten transcriptions (30%), lacking insulin volume label (33% wrong dose and 4%
omission), limited shelf space (15%), and lacking double check before the preparation
(7%).
The significance of this study is to strongly suggest that the Unit Dose Dispensing
System designed for this Chinese hospital offers a reduction in the medication error rate
of 70% at a relatively low cost. The cost should be relatively low because manual labor is
used instead of automated systems which are very expensive.
The Unit Dose Dispensing System has been used in the Pharmacy Intravenous
Admixture Center Service (PIVAS) at some Chinese military hospitals (Appendix J).
Based on the results of this study, the Unit Dose Dispensing System is recommended for
use at least for preparing TPN doses in other Chinese hospitals as well as the hospitals
with similar IV preparation process in other developing countries.
Although the nursing staff changed their mind to exclude Non-TPNs from the
Unit Dose Dispensing System late in the study, a total of 790 Non-TPN T.O.E.s were
observed in the baseline study with a high error rate of 10.5%. A future study can address
the clues to the causes of the errors in Non-TPN doses, and another study should focus on
measuring the effect of the Unit Dose Dispensing System on reducing medication errors
for Non-TPN doses.
164
Implications for Nurses
Nursing education varies greatly at multiple levels in China. There are about 862
secondary vocational nursing programs (2-3 years for high school graduates or 3-4 years
for junior high school graduates), 307 diploma/associate programs (3 years for high
school graduates), 192 baccalaureate programs (admits high school graduates through
National University Admission Examinations), 65 masters programs and 10 doctoral
programs in Chinese nursing education (Gao, Chan, & Cheng, 2011).
Several deficiencies in nursing IV preparation procedure which could potentially
contribute to errors were found in this study: (1) no special precautions were observed
when the nurses admixed high risk drugs; (2) the chemotherapy drugs were prepared in
the same preparation room as TPN doses under no laminar air flow hood with limited
protections (included two layers of gloves (plastic and rubber gloves), cotton mask, and
opening the windows); (3) violations of the preparation procedures such that the tube and
needle were shared for two patients in transferring similar additives into the Kabiven TM
PI bags (1440 ml) were found; and (4) No labels containing the patient information and
the additive drug information were placed on the base solution bag, such a system lacking
labels seemed likely to raise the risk of errors and make them difficult to be detected in
the system especially during the preparation process.
The findings of this study suggest that it is necessary to integrate the education of
patient safety into the curriculum of the nursing education as well as continuing
education or training during their practice.
165
Implications for Pharmacists
The findings of this study showed that although the preparation nurses were asked
to double check the doses before the preparation, this activity was omitted due to the
rushing hours in the morning or was interrupted by other on-call tasks, such as a
telephone call, questions from a physician, need to withdraw the patients’ blood, etc. The
proposed Unit Dose Dispensing System for Chinese hospitals would integrate a
pharmacist who does not prepare the TPN doses, but focuses on the role of editing order
and checking labels in the medication use system.
If the hospital does not have enough pharmacists, a nurse can be considered for
the role of editing orders and checking in the medication use system. However this nurse
should not be the same nurse who perform the tasks of checking and preparing IV doses.
Implications for Pediatric Care
This study showed that more than 70% of the detected TPN errors (27 errors)
observed in the Control and Experimental groups for the baseline study were wrong dose
errors (19 errors). The Principal Investigator recognizes that the doses for children are
more sensitive based on the age and weight of individuals.
Due to the high volume usage of prescribed infusion for Chinese people,
especially for children it is highly recommended that the problem of IV medication errors
for children, and potential effect of the Unit Dose Dispensing System on reducing
medication errors for children be studied.

166
Recommendations for Future Studies
The recommendations for future studies are as follows:
1. It is recommended that the clues to the causes of the errors in Non-TPN doses and
the effect of the Unit Dose Dispensing System on reducing medication errors for
Non-TPN doses be studied.
2. It is highly recommended that the IV medication errors for children as well as the
effect of the Unit Dose Dispensing System on reducing medication errors for
children be studied.
3. It is recommended that the factors of inefficiencies, workload, and interruptions
on the errors in the preparation of IVs receive further study.
4. The Principal Investigator recognized that E-Prescribing was available in the new
installed HIS in this Chinese hospital although the physicians were not adapted to
the full function. It is recommended that an explanatory study of the optimized
utilization of technologies (e.g., E-Prescribing) should be incorporated into the
Unit Dose Dispensing System and the effect on medication errors studied.

167
References
Allan, E. L., & Barker, K. N. (1990). Fundamentals of medication error research.
American Journal of Hospital Pharmacy, 47(3), 555-571.
American Society of Hospital Pharmacists. (1975). ASHP statement on unit dose drug
distribution. American Journal of Hospital Pharmacy, 32(8), 835.
American Society of Hospital Pharmacists. (1989). ASHP statement on unit dose drug
distribution. American Journal of Hospital Pharmacy, 46, 2346.
American Society of Hospital Pharmacists. (1993). Guidelines on preventing medication
errors in hospitals. American Journal of Hospital Pharmacy, 50(2), 305-314.
Armitage, G., & Knapman, H. (2003). Adverse events in drug administration: a literature
review. Journal of Nursing Management, 11(2), 130-140.
Armour, D. J., Cairns, C. J., Costello, I., Riley, S. J., & Davies, E. G. (1996). The
economics of a pharmacy-based central intravenous additive service for paediatric
patients. Pharmacoeconomics, 10(4), 386-394.
Aspden, P. (2007). Preventing medication errors/ Committee on identifying and
preventing medication errors. Washington, DC: National Academies Press.
Barker, K. N. (1969). The effects of an experimental medication system on medication
errors and costs. Part one: introduction and error study American Journal of
Hospital Pharmacy, 26(6), 324-333.
Barker, K. N., Flynn, E. A., & Pepper, G. A. (2002). Observation method of detecting
medication errors. American Journal of Health-System Pharmacy, 59(23), 2314-
2316.
Barker, K. N., Flynn, E. A., Pepper, G. A., Bates, D. W., & Mikeal, R. L. (2002).
Medication errors observed in 36 health care facilities. Archives of Internal
Medicine, 162(16), 1897-1903.
Barker, K. N., Harris, J. A., Webster, D. B., Stringer, J. F., Pearson, R. E., Mikeal, R. L.,
Glotzhober, G. R., & Miller, G. J. (1984a). Consultant evaluation of a hospital
medication system: analysis of the existing system. American Journal of Hospital
Pharmacy, 41(10), 2009-2016.
Barker, K. N., Harris, J. A., Webster, D. B., Stringer, J. F., Pearson, R. E., Mikeal, R. L.,
Glotzhober, G. R., & Miller, G. J. (1984b). Consultant evaluation of a hospital
168
medication system: implementation and evaluation of the new system. American
Journal of Hospital Pharmacy, 41(10), 2022-2029.
Barker, K. N., Harris, J. A., Webster, D. B., Stringer, J. F., Pearson, R. E., Mikeal, R. L.,
Glotzhober, G. R., & Miller, G. J. (1984c). Consultant evaluation of a hospital
medication system: synthesis of a new system. American Journal of Hospital
Pharmacy, 41(10), 2016-2021.
Barker, K. N., & Heller, W. M. (1963a). The development of a centralized unit-dose
dispensing system for UAMC. Part I: description of the UAMC experimental
system. American Journal of Hospital Pharmacy, 20(11), 568-579.
Barker, K. N., & Heller, W. M. (1963b). The development of a centralized unit-dose
dispensing system for UAMC. Part II: why centralize the preparation of unit-
doses? American Journal of Hospital Pharmacy, 20(12), 612-623.
Barker, K. N., & Heller, W. M. (1964). The development of a centralized unit-dose
dispensing system for UAMC. Part III: an editing center for physicians'
medication orders. American Journal of Hospital Pharmacy, 21(2), 56-67.
Barker, K. N., Heller, W. M., & Brennan, J. J. (1964). The development of a centralized
unit-dose dispensing system for UAMC. Part V: the pilot study-introduction and
work measurement. American Journal of Hospital Pharmacy, 21(5), 412-423.
Barker, K. N., Heller, W. M., Brennan, J. J., & Sheldon, E. C. (1964). The development
of a centralized unit-dose dispensing system for UAMC. Part VI: the pilot study-
medication errors and drug losses. American Journal of Hospital Pharmacy,
21(12), 609-625.
Barker, K. N., Heller, W. M., & Sheldon, E. C. (1964). The development of a centralized
unit-dose dispensing system for UAMC. Part IV: the roles and responsibilities of
the pharmacist and nurse under the experimental system. American Journal of
Hospital Pharmacy, 21(9), 230-237.
Barker, K. N., Kimbrough, W. W., & Heller, W. M. (1966). A study of medication errors
in a hospital. University of Arkansas, Fayetteville, Arkansas.
Barker, K. N., & McConnell, W. E. (1962). The problems of detecting medication errors
in hospitals. American Journal of Hospital Pharmacy, 19(3), 360-369.
Barker, K. N., & Pearson, R. E. (1986). Medication distribution systems. In T. R. Brown
& M. C. Smith (Eds.), Handbook of Institutional Pharmacy Practice. 2nd Ed (pp.
325–351). Baltimore, MD: American Society of Hospital Pharmacists.
Barker, K. N., Pearson, R. E., Hepler, C. D., Smith, W. E., & Pappas, C. A. (1984).
Effect of an automated bedside dispensing machine on medication errors.
American Journal of Hospital Pharmacy, 41(7), 1352-1358.
169
Bates, D. W., Teich, J. M., Lee, J., Seger, D., Kuperman, G. J., Ma'Luf, N., Boyle, D.,
& Leape, L. (1999). The impact of computerized physician order entry on
medication error prevention. Journal of the American Medical Informatics
Association, 6(4), 313-321.
Black, H. J., & Nelson, S. P. (1992). Medication distribution systems. In T. R. Brown
(Ed.), Handbook of Institutional Pharmacy Practice. 3rd Ed (pp. 165-174).
Bethesda, MD: American Society of Hospital Pharmacists.
Black, H. J., & Tester, W. W. (1964). Decentralized pharmacy operations utilizing the
unit dose concept part I. American Journal of Hospital Pharmacy, 21(8), 344-350.
Black, H. J., & Tester, W. W. (1967). Decentralized pharmacy operations utilizing the
unit dose concept part III. American Journal of Hospital Pharmacy, 24(3), 120-
129.
Blumenthal, D., & Hsiao, W. (2005). Privatization and its discontents-the evolving
Chinese health care system. New England Journal of Medicine, 353(11), 1165-
1170.
Borel, J. M., & Rascati, K. L. (1995). Effect of an automated, nursing unit-based drug-
dispensing device on medication errors. American Journal of Health-System
Pharmacy, 52(17), 1875-1879.
Bruce, J., & Wong, I. (2001). Parenteral drug administration errors by nursing staff on an
acute medical admissions ward during day duty. Drug Safety, 24(11), 855-862.
Cai, F., Park, A., & Zhao, Y. (2008). The Chinese labor market in the reform era. In L.
Brandt & T. G. Rawski (Eds.), China's Great Economic Transformation (pp. 167-
214). New York: Cambridge University Press.
Cai, W. W., Marks, J. S., Chen, C. H., Zhuang, Y. X., Morris, L., & Harris, J. R. (1998).
Increased cesarean section rates and emerging patterns of health insurance in
Shanghai, China. American Journal of Public Health, 88(5), 777-780.
Decisions of the central committee of the communist party of China and the state council
on further strengthening rural health work. Beijing, China, (2002).
China Daily. (2011). Eight bottles per capita infusion of focus. Retrieved 1.12, 2011,
from http://www.china-daily.org/China-News/8-bottles-per-capita-infusion-of-
focus-the-back-to-drugs-to-support-medical-institutions-to/
Chinese Ministry of Health. (2004). China health year book, 2004 (Zhongguo Weisheng
Nianjian, 2004). Retrieved. from Government Webpage:
http://www.moh.gov.cn/publicfiles/business/htmlfiles/mohbgt/s8274/200805/352
86.htm.

170
Chinese Ministry of Health. (2009). China health year book, 2009 (Zhongguo Weisheng
Nianjian, 2009). Retrieved. from Government Webpage:
http://www.moh.gov.cn/publicfiles/business/htmlfiles/zwgkzt/ptjnj/year2009/t-
1.htm.
Chinese Ministry of Labor and Social Security. (2004). National basic medical insurance
list. Retrieved. from Government Webpage:
http://www.molss.gov.cn/gb/zt/pdf/xybf.htm
Cohen, J. (1988). Statistical power analysis for the behavioral sciences. 2nd Ed.
Hillsdale, NJ: Lawrence Erlbaum Associates.
Committee on Quality of Health Care in America Institute of Medicine. (2001). Crossing
the quality chasm: a new health system for the 21st century. Washington DC:
National Academy Press.
Corrigan, J., Donaldson, M., Kohn, L., Maguire, S., & Pike, K. (2001). Crossing the
quality chasm: a new health system for the 21st century. Washington DC:
Institute of Medicine.
Cousins, D. D. M. (1998). Medication use: a systems approach to reducing errors.
Oatbrook Terrace, IL: Joint Commission on Accreditation of Healthcare
Organization.
Cousins, D. D. M., & Calnan, R. (2000). Medication error reporting systems. In M. R.
Cohen (Ed.), Medication Errors: causes, prevention, and risk management (pp.
18.11-18.20). Sudbury, MA: Jones & Bartlett Publishers.
Davies, T. (2006). Fatal drug mix-up exposes hospital flaws: 3 Indiana baby deaths
because of drug mix-ups expose flaws in medication system. from
http://wwwimage.cbsnews.com/stories/2006/09/23/ap/health/mainD8KA8UD00.s
html
Dean, B. S., Allan, E. L., Barber, N. D., & Barker, K. N. (1995). Comparison of
medication errors in an American and a British hospital. American Journal of
Health-System Pharmacy, 52(22), 2543.
Dean, B. S., & Barber, N. D. (1999). A validated, reliable method of scoring the severity
of medication errors. American Journal of Health-System Pharmacy, 56(1), 57-
62.
Dean, B. S., & Barber, N. D. (2001). Validity and reliability of observational methods for
studying medication administration errors. American Journal of Health-System
Pharmacy, 58(1), 54-59.
171
DeYoung, J. L., VanderKooi, M. E., & Barletta, J. F. (2009). Effect of bar-code-assisted
medication administration on medication error rates in an adult medical
intensive care unit. American Journal of Health-System Pharmacy, 66(12), 1110-
1115.
Dragon TV. (2010). A case of Infusion death. from
http://tv.sohu.com/20100127/n269854112.shtml
Felkey, B. G., & Barker, K. N. (1995). The power of information in an integrated health
care system. American Journal of Health-System Pharmacy, 52(5), 537-540.
Felkey, B. G., & Barker, K. N. (2005). Technology and automation. In D. B. Troy (Ed.),
Remington: the science and practice of pharmacy. 21st Ed (Vol. 21, pp. 1753-
1761). Philadelphia, PA: Lippincott Williams & Wilkins.
First Consulting Group. (2003). Computerized physician order entry: costs, benefits, and
challenges. from http://www.leapfroggroup.org/media/file/Leapfrog-
CPOE_Costs_Benefits_Challenges.pdf
Flynn, E., Barker, K., Pepper, G., Bates, D., & Mikeal, R. (2002). Comparison of
methods for detecting medication errors in 36 hospitals and skilled-nursing
facilities. American Journal of Health-System Pharmacy, 59(5), 436-446.
Flynn, E. A., & Barker, K. N. (2000). Medication errors research. In M. R. Cohen (Ed.),
Medication Errors: causes, prevention, and risk management (pp. 6.1-6.25).
Sudbury, MA: Jones & Bartlett Publishers.
Flynn, E. A., & Barker, K. N. (2007). Research on errors in dispensing and medication
administration. In M. R. Cohen (Ed.), Medication Errors: causes, prevention, and
risk management. 2nd Ed (pp. 15-41). Washington, DC: American
Pharmaceutical Association.
Flynn, E. A., Pearson, R. E., & Barker, K. N. (1997). Observational study of accuracy in
compounding iv admixtures at five hospitals. American Journal of Health-System
Pharmacy, 54(8), 904-912.
Fraind, D. B., Slagle, J. M., Tubbesing, V. A., Hughes, S. A., & Weinger, M. B. (2002).
Reengineering intravenous drug and fluid administration processes in the
operating room. Step one: task analysis of existing processes. Anesthesiology, 97
139-147.
Franklin, B. D., O’Grady, K., Donyai, P., Jacklin, A., & Barber, N. (2007). The impact of
a closed-loop electronic prescribing and administration system on prescribing
errors, administration errors and staff time: a before-and-after study. Quality and
Safety in Health Care, 16(4), 279.

172
Gao, J., Tang, S., Tolhurst, R., & Rao, K. (2001). Changing access to health services in
urban China: implications for equity. Health Policy and Planning 16(3), 302-
312.
Gao, L. L., Chan, S. W. C., & Cheng, B. S. (2011). The past, present and future of
nursing education in the People's Republic of China: a discussion paper. Journal
of Advanced Nursing.
Gao, P. (2011). Two years old boy died in infusion: wrong patient's label was found on
the bottle. Retrieved Feb.11, 2011, from
http://health.people.com.cn/GB/13894009.html
Gray, J. (2008). Infant deaths raise new heparin questions. from
http://www.msnbc.msn.com/id/25637545/#hybrid_video
Hartley, G. M., & Dhillon, S. (1998). An observational study of the prescribing and
administration of intravenous drugs in a general hospital. International Journal of
Pharmacy Practice, 6(1), 38-45.
Heller, W. M. (1964). U.S. Public Health Service Publication No. 930-C-8 June 1964
Grant HM-00323, University of Arkansas Medical Center: A Proposed hospital
Drug Distribution System.
Hellman, R. (2004). A systems approach to reducing errors in insulin therapy in the
inpatient setting. Endocrine Practice, 10(Supplement 2), 100-107.
Helmons, P. J., Wargel, L. N., & Daniels, C. E. (2009). Effect of bar-code-assisted
medication administration on medication administration errors and accuracy in
multiple patient care areas. American Journal of Health-System Pharmacy,
66(13), 1202-1210.
Hesketh, T., & Zhu, W. X. (1997). Health in China: the healthcare market. British
Medical Journal, 314(7094), 1616.
Hong, Y.-S., & Yatsushiro, R. (2003). Nursing education in China in transition. Journal
of Oita Nursing and Health Sciences, 4(2), 41-47.
Hsiao, W. C. (1984). Transformation of health care in China. New England Journal of
Medicine, 310(14), 932-936.
Hsiao, W. C. (2004). Disparity in health: the underbelly of China's economic
development. Harvard China Review, 5(1), 64–70.
Hynniman, C. E., Conrad, W. F., Urch, W. A., Rudnick, R. B., & Parker, P. F. (1970). A
comparison of medication errors under the University of Kentucky dose system
and traditional drug distribution systems in four hospitals. American Journal of
Hospital Pharmacy, 27(10), 802-814.

173
Institute for Safe Medication Practices. (2003, July 2003). Insulin errors. from
http://www.usp.org/pdf/EN/patientSafety/capsLink2003-07-01.pdf
Institute for Safe Medication Practices. (2008). ISMP's list of high-alert medications.
from http://www.ismp.org/Tools/highalertmedications.pdf
Institute for Safe Medication Practices. (2011). TPN-related deaths call for FDA
guidance and pharmacy board oversight of USP Chapter <797>. from
http://www.ismp.org/Newsletters/acutecare/articles/20110407.asp
Kerlinger, F. N., & Lee, H. B. (1999). Foundations of behavioral research. 3rd Ed.
Orlando, FL: Holt, Rinehart and Winston, Inc.
Leape, L. L. (1994). Error in medicine. The Journal of the American Medical
Association, 272(23), 1851-1857.
Leape, L. L., Bates, D. W., Cullen, D. J., Cooper, J., Demonaco, H. J., Gallivan, T.,
Hallisey, R., Ives, J., Laird, N., & Laffel, G. (1995). Systems analysis of adverse
drug events. Journal of American Medical Association, 274(1), 35-43.
Li, C. Y., Huang, J., Li, L., Sun, H., & Ying, L. (2009). A survey of the status of infusion
therapy in Beijing (Chinese). Chinese Journal of Nursing Administration, 607-
609.
Liu, X., & Hsiao, W. C. (1995). The cost escalation of social health insurance plans in
China: its implication for public policy. Social Science & Medicine, 41(8), 1095-
1101.
Liu, X., & Mills, A. (1999). Evaluating payment mechanisms: how can we measure
unnecessary care? . Health Policy and Planning, 14, 409-413.
Liu, Y. (2004a). China's public healthcare system: facing the challenges. Bulletin of the
World Health Organization, 82, 532-538.
Liu, Y. (2004b). Development of the rural health insurance system in China. Health
Policy and Planning, 19(3), 159.
Liu, Y., Rao, K., & Hsiao, W. C. (2003). Medical spending and rural impoverishment in
China. Journal of Health, Population, and Nutrition, 21, 216-222.
Martelli, M. E. (2002). Intravenous medication administration. from Gale Encyclopedia
of Nursing and Allied Health: http://www.enotes.com/nursing-
encyclopedia/intravenous-medication-administration
McConnell, W. E., Barker, K. N., & Garrity, L. (1961). Centralized unit dose dispensing:
report of a study. American Journal of Hospital Pharmacy, 18(9), 531-541.
174
Means, B. J., Derewicz, H. J., & Lamy, P. P. (1975). Medication errors in a multidose
and a computer-based unit dose drug distribution system. American Journal of
Hospital Pharmacy, 32(2), 186-191.
MEDMARX Database 2002-2006. (2008). Intravenous Medication Errors: Findings
from the MedMarx® Database. Paper presented at the ASHP IV Safety Summit,
Rockville, Maryland.
Moray, N. (1994). Error reduction as a systems problem. In Human error in medicine
(pp. 67–91). Hillsdale, NJ: Lawrence Erlbaum Associates.
Munro, B. H. (2005). Analysis of covariance in statistical methods for health care
research. 5th Ed. Philadelphia, PA: Lippincott Williams & Wilkins.
Murray, D. M. (1998). Design and analysis of group-randomized trials. New York, NY:
Oxford University Press Inc.
O’Hara, M., Bradley, A. M., Gallagher, T., & Shields, M. D. (1995). Errors in
administration of intravenous drugs. British Medical Journal, 310, 1536-1537.
Paoletti, R. D., Suess, T. M., Lesko, M. G., Feroli, A. A., Kennel, J. A., Mahler, J. M., &
Sauders, T. (2007). Using bar-code technology and medication observation
methodology for safer medication administration. American Journal of Health-
System Pharmacy, 64(5), 536-543.
Parshuram, C. S., To, T., & Seto, W. (2008). Systematic evaluation of errors occurring
during the preparation of intravenous medication. Canadian Medical Association
Journal, 178(1), 42.
Patterson, T. R., & Nordstrom, K. A. (1968). An analysis of intravenous additive
procedures on nursing units. American Journal of Hospital Pharmacy, 25(3), 134-
137.
Pedersen, C. A., Schneider, P. J., & Scheckelhoff, D. J. (2009). ASHP national survey of
pharmacy practice in hospital settings: dispensing and administration-2008.
American Journal of Health-System Pharmacy, 66(10), 926-946.
Perlstein, P. H., Callison, C., White, M., Barnes, B., & Edwards, N. K. (1979). Errors in
drug computations during newborn intensive care. Archives of Pediatrics and
Adolescent Medicine, 133(4), 376-379.
Phend, C. (2007). Heparin overdose in three infants revisits hospital error issues. from
http://www.medpagetoday.com/Pediatrics/GeneralPediatrics/7469
Poon, E. G., Keohane, C. A., Yoon, C. S., Ditmore, M., Bane, A., Levtzion-Korach, O.,
Moniz, T., Rothschild, J. M., Kachalia, A. B., Hayes, J., Churchill, W. W.,
Lipsitz, S., Whittemore, A. D., Bates, D. W., & Gandhi, T. K. (2010). Effect of
175
bar-code technology on the safety of medication administration. New England
Journal of Medicine, 362(18), 1698-1707.
Reilly, K. M. (1987). Problems in administration techniques and dose measurement that
influence accuracy of IV drug delivery. American Journal of Hospital Pharmacy,
44(11), 2545-2550.
Rogers, E. M. (1995). Diffusion of innovations: Free Pr.
Rough, S., & Temple, J. (2006). Automation in prcatice. In T. R. Brown (Ed.), Handbook
of Institutional Pharmacy Practice. 4th Ed (pp. 329-352). Bethesda, MD:
American Society of Health-System Pharmacists.
Sanborn, M., Gabay, M., & Moody, M. L. (2009). The safety of intravenous drug
delivery systems: update on current issues since the 1999 consensus development
conference. Hospital Pharmacy, 44(2), 159-163.
Schneider, M. P., Cotting, J., & Pannatier, A. (1998). Evaluation of nurses' errors
associated in the preparation and administration of medication in a pediatric
intensive care unit. Pharmacy World & Science, 20(4), 178-182.
Schneider, R., Bagby, J., & Carlson, R. (2008). Bar-code medication administration: a
systems perspective. American Journal of Health-System Pharmacy, 65(23),
2216-2219.
Schnell, B. R. (1976). A study of unit-dose drug distribution in four Canadian hospitals.
The Canadian journal of hospital pharmacy, 29(3), 85-90.
Smetzer, J. L., & Cohen, M. R. (2007). Medication error reporting systems. In M. R.
Cohen (Ed.), Medication errors: causes, prevention, and risk management. 2nd
Ed (pp. 513-550). Sudbury, MA: Jones & Bartlett Publishers.
Stephenson, J. (Ed.). (1991). System Safety 2000: Van Nostrand Reinhold, New York.
Taxis, K., & Barber, N. (2003a). Causes of intravenous medication errors: an
ethnographic study. Quality and safety in health care, 12(5), 343-347.
Taxis, K., & Barber, N. (2003b). Ethnographic study of incidence and severity of
intravenous drug errors. British Medical Journal, 326, 684-687.
Taxis, K., & Barber, N. (2004). Incidence and severity of intravenous drug errors in a
German hospital. European Journal of Clinical Pharmacology, 59(11), 815-817.
Teich, J. M., Hurley, J. F., Beckley, R. F., & Aranow, M. (1992). Design of an easy-to-
use physician order entry system with support for nursing and ancillary
departments. Proceedings of the Annual Symposium on Computer Application in
Medical Care 99-103.
176
Tester, W. W. (1964). U.S. Public Health Service Publication No. 930-C-8 June 1964
Grant HM-00328-01, University of Iowa: A Study of Patient Care Involving a
Unit Dose System.
Thielke, T. S. (2003). The impact of bar code medication administration. Paper presented
at the Proceedings Bar Code Medication Adminsitration Conference, San Diego,
CA.: ALARIS Center for Medication Safety and Clinical Improvement.
Thur, M. P., Miller, W. A., & Latiolais, C. J. (1972). Medication errors in a nurse-
controlled parenteral admixture program. American Journal of Hospital
Pharmacy, 29(4), 298-304.
Tissot, E., Cornette, C., Demoly, P., Jacwuet, M., Barale, F., & Capellier, G. (1999).
Medication errors at the administration stage in an intensive care unit. Intensive
Care Medicine 25, 353-359.
Tucker, S. A. (2003). Analysis of impact of the Food and Drug Administration's proposed
bar code label requirements for human drug products and blood. Paper presented
at the Proceedings Bar Code Medication Adminsitration Conference, San Diego,
CA.: ALARIS Center for Medication Safety and Clinical Improvement.
Van den Bemt, P. M., Fijn, R., van der Voort, P. H., Gossen, A. A., Egberts, T. C., &
Brouwers, J. R. (2002). Frequency and determinants of drug administration errors
in the intensive care unit. Critical Care Medicine, 30(4), 846-850.
Wagstaff, A., Lindelow, M., Wang, S., & Zhang, S. (2009). Reforming China's Rural
Health System: World Bank Publications.
Wagstaff, A., Yip, W., Lindelow, M., & Hsiao, W. C. (2009). China's health system and
its reform: a review of recent studies. Health Economics, 18(S2), S7-S23.
Wirtz, V., Taxis, K., & Barber, N. (2003). An observational study of intravenous
medication errors in the United Kingdom and in Germany. Pharmacy World &
Science, 25(3), 104-111.
World Health Organization. (2009). Health situation and trend. from
http://www.wpro.who.int/countries/2009/chn/health_situation.htm
Yip, W. (2009). Disparities in health care and health status: the rural-urban gap and
beyond. In M. K. Whyte (Ed.), One Country, Two Societies: Rural-Urban
Inequality in Contemporary China (pp. 147-165). Cambridge, MA: Harvard
University Press.
Yip, W., & Hsiao, W. (2009). Non-evidence-based policy: how effective is China's new
cooperative medical scheme in reducing medical impoverishment? Social Science
& Medicine, 68(2), 201-209.
177
Zhang, G. Q., Zhao, L., Li, W., Wang, B., & Gong, C. G. (2005). Design of Unit Dose
Dispensing System in the centralized dispensing pharmacy. Journal of
Pharmaceutical Practice (Chinese), 23 (2), 78-80.

178
Appendix A: Conversations with the Director of the Hospital Pharmacy

179
A Letter for the Educational Purpose in the December 2008 Dear Director ***, I am writing this letter to ask for your help with my research. My dissertation research project is to evaluate the effect of a unit dose system on medication accuracy in Chinese hospitals. I am planning to send a questionnaire to ask about the current processes of dispensing medications in your hospital pharmacy, and information about unit dose systems in Chinese hospital pharmacies. I am sending you this questionnaire in email for your review firstly, and then later I plan to call you on the phone for your answers to these questions. You were selected to be part of this project because you are a highly respected member committee of the Chinese Hospital Pharmacy Association, which is also interested in medication errors. Your hospital was one of the famous hospitals in the People's Republic of China. I know that as the Director of Pharmacists you are very busy, but I hope that you will take the time to participate in helping me draft this national questionnaire. Before drafting my questionnaire, I did a literature review of Chinese hospital pharmacies. I found very few published papers that displayed in detail the processes of dispensing medications in hospital pharmacy. The specific purpose of my study is to help me get a clear picture of the processes of dispensing medications in hospital pharmacy and the current status and usage of unit dose system. Please try to answer the questions in detail and precisely as much as you can. Your answers will be completely confidential. Your response will be used for research purposes only. I will not release any information identifying your hospital pharmacy to a third party. If you feel uncomfortable about some questions, please let me know and I will change them. Thank you in advance for your help in drafting this questionnaire. If you have any questions, please contact me at 334-275-1778 or [email protected] or Dr Barker at 334-844-5152 or [email protected]. Sincerely, Qian Ding Graduate Student Pharmacy Care Systems Auburn University Auburn, AL 36849-5506 Mobile: (334) 275-1778 Email: [email protected]
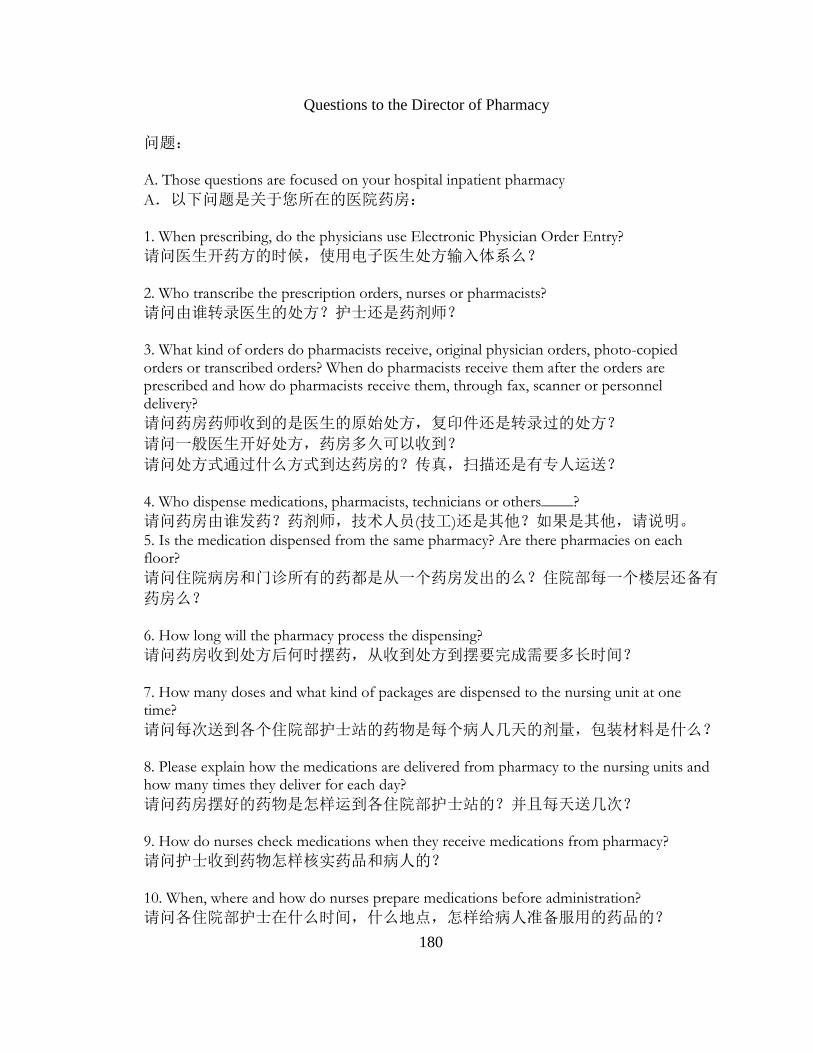
180
Questions to the Director of Pharmacy
问题:
A. Those questions are focused on your hospital inpatient pharmacy
A.以下问题是关于您所在的医院药房:
1. When prescribing, do the physicians use Electronic Physician Order Entry?
请问医生开药方的时候,使用电子医生处方输入体系么?
2. Who transcribe the prescription orders, nurses or pharmacists?
请问由谁转录医生的处方?护士还是药剂师?
3. What kind of orders do pharmacists receive, original physician orders, photo-copied orders or transcribed orders? When do pharmacists receive them after the orders are prescribed and how do pharmacists receive them, through fax, scanner or personnel delivery?
请问药房药师收到的是医生的原始处方,复印件还是转录过的处方?
请问一般医生开好处方,药房多久可以收到?
请问处方式通过什么方式到达药房的?传真,扫描还是有专人运送?
4. Who dispense medications, pharmacists, technicians or others____?
请问药房由谁发药?药剂师,技术人员(技工)还是其他?如果是其他,请说明。
5. Is the medication dispensed from the same pharmacy? Are there pharmacies on each floor?
请问住院病房和门诊所有的药都是从一个药房发出的么?住院部每一个楼层还备有
药房么?
6. How long will the pharmacy process the dispensing?
请问药房收到处方后何时摆药,从收到处方到摆要完成需要多长时间?
7. How many doses and what kind of packages are dispensed to the nursing unit at one time?
请问每次送到各个住院部护士站的药物是每个病人几天的剂量,包装材料是什么?
8. Please explain how the medications are delivered from pharmacy to the nursing units and how many times they deliver for each day?
请问药房摆好的药物是怎样运到各住院部护士站的?并且每天送几次?
9. How do nurses check medications when they receive medications from pharmacy?
请问护士收到药物怎样核实药品和病人的?
10. When, where and how do nurses prepare medications before administration?
请问各住院部护士在什么时间,什么地点,怎样给病人准备服用的药品的?
181
B. Those questions are related to the workload:
以下问题关于工作量
1. How many beds in your hospital?
请问贵医院住院部有多少床位?
2. How many patient wards in your hospital?
请问贵医院一共有多少住院单元?
3. How many beds per patient ward and how many nurses per patient ward?
请问每个住院单元有多少床位,多少护士?
4. How many pharmacists in the hospital pharmacy?
请问医院住院药房共有多少药剂师?
5. How many prescription orders dispensed per day minimum, average and maximum?
请问医院药房平均每天摆多少处方药,最少和最多每天摆多少处方药?
C. Those questions are related to the attitude and knowledge of unit dose system:
以下问题关于您对单剂量发药体系的态度和知识
1. Are you familiar with the concept of unit dose system?
请问您了解单剂量发药体系概念么?
2. Has your hospital pharmacy installed the Unit Dose Dispensing System?
请问贵医院药房使用单剂量发药体系了么?
3. If not, would you like to install the Unit Dose Dispensing System?
如果上题回答没有,请问您愿意使用单剂量发药体系么?
4. Do you know which hospital has installed unit dose system in hospital pharmacy in Mainland China?
请问您知道国内哪些医院安装了单剂量体系发药体系么?
5. Can you give me their contact information?
请问您知道他们的联系方式么?
D. Those two questions are related to the resource about hospital pharmacy information
以下问题关于医院药房信息资源
1. Is there an association, which is like ASHP in the US, in Mainland China?
请问您知道国内有没有相当于 ASHP 的组织?
182
2. Is there such a book published by government or Health Department gathering information of hospitals in China and where can I buy such a book?
请问您知道国内有没有权威出版社出版的医院名录,请问哪里有卖这本书的?
183
Script to the Observed Nurses
Subject: Protocol “The Effects of the Unit Dose Dispensing System on IV Medication Administration Accuracy in a Chinese Hospital: Inpatients” Principal Investigator: Qian Ding Key Personnel: Qian Ding, Kenneth N. Barker, and Elizabeth A. Flynn Date research materials submitted to IRB: Feb 05, 2010 Name of Institutional Review Board: Hospital Clinical Research Ethical Review Board Objective of the Study:
1. Explore the nature and frequency of IV medication errors among Chinese hospital inpatients.
2. Study the effect of a Unit Dose Dispensing System upon IV medication errors in Chinese hospital inpatients?
Research Methods: Randomize Control Trial Two patient units will be randomly selected to be the Control group or the Experimental group. The Before intervention observations (Baseline) will run from June to September 2010. The traditional system is that the nurses prepare IV medications in the treatment room in the inpatient units. The intervention to be introduced, Unit Dose Dispensing for IV drugs, is designed to be used the patient unit selected as the experimental group by random assignment from October 2010 to March 2011. The IV drugs are designed to be dispensed from the pharmacy in the ready-to-administer unit dose form, which means that the additives are added into the base solutions with labels on the base solutions. The pharmacists will check the IV drugs before they are dispensed to the patient units. The After intervention observations will run from April to June 2011.
Outcome Measurement: IV medication administration errors by the Direct Observation Method The observer, Qian Ding, was trained by Dr. Flynn the direct observation method for one week in a U.S. hospital in the summer 2008 and certified in the proper use of observation method to detect medication errors. The regular medications preparation and administration working processes will be observed and recorded on the standardized observational tools (Drug Pass Worksheet, Drug Order, and Medication Error Summary Worksheet) by the observer. The details are as follows. The observer will randomly select a nurse, follow this nurse, and observe the processes as she uses to prepare and administer the medicines, including any dosage form. The observer will write down what the nurse did, including the medication’s name, dosage form, dose, strength, dose preparation and administration time, and administration rate if the medicine is an IV drug. Then the notes will be compared with the written interpretable
184
orders on the patients’ charts to detect the IV medication administration errors. Once the errors are identified and addressed on the Medication Error Summary Worksheet, The observer will shred the worksheets of Drug Orders and Drug Pass with patients’ names within 90 days.
Observation period for each patient ward will cover about 14 consecutive days from 7 AM to 3 PM. The consented nurses or the pharmacists for one patient ward have the same opportunities to be picked up for the observation during the observation period. The total observation periods will cover around 56 days for four patient wards. Participants: Medication nurses in the chosen patient wards IV preparation pharmacists in the chosen experimental groups Participants will be recruited by the script of the project description posted on the board in the patient wards, which was provided by the Principal Investigator. Before initiating the study, an AU IRB approved stamped consent form will be given to the medication nurses and IV preparation pharmacists. The Principal Investigator will describe the study to the nurses and pharmacists before they read the consent form. The participants have the opportunities to ask any questions to the Principal Investigator. The signed consent forms are returned to Qian Ding in the closed envelops. The consent forms are confidential to their supervisors, colleagues or the third party. The nurses have the opportunities to withdraw the study at any time during the study without causing bad relationship with their employer hospital or bad effects on their job in the future. Protection of the DATA: The data collected with patients name will be shredded in 10 days when the observer detects the errors. Before shredding, the data are locked in the drawer in Qian Ding’s apartment in Beijing. Pictures and videos without any identifiable person’s face are allowed. The hardcopies including the pictures and the Medication Error Summary Worksheet will be locked in the Qian Ding’s personal cabinet in 205 Dunstan Hall in Auburn University. The electronic records of the pictures and videos are stored in Qian Ding’s personal laptop locked by a private password. The Principal Investigator will shed the hardcopies and delete the electronic files from the laptop by June 1, 2013.
185
Appendix B: Official IRB Approval Letter from the Hospital
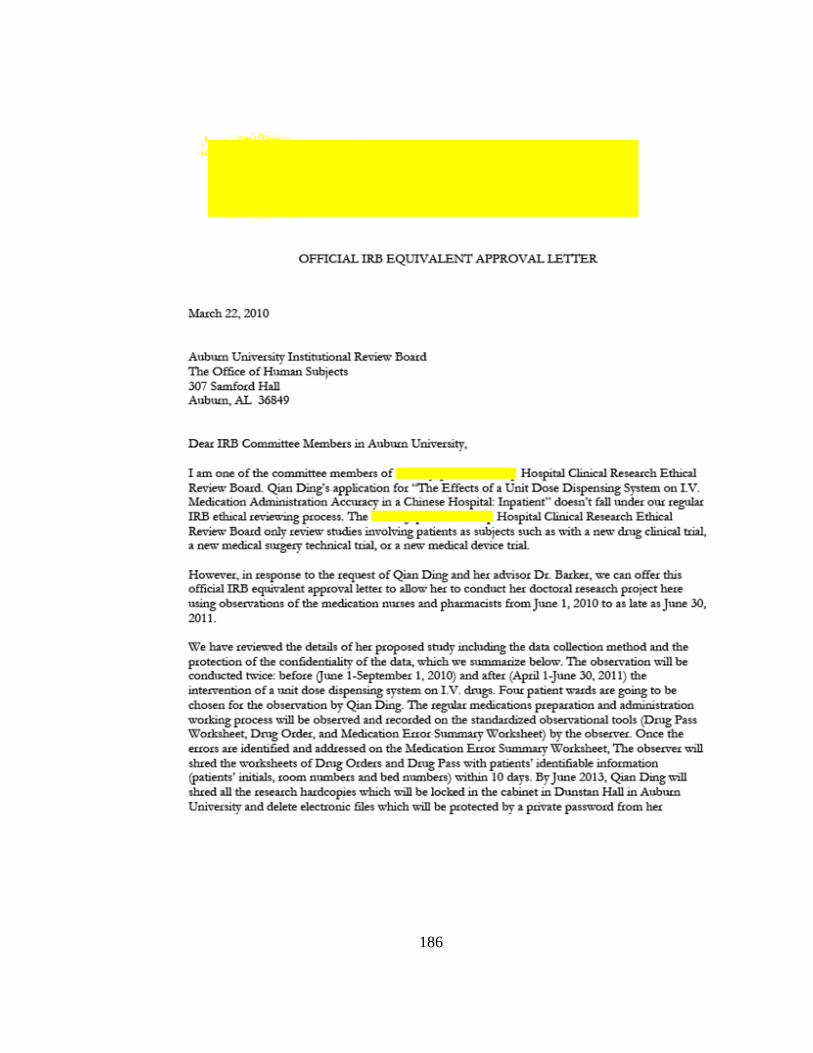
186

187

188
Appendix C: Informed Consent Letter (English and Chinese Versions)
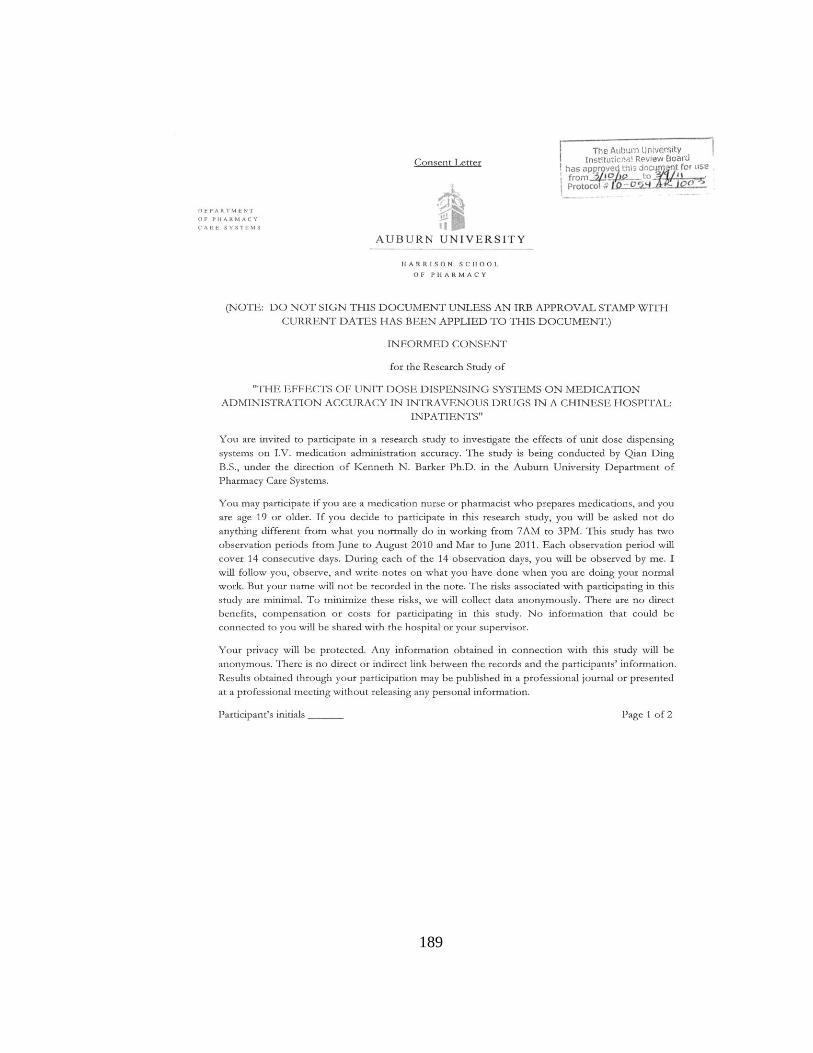
189
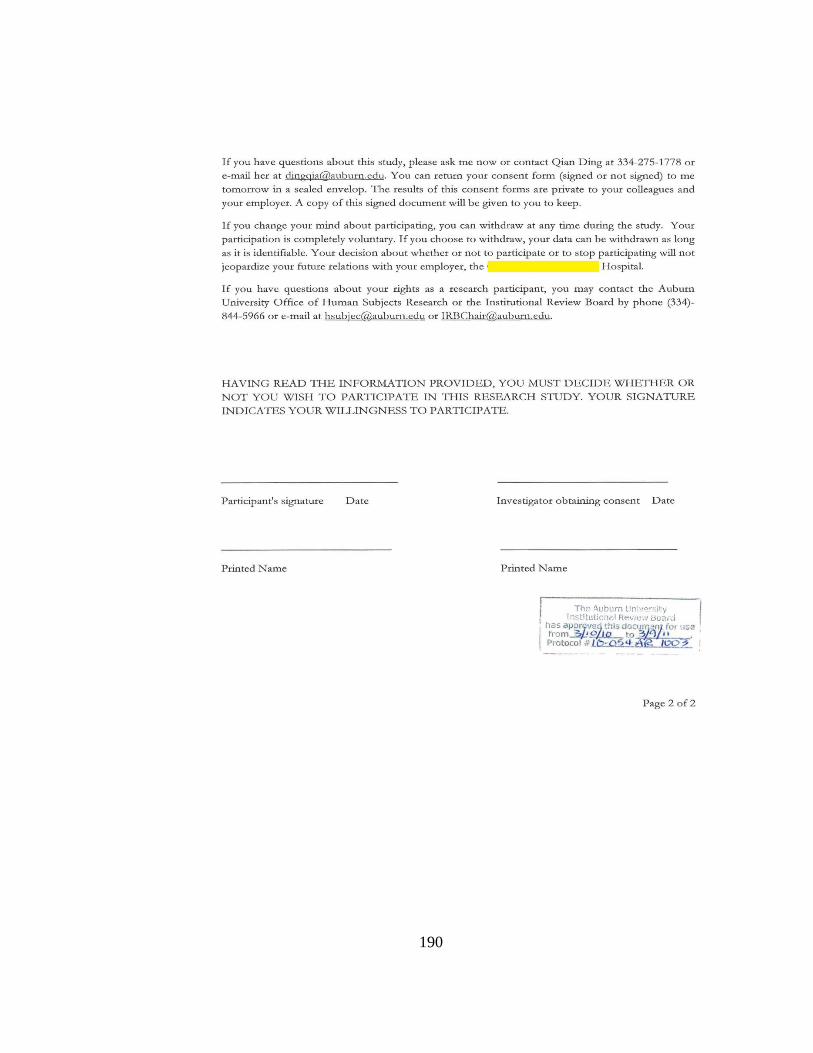
190
191

192

193
Appendix D: Renewed IRB Form
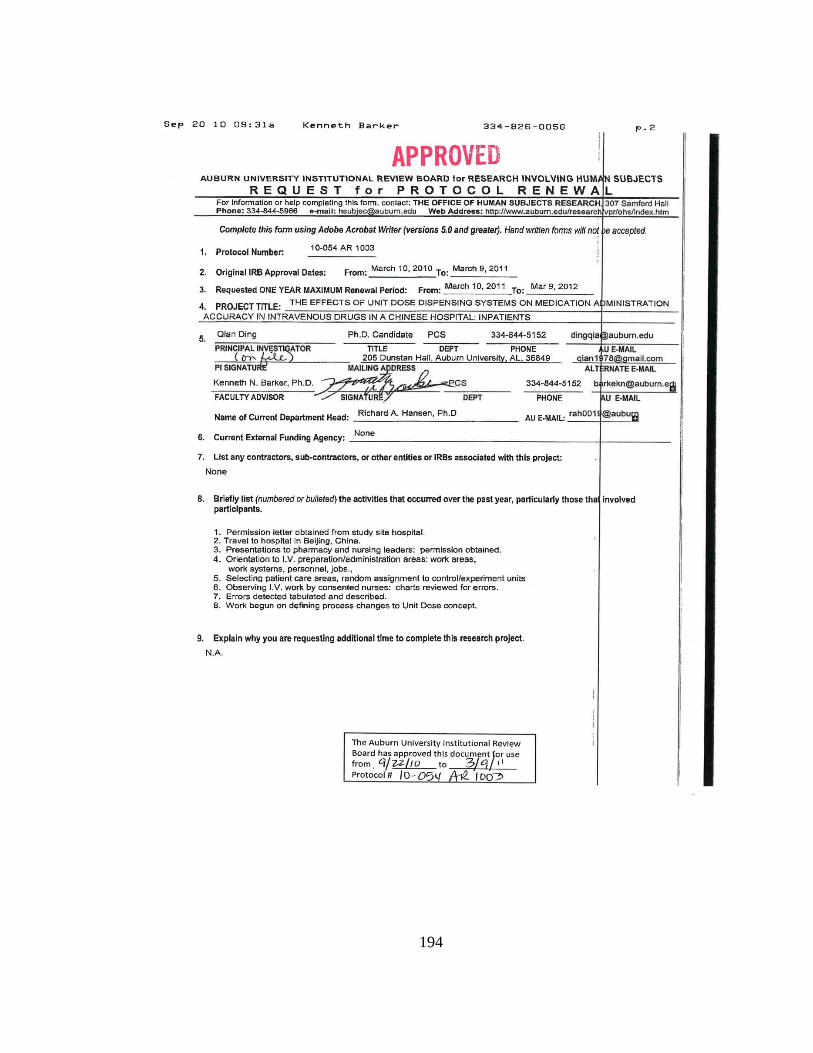
194

195
Appendix E: Data Collection Forms
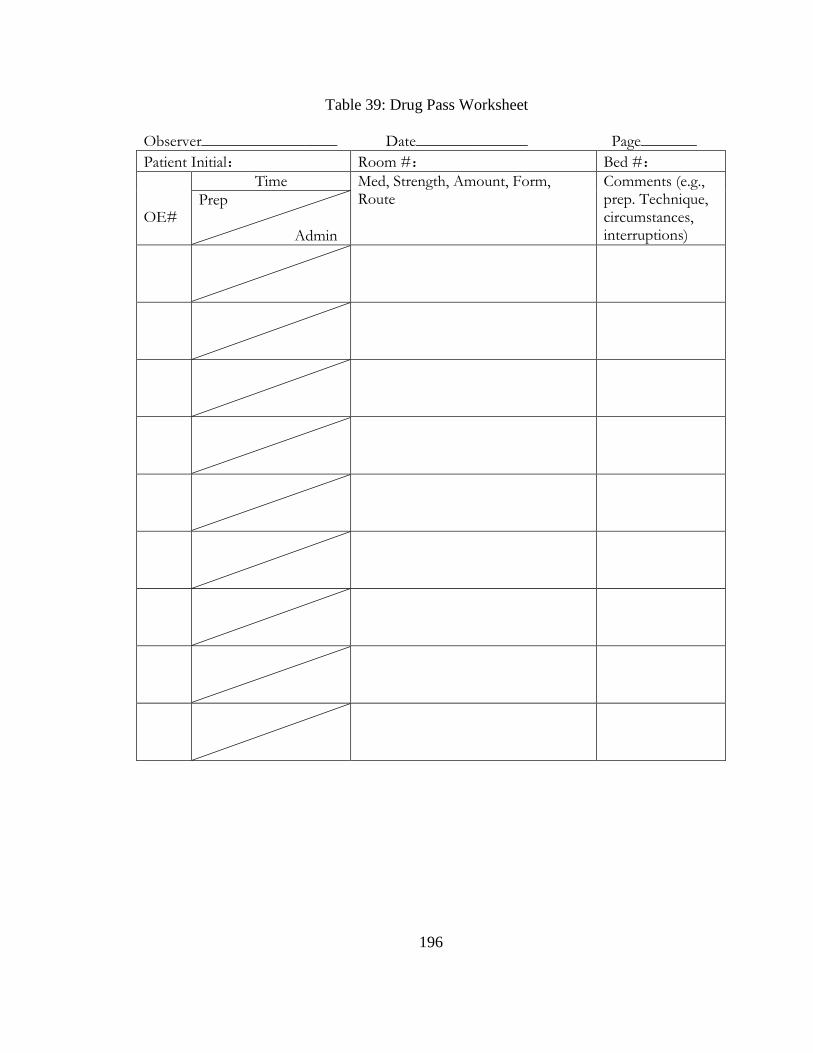
196
Table 39: Drug Pass Worksheet
Observer_________________ Date______________ Page_______
Patient Initial: Room #: Bed #:
OE#
Time Med, Strength, Amount, Form, Route
Comments (e.g., prep. Technique, circumstances, interruptions)
Prep Admin

197
Table 40: Drug Order Worksheet
Observer_________________ Date______________
Page_______
Patient Initial: Room # Bed #
OE# Date, time of the order
Med, strength, amount, form, instructions
Time dose due
Drug allergies: ________________________________________________
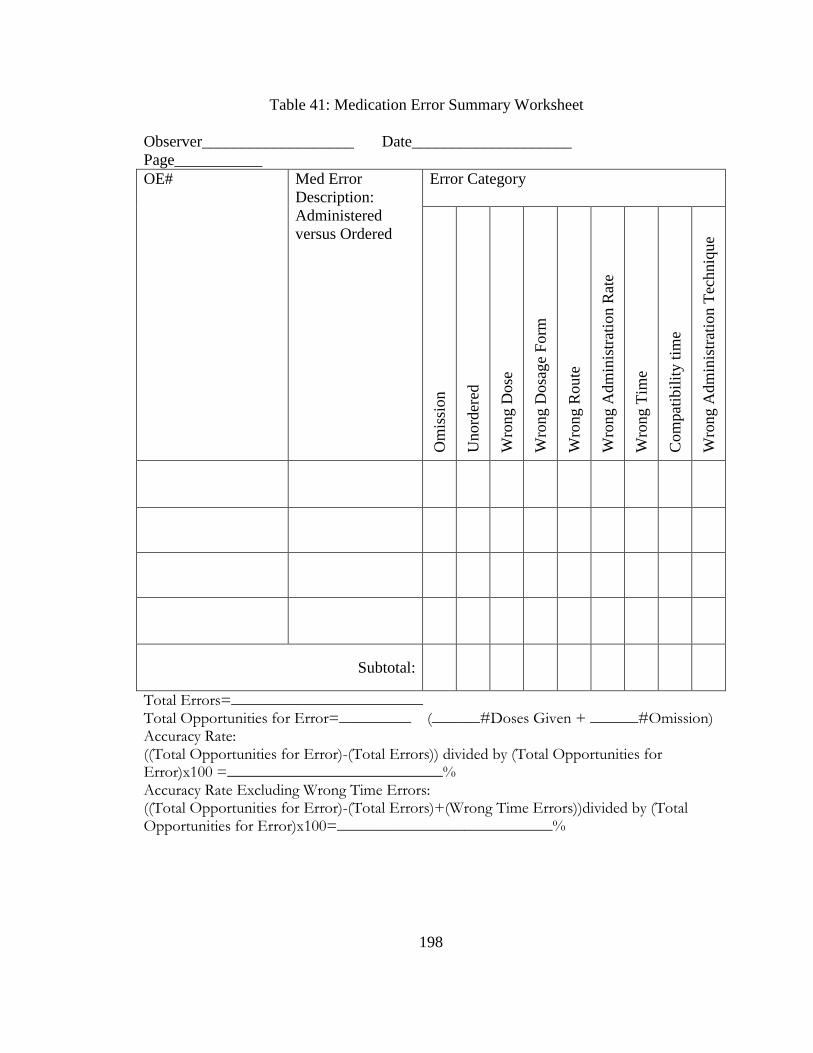
198
Table 41: Medication Error Summary Worksheet
Observer___________________ Date____________________
Page___________
OE# Med Error
Description:
Administered
versus Ordered
Error Category
Om
issi
on
Unord
ered
Wro
ng D
ose
Wro
ng D
osa
ge
Form
Wro
ng R
oute
Wro
ng A
dm
inis
trat
ion R
ate
Wro
ng T
ime
Com
pat
ibil
ity t
ime
Wro
ng A
dm
inis
trat
ion T
echniq
ue
Subtotal:
Total Errors=________________________ Total Opportunities for Error=_________ (______#Doses Given + ______#Omission) Accuracy Rate: ((Total Opportunities for Error)-(Total Errors)) divided by (Total Opportunities for Error)x100 =___________________________% Accuracy Rate Excluding Wrong Time Errors: ((Total Opportunities for Error)-(Total Errors)+(Wrong Time Errors))divided by (Total Opportunities for Error)x100=___________________________%

199
Appendix F: SAS Codes

200
SAS Code 1: Analysis of Covariance (ANCOVA)
/*ANCOVA*/
ODS Graphics on;
ODS RTF;
options nodate;
Data Disser_ANCOVA;
Input Group Overall_Before Overall_After WrongDose_Before
WrongDose_After Omission_Before Omission_After;
/*
Adjusted=After(i)-Beta*[Before(i)-Before(mean)]
The coefficient Beta is a weighted average of the slopes of the linear
regression.
To obtain this coefficient, add the solution option to the Model
statement:
Model After = Group Before/solution
*/
Overall_Adjusted=Overall_After-(-0.137579664)*(Overall_Before-5.56);
WrongDose_Adjusted=WrongDose_After-(-0.179758520)*(WrongDose_Before-
3.83);
Omission_Adjusted=Omission_After-0.007073043*(Omission_Before-1.36);
Datalines;
1 30.77 3.70 7.69 0.00 15.38 3.70
1 9.09 14.29 9.09 0.00 0.00 9.52
1 3.23 2.56 3.23 0.00 0.00 2.56
1 5.26 8.00 5.26 4.00 0.00 4.00
1 4.35 8.00 4.35 8.00 0.00 0.00
1 10.00 11.36 0.00 2.27 10.00 9.09
1 0.00 15.00 0.00 7.50 0.00 7.50
1 6.67 3.03 6.67 3.03 0.00 0.00
1 6.67 19.44 6.67 2.78 0.00 16.67
1 0.00 8.57 0.00 2.86 0.00 2.86
1 0.00 . 0.00 . 0.00 .
2 0.00 0.00 0.00 0.00 0.00 0.00
2 12.00 2.04 12.00 0.00 0.00 2.04
2 4.00 0.00 4.00 0.00 0.00 0.00
2 3.45 0.00 3.45 0.00 0.00 0.00
2 2.86 2.63 2.86 0.00 0.00 2.63
2 3.23 0.00 0.00 0.00 3.23 0.00
2 3.23 0.00 3.23 0.00 0.00 0.00
2 4.55 5.26 4.55 0.00 0.00 5.26
2 3.70 2.27 3.70 0.00 0.00 2.27
2 3.70 0.00 3.70 0.00 0.00 0.00
;
run;
Proc Format;
Value Group 1='Control Group'
2='Experimental Group';
run;
/*Medication Error Rate Overall*/
/*Scatter Plot of the Slope between Pre and Post Test*/
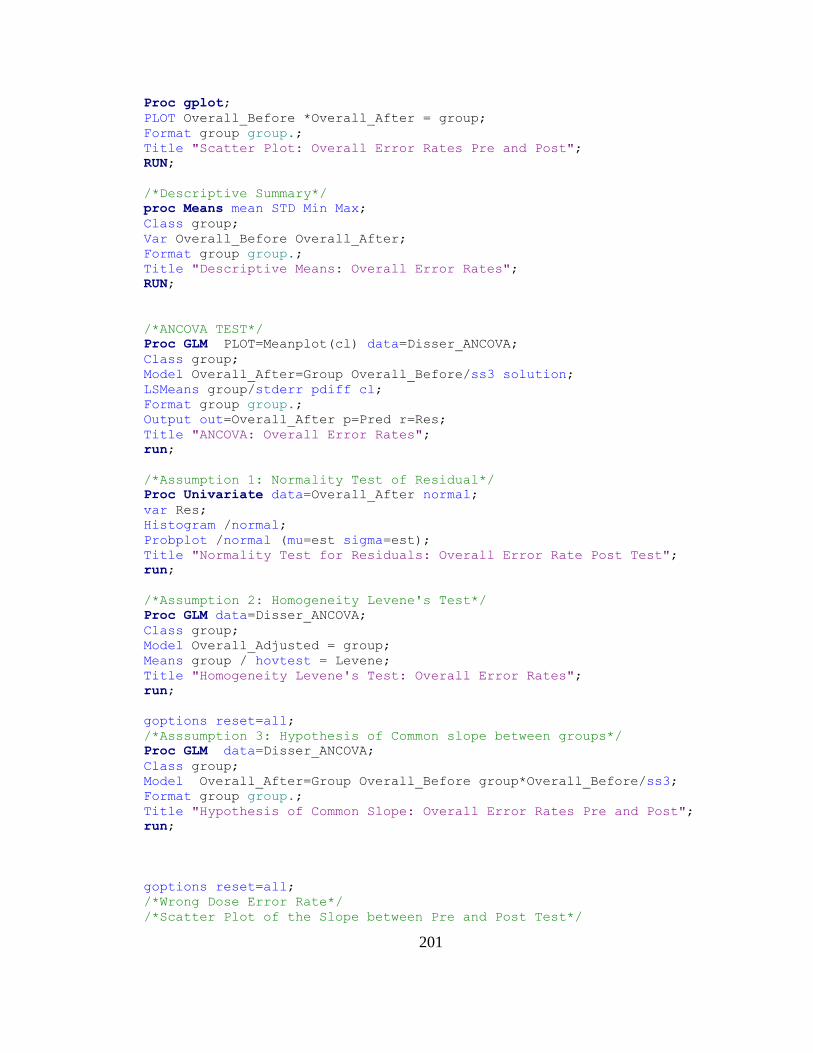
201
Proc gplot;
PLOT Overall_Before *Overall_After = group;
Format group group.;
Title "Scatter Plot: Overall Error Rates Pre and Post";
RUN;
/*Descriptive Summary*/
proc Means mean STD Min Max;
Class group;
Var Overall_Before Overall_After;
Format group group.;
Title "Descriptive Means: Overall Error Rates";
RUN;
/*ANCOVA TEST*/
Proc GLM PLOT=Meanplot(cl) data=Disser_ANCOVA;
Class group;
Model Overall_After=Group Overall_Before/ss3 solution;
LSMeans group/stderr pdiff cl;
Format group group.;
Output out=Overall_After p=Pred r=Res;
Title "ANCOVA: Overall Error Rates";
run;
/*Assumption 1: Normality Test of Residual*/
Proc Univariate data=Overall_After normal;
var Res;
Histogram /normal;
Probplot /normal (mu=est sigma=est);
Title "Normality Test for Residuals: Overall Error Rate Post Test";
run;
/*Assumption 2: Homogeneity Levene's Test*/
Proc GLM data=Disser_ANCOVA;
Class group;
Model Overall_Adjusted = group;
Means group / hovtest = Levene;
Title "Homogeneity Levene's Test: Overall Error Rates";
run;
goptions reset=all;
/*Asssumption 3: Hypothesis of Common slope between groups*/
Proc GLM data=Disser_ANCOVA;
Class group;
Model Overall_After=Group Overall_Before group*Overall_Before/ss3;
Format group group.;
Title "Hypothesis of Common Slope: Overall Error Rates Pre and Post";
run;
goptions reset=all;
/*Wrong Dose Error Rate*/
/*Scatter Plot of the Slope between Pre and Post Test*/
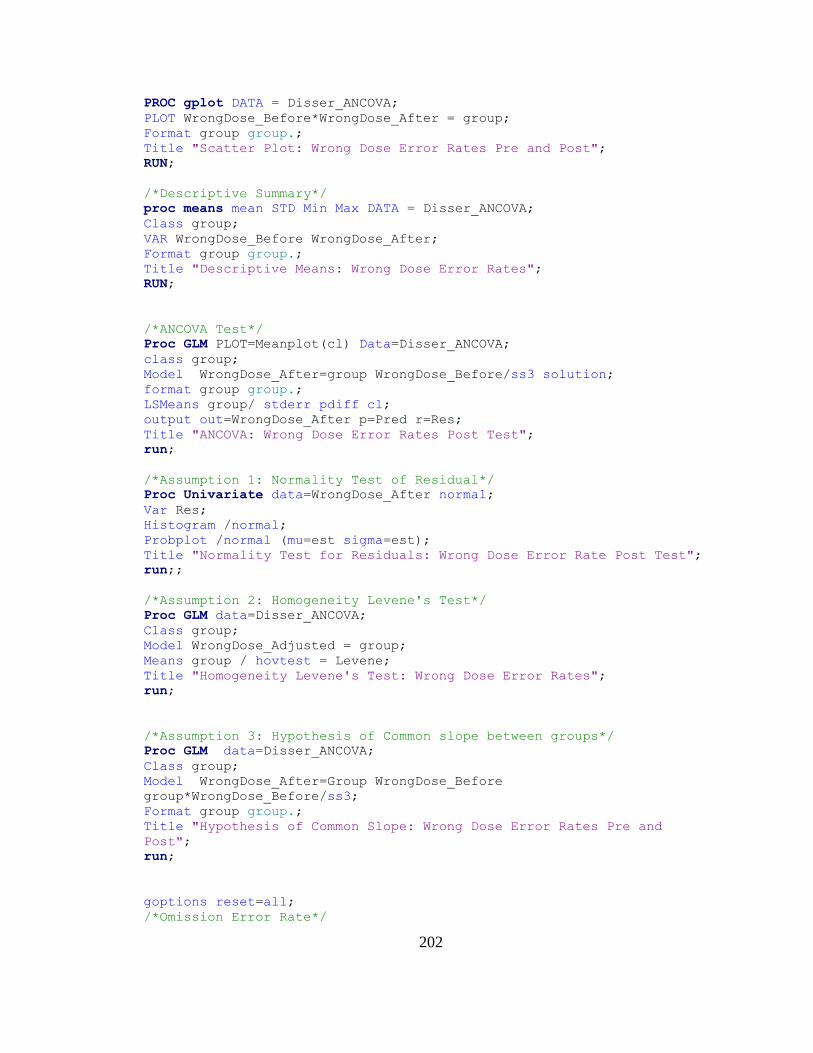
202
PROC gplot DATA = Disser_ANCOVA;
PLOT WrongDose_Before*WrongDose_After = group;
Format group group.;
Title "Scatter Plot: Wrong Dose Error Rates Pre and Post";
RUN;
/*Descriptive Summary*/
proc means mean STD Min Max DATA = Disser_ANCOVA;
Class group;
VAR WrongDose_Before WrongDose_After;
Format group group.;
Title "Descriptive Means: Wrong Dose Error Rates";
RUN;
/*ANCOVA Test*/
Proc GLM PLOT=Meanplot(cl) Data=Disser_ANCOVA;
class group;
Model WrongDose_After=group WrongDose_Before/ss3 solution;
format group group.;
LSMeans group/ stderr pdiff cl;
output out=WrongDose_After p=Pred r=Res;
Title "ANCOVA: Wrong Dose Error Rates Post Test";
run;
/*Assumption 1: Normality Test of Residual*/
Proc Univariate data=WrongDose_After normal;
Var Res;
Histogram /normal;
Probplot /normal (mu=est sigma=est);
Title "Normality Test for Residuals: Wrong Dose Error Rate Post Test";
run;;
/*Assumption 2: Homogeneity Levene's Test*/
Proc GLM data=Disser_ANCOVA;
Class group;
Model WrongDose_Adjusted = group;
Means group / hovtest = Levene;
Title "Homogeneity Levene's Test: Wrong Dose Error Rates";
run;
/*Assumption 3: Hypothesis of Common slope between groups*/
Proc GLM data=Disser_ANCOVA;
Class group;
Model WrongDose_After=Group WrongDose_Before
group*WrongDose_Before/ss3;
Format group group.;
Title "Hypothesis of Common Slope: Wrong Dose Error Rates Pre and
Post";
run;
goptions reset=all;
/*Omission Error Rate*/

203
/*Scatter Plot of the Slope between Pre and Post Test*/
PROC gplot DATA = Disser_ANCOVA;
Plot Omission_Before*Omission_After = group;
format group group.;
Title "Scatter Plot: Omission Error Rates Pre and Post";
RUN;
/*Descriptive Summary*/
proc means mean STD Min Max DATA = Disser_ANCOVA;
Class group;
VAR Omission_Before Omission_After;
Format group group.;
Title "Descriptive Means: Omission Error Rates";
RUN;
/*ANCOVA Test*/
Proc GLM PLOT=Meanplot(cl) Data=Disser_ANCOVA;
Class group;
Model Omission_After=group Omission_Before/ss3 solution;
format group group.;
LSMeans group/ stderr pdiff cl;
Output out=Omission_After p=Pred r=Res;
Title "ANCOVA: Omission Error Rates Post Test";
run;
/*Assumption 1: Normality Test of Residual*/
Proc Univariate data=Omission_After normal;
Var Res;
Histogram /normal;
Probplot /normal (mu=est sigma=est);
Title "Normality Test for Residuals: Omission Error Rate Post Test";
run;
/*Assumption 2: Homogeneity Levene's Test*/
Proc GLM data=Disser_ANCOVA;
Class group;
Model Omission_Adjusted = group;
Means group / hovtest = Levene;
Title "Homogeneity Levene's Test: Omission Error Rates";
run;
/*Assumption 3: Hypothesis of Common slope between groups*/
Proc GLM data=Disser_ANCOVA;
Class group;
Model Omission_After=Group Omission_Before group*Omission_Before/ss3;
Format group group.;
Title "Hypothesis of Common Slope: Omission Error Rates Pre and Post";
run;
ODS Graphics off;
ODS RTF close;
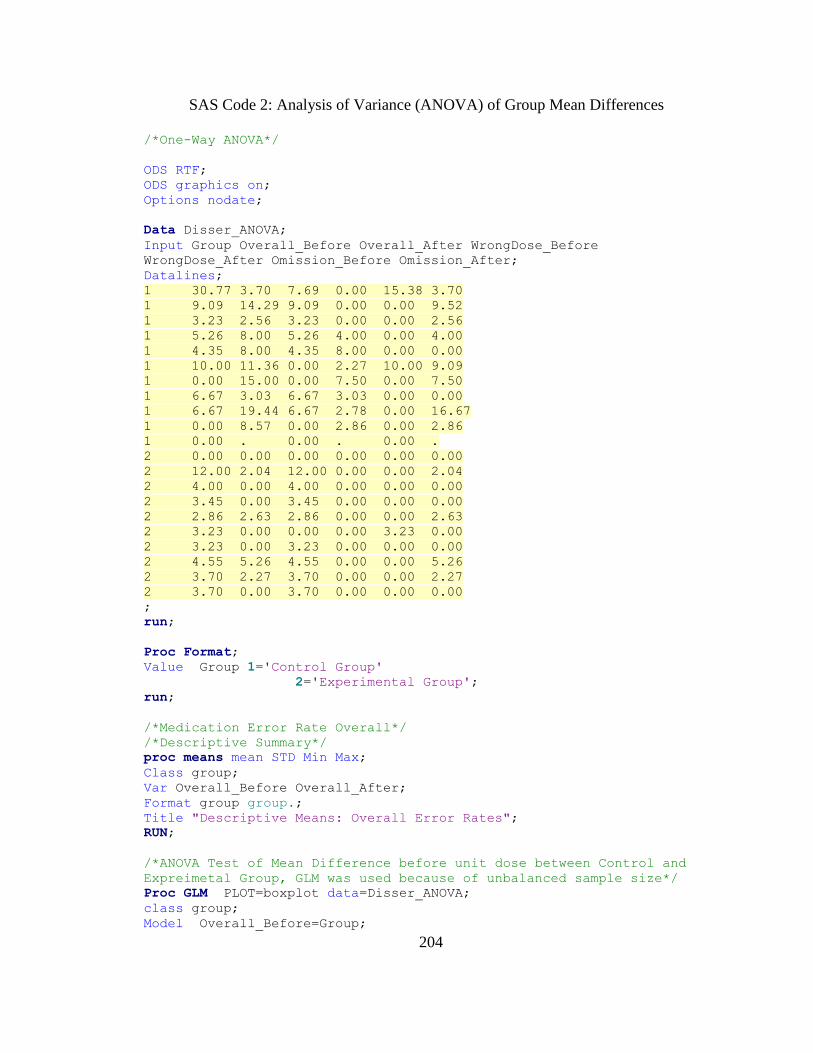
204
SAS Code 2: Analysis of Variance (ANOVA) of Group Mean Differences
/*One-Way ANOVA*/
ODS RTF;
ODS graphics on;
Options nodate;
Data Disser_ANOVA;
Input Group Overall_Before Overall_After WrongDose_Before
WrongDose_After Omission_Before Omission_After;
Datalines;
1 30.77 3.70 7.69 0.00 15.38 3.70
1 9.09 14.29 9.09 0.00 0.00 9.52
1 3.23 2.56 3.23 0.00 0.00 2.56
1 5.26 8.00 5.26 4.00 0.00 4.00
1 4.35 8.00 4.35 8.00 0.00 0.00
1 10.00 11.36 0.00 2.27 10.00 9.09
1 0.00 15.00 0.00 7.50 0.00 7.50
1 6.67 3.03 6.67 3.03 0.00 0.00
1 6.67 19.44 6.67 2.78 0.00 16.67
1 0.00 8.57 0.00 2.86 0.00 2.86
1 0.00 . 0.00 . 0.00 .
2 0.00 0.00 0.00 0.00 0.00 0.00
2 12.00 2.04 12.00 0.00 0.00 2.04
2 4.00 0.00 4.00 0.00 0.00 0.00
2 3.45 0.00 3.45 0.00 0.00 0.00
2 2.86 2.63 2.86 0.00 0.00 2.63
2 3.23 0.00 0.00 0.00 3.23 0.00
2 3.23 0.00 3.23 0.00 0.00 0.00
2 4.55 5.26 4.55 0.00 0.00 5.26
2 3.70 2.27 3.70 0.00 0.00 2.27
2 3.70 0.00 3.70 0.00 0.00 0.00
;
run;
Proc Format;
Value Group 1='Control Group'
2='Experimental Group';
run;
/*Medication Error Rate Overall*/
/*Descriptive Summary*/
proc means mean STD Min Max;
Class group;
Var Overall_Before Overall_After;
Format group group.;
Title "Descriptive Means: Overall Error Rates";
RUN;
/*ANOVA Test of Mean Difference before unit dose between Control and
Expreimetal Group, GLM was used because of unbalanced sample size*/
Proc GLM PLOT=boxplot data=Disser_ANOVA;
class group;
Model Overall_Before=Group;
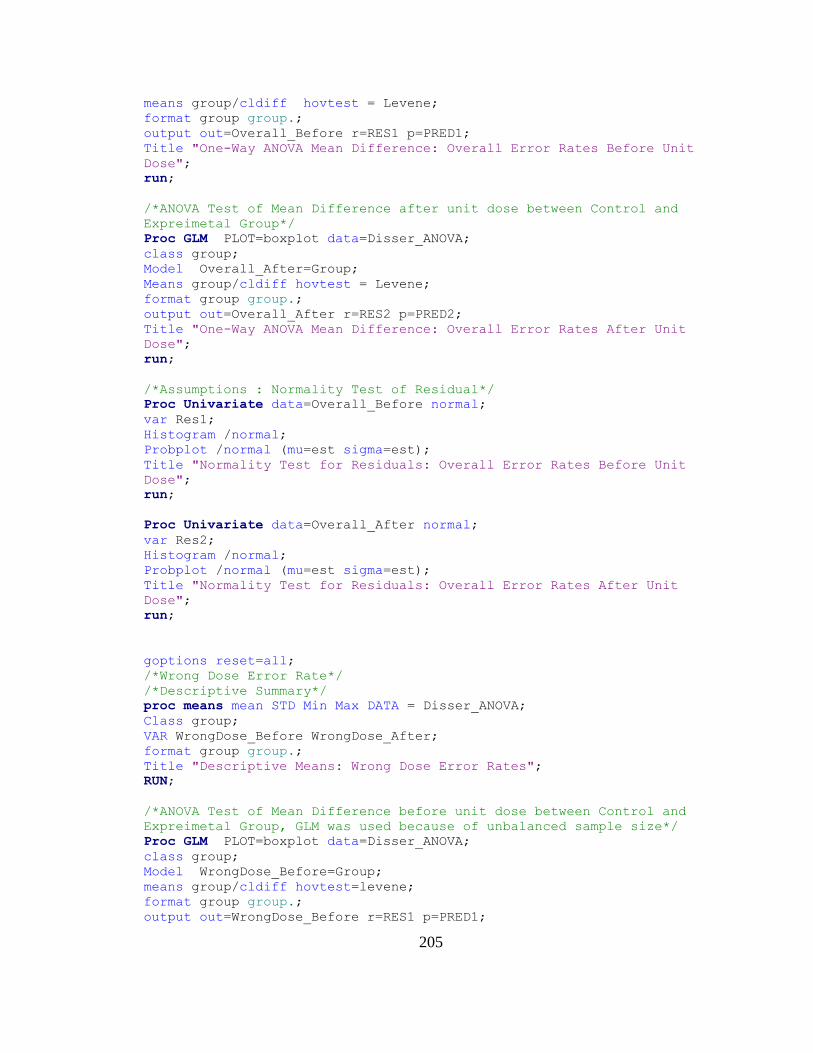
205
means group/cldiff hovtest = Levene;
format group group.;
output out=Overall_Before r=RES1 p=PRED1;
Title "One-Way ANOVA Mean Difference: Overall Error Rates Before Unit
Dose";
run;
/*ANOVA Test of Mean Difference after unit dose between Control and
Expreimetal Group*/
Proc GLM PLOT=boxplot data=Disser_ANOVA;
class group;
Model Overall_After=Group;
Means group/cldiff hovtest = Levene;
format group group.;
output out=Overall_After r=RES2 p=PRED2;
Title "One-Way ANOVA Mean Difference: Overall Error Rates After Unit
Dose";
run;
/*Assumptions : Normality Test of Residual*/
Proc Univariate data=Overall_Before normal;
var Res1;
Histogram /normal;
Probplot /normal (mu=est sigma=est);
Title "Normality Test for Residuals: Overall Error Rates Before Unit
Dose";
run;
Proc Univariate data=Overall_After normal;
var Res2;
Histogram /normal;
Probplot /normal (mu=est sigma=est);
Title "Normality Test for Residuals: Overall Error Rates After Unit
Dose";
run;
goptions reset=all;
/*Wrong Dose Error Rate*/
/*Descriptive Summary*/
proc means mean STD Min Max DATA = Disser_ANOVA;
Class group;
VAR WrongDose_Before WrongDose_After;
format group group.;
Title "Descriptive Means: Wrong Dose Error Rates";
RUN;
/*ANOVA Test of Mean Difference before unit dose between Control and
Expreimetal Group, GLM was used because of unbalanced sample size*/
Proc GLM PLOT=boxplot data=Disser_ANOVA;
class group;
Model WrongDose_Before=Group;
means group/cldiff hovtest=levene;
format group group.;
output out=WrongDose_Before r=RES1 p=PRED1;
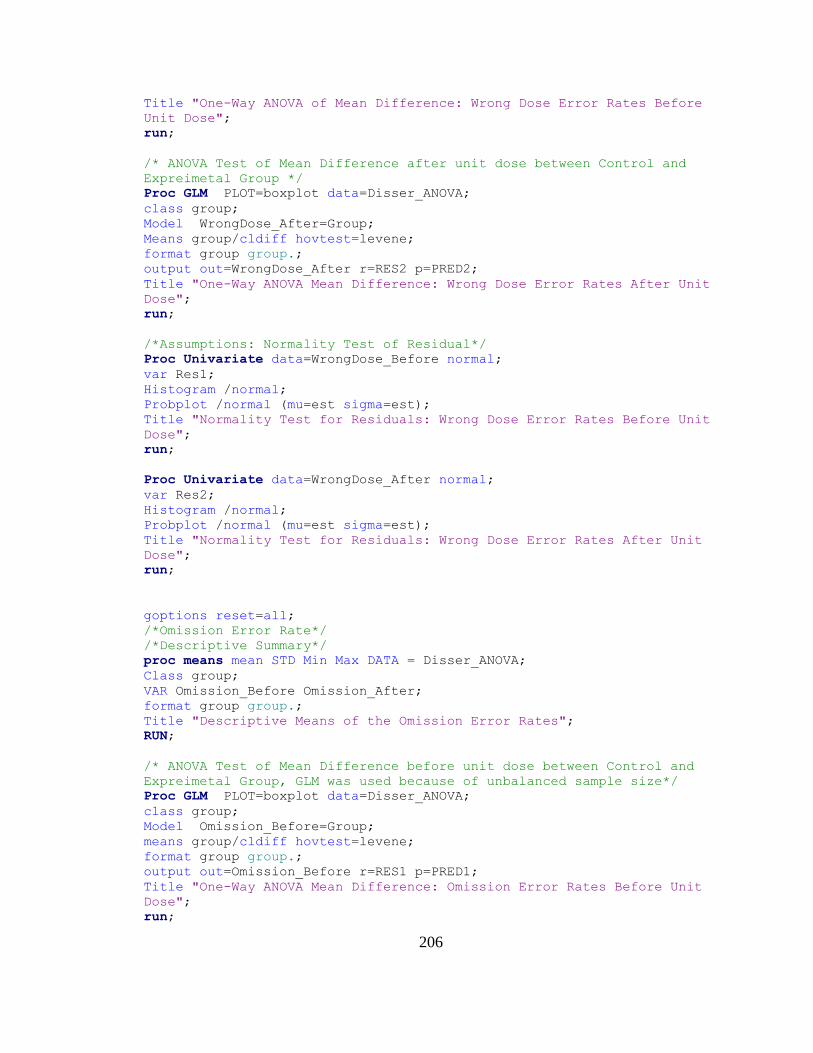
206
Title "One-Way ANOVA of Mean Difference: Wrong Dose Error Rates Before
Unit Dose";
run;
/* ANOVA Test of Mean Difference after unit dose between Control and
Expreimetal Group */
Proc GLM PLOT=boxplot data=Disser_ANOVA;
class group;
Model WrongDose_After=Group;
Means group/cldiff hovtest=levene;
format group group.;
output out=WrongDose_After r=RES2 p=PRED2;
Title "One-Way ANOVA Mean Difference: Wrong Dose Error Rates After Unit
Dose";
run;
/*Assumptions: Normality Test of Residual*/
Proc Univariate data=WrongDose_Before normal;
var Res1;
Histogram /normal;
Probplot /normal (mu=est sigma=est);
Title "Normality Test for Residuals: Wrong Dose Error Rates Before Unit
Dose";
run;
Proc Univariate data=WrongDose_After normal;
var Res2;
Histogram /normal;
Probplot /normal (mu=est sigma=est);
Title "Normality Test for Residuals: Wrong Dose Error Rates After Unit
Dose";
run;
goptions reset=all;
/*Omission Error Rate*/
/*Descriptive Summary*/
proc means mean STD Min Max DATA = Disser_ANOVA;
Class group;
VAR Omission_Before Omission_After;
format group group.;
Title "Descriptive Means of the Omission Error Rates";
RUN;
/* ANOVA Test of Mean Difference before unit dose between Control and
Expreimetal Group, GLM was used because of unbalanced sample size*/
Proc GLM PLOT=boxplot data=Disser_ANOVA;
class group;
Model Omission_Before=Group;
means group/cldiff hovtest=levene;
format group group.;
output out=Omission_Before r=RES1 p=PRED1;
Title "One-Way ANOVA Mean Difference: Omission Error Rates Before Unit
Dose";
run;
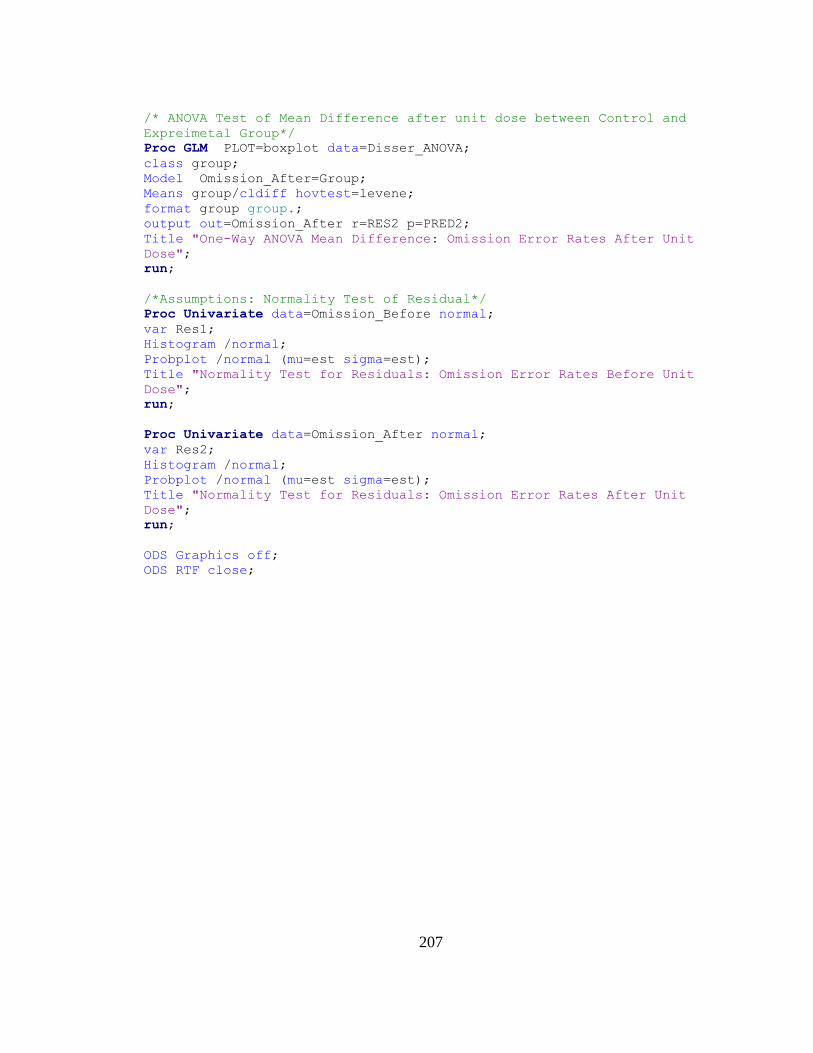
207
/* ANOVA Test of Mean Difference after unit dose between Control and
Expreimetal Group*/
Proc GLM PLOT=boxplot data=Disser_ANOVA;
class group;
Model Omission_After=Group;
Means group/cldiff hovtest=levene;
format group group.;
output out=Omission_After r=RES2 p=PRED2;
Title "One-Way ANOVA Mean Difference: Omission Error Rates After Unit
Dose";
run;
/*Assumptions: Normality Test of Residual*/
Proc Univariate data=Omission_Before normal;
var Res1;
Histogram /normal;
Probplot /normal (mu=est sigma=est);
Title "Normality Test for Residuals: Omission Error Rates Before Unit
Dose";
run;
Proc Univariate data=Omission_After normal;
var Res2;
Histogram /normal;
Probplot /normal (mu=est sigma=est);
Title "Normality Test for Residuals: Omission Error Rates After Unit
Dose";
run;
ODS Graphics off;
ODS RTF close;

208
Appendix G: Medication Error Rates by Each Observational Day
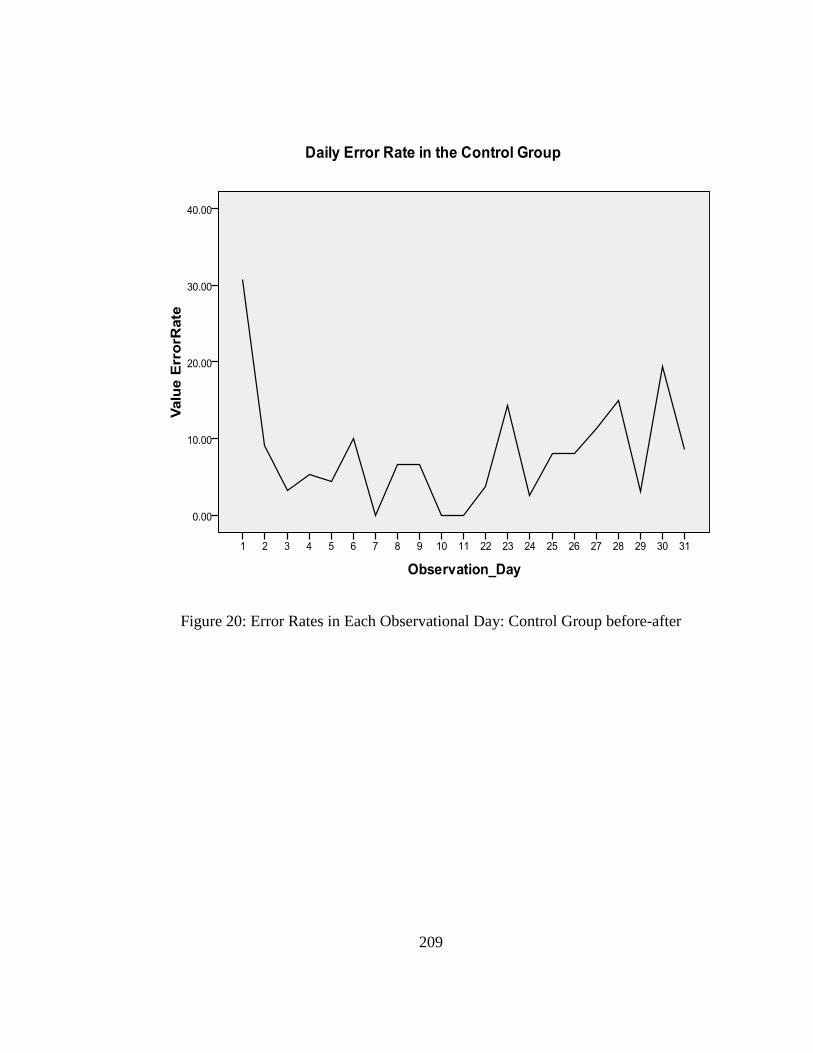
209
Figure 20: Error Rates in Each Observational Day: Control Group before-after
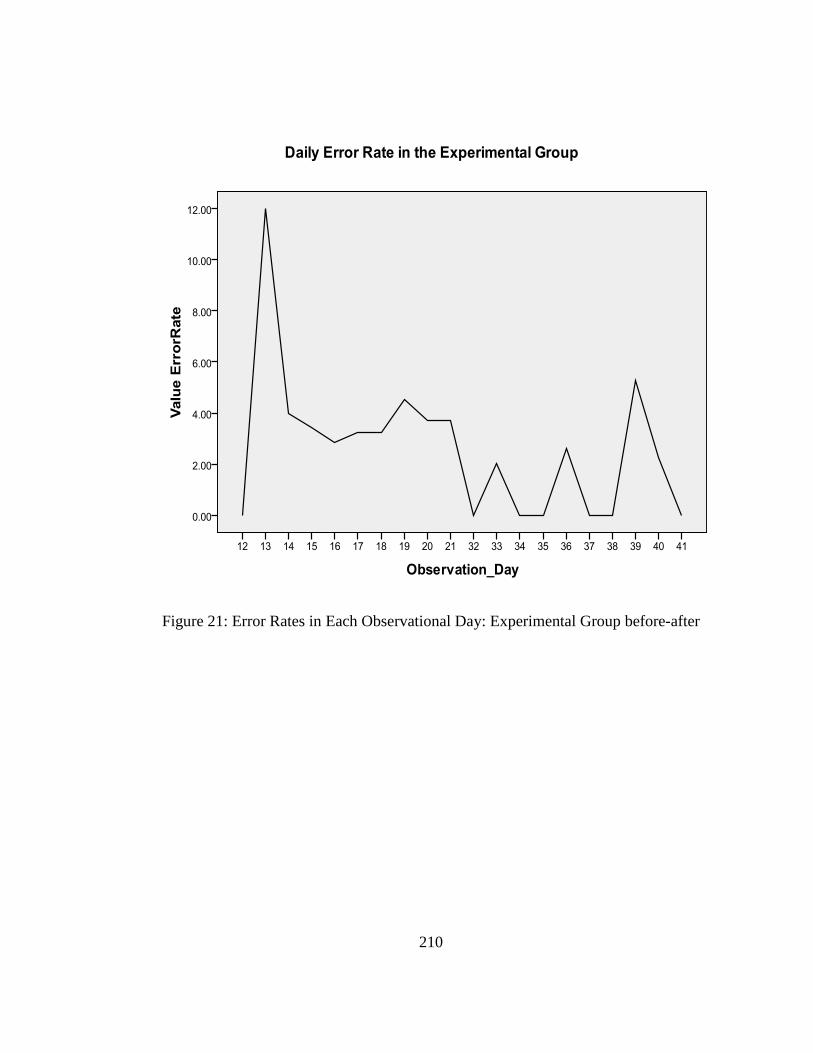
210
Figure 21: Error Rates in Each Observational Day: Experimental Group before-after

211
Appendix H: Figures in the Study
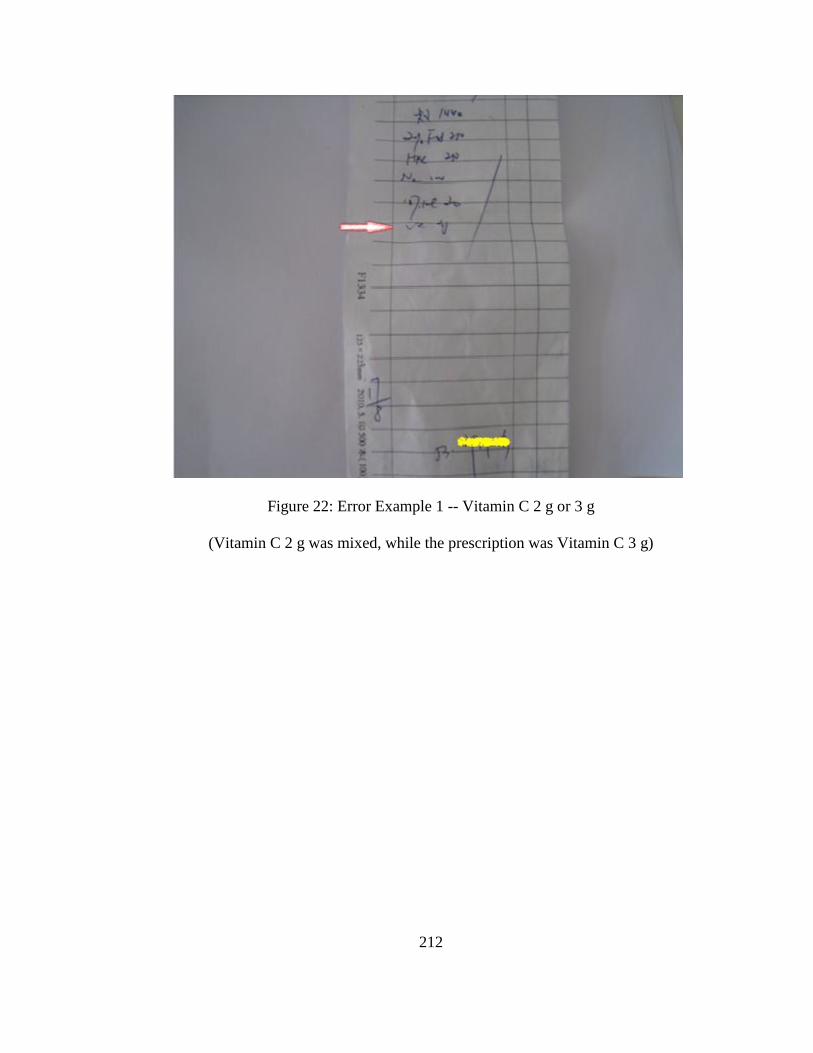
212
Figure 22: Error Example 1 -- Vitamin C 2 g or 3 g
(Vitamin C 2 g was mixed, while the prescription was Vitamin C 3 g)

213
Figure 23: Error Example 2 -- 10% NaCl 10 ampoules or 10 ml
(10% NaCl 10 ml was mixed, while the prescription was 10% NaCl 100 ml)
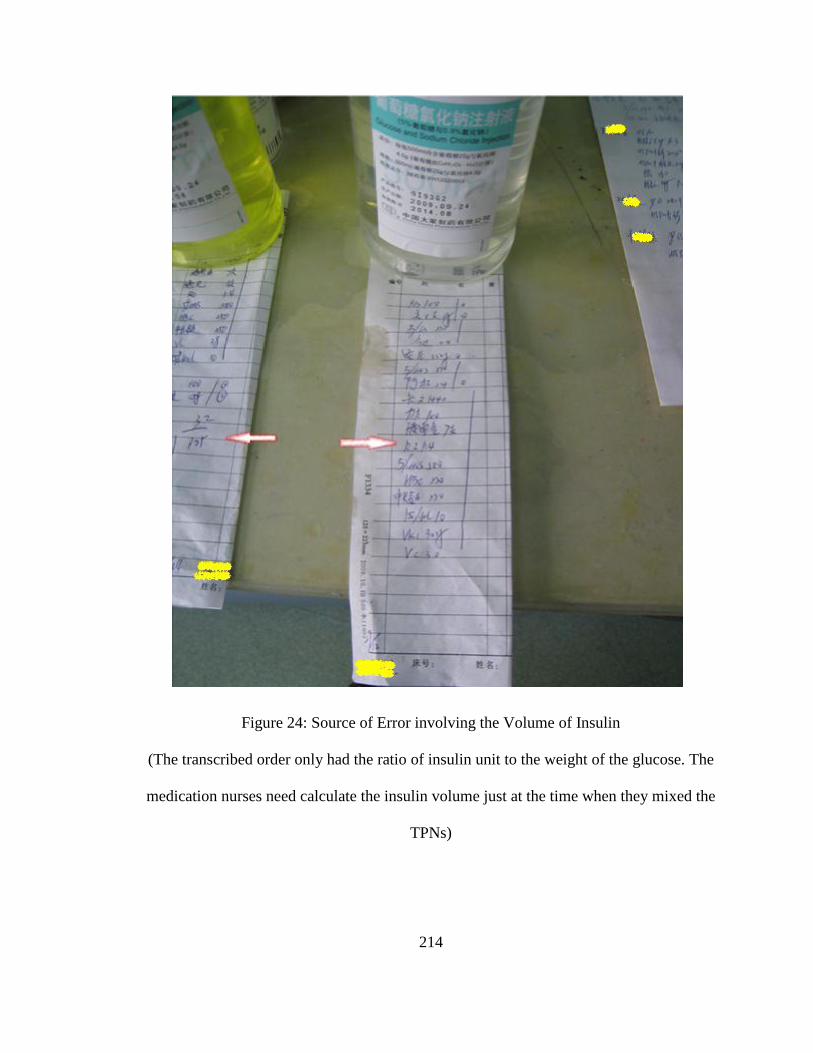
214
Figure 24: Source of Error involving the Volume of Insulin
(The transcribed order only had the ratio of insulin unit to the weight of the glucose. The
medication nurses need calculate the insulin volume just at the time when they mixed the
TPNs)

215
Figure 25: Syringe (1 ml) for Insulin

216
Figure 26: Old Label in the Existing System
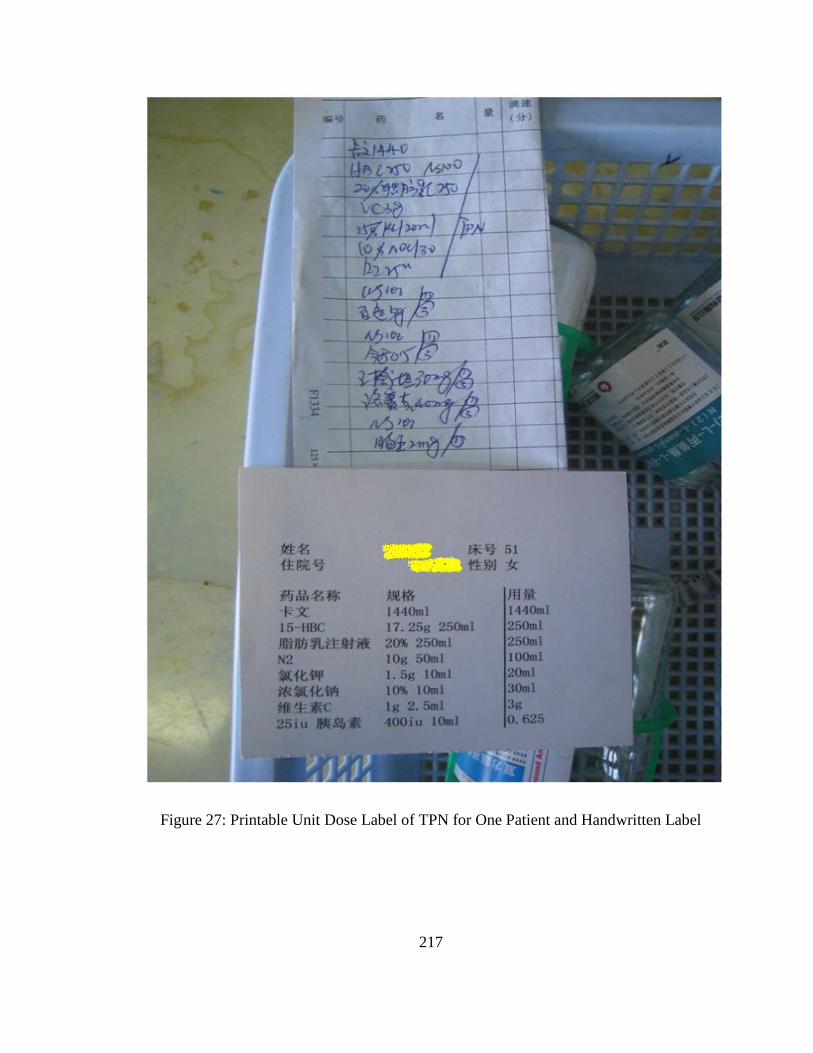
217
Figure 27: Printable Unit Dose Label of TPN for One Patient and Handwritten Label
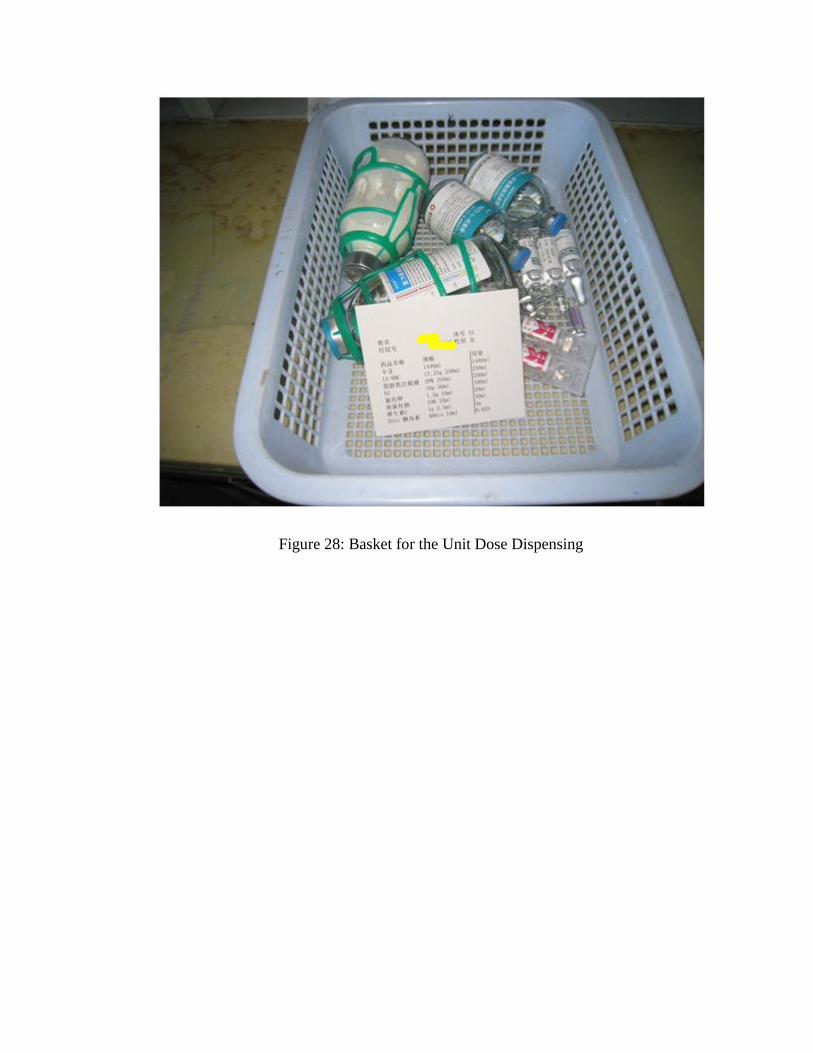
Figure 28: Basket for the Unit Dose Dispensing
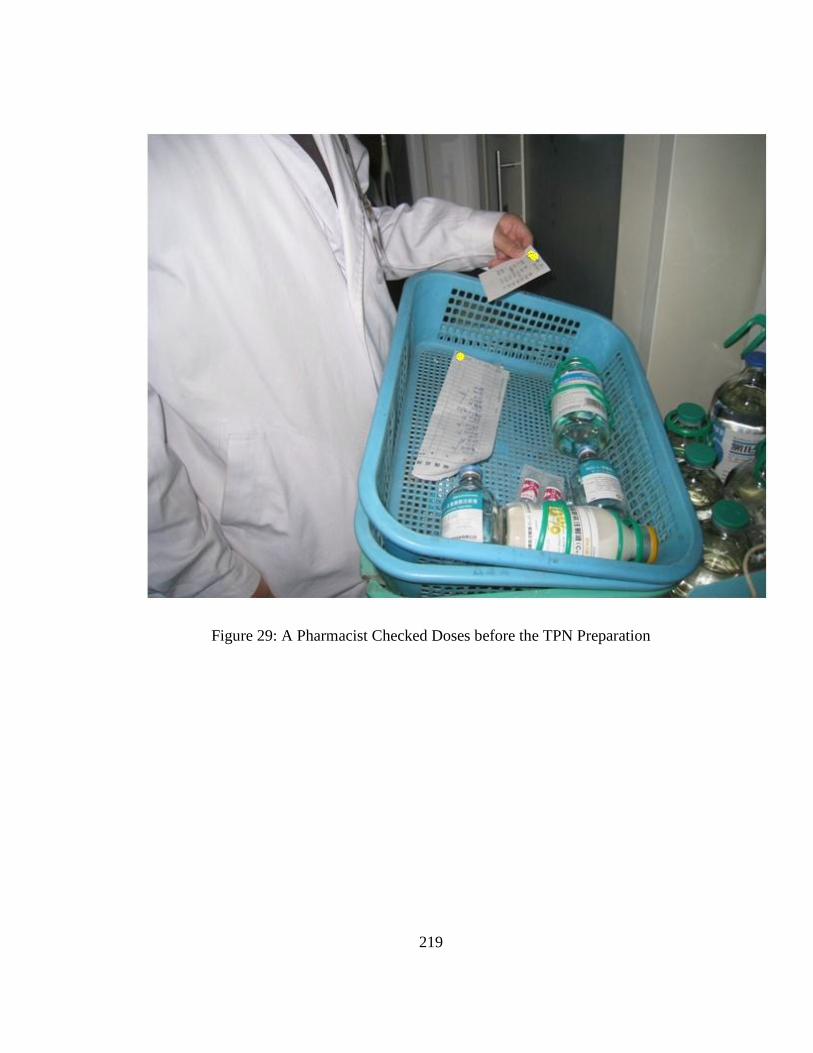
219
Figure 29: A Pharmacist Checked Doses before the TPN Preparation

220
Appendix I: Patients’ TPN File in the Unit Dose System for the Experimental Group
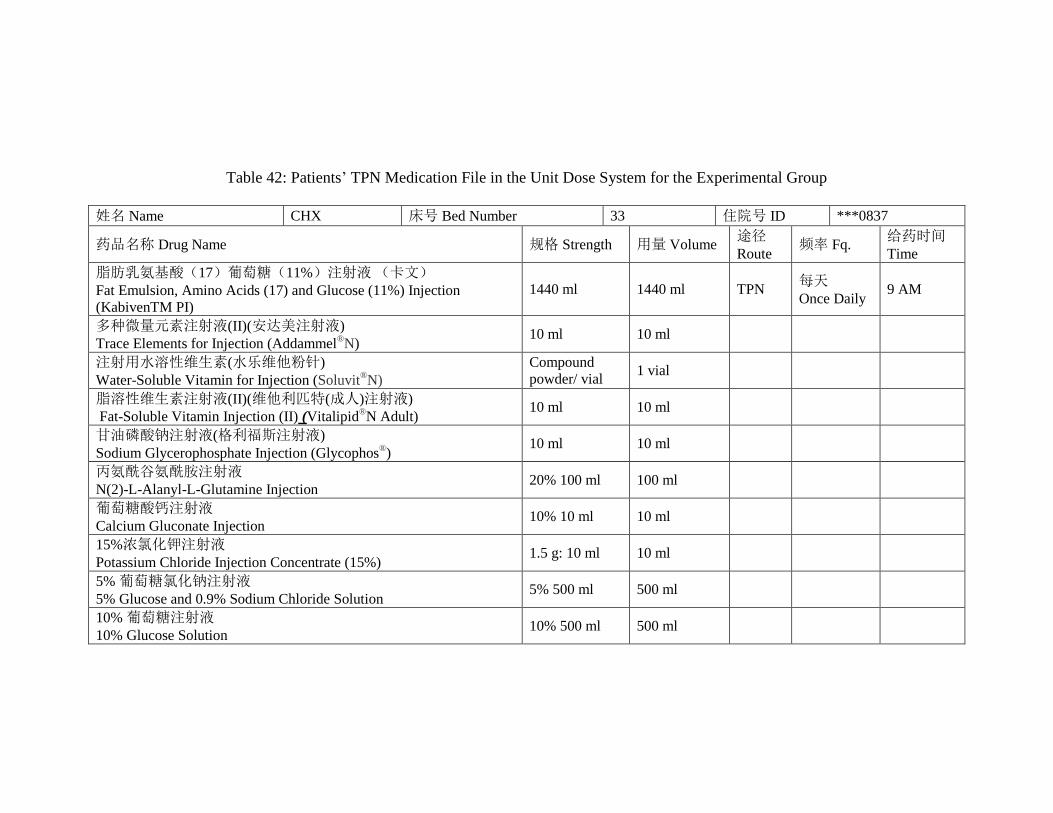
Table 42: Patients’ TPN Medication File in the Unit Dose System for the Experimental Group
姓名 Name CHX 床号 Bed Number 33 住院号 ID ***0837
药品名称 Drug Name 规格 Strength 用量 Volume 途径
Route 频率 Fq.
给药时间
Time
脂肪乳氨基酸(17)葡萄糖(11%)注射液 (卡文)
Fat Emulsion, Amino Acids (17) and Glucose (11%) Injection
(KabivenTM PI)
1440 ml 1440 ml TPN 每天
Once Daily 9 AM
多种微量元素注射液(II)(安达美注射液)
Trace Elements for Injection (Addammel®N)
10 ml 10 ml
注射用水溶性维生素(水乐维他粉针)
Water-Soluble Vitamin for Injection (Soluvit®N)
Compound
powder/ vial 1 vial
脂溶性维生素注射液(II)(维他利匹特(成人)注射液)
Fat-Soluble Vitamin Injection (II) (Vitalipid®N Adult)
10 ml 10 ml
甘油磷酸钠注射液(格利福斯注射液)
Sodium Glycerophosphate Injection (Glycophos®)
10 ml 10 ml
丙氨酰谷氨酰胺注射液
N(2)-L-Alanyl-L-Glutamine Injection 20% 100 ml 100 ml
葡萄糖酸钙注射液
Calcium Gluconate Injection 10% 10 ml 10 ml
15%浓氯化钾注射液
Potassium Chloride Injection Concentrate (15%) 1.5 g: 10 ml 10 ml
5% 葡萄糖氯化钠注射液
5% Glucose and 0.9% Sodium Chloride Solution 5% 500 ml 500 ml
10% 葡萄糖注射液
10% Glucose Solution 10% 500 ml 500 ml
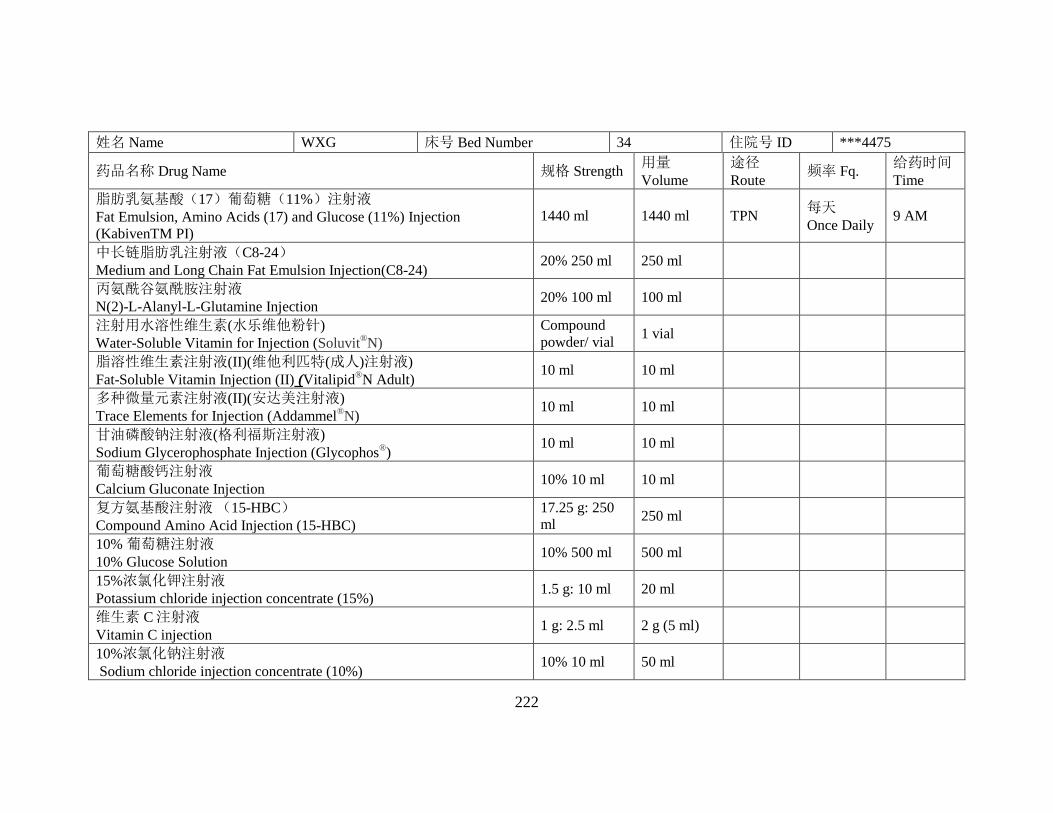
222
姓名 Name WXG 床号 Bed Number 34 住院号 ID ***4475
药品名称 Drug Name 规格 Strength 用量
Volume
途径
Route 频率 Fq.
给药时间
Time
脂肪乳氨基酸(17)葡萄糖(11%)注射液
Fat Emulsion, Amino Acids (17) and Glucose (11%) Injection
(KabivenTM PI)
1440 ml 1440 ml TPN 每天
Once Daily 9 AM
中长链脂肪乳注射液(C8-24)
Medium and Long Chain Fat Emulsion Injection(C8-24) 20% 250 ml 250 ml
丙氨酰谷氨酰胺注射液
N(2)-L-Alanyl-L-Glutamine Injection 20% 100 ml 100 ml
注射用水溶性维生素(水乐维他粉针)
Water-Soluble Vitamin for Injection (Soluvit®N)
Compound
powder/ vial 1 vial
脂溶性维生素注射液(II)(维他利匹特(成人)注射液)
Fat-Soluble Vitamin Injection (II) (Vitalipid®N Adult)
10 ml 10 ml
多种微量元素注射液(II)(安达美注射液)
Trace Elements for Injection (Addammel®N)
10 ml 10 ml
甘油磷酸钠注射液(格利福斯注射液)
Sodium Glycerophosphate Injection (Glycophos®)
10 ml 10 ml
葡萄糖酸钙注射液
Calcium Gluconate Injection 10% 10 ml 10 ml
复方氨基酸注射液 (15-HBC)
Compound Amino Acid Injection (15-HBC)
17.25 g: 250
ml 250 ml
10% 葡萄糖注射液
10% Glucose Solution 10% 500 ml 500 ml
15%浓氯化钾注射液
Potassium chloride injection concentrate (15%) 1.5 g: 10 ml 20 ml
维生素 C 注射液
Vitamin C injection 1 g: 2.5 ml 2 g (5 ml)
10%浓氯化钠注射液
Sodium chloride injection concentrate (10%) 10% 10 ml 50 ml

223
姓名 Name WXF 床号 Bed Number 36 住院号 ID ***2479
药品名称 Drug Name 规格 Strength 用量
Volume
途径
Route 频率 Fq.
给药时间
Time
脂肪乳氨基酸(17)葡萄糖(11%)注射液
Fat Emulsion, Amino Acids (17) and Glucose (11%) Injection
(KabivenTM PI)
1440 ml 1440 ml TPN 每天
Once Daily 9 AM
丙氨酰谷氨酰胺注射液
N(2)-L-Alanyl-L-Glutamine Injection 10 g: 50 ml 100 ml
注射用水溶性维生素(水乐维他粉针)
Water-Soluble Vitamin for Injection (Soluvit®N)
Compounded
powder/ vial 1 vial
多种微量元素注射液(II)(安达美注射液)
Trace Elements for Injection (Addammel®N)
10 ml 10 ml
甘油磷酸钠注射液(格利福斯注射液)
Sodium Glycerophosphate Injection (Glycophos®)
10 ml 10 ml
脂溶性维生素注射液(II)(维他利匹特(成人)注射液)
Fat-Soluble Vitamin Injection (II) (Vitalipid®N Adult)
10 ml 10 ml
注射用复合辅酶
Coenzyme Complex for Injection 200 IU
200 iu : 0.2
mg
200 iu
(0.2 mg)
15%浓氯化钾注射液
Potassium chloride injection concentrate (15%) 1.5 g: 10 ml 20 ml
10%浓氯化钠注射液
Sodium chloride injection concentrate (10%)
10% 10 ml 20 ml
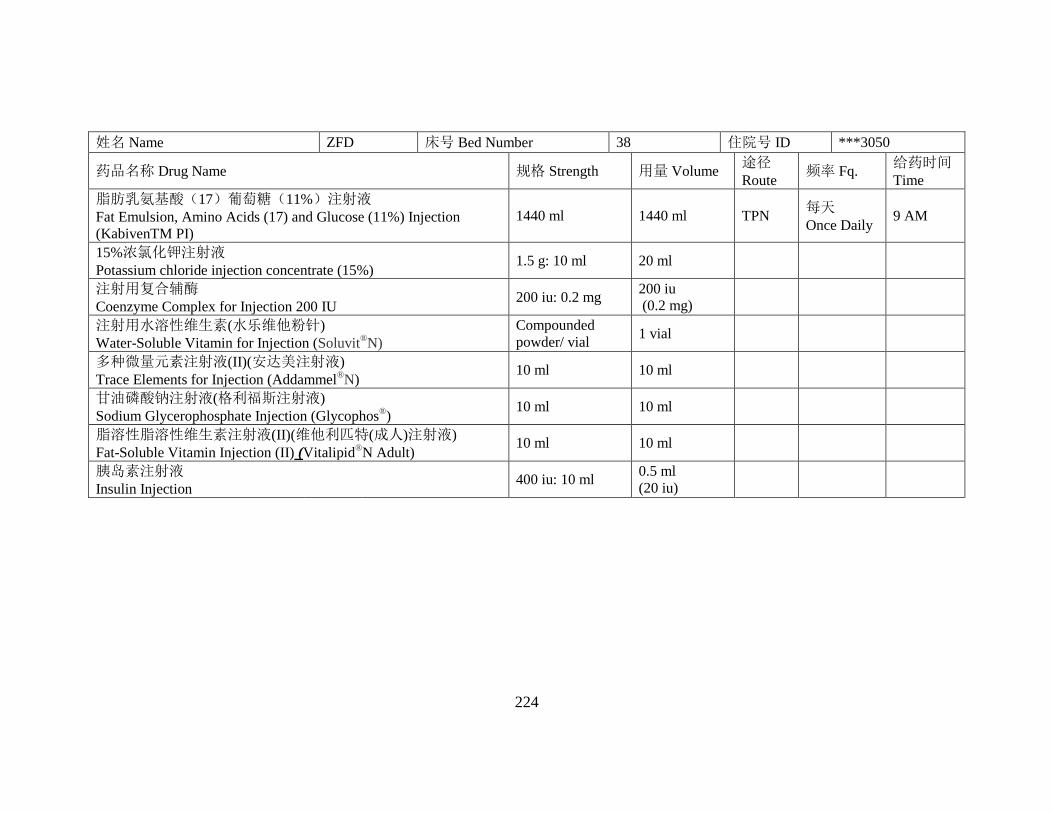
224
姓名 Name ZFD 床号 Bed Number 38 住院号 ID ***3050
药品名称 Drug Name 规格 Strength 用量 Volume 途径
Route 频率 Fq.
给药时间
Time
脂肪乳氨基酸(17)葡萄糖(11%)注射液
Fat Emulsion, Amino Acids (17) and Glucose (11%) Injection
(KabivenTM PI)
1440 ml 1440 ml TPN 每天
Once Daily 9 AM
15%浓氯化钾注射液
Potassium chloride injection concentrate (15%) 1.5 g: 10 ml 20 ml
注射用复合辅酶
Coenzyme Complex for Injection 200 IU 200 iu: 0.2 mg
200 iu
(0.2 mg)
注射用水溶性维生素(水乐维他粉针)
Water-Soluble Vitamin for Injection (Soluvit®N)
Compounded
powder/ vial 1 vial
多种微量元素注射液(II)(安达美注射液)
Trace Elements for Injection (Addammel®N)
10 ml 10 ml
甘油磷酸钠注射液(格利福斯注射液)
Sodium Glycerophosphate Injection (Glycophos®)
10 ml 10 ml
脂溶性脂溶性维生素注射液(II)(维他利匹特(成人)注射液)
Fat-Soluble Vitamin Injection (II) (Vitalipid®N Adult)
10 ml 10 ml
胰岛素注射液
Insulin Injection 400 iu: 10 ml
0.5 ml
(20 iu)
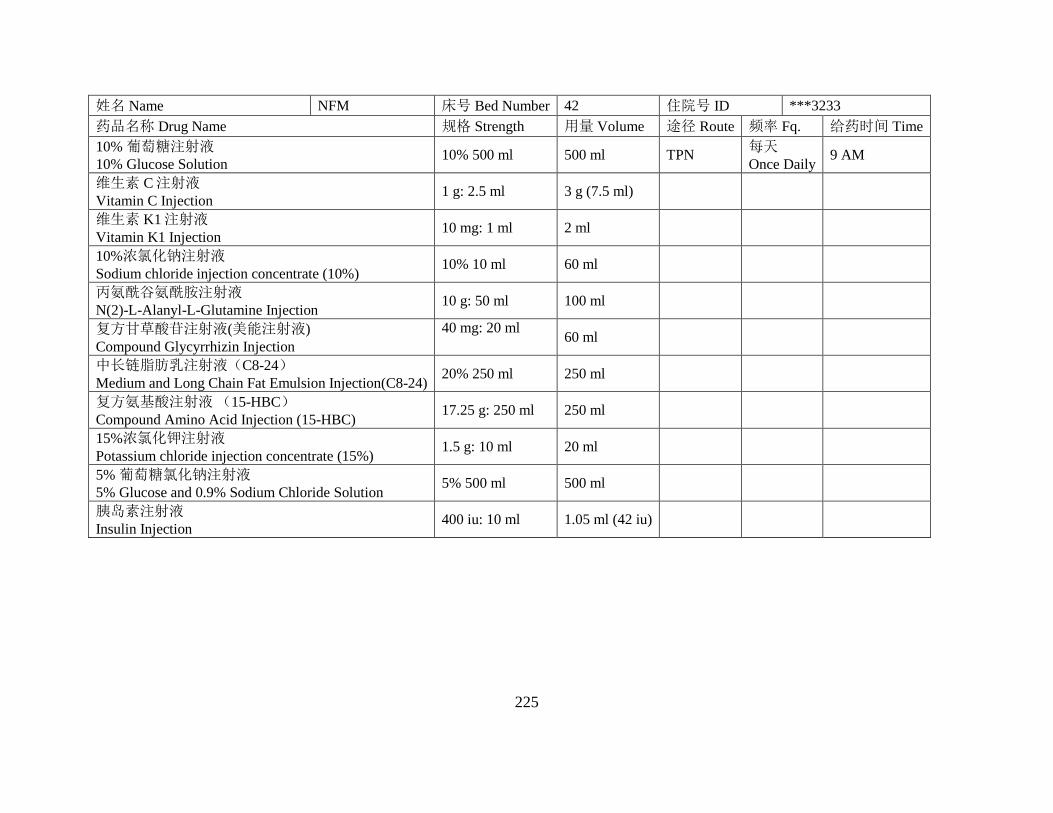
225
姓名 Name NFM 床号 Bed Number 42 住院号 ID ***3233
药品名称 Drug Name 规格 Strength 用量 Volume 途径 Route 频率 Fq. 给药时间 Time
10% 葡萄糖注射液
10% Glucose Solution 10% 500 ml 500 ml TPN
每天
Once Daily 9 AM
维生素 C 注射液
Vitamin C Injection 1 g: 2.5 ml 3 g (7.5 ml)
维生素 K1 注射液
Vitamin K1 Injection 10 mg: 1 ml 2 ml
10%浓氯化钠注射液
Sodium chloride injection concentrate (10%) 10% 10 ml 60 ml
丙氨酰谷氨酰胺注射液
N(2)-L-Alanyl-L-Glutamine Injection 10 g: 50 ml 100 ml
复方甘草酸苷注射液(美能注射液)
Compound Glycyrrhizin Injection
40 mg: 20 ml 60 ml
中长链脂肪乳注射液(C8-24)
Medium and Long Chain Fat Emulsion Injection(C8-24) 20% 250 ml 250 ml
复方氨基酸注射液 (15-HBC)
Compound Amino Acid Injection (15-HBC) 17.25 g: 250 ml 250 ml
15%浓氯化钾注射液
Potassium chloride injection concentrate (15%) 1.5 g: 10 ml 20 ml
5% 葡萄糖氯化钠注射液
5% Glucose and 0.9% Sodium Chloride Solution 5% 500 ml 500 ml
胰岛素注射液
Insulin Injection 400 iu: 10 ml 1.05 ml (42 iu)

226
姓名 Name TCY 床号 Bed Number 45 住院号 ID ***3251
药品名称 Drug Name 规格 Strength 用量 Volume 途径
Route 频率 Fq.
给药时间
Time
脂肪乳氨基酸(17)葡萄糖(11%)注射液
Fat Emulsion, Amino Acids (17) and Glucose (11%) Injection
(KabivenTM PI)
1440 ml 1440 ml TPN 每天
Once Daily 9 AM
丙氨酰谷氨酰胺注射液
N(2)-L-Alanyl-L-Glutamine Injection 20% 100 ml 100 ml
维生素 C 注射液
Vitamin C Injection 1 g: 2.5 ml 3 g (7.5 ml)
维生素 K1 注射液
Vitamin K1 Injection 10 mg: 1 ml 2 ml
胰岛素注射液
Insulin Injection 400 iu: 10 ml
0.625 ml
(25 iu)
15%浓氯化钾注射液
Potassium Chloride Injection Concentrate (15%) 1.5 g: 10 ml 10 ml
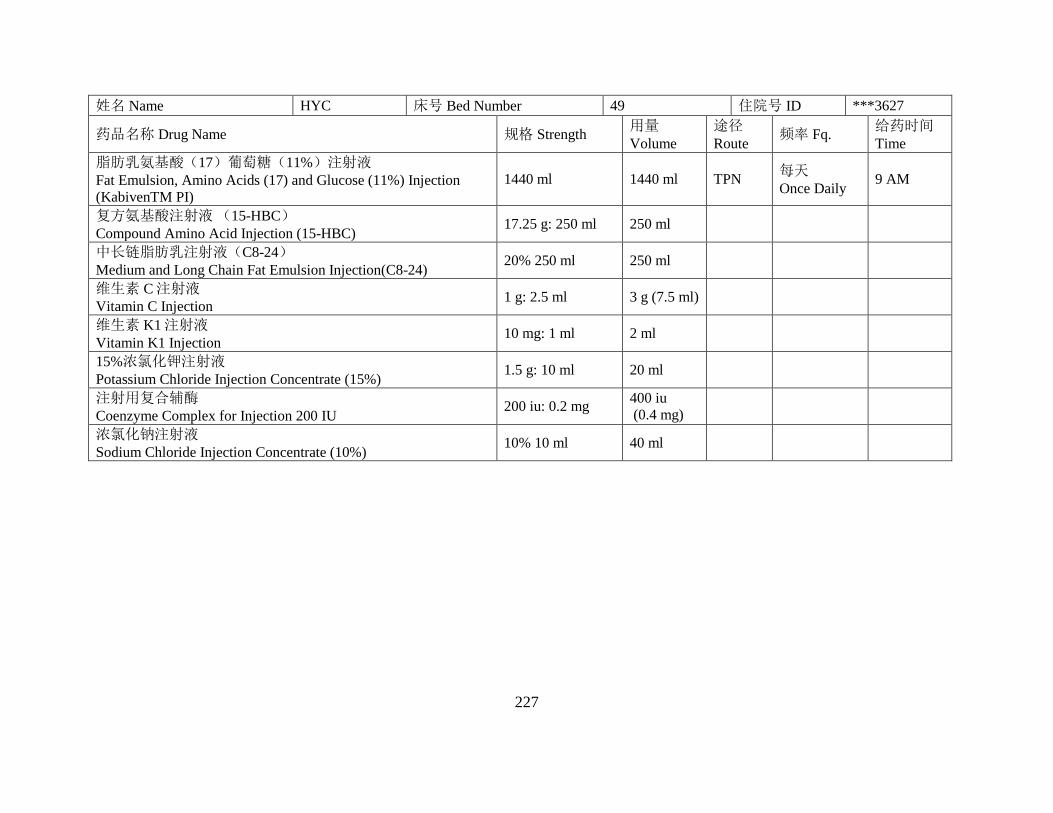
227
姓名 Name HYC 床号 Bed Number 49 住院号 ID ***3627
药品名称 Drug Name 规格 Strength 用量
Volume
途径
Route 频率 Fq.
给药时间
Time
脂肪乳氨基酸(17)葡萄糖(11%)注射液
Fat Emulsion, Amino Acids (17) and Glucose (11%) Injection
(KabivenTM PI)
1440 ml 1440 ml TPN 每天
Once Daily 9 AM
复方氨基酸注射液 (15-HBC)
Compound Amino Acid Injection (15-HBC) 17.25 g: 250 ml 250 ml
中长链脂肪乳注射液(C8-24)
Medium and Long Chain Fat Emulsion Injection(C8-24) 20% 250 ml 250 ml
维生素 C 注射液
Vitamin C Injection 1 g: 2.5 ml 3 g (7.5 ml)
维生素 K1 注射液
Vitamin K1 Injection 10 mg: 1 ml 2 ml
15%浓氯化钾注射液
Potassium Chloride Injection Concentrate (15%) 1.5 g: 10 ml 20 ml
注射用复合辅酶
Coenzyme Complex for Injection 200 IU 200 iu: 0.2 mg
400 iu
(0.4 mg)
浓氯化钠注射液
Sodium Chloride Injection Concentrate (10%) 10% 10 ml 40 ml
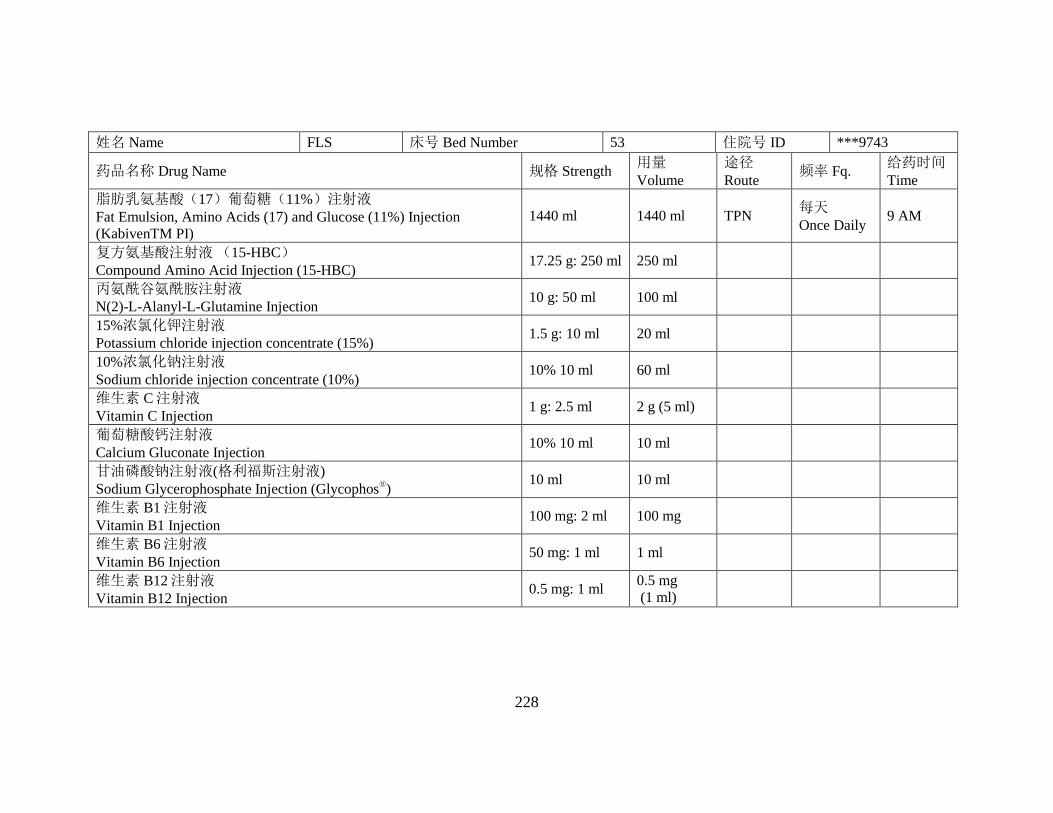
228
姓名 Name FLS 床号 Bed Number 53 住院号 ID ***9743
药品名称 Drug Name 规格 Strength 用量
Volume
途径
Route 频率 Fq.
给药时间
Time
脂肪乳氨基酸(17)葡萄糖(11%)注射液
Fat Emulsion, Amino Acids (17) and Glucose (11%) Injection
(KabivenTM PI)
1440 ml 1440 ml TPN 每天
Once Daily 9 AM
复方氨基酸注射液 (15-HBC)
Compound Amino Acid Injection (15-HBC) 17.25 g: 250 ml 250 ml
丙氨酰谷氨酰胺注射液
N(2)-L-Alanyl-L-Glutamine Injection 10 g: 50 ml 100 ml
15%浓氯化钾注射液
Potassium chloride injection concentrate (15%) 1.5 g: 10 ml 20 ml
10%浓氯化钠注射液
Sodium chloride injection concentrate (10%) 10% 10 ml 60 ml
维生素 C 注射液
Vitamin C Injection 1 g: 2.5 ml 2 g (5 ml)
葡萄糖酸钙注射液
Calcium Gluconate Injection 10% 10 ml 10 ml
甘油磷酸钠注射液(格利福斯注射液)
Sodium Glycerophosphate Injection (Glycophos®)
10 ml 10 ml
维生素 B1 注射液
Vitamin B1 Injection 100 mg: 2 ml 100 mg
维生素 B6 注射液
Vitamin B6 Injection 50 mg: 1 ml 1 ml
维生素 B12 注射液
Vitamin B12 Injection 0.5 mg: 1 ml
0.5 mg
(1 ml)

229
Appendix J: Pictures of the Unit Dose Dispensing System in Other Military
Hospitals

230
Figure 30: Checking IV Label and Dispensing Unit Dose

231
Figure 31: Pharmacy Intravenous Admixture Center Service (PIVAS) Windows (In-Out)
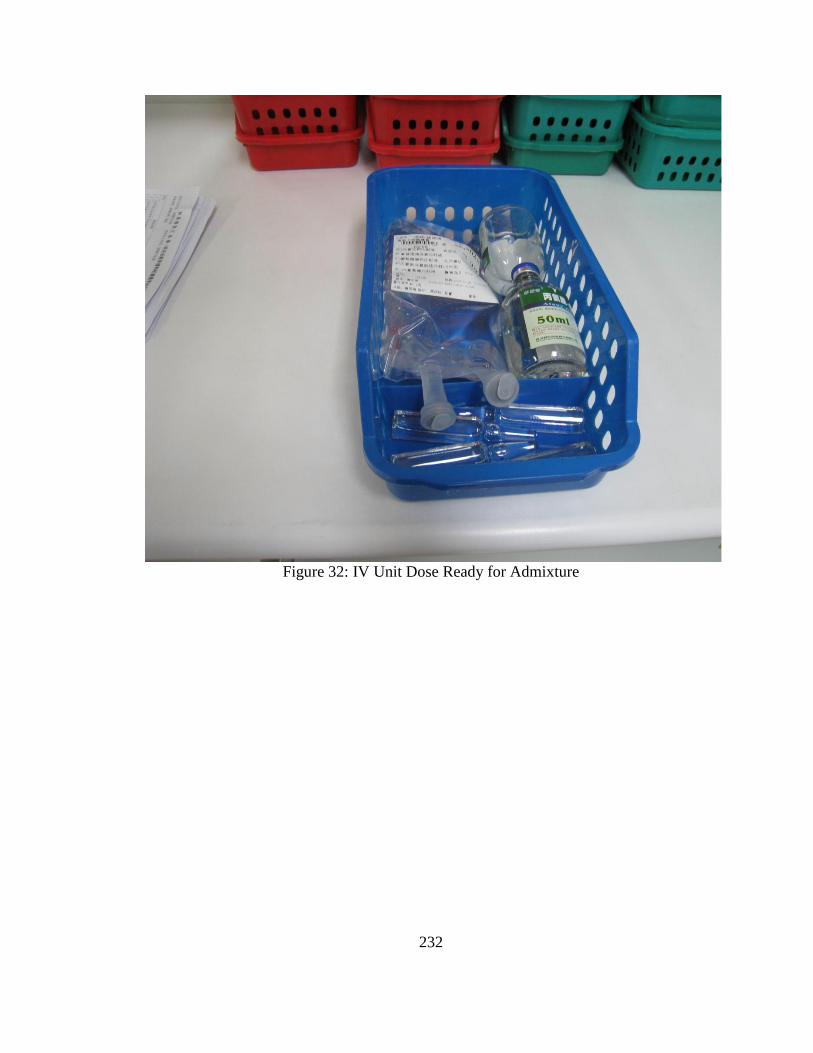
232
Figure 32: IV Unit Dose Ready for Admixture