Embed Size (px)
Citation preview

FUNDAÇÃO GETULIO VARGAS ESCOLA DE ADMINISTRAÇÃO DE EMPRESAS DE SÃO PAULO
CRISTIANO DO AMARAL BRITTO DE CASTRO
The Effect of Using Claim Confirming Product Cues on the Product
Claim Credibility: is Seeing Believing?
SÃO PAULO
2013
CRISTIANO DO AMARAL BRITTO DE CASTRO
The Effect of Using Claim Confirming Product Cues on the Product
Claim Credibility: is Seeing Believing?
Thesis presented to Escola de Administração
de Empresas de São Paulo, Fundação Getúlio
Vargas, for granting the title of Master in
Business Administration.
Research Area: Marketing Strategy
Thesis Advisor: Prof. Dr. Delane Botelho
SÃO PAULO 2013

Castro, Cristiano do Amaral Britto de
The Effect of Using Claim Confirming Product Cues on the Product Claim Credibility: is Seeing Believing? / Cristiano do Amaral Britto de Castro. – 2013. 8 pp. 85
Thesis Advisor: Prof. Dr. Delane Botelho
���Thesis (master) – Escola de Administração de Empresas de São Paulo.
1. Marketing – psychological aspects. 2. Risk Perception. 3. Consumer Behavior. 4. Cognition. 5. Economics of Information Theory I. Botelho, Delane. II. Thesis (master) - Escola de Administração de Empresas de São Paulo. III. Title.
CDU 658.89

CRISTIANO DO AMARAL BRITTO DE CASTRO
The Effect of Using Claim Confirming Product Cues on the Product
Claim Credibility: is Seeing Believing?
Thesis presented to Escola de Administração
de Empresas de São Paulo, Fundação Getúlio
Vargas, for granting the title of Master in
Business Administration.
Research Area: Marketing Strategy
Approval date: _____ / _____ / ______ Thesis committee: __________________________________________________ Prof. Dr. Delane Botelho (thesis advisor) FGV – EAESP Prof. Dr. Felipe Zambaldi FGV – EAESP Prof. Dr. Rafael Porto UnB

To my parents, Paulo and Cecília, and to my wife and daughter, who have
showed great understanding throughout the process.

AKNOWLEDGEMENT I feel very fortunate for the help and support I received from my family, friends, colleagues and professors during this learning process. Without them, this journey would have not been possible.
First, I would like to thank my thesis advisor Delane Botelho for all the guidance I received during this process. His knowledge and encouragement not only guided this work, but was also an instrumental part of my formation as a marketing researcher.
Thanks to Rafael Porto, Felipe Zambaldi and José Mauro Hernandez for their comments and suggestions to my research project. Also, thanks to the professors and experts Juracy Parente, Eliane Brito, Rodrigo Bandeira de Mello, André Samartini, Emílio Arruda, Roberto Fava Scare, Edgard Barki and all those present at XXXVI EnAnpad who kindly listened to me and gave me valuable advice to conduct this research.
I would like to thank FGV and Capes for the financial support received.
I thank professors at FGV and my colleagues at ESPM for all the support and for helping me gathering students to participate on my field research, as well as many thanks to Marcelo Dhargan for asking his fans for their help in this research as well.
Many thanks to my friends and family for their comprehension and a special thank to Mari, who stood by me and listened to my theories and also to my whining about the endless hours of work. I could not leave Lelê out of this list, because she understood very well why I couldn’t be with her at all times.
I would also like to thank all the people who agreed to participate on my research.
Finally, I would really like to thank all my colleagues from the Master and Doctoral programs at FGV, whose support, help and very special friendship were fundamental to make this challenge even more enjoyable.
ABSTRACT The Cue Utilization Theory establishes that all products are made of multiples cues that may
be seen as surrogates for the intangible attributes that make up any given product. However,
the results of many years of research have yet yielded little consensus as to the impact
generated by the use of such cues. This research aims to contribute to the discussion about the
importance of intrinsic cues by investigating the effects that the use of product cues that
confirm the product claim may have on Claim Credibility (measured through Ad Credibility),
and also on consumers’ Purchase Intention and Perceived Risk toward the product. An
experiment was designed to test such effects and the results suggest the effects of the use of
Claim Confirming Product Cues depend on consumer’s level of awareness about such cue,
and that when consumers are aware of it, Ad Credibility and Purchase Intention increase, as
Perceived Risk decreases. Such results may have implications to academicians and
practitioners, as well as may provide insights for future research.
Keywords: product claim, ad credibility, purchase intention, perceived risk, skepticism
toward advertising, cue utilization theory, economics of information theory

LIST OF ILLUSTRATIONS FIGURES Figure 1: Omo Multiação package claiming to have Extra Clean particles ............................... 2
Figure 2: Nike Air shoe with a see-through heel used to confirm its ‘air’ claim ....................... 8
Figure 3: Toothpaste with search cue represented by three different colors ............................ 13
Figure 4: Extended relationship between price, product attribute information and Purchase Intention (Chang & Wildt, 1994) ............................................................................................. 17
Figure 5: Experiment design ..................................................................................................... 29
Figure 6: Ad not featuring the Claim Confirming Product Cue. .............................................. 31
Figure 7: Ad featuring the Claim Confirming Product Cue. .................................................... 32
Figure 8: Article stating that ads are deceitful .......................................................................... 33
Figure 9: Article stating that ads are trustworthy ..................................................................... 34
Figure 10: Family Income profile of students in Group 1 ........................................................ 41
Figure 11: Semester attended by students in Group 1 .............................................................. 41
Figure 12: Interaction between level of skepticism and the use of Claim Confirming Product Cue on Ad Credibility (group 1) ............................................................................................... 45
Figure 13: Level of skepticism and the use of Claim Confirming Product Cue on Purchase Intention (group 1) .................................................................................................................... 47
Figure 14: Interaction between level of skepticism and the use of Claim Confirming Product Cue on Perceived Risk (group 1) .............................................................................................. 49
Figure 15: Levels of Claim Confirming Product Cue and Skepticism on Ad Credibility and Perceived Risk (Group 2) ......................................................................................................... 53
Figure 15: Interaction between Ad Type and Manipulation Awareness for Ad Credibility in Group 1 ..................................................................................................................................... 55
Figure 16: Interaction between Ad Type and Manipulation Awareness for Purchase Intention in Group 1 ................................................................................................................................. 55
Figure 17: Graph showing the interaction between Ad Type and Manipulation Awareness for Perceived Risk in Group 1 ........................................................................................................ 57
Figure 18: Graph showing the interaction between Ad Type and Manipulation Awareness for Ad Credibility in Group 2 ......................................................................................................... 59

Figure 19: Graph showing the interaction between Ad Type and Manipulation Awareness for Purchase Intention in Group 2 .................................................................................................. 60
Figure 20: Graph showing the interaction between Ad Type and Manipulation Awareness for Perceived Risk in Group 2 ........................................................................................................ 61
TABLES Table 1: examples of cues being used as search attributes ....................................................... 13
Table 2: Five dimensions of product innovativeness (Ostlund, 1974) ..................................... 15
Table 3: dimensions of the Perceived Risk construct, as per Jacoby and Kaplan (1972) and Roselius (1971) ......................................................................................................................... 18
Table 4: Andreasen’s information source typology (Lutz & Reilly, 1974) .............................. 19
Table 5: definitions of skepticism in different fields. ............................................................... 21
Table 6: antecedents of skepticism ........................................................................................... 23
Table 7: scale for Product Involvement used in the pre-test .................................................... 29
Table 8: scale for Skepticism toward advertising used as manipulation check ........................ 34
Table 9: t-test results for the Skepticism toward advertising variable ..................................... 35
Table 10: scale for dispositional skepticism used as a covariate .............................................. 37
Table 11: ANCOVA results for the Skepticism toward advertising variable .......................... 37
Table 12: scales for the dependent variables used in the experiment ....................................... 39
Table 13: t-test results for Dispositional Skepticism Level in groups 1 and 2 ......................... 40
Table 14: descriptive statistics of respondents in Groups 1 and 2 ............................................ 40
Table 15: reliability tests results for the scales used in the research ........................................ 42
Table 16: Group 1 Perceived Risk Crombach’s alpha value if items deleted .......................... 42
Table 17: two-way ANOVA results for Ad Credibility variable in Group 1 ........................... 44
Table 19: two-way ANOVA results for the Purchase Intention variable in Group 1 .............. 46
Table 19: two-way ANOVA results for the Perceived Risk dependent variable in Group 1 ... 48
Table 20: two-way ANOVA results for Ad Credibility in Group 2 ......................................... 50
Table 21: two-way ANOVA results for Purchase Intention in Group 2 .................................. 51
Table 22: two-way ANOVA results for Perceived Risk in Group 2 ........................................ 52
Table 23: two-way ANOVA results for the Ad Credibility variable re-run with sample split by manipulation awareness in Group 1 ......................................................................................... 54
Table 24: two-way ANOVA results for the Purchase Intention variable re-run with sample split by manipulation awareness in Group 1 ............................................................................ 56
Table 25: two-way ANOVA results for the Perceived Risk variable re-run with sample split by manipulation awareness in Group 1 .................................................................................... 57
Table 26: two-way ANOVA results for the Ad Credibility variable re-run with sample split by manipulation awareness in Group 2 ......................................................................................... 59
Table 27: two-way ANOVA results for the Purchase Intention variable re-run with sample split by manipulation awareness in Group 2 ............................................................................ 60
Table 28: two-way ANOVA results for the Perceived Risk variable re-run with sample split by manipulation awareness in Group 2 .................................................................................... 61

SUMMARY
1. INTRODUCTION ............................................................................................................................ 1 1.1 THEME ........................................................................................................................................ 1 1.2 PROBLEM .................................................................................................................................... 2 1.3 RELEVANCE ................................................................................................................................ 4
2. CONCEPTUAL BACKGROUND AND HYPOTHESIS ............................................................... 6 2.1 TANGIBILITY ............................................................................................................................... 6 2.2 ECONOMICS OF INFORMATION THEORY ................................................................................... 11 2.2.1 WHAT THE ECONOMIC THEORY OF INFORMATION IS ........................................................... 11 2.2.2 ECONOMICS OF INFORMATION AND CUE UTILIZATION ........................................................ 13 2.3 PURCHASE INTENTION .............................................................................................................. 15 2.4 PERCEIVED RISK ....................................................................................................................... 17 2.5 SKEPTICISM .............................................................................................................................. 20 2.5.1 WHAT SKEPTICISM IS ............................................................................................................ 20 2.5.2 CONSEQUENCES OF SKEPTICISM ............................................................................................ 25
3. METHOD ...................................................................................................................................... 28 3.1 SAMPLING ................................................................................................................................. 28 3.2 DATA COLLECTION .................................................................................................................. 28 3.3 DATA ANALYSIS ....................................................................................................................... 39
4. RESULTS ...................................................................................................................................... 40 4.1 DESCRIPTIVE STATISTICS ......................................................................................................... 40 4.2 ANALYSIS ................................................................................................................................. 42 4.2.1 TEST OF HYPOTHESES ................................................................................................................ 43 4.2.1.1 GROUP 1 ............................................................................................................................. 43 4.2.1.2 GROUP 2 ................................................................................................................................. 49 4.2.1.3 FURTHER ANALYSIS ............................................................................................................ 53
5. FINAL REMARKS ........................................................................................................................ 63 5.1 CONCLUSIONS ........................................................................................................................... 63 5.2 IMPLICATIONS ........................................................................................................................... 65 5.2.1 THEORETICAL IMPLICATIONS ................................................................................................ 65 5.2.2 MANAGERIAL IMPLICATIONS ................................................................................................ 66 5.3 LIMITATIONS AND FUTURE RESEARCH .................................................................................... 66
REFERENCES ....................................................................................................................................... 68 APPENDIX A: RESULTS OF PRE-TEST OF PRODUCT CATEGORY INVOLVEMENT ............. 74 APPENDIX B: MANIPULATION FOR SKEPTICISM LEVEL AS USED IN NIELSEN AND ESCALAS (2010) .................................................................................................................................. 75 APPENDIX C: MANIPULATION FOR SKEPTICISM TOWARD ADVERTISING ........................ 76 ARTICLE STATING THAT ADS ARE NOT DECEITFUL ............................................................... 76 APPENDIX D: SCALES BACK-TRANSLATION .............................................................................. 77

1
1. INTRODUCTION
1.1 Theme
Developing and launching successful products has always been a challenge for companies.
The large amount of information available nowadays, generated by different offerings and
advertising messages, has made that challenge even greater.
Consumers may feel more skeptical, since the operation of a free market demands sellers to
display their products from the best angle according to their interests, which combined with
the somewhat loose legislation, allows for a certain degree of exaggeration on the persuasive
communication sellers do. Thus, market itself sponsors skepticism (Obermiller &
Spangenberg, 1998; Moore-Shay & Lutz, 1988). In addition, events such as the 2008-2009
recession increase consumers’ mistrust of corporations, making this phenomenon even more
relevant (Kotler, Kartajaya, & Setiawan, 2010).
The search for possibilities to diminish the negative effects of such skepticism has mostly
explored aspects related to the communication mix companies may use (Cummins, 1995;
Ditto & Lopez, 1992; Ford, Smith, & Swasy, 1990; Prendergast, Liu, & Poon, 2009) or
intended to deeply understand the causes of skepticism in an attempt to find alternatives to
reduce it (Calfee & Ringold, 1994; Obermiller & Spangenberg, 1998; Obermiller &
Spangenberg, 2000; Obermiller, Spangenberg, & MacLachlan, 2005; Bousch, Friestad, &
Rose, 1994; Hawkins & Hoch, 1992).
Few attempts have been made to identify different tools in the marketing mix, namely product,
price and distribution strategies, that may offer alternative ways to deal with such skepticism,
and most of them look at this issue through the perspective of the Economics of Information
Theory (Calfee & Ford, 1988; Nelson, 1970; 1974; Stigler, 1961; Darby & Karni, 1973),
which states that products may bear Search Attributes, that can be verified prior to the
purchase (i.e.: product price), Experience Attributes, verifiable only after the purchase has
occurred (i.e.: product’s performance or quality), and Credence attributes, which are not at all
verifiable (the results of a preventive muffler change in your car).

2
However, the Cue Utilization Theory (Cox1, 1967; Olson2, 1972; apud Sullivan & Burger,
1987), which establishes that all products are made of multiples cues that may be seen as
surrogates for the intangible attributes that make up any given product, may offer a different
perspective on the matter. Throughout the years, companies have been using cues that
confirm whatever claim is being made about the product. For example, the different color
particle in the powder detergent that insinuates a higher performance (figure 1). The research
herein combines the Economics of Information and the Cue Utilization theories to investigate
a new possibility to belittle skepticism’s negative impact: the use of Claim Confirming
Product Cues.
Figure 1: Omo Multiação package claiming to have Extra Clean particles
1.2 Problem
Skepticism may create a serious condition for companies, especially when analyzed at a
behavioral level: for example, highly skeptical consumers show higher propensity to avoid
advertising (Obermiller, Spangenberg, & MacLachlan, 2005). Thus, skepticism may turn
large advertising investments into useless efforts to persuade consumers, and the same may be
true for the investments made in new product development and launching.
1 Cox, D. F. (1967) The Sorting Rule Model of the Consumer Product Evaluation Process. In Risk Taking and Information Handling in Consumer Behavior. Boston: Harvard University, Graduate School of Business Administration. 2 Olson, J. C. (1972). Product Quality Perception: A Model of Quality Cue Utilization and an Empirical Test. Unpublished doctoral dissertation, Purdue University.

3
However, skeptics are not immune to advertising (Obermiller, Spangenberg, & MacLachlan,
2005). Calfee and Ford (1988) proposed that the effects of advertising can best be understood
if we assume that consumers do not trust product claims unless they have specific reasons to
do so.
Based on the Economics of Information Theory, one may assume that product claims can
potentially be made based on search (i.e.: the cheapest TV set in the market) and experience
attributes (i.e.: the higher quality TV set in the market). By definition, the latter suffers the
most with the issue of skepticism, since the consumers may feel like they are purchasing
nothing but a promise, but it is also the most commonly found in the market (Nelson, 1974).
It is hypothesized that claims based on experience attributes may benefit from lending such
attribute a more tangible dimension, which can in turn transform it into a search attribute, a
form of attribute that presents lower levels of skepticism. Thus, tangibility would work as a
facilitator of truthfulness verification. However, for these expected results to be reached,
claims need to be supported by a search cue that must be perceived by the consumer, no
matter whether on the product itself or on the package.
Similar propositions have been made in the services marketing literature, and empirical
evidence has been found supporting the positive effects of the tangibility of intangible aspects
of offerings (Shostack, 1977; Rushton & Carson, 1989), being the most prominent one the
reduction of uncertainty on consumer's part. Reducing the uncertainty does, indeed, provide
the service with better acceptability by the consumer, who in turn consumes more of it. So,
the proposed research question is:
What is the effect of using Claim Confirming Product Cues on the product claim’s
credibility?
Besides the higher credibility of the ad, I also hypothesize that the use of Claim Confirming
Product Cues may impact other perceptions and processes undergone by the consumer, such
as Purchase Intention and risk perception.
Therefore, the objectives of this research may be described as:
Primary: Verify whether the use of claim confirming product cues has an effect on the
product claim’s credibility.

4
Secondary: Verify other effects resulting of the use of Claim Confirming Product Cues,
such as its impacts on consumer’s Purchase Intention and risk perception.
Verify the level of skepticism’s impact on the use of Claim Confirming
Product Cues’ effects.
Establish a link between the theories: Economics of Information and Cue
Utilization theories to better understand consumer behavior and skepticism.
1.3 Relevance
The discussion raised in this research may present benefits to a multitude of fields of
investigation.
The results of many years of research have yet yielded little consensus as to the impact
generated by the use product cues. Therefore, from the academic point of view, this research
offers a new perspective on the topic, combining the Cue Utilization Theory to the Economics
of Information Theory aiming to investigate an unexplored aspect of the cue utilization.
Also, a contribution is given to the literature of skepticism. As mentioned before, most studies
focus on communication strategies that can be used to reduce the negative impact of
skepticism, and little efforts have been done as to what other tools pertaining to the marketing
mix can be used with that same goal, and the research herein investigates the use of product
characteristics as a possible alternative. As for ad effectiveness, this research indicates that
mixing two elements of the marketing mix may present positive effects for the marketer.
Feature fatigue has been one theme covered in the literature related to product development
(Thompson, Hamilton, & Rust, 2005), with the conclusion that offering multiple features is a
good strategy in the pre-purchase stage, since it may lend better value perception to the
product, but may generate confusion in consumer’s mind during product use, decreasing
product value and also re-Purchase Intentions. The discussion herein offers an alternative
perspective on the matter in the sense that it may indicate a possibility of offering fewer
features in a product and still maintain competitiveness during pre-purchase stage, which
would combine with less confusion during product use to increase product value as a whole.
From the managerial perspective, this thesis may contribute in answering an overall
managerial question of how marketers can decrease consumers’ levels of skepticism by

5
providing them with reasons to believe product claims. Many new products are launched
every year, making standing out in a high profusion of existing products a very difficult task.
Also, new media, millionaire communication budgets, a vast array of brands and publicity
messages, ease of information finding and trading, all make communicating assertively and
productively with consumer a challenging task. The hypotheses tested may generate insights
for rethinking product specification and communication planning for a higher value
proposition.

6
2. CONCEPTUAL BACKGROUND AND HYPOTHESIS
This chapter reviews the literature on cues usage and its relation to product claims, its impact
on claims credibility and consumers’ product Purchase Intention and Perceived Risk, as well
as its interaction with consumer’s skepticism.
2.1 Tangibility
In “Breaking Free from Product Marketing” (1977), Shostack suggests a continuum along
which all offerings found in the market may be placed. The position of the offering on the
continuum is determined by its level of tangibility, being such continuum anchored by
intangible offerings to the left and tangible ones to the right. What is meant by intangible is
something that is not physical and cannot be sensed in any way (Kotler & Keller, 2006),
which then causes intangible aspects to be only known or understood (Miller & Foust, 2003).
Thus, the opposite may be said of tangibility, that is, something tangible is physical and can
be sensed. Shostack (1977), therefore, suggests that whatever offer found in market presents
both tangible and intangible qualities. Those offers that are predominantly tangible are known
as goods, or products, whilst those predominantly intangible are called services. Although
tangibility is a term usually used in the literature of service marketing, for the purposes of this
research only physical goods will be discussed.
Intangibility carries along a great deal of risk, since “it makes products difficult, sometimes
impossible, to evaluate before the purchase” (Rushton & Carson, 1989, p. 30).
Besides, “consumers like to be able to answer, or feel they can answer, albeit subconsciously,
questions about a product such as: what is it that is being offered? What is it about the product
that means it can yield the promised benefits?” (Rushton & Carson, 1989, p. 30). In the case
of offers displaying some level of intangibility, the answer to those questions may be as vague
as the offering itself, which can lead consumers to a negative attitude towards the offering.
To allow a better understanding of intangibility’s risk, an important concept to be explored is
that of value, central in marketing theories. Value is the perceived result of an evaluation
made by the consumer of the benefits and costs embedded in a particular offering, considering
that benefits may be of functional, social, personal and experimental nature, whilst costs may
be determined by monetary, temporal, psychological and behavioral causes (Churchill &
Peter, 2000). It is amongst the different causes of cost that the risk generated by intangibility

7
becomes largely important, because it represents an antecedent of psychological costs, which
then allows it to diminish perceived value for the offering as a whole.
Based on that, it is clear the importance of reducing Perceived Risk when it comes to offer’s
intangible attributes. Levitt (1981) says “when prospective customers can’t experience the
product in advance, they are asked to buy what are essentially promises – promises of
satisfaction” (p. 96). Therefore, just like in services, the tangibility of an intangible factor
allows a product promise to be more real, providing the buyer with higher reliability. Even an
offer with prevailing tangible attributes may benefit from making its intangible aspects more
believable.
The Cue Utilization Theory (Cox3, 1967; Olson4, 1972; apud Sullivan & Burger, 1987)
establishes that all products are made of multiples cues that may be seen as surrogates for the
intangible attributes that make up, in higher or lower degree, an offer. So, these cues end up
allowing for a higher tangibility of those intangible attributes in any given offer, which is
highly relevant to not only those dedicated to the marketing of services (Rushton & Carson,
1989), but also to those involved with the marketing of physical goods (Levitt, 1981).
Companies (sellers) are not the only ones who benefit from the cue utilization; consumers
themselves, whether it is conscious or not, make systematic use of them too (Jacoby, Olson,
& Haddock, 1971), through a decoding behavior that is both learned and refined throughout
life by every person (Sullivan & Burger, 1987). Thus, cue utilization allows the seller to
decrease perceived psychological cost of the products being sold, improving its value
equation.
Depending on the product category, different cues may be used by the buyer to generate some
sort of perception about an intangible attribute. To come up with at least some sort of cues
generalizability, Olson and Jacoby (1972) classified such cues according to their relation with
the product. Thus, just as there are intrinsic or extrinsic attributes, the cues available in any
given product, since they are based on product’s attributes, can also be classified as intrinsic
or extrinsic. Intrinsic cues, are those that, once altered, will alter product characteristics as
well, which means that they are physical attributes of the product. The extrinsic cues are those
3 Cox, D. F. (1967) The Sorting Rule Model of the Consumer Product Evaluation Process. In Risk Taking and Information Handling in Consumer Behavior. Boston: Harvard University, Graduate School of Business Administration. 4 Olson, J. C. (1972). Product Quality Perception: A Model of Quality Cue Utilization and an Empirical Test. Unpublished doctoral dissertation, Purdue University.

8
that are associated with the product, but are not part of the product itself, such as brand, price,
and store image (Jacoby, Olson, & Haddock, 1971; Dodds, Monroe, & Dhruv, 1991; Olson &
Jacoby, 1972; Rao & Monroe, 1989). Thus, extrinsic cues carry a great degree of intangibility,
which explains why the focus of this research is on the use of intrinsic cues (figure 2).
Figure 2: Nike Air shoe with a see-through heel used to confirm its ‘air’ claim
To better elucidate the intrinsic and extrinsic cues argumentation, the concept of quality will
serve as an example. According to Yoon and Kijewski (1997), quality may be seen from two
distinct perspectives: that of the seller and that of the buyer. Under the seller’s perspective,
quality is associated with the product’s specification, that is, its features and performance.
Under the buyer’s perspective, quality is associated with the satisfaction of their needs and
desires, which is related to expectation and perception. Therefore, perceived quality has been
defined as the result of consumer’s judgment about the excellency and superiority of a
particular product, and is different from objective quality, since it bears high levels of
abstraction (Zeithaml, 1988).
Perceived quality is an intangible aspect of products, holding great importance both to buyers
and sellers, since it is positively related to consumers’ Purchase Intentions (Tsiotsou, 2006),
which explains why it is a recurrent theme in product marketing literature. The greater
importance of one kind of cue compared to the other on consumer perception of quality has
been largely discussed in the literature, presenting contradictory results. There is empirical
support to the thesis that, when forming a quality perception of any product, consumers lean
mainly on price and brand (Leavitt, 1954; Jacoby, Olson, & Haddock, 1971; Dodds, Monroe,
& Dhruv, 1991; Rao & Monroe, 1989; Richardson, Dick, & Jain, 1994), which are extrinsic
cues.
On the other hand, Szybillo and Jacoby (1974) found that intrinsic cues, ceteris paribus,
possess greater impact in consumers’ minds. Olson and Jacoby (1972) observe that, amongst

9
those cues that are taken into consideration by consumers during the formation of quality
perception, the intrinsic ones are far more relevant. Price, for instance, is not even ranked
within the top four cues. Similar results were obtained by Jacoby, Olson and Haddock (1971),
which then confirms the importance of intrinsic cues. Miyazaki, Grewal and Goodstein (2005)
explain this phenomenon by stating that intrinsic cues will be more dominant under two
circumstances, namely (1) the existence of intrinsic cues in abundance, and (2) time
availability on the buyer’s side along with the will to process all cues.
The difference in results described above may be explained taking into consideration the
existence of moments when intrinsic cues are more important, and moments when extrinsic
cues have that prerogative (Zeithaml, 1988). Consumers depend and rely more on intrinsic
cues when they either (1) are at the moment of purchase, (2) or in a pre-purchase situation,
when intrinsic attributes are search attributes, and not experience ones, or (3) when the
intrinsic attribute bears a high predictive value. On the other hand, extrinsic cues become
more relevant when consumers (1) are in the initial stages of purchase process, when intrinsic
attributes are not yet available, (2) perceive the time and energy necessary to evaluate all
intrinsic cues greater than that which is seen as valid, and (3) when quality is too difficult to
evaluate.
Relying on one, or two, even three or more cues have also got important outcomes on the
analysis of how important cues are. To illustrate this statement, consider price, which is one
of the most commonly studied of the extrinsic cues (Dawar & Parker, 1994). When a
consumer is shopping any given product and quality is considered the most important
attribute, most consumers choose the most expensive product (Leavitt, 1954). So, when price
is the only utilized extrinsic cue, it is positively associated with perceived quality (Dodds,
Monroe, & Dhruv, 1991). However, when the consumers use more cues, price has its
importance diminished (Jacoby, Olson, & Haddock, 1971; Rao & Monroe, 1989; Dodds,
Monroe, & Dhruv, 1991), which may be considered natural, since the inclusion of different
cues on the list automatically indicates that more factors have to be considered and weighed
in by the consumer. The primordial conclusion is that any particular cue will have its
importance diminished in the presence of other cues, since there are evidences proving that
consumers use multiple cues when forming a quality perception, and not only one or two
(Olson & Jacoby, 1972).

10
There is one last factor to be considered in the discussion on the importance of cues: the use
of cues that are consistent to each other increases their impact on consumer’s perception of
product quality (Myiazaki, Grewal & Goodstein, 2005). If this is true, then it is correct to say
that when inconsistencies between cues are present, consumer’s quality perception is the same
as if the cues were all weak. Differently of what one may think, in a situation like this, quality
perception does not follow the direction pointed by the stronger cue. For instance, if a pen is
premium priced but is very light when picked up, consumers will not perceive it as a premium
product, but instead as a low quality pen.
In the Cue Utilization Theory, a suggestion of an alternative and perhaps more enlightening,
yet complex, explanation about consumer’s relationship with cues may be found. It proposes
that all cues may be described as possessing a predictive value (PV) and also a confidence
value (CV). Predictive value is defined as “a measure of a consumer’s perception that a cue is
a valid indicator of one or more subjective attributes” (Sullivan & Burger, 1987, p. 64). For
instance, the size of the speakers in a stereo system may be a good indicator of how powerful
that system really is. Conversely, whether the speakers are black or white have very little to
do with measuring the power level of the stereo system as a whole. Thus, speaker size
presents a high PV, whilst speaker color have a low PV for the subjective attribute power.
Confidence value relates to “the degree of confidence that consumers have in their ability to
distinguish differences in a cue and correctly evaluate those differences” (Sullivan & Burger,
1987, p. 65). Building on the previous example, both an electric engineer and a housewife
buying her first stereo system might believe that speaker size is a good indicator of the
system’s power. However, the engineer would probably present higher confidence in judging
differences in speaker size among various systems. Therefore, speaker size would present
greater CV level for the engineer than for the inexperienced buyer’s in this situation, even
though both would likely assign a high PV level to speaker size as a cue.
Predictive and confidence values constitute distinct and independent entities, each one made
of a set of information that, taken together allow the cue to have higher or lower value.
However, although independent from each other, PV and CV influence both the use and the
impact of the cue in a specific and interactive way, which means that the results obtained
from a cue with high PV and CV are better than the results obtained from cues that have any
of the other three possible combinations (Sullivan & Burger, 1987).

11
The idea of Predictive and Confidence Value borne in the Cue Utilization Theory is of great
importance to the understanding of the tangibility concept, since marketing environment
allows a vast array of PV and CV manipulation possibilities with the objective of improving
product and brand’s image. There are three different ways to operate such manipulation: (1)
seller may manipulate product’s intrinsic attributes, that is, alter the product’s characteristics
or develop new intrinsic qualities to create new cues or reinforce existing ones; (2) seller may
use communication tools to change the perception about the cues, which ends up transferring
more confidence to the consumer due to their familiarity with the media; and (3) seller may
also combine both previous strategies, reinforcing a cue obtained through altered/new
intrinsic attributes via communication tools (Sullivan & Burger, 1987).
Now that the concept of tangibility has been discussed, the relation of product cues and the
economic theory of information will be presented next.
2.2 Economics of Information Theory
The Economics of information Theory provides a different angle on the matter of cue
utilization. To better understand it, its concept will be briefly described, and its relationship
with the cue utilization theory will be discussed.
2.2.1 What the Economics of Information Theory is
Information may be considered a valuable resource, however it was not until 1961 that the
first economist wrote about the value of information. George Stigler (1961) discussed the
issue of advertising, one the information-producing industries, and its role on the process of
screening various sellers (or buyers) that a buyer (or seller) goes through when they wish to
ascertain the most favorable price. The economics of information evolved from there, having
as a basic principle the fact that consumers will gather product information up to the point
where the cost of doing so exceeds the value of further information (Calfee & Ford, 1988).
It is possible to establish different types of product attributes from the perspective of
attainment of information by the buyer (Nelson, 1970; Darby & Karni, 1973). The first type is
the Search attribute, described as the kind of attribute that can be fully verified prior to the
purchase, such as price. The second type of product attribute is that which can only be
assessed after the purchase, as the buyer experiences it, so it is called Experience attributes.
An illustrative example would be products’ quality or performance (Nelson, 1970). For the

12
seller, experience attributes are key, because “the greater the discrepancy between promised
and actual experience qualities, the less likely the customer is to do further business with the
same firm" (Darby & Karni, 1973, p. 72).
A third kind of product attribute is that which cannot be verified neither prior nor after the
purchase, because consumers don't have the specific knowledge to evaluate the product or
service. It is more than just an attribute; it is the product or service itself (Darby & Karni,
1973), so it is called Credence Products. Typically, credence products have a high technical
appeal to it, such as automobile mechanics service, or even an appendix removal surgery. The
rationale behind is that, when performed in a preventive manner, consumers are not able to
tell whether the service was well executed or really necessary, because they cannot sense
anything different after the surgery or car repair.
For the purpose of this research, credence attributes and goods will not be a part of the
investigation, since “the assessment of their value requires additional costly information”
(Darby & Karni, 1973, p. 68), whilst the focus of this study is to evaluate alternative forms of
offering low cost information to the consumer.
Advertising for search and experience/credence product qualities present different objectives.
In the case of products based on experience/credence attributes, advertising aims to “increase
sales through increasing the reputability of the seller” (Nelson, 1974, p. 740), whereas in the
case of search attributes it intends to “increase sales by providing the consumer with ‘hard’
information about the seller's products” (Nelson, 1974, p. 740). However, the ‘hard’
information can be ascertained personally, which then makes advertising less necessary,
which means that there is higher incidence of experience goods advertising than of search
goods (Nelson, 1974).
In line with that concept, and helping to understand how the Economic Theory of Information
(Stigler, 1961; Nelson, 1970; 1974) relates with cues utilization, I take the example of
toothpaste. As mentioned before, performance is an experience attribute, and when claiming
to have a triple action effect, the seller is claiming to have a high performance product. To
make it clearer to the consumer, the toothpaste seller developed its product bearing three
different colors in its composition, and made it very apparent on package (figure 3).
Consumers can, therefore, verify the validity of the triple action claim before purchasing the
product.

13
Figure 3: toothpaste with search cue represented by three different colors
A second example may be that of Listerine, a mouthwash that for years made its cleansing
power evident to the consumer through its bursting taste, which was also emphasized in its
advertising. More examples may be seen in table 1.
Product Category Claim Cue Colgate Tripla Ação Toothpaste Triple action Product displaying three different colors,
and package showing product Listerine Mouthwash Greater cleansing
power Bursting taste
Gol Car Turbo Power Lump on car’s hood Omo Multiação Powder
detergent Faster and greater cleansing power
Extra-clean particles in the product, and also shown on package
Laranja Caseira Orange Juice Being natural Orange buds present in the juice Table 1: examples of cues being used as search attributes
All of these cues are product intrinsic attributes that were embedded in the product aligned
with the product’s main and differentiating promise. The relative importance of cues
generally follows its specificity, or the extent to which a particular cue is not shared in the
market. “The more specific a cue, all else being equal, the more likely it will provide
information that is useful in an assessment of product quality” (Dawar & Parker, 1994, p. 84).
Therefore, developing a product that has a differential versus its competitors, and embedding
a cue in the product to confirm such differential may provide useful information to the
consumer.
2.2.2 Economics of Information and Cue Utilization
Whether the product presents search or experience attributes, buyers still go through a process
of information gathering before they feel like it is enough for them to make a purchase
decision. During this process, information may be obtained from a number of different
sources, namely stores, friends, family, media (Nelson, 1970). Advertisement is also
considered to be a source of useful information about the product for 70% of consumers
(Calfee & Ringold, 1994), which then illustrates the importance of providing truthful claims
about products.

14
“If the advertised properties of the product differ from the actual properties, the consumer will
know about that difference prior to the purchase in the case of search qualities” (Nelson, 1974,
p. 730). Therefore, claims based on search attributes are more easily believed in, because
market auto-regulation mechanisms will not allow a seller to be dishonest about something
that can be easily verified prior to the purchase.
However, claims based on Experience attributes face a somewhat different situation. Since it
is not verifiable before the purchase, claim’s authenticity falls much shorter than is the case
for search attribute claims. "In the case of experience qualities, consumer's power over the
advertising is much less potent than his power over search qualities” (Nelson, 1974, p. 730).
One possibility for claims based on experience attributes to increase its credibility is by using
signals, which can be described as information perceived as being connected to another
information (Calfee & Ford, 1988). Therefore, the use signals may lend higher certainty to a
claim based on experience attributes. The similarities between signals and cues are very clear,
so from now on this type of strategy will be referred to as “use of a Claim Confirming Product
Cue”.
To further substantiate the proposition above, a look at the concept of objective and subjective
claim will be useful. A subjective claim will likely be made of some intangible attribute of the
product, whereas an objective claim will be likely about tangible attributes, which can be seen
and measured in some way. Therefore, objective claims are more easily believed in, which
then elicits lower levels of skepticism (Ford, Smith, & Swasy, 1990). Thus, allowing an
intangible attribute to gain more tangible dimension will allow for the claim based on this
attribute to move from subjective to objective, decreasing skepticism towards such claim.
Considering that product advertising is always based on a product claim, increasing claim’s
credibility will also increase ad’s credibility, defined as the representation of “the net effect of
advertising upon the mind of the reader, listener, or viewer” (Maloney, 1963, p. 1), which
means that an ad is more credible “when it leaves the consumer with that attitude, belief, or
intention toward the product which the advertiser intended that he or she should have after
exposure to the advertisement” (Maloney, 1963, p. 1). So, the first hypothesis is:
H1: the use of a Claim Confirming Product Cue will increase ads’ perceived credibility.

15
2.3 Purchase Intention
The acceptance or adoption of a product by the consumers is influenced by their Purchase
Intentions – defined as a behavior "formed under the assumption of a pending transaction and,
consequently, often considered an important indicator of actual purchase" (Chang & Wildt,
1994, p. 20) – which in turn is impacted by such product’s characteristics (Holak & Lehman,
1990). In the case of a new product, perceived innovation attributes are stronger predictors of
such acceptance and adoption than personal characteristics (Ostlund, 1974). What is meant by
perceived innovation attributes are the five dimensions described by Rogers (19625, apud
Ostlund, 1974), which are relative advantage, compatibility, complexity, divisibility and
communicability (table 2). Along with Perceived Risk, such dimensions have been used to
assess consumers’ Purchase Intention for new products (Holak & Lehman, 1990).
Attribute Definition Relative Advantage Degree to which a new product is perceived
to be superior to those that preceded it Compatibility Degree to which a new product is perceived
to be compatible to its target lifestyles and needs
Complexity Degree to which a new product is perceived as being difficult to comprehend and use
Divisibility Degree to which a new product may be tried without large initial commitment
Communicability Degree to which a new product is easily diffused and adopted
Table 2: Five dimensions of product innovativeness (Ostlund, 1974)
Communicability is one of three most important dimensions in consumers’ assessment of the
product (Holak & Lehman, 1990). Relative advantage and compatibility are the other two,
and may be determinant in the adoption of the product. The topic under discussion here is
related to all three of the above dimensions, since, ideally, any product needs to bear a unique
feature that fits perfectly with its target audience’s needs, and that provides a good basis for
communicating it. When done properly, Relative Advantage and Compatibility allow greater
communicability, and the rationale for that is, “if product results or benefits are perceived
easily and expressed readily, information about the item will be disseminated across a
population more quickly" (Holak &Lehman, 1990, p. 61).
5 Rogers, Everett M. Diffusion of Innovations. New York: The Free Press of Glencoe, 1962

16
By increasing Relative Advantage, Compatibility and Communicability about a product, the
end result is an increase in the confidence consumer feels toward a particular product, which
is also related to the consumer’s Purchase Intention (Bennet & Harrel, 1975). The confidence
construct can be dismembered in two separate factors, which are Knowledge Confidence and
Choice Confidence (Laroche, Kim & Zhou, 1994). Such factors have also been referred to as
Knowledge and Choice Uncertainty (Urbany, Dickson & Wilkie, 1989), and refer to,
respectively, the uncertainty consumer feels about how much he/she knows about the
brand/product (available features, the importance of such features, and the performance of the
alternatives on such dimensions), and the uncertainty of making the right choice amongst all
possible options.
Purchase Intention is highly affected by Knowledge Confidence (Laroche, Kim & Zhou,
1994), which means that it may be considered normal for consumers to demand information
that will enable them to make informed choices. In this context, providing easier to
understand and more believable information about the product’s relative advantage may
predict higher Purchase Intention rates from the consumer.
Forsythe, Kim and Petee (1999) had similar findings when conducting a research to verify
what kinds of cues were the most commonly used by consumers to assess product’s perceived
quality. They found that physical quality and design are the most important cues, and that
such cues have direct impact, along with price perceptions, on Purchase Intention in different
countries.
Chang and Wildt (1994) verified the same phenomenon. Their model relates intrinsic product
attributes and objective and perceived price to Purchase Intention. They suggest that intrinsic
attributes are directly responsible for perceived quality, which in turn is directly responsible
for perceived value, which then determines Purchase Intention (Figure 4).

17
Figure 4 Extended relationship between price, product attribute information and Purchase Intention (Chang & Wildt, 1994)
Therefore, the use of Claim Confirming Product Cues will enable a better understanding of
the product’s Relative Advantage, as well as its Compatibility, which will then increase
consumers’ Knowledge Confidence, allowing a higher perceived quality through deeper
comprehension of the products intrinsic attributes. The end result of such a process is
heightened Purchase Intention. So, the second hypothesis is:
H2: the use of a Claim Confirming Product Cue will increase consumer’s Purchase
Intention.
2.4 Perceived Risk
Perceived Risk implies that consumers may experience pre-purchase uncertainty as to type
and degree of expected loss resulting from the purchase and use of any given good or service
(Murray & Schlacter, 1990). Risk is, therefore, defined as a subjectively determined
expectation of loss: the greater the probability of this loss, the greater the risk thought to exist
for an individual" (Mitchell, 1999, p. 168). As a construct, Perceived Risk has been described
as being a multi-dimensional one (Jacoby & Kaplan, 1972; Kaplan, Szybillo & Jacoby, 1974;
Roselius, 1971), comprising six different dimensions: financial, performance, social, physical,
psychological, and convenience (table 3).
Perceived Price
Perceived Quality
PerceivedValue
Purchase Intention
+
+ +
+
+
-‐
-‐
Reference Price
Objective Price
Product Attribute Information

18
Jacoby and Kaplan (1972) studied more profoundly five of these dimensions – Convenience
Risk was first described by Roselius (1971), but was not incorporated to the study since data
had been collected prior to the publishing of Roselius’ paper – and their findings indicate that
Financial, Performance, Physical, Psychological and Social dimensions explained 76% of the
variance in Perceived Risk measures taken across 12 product categories. Kaplan, Szybilo and
Jacoby (1974), when validating previous studies, found that these five dimensions actually
explained 86% of the variance in Perceived Risk measures. Later, Stone and Grønhaug (1993)
confirmed that all six dimensions, including Convenience Risk, explain almost 90% of the
Perceived Risk construct, validating the findings of the research up to that date.
Dimension Definition Financial What are the chances that consumer stands to lose money if
he/she tries the product? Performance What is the likelihood that there will be something wrong with
the product, or that it will not work properly? Physical What are the chances that the product may not be safe, may be
or become harmful or injurious to your health? Psychological What are the chances that the product will not fit well with
consumer’s self image or self-concept? Social What are the chances that the product will affect the way others
think of the consumer? Convenience What are the chances consumers feel like time was lost on the
purchase or use of the product? Table 3: dimensions of the Perceived Risk construct, as per Jacoby and Kaplan (1972) and Roselius (1971)
Although there is a tendency of overall Perceived Risk correlate with product price, it has
been found that performance risk correlates with overall Perceived Risk, meaning that
employing performance risk as an approximation of overall Perceived Risk is a supported
practice (Kaplan, Szybillo & Jacoby, 1974; Jacoby & Kaplan, 1972; Lutz & Reilly, 1974).
Even though Stone and Grønhaug (1993) found low correlation between performance risk and
the overall risk perception, that may be explained by the fact that the sample used in their
research is highly familiar with computers, which was the product used as example in the
questionnaire, which then does not invalidate the findings of their predecessors.
Although comprised of six dimensions, the Perceived Risk construct can be divided in two
slightly different constructs (Bettman, 1973). The first one represents the Inherent Risk
carried by any given product category, and may be explained by (1) the importance to the
consumer of making a good decision within that product category, and (2) the number of
brands considered to be of good quality in that category. As for the second construct, it

19
explains the Handled risk, which is the result of information gathering and risk reduction
processes on inherent risk.
Therefore, to reduce Perceived Risk, consumers engage in strategies of risk resolution,
seeking risk relievers, which can be defined as a device or action, initiated by the buyer or
seller, which is used to decrease the chances of the purchase to fail or reduce the severity of
the real or imagined loss, or even to shift from one type of Perceived Risk to a more tolerable
one (Roselius, 1971). Thus, offering information to the consumer, as well as emphasizing the
quality of the brand/product, allows the seller to reduce risk related to its product, since "the
result of the integration of this information into the consumer's cognitive structure should be
the reduction of uncertainty surrounding the decision, which in turn should lead to a reduction
in Perceived Risk." (Lutz & Reilly, 1974, p. 393)
"Buyers have a set of many risk-relieving devices and actions ranging from the most preferred
to least preferred which they call upon when needed. Perception of risk causes the buyer to
select whichever device appears to be best suited for the type of risk involved" (Roselius,
1971, p. 57). To further investigate the use of risk-relievers, Lutz and Reilly (1974) used
Andreasen’s (19686, apud Lutz & Reilly, 1974) information source typology (table 4) as a
starting point, since it provides five information source types that consumer may call upon
depending on his/her specific need, according to each category characteristics.
For products laden on performance risk, consumers tend to look for independent personal
sources of information, contrary to common sense. Even for those high on performance risk,
impersonal information is only looked upon when it is independent. Mass media advertising
tends to be not heavily utilized (Lutz & Reilly, 1974).
Category Example Impersonal advocate Mass media advertising Impersonal independent Consumer reports Personal advocate Sales clerks Personal independent Friend’s opinions Direct observation Experience Table 4: Andreasen’s information source typology (Lutz & Reilly, 1974)
Shimp and Bearden (1982) also found that some extrinsic cues do not significantly reduce
consumers' performance risk perceptions. In new products, extrinsic cues such as advertising 6 Andreasen, A. R. Attitudes and Customer Behavior: a Decision Model. In H. E. Kassargian and T. S. Robertson (Eds.), Perspectives in Consumer Behavior. Glenview, Ill.: Scott, Foresman and Company, 1968, 498-510.

20
seem to be incapable of decreasing the uncertainty associated with whether the product will
appropriately perform its function.
In line with those findings, Roselius (1971), the first to investigate the use of risk-relievers,
found that brand loyalty and brand image are the top ranked risk reliever for all customers, in
all sorts of risk situations. Store image, shopping around, free sample, word of mouth and
government testing show up as neutral or slightly favorable devices used by consumers.
Endorsements, money back guarantees, and private testing generally evoke a slightly
unfavorable response from consumers, as buying the most expensive model proves to be the
least favored strategy.
Therefore, when reducing risk perception consumers may not rely on information provided by
the seller to assess the product and diminish their uncertainty. Thus, contrary to what may
seem logical:
H3: the use of a Claim Confirming Product Cue will not decrease consumer’s Perceived
Risk toward the advertised product.
2.5 Skepticism
Skepticism may create a serious condition for companies, especially when analyzed at a
behavioral level: highly skeptical consumers show higher propensity to avoid advertising,
since “higher skepticism is associated with zipping, zapping, and ignoring ads” (Obermiller,
Spangenberg, & MacLachlan, 2005, p. 11), so that skepticism may turn large advertising
investments into useless efforts to persuade consumers.
However, skeptics are not immune to advertising (Obermiller, Spangenberg, & MacLachlan,
2005). Calfee and Ford (1988) proposed that the effects of advertising can best be understood
if we assume that consumers do not trust ad claims unless they have specific reasons to do so.
Therefore, in the next chapters skepticism and its interaction with the use of Claim
Confirming Product Cues will be discussed.
2.5.1 What Skepticism is
Authors from fields as diverse as accounting and philosophy, religion and marketing have
been scrutinizing skepticism for many decades (table 5). But it is the field of consumer
psychology that has its most devoted researchers, who have been exploring its origins and its

21
impacts on consumer behavior. One of the areas that have been drawing substantial attention
from consumer psychologists refers to skepticism toward advertising.
Construct Author Definition Field Skepticism Merriam Webster
Dictionary (2012) An attitude of doubt or a disposition of incredulity in general or towards a specific object.
Linguistics
Skepticism (Mohr, Eroglu, & Ellen, 1998)
A cognitive response that varies depending on the context and content of communication.
Marketing
Skepticism toward advertising
(Obermiller & Spangenberg, 1998)
Tendency toward disbelief of advertising claims. Psychology
Skepticism toward advertising
(Bousch, Friestad, & Rose, 1994)
A combination of disbelief in advertising claims and mistrust of advertisement motives.
Marketing
Motivated skepticism
(Ditto & Lopez, 1992)
Tendency to believe more easily in desirable than undesirable information.
Psychology
Skepticism (Forehand & Grier, 2003)
Consumer distrust or disbelief of marketer actions, which can be induced independently of evaluator traits.
Consumer psychology
Humean skepticism
(Hunt, 2003) Since all of our knowledge of the external world comes from “sense impressions”, there is no way to establish the necessary connections between the phenomena.
Philosophy of Science
Skepticism (Bostad, 2011) Unbiased form of investigation. Philosophy Professional Skepticism
(Hurtt, 2010) A multi-dimensional construct that characterizes the propensity of an individual to defer concluding until the evidence provides sufficient support for one alternative over others.
Accounting
Skepticism (Priest, 1968) An intellectually articulated challenge to the ultimate legitimations of society.
Religion
Table 5: definitions of skepticism in different fields.
Obermiller and Spangenberg (1998) offer a well-established definition of skepticism toward
advertising, also known as ad skepticism, which states that it is a “tendency toward disbelief
of advertising claims” (p. 160). As such, ad skepticism “is a stable characteristic of consumers
that play a role in responses to advertising” (Obermiller & Spangenberg, 2000, p. 312). An
important observation that stems from this definition is that, although advertising claims may
be found in different media, skepticism may be generalizable across media within a person,
even though a specific medium may provoke higher skepticism than others. That means that a
person may be more skeptical of an ad placed on the Internet when compared to an ad placed
on TV, for instance, but a skeptical person will always display higher levels of skepticism
than those who are less skeptical, regardless of the medium.
Although agreeing with the broad definition of skepticism, Bousch, Friestad and Rose (1994)
indicate that ad skepticism concept goes beyond disbelief toward advertising claims.
Considering that consumers may evaluate firms more negatively if they perceive its practices

22
serving only its own interests, and not the general public’s good (Forehand & Grier, 2003),
skepticism is also driven by an individual’s mistrust of marketer’s motives (Bousch, Friestad,
& Rose, 1994). The majority of consumers consistently assume that advertising seeks to
persuade for the benefit of sellers rather than consumers (Calfee & Ringold, 1994), which
then explains why consumers tend to be more skeptical of information provided by marketers
than of information provided by other people, regardless of how close they are (Obermiller &
Spangenberg, 2000), indicating that the source of information influences the degree of
skepticism displayed by consumer. For instance, Fiat claiming that Uno is a very fuel-
efficient car may be less credible than a friend telling the same thing to the consumer.
Skepticism may be viewed as a market place belief in the sense that consumers perceive it as
being part of how market operates (Moore-Shay & Lutz, 1988; Obermiller & Spangenberg,
1998). To overcome competition, marketers are demanded to display their offerings always
from the best possible angle and, considering the somewhat loose regulation governing the
advertising market, marketers may stimulate consumer’s skepticism.
Skepticism may take two distinct forms: dispositional skepticism, which is an individual's
tendency to be suspicious of other people's motives, and situational skepticism, which is only
a momentary state of distrust (Forehand & Grier, 2003). For each of these types of skepticism,
different sets of antecedents have been identified (table 6). For dispositional skepticism,
antecedents are socialization in the family (Obermiller & Spangenberg, 2000), age (Bousch,
Friestad, & Rose, 1994), education, and personality traits such as self-esteem (Obermiller &
Spangenberg, 1998; Obermiller, Spangenberg, & MacLachlan, 2005). As for situational
skepticism, antecedents are level of involvement with the product category (Obermiller,
Spangenberg, & MacLachlan, 2005; Hawkins & Hoch, 1992), product and medium type
(Stigler, 1961; Nelson, 1974; Nelson, 1970; Darby & Karni, 1973; Ford, Smith, & Swasy,
1990; Prendergast, Liu, & Poon, 2009; Calfee & Ford, 1988), the consistency of the
information with the expected conclusion (Ditto & Lopez, 1992), and the product claim itself
(Ford, Smith, & Swasy, 1990; Cummins, 1995).
Socialization in the family, mainly across generations, influences dispositional skepticism.
Parents influence their children in many ways, and it also happens for marketplace beliefs,
including the usefulness and value of advertising (Moore-Shay & Lutz, 1988). Thus, more
skeptical parents have more skeptical children (Obermiller & Spangenberg, 2000). The
associations between parents and children diminished with age, which was considered a

23
surrogate for time away from home, confirming that family is an important antecedent of
skepticism (Obermiller & Spangenberg, 2000).
Situational factors Dispositional Factors Consumer involvement with category
(Obermiller, Spangenberg, & MacLachlan, 2005) (Hawkins & Hoch, 1992)
Socialization in the family
(Moore-Shay & Lutz, 1988) (Obermiller & Spangenberg, 2000)
Product Type (Stigler, 1961) (Nelson, Information and Consumer Behavior, 1970) (Nelson, 1974) (Darby & Karni, 1973) (Calfee & Ford, 1988)
Age (Bousch, Friestad, & Rose, 1994)
Medium Type (Prendergast, Liu, & Poon, 2009) (Marshall & Na, 2003) (Atkin & Beltramini, 2007)
Education (Obermiller & Spangenberg, 1998) (Obermiller, Spangenberg, & MacLachlan, 2005)
Prior Beliefs (Maloney, 1963) Self-esteem (Obermiller & Spangenberg, 1998) (Obermiller, Spangenberg, & MacLachlan, 2005)
Consistency of the information with the expected conclusion
(Ditto & Lopez, 1992)
Claim’s degree of objectivity and alternative explanations
(Ford, Smith, & Swasy, 1990) (Cummins, 1995)
Table 6: antecedents of skepticism
So, age is also an important factor influencing how skeptical a person is. The basic
explanation is that knowledge about advertiser tactics will develop during early adolescence,
which then impacts skepticism as age increases (Bousch, Friestad, & Rose, 1994). Although
the levels of mistrust in advertiser motives do not change throughout adolescence, the levels
of disbelief on advertisers’ claims do.
Along with age, education and self-esteem represent major influence factors on skepticism
(Obermiller & Spangenberg, 1998; Obermiller, Spangenberg, & MacLachlan, 2005). The
more educated a person, the more comfortable s/he will feel when questioning and criticizing
an advertising claim, since s/he will have more information to back up the argument. The
same goes for self-esteem: the more confident a person, the more inclined to argue against
something s/he do not agree or believe (Bousch, Friestad, & Rose, 1994).
For situational skepticism, consumer involvement with product category is an important
antecedent. Lower involvement with the product generates a higher skepticism level on
consumers (Obermiller, Spangenberg, & MacLachlan, 2005; Hawkins & Hoch, 1992), since

24
consumers cannot tell what that product is capable of doing. Once consumer learns about the
product, the uncertainty around it decreases, and so does skepticism.
The dyad product and medium type comes in as a second factor. For product type, the
taxonomy established by the Economics of Information Theory (Stigler, 1961; Nelson, 1974;
Nelson, 1970; Darby & Karni, 1973), provides a good explanation. As discussed previoulsy,
market offerings may be grouped into search, experience and credence goods. Search goods
are those with characteristics that can be investigated prior to purchase or use, which then
ensures a lower level of skepticism (Calfee & Ford, 1988); experience goods, on the other
hand, present characteristics that cannot be determined by search, demanding therefore use
experience; and credence goods are complex products, featuring characteristics that cannot be
searched nor experienced, which then elicits higher levels of skepticism.
Also related to product type, consumers might consider the price of goods when judging the
veracity of a claim. Therefore, low-cost and high-cost products may display differences as to
the level of skepticism they exert (Calfee & Ford, 1988). Consumers perceive claims for low-
cost goods as more truthful, due to the low cost of sampling, which then causes the market to
regulate itself on this matter.
But, "advertising credibility refers not only to the product being advertised, but also to the
medium through which the message is being delivered" (Prendergast, Liu, & Poon, 2009, p.
321). Each medium presents its own image and personality, so it is logical that different
media hold different levels of credibility. Marshal and Na (2003) and Atkin and Beltramini
(2007) found that Internet is a less credible medium than print media, which means that the
same message will evoke higher levels of skepticism when presented online than in print.
Another situational factor that may affect skepticism refers to the sort of prior beliefs the
person has about that specific brand, product or category (Maloney, 1963). Therefore,
skepticism tends to be greater when consumers have an opposing attitude or belief to that
which is being advertised. For instance, if a person believes that smoking is not bad for their
health, claiming the opposite will raise higher skepticism.
That goes along with the concept of motivated skepticism, which explains “the notion that
people are less skeptical consumers of desirable than undesirable information” (Ditto &
Lopez, 1992, p. 568). This means that information that is consistent with the preferred
conclusion (i.e.: favorable results in a medical test) is less likely to initiate an intense

25
cognitive process on the person’s mind than an inconsistent one. The result is that the person
will be less critic on the first situation, and will be more skeptical on the second. However, it
does not mean that people will not ever be able to accept inconsistent information’s validity,
only that they will require more, or better quality, information to overcome skepticism and
accept the nonpreferred conclusion.
One last situational factor relates to the product claim itself. As mentioned previously, an
objective claim is “one that describes some feature of the product that is measured in a
standard way” (Ford, Smith, & Swasy, 1990, p. 436), such as weight or height. Therefore,
subjective claims may be described as those that describe some features of the product that
are not measured in a standard way. By definition, objective claims are more easily believed
in, since it possibly generates more support arguments and fewer counterarguments than
subjective claims.
No matter what the claim is, consumers’ degree of skepticism may also be impacted by two
factors found in such claim: (1) alternative causes, which refers to the consumers’ ability of
finding different explanations for that claim to be true, and (2) disabling conditions,
refereeing to the ability consumers have to think of situations that deny what is being claimed
(Cummins, 1995). Take the example of one of Whirlpool’s Microwave Oven launches in
Brazil, which claimed to allow consumers to “cook with only three touches”, positioning the
product as very easy to use. For alternative causes, consumer may believe that frozen food
companies bear the responsibility of making it easy for the consumer to defrost and eat it. As
for a disabling condition, consumer may know other consumers who have purchased the
product and not found it simple to use. Thus, consumer’s skepticism level influences and is
influenced by how much consumers will search for alternative explanations for any given
claim.
2.5.2 Consequences of skepticism
Skepticism may present several different responses to advertising claims. In a broad sense,
not only more skeptical consumers believe advertising less, but they also like it less. And
more: highly skeptical consumers expect less informational value from any sort of
advertisement. As a result of less perceived informational value of advertisement, consumers
attend to it less and rely on it less, which then generates a low response in purchasing the

26
advertised products as a consequence of the ad (Obermiller, Spangenberg & MacLachlan,
2005).
The importance of ad skepticism becomes clear when it is analyzed at a behavioral level.
Highly skeptical consumers show higher propensity to avoid advertising, since “higher
skepticism was associated with zipping, zapping, and ignoring ads” (Obermiller, Spangenberg,
& MacLachlan, 2005, p. 11), which implicates that skepticism may turn large advertising
investments into useless efforts to persuade consumers.
However, “skeptics are not immune to advertising” (Obermiller, Spangenberg, & MacLachlan,
2005, p. 15). Despite higher or lower levels of skepticism, around 70% of consumers declare
believing that advertisements provide useful information on the products being announced
(Calfee & Ringold, 1994). This means that sellers can overcome the barriers generated by
skepticism to improve their performances in the market.
Considering that skepticism may differ from person to person according to a number of
variables, it is fair to assume that the use of Claim Confirming Product Cues will have
different impact on people. Those who present lower levels of skepticism should present a
lesser response to the use of such strategy, since they already see advertising as credible and
will not look for signals that allow them to believe what is being said. However, the opposite
situation may be predicted for those who present high levels of skepticism, since they are
prone to search and process more information so that they may see advertising as more
believable. In doing so, skeptics will increase the Knowledge Confidence, improving the
product attribute information – perceived quality – perceived value relationship (Chang &
Wildt, 1994), which will then have a bigger impact on highly skeptical consumers’ Purchase
Intention. However, since advertising is not a source of information used by consumers to the
decrease their perception of risk, no differences should be found between high and low
skeptical respondents. Thus:
H4a: the use of Claim Confirming Product Cue will have greater impact on ads’ perceived credibility for those who present higher levels of skepticism.
H4b: the use of Claim Confirming Product Cue will have greater impact on consumers’ Purchase Intention for those who present higher levels of skepticism.
H4c: the use of Claim Confirming Product Cue will have no greater impact on consumers’ Perceived Risk for those who present higher levels of skepticism.

27
Therefore, it is predicted that the use of Claim Confirming Product Cues may pose as an
alternative way of overcoming consumer’s skepticism toward advertising, as well as offer
different benefits to the seller.
Next, the method will be discussed.
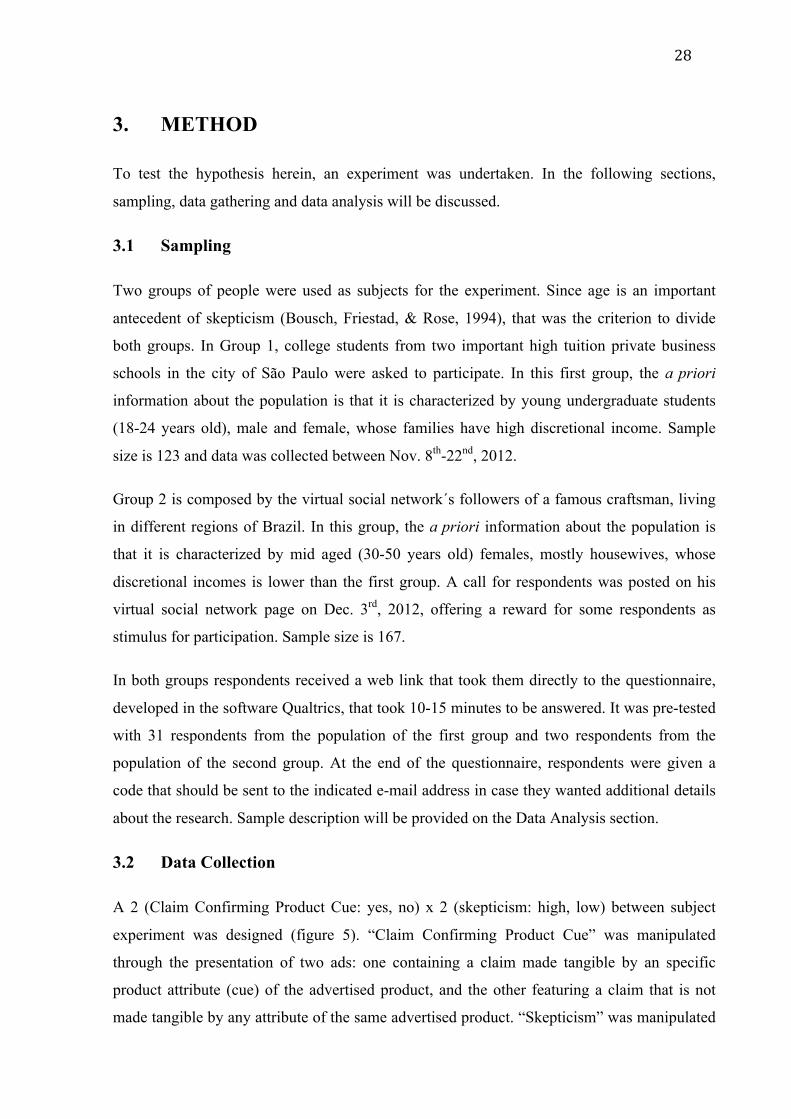
28
3. METHOD
To test the hypothesis herein, an experiment was undertaken. In the following sections,
sampling, data gathering and data analysis will be discussed.
3.1 Sampling
Two groups of people were used as subjects for the experiment. Since age is an important
antecedent of skepticism (Bousch, Friestad, & Rose, 1994), that was the criterion to divide
both groups. In Group 1, college students from two important high tuition private business
schools in the city of São Paulo were asked to participate. In this first group, the a priori
information about the population is that it is characterized by young undergraduate students
(18-24 years old), male and female, whose families have high discretional income. Sample
size is 123 and data was collected between Nov. 8th-22nd, 2012.
Group 2 is composed by the virtual social network´s followers of a famous craftsman, living
in different regions of Brazil. In this group, the a priori information about the population is
that it is characterized by mid aged (30-50 years old) females, mostly housewives, whose
discretional incomes is lower than the first group. A call for respondents was posted on his
virtual social network page on Dec. 3rd, 2012, offering a reward for some respondents as
stimulus for participation. Sample size is 167.
In both groups respondents received a web link that took them directly to the questionnaire,
developed in the software Qualtrics, that took 10-15 minutes to be answered. It was pre-tested
with 31 respondents from the population of the first group and two respondents from the
population of the second group. At the end of the questionnaire, respondents were given a
code that should be sent to the indicated e-mail address in case they wanted additional details
about the research. Sample description will be provided on the Data Analysis section.
3.2 Data Collection
A 2 (Claim Confirming Product Cue: yes, no) x 2 (skepticism: high, low) between subject
experiment was designed (figure 5). “Claim Confirming Product Cue” was manipulated
through the presentation of two ads: one containing a claim made tangible by an specific
product attribute (cue) of the advertised product, and the other featuring a claim that is not
made tangible by any attribute of the same advertised product. “Skepticism” was manipulated

29
by exposing respondents to different newspaper articles: one stating that ads are deceitful and
the other stating they are trustworthy. Next, both manipulations is explained.
Figure 5: experiment design
Claim Confirming Product Cue
Since product involvement is an antecedent of skepticism (Obermiller, Spangenberg, &
MacLachlan, 2005; Hawkins & Hoch, 1992), to be sure that all respondents present the same
level of product involvement, a pretest was run with subjects from the population of the first
group. A questionnaire containing a product involvement scale (table 7) made of four items
with five-point Likert scales (Beatty & Talpade, 1994) was filled out by 11 respondents, both
men and women, to control for differences in involvement according to gender (Putrevu,
2001), to find a product that has similar involvement level for women and men.
Scale Items (English) Items (Portuguese) Source Product Involvement
1. In general, I have a strong interest in this product category.
2. This product category is very important to me.
3. This product category matters a lot to me.
4. I get bored when other people talk to me about this product category
1. De forma geral, eu tenho um grande interesse nesta categoria de produto.
2. Esta categoria de produto é muito importante pra mim.
3. Esta categoria de produto significa muito pra mim.
4. Fico entediado quando as pessoas conversam comigo sobre esta categoria de produto.
Beatty & Talpade (1994)
Table 7: scale for Product Involvement used in the pre-test

30
The product chosen to be featured in the ads was toothpaste for three reasons: (1) brands in
that market have been using Claim Confirming Product Cues for years; (2) consumers show
intermediate level of product involvement (appendix A), which is ideal since people will not
feel unmotivated to search for information as they would be in a low involvement situation
(Urbany, Dickson, & Wilkie, 1989) or in a high involvement situation (Stone & Grønhaug,
1993); (3) all respondents (in the two groups) use the product on a daily basis, which is clear
in the consistency of the answers obtained in the involvement scale.
To control for ad quality, an advertising agency was briefed and asked to develop the two ads.
To prevent any biases of a known brand, a new brand (Skanti) was created using a random
brand name generator (nomesparaempresas.gratuita.com.br). The two ads created may be seen
in figures 6 and 7.

31
Figure 6: ad not featuring the Claim Confirming Product Cue.

32
Figure 7: ad featuring the Claim Confirming Product Cue.

33
Two verifying questions were used, one related to brand knowledge (only 7% of the
participants, equally distributed in both Groups 1 and 2, declared having previous knowledge
of the brand, which is an indicator that brand was not a bias factor) and one regarding whether
the participant saw the Claim Confirming Product Cue in the ad.
Skepticism
At first, an attempt was made to manipulate the participant’s level of skepticism toward
advertising. Originally, the manipulation used by Nielsen and Escalas (2010) (appendix B)
was considered, and the ads were shown before respondents filled out the scale, but the pre-
test, which had a qualitative step, indicated that such manipulation was not working as
intended. The manipulation method was then changed and, as stated before, two newspaper
articles were used, one stating that ads are deceitful (figure 8) and the other stating they are
trustworthy (figure 9) (for texts in Portuguese, see Appendix C). Such articles were actually a
composite of different articles, and after the completion of the entire questionnaire subjects
were debriefed about the possibility of some information seen during the test not being
entirely accurate. Neutral information, an article on the growth of pet products market in
Brazil, was presented afterwards for distraction purpose, and to make the setting more natural.
Figure 8: Article stating that ads are deceitful
False advertising as common practice A survey conducted by IBM in the U.S. and UK shows a drop in consumer confidence towards consumer products manufacturers, and one of the main reasons for this are the constant problems related to false advertising. In Brazil, we also live this kind of situation. As examples, Nokia was recently spotted by consumers practicing false advertising in one of their commercials, and supermarkets often advertise in their newspaper inserts prices different from those recorded in the check-out. (source: www.mundodomarketing.com.br, 2012)

34
Figure 9: article stating that ads are trustworthy
After being exposed to the articles, subjects then filled out a questionnaire presenting
“skepticism toward advertising” scale (table 8), used as a manipulation check. Additionally,
different from what was done in the original manipulation attempt, the ads were not shown
before the completion of this task.
Scale Items (English) Items (Portuguese) Source Skepticism toward Advertising
1.We can depend on getting the truth in most advertising.
2. Advertising’s aim in to inform the consumer.
3. I believe advertising is informative.
4. Advertising is generally truthful.
5. Advertising is a reliable source of information about the quality and performance of products.
6. Advertising is truth well told.
7. In general, advertising presents a true picture of the product being advertised.
8. I feel I’ve been accurately informed after viewing most advertisements.
9. Most advertising provides consumers with essential information.
1. Podemos acreditar que conseguiremos a verdade na maioria das propagandas.
2. O objetivo da propaganda é informar o consumidor.
3. Eu acredito que propagandas sejam informativas.
4. Propagandas geralmente são verdadeiras.
5. Propaganda é uma fonte de informação confiável a respeito da qualidade e desempenho do produto.
6. Propaganda é uma verdade bem dita.
7. De forma geral, a propaganda apresenta uma imagem verdadeira do produto sendo anunciado.
8. Depois de assistir a maioria das propagandas, sinto que fui precisamente informado sobre o produto anunciado.
9. A maioria das propagandas traz informações essenciais ao consumidor.
Obermiller & Spangenberg (1998)
Table 8: scale for Skepticism toward advertising used as manipulation check
The false advertising is more harmful to the advertiser than to the consumer.
In the past, false advertising might have even made sense for businesses. However, today, with a more informed society, higher competition between companies, a more evolved consumer protection law and the surveillance of governmental and non-governmental organizations, deceitful advertising makes no sense under the economic and market perspectives. The injured player in the case of false advertising is the advertiser itself, which over time loses credibility and, as a consequence, sales and profit. (source: The Folha de São Paulo, 2011)
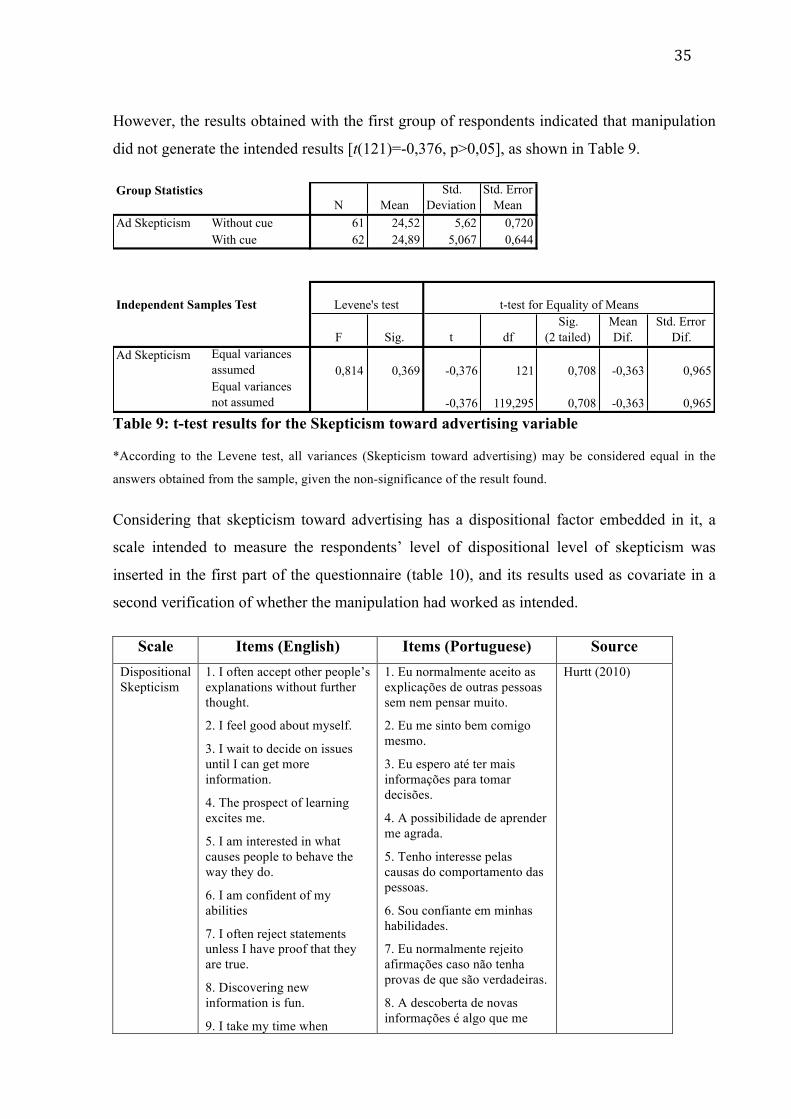
35
However, the results obtained with the first group of respondents indicated that manipulation
did not generate the intended results [t(121)=-0,376, p>0,05], as shown in Table 9.
Table 9: t-test results for the Skepticism toward advertising variable
*According to the Levene test, all variances (Skepticism toward advertising) may be considered equal in the
answers obtained from the sample, given the non-significance of the result found.
Considering that skepticism toward advertising has a dispositional factor embedded in it, a
scale intended to measure the respondents’ level of dispositional level of skepticism was
inserted in the first part of the questionnaire (table 10), and its results used as covariate in a
second verification of whether the manipulation had worked as intended.
Scale Items (English) Items (Portuguese) Source Dispositional Skepticism
1. I often accept other people’s explanations without further thought.
2. I feel good about myself.
3. I wait to decide on issues until I can get more information.
4. The prospect of learning excites me.
5. I am interested in what causes people to behave the way they do.
6. I am confident of my abilities
7. I often reject statements unless I have proof that they are true.
8. Discovering new information is fun.
9. I take my time when
1. Eu normalmente aceito as explicações de outras pessoas sem nem pensar muito.
2. Eu me sinto bem comigo mesmo.
3. Eu espero até ter mais informações para tomar decisões.
4. A possibilidade de aprender me agrada.
5. Tenho interesse pelas causas do comportamento das pessoas.
6. Sou confiante em minhas habilidades.
7. Eu normalmente rejeito afirmações caso não tenha provas de que são verdadeiras.
8. A descoberta de novas informações é algo que me
Hurtt (2010)
Group StatisticsN Mean
Std. Deviation
Std. Error Mean
Ad Skepticism Without cue 61 24,52 5,62 0,720With cue 62 24,89 5,067 0,644
Independent Samples Test
F Sig. t dfSig.
(2 tailed)Mean Dif.
Std. Error Dif.
Ad Skepticism Equal variances assumed 0,814 0,369 -0,376 121 0,708 -0,363 0,965Equal variances not assumed -0,376 119,295 0,708 -0,363 0,965
t-test for Equality of MeansLevene's test

36
making decisions.
10. I tend to immediately accept what other people tell me.
11. Other people’s behavior does not interest me.
12. I am self-assured.
13. My friends tell me that I usually question things that I see or hear.
14. I like to understand the reason for other people’s behavior.
15. I think that learning is exciting.
16. I usually accept things I see, read or hear at face value.
17. I do not feel sure of myself.
18. I usually notice inconsistencies in explanations.
19. Most often I agree with what the others in my group think.
20. I dislike having to make decisions quickly.
21. I have confidence in myself.
22. I do not like to decide until I’ve looked at all of the readily available information.
23. I like searching for knowledge.
24. I frequently question things that I see or hear.
25. It is easy for other people to convince me.
26. I seldom consider why people behave in a certain way.
27. I like to ensure that I’ve considered most available information before making a decision.
28. I enjoy trying to determine if what I read or hear is true
29. I relish learning.
30. The actions people take
agrada.
9. Tenho tempo para tomar minhas decisões.
10. A tendência é que eu sempre aceite o que os outros me dizem.
11. O comportamento das outras pessoas não me interessa.
12. Eu sou seguro.
13. Meus amigos me dizem que normalmente eu questiono tudo que ouço ou vejo.
14. Eu gosto de entender o motivo do comportamento das pessoas.
15. Eu acredito que aprender coisas novas é muito empolgante.
16. Eu normalmente aceito aquilo que vejo.
17. Eu não me sinto muito seguro quanto a mim mesmo.
18. Normalmente eu vejo inconsistências em explicações que ouço.
19. Na maioria das vezes, eu concordo com o que os outros no meu grupo pensam.
20. Não me agrada ter que tomar decisões rapidamente.
21. Sou autoconfiante.
22. Eu não gosto de tomar decisões sem antes avaliar todas as informações que tenho à mão.
23. A busca por conhecimento me agrada.
24. Eu frequentemente questiono as coisas que escuto ou vejo.
25. É fácil as outras pessoas me convencerem.
26. Eu raramente levo em consideração por que as pessoas se comportam de determinada maneira.
27. Eu gosto de garantir que considerei todas as informações disponíveis na

37
and the reasons for those actions are fascinating.
hora de tomar minha decisão.
28. Gosto de pensar a respeito de quanto aquilo que ouço ou leio é verdadeiro.
29. Eu aprecio aprender coisas novas.
30. As ações das pessoas e os motivos para tais ações são fascinantes.
Table 10: scale for dispositional skepticism used as a covariate
The results found in such analysis were no different. The covariate Level of Dispositional
Skepticism is not significantly related to the Skepticism toward Advertising, F(1,120)=0,185,
p>0,05 (table 11), as is the effect of the manipulation, F(1, 120)=0,182, p>0,05.
Table 11: ANCOVA results for the Skepticism toward advertising variable
*The Levene Test results indicate that all variances (in the variable Skepticism toward advertising) are
assumed to be equal, which then validates the results of the ANCOVA, F(1,121)=0,531,p>0,05.
Due to results of the Skepticism toward Advertising manipulation check, the results obtained
from the Dispositional Skepticism scale were used for splitting groups 1 and 2 for data
analysis. Scores found in both groups were used to divide each group in three parts, and then
only the highest and lowest thirds were considered in the research. In Group 1, 37 respondents
were cut out, and in group 2, 50. That reduced the total number of participants to 203 (85 in
Group 1 and 118 in Group 2). .
Test of Between-subjects Effects
Type III Sum of Squares df
Mean Square F Sig.
Correct Model 9,364a 2 4,682 0,163 0,850Intercept 759,251 1 759,251 26,362 0,000Skeptcism Level 5,324 1 5,324 0,185 0,668Article type 5,254 1 5,254 0,182 0,670Error 3456,099 120 28,801Total 78551,000 123Corrected Model 3465,463 122a. R Squared = 0,087 (Adjusted R Squared = 0,063)
Levene's test of equality of Error Variances F df1 df2 Sig.0,531 1 121 0,468

38
For the second group of respondents, both the manipulation of the Skepticism toward
Advertising and its manipulation check were removed from the questionnaire, which aided in
the time reduction indicated as needed during the pre-test of the questionnaire with the target
audience. Also, I removed questions related to the college and the semester attended in the
college.
Dependent Variables
Dependent variables and their scales are: Ad Credibility (Putrevu & Lord, 1994), Purchase
Intention (Baker & Churchill Jr., 1977) and Perceived Risk (Shimp & Bearden, 1982), which
is a perfomance risk scale. Table 12 presents all the scales for the experiment translated into
Portuguese. These scales were then back translated into English by two translators (appendix
C), both MSc. students from two important business schools in Brazil.
Scale Items (English) Items (Portuguese) Source Ad credibility
1. The claims in the ad are true.
2. I believe the claims in the ad.
3. The ad is sincere.
4. I think the ad is dishonest.
1. As promessas do produto no anúncio são verdadeiras.
2. Eu acredito nas promessas do produto no anúncio.
3. O anúncio é sincero.
4. Eu acho que o anúncio é desonesto.
Putrevu & Lord (1994)
Purchase Intention
1. Would you like to try this product?
2. Would you buy this product if you happened to see it in a store?
3. Would you actively seek out this product in a store in order to purchase it?
1. Você gostaria de experimentar pasta de dente do anúncio?
2. Você compraria esta pasta de dente caso a visse em uma loja?
3. Você procuraria esta pasta de dente em uma loja com a intenção de comprá-lo?
Baker & Churchill Jr. (1977)
Perceived Risk
1. How sure are you about the ________’s ability to perform satisfactorily?
2. Considering the possible problems associated with _______’s performance, how much risk would you say would be involved with purchasing the new ______?
3. In your opinion, do you feel that the new ______ if introduced would perform as well as other _______ now on
1. Qual seu nível de certeza sobre a capacidade da pasta de dente do anúncio ter um desempenho satisfatório?
2. Levando em consideração os problemas associados com o desempenho das pastas de dente existentes no mercado, qual o nível de risco você diria estar associado com a compra do produto anunciado?
3. Em sua opinião, você acredita que se a pasta de
(Shimp & Bearden, 1982)

39
market?
4. How confident are you of the _______’s ability to perform as expected?
dente do anúncio fosse lançada ela teria um desempenho tão bom quanto o das pastas já existentes no mercado?
4. Qual seu nível de confiança na capacidade da pasta de dente do anúncio ter um desempenho condizente com o esperado?
Table 12: scales for the dependent variables used in the experiment
3.3 Data Analysis
Data was extracted from Qualtrics and then transferred to SPSS Statistics 19 software, which
was used to perform all statistical analysis, All reversed questions were reversed back, all
scales were reduced down to factors through exploratory factorial analysis, and all necessary
coding was made.
To test all hypotheses, two-way ANOVAs were performed for each dependent variable,
which allowed for the verification of both the main effects of the factors (Ad Type and
Skepticism Level) as well as the effect of the interaction between the factors.
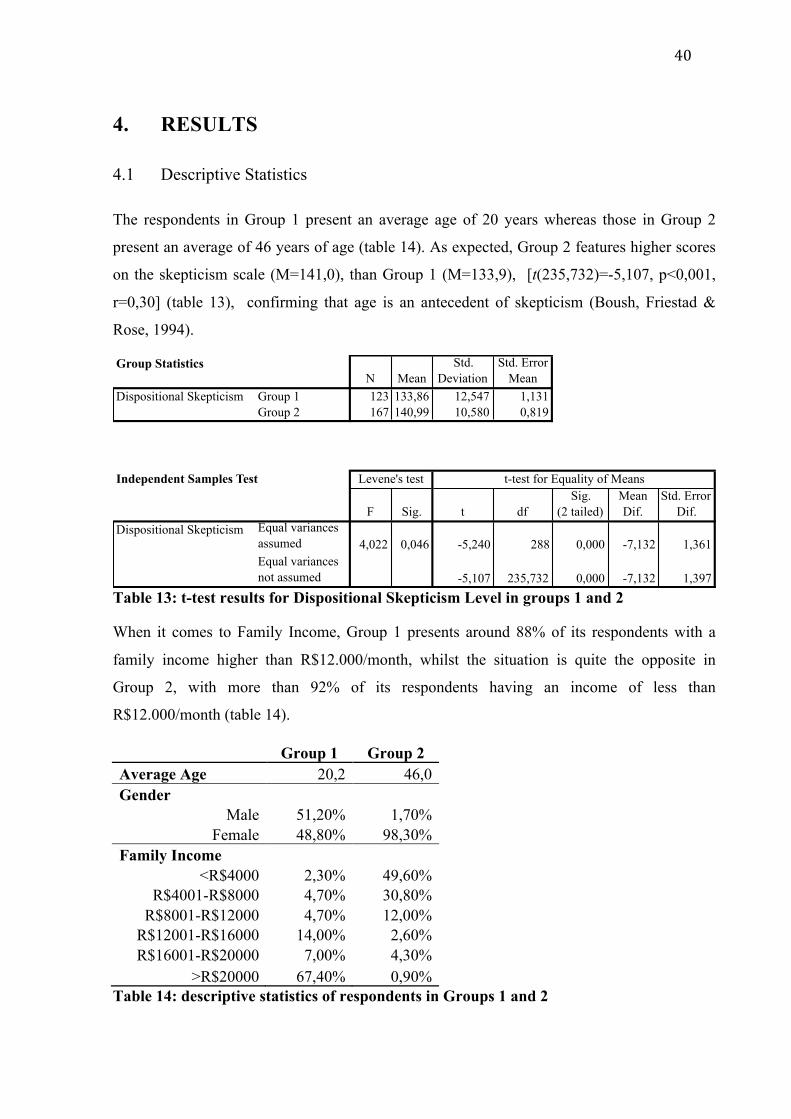
40
4. RESULTS
4.1 Descriptive Statistics
The respondents in Group 1 present an average age of 20 years whereas those in Group 2
present an average of 46 years of age (table 14). As expected, Group 2 features higher scores
on the skepticism scale (M=141,0), than Group 1 (M=133,9), [t(235,732)=-5,107, p<0,001,
r=0,30] (table 13), confirming that age is an antecedent of skepticism (Boush, Friestad &
Rose, 1994).
Table 13: t-test results for Dispositional Skepticism Level in groups 1 and 2
When it comes to Family Income, Group 1 presents around 88% of its respondents with a
family income higher than R$12.000/month, whilst the situation is quite the opposite in
Group 2, with more than 92% of its respondents having an income of less than
R$12.000/month (table 14).
Group 1 Group 2 Average Age 20,2 46,0 Gender
Male 51,20% 1,70% Female 48,80% 98,30%
Family Income <R$4000 2,30% 49,60%
R$4001-R$8000 4,70% 30,80% R$8001-R$12000 4,70% 12,00%
R$12001-R$16000 14,00% 2,60% R$16001-R$20000 7,00% 4,30%
>R$20000 67,40% 0,90% Table 14: descriptive statistics of respondents in Groups 1 and 2
Group StatisticsN Mean
Std. Deviation
Std. Error Mean
Dispositional Skepticism Group 1 123 133,86 12,547 1,131Group 2 167 140,99 10,580 0,819
Independent Samples Test
F Sig. t dfSig.
(2 tailed)Mean Dif.
Std. Error Dif.
Dispositional Skepticism Equal variances assumed 4,022 0,046 -5,240 288 0,000 -7,132 1,361Equal variances not assumed -5,107 235,732 0,000 -7,132 1,397
Levene's test t-test for Equality of Means

41
As for Group 1, although respondents came from two different colleges, they show very
similar profile. Average ages were 20,2 and 20,3 years old for colleges A and B, respectively.
As for family income there is also a similar pattern between the two colleges, with the
majority of the students presenting a family income higher then R$20000 per month (figure
10).
Figure 10: Family Income profile of students in Group 1
When it comes to the semester all the students are, College A features respondents distributed
throughout the semesters, with a high concentration of students in the first semester (figure
11). The respondents from College B all came from a narrower array of semesters, namely the
first, fifth (the most representative) and sixth semesters.
Figure 11: semester attended by students in Group 1

42
4.2 Analysis
Internal consistency of all scales was measured by Crombach’s Alpha. Table 15 shows the
results obtained for all of them.
group 1 Crombach's Alpha Skepticism 0,872 Ad Credibility 0,790 Purchase Intention 0,864 Perceived Risk 0,629
group 2 Crombach's Alpha Skepticism 0,798 Ad Credibility 0,848 Purchase Intention 0,840 Perceived Risk 0,740
Table 15: reliability tests results for the scales used in the research
In group 1, the scale used to measure Perceived Risk does not show high reliability, which
may impact further analysis. No improvement in that score is possible, since the removal of
any item will only decrease Crombach’s alpha global value (table 16).
Perceived Risk Group 1
Crombach's alpha if item deleted
Item 1 0,481 Item 2 0,622 Item 3 0,610 Item 4 0,526 Global Alpha 0,629
Table 16: Group 1 Perceived Risk Crombach’s alpha value if items deleted

43
4.2.1 Test of hypotheses
The hypotheses were tested separately in each group, and will be presented also separately,
starting with Group 1.
4.2.1.1 Group 1
Ad Credibility
To verify hypotheses 1 and 4a, both related to Ad Credibility, a two-way ANOVA was run,
considering both the level of skepticism and the use or not of the Claim Confirming Product
Cue as independent factors. Hypothesis 1 predicted that the use of a Claim Confirming
Product Cue would increase ads’ perceived credibility, and it was rejected [F(1,82)=0,184,
p>0,05 (table 17).
As for H4a, which considered that the use of Claim Confirming Product Cue has greater
impact on ads’ perceived credibility for those who present higher levels of skepticism, there
was a non-significant effect of the interaction between the two factors [F(1,82)=1,535,
p>0,05] (table 17), indicating that the outcomes of using a Claim Confirming Product Cue
were not affected by the level of skepticism of the respondents as far as Ad Credibility is
concerned. Thus, H4a was also rejected.
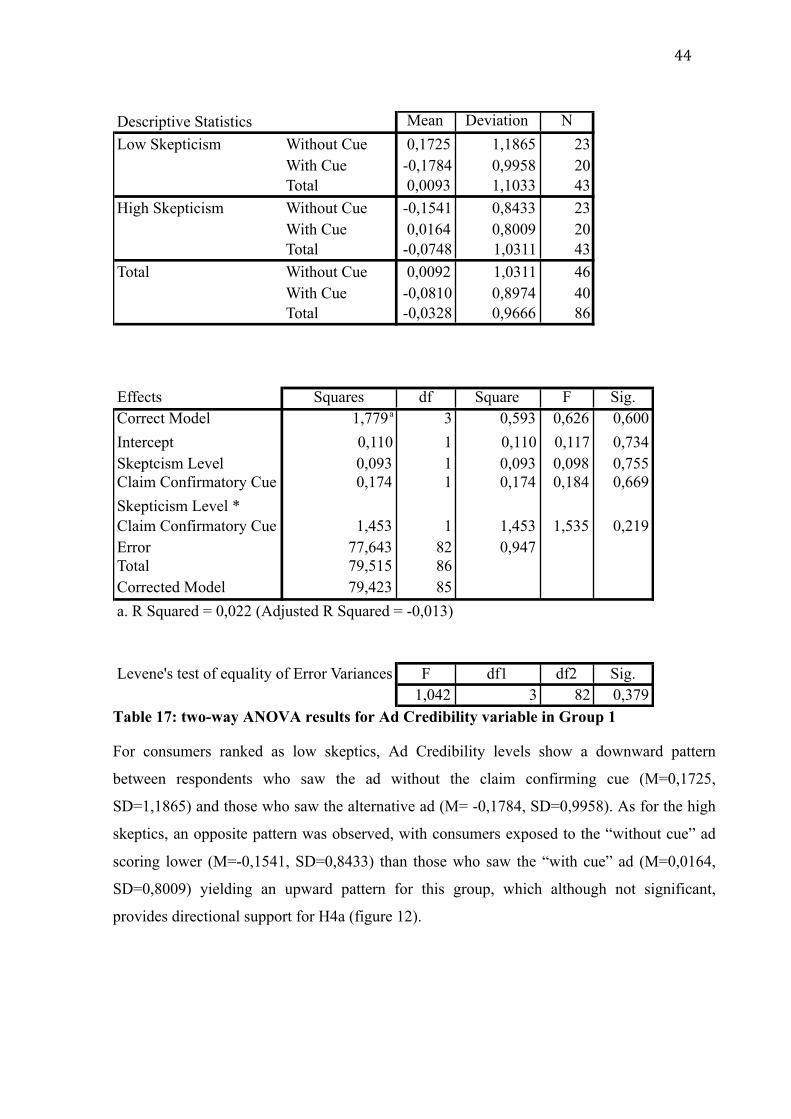
44
Table 17: two-way ANOVA results for Ad Credibility variable in Group 1
For consumers ranked as low skeptics, Ad Credibility levels show a downward pattern
between respondents who saw the ad without the claim confirming cue (M=0,1725,
SD=1,1865) and those who saw the alternative ad (M= -0,1784, SD=0,9958). As for the high
skeptics, an opposite pattern was observed, with consumers exposed to the “without cue” ad
scoring lower (M=-0,1541, SD=0,8433) than those who saw the “with cue” ad (M=0,0164,
SD=0,8009) yielding an upward pattern for this group, which although not significant,
provides directional support for H4a (figure 12).
Descriptive Statistics MeanStd.
Deviation NLow Skepticism Without Cue 0,1725 1,1865 23
With Cue -0,1784 0,9958 20Total 0,0093 1,1033 43
High Skepticism Without Cue -0,1541 0,8433 23With Cue 0,0164 0,8009 20Total -0,0748 1,0311 43
Total Without Cue 0,0092 1,0311 46With Cue -0,0810 0,8974 40Total -0,0328 0,9666 86
Test of Between-subjects Effects
Type III Sum of Squares df
Mean Square F Sig.
Correct Model 1,779a 3 0,593 0,626 0,600Intercept 0,110 1 0,110 0,117 0,734Skeptcism Level 0,093 1 0,093 0,098 0,755Claim Confirmatory Cue 0,174 1 0,174 0,184 0,669Skepticism Level * Claim Confirmatory Cue 1,453 1 1,453 1,535 0,219Error 77,643 82 0,947Total 79,515 86Corrected Model 79,423 85a. R Squared = 0,022 (Adjusted R Squared = -0,013)
Levene's test of equality of Error Variances F df1 df2 Sig.1,042 3 82 0,379

45
Figure 12: Interaction between level of skepticism and the use of Claim Confirming Product Cue on Ad Credibility (group 1)
Purchase Intention
A two-way ANOVA was undertaken to verify H2 and H4b. Hypothesis 2 predicted that the
use of a Claim Confirming Product Cue would increase consumer’s Purchase Intention, and
the results show that in average, those who saw the ad that did not feature de claim
confirming cue scored higher (M=0,0264, SD=1,1312) than those exposed to ad that had such
claim (M=-1,1114, SD=0,8725). Although such results proved to be non-significant
[F(1,82)=0,402, p>0,05] (table 18), rejecting therefore H2, the direction of the results were
opposite to what was expected.
As for H4b, it stated that the use of Claim Confirming Product Cue would have greater impact
on consumers’ Purchase Intention for those who present higher levels of skepticism. Just like
for H4a, non-significant results were found F(1, 82)=0,039, p>0,05 (table 18), which then
rejects H4b as well.
Claim confirming product cueWith CueWithout Cue
Estim
ated
Mar
gina
l Mea
ns
!0,3%
!0,2%
!0,1%
0%
0,1%
0,2%
0,3%
Low%Skep/cism%
High%Skep/cism%
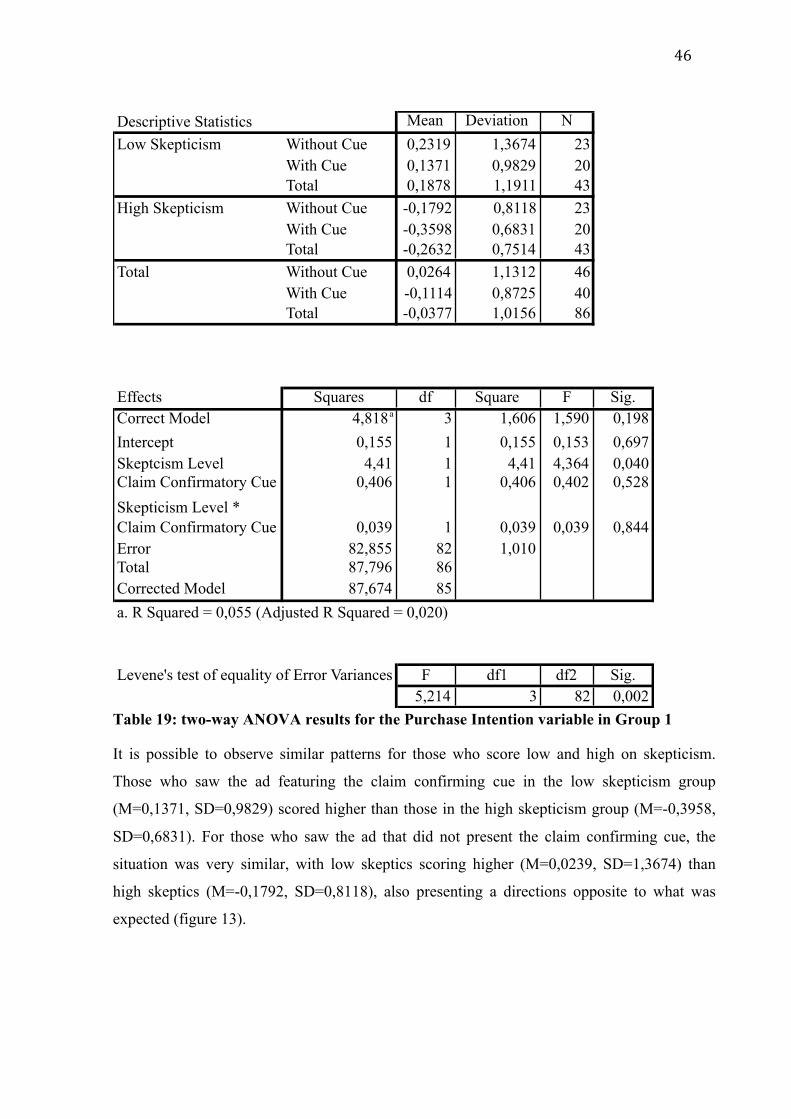
46
Table 19: two-way ANOVA results for the Purchase Intention variable in Group 1
It is possible to observe similar patterns for those who score low and high on skepticism.
Those who saw the ad featuring the claim confirming cue in the low skepticism group
(M=0,1371, SD=0,9829) scored higher than those in the high skepticism group (M=-0,3958,
SD=0,6831). For those who saw the ad that did not present the claim confirming cue, the
situation was very similar, with low skeptics scoring higher (M=0,0239, SD=1,3674) than
high skeptics (M=-0,1792, SD=0,8118), also presenting a directions opposite to what was
expected (figure 13).
Descriptive Statistics MeanStd.
Deviation NLow Skepticism Without Cue 0,2319 1,3674 23
With Cue 0,1371 0,9829 20Total 0,1878 1,1911 43
High Skepticism Without Cue -0,1792 0,8118 23With Cue -0,3598 0,6831 20Total -0,2632 0,7514 43
Total Without Cue 0,0264 1,1312 46With Cue -0,1114 0,8725 40Total -0,0377 1,0156 86
Test of Between-subjects Effects
Type III Sum of Squares df
Mean Square F Sig.
Correct Model 4,818a 3 1,606 1,590 0,198Intercept 0,155 1 0,155 0,153 0,697Skeptcism Level 4,41 1 4,41 4,364 0,040Claim Confirmatory Cue 0,406 1 0,406 0,402 0,528Skepticism Level * Claim Confirmatory Cue 0,039 1 0,039 0,039 0,844Error 82,855 82 1,010Total 87,796 86Corrected Model 87,674 85a. R Squared = 0,055 (Adjusted R Squared = 0,020)
Levene's test of equality of Error Variances F df1 df2 Sig.5,214 3 82 0,002

47
Figure 13: Level of skepticism and the use of Claim Confirming Product Cue on Purchase Intention (group 1)
Perceived Risk
The same procedure was undergone to verify H3 and H4c. Hypothesis 3 states that the use of
a Claim Confirming Product Cue would not decrease consumer’s Perceived Risk toward the
advertised product, and it was not rejected. Respondents who saw the ad featuring the Claim
Confirming Product Cue scored a little higher (M=0,0602, SD=0,9896) than those who saw
the other ad (M=-0,0189, SD=1,0791), but the difference in scores was not significant
[F(1,82)=0,121, p>0,05] (table 19). Hypothesis 4c states that the use of Claim Confirming
Product Cues would have no greater impact on consumers’ Perceived Risk for those who
present higher levels of skepticism. The interaction between the levels of skepticism and the
use of Claim Confirming Product Cues produced non-significant results [F(1,82)=1,747,
p>0,05] (table 19), also confirming hypothesis 4c.
Claim confirming product cueWithout Cue With Cue
Estim
ated
Mar
gina
l Mea
ns
!0,4%
!0,3%
!0,2%
!0,1%
0%
0,1%
0,2%
0,3%
Low%Skep0cism%
High%Skep0cism%

48
Table 19: two-way ANOVA results for the Perceived Risk dependent variable in Group 1
Those in the low skepticism group who saw the ad that presents the Claim Confirming
Product Cue scored higher (M=0,2017, SD=1,0392) than those who saw the alternative
ad (M=-‐0,1775, SD=1,1576), but in the high skepticism results were the opposite,
contrary to what was expected. A downward pattern was generated by a higher score
from those who saw the ad that did not feature the Claim Confirming Product Cue
(M=0,1397, SD=1,0341) when compared to the score of those who saw the ad that did
present such Cue (M=-‐0,0812, SD=0,9423), as seen in figure 14.
Descriptive Statistics MeanStd.
Deviation NLow Skepticism Without Cue -0,1775 1,1576 23
With Cue 0,2017 1,0392 20Total -0,0012 1,1077 43
High Skepticism Without Cue 0,1397 1,0341 23With Cue -0,0812 0,9423 20Total 0,0369 0,9871 43
Total Without Cue -0,0189 1,0971 46With Cue 0,0602 0,9896 40Total 0,0179 1,0431 86
Test of Between-subjects Effects
Type III Sum of Squares df
Mean Square F Sig.
Correct Model 2,092a 3 0,697 0,632 0,596Intercept 0,037 1 0,037 0,033 0,856Skeptcism Level 0,006 1 0,006 0,006 0,940Claim Confirmatory Cue 0,134 1 0,234 0,121 0,728Skepticism Level * Claim Confirmatory Cue 1,926 1 1,926 1,747 0,190Error 90,398 82 1,102Total 92,517 86Corrected Model 92,489 85a. R Squared = 0,023 (Adjusted R Squared = -0,013)
Levene's test of equality of Error Variances F df1 df2 Sig.0,622 3 82 0,603

49
Figure 14: Interaction between level of skepticism and the use of Claim Confirming Product Cue on Perceived Risk (group 1)
4.2.1.2 Group 2
Very similar analysis to those performed in Group 1 were made in Group 2, which then
enables a briefer report of the results. Just like was the case for Group 1, the results found for
the interactions between the level of skepticism and the use of Claim Confirming Product Cue,
the results obtained with Group 2 were non-significant. Hypothesis 4a was rejected, since Ad
Credibility suffered no impact from the interaction mentioned above [F(1,113)=2,392,
p>0,05] (table 20). The same happened with the Purchase Intention variable measure [F(1,
113)=0,777, p>0,05] (table 21), which also rejected H4b. As for H4c, since it predicted no
significant interaction between the level of skepticism and the use of Claim Confirming
Product Cues affecting the level of Perceived Risk, it was confirmed [F(1,113)=0,000,
p>0,05] (table 22).
As for H1, it was also rejected for group 2 [F(1,113)=2,891, p>0,05], and the same happened
for H2 [F(1,113)=0,556, p>0,05]. However, differently from what was found in Group 1, the
main effect of the use or not the Claim Confirming Product Cue, was found significant for
Perceived Risk [F(1,113)=5,921, p<0,05] (table 22).
Claim confirming product cueWithout Cue With Cue
Estim
ated
Mar
gina
l Mea
ns
!0,3%
!0,2%
!0,1%
0%
0,1%
0,2%
0,3%
Low%Skep/cism%
High%Skep/cism%

50
Table 20: two-way ANOVA results for Ad Credibility in Group 2
Descriptive Statistics MeanStd.
Deviation NLow Skepticism Without Cue 0,4578 1,1113 27
With Cue -0,1235 1,0743 31Total 0,1471 1,1209 58
High Skepticism Without Cue -0,1046 0,8669 28With Cue -0,1321 0,7850 31Total -0,1191 0,8178 59
Total Without Cue 0,1714 1,0251 55With Cue -0,1278 0,9331 62Total 0,0129 0,9847 117
Test of Between-subjects Effects
Type III Sum of Squares df
Mean Square F Sig.
Correct Model 6,959a 3 2,32 2,484 0,064Intercept 0,069 1 0,069 0,074 0,786Skeptcism Level 2,376 1 2,376 2,544 0,113Claim Confirmatory Cue 2,7 1 2,700 2,891 0,092Skepticism Level * Claim Confirmatory Cue 2,234 1 2,234 2,392 0,125Error 105,515 113 0,934Total 112,494 117Corrected Model 112,474 116a. R Squared = 0,062 (Adjusted R Squared = 0,037)
Levene's test of equality of Error Variances F df1 df2 Sig.2,794 3 113 0,044

51
Table 21: two-way ANOVA results for Purchase Intention in Group 2
Descriptive Statistics MeanStd.
Deviation NLow Skepticism Without Cue 0,3721 0,8923 27
With Cue 0,0732 1,0887 31Total 0,2124 1,0048 58
High Skepticism Without Cue -0,1311 1,0269 28With Cue -0,1061 0,9370 31Total -0,1179 0,9722 59
Total Without Cue 0,1160 0,9874 55With Cue -0,0164 1,0114 62Total 0,0458 0,9981 117
Test of Between-subjects Effects
Type III Sum of Squares df
Mean Square F Sig.
Correct Model 4,490a 3 1,497 1,523 0,213Intercept 0,316 1 0,316 0,321 0,572Skeptcism Level 3,393 1 3,393 3,452 0,066Claim Confirmatory Cue 0,547 1 0,547 0,556 0,457Skepticism Level * Claim Confirmatory Cue 0,764 1 0,764 0,777 0,380Error 111,071 113 0,983Total 115,806 117Corrected Model 115,561 116a. R Squared = 0,039 (Adjusted R Squared = 0,013)
Levene's test of equality of Error Variances F df1 df2 Sig.0,838 3 113 0,476

52
Table 22: two-way ANOVA results for Perceived Risk in Group 2
However, even though all hypothesis were rejected, the average scores obtained from Group 2
indicated a direction opposite to what was expected. When Ad Credibility is concerned, the
average score of those who saw the ad that did not feature the Claim Confirming Cue was
higher (M=0,1714, SD=1,0251) than of those who saw the alternative ad (M=-0,1278,
SD=0,9331) (table 20), which then contradicts H1.
The same happened with the measures of Perceived Risk (table 22). Considering that lower
scores on the scale indicate lesser perception of risk, respondents exposed to the ad “without”
the Claim Confirming Cues scored lower (M=-0,2534, SD=1,0387) than those who saw the
ad “with” such resource (M=0,1894, SD=0,9205) (figure 15).
Descriptive Statistics MeanStd.
Deviation NLow Skepticism Without Cue -0,3100 1,0916 27
With Cue 0,1312 1,0153 31Total -0,0742 1,0655 58
High Skepticism Without Cue -0,1988 1,0021 28With Cue 0,2477 0,8276 31Total 0,0358 0,9340 59
Total Without Cue -0,2534 1,0387 55With Cue 0,1894 0,9205 62Total -0,0187 0,9985 117
Test of Between-subjects Effects
Type III Sum of Squares df
Mean Square F Sig.
Correct Model 6,096a 3 2,032 2,096 0,105Intercept 0,123 1 0,123 0,127 0,722Skeptcism Level 0,378 1 0,378 0,39 0,534Claim Confirmatory Cue 5,741 1 5,741 5,921 0,017Skepticism Level * Claim Confirmatory Cue 0,000 1 0,000 0,000 0,989Error 109,563 113 0,970Total 115,700 117Corrected Model 115,659 116a. R Squared = 0,053 (Adjusted R Squared = 0,028)
Levene's test of equality of Error Variances F df1 df2 Sig.0,961 3 113 0,414

53
Figure 15: Levels of Claim Confirming Product Cue and Skepticism on Ad Credibility and Perceived Risk (Group 2)
4.2.1.3 Further analysis
Although many years of research have yielded little consensus as to the impact generated by
the use of product cues in product claims, contrary to what was hypothesized in this study the
use of Claim Confirming Product Cues does not increase ads’ perceived credibility and
Purchase Intention. To further investigate the phenomenon, under the assumption that the
level of consciousness about the Claim Confirming Cue might have some impact on
respondents, I used one of the verifying questions I had inserted in the questionnaire, the one
regarding whether the participant saw the Claim Confirming Product Cue in the ad. Those
who saw the ad that did not feature any Claim Confirming Product Cue should answer no to
that question, and the opposite goes for those who saw the ad that presented such resource.
Even though someone who saw the ad “with” the cue may have answered “no” to that
question and still be impacted on a subconscious manner by it, for the next analysis I
separated the respondents who answered differently than what was expected from those who
could verbalize what they had seen. I tested for the interaction between the use of Claim
Confirming Product Cue and the awareness respondents had about such resource. Thus, two-
way ANOVAs were performed again for all three dependent variables in the two groups, and
results were different in some important aspects.
Group 1
When it comes to Ad Credibility, although the main effect of Ad Type [F(1, 82)=1,428,
p>0,05] and Manipulation Awareness [F(1,82)=0,983, p>0,05] were still not significant (table
Claim confirming product cue Claim confirming product cueWithout Cue With Cue
AD CREDIBILITY PERCEIVED RISK
Without Cue With Cue
Estim
ated
Mar
gina
l Mea
ns
!0,3%
!0,2%
!0,1%
0%
0,1%
0,2%
0,3%
0,4%
0,5%
Low%Skep1cism%
High%Skep1cism%
!0,4%
!0,3%
!0,2%
!0,1%
0%
0,1%
0,2%
0,3%

54
23), the interaction effect between the two factors proved to be significant [F(1,82)=11,352,
p<0,01, which indicates the level of awareness about the use of Claim Confirming Product
Cues have an impact on how the respondents processed both types of ad.
When analyzing the average scores obtained from the participants, to those who declared
perceiving the manipulation, respondents who saw the ad featuring the Claim Confirming
Product Cue scored higher on Ad Credibility (M=0,0669, SD=0,9651) than those who saw the
ad without the Cue (M=-0,3839, SD=0,9395), which provides directional support for H1.
However, for those who declared not perceiving the manipulation, results indicate the
opposite, with respondents who were exposed to the ad without the Cue scoring higher
(M=0,5203, SD=0,9327) than those who saw the ad featuring the Claim Confirming Cue
(M=-0,4262, SD=0,6192), as shown in figure 15.
Table 23: two-way ANOVA results for the Ad Credibility variable re-run with sample split by manipulation awareness in Group 1
Descriptive StatisticsMean
Std. Deviation N
Without Claim Confirming Cue did not perceive the manipulation 0,5203 0,9327 20did perceive the manipulation -0,3839 0,9395 26Total 0,0092 1,0311 46
With Claim Confirming Cue did not perceive the manipulation -0,4262 0,6192 12did perceive the manipulation 0,0669 0,9651 28Total -0,0810 0,8974 40
Total did not perceive the manipulation 0,1654 0,9412 32did perceive the manipulation -0,1502 0,9709 54Total -0,0328 0,9666 86
Test of Between-subjects Effects Type III Sum of Squares dfMean Square F Sig.
Correct Model 11,459a 3 3,82 4,608 0,005Intercept 0,239 1 0,239 0,289 0,592Ad type 1,183 1 1,183 1,428 0,236Manipulation awareness 0,815 1 0,815 0,983 0,324Ad type*Manipualtion perception 9,409 1 9,409 11,352 0,001Error 67,964 82 0,829Total 79,515 86Corrected Model 79,423 85a. R Squared = 0,144 (Adjusted R Squared = 0,113)
Levene's test of equality of Error Variances F df1 df2 Sig.0,668 3 82 0,574

55
Figure 15: Interaction between Ad Type and Manipulation Awareness for Ad Credibility in Group 1
The same happened to the Purchase Intention variable. The interaction effect between the ad
type and the manipulation awareness was significant [F(1,82)=7,244, p<0,01] (table 24),
indicating that being fully conscious of the existence of Claim Confirming Product Cues
exacerbate its effects, even though the manipulation awareness main effect is not significant
[F(1,82)=0,041, p>0,05]. Again, as seen in figure 16, those who perceived the manipulation
and saw the ad without the Cue scored lower (M=-0,2563, SD=0,9614) than those who were
aware of the manipulation and saw the ad with the Cue (M=0,0566, SD=0,8879), providing
directional support for H2 as well.
Figure 16: Interaction between Ad Type and Manipulation Awareness for Purchase Intention in Group 1
Claim confirming product cue
Estim
ated
Mar
gina
l Mea
ns
Without Cue With Cue!0,60%
!0,40%
!0,20%
0,00%
0,20%
0,40%
0,60%
Did%not%perceive%the%manipula8on%
Did%perceive%the%manipula8on%
Claim confirming product cueWithout Cue With Cue
Estim
ated
Mar
gina
l Mea
ns
!0,60%
!0,40%
!0,20%
0,00%
0,20%
0,40%
0,60%
Did%not%perceive%the%manipula8on%
Did%perceive%the%manipula8on%

56
Table 24: two-way ANOVA results for the Purchase Intention variable re-run with sample split by manipulation awareness in Group 1
As for Perceived Risk, the same pattern was observed. Although neither the main effect of the
use of Claim Confirming Product Cue [F(1,82)=1,321, p>0,05] (table 25) nor the main effect
of the manipulation awareness [F(1,82)=0,046, p>0,05] were significant, the interaction effect
between such factors proved to be significant [F(1,82)=8,570, p<0,01]. Although H3 was
confirmed, the average scores obtained from the respondents (figure 17) provide directional
support for the rejection of H3, indicating that even the perception of risk may be positively
influenced by the correct use of Claim Confirming Product Cue.
Descriptive Statistics MeanStd.
Deviation NWithout Claim Confirming Cue did not perceive the manipulation 0,3939 1,2502 20
did perceive the manipulation -0,2563 0,9614 26Total 0,0264 1,1312 46
With Claim Confirming Cue did not perceive the manipulation -0,5032 0,7244 12did perceive the manipulation 0,0566 0,8879 28Total -0,1114 0,8725 40
Total did not perceive the manipulation 0,0575 1,1570 32did perceive the manipulation -0,0941 0,9287 54Total -0,0377 1,0156 86
Test of Between-subjects Effects Type III Sum of Squares dfMean Square F Sig.
Correct Model 7,816a 3 2,605 2,675 0,053Intercept 0,460 1 0,460 0,473 0,494Ad type 1,644 1 1,644 1,688 0,197Manipulation awareness 0,039 1 0,039 0,041 0,841Ad type*Manipualtion perception 7,055 1 7,055 7,244 0,009Error 79,857 82 0,974Total 87,796 86Corrected Model 87,674 85a. R Squared = 0,089 (Adjusted R Squared = 0,056)
Levene's test of equality of Error Variances F df1 df2 Sig.0,927 3 82 0,432

57
Table 25: two-way ANOVA results for the Perceived Risk variable re-run with sample split by manipulation awareness in Group 1
Figure 17: graph showing the interaction between Ad Type and Manipulation Awareness for Perceived Risk in Group 1
It is notable that the response pattern for those who declared not being aware of the
manipulation is similar for the three variables. For the respondents who were exposed to the
ad that did not feature the Claim Confirming Product Cue, not being aware of the
Descriptive Statistics MeanStd.
Deviation NWithout Claim Confirming Cue did not perceive the manipulation -0,3714 0,8910 20
did perceive the manipulation 0,2523 1,1779 26Total -0,0189 1,0971 46
With Claim Confirming Cue did not perceive the manipulation 0,5660 0,8779 12did perceive the manipulation -0,1566 0,9685 28Total 0,0602 0,9896 40
Total did not perceive the manipulation -0,0199 0,9862 32did perceive the manipulation 0,0403 1,0839 54Total 0,0179 1,0431 86
Test of Between-subjects Effects Type III Sum of Squares dfMean Square F Sig.
Correct Model 8,917a 3 2,972 2,916 0,039Intercept 0,406 1 0,406 0,399 0,530Ad type 1,347 1 1,347 1,321 0,254Manipulation awareness 0,047 1 0,047 0,046 0,83Ad type*Manipualtion perception 8,734 1 8,734 8,570 0,004Error 83,572 82 1,019Total 92,517 86Corrected Model 92,489 85a. R Squared = 0,096 (Adjusted R Squared = 0,063)
Levene's test of equality of Error Variances F df1 df2 Sig.0,529 3 82 0,664
Claim confirming product cueWithout Cue With Cue
Estim
ated
Mar
gina
l Mea
ns
!0,60%
!0,40%
!0,20%
0,00%
0,20%
0,40%
0,60%
Did%not%perceive%the%manipula8on%
Did%perceive%the%manipula8on%

58
manipulation means seeing something in the product that they considered being in accordance
with the product claim, which then may explain the good scores obtained from respondents in
that condition. Also, such possibility confirms the benefits producers may acquire from the
use of this type of cue.
Group 2
The results from Group 2 followed similar pattern to Group 1. For all the variables, the
interaction effect between Ad Type and Manipulation awareness was significant (Ad
Credibility [F(1,113)=14,020, p<0,01], table 26; Purchase Intention [F1,113)=10,856, p<0,01],
table 27; Perceived Risk [F(1,113)=10,069, p<0,01], table 28), again indicating the possibility
that respondents’ level of awareness about the use of Claim Confirming Product Cues may
pose as an important factor as to the efficacy of such tool.
Just like happened with Group 1, H1 (figure 18) and H2 (figure 19) found directional support
in Group 2 as well, and H3, although confirmed, has also found directional support to be
rejected (figure 20). When Ad Credibility is concerned, respondents who perceived the
manipulation scored higher in the “with cue” situation (table 26), and the same happened
when it comes to Purchase Intention (table 27). As for Perceived Risk, those who were aware
of the manipulation and saw the ad featuring such manipulation scored lower than those who
saw the ad that did not present the Claim Confirming Cue (table 28).
When analyzed without the manipulation awareness split, Group 2 had presented results for
both H1 and H3 in the opposite direction of what was expected. The fact that splitting the
group causes such a difference in results serves as one more indication that Claim Confirming
Cues may be beneficial for producers if executed properly.
Just like in Group 1, respondents who declared not perceiving the manipulation revealed a
drop in Ad Credibility (figure 18), Purchase Intention (figure 19) and Perceived Risk (figure
20), which as mentioned before, also validates the role of the Claim Confirming Cue in
consumer’s information processing.

59
Table 26: two-way ANOVA results for the Ad Credibility variable re-run with sample split by manipulation awareness in Group 2
Figure 18: graph showing the interaction between Ad Type and Manipulation Awareness for Ad Credibility in Group 2
Descriptive StatisticsMean Std. Deviation N
Without Claim Confirming Cue did not perceive the manipulation 0,4884 1,0203 37did perceive the manipulation -0,4801 0,6814 18Total 0,1714 1,0251 55
With Claim Confirming Cue did not perceive the manipulation -0,3661 0,8503 23did perceive the manipulation 0,0127 0,9615 39Total -0,1278 0,9331 62
Total did not perceive the manipulation 0,1608 1,0394 60did perceive the manipulation -0,0143 0,9067 57Total 0,0129 0,9847 117
Test of Between-subjects Effects Type III Sum of Squares df Mean Square F Sig.Correct Model 16,043a 3 5,348 6,266 0,001Intercept 0,785 1 0,785 0,92 0,340Ad type 0,862 1 0,862 1,011 0,317Manipulation awareness 2,292 1 2,292 2,686 0,104Ad type*Manipualtion perception 11,965 1 11,965 14,020 0,000Error 96,431 113 0,853Total 112,494 117Corrected Model 112,474 116a. R Squared = 0,143 (Adjusted R Squared = 0,120)
Levene's test of equality of Error Variances F df1 df2 Sig.1,401 3 113 0,246
Claim confirming product cueWithout Cue With Cue
Estim
ated
Mar
gina
l Mea
ns
!0,60%
!0,40%
!0,20%
0,00%
0,20%
0,40%
0,60%
Did%not%perceive%the%manipula8on%
Did%perceive%the%manipula8on%
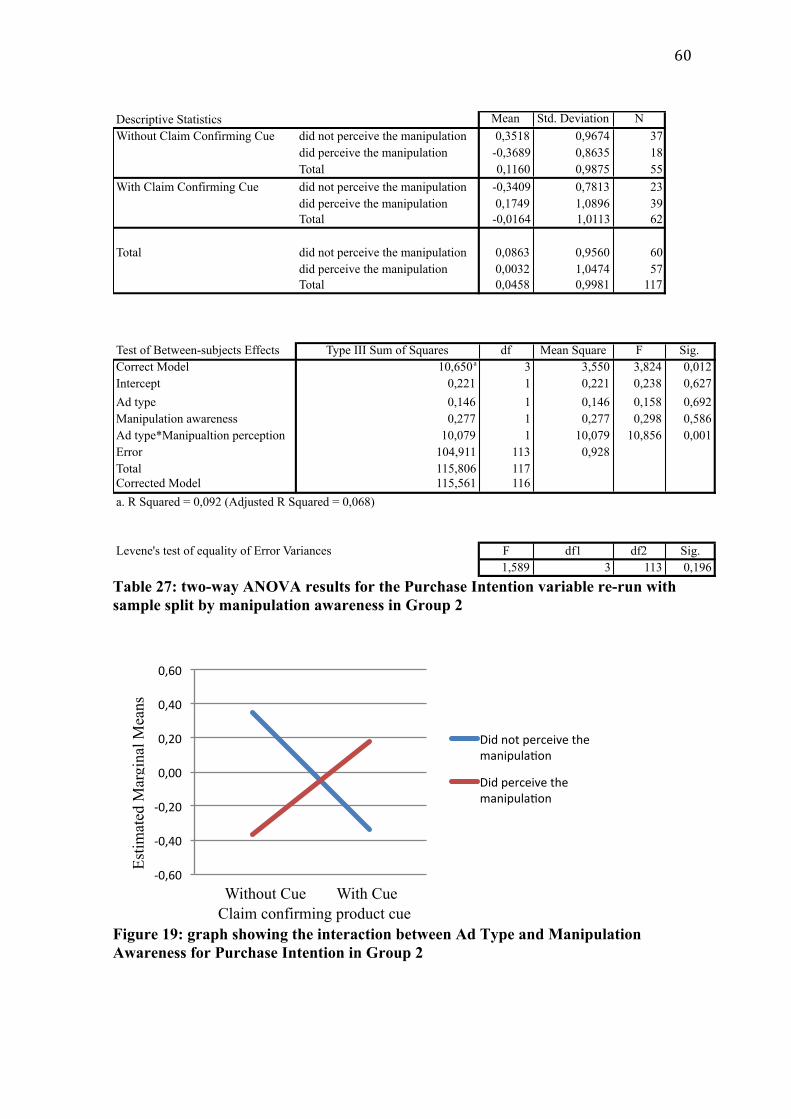
60
Table 27: two-way ANOVA results for the Purchase Intention variable re-run with sample split by manipulation awareness in Group 2
Figure 19: graph showing the interaction between Ad Type and Manipulation Awareness for Purchase Intention in Group 2
Descriptive Statistics Mean Std. Deviation NWithout Claim Confirming Cue did not perceive the manipulation 0,3518 0,9674 37
did perceive the manipulation -0,3689 0,8635 18Total 0,1160 0,9875 55
With Claim Confirming Cue did not perceive the manipulation -0,3409 0,7813 23did perceive the manipulation 0,1749 1,0896 39Total -0,0164 1,0113 62
Total did not perceive the manipulation 0,0863 0,9560 60did perceive the manipulation 0,0032 1,0474 57Total 0,0458 0,9981 117
Test of Between-subjects Effects Type III Sum of Squares df Mean Square F Sig.Correct Model 10,650a 3 3,550 3,824 0,012Intercept 0,221 1 0,221 0,238 0,627Ad type 0,146 1 0,146 0,158 0,692Manipulation awareness 0,277 1 0,277 0,298 0,586Ad type*Manipualtion perception 10,079 1 10,079 10,856 0,001Error 104,911 113 0,928Total 115,806 117Corrected Model 115,561 116a. R Squared = 0,092 (Adjusted R Squared = 0,068)
Levene's test of equality of Error Variances F df1 df2 Sig.1,589 3 113 0,196
Claim confirming product cueWithout Cue With Cue
Estim
ated
Mar
gina
l Mea
ns
!0,60%
!0,40%
!0,20%
0,00%
0,20%
0,40%
0,60%
Did%not%perceive%the%manipula8on%
Did%perceive%the%manipula8on%

61
Table 28: two-way ANOVA results for the Perceived Risk variable re-run with sample split by manipulation awareness in Group 2
Figure 20: graph showing the interaction between Ad Type and Manipulation Awareness for Perceived Risk in Group 2
Descriptive Statistics Mean Std. Deviation NWithout Claim Confirming Cue did not perceive the manipulation -0,5565 0,9168 37
did perceive the manipulation 0,3696 1,0180 18Total -0,2534 1,0387 55
With Claim Confirming Cue did not perceive the manipulation 0,3339 0,8424 23did perceive the manipulation 0,1043 0,9639 39Total 0,1894 0,9205 62
Total did not perceive the manipulation -0,2152 0,9839 60did perceive the manipulation 0,1881 0,9801 57Total -0,0187 0,9985 117
Test of Between-subjects Effects Type III Sum of Squares df Mean Square F Sig.Correct Model 16,863a 3 5,621 6,429 0,000Intercept 0,416 1 0,416 0,476 0,492Ad type 2,575 1 2,575 2,945 0,089Manipulation awareness 3,198 1 3,198 3,657 0,058Ad type*Manipualtion perception 8,803 1 8,803 10,069 0,002Error 98,797 113 0,874Total 115,700 117Corrected Model 115,659 116a. R Squared = 0,146 (Adjusted R Squared = 0,123)
Levene's test of equality of Error Variances F df1 df2 Sig.0,384 3 113 0,765
Claim confirming product cueWithout Cue With Cue
Estim
ated
Mar
gina
l Mea
ns
!0,60%
!0,40%
!0,20%
0,00%
0,20%
0,40%
0,60%
Did%not%perceive%the%manipula8on%
Did%perceive%the%manipula8on%

62
Taking such results into consideration, conclusions, implications, limitations and
opportunities for future research will be discussed next.

63
5. FINAL REMARKS
5.1 Conclusions
The Cue Utilization Theory posits that all offers found in market possess cues that allow
consumers to infer information about such offer, information that cannot be directly stated,
such as perceived quality. Since cues are based on offer’s attributes, they may be of intrinsic
(implying that, when altered, the offer itself is also altered) or extrinsic nature, and
researchers have not yet reached a consensus as to which is most valuable to consumers, but
have realized that they can be used differently by consumers depending on the occasion and
need.
When it comes to lending credibility to the product claim, the Economics of Information
Theory suggests that both intrinsic and extrinsic cues may play important roles, depending on
what the claim is. Such theory explores how consumers use and value information during any
purchase process, stating that people will look first for “cheap” information to make their
decisions. In that sense, offers found in the market may have Search Attributes, which are
verifiable prior to the purchase and consequently are the cheapest source of information
available; and Experience Attributes, which can only be verified through experience,
generally only possible after the purchase, hence making this information more expensive.
Offers may also be impregnated with Credence Attributes, which are not verifiable at all, and
depend highly on belief. Thus, an extrinsic cue such as price may play an important role
during the purchase process for being a very cheap Search Attribute. It allows consumers to
assume quality standards for the offer, for instance.
However, producers do not normally advertise their products using Search Attributes, making
a choice to differentiate their offers through Experience or maybe even Credence Attributes.
The problem lies in the credibility of such claims, which are less credible than those based on
Search Attributes, since they cannot be verified prior to the purchase. In that sense, this study
explored the use of Intrinsic Cues as a way of increasing product’s claim credibility.
Toothpaste was the selected product to assess the impact of the use of Claim Confirming
Product Cues, and an experiment was made with samples from two different populations,
namely (1) college students and (2) housewives, to allow for differences in age, family
income and, therefore, skepticism level.
64
At first, results from both groups showed no difference in the responses from those who had
been exposed to the “no Claim Confirming Product Cue” situation and those exposed to the
opposite situation, suggesting that the use of such artifice offers no benefits to the producer.
The housewives, group with higher skepticism level, even indicated a significant smaller
degree of belief when the Claim Confirming Product Cue was used, which may be an
indication that using such resource only exacerbates consumer’s skepticism.
However, the results are different if respondent’s level of awareness about the use of Claim
Confirming Product Cues is considered. Although still non-significant, results point to
opposite direction in terms of average scores. Now, those who were aware of the Cue’s
presence (or absence) and were exposed to the “no Claim Confirming Product Cue” situation
scored lower than those exposed to the alternative situation, indicating that the full perception
and awareness of the presence of such type of cues may play an important role in consumers’
information processing. These results were found in both groups, but in a stronger manner in
the housewives group, which may be an indicative that the use of Claim Confirming Product
Cue, when executed in a way that allows full acknowledgement on consumers part, may pose
as tool to diminish consumer skepticism toward advertising.
Producers may also benefit from the good use of Claim Confirming Product Cue in different
aspects. This study also measured the impacts of the use of such cue on consumers’ Purchase
Intentions and Perceived Risk, and the results obtained were in the same direction of those
found for Ad Credibility. That is, when consumers are aware of the presence of Claim
Confirming Product Cue, they show higher Purchase Intentions and also lower Perceived Risk,
which in turn may increase the offer’s perceived value.
When respondents declared not having perceived the Claim Confirming Product Cue
manipulation, results may also be an indicative of the importance of such type of cue. Those
respondents exposed to the situation where no Cue was presented to them should have
declared not seeing any cue that confirmed the product claim, which would mean that they did
perceive the manipulation. However, a number of respondents declared having seen cues that
confirmed the product’s claim, indicating that in their minds there was the presence of a
Claim Confirming Product Cue. Interestingly, the scores obtained from those respondents
were higher than the ones acquired from the respondents who did not see any Claim
Confirming Product Cues even when presented with them.

65
The situation above implies that having Claim Confirming Product Cues, real or imaginary,
offers benefits to the producers. However, leaving it up for consumer’s imagination may not
be an adequate solution for marketers, which then indicates that having a properly executed
Claim Confirming Product Cue poses as a possible solution for producers to improve their Ad
Credibility, increase consumer’s Purchase Intentions for their products and also decrease
product’s Perceived Risk level. So consumers must perceive the Confirming Product Cues.
Based on the results obtained, it is possible to say that combining Cue Utilization Theory and
Economics of Information Theory is not only possible, but may also produce benefits for the
marketer who execute it properly.
5.2 Implications
The discussion raised in this research may present benefits to a multitude of fields of
investigation, and have both scholar and managerial implications.
5.2.1 Theoretical Implications
As mentioned before, the results of many years of research have yet yielded little consensus
as to the impact generated by the use product cues. Therefore, this research offers a new
perspective on the topic, combining the Cue Utilization Theory to the Economics of
Information Theory aiming to investigate an unexplored aspect of the cue utilization, which is
the benefits it may offer to Ad Credibility, consumer’s Purchase Intention and product’s
Perceived Risk by the consumer.
In that sense, this research has also added to the discussion concerning whether intrinsic cues
are more important than extrinsic ones. It has been discussed that each type of cue is more
important in a specific situation, and this study has shown that, in the case of serving as
confirmation for product claim, intrinsic cues have proven its value when it comes to the three
dependent variable tested herein.
Also, some contribution is given to the literature of skepticism. As mentioned before, most
studies focus on communication strategies that can be used to reduce the negative impact of
skepticism, and little efforts have been done as to what other tools pertaining to the marketing
mix can be used with that same goal. The research herein investigates the use of product
characteristics as a possible alternative, which combined with communication strategies offer

66
benefits to the producer as far as Ad Credibility, Purchase Intention and perceiver risk is
concerned. That is also in line with the concern for ad effectiveness, since this research
indicates that mixing two elements of the marketing mix may present positive effects for the
marketer.
By indicating that consumer perception of the Claim Confirming Product Cue affects their
response to it, this research also contributes to the literature of consumer behavior, in the
sense that it adds new insights as to the effects of consumer perception,
Feature fatigue has been one theme covered in the literature related to product development
(Thompson, Hamilton, & Rust, 2005), with the conclusion that offering multiple features is a
good strategy in the pre-purchase stage, since it may lend better value perception to the
product, but may generate confusion in consumer’s mind during product use, decreasing
product value and also re-Purchase Intentions. The research herein offer an alternative
perspective on the matter in the sense that it indicates the possibility of offering fewer features
in a product and still maintain competitiveness during pre-purchase stage, which would
combine with less confusion during product use to increase product value as a whole.
5.2.2 Managerial Implications
Apart from the Feature Fatigue aspect discussed above, which has clear managerial
implications as well, this thesis may provide insights for practitioners in the sense that it
provides them with a tool to improve their Ad Credibility, increase consumers’ Purchase
Intentions toward their products and also decreasing the perception of risk associated with the
product they market.
However, to be able to crop all the benefits that may be offered by the use of Claim
Confirming Product Cues, this research has made clear to marketers that consumer research is
needed to ascertain that such claim is actually perceived by consumer, otherwise it may not
have the intended effect.
5.3 Limitations and Future Research
The intended manipulation of skepticism toward advertising did not work as intended, and the
use of a dispositional skepticism measure may be considered a shortfall. Although
representing a significant portion of the skepticism toward advertising construct, dispositional
67
skepticism do not account for the situational factors that are part of the consumer’s belief
(Forehand & Grier, 2003). Therefore, results might not be as accurate as one would expect
from a research intended to measure the effects of consumer’s skepticism toward advertising,
and validating the results found herein using a measure of such type of skepticism is
recommended.
Also, the manipulation of the use of Claim Confirming Product Cue proved to be
insufficiently designed, which caused many respondents to declare not having perceived it.
Although it was helpful in the sense that allowed the conclusions herein, it also caused the
sample size to be inadequate for a proper analysis. Some of the cells in the second round of
analysis were populated by few respondents, which may have compromised the analysis’
statistical validity, caused by difficulties in terms of normality of the sample, maybe even in
the significance level and statistical power obtained.
The choice for toothpaste as the product category to be tested may be seen as controversial,
since the risk involved in such purchase may be perceived as being not relevant by
respondents, which may therefore have biased some of the results, including the measure of
Perceived Risk. Therefore, new studies featuring different products categories, such as more
expensive products and products featuring different levels of involvement are welcome.
There are indications that some people are more cue-oriented than others (Dawar & Parker,
1994), which may then elicit new research in order to investigate any differences found in
diverse groups of people. This study researched people from different ages and different
financial status, and found little differences between them, which may be confirmed by the
fact that the use of cues is considered a Marketing Universal (Dawar & Parker, 1994).
However, further investigation on this matter is important. For instance, investigating if
people with differences in cultural background (i.e.: living in different regions of the country,
or in different countries), or religious beliefs, or even if children perceive Claim Confirming
Product Cues in a similar way may shed light on the topic.
Also, different effects of the use of Claim Confirming Product Cues may be tested. The
impact it may have on brand perception may offer good contribution to the Branding literature,
as well as whether it possesses any carry-over effect that could enhance brand equity in future
purchases made be the consumer.
68
REFERENCES
Atkin, J. L., & Beltramini, R. F. (2007). Exploring the Perceived Credibility of DTC Advetising in the US. Journal of Marketing Communications , 13 (3), 169-‐180.
Baker, M. J., & Churchill Jr., G. A. (1977). The Impact of Physically Attractive Models on Advertising. Journal of Marketing Research , 14, 538-‐555.
Barksdale, H. C., & Darden, W. R. (1972). Consumer Attitudes toward Marketing and Consumerism. The Journal of Marketing , 36 (4), 28-‐35.
Beatty, S., & Talpade, S. (1994). Adolescent Influence in Family Decision Making: a Replication with Extension. Journal of Consumer Research , 21, 332-‐341.
Bennet, P. D., & Harrel, G. D. (1975). The Role of Confidence in Understanding and Predicting Buyers’ Attitudes and Purchase Intentions. Journal of Consumer Research, 2 (2), 110-‐117.
Bettman, J. R. (1973). Perceived Risk and Its Components: A Model and Empirical Test. Journal of Marketing Research, 10 (2), 184-‐190
Bostad, I. (2011). The Life and Learning of Arne Naess: Scepticism as a Survival Strategy. Inquiry: An Interdisciplinary Journal of Philosophy , 54 (1), 42-‐51.
Bousch, D. M., Friestad, M., & Rose, G. M. (1994). Adolescent Skepticism Toward TV Advertising and Knowledge of Advertiser Tactics. Journal of Consumer Research , 21 (1), 165-‐175.
Bousch, D. M., Kim, C.-‐H., Kahle, L. R., & Batra, R. (1993). Cynism and Conformity as Correlates of Trust in Product Information Sources. Journal of Current Issues and Research in Advertising , 15 (2), 71-‐79.
Calfee, J. E., & Ford, G. T. (1988). Economics, Information and Consumer Behavior. In M. Houston (Ed.), Advances in Consumer Research. 15, pp. 234-‐138. Provo, UT: Association for Consumer Research.
Calfee, J. E., & Ringold, D. J. (1994). The 70% Majority: Enduring Consumers Beliefs About Advertising. Journal of Public Policy & Marketing , 13 (2), 228-‐238.
Chan, T.-‐S., & Cui, G. (2004). Consumer Attitudes toward Marketing in a Transitional Economy: a Replication and Extension. Journal of Consumer Marketing , 21 (1), 10-‐26.
Chang, T.-‐Z., & Wildt, A. R. (1994). Proce, Product, and Purchase Intention: an Empirical Study. Journal of the Academy of Marketing Science , 22 (1), 16-‐27.
Churchill, G. A., & Peter, J. P. (2000). Marketing: Criando Valor para o Cliente. (C. C. Moreira, Trans.) São Paulo: Saraiva.
Cummins, D. D. (1995). Naive Theories and Causal Deduction. Memory & Cognition , 23 (5), 646-‐658.

69
Darby, M. R., & Karni, E. (1973). Free Competition and the Optimal Amaunt of Fraud. Journal of Law and Economics , 16 (1), 67-‐88.
Dawar, N., & Parker, P. (1994). Marketing Universals: Consumers’ Use of Brand Name, Price, Physical Appearance, and Retailer Reputation as Signals of Product Quality. Journal of Marketing, 58, 81-‐95.
Ditto, P. H., & Lopez, D. F. (1992). Motivated Skepticism: Use of Differential Decision Criteria for Preferred and Nonpreferred Conclusions. Journal of Personality and Social Psychology , 63 (4), 568-‐584.
Dodds, W. B., Monroe, K. B., & Dhruv, G. (1991). Effects of Price, Brand, and Store Information on Buyers Product Evaluations. Journal of Marketing Research , 28 (3), 307-‐319.
Field, Andy. Descobrindo a Estatística usando SPSS; tradução Larí Viali. 2. Ed. Porto Alegre: Artmed (2009)
Ford, G. T., Smith, D. B., & Swasy, J. L. (1990). Consumer Skepticism of Advertising CLaims: Testing Hypothises from Economics of Information. Journal of Consumer Research , 16 (4), 433-‐441.
Forehand, M. R., & Grier, S. (2003). When is Honesty the Best Policy? THe Efect of Stated Company Intent on Consumer Skepticism. Journal of Consumer Psychology , 13 (3), 349-‐356.
Forsythe, S., Kim, J. O., & Petee, T. (1999). Product Cue Usage in Two Asian Markets: a Cross-‐Cultural Comparison. Asia Pacific Journal of Management, 16, 275-‐292.
Friestad, M., & Wright, P. (1994). The Persuasion Knowledge Model: How People Cope with Persuasion Attempts. Journal of Consumer Research , 21, 1-‐31.
Gaski, J. F., & Etzel, M. J. (1986). The Index of Consumer Sentiment toward Marketing. Journal of Marketing , 50 (3), 71-‐81.
Hawkins, S. A., & Hoch, S. J. (1992). Low-‐Involvement Learning: Memory without Evaluation. Journal of Consumer Research , 19 (2), 212-‐225.
Helm, A. (2004). Cynics and Skeptics: COnsumer Dispositional Trust. Advances in Consumer Research , 31, 345-‐351.
Holak, S. L., Lehmann, D. R. (1990). Purchase Intentions and the Dimensions of Innovation: An Exploratory Model. Journal of Product Innovation Management, 7, 59-‐73
Hunt, S. D. (2003). Controversy in Marketing Theory: For Reason, Realism, Truth, and Objectivity. Armonk, NY: M. E. Sharpe.
Hurtt, R. K. (2010). Development of a Scale to Measure Professional Skepticism. Auditing , 29 (1), 149-‐171.

70
Jacoby, J., & Kaplan, L. B. (1972). The Components of Perceived Risk. Proceedings of the Third Annual Conference of the Association for Consumer Research. (pp. 382-‐393). Association for Consumer Research.
____________ , Olson, J. C., & Haddock, R. A. (1971). Price, Brand Name, and Product Composition Characteristics as Determinants of Perceived Quality. Journal of Applied Psychology , 55 (6), 570-‐579.
Kaplan, L. B., Szybillo, G. J., & Jacoby, J. (1974). Components of Perceived Risk in Product Purchase: a Cross-‐Validation. Journal of Applied Psychology, 3, 287-‐291.
Kotler, P., & Keller, K. L. (2006). Administração de Marketing (12th ed.). (M. Roemberg, B. R. Fernandes, & C. Freire, Trans.) São Paulo: Pearson Prentice Hall.
Kotler, P., Kartajaya, H., & Setiawan, I. (2010). Marketing 3.0: As Forças que estão Definido o Novo Marketing Centrado no Ser Humano. Rio de Janeiro: Elsevier.
Laroche, M., Kim, C, & Zhou, L. (1996). Brand Familiarity and Confidence as Determinants of Purchase Intention: An Empirical Test in a Multiple Brand Context. Journal of Business Research, 37, 115-‐120
Leavitt, H. J. (1954). A Note on Some Experimental Findings About the Meaning of Price. The Journal of Business , 27 (3), 205-‐210.
Levine, D. M., Stephan, D., Krehbiel, T. C., & Berenson, M. L. (2005). Estatística: Teoria e Aplicações Usando o Microsoft Excell em Português. Rio de Janeiro: LTC.
Levitt, T. (1981, May-‐June). Marketing Intangible Product and Product intangibles. Harvard Business Review , pp. 94-‐102.
Lutz, R. J., MacKenzie, S. B., & Belch, G. E. (1983). Attitude toward the Ad as a Mediator of Advertising Effectiveness: Determinants and Consequences. Advances in Consumer Research , 10, 532-‐539.
_________ , & Reilly, P. J. (1974). An Exploration of the Effects of Perceived Social and Performance Risk on Consumer Information Acquisition. Advances in Consumer Research, 1, 393-‐405.
MacInnis, D. J., Moorman, C., & Jaworski, B. J. (1991). Enhancing and Measuring Consumers' Motivation, Opportunity, and Ability to Process Brand Information from Ads. Journal of Marketing , 55, 32-‐53.
MacKenzie, S. B., & Lutz, R. J. (1989). An Empirical Examination of the Structural Antecedents of Attitude toward the Ad in an Advertising Pretesting Context. The Journal of Marketing , 53 (2), 48-‐65.
Maloney, J. C. (1963). Is Advertising Really Important? Journal of Marketing , 27 (4), 1-‐8.
Marshall, R., & Na, W. (2003). An Experimental Study of the Role of Brand Strength in the Relationship Between the Medium of Communication and Perceived Credibility of the Message. Journal of Interactive Marketing , 17 (3), 75-‐79.

71
Miller, D. W., & Foust, J. E. (2003). Classifying Services by Tangibility/Intangibility of Attributes and Benefits. Services Marketing Quarterly , 24 (4), 35-‐55.
Mitchell, Vincent-‐Wayne (1999). Consumer Perceived Risk: Conceptualisations and Models. European Journal of Marketing, 33 (1), 163-‐195
Miyazaki, A. D., Grewal, D., & Goodstein, R. C. (2005). The Effect of Multiple Extrinsic Cues on Quality Perceptions: a Matter of Consistency. Journal of Consumer Research , 32 (1), 146-‐153.
Mohr, L. M., Eroglu, D., & Ellen, P. S. (1998). THe Development and Testing of a Measure of Skepticism Toward Environmental Claim in Marketers' Communications. Journal of Consumer Affairs , 32 (1), 30-‐55.
Moore-‐Shay, E., & Lutz, R. (1988). Intergenerational Influences in the Formation of Consumer Attitudes and Beliefs about the Marketplace: Mothers and Daughters. In M. J. Houston (Ed.), Advances in Consumer Research. 15, pp. 461-‐467. Provo, UT: Association for Consumers Research.
Muehling, D. D. (1987). An Investigation of Factors Underlying Attitude-‐Toward-‐Advertising-‐In-‐General. Journal of Advertising , 16 (1), 32-‐40.
Murray, K. B., & Schlacter, J. L. (1990). The Impact of Services versus Goods on Consumers’ Assessment of Perceived Risk and Variability. Journal of the Academy of Marketing Science, 18 (1), 51-‐65
Nelson, P. (1974). Advertising as Information. Journal of Political Economy , 82, 729-‐754.
Nelson, P. (1970). Information and Consumer Behavior. Journal of Political Economy , 78 (2), 311-‐329.
Nielsen, J. H., & Escalas, J. E. (2010). Easier is not always Better: The Moderating Role of Processing Type on Preference Fluency. Journal of Consumer Psychology, 20, 295-‐305.
Obermiller, C., & Spangenberg, E. R. (1998). Development of a Scale to Measure Consumer Skepticism Toward Advertising. Journal of Consumer Psychology , 7 (2), 159-‐186.
Obermiller, C., & Spangenberg, E. R. (2000). On the Origins and Distinctness of Skepticism toward Advertising. Journal of Consumer Psychology , 7 (2), 159-‐186.
Obermiller, C., Spangenberg, E. R., & MacLachlan, D. M. (2005). Ad Skepticism: the Consequences of Disbelief. Journal of Advertising , 34 (3), 7-‐17.
Olson, J. C., & Jacoby, J. (1972). Cue Utilization in the Quality Perception Process. Proceedings of the Third Annual Conference of the Association for Consumer Research. (pp. 167-‐179). Association for Consumer Research.
Ostlund, L. E. (1974). Perceived Innovation Attributes as Predictors of Innovativeness. Journal of Consumer Research, 1 (2), 23-‐29.

72
Prendergast, G., Liu, P.-‐Y., & Poon, D. T. (2009). A Honk Kong Study of Advertising Credibility. Journal of Consumer Marketing , 26 (5), 320-‐329.
Priest, J. (1968). Humanism, Skepticism, and Pessimism in Israel. Journal of the American Academy of Religion , 36 (4), 311-‐326.
Putrevu, S. (2001). Exploring the Origins and Information Processing Differences Between Men and Women: Implications for Advertisers. Academy of Marketing Science Review , 2001 (10), 1-‐14.
Putrevu, S., & Lord, K. R. (1994). Comparative and Noncomparative Advertising: Attitudinal Effects Under Cognitive and Affective Involvement Conditions. Journal of Advertising , 23, 77-‐90.
Rao, A. R., & Monroe, K. B. (1989). The Effect of Price, Brand Name, and Store name on Buyers' Perception of Product Quality: an integrative Review. Journal of Marketing Research , 26 (3), 351-‐357.
Richardson, P. S., Dick, A. S., & Jain, A. K. (1994). Extrinsic and Intrinsic Cue Effects on Perceptions of Store Brand Quality. Journal of Marketing , 58 (4), 28-‐36.
Roselius, Ted (1971). Consumer Rankings of Risk Reduction Methods. Journal of Marketing, 35 (1), 56-‐61
Rushton, A. M., & Carson, D. J. (1989). The Marketing of Services: Managing the Intangibles. European Journal of Marketing , 23 (8), 23-‐44.
Sandage, C. H., & Leckenby, J. D. (1980). Student Attitudes Toward Advertising: Institution vs Instrument. Journal of Advertising , 9 (2), 29-‐44.
Shimp, T. A., & Bearden, W. O. (1982). Warranty and Other Extrinsic Cue Effects on Consumers’ Risk Percepetions. Journal of Consumer Research, 9 (1), 38-‐46.
Shostack, G. L. (1977). Breaking Free from Product Marketing. Journal of Marketing , 41 (April), 73-‐80.
Stigler, G. J. (1961). The Economics of Information. Journal of Political Economy , 69 (3), 213-‐225.
Stone, R. N., & Grønhaug, K. (1993). Perceived Risk: Further Considerations for the Marketing Discipline. European Journal of Marketing, 27 (3), 39-‐50
Sullivan, G. L., & Burger, K. J. (1987). An Investigation of the Determinants of Cue Utilization. Psychology & Marketing , 4, 63-‐74.
Szybillo, G. J., & Jacoby, J. (1974). Intrinsic vs Extrinsic Cues as Determinants of Perceived Product Quality. Journal of Applied Psychology , 59 (1), 74-‐78.
Thompson, D. V., Hamilton, R. W., & Rust, R. T. (2005). Feature Fatigue: When Product Capabilities Become Too Much of a Good Thing. Journal of Marketing Research , 42 (4), 432-‐442.

73
Tsiotsou, R. (2006). The Role of Perceived Product Quality and Overall Satisfaction on Purchase Intentions. International Journal of Consumer Studies , 30 (2), 207-‐217.
Urbany, J. E., Dickson, P. R., Wilkie W. L. (1989). Buyer Uncertainty and Information Search. Journal of Consumer Research, 16 (2), 208-‐215.
Varadarajan, P. R., & Thirunarayana, P. N. (1990). Consumers' Attitudes towards Marketing Practices, Consumerism, and Government Regulations: Cross-‐National Perspectives. The European Journal of Marketing , 24 (6), 6-‐23.
Yoon, E., & Kijewski, V. (1997). Dynamics of the Relationship between Product Features, Quality Evaluation, and Pricing. Pricing Strategy & Practice , 5 (2), 45-‐60.
Zeithaml, V. A. (1988). Consumer's Perception of Price, Quality, and Value: a Means-‐End Model and Synthesis of Evidence. Journal of Marketing , 52 (3), 2-‐22.

74
APPENDIX A: Results of pre-test of product category involvement
Points for each category represent the sum of the points representing the answers on the likert scale, considering the last question had to be reversed. The lower the points, the lower the involvement.
A F 14 14 13 12 16 10B M 18 11 11 16 20 7B F 14 10 8 16 16 9B F 11 18 8 16 13 10B F 17 10 4 10 16 9A M 20 13 9 14 20 7A F 13 5 7 12 16 7A M 20 10 10 12 20 7
Shampoo LaptopLaundry
DetergentUniversity Gender Smartphone Toothpaste MP3 Player
B F 15 12 7 15 13 9B M 7 13 18 4 19 9B F 15 14 19 16 16 7

75
APPENDIX B: Manipulation for skepticism level as used in Nielsen
and Escalas (2010)
Regular instructions: A seguir lhe será exibida uma proposta de anúncio de uma nova marca de creme dental. Esta é uma primeira proposta, e gostaríamos de saber sua opinião sobre o anúncio. Ao ver o anúncio, analise-o como se a agência tivesse lhe pedido um feedback para o conceito utilizado no anúncio. Skepticism Instructions: A seguir lhe será exibida uma proposta de anúncio de uma nova marca de creme dental. Esta é uma primeira proposta, e gostaríamos de saber sua opinião sobre o anúncio. Ao ver o anúncio, analise-o de maneira critica, avaliando as características do produto descritas no anúncio. !

76
APPENDIX C: manipulation for skepticism toward advertising
Article stating that ads are deceitful
Article stating that ads are not deceitful

77
APPENDIX D: Scales back-translation
T1: translator 1 T2: translator 2 O: original
SCALE: PRODUCT INVOLVEMENT 1. De forma geral, eu tenho um grande interesse por esta categoria de produto.
T1: Overall, I have great interest for this product category T2: Overall, I have a great interest in this product category.
O: In general, I have a strong interest in this product category.
2. Esta categoria de produto é muito importante pra mim. T1: This product category is very important to me
T2: This product category is very important to me. O: This product category is very important to me.
3. Esta categoria de produto significa muito pra mim.
T1: This product category means a lot to me T2: This product category means a lot to me.
O: This product category matters a lot to me.
4. Fico entediado quando as pessoas conversam comigo sobre esta categoria de produto. T1: I get bored when people talk about this product category
T2: I get bored when people talk to me about this product category. O: I get bored when other people talk to me about this product category
SCALE: DISPOSITIONAL SKEPTICISM 1. Eu normalmente aceito as explicações de outras pessoas sem nem pensar muito.
T1: I usually accept explanations from others without thinking too much T2: I usually accept the explanations of others without thinking much. O: I often accept other people’s explanations without further thought.
2. Eu me sinto bem comigo mesmo. T1: I feel good about myself

78
T2: I feel good about myself.
O: . I feel good about myself.
3. Eu espero até ter mais informações para tomar decisões. T1: I wait until have more information before taking decisions
T2: I wait to have more information to make decisions. O: . I wait to decide on issues until I can get more information.
4. A possibilidade de aprender me agrada.
T1: The possibility of learning pleases me. T2: The possibility to learn pleases me.
O: The prospect of learning excites me.
5. Tenho interesse pelas causas do comportamento das pessoas. T1: I’m interested in the causes of people’s behavior.
T2: I have interest in the causes of people's behavior. O: I am interested in what causes people to behave the way they do
6. Sou confiante em minhas habilidades.
T1: I’m confident of my skills T2: I am confident in my skills.
O: I am confident of my abilities
7. Eu normalmente rejeito afirmações caso não tenha provas de que são verdadeiras. T1: I usually reject statements if there is no evidence that they are true.
T2: I usually reject claims in case I have no evidence that they are true. O: I often reject statements unless I have proof that they are true.
8. A descoberta de novas informações é algo que me agrada.
T1: Discovering new information is something that pleases me. T2: The discovery of new information is something that pleases me.
O: Discovering new information is fun.
9. Tenho tempo para tomar minhas decisões. T1: I have time to make my own decisions.

79
T2: I have time to make my decisions.
O: I take my time when making decisions.
10. A tendência é que eu sempre aceite o que os outros me dizem. T1: The tendency is that I always accept what others tell me.
T2: The tendency is that I always accept what others tell me. O: I tend to immediately accept what other people tell me.
11. O comportamento das outras pessoas não me interessa.
T1: I’m not interested in other people’s behavior/ The behavior of others doesn’t interest me T2: The behavior of others does not interest me.
O: Other people’s behavior does not interest me.
12. Eu sou seguro. T1: I’m confident.
T2: I am confident. O: I am self-assured.
13. Meus amigos me dizem que normalmente eu questiono tudo que ouço ou vejo.
T1: My friends often tell me that I question everything I hear or see. T2: My friends often tell me that I question everything I hear or see.
O: My friends tell me that I usually question things that I see or hear.
14. Eu gosto de entender o motivo do comportamento das pessoas. T1: I like to understand why people behave the way they behave.
T2: I like to understand why people behave the way they behave. O: I like to understand the reason for other people’s behavior.
15. Eu acredito que aprender coisas novas é muito empolgante.
T1: I believe that learning new things is very exciting. T2: I believe that learning new things is very exciting.
O: I think that learning is exciting.
16. Eu normalmente aceito aquilo que vejo. T1: I usually accept what I see.

80
T2: I usually accept what I see.
O: I usually accept things I see, read or hear at face value.
17. Eu não me sinto muito seguro quanto a mim mesmo. T1: I don’t feel very secure about myself.
T2: I do not feel very confident about myself O: . I do not feel sure of myself.
18. Normalmente eu vejo inconsistências em explicações que ouço.
T1: Normally I see inconsistencies in explanations I hear. T2: Normally I see inconsistencies in explanations I hear
O: I usually notice inconsistencies in explanations.
19. Na maioria das vezes, eu concordo com o que os outros no meu grupo pensam. T1: Most of the time, I agree with what others in my group think.
T2: In most cases, I agree with what others in my group think. O: Most often I agree with what the others in my group think.
20. Não me agrada ter que tomar decisões rapidamente.
T1: I don’t like having to make decisions quickly. T2: I do not like having to make decisions quickly.
O: I dislike having to make decisions quickly.
21. Sou autoconfiante. T1: I’m self confident
T2: I'm self confident. O: I have confidence in myself.
22. Eu não gosto de tomar decisões sem antes avaliar todas as informações que tenho à mão.
T1: I don’t like making decisions without assessing all the information I have at hand. T2: I do not like making decisions without evaluating all the information I have at hand.
O: I do not like to decide until I’ve looked at all of the readily available information.
23. A busca por conhecimento me agrada. T1: The search for knowledge pleases me.
81
T2: The search for knowledge pleases me.
O: I like searching for knowledge
24. Eu frequentemente questiono as coisas que escuto ou vejo. T1: I often question things I hear or see.
T2: I often question things I hear or see. O: I frequently question things that I see or hear.
25. É fácil as outras pessoas me convencerem.
T1: It's easy for me to be convinced by others. T2: It's easy for other people to convince me.
O: It is easy for other people to convince me.
26. Eu raramente levo em consideração porque as pessoas se comportam de certo modo. T1: I rarely take into consideration why people behave a certain way.
T2: I rarely take into consideration why people behave a certain way. O: I seldom consider why people behave in a certain way.
27. Eu gosto de garantir que considerei todas as informações disponíveis na hora de tomar minha decisão. T1: I like to make sure I considered all available information when making my decision.
T2: I like to make sure that I considered all available information when making my decision. O: I like to ensure that I’ve considered most available information before making a decision.
28. Gosto de pensar a respeito de quanto aquilo que ouço ou leio é verdadeiro.
T1: I like to weigh if what I hear or read is true. T2: I like to ponder if what I hear or read is true.
O: I enjoy trying to determine if what I read or hear is true.
29. Eu aprecio aprender coisas novas. T1: I like to learn new things
T2: I enjoy learning new things. O: I relish learning.
30. As ações das pessoas e os motivos para tais ações são fascinantes.

82
T1: People's actions and the reasons for such actions are fascinating.
T2: People's actions and the reasons for such actions are fascinating. O: The actions people take and the reasons for those actions are fascinating.
SCALE: SKEPTICISM TOWARD ADVERTISING 1. Podemos acreditar que conseguiremos a verdade na maioria das propagandas.
T1: We can believe that we will be able to get the truth in most advertisements. T2: We believe that we can achieve the truth in most advertisements.
O: We can depend on getting the truth in most advertising.
2. O objetivo da propaganda é informar o consumidor. T1: The purpose of advertising is to inform consumers.
T2: The purpose of advertising is to inform consumers. O: Advertising’s aim in to inform the consumer.
3. Eu acredito que propagandas sejam informativas.
T1: I believe that advertisements are informative. T2: I believe that advertisements are informative.
O: I believe advertising is informative.
4. Propagandas geralmente são verdadeiras. T1: Advertisements are usually true.
T2: Advertisements are usually true. O: Advertising is generally truthful.
5. Propaganda é uma fonte de informação confiável a respeito da qualidade e desempenho do produto. T1: Advertising is a source of reliable information about the quality and performance of the product. T2: Propaganda is a source of reliable information about the quality and performance of the product. O: Advertising is a reliable source of information about the quality and performance of products.
6. Propaganda é uma verdade bem dita.
83
T1: Propaganda is a truth well told.
T2: Propaganda is a truth well told. O: Advertising is truth well told.
7. De forma geral, a propaganda apresenta uma imagem verdadeira do produto anunciado.
T1: In general, advertising presents a true picture of the product advertised. T2: In general, advertising presents a true picture of the product advertised.
O: In general, advertising presents a true picture of the product being advertised
8. Depois de assistir a maioria das propagandas, sinto que fui precisamente informado sobre o produto anunciado.
T1:After watching most of the advertisements, I feel that I was precisely informed about the advertised product.
T2: After watching most of the advertisements, I feel that I was just informed about the advertised product.
O: I feel I’ve been accurately informed after viewing most advertisements.
9. A maioria das propagandas traz informações essenciais ao consumidor. T1: Most advertisements brings key information to consumers.
T2: Most advertisements bring key information to consumers. O: Most advertising provides consumers with essential information.
SCALE: AD CREDIBILITY 1. As promessas do produto no anúncio são verdadeiras.
T1: The promises of the product in the ad are true. T2: The promises of the product in the advertisement are true.
O: The claims in the ad are true.
2. Eu acredito nas promessas do produto no anúncio. T1: I believe in the promises of the product in the ad.
T2: I believe in the promises of the product in the advertisement. O: I believe the claims in the ad.
3. O anúncio é sincero.
T1: The ad is sincere.

84
T2: The advertisement is sincere.
O: The ad is sincere.
4. Eu acho que o anúncio é desonesto. T1: I think the ad is dishonest.
T2: I think the advertisement is dishonest. O: I think the ad is dishonest.
SCALE: PURCHASE INTENTION 1. Você gostaria de experimentar este produto?
T1: Would you like to try this product? T2: Would you like to try this product?
O: Would you like to try this product?
2. Você compraria este produto caso o visse em uma loja? T1: Would you buy this product if you see it in a store?
T2: Would you buy this product if you saw it in a store? O: Would you buy this product if you happened to see it in a store?
3. Você procuraria este produto em uma loja com a intenção de comprá-lo?
T1: Would you look for this product in a store with the intention to buy it? T2: Would you look for this product in a store with the intention of buying it?
O: Would you actively seek out this product in a store in order to purchase it?
SCALE: PERCEIVED RISK
1. Qual seu nível de certeza sobre a capacidade do (a) _________ter um desempenho satisfatório?
T1: What is your level of certainty about the ________ ability to have a satisfactory performance?
T2: What is your level of certainty about the ability of _________ to have a satisfactory performance? O: How sure are you about the ________’s ability to perform satisfactorily?
2. Levando em consideração os problemas associados com o desempenho do(a) __________, qual o nível de risco você diria estar associado com a compra do(a) novo(a) ________?

85
T1: Taking into account the problems associated with the performance of _______, which is the level of risk you would associate with the purchase of the new _________? T2: Taking into account the problems associated with the performance of __________, what level of risk you would consider to be associated with the purchase of the new ________? O: Considering the possible problems associated with _______’s performance, how much risk would you say would be involved with purchasing the new ______?
3. Em sua opinião, você acredita que se o(a) novo(a) _________ fosse lançado(a) ele(a) teria um desempenho tão bom quanto os dos produtos já existentes no mercado?
T1: In your opinion, do you believe that if the new _______ was launched it would perform as well as the products already on the market?
T2: In your opinion, do you believe that if the new ______was launched _________ it would perform as good as the products already in the market?
O: In your opinion, do you feel that the new ______ if introduced would perform as well as other _______ now on market?
4. Qual seu nível de confiança na capacidade do(a) _________ ter um desempenho condizente com o esperado? T1: What is your level of confidence in the ability of __________ to have a performance consistent with expected? T2: What is your level of confidence in the ability of ________ to have a performance aligned with your expectations? O: How confident are you of the _______’s ability to perform as expected?