Embed Size (px)
Citation preview
Institutionen för fysik, kemi och biologi
Examensarbete
The effect of water chemistry and fibre-size distribution on dissolved air flotation efficiency
Anna Sjölander
Examensarbetet utfört vid Holmen Paper och Noss 2009-01-01 – 2009-06-18
LITH-IFM-G-EX—09/2090—SE
Linköpings universitet Institutionen för fysik, kemi och biologi 581 83 Linköping
Institutionen för fysik, kemi och biologi
The effect of water chemistry and fibre-size distribution on dissolved air flotation efficiency
Anna Sjölander
Examensarbetet utfört vid Holmen Paper och Noss 2009-01-01 – 2009-06-18
Handledare
Christer Sandberg, Holmen Paper Martin Gustavsson, Noss
Examinator
Stefan Svensson, IFM
Avdelning, institution Division, Department
Chemistry Department of Physics, Chemistry and Biology Linköping University
URL för elektronisk version
ISBN ISRN: LITH-IFM-G-EX--09/2090--SE _________________________________________________________________ Serietitel och serienummer ISSN Title of series, numbering ______________________________
Språk Language
Svenska/Swedish Engelska/English
________________
Rapporttyp Report category
Licentiatavhandling Examensarbete C-uppsats D-uppsats Övrig rapport
_____________
Titel Title
The effect of water chemistry and fibre-size distribution on dissolved air flotation efficiency Författare Author
Anna Sjölander
Nyckelord Keyword
Dissolved air flotation, DAF, micro flotation, removal efficiency, factorial design, thermomechanical pulp, white water
Sammanfattning Abstract
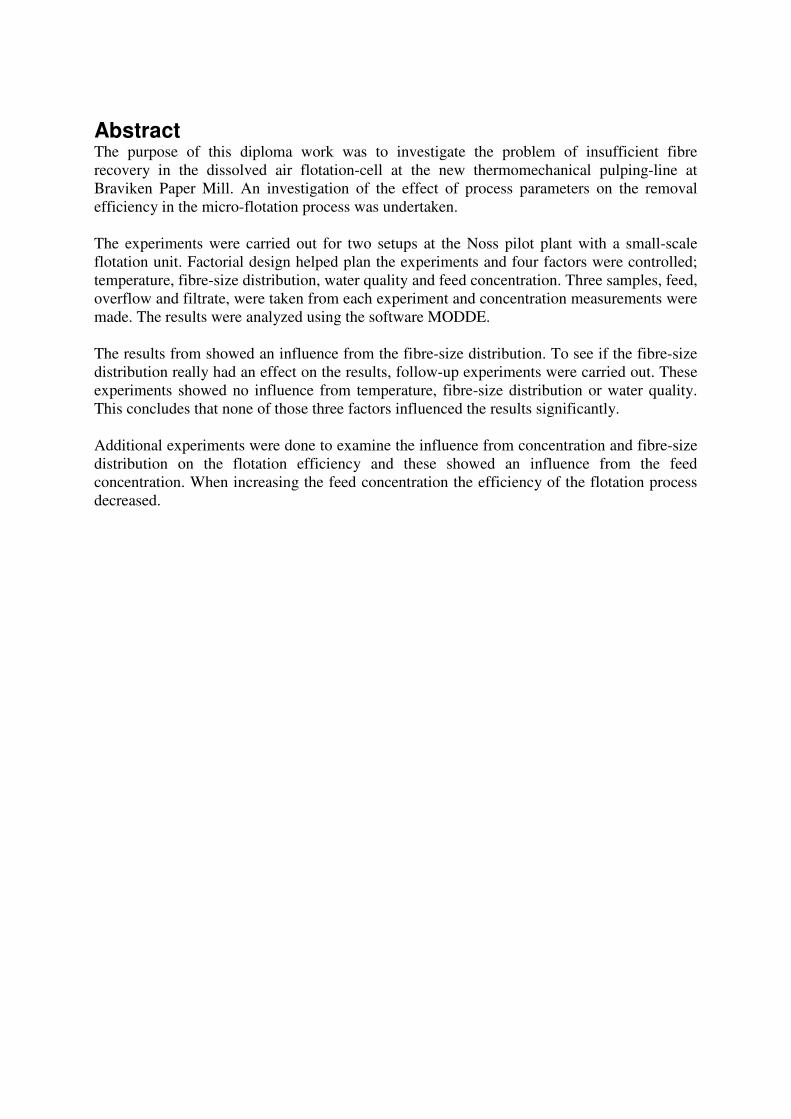
The purpose of this diploma work was to investigate the problem of insufficient fibre recovery in the dissolved air flotation-cell at the new thermomechanical pulping-line at Braviken Paper Mill. An investigation of the effect of process parameters on the removal efficiency in the micro-flotation process was undertaken. The experiments were carried out for two setups at the Noss pilot plant with a small-scale flotation unit. Factorial design helped plan the experiments and four factors were controlled; temperature, fibre-size distribution, water quality and feed concentration. Three samples, feed, overflow and filtrate, were taken from each experiment and concentration measurements were made. The results were analyzed using the software MODDE. The results from showed an influence from the fibre-size distribution. To see if the fibre-size distribution really had an effect on the results, follow-up experiments were carried out. These experiments showed no influence from temperature, fibre-size distribution or water quality. This concludes that none of those three factors influenced the results significantly. Additional experiments were done to examine the influence from concentration and fibre-size distribution on the flotation efficiency and these showed an influence from the feed concentration. When increasing the feed concentration the efficiency of the flotation process decreased.
Datum Date 2009-06-03
Abstract
The purpose of this diploma work was to investigate the problem of insufficient fibre recovery in the dissolved air flotation-cell at the new thermomechanical pulping-line at Braviken Paper Mill. An investigation of the effect of process parameters on the removal efficiency in the micro-flotation process was undertaken. The experiments were carried out for two setups at the Noss pilot plant with a small-scale flotation unit. Factorial design helped plan the experiments and four factors were controlled; temperature, fibre-size distribution, water quality and feed concentration. Three samples, feed, overflow and filtrate, were taken from each experiment and concentration measurements were made. The results were analyzed using the software MODDE. The results from showed an influence from the fibre-size distribution. To see if the fibre-size distribution really had an effect on the results, follow-up experiments were carried out. These experiments showed no influence from temperature, fibre-size distribution or water quality. This concludes that none of those three factors influenced the results significantly. Additional experiments were done to examine the influence from concentration and fibre-size distribution on the flotation efficiency and these showed an influence from the feed concentration. When increasing the feed concentration the efficiency of the flotation process decreased.
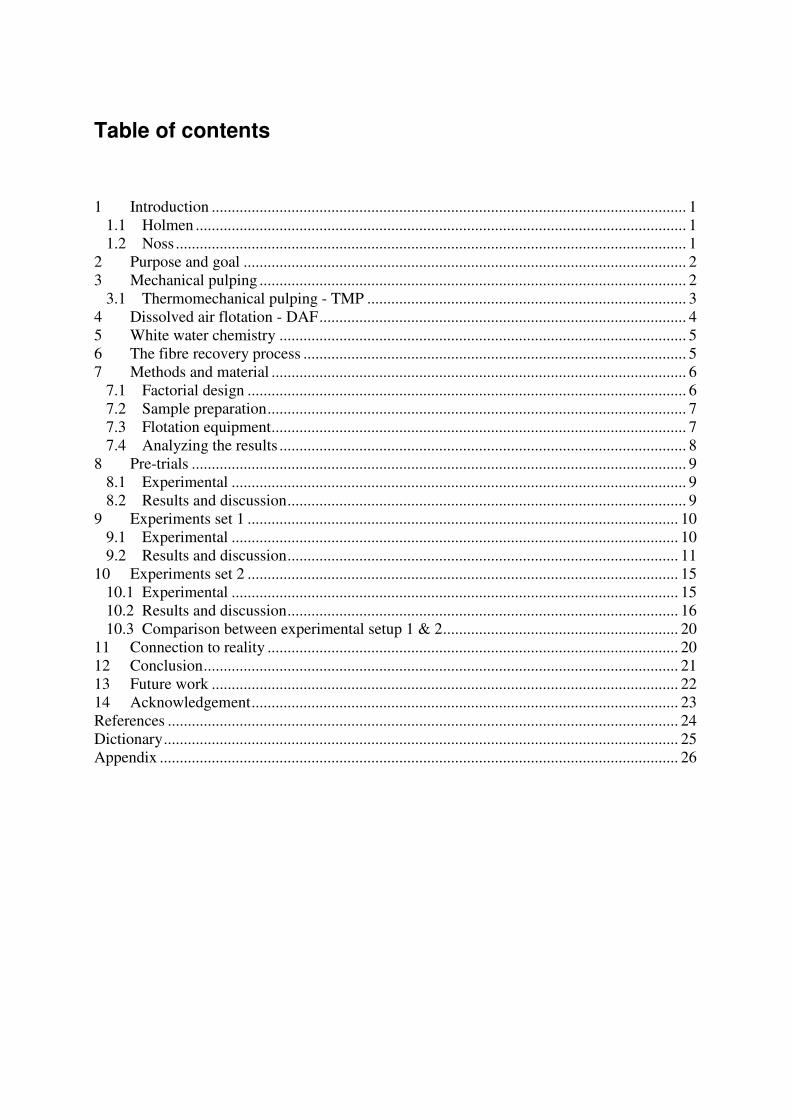
Table of contents
1 Introduction ....................................................................................................................... 1
1.1 Holmen ........................................................................................................................... 1 1.2 Noss ................................................................................................................................ 1
2 Purpose and goal ............................................................................................................... 2 3 Mechanical pulping ........................................................................................................... 2
3.1 Thermomechanical pulping - TMP ................................................................................ 3 4 Dissolved air flotation - DAF............................................................................................ 4 5 White water chemistry ...................................................................................................... 5 6 The fibre recovery process ................................................................................................ 5 7 Methods and material ........................................................................................................ 6
7.1 Factorial design .............................................................................................................. 6 7.2 Sample preparation......................................................................................................... 7 7.3 Flotation equipment........................................................................................................ 7 7.4 Analyzing the results ...................................................................................................... 8
8 Pre-trials ............................................................................................................................ 9 8.1 Experimental .................................................................................................................. 9 8.2 Results and discussion.................................................................................................... 9
9 Experiments set 1 ............................................................................................................ 10 9.1 Experimental ................................................................................................................ 10 9.2 Results and discussion.................................................................................................. 11
10 Experiments set 2 ............................................................................................................ 15 10.1 Experimental ................................................................................................................ 15 10.2 Results and discussion.................................................................................................. 16 10.3 Comparison between experimental setup 1 & 2........................................................... 20
11 Connection to reality ....................................................................................................... 20 12 Conclusion....................................................................................................................... 21 13 Future work ..................................................................................................................... 22 14 Acknowledgement........................................................................................................... 23 References ................................................................................................................................ 24 Dictionary................................................................................................................................. 25 Appendix .................................................................................................................................. 26
1
1 Introduction The purpose of all pulping processes is to separate the fibres from each other and make them suitable for papermaking. The fibres can be separated either in a chemical process, a mechanical process or in a combination of the two. [1] Wood consists of different cell types of which, for soft wood, the tracheids are the most frequent and normally just called fibres. The cell walls are built up of cellulose, hemicellulose and lignin, where the lignin holds the fibres together. The fibre wall consists of fibrils (thin threadlike aggregates of cellulose chains) with lignin and hemicellulose holding it together. [2] In chemical pulping the lignin and hemicellulose are dissolved and removed to separate the fibres. In the mechanical pulping process the fibres are separated by mechanical defibration [3]. Even the chemical pulping process requires refining to make the pulp suitable for papermaking. [1] The ideal properties of the pulp vary depending on the final product. Examples of different properties are: strength, opacity, brightness, bulk and smoothness. One product may need good strength while another requires high opacity. [1] Lignin is a complex cross-linked racemic macromolecule and is relatively hydrophobic and aromatic in nature. The lignin has a negative impact on the paper qualities because of its sensibility to ultraviolet light, making the paper sheet yellow and frail. [4] Hemicelluloses are branched polysaccharides composed of many monosaccharides. Hemicelluloses have shorter chains of monosaccharides than cellulose. Cellulose is un-branched with hydrophilic properties and is insoluble in water and most organic solvents. [5]
1.1 Holmen
Holmen is a forest products group manufacturing printing paper, paperboard and sawn timber. The Holmen group also owns forests and power plants. The number of employees was about 5000 in the whole group (2007). Holmen is the fifth largest producer of printing paper and paperboard in Europe. In Holmen Group there are five business areas; Holmen Paper (newsprint and magazine paper), Iggesund Paperboard (paperboard), Holmen Timber (sawn timber), Holmen Skog (forestry) and Holmen Energi (power plants). [6] Holmen Paper has its head office in Norrköping and manufactures wood-containing printing paper with paper mills located in Hallstavik, Norrköping and Madrid. Braviken Paper Mill is located outside Norrköping and has tree paper machines. In August 2008 a new pulp line was started, which produces thermomechanical pulp (TMP) for newsprint and special printing paper. The new pulp line contains already established technology but also new developed equipment never carried out in full scale before. [7]
1.2 Noss
Noss is a Swedish company supplying advanced fibre development systems in form of equipment for cleaning, screening, thickening, fibre fractionation and deaeration. Noss has been active since the early 1950’s and today over 1000 Noss installations are operating in various applications in mills all over the world. Noss has about 100 employees. All machinery and spare parts are manufactured in Norrköping, where costumer trials also are performed at the full scale pilot plant. [8]
2
2 Purpose and goal The purpose of this diploma work was to investigate the problem with nonsufficient fibre recovery in the DAF-unit (dissolved air flotation-unit) at the new TMP-line (thermomechanical pulping-line) at Holmen Paper, Braviken. An investigation of the effect of process parameters on the removal efficiency of the micro-flotation process was made. Studied variables were water quality, temperature and fibre-size distribution. The chosen variables were studied with factorial design (with help from the software MODDE) to evaluate their influence on the results. The goal of this diploma work was to improve the fibre and fines removal efficiency in the DAF- based fibre recovery process.
3 Mechanical pulping There are two major ways to produce mechanical pulp, either by grinding or by refining. When wooden logs are pressed against a revolving grindstone it is called grinding and when woodchips are defibrated in a disc refiner it is called refining. Depending on the final product demand both procedures can be adjusted to get a pulp with desirable quality. Grinding tends to produce pulp with good optical properties, while refining produces pulp with good strength. With mechanical pulp it is possible to produce a paper sheet with high opacity and bulk. When comparing chemical pulping and mechanical pulping, the mechanical process has higher yield, lower capital costs and is less complicated. The pulp has high light-scattering, fairly high brightness and smoothness and high bulk. The pulp has also good formation properties. The drawbacks with mechanical pulp are high electrical energy consumption and demand on high quality wood raw materials. Mechanical fibres have lower bonding capacity than chemical fibres which leads to lower overall strength. [1] Below are three examples of mechanical pulping processes, where TMP and CTMP are the two main processes that are used.
o RMP – refiner mechanical pulp. Wood chips are mechanically defibrated in a refiner without any pre-treatment. The refining takes place under atmospheric pressure and at a temperature at about 100°C. [3]
o TMP – thermomechanical pulp. Woodchips are preheated with pressurized steam and refined under pressure at elevated temperature. The pressure of the steam is normally 3-5 bars and has a temperature of 130-155°C. TMP has a yield of 97.5%. [1][3]
o CTMP – chemi-thermomechanical pulp. Pressurized refining of chemically preheated woodchips gives CTMP a relatively gentle chemical treatment in comparison with chemical pulping. The yield is over 90%. Even though chemicals are used it is considered to belong to the mechanical pulps. [1][3]
3
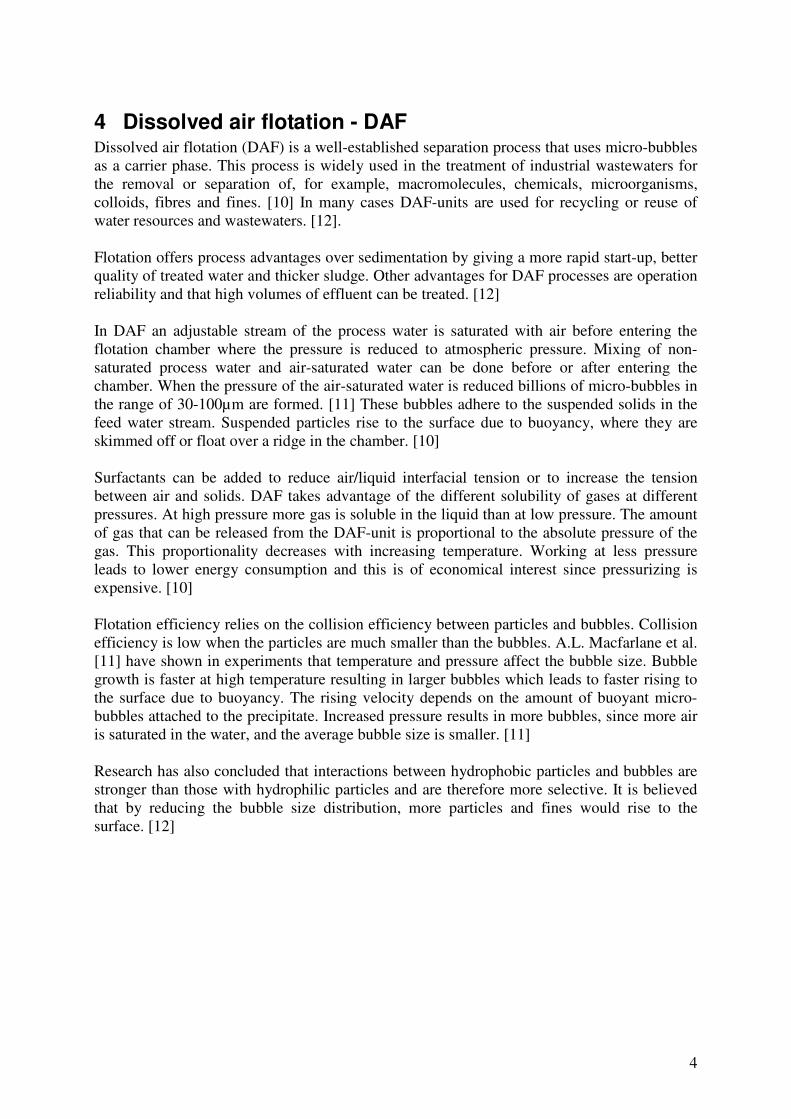
3.1 Thermomechanical pulping - TMP
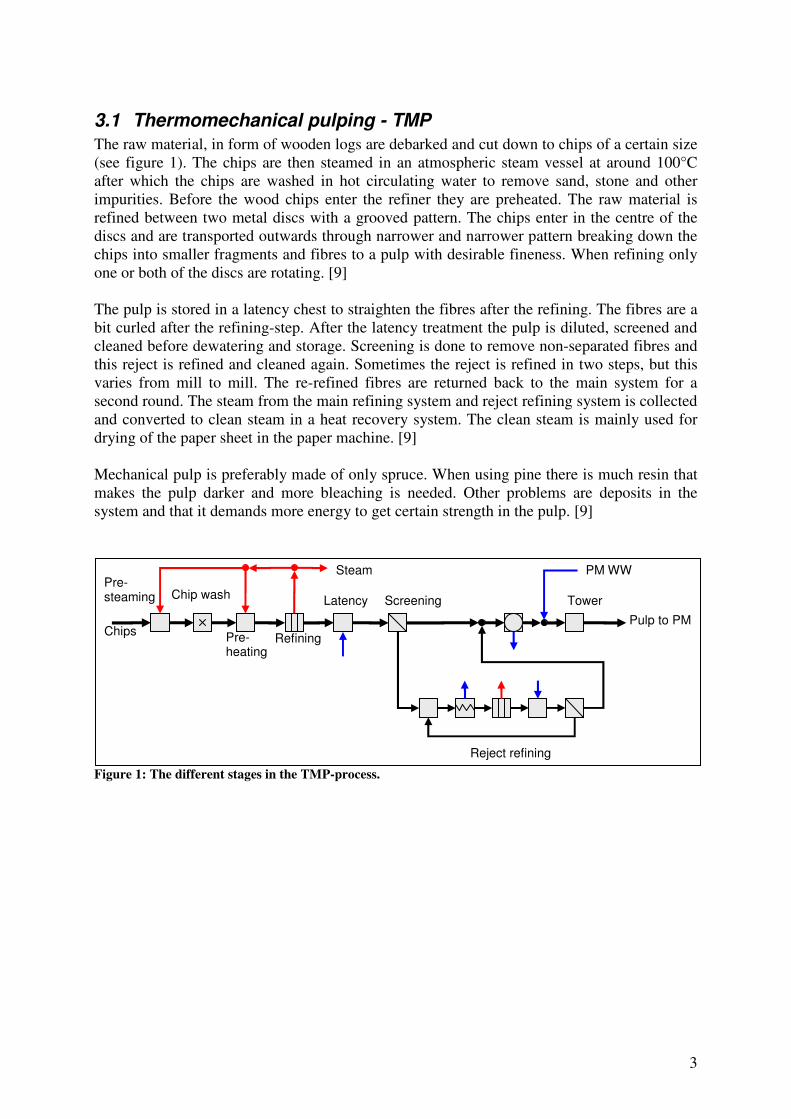
The raw material, in form of wooden logs are debarked and cut down to chips of a certain size (see figure 1). The chips are then steamed in an atmospheric steam vessel at around 100°C after which the chips are washed in hot circulating water to remove sand, stone and other impurities. Before the wood chips enter the refiner they are preheated. The raw material is refined between two metal discs with a grooved pattern. The chips enter in the centre of the discs and are transported outwards through narrower and narrower pattern breaking down the chips into smaller fragments and fibres to a pulp with desirable fineness. When refining only one or both of the discs are rotating. [9] The pulp is stored in a latency chest to straighten the fibres after the refining. The fibres are a bit curled after the refining-step. After the latency treatment the pulp is diluted, screened and cleaned before dewatering and storage. Screening is done to remove non-separated fibres and this reject is refined and cleaned again. Sometimes the reject is refined in two steps, but this varies from mill to mill. The re-refined fibres are returned back to the main system for a second round. The steam from the main refining system and reject refining system is collected and converted to clean steam in a heat recovery system. The clean steam is mainly used for drying of the paper sheet in the paper machine. [9] Mechanical pulp is preferably made of only spruce. When using pine there is much resin that makes the pulp darker and more bleaching is needed. Other problems are deposits in the system and that it demands more energy to get certain strength in the pulp. [9]
Figure 1: The different stages in the TMP-process.
Tower
PM WW
Chip wash Pre- steaming
Pre- heating
Refining
Latency Screening
Reject refining
Steam
Chips Pulp to PM
4
4 Dissolved air flotation - DAF Dissolved air flotation (DAF) is a well-established separation process that uses micro-bubbles as a carrier phase. This process is widely used in the treatment of industrial wastewaters for the removal or separation of, for example, macromolecules, chemicals, microorganisms, colloids, fibres and fines. [10] In many cases DAF-units are used for recycling or reuse of water resources and wastewaters. [12]. Flotation offers process advantages over sedimentation by giving a more rapid start-up, better quality of treated water and thicker sludge. Other advantages for DAF processes are operation reliability and that high volumes of effluent can be treated. [12] In DAF an adjustable stream of the process water is saturated with air before entering the flotation chamber where the pressure is reduced to atmospheric pressure. Mixing of non-saturated process water and air-saturated water can be done before or after entering the chamber. When the pressure of the air-saturated water is reduced billions of micro-bubbles in the range of 30-100µm are formed. [11] These bubbles adhere to the suspended solids in the feed water stream. Suspended particles rise to the surface due to buoyancy, where they are skimmed off or float over a ridge in the chamber. [10] Surfactants can be added to reduce air/liquid interfacial tension or to increase the tension between air and solids. DAF takes advantage of the different solubility of gases at different pressures. At high pressure more gas is soluble in the liquid than at low pressure. The amount of gas that can be released from the DAF-unit is proportional to the absolute pressure of the gas. This proportionality decreases with increasing temperature. Working at less pressure leads to lower energy consumption and this is of economical interest since pressurizing is expensive. [10] Flotation efficiency relies on the collision efficiency between particles and bubbles. Collision efficiency is low when the particles are much smaller than the bubbles. A.L. Macfarlane et al. [11] have shown in experiments that temperature and pressure affect the bubble size. Bubble growth is faster at high temperature resulting in larger bubbles which leads to faster rising to the surface due to buoyancy. The rising velocity depends on the amount of buoyant micro-bubbles attached to the precipitate. Increased pressure results in more bubbles, since more air is saturated in the water, and the average bubble size is smaller. [11] Research has also concluded that interactions between hydrophobic particles and bubbles are stronger than those with hydrophilic particles and are therefore more selective. It is believed that by reducing the bubble size distribution, more particles and fines would rise to the surface. [12]
5
5 White water chemistry In a paper process, water is reused in a circulation system to reduce water consumption. The vacuumed process water (the white water) from the wire section in the paper machine is led back to the pulping process for dilution and as make-up water (to maintain a certain flow). Mechanical pulp contains most of the components in the wood; i.e. most of the lignin, cellulose and hemicelluloses will become pulp. [1] The white water consists of small amounts of dissolved lignin and carbohydrates and other components like alcohols, terpenoids, resin and wood acids.
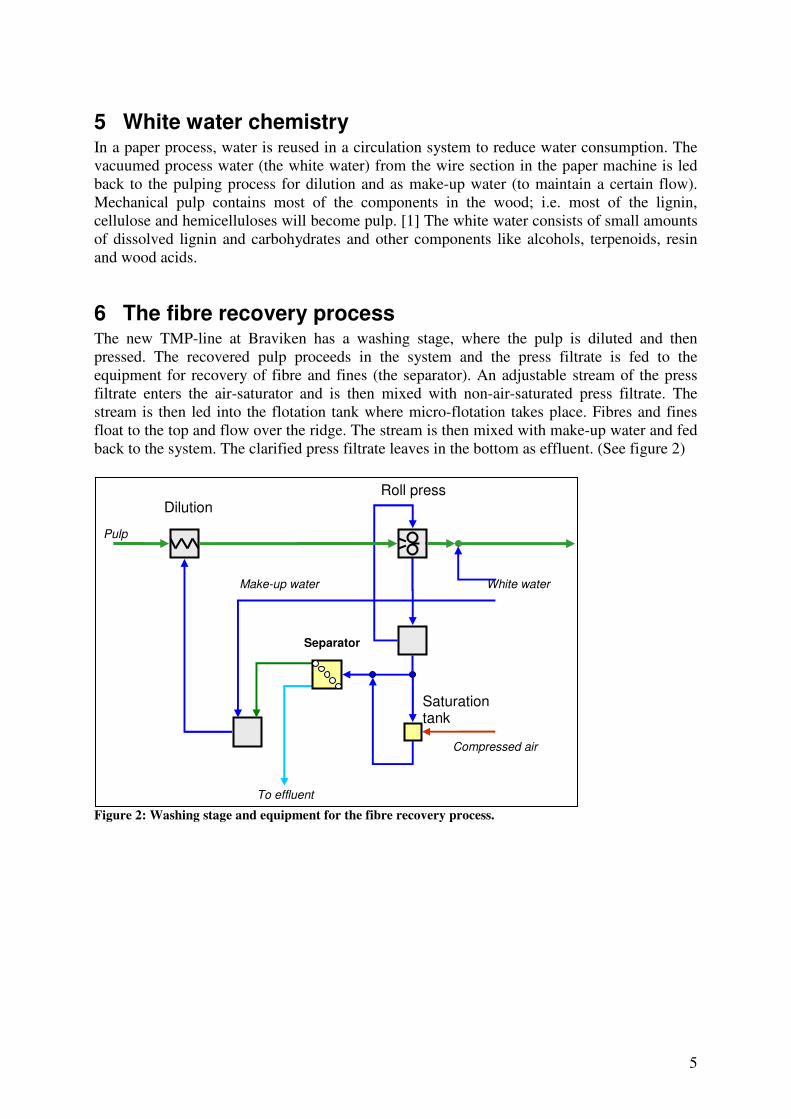
6 The fibre recovery process The new TMP-line at Braviken has a washing stage, where the pulp is diluted and then pressed. The recovered pulp proceeds in the system and the press filtrate is fed to the equipment for recovery of fibre and fines (the separator). An adjustable stream of the press filtrate enters the air-saturator and is then mixed with non-air-saturated press filtrate. The stream is then led into the flotation tank where micro-flotation takes place. Fibres and fines float to the top and flow over the ridge. The stream is then mixed with make-up water and fed back to the system. The clarified press filtrate leaves in the bottom as effluent. (See figure 2)
Figure 2: Washing stage and equipment for the fibre recovery process.
To effluent
Saturation tank
Roll press
Pulp
Separator
White water
Compressed air
Make-up water
Dilution
6
7 Methods and material This diploma work started with a literature study of the mechanical pulping process, dissolved air flotation, white water chemistry and surface tension. The results of the study helped plan the laboratory work. The method used for fibre and fines recovery was DAF. Materials, in form of pulp, press filtrate, laboratory equipment etcetera were supplied from Noss and Holmen Paper, Braviken. The experiments were carried out at the Noss pilot plant with a small scale flotation unit.
7.1 Factorial design
Factorial design was used to plan the experiments. Two experimental setups were made to examine the influence from four factors; temperature, fibre-size distribution, water quality and concentration (see table 1).
Table 1: Showing all different factors.
Factor A Temperature B Fibre-size distribution C Water quality D Concentration
A decision was made to control three factors during experimental setup 1; temperature, fibre-size distribution and water quality. In this case there was no need to do a fractional factorial design. When having three factors the numbers of experiments were 23 = 8 in a full factorial design. Since there were no time to do duplicate runs three centre points were added and performed to show repeatability. In experimental setup 2 two factors were controlled; temperature and fibre-size distribution. When having two factors the numbers of experiments were 22 = 4. Temperatures (factor A) were held at 60 degrees respectively 75 degrees for the high level and at 40 degrees for the low level. The centre points had a temperature of 50 degrees. In experimental setup 2 higher temperatures were reached to see if the temperature showed any noticeable difference between results. Temperature was measured at each experiment to make sure it was in the right range. The press filtrate was heated with steam to about 78 degrees. To eliminate the problem of cooling press filtrate during runs recirculation was made to heat up the piping. The levels for the fibre-size distribution (factor B) were set to fibre suspension as low level and pulp from the roll press as high level. The centre point level was a combination between the high and the low level. Fibre suspension was collected with help of dewatering and contains mostly fines. Pulp from the roll press contains more long fibres. To see if the water quality (factor C) had any influence on the results purified press filtrate and tap water were used as low respective high level. The centre point had mixed tap water and purified press filtrate. Factors kept constant during experiments were feed concentration and pressure in the air-saturator with exception for the three additional experiments (experiments no. 5-7 in set 2).
7
Three additional experiments were added with feed concentration (factor D) and fibre-size distribution (factor B) as process parameters. Feed concentrations used were 0.2%, 0.3% and 0.4%. The fibre-size distribution levels were fibre suspension respectively roll press pulp. Temperature was held at low level, 40 degrees and purified press filtrate was used as process water.
7.2 Sample preparation
An examination of different methods to remove fibres and fines from the press filtrate was made in a number of pre-trials to estimate the time consumption. The separation was desired for two reasons; 1) collection of fibre and fines and 2) a purified press filtrate. Three methods were studied; sedimentation, dewatering on a wire and dewatering using a dewatering-bag. Press filtrate was used during the pre-trials. Press filtrate was let to sediment in cipac-containers over night after which the top three-quarters were collected by siphoning into another cipac-container. The last quarter was dewatered in order to collect a fibre suspension needed for the feed preparation. The purified press filtrate/water was stored in a tank with the ability to be heated with steam. When making the feed solutions the water (factor C) stored in the tank was used. Pulp from the roll press was disintegrated with a defibrator to get a fibre solution (feed) without fibre knots. To obtain the two feed solutions the fibre suspension or disintegrated pulp was diluted with heated water or press filtrate to the desired concentrations. The press filtrate suspension contains more fibres and fines than the pulp. The pulp on the other hand contains more long fibres.
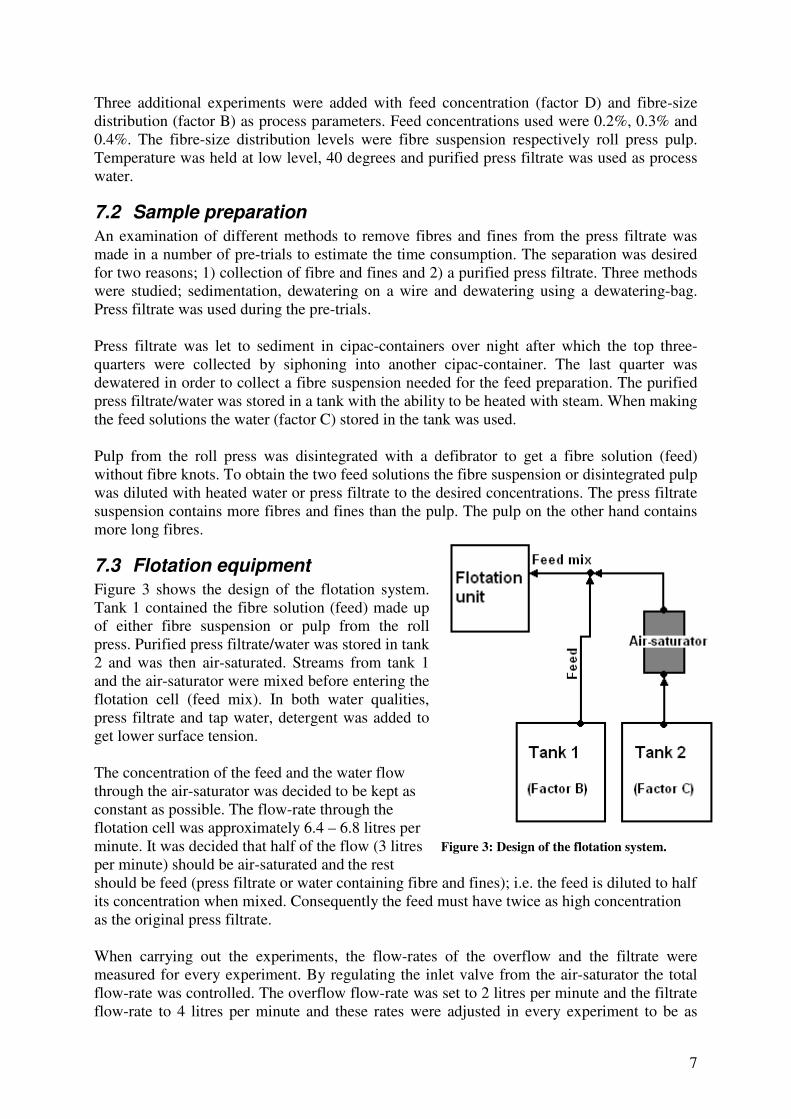
7.3 Flotation equipment
Figure 3 shows the design of the flotation system. Tank 1 contained the fibre solution (feed) made up of either fibre suspension or pulp from the roll press. Purified press filtrate/water was stored in tank 2 and was then air-saturated. Streams from tank 1 and the air-saturator were mixed before entering the flotation cell (feed mix). In both water qualities, press filtrate and tap water, detergent was added to get lower surface tension. The concentration of the feed and the water flow through the air-saturator was decided to be kept as constant as possible. The flow-rate through the flotation cell was approximately 6.4 – 6.8 litres per minute. It was decided that half of the flow (3 litres Figure 3: Design of the flotation system. per minute) should be air-saturated and the rest should be feed (press filtrate or water containing fibre and fines); i.e. the feed is diluted to half its concentration when mixed. Consequently the feed must have twice as high concentration as the original press filtrate. When carrying out the experiments, the flow-rates of the overflow and the filtrate were measured for every experiment. By regulating the inlet valve from the air-saturator the total flow-rate was controlled. The overflow flow-rate was set to 2 litres per minute and the filtrate flow-rate to 4 litres per minute and these rates were adjusted in every experiment to be as
8
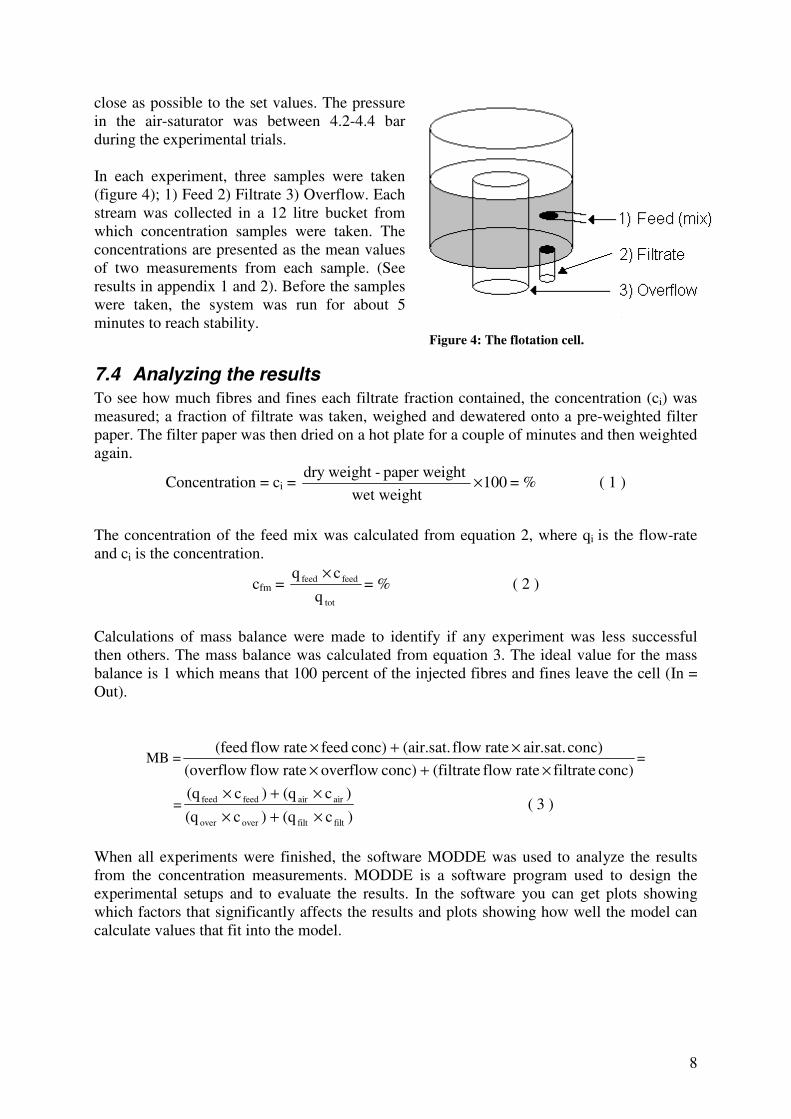
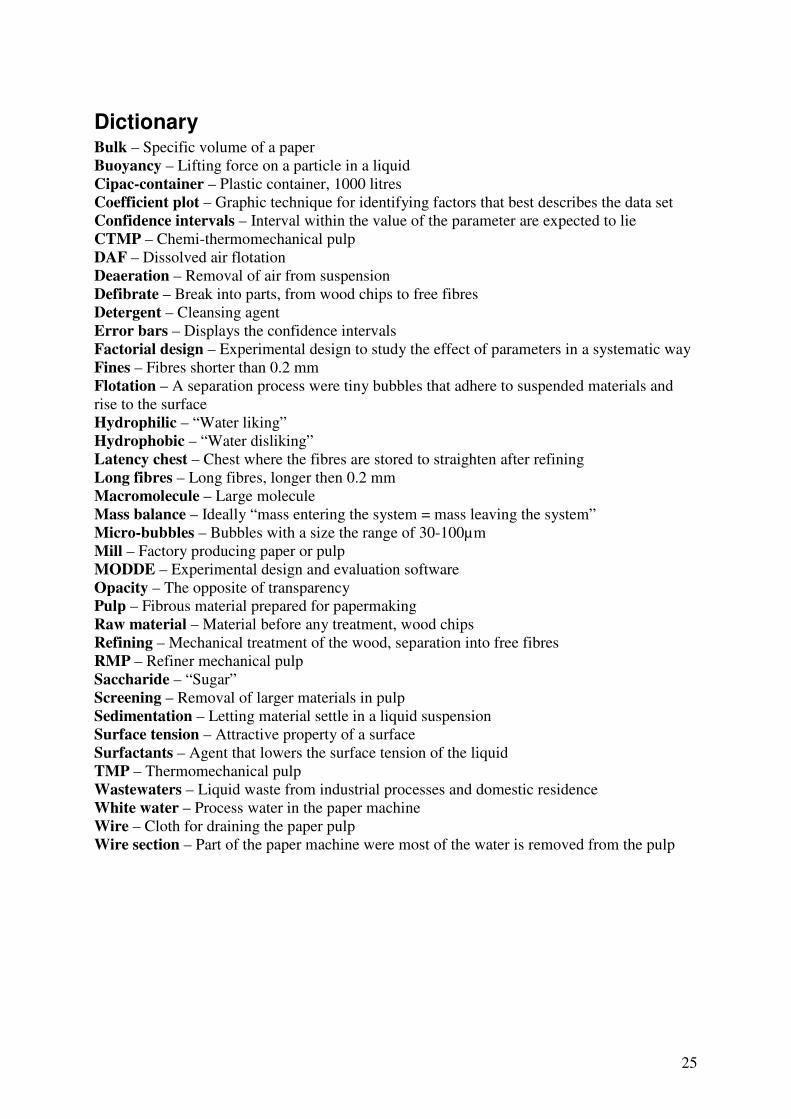
close as possible to the set values. The pressure in the air-saturator was between 4.2-4.4 bar during the experimental trials. In each experiment, three samples were taken (figure 4); 1) Feed 2) Filtrate 3) Overflow. Each stream was collected in a 12 litre bucket from which concentration samples were taken. The concentrations are presented as the mean values of two measurements from each sample. (See results in appendix 1 and 2). Before the samples were taken, the system was run for about 5 minutes to reach stability.
Figure 4: The flotation cell.
7.4 Analyzing the results
To see how much fibres and fines each filtrate fraction contained, the concentration (ci) was measured; a fraction of filtrate was taken, weighed and dewatered onto a pre-weighted filter paper. The filter paper was then dried on a hot plate for a couple of minutes and then weighted again.
Concentration = ci = 100wet weight
ht paper weig - dry weight× = % ( 1 )
The concentration of the feed mix was calculated from equation 2, where qi is the flow-rate and ci is the concentration.
cfm = tot
feedfeed
q
c q ×
= % ( 2 )
Calculations of mass balance were made to identify if any experiment was less successful then others. The mass balance was calculated from equation 3. The ideal value for the mass balance is 1 which means that 100 percent of the injected fibres and fines leave the cell (In = Out).
MB =conc) filtrate rate flow (filtrateconc) overflowrate flow (overflow
conc) air.sat.rate flow (air.sat.conc) feed rate flow (feed
×+×
×+×=
=)c(q)c(q
)c(q)c(q
filtfiltoverover
airairfeedfeed
×+×
×+×
( 3 )
When all experiments were finished, the software MODDE was used to analyze the results from the concentration measurements. MODDE is a software program used to design the experimental setups and to evaluate the results. In the software you can get plots showing which factors that significantly affects the results and plots showing how well the model can calculate values that fit into the model.
9
8 Pre-trials
8.1 Experimental
Sedimentation was carried out in 12-litres-buckets and concentration samples were taken after one, two and 24 hours. When using the dewatering-bag, four buckets of press filtrate were poured though the bag and the press filtrate passing through the bag was collected in a tank below. The concentration of the press filtrate was measured. Dewatering was done by pouring six buckets of press filtrate on a wire, letting the press filtrate pass through and measuring the concentration for both press filtrate and the collected fibre suspension.
8.2 Results and discussion
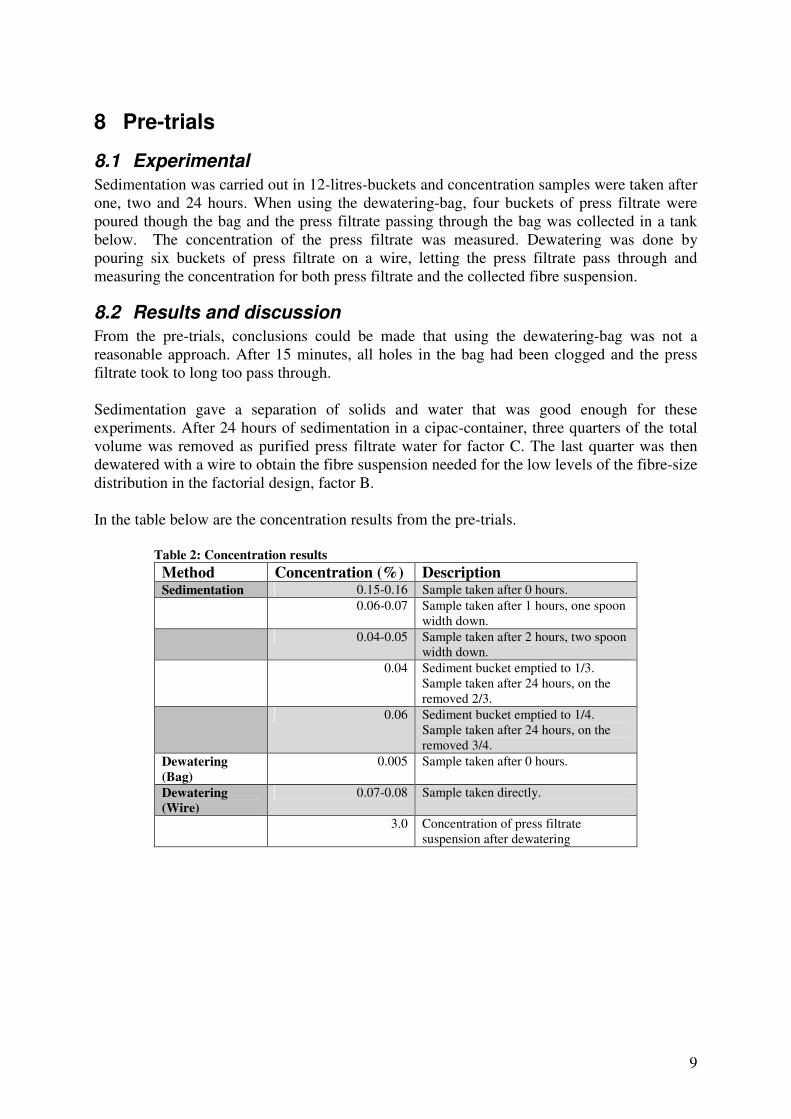
From the pre-trials, conclusions could be made that using the dewatering-bag was not a reasonable approach. After 15 minutes, all holes in the bag had been clogged and the press filtrate took to long too pass through. Sedimentation gave a separation of solids and water that was good enough for these experiments. After 24 hours of sedimentation in a cipac-container, three quarters of the total volume was removed as purified press filtrate water for factor C. The last quarter was then dewatered with a wire to obtain the fibre suspension needed for the low levels of the fibre-size distribution in the factorial design, factor B. In the table below are the concentration results from the pre-trials.
Table 2: Concentration results
Method Concentration (%) Description Sedimentation 0.15-0.16 Sample taken after 0 hours. 0.06-0.07 Sample taken after 1 hours, one spoon
width down. 0.04-0.05 Sample taken after 2 hours, two spoon
width down. 0.04 Sediment bucket emptied to 1/3.
Sample taken after 24 hours, on the removed 2/3.
0.06 Sediment bucket emptied to 1/4. Sample taken after 24 hours, on the removed 3/4.
Dewatering (Bag)
0.005 Sample taken after 0 hours.
Dewatering (Wire)
0.07-0.08 Sample taken directly.
3.0 Concentration of press filtrate suspension after dewatering
10
9 Experiments set 1
9.1 Experimental
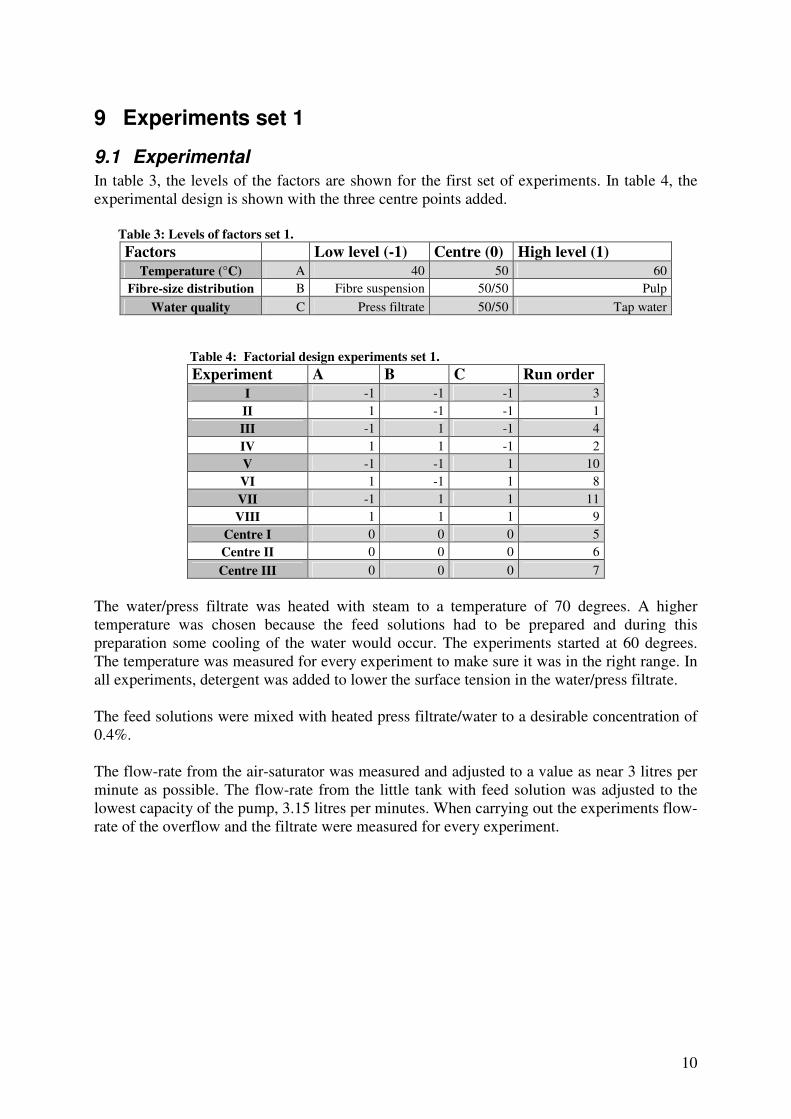
In table 3, the levels of the factors are shown for the first set of experiments. In table 4, the experimental design is shown with the three centre points added.
Table 3: Levels of factors set 1.
Factors Low level (-1) Centre (0) High level (1) Temperature (°C) A 40 50 60
Fibre-size distribution B Fibre suspension 50/50 Pulp
Water quality C Press filtrate 50/50 Tap water
Table 4: Factorial design experiments set 1.
Experiment A B C Run order I -1 -1 -1 3
II 1 -1 -1 1
III -1 1 -1 4
IV 1 1 -1 2
V -1 -1 1 10
VI 1 -1 1 8
VII -1 1 1 11
VIII 1 1 1 9
Centre I 0 0 0 5
Centre II 0 0 0 6
Centre III 0 0 0 7
The water/press filtrate was heated with steam to a temperature of 70 degrees. A higher temperature was chosen because the feed solutions had to be prepared and during this preparation some cooling of the water would occur. The experiments started at 60 degrees. The temperature was measured for every experiment to make sure it was in the right range. In all experiments, detergent was added to lower the surface tension in the water/press filtrate. The feed solutions were mixed with heated press filtrate/water to a desirable concentration of 0.4%. The flow-rate from the air-saturator was measured and adjusted to a value as near 3 litres per minute as possible. The flow-rate from the little tank with feed solution was adjusted to the lowest capacity of the pump, 3.15 litres per minutes. When carrying out the experiments flow-rate of the overflow and the filtrate were measured for every experiment.
11
9.2 Results and discussion
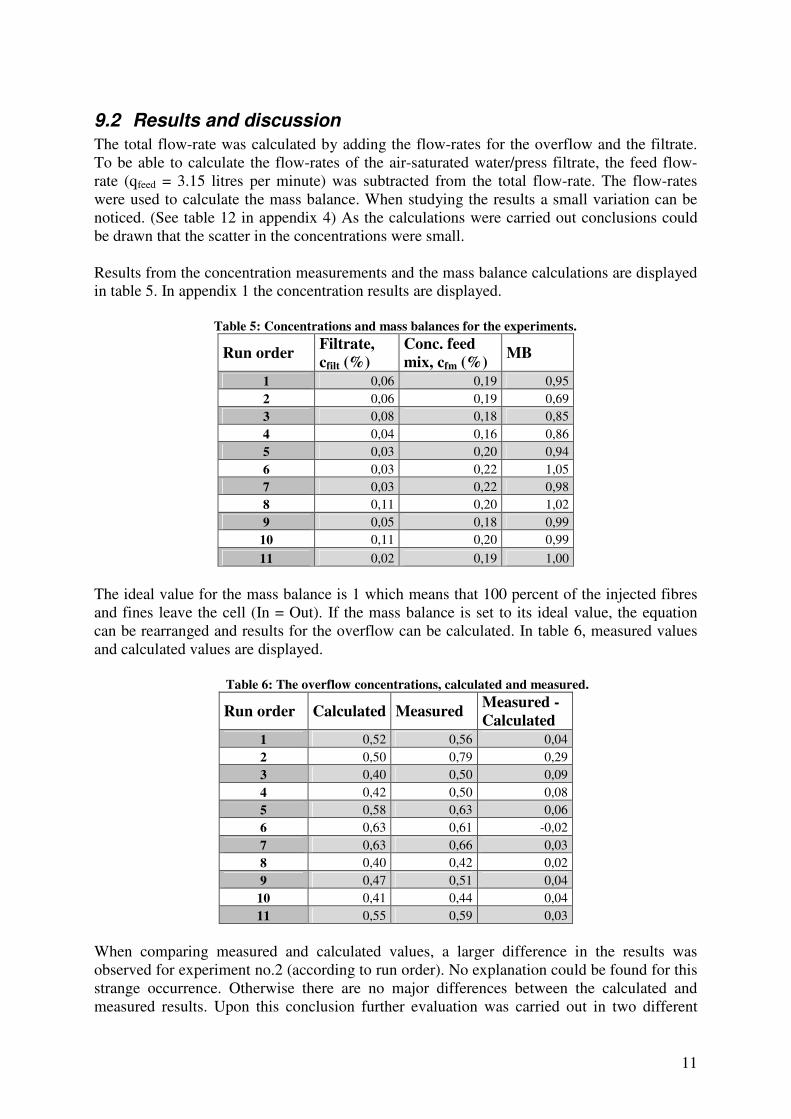
The total flow-rate was calculated by adding the flow-rates for the overflow and the filtrate. To be able to calculate the flow-rates of the air-saturated water/press filtrate, the feed flow-rate (qfeed = 3.15 litres per minute) was subtracted from the total flow-rate. The flow-rates were used to calculate the mass balance. When studying the results a small variation can be noticed. (See table 12 in appendix 4) As the calculations were carried out conclusions could be drawn that the scatter in the concentrations were small. Results from the concentration measurements and the mass balance calculations are displayed in table 5. In appendix 1 the concentration results are displayed.
Table 5: Concentrations and mass balances for the experiments.
Run order Filtrate, cfilt (%)
Conc. feed mix, cfm (%)
MB
1 0,06 0,19 0,95
2 0,06 0,19 0,69
3 0,08 0,18 0,85
4 0,04 0,16 0,86
5 0,03 0,20 0,94
6 0,03 0,22 1,05
7 0,03 0,22 0,98
8 0,11 0,20 1,02
9 0,05 0,18 0,99
10 0,11 0,20 0,99
11 0,02 0,19 1,00
The ideal value for the mass balance is 1 which means that 100 percent of the injected fibres and fines leave the cell (In = Out). If the mass balance is set to its ideal value, the equation can be rearranged and results for the overflow can be calculated. In table 6, measured values and calculated values are displayed.
Table 6: The overflow concentrations, calculated and measured.
Run order Calculated Measured Measured - Calculated
1 0,52 0,56 0,04
2 0,50 0,79 0,29
3 0,40 0,50 0,09
4 0,42 0,50 0,08
5 0,58 0,63 0,06
6 0,63 0,61 -0,02
7 0,63 0,66 0,03
8 0,40 0,42 0,02
9 0,47 0,51 0,04
10 0,41 0,44 0,04
11 0,55 0,59 0,03
When comparing measured and calculated values, a larger difference in the results was observed for experiment no.2 (according to run order). No explanation could be found for this strange occurrence. Otherwise there are no major differences between the calculated and measured results. Upon this conclusion further evaluation was carried out in two different
12
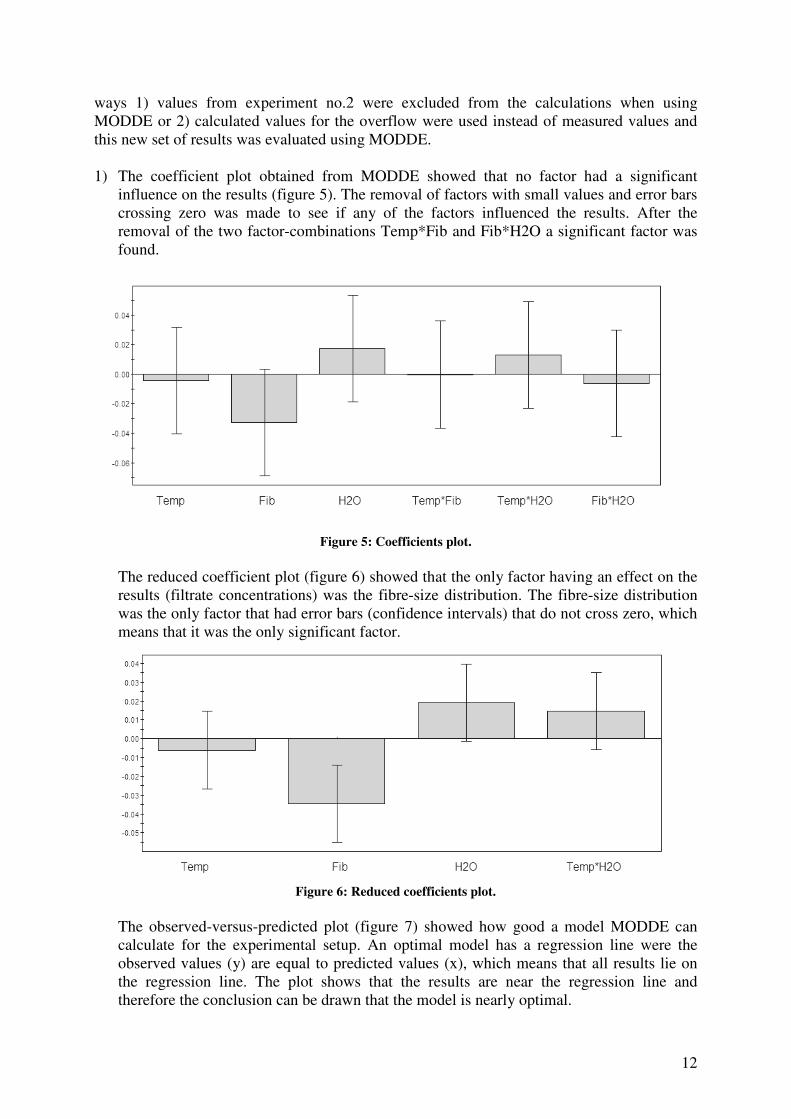
ways 1) values from experiment no.2 were excluded from the calculations when using MODDE or 2) calculated values for the overflow were used instead of measured values and this new set of results was evaluated using MODDE. 1) The coefficient plot obtained from MODDE showed that no factor had a significant
influence on the results (figure 5). The removal of factors with small values and error bars crossing zero was made to see if any of the factors influenced the results. After the removal of the two factor-combinations Temp*Fib and Fib*H2O a significant factor was found.
Figure 5: Coefficients plot.
The reduced coefficient plot (figure 6) showed that the only factor having an effect on the results (filtrate concentrations) was the fibre-size distribution. The fibre-size distribution was the only factor that had error bars (confidence intervals) that do not cross zero, which means that it was the only significant factor.
Figure 6: Reduced coefficients plot.
The observed-versus-predicted plot (figure 7) showed how good a model MODDE can calculate for the experimental setup. An optimal model has a regression line were the observed values (y) are equal to predicted values (x), which means that all results lie on the regression line. The plot shows that the results are near the regression line and therefore the conclusion can be drawn that the model is nearly optimal.
13
Figure 7: Plot showing observed versus predicted values.
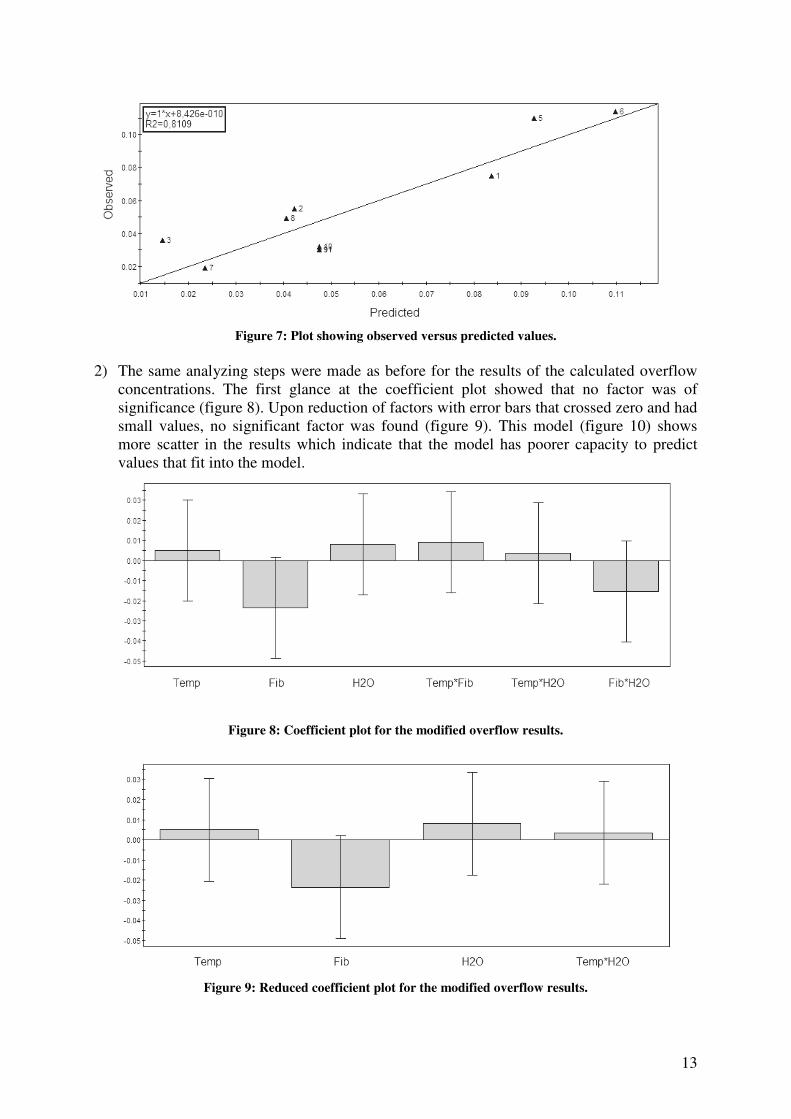
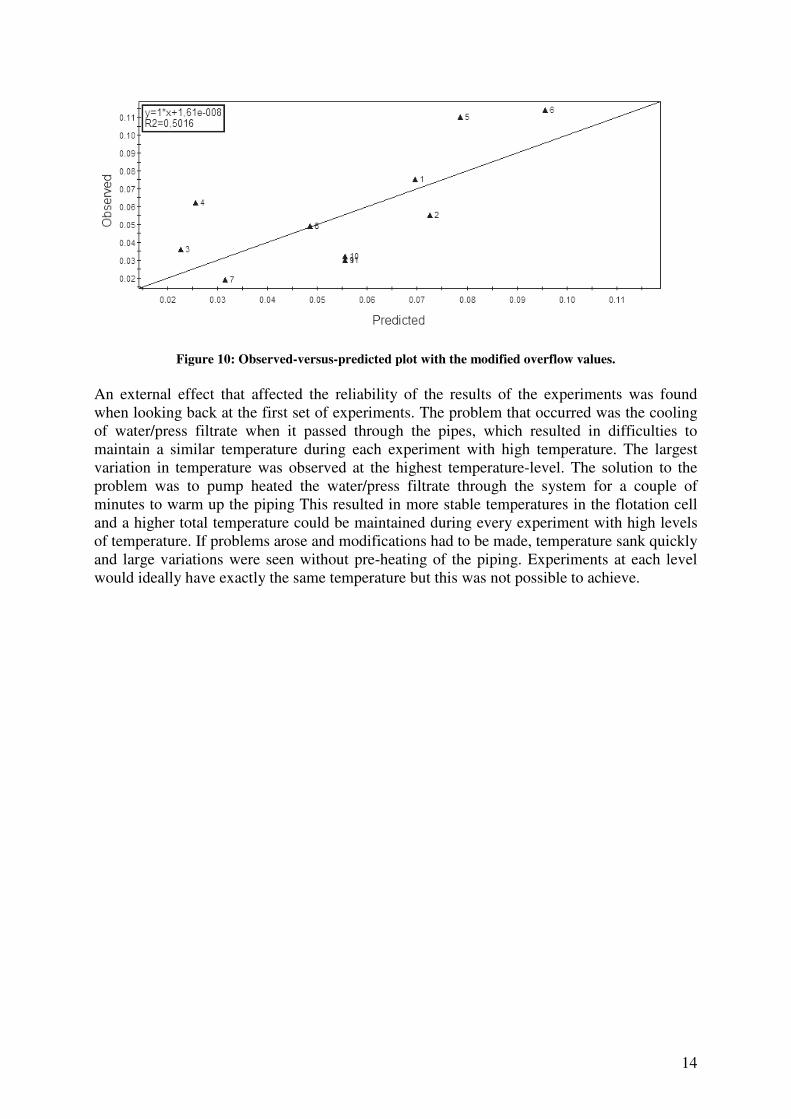
2) The same analyzing steps were made as before for the results of the calculated overflow
concentrations. The first glance at the coefficient plot showed that no factor was of significance (figure 8). Upon reduction of factors with error bars that crossed zero and had small values, no significant factor was found (figure 9). This model (figure 10) shows more scatter in the results which indicate that the model has poorer capacity to predict values that fit into the model.
Figure 8: Coefficient plot for the modified overflow results.
Figure 9: Reduced coefficient plot for the modified overflow results.
14
Figure 10: Observed-versus-predicted plot with the modified overflow values.
An external effect that affected the reliability of the results of the experiments was found when looking back at the first set of experiments. The problem that occurred was the cooling of water/press filtrate when it passed through the pipes, which resulted in difficulties to maintain a similar temperature during each experiment with high temperature. The largest variation in temperature was observed at the highest temperature-level. The solution to the problem was to pump heated the water/press filtrate through the system for a couple of minutes to warm up the piping This resulted in more stable temperatures in the flotation cell and a higher total temperature could be maintained during every experiment with high levels of temperature. If problems arose and modifications had to be made, temperature sank quickly and large variations were seen without pre-heating of the piping. Experiments at each level would ideally have exactly the same temperature but this was not possible to achieve.
15
10 Experiments set 2
10.1 Experimental
Based on the conclusions from the first set of experiments, a new set of experiments was planned. The same preparations were made before these experiments. The levels of the factors and the factorial design are displayed in table 7 and 8. No centre points were added because of the good reproducibility noticed in the first set of experiments.
Table 7: Level of factors in setup 2.
Table 8: Factorial design experiments set 2.
Experiment A B Run order I -1 -1 3
II 1 -1 1
III -1 1 4
IV 1 1 2
In the new set of experiments purified press filtrate was used as process water and the concentration of the feed was kept constant. No detergent was added to the press filtrate. A higher temperature was reached for the high level of factor A to get a larger difference between low and high levels. The purpose of this was to see if the temperature had any influence on the results and to see if there were any noticeable differences between these four experiments and the first four experiments from setup 1. The press filtrate was heated with steam to about 78 degrees. To eliminate the problem of cooling of the press filtrate during runs, recirculation of the water was made to heat up the piping before runs. Feed solutions were prepared in the same way as before for high and low levels of factor B with a concentration of 0.4%. Three more experiments were planned, table 9 and 10, and were carried out directly after the other experiments explained above. The process parameters controlled in these experiments were concentration (factor D) and fibre-size distribution (factor B). Only three experiments were made since experiment number V already had been carried out and experiment VI is not practically possible in the pulping process. The temperature was at the low level and the press filtrate (without detergent) was used as process water.
Table 9: Level of factors for the additional experiments.
Factors Low level (-1) High level (1) Temperature (°C) A 40 75
Fibre-size distribution B Fibre suspension Pulp
Factors Low level (-1) Centre (0) High level (1) Concentration (%) D 0.2 0.3 0.4
Fibre-size distribution B Fibre suspension 75/25 50% Fibre suspension/50% Pulp
16
Table 10: Factorial design for additional experiments.
Experiment D B Run order V -1 -1 -
VI 1 -1 -
VII -1 1 1
VIII 1 1 2
IX 0 0 3
As in the previous experimental setup the pressure in the air-saturator was between 4.2-4.4 bar. The flow-rate from the air-saturator was measured and adjusted to a value near 3 litres per minute. Also the flow-rate from feed solution tank (tank 1) and the total flow-rate through the flotation cell were measured. The overflow and filtrate flow-rates were measured and adjusted to approximately 2 litres per minute and 4 litres per minute respectively in each experiment to be as close to set values as possible. The temperature was measured in each experiment to make sure it was in the right range. Concentration measurements were made exactly like before. The system was let to stabilize before the samples were taken.
10.2 Results and discussion
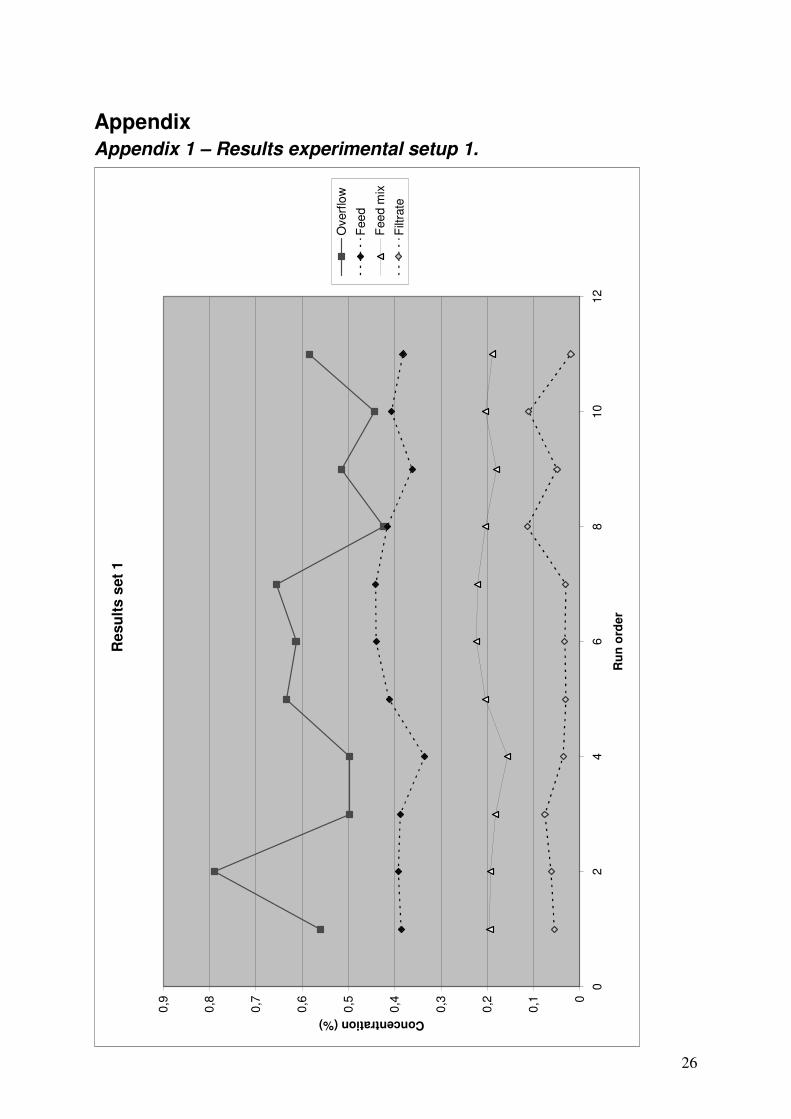
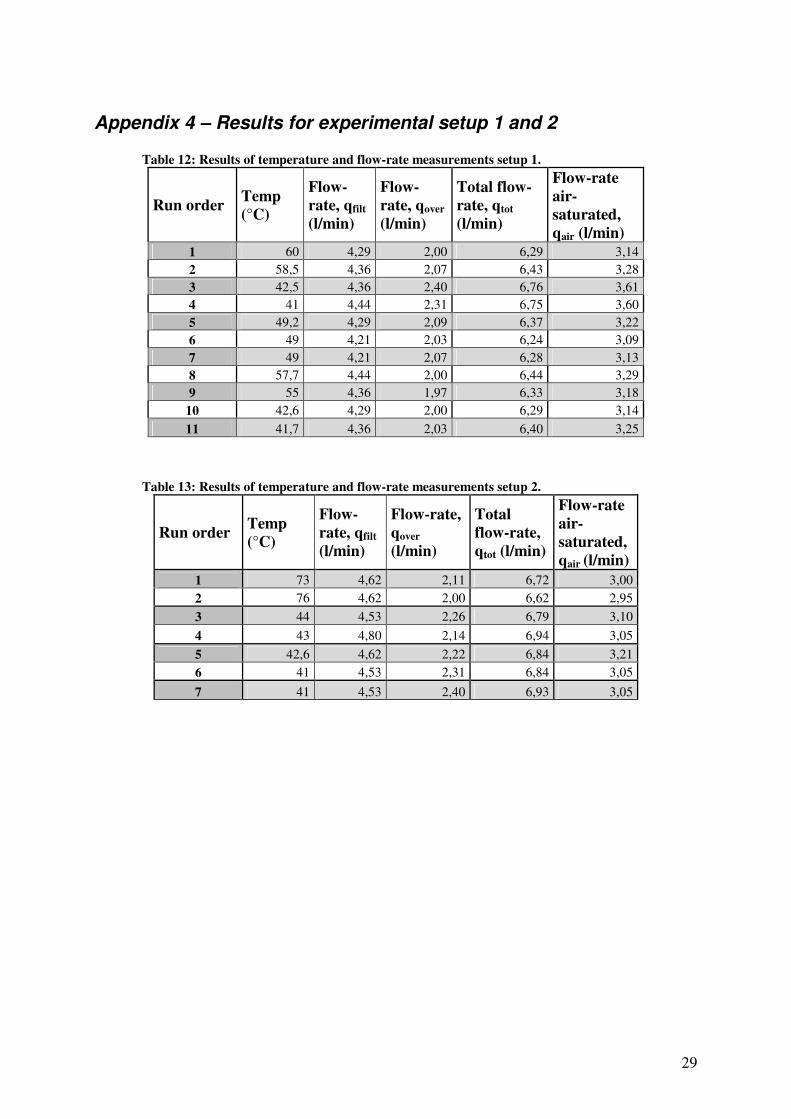
In table 13 in appendix 4, flow-rates for the feed mix, the filtrate and the air-saturated press filtrate are displayed. Temperatures for the experiments can be found in the same appendix. The total flow-rates were calculated by adding the flow-rates from the overflow and the filtrate. The flow-rate of the air-saturated press filtrate could be calculated because of the assumption of a constant feed flow-rate (qfeed = 3.6 litres per minute). When the results were studied, conclusions could be drawn that the total flow-rate was approximately 6.8 litres per minute and that there were small variations in the flow-rates between different runs, less than 5%. Results from the concentration measurements and the mass balance calculations are displayed in table 11 below. In appendix 2, a plot of the concentration results is displayed.
Table 11: The concentrations and mass balances for the experiments.
Run order Filtrate, cfilt (%)
Conc. feed mix, cfm (%)
MB
1 0,05 0,21 1,15
2 0,04 0,21 1,02
3 0,15 0,26 0,96
4 0,04 0,20 0,98
5 0,08 0,22 1,00
6 0,21 0,43 1,05
7 0,19 0,34 1,01
Concentrations of the total flow (the feed mix) into the flotation cell were calculated as before, see equation 2. From these calculations conclusions could be drawn that the concentrations of the feed mix were near the desirable value of 0.2%. Experiment no.3 had higher concentration than the others due to an error in the feed preparation process. Desirable concentrations for experiments no.5-7 were 0.2%, 0.4% and 0.3%.
17
The mass balances were near the ideal value of 1 for all experiments except for experiment no.1 where the difference from 1 is larger. This difference could have emerged because of an unstable system since it was the first run. According to the results a difference in the filtrate concentration was observed for experiment no.3. This difference in the results can depend on the somewhat higher feed concentration and the decrease in efficiency of the flotation cell. In the evaluation of the results from experiment no.1-4 the centre points from setup 1 were added to get repeatability. The centre point could be used because of the resemblance of factorial designs between setup 1 and 2. The evaluation was then made in two different ways in MODDE. 1) Without any modifications 2) The results from experiment no.3 was exchanged with those from setup 1. Experiment no. 5-7 was not evaluated in MODDE since a complete factorial design was not made. Instead these experiments were evaluated by studying plots and notes taken during runs.
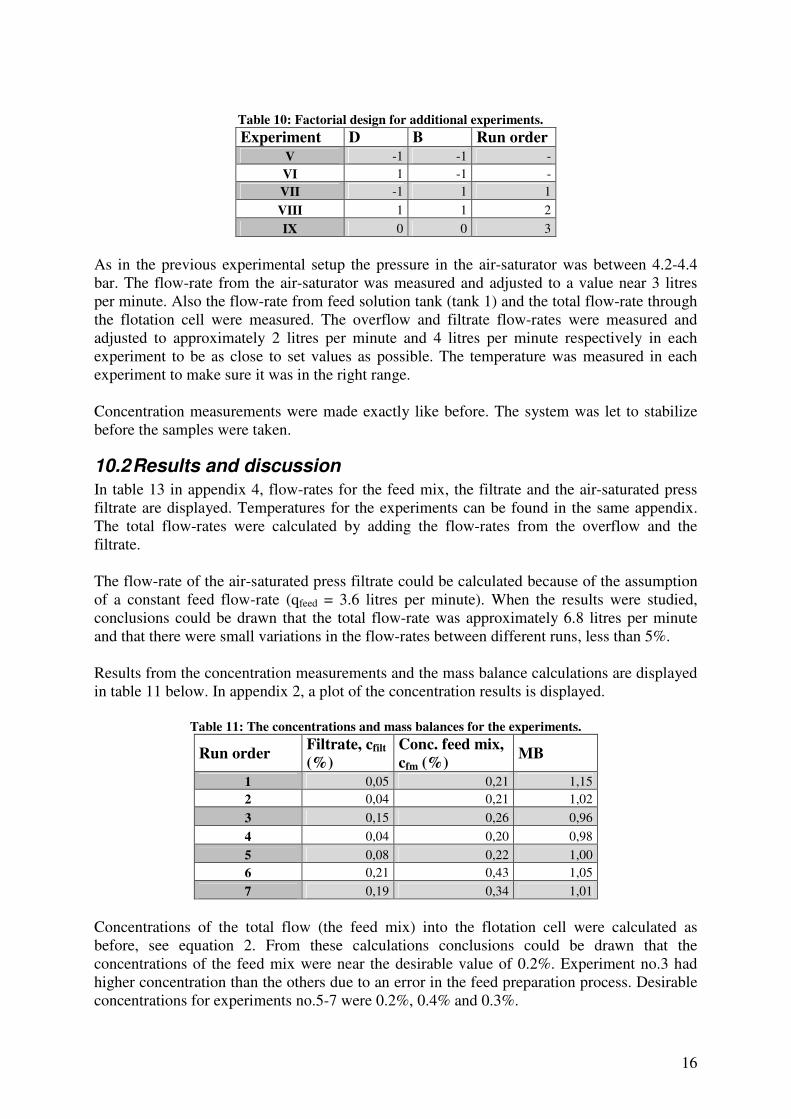
1) The results without any modifications showed no significant influence from any of the factors (figure 11). When having two factors, a reduction of coefficients could not be made.
Figure 11: Coefficient plot set 2.
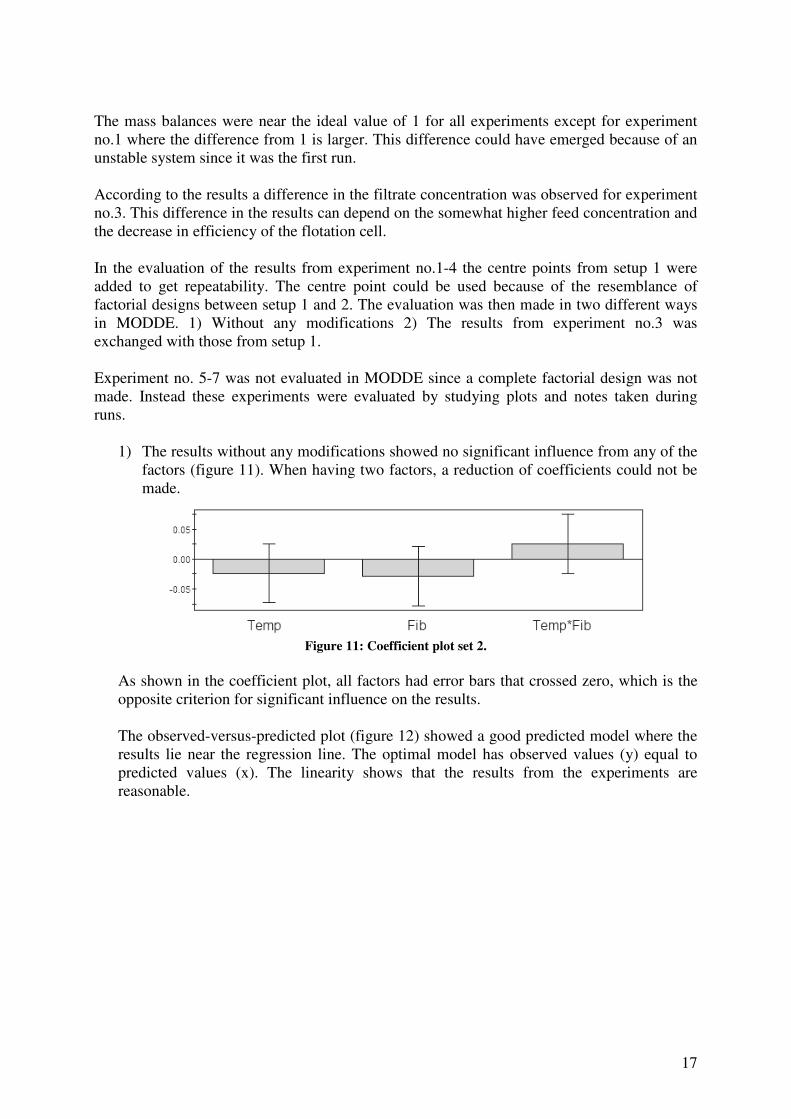
As shown in the coefficient plot, all factors had error bars that crossed zero, which is the opposite criterion for significant influence on the results. The observed-versus-predicted plot (figure 12) showed a good predicted model where the results lie near the regression line. The optimal model has observed values (y) equal to predicted values (x). The linearity shows that the results from the experiments are reasonable.
18
Figure 12: Plot showing observed values versus predicted values.
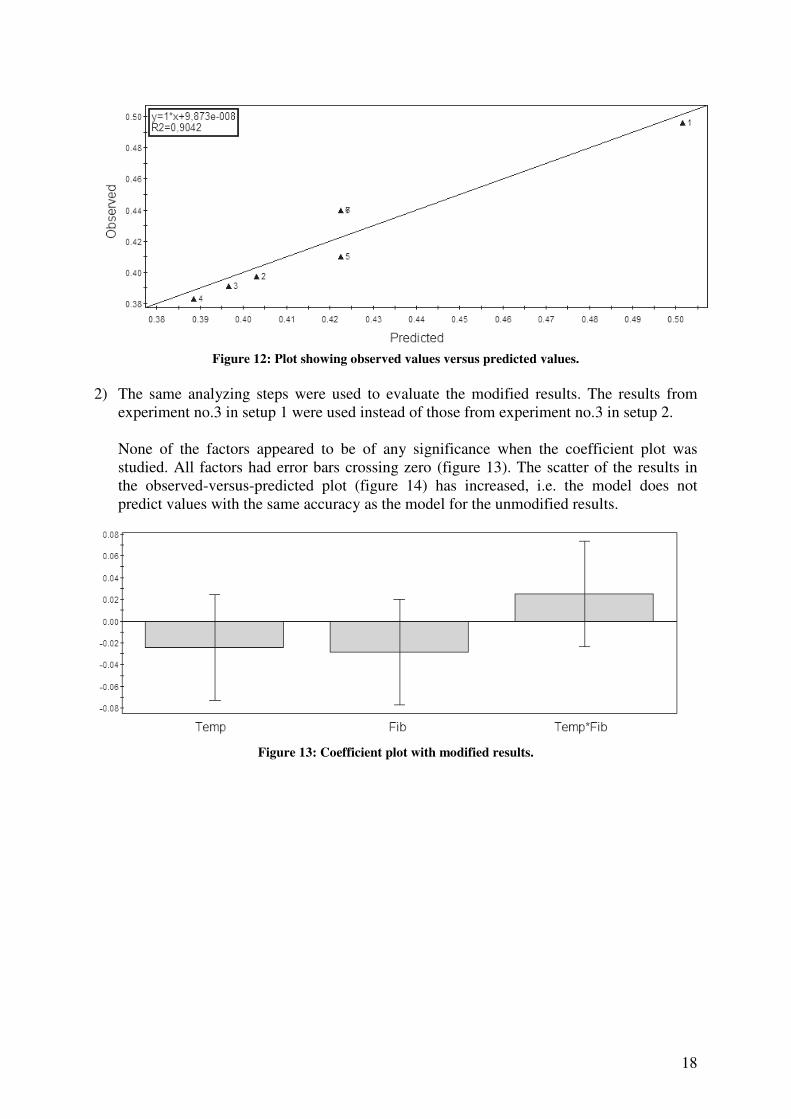
2) The same analyzing steps were used to evaluate the modified results. The results from
experiment no.3 in setup 1 were used instead of those from experiment no.3 in setup 2. None of the factors appeared to be of any significance when the coefficient plot was studied. All factors had error bars crossing zero (figure 13). The scatter of the results in the observed-versus-predicted plot (figure 14) has increased, i.e. the model does not predict values with the same accuracy as the model for the unmodified results.
Figure 13: Coefficient plot with modified results.
19
Figure 14: Observed-versus-predicted plot with modified results.
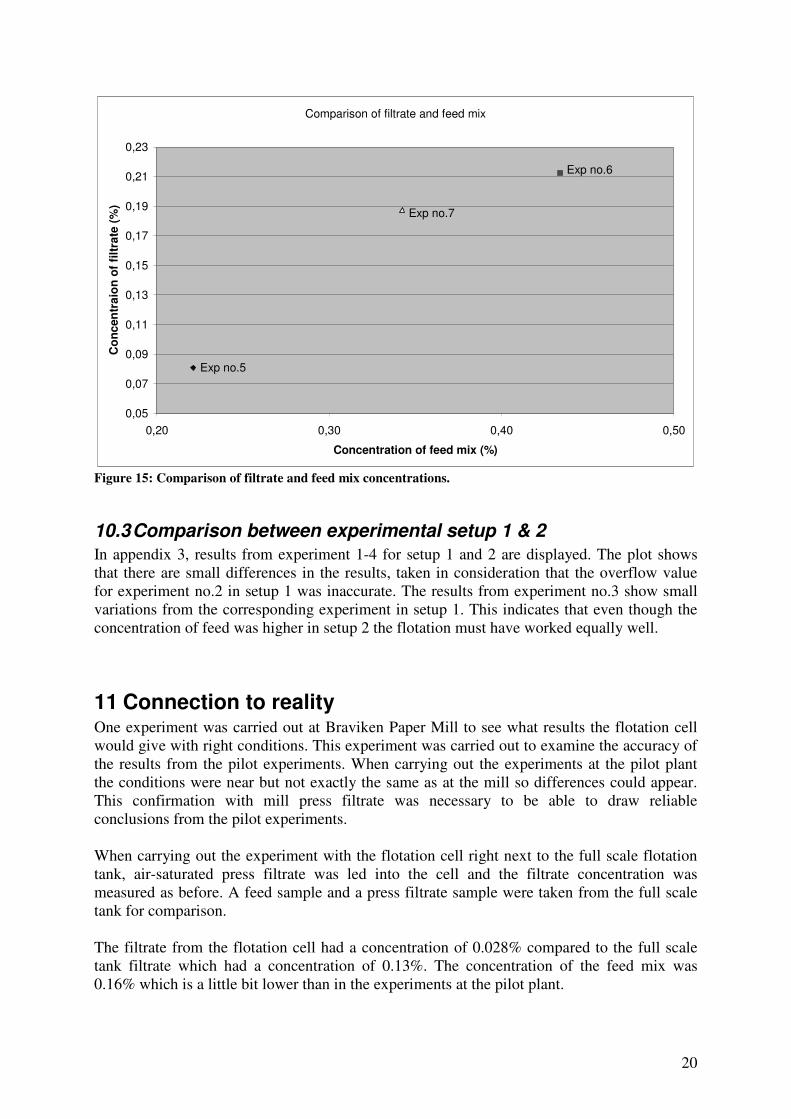
During the second experimental setup, a disturbance when the feed mix entered the flotation cell was observed. Large bubbles rose to the surface creating a barrier whereby floating fibres got blocked and could not be skimmed off by themselves. This phenomenon occurred at both high and low temperature levels but was most distinct at high temperatures. It looked like the air bubbles merged while rising. Sometimes at low temperatures the disturbance was so small that it was not noticeable. The separation of rising and sinking materials (fibres and fines connected to the air bubbles) could be observed more or less at both high and low temperature levels. In experiment no.4 the separation was not as good as in the previous runs. It did not have the same capacity of thickening the overflow. When the concentration of the feed was increased, the flotation of materials decreased dramatically. There was no distinct layering of rising and sinking materials. It seemed like the flotation cell got overloaded and that the thickening capacity was low. The results from the concentration measurements (figure 15) showed that some thickening had occurred but it was not as efficient as when having lower feed concentration.
20
Comparison of filtrate and feed mix
Exp no.6
Exp no.7
Exp no.5
0,05
0,07
0,09
0,11
0,13
0,15
0,17
0,19
0,21
0,23
0,20 0,30 0,40 0,50
Concentration of feed mix (%)
Co
nc
en
tra
ion
of
filt
rate
(%
)
Figure 15: Comparison of filtrate and feed mix concentrations.
10.3 Comparison between experimental setup 1 & 2
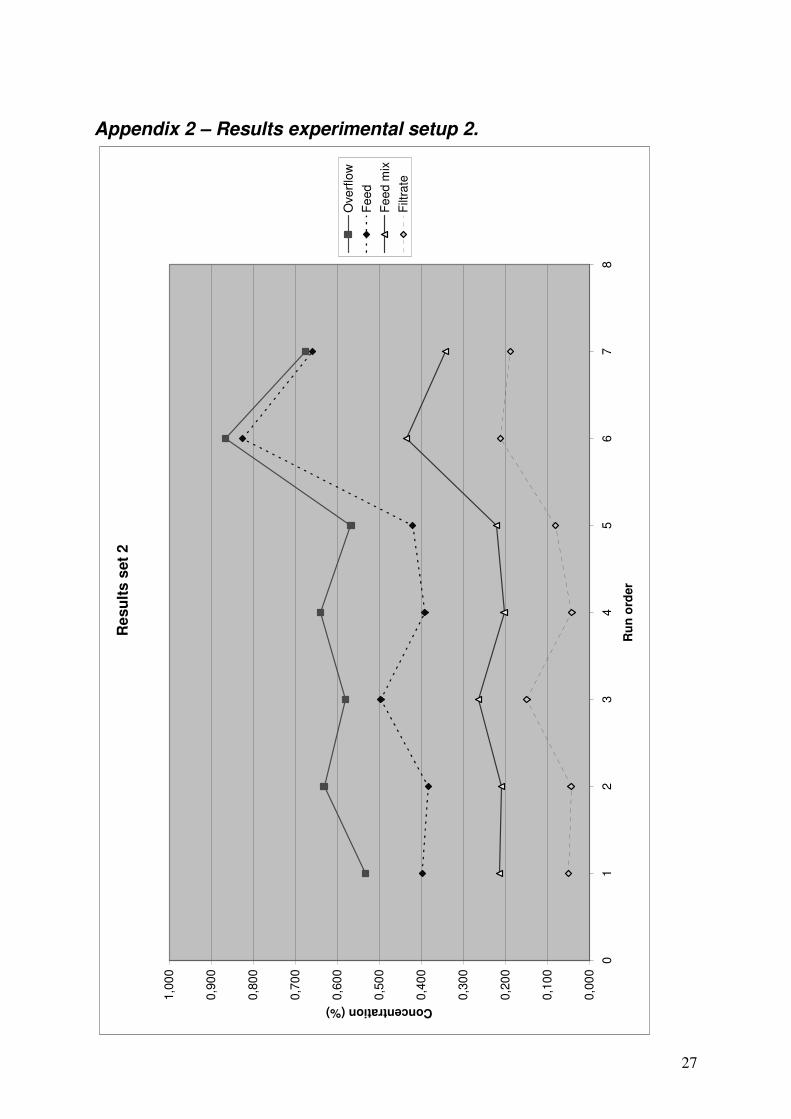
In appendix 3, results from experiment 1-4 for setup 1 and 2 are displayed. The plot shows that there are small differences in the results, taken in consideration that the overflow value for experiment no.2 in setup 1 was inaccurate. The results from experiment no.3 show small variations from the corresponding experiment in setup 1. This indicates that even though the concentration of feed was higher in setup 2 the flotation must have worked equally well.
11 Connection to reality One experiment was carried out at Braviken Paper Mill to see what results the flotation cell would give with right conditions. This experiment was carried out to examine the accuracy of the results from the pilot experiments. When carrying out the experiments at the pilot plant the conditions were near but not exactly the same as at the mill so differences could appear. This confirmation with mill press filtrate was necessary to be able to draw reliable conclusions from the pilot experiments. When carrying out the experiment with the flotation cell right next to the full scale flotation tank, air-saturated press filtrate was led into the cell and the filtrate concentration was measured as before. A feed sample and a press filtrate sample were taken from the full scale tank for comparison. The filtrate from the flotation cell had a concentration of 0.028% compared to the full scale tank filtrate which had a concentration of 0.13%. The concentration of the feed mix was 0.16% which is a little bit lower than in the experiments at the pilot plant.
21
12 Conclusion The purpose of this diploma work was to examine possible influences of process parameters of the removal efficiency in the micro-flotation process. The experiments were planned with the help of factorial design and were carried out in a pilot plant. Controlled factors were temperature, fibre-size distribution, water quality and feed concentration. Concentration measurements were made on the samples and the results were evaluated with the software MODDE. The results from the evaluation showed that factor B (fibre-size distribution) had an influence on the results in experimental setup 1. When doing the follow-up experiments (setup2, experiment no. 1-4) to see if factor B really had an influence on the results, it showed that none of the three factors had any influence on the results. This concludes that none of the three factors (temperature, fibre-size distribution and water quality), influences the results significantly. With this in mind, there is no reason for the full size flotation unit not to work as well as the pilot unit. The conclusion is that the influence on fibre recovery efficiency in the full scale flotation unit comes from another source. Increased feed mix concentration decreased the efficiency of the flotation process drastically. Concentrations of 0.3% and 0.4% resulted in an overload of the cell and the thickening capacity was low. A conclusion could be drawn that the feed mix concentration affected the flotation efficiency. Since the concentration of the press filtrate in the main process is around 0.2% this limitation is not a problem for the full scale flotation tank. The small flotation cell showed good results when used out in the mill with press filtrate from the process and showed good fibre recovery results. This showed that the principle of using flotation as a fibre recovery process is possible. The small scale flotation cell showed better fibre recovery results than the full scale unit. This implies that the small flotation cell works well and according to the studied process parameters there is no reason for the full scale unit not to work as well.
22
13 Future work Future work involves further investigations on the influence of other process parameters, since this diploma work only investigated the influence of four different parameters. A more detailed experimental setup with duplicate runs would give more reliable results. Another important factor that should be studied is how the size of the bubbles affects the fibre recovery results. An investigation of the inlet of air-saturated water into the unit could be made to see how the location of the inlet and the flow-rate of the feed mix affect the fibre recovery efficiency. Perhaps a look at the design of the flotation unit and some remodelling of the design could be the solution.

23
14 Acknowledgement
I want to thank my supervisors Christer Sandberg, Holmen Paper Martin Gustavsson, Noss Stefan Svensson, Linköping University for their support and expertise.
24
References [1] Sundholm, Jan (1999). Papermaking Science and Technology, book 5 (a series of 19 books). Chapter 2 – What is mechanical pulping?, pages: 17-21. Finland: Fapet Oy (1999). [2] Sjöström, Eero (1992), Wood chemistry: Fundamentals and Applications, 2
nd
edition. Academic Press, Inc., San Diego, California (1993). [3] Holik, Herbert (Ed.), Handbook of Paper and Board. Chapter 2 – Raw materials
for paper and board manufacture, pages: 20-24. Germany: WILEY-VCH Verlag GmbH & Co. KgaA, Weinheim (2006).
[4] Wikipedia – Cellulose, Available at: < http://en.wikipedia.org/wiki/Cellulose >
/Information about cellulose. (2009-02-10)
[5] Wikipedia – Lignin, Available at: < http://en.wikipedia.org/wiki/Lignin > /Information about lignin. (2009-02-10) [6] Home - The group - Holmen in brief, (Latest update: 2009-02-17). Available at:
< http://www.holmen.com/main.aspx?ID=4b39d7fe-6df8-46a5-adcb-9bcd1158c35a > /Information about Holmen Group. (2009-02-23)
[7] Home - Paper mills - Braviken, (Latest update: 2009-02-25). Available at:
< http://www.holmenpaper.com/main.aspx?ID=f6732ce8-d202-450e-a731-b0abd15a2203 > /Information about Holmen Paper. (2009-03-01)
[8] Noss – About us. Available at: < http://www.noss.se > /Information about Noss.
(2009-02-23)
[9] Sundholm, Jan (1999). Papermaking Science and Technology, book 5 (a series of 19 books). Artamo, Arvi et al. Chapter 7 – Thermomechanical pulping, pages: 159-221. Finland: Fapet Oy (1999).
[10] L.A. Féris and J. Rubio (1999), Dissolved Air Flotation (DAF) Performance at
Low Saturation Pressures, Filtration & Separation, vol. 36:9, November 1999, pages 61-65.
[11] A.L. Macfarlane, R. Prestidge, M.M. Farid and J.J.J. Chen (2007), Dissolves air
flotation: A novel approach to recovery of organosolv lignin, Chemical
Engineering Journal (2008) [12] R.T. Rodrigues and J. Rubio (2006), DAF – dissolved air flotation: Potential
applications in the mining and mineral processing industry, International Journal
of Mineral Processing (2007), vol. 82:1, pages 1-13.
25
Dictionary Bulk – Specific volume of a paper Buoyancy – Lifting force on a particle in a liquid Cipac-container – Plastic container, 1000 litres Coefficient plot – Graphic technique for identifying factors that best describes the data set Confidence intervals – Interval within the value of the parameter are expected to lie CTMP – Chemi-thermomechanical pulp DAF – Dissolved air flotation Deaeration – Removal of air from suspension Defibrate – Break into parts, from wood chips to free fibres Detergent – Cleansing agent Error bars – Displays the confidence intervals Factorial design – Experimental design to study the effect of parameters in a systematic way Fines – Fibres shorter than 0.2 mm Flotation – A separation process were tiny bubbles that adhere to suspended materials and rise to the surface Hydrophilic – “Water liking” Hydrophobic – “Water disliking” Latency chest – Chest where the fibres are stored to straighten after refining Long fibres – Long fibres, longer then 0.2 mm Macromolecule – Large molecule Mass balance – Ideally “mass entering the system = mass leaving the system” Micro-bubbles – Bubbles with a size the range of 30-100µm Mill – Factory producing paper or pulp MODDE – Experimental design and evaluation software Opacity – The opposite of transparency Pulp – Fibrous material prepared for papermaking Raw material – Material before any treatment, wood chips Refining – Mechanical treatment of the wood, separation into free fibres RMP – Refiner mechanical pulp Saccharide – “Sugar” Screening – Removal of larger materials in pulp Sedimentation – Letting material settle in a liquid suspension Surface tension – Attractive property of a surface Surfactants – Agent that lowers the surface tension of the liquid TMP – Thermomechanical pulp Wastewaters – Liquid waste from industrial processes and domestic residence White water – Process water in the paper machine Wire – Cloth for draining the paper pulp Wire section – Part of the paper machine were most of the water is removed from the pulp
26
Appendix
Appendix 1 – Results experimental setup 1.
Re
su
lts
set
1
0
0,1
0,2
0,3
0,4
0,5
0,6
0,7
0,8
0,9
02
46
81
01
2
Ru
n o
rde
r
Concentration (%)
Overf
low
Fee
d
Fee
d m
ix
Filt
rate
27
Appendix 2 – Results experimental setup 2.
Re
su
lts
set
2
0,0
00
0,1
00
0,2
00
0,3
00
0,4
00
0,5
00
0,6
00
0,7
00
0,8
00
0,9
00
1,0
00
01
23
45
67
8
Ru
n o
rder
Concentration (%)
Ove
rflo
w
Fe
ed
Fe
ed m
ix
Filt
rate
28
Appendix 3 – Comparison between experiments 1 – 4.
Co
mp
ari
so
n b
etw
ee
n s
et
1 a
nd
2.
0
0,1
0,2
0,3
0,4
0,5
0,6
0,7
0,8
0,9
01
23
45
Ru
n o
rder
Concentration (%)
Ove
rflo
w s
et
1
Ove
rflo
w s
et
2
Fe
ed
mix
se
t 1
Fe
ed
mix
se
t 2
Filt
rate
se
t 1
Filt
rate
se
t 2
29
Appendix 4 – Results for experimental setup 1 and 2
Table 12: Results of temperature and flow-rate measurements setup 1.
Table 13: Results of temperature and flow-rate measurements setup 2.
Run order Temp (°C)
Flow-rate, qfilt (l/min)
Flow-rate, qover (l/min)
Total flow-rate, qtot (l/min)
Flow-rate air-saturated, qair (l/min)
1 60 4,29 2,00 6,29 3,14
2 58,5 4,36 2,07 6,43 3,28
3 42,5 4,36 2,40 6,76 3,61
4 41 4,44 2,31 6,75 3,60
5 49,2 4,29 2,09 6,37 3,22
6 49 4,21 2,03 6,24 3,09
7 49 4,21 2,07 6,28 3,13
8 57,7 4,44 2,00 6,44 3,29
9 55 4,36 1,97 6,33 3,18
10 42,6 4,29 2,00 6,29 3,14
11 41,7 4,36 2,03 6,40 3,25
Run order Temp (°C)
Flow-rate, qfilt (l/min)
Flow-rate, qover (l/min)
Total flow-rate, qtot (l/min)
Flow-rate air-saturated, qair (l/min)
1 73 4,62 2,11 6,72 3,00
2 76 4,62 2,00 6,62 2,95
3 44 4,53 2,26 6,79 3,10
4 43 4,80 2,14 6,94 3,05
5 42,6 4,62 2,22 6,84 3,21
6 41 4,53 2,31 6,84 3,05
7 41 4,53 2,40 6,93 3,05