Embed Size (px)
Citation preview

TheEffectthatStateandFederalHousingPoliciesHaveonVehicleMilesofTravel
November2016
AResearchReportfromtheNationalCenterforSustainableTransportation
MatthewPalm,UniversityofCalifornia,Davis
DebbieNiemeier,UniversityofCalifornia,Davis

AbouttheNationalCenterforSustainableTransportationTheNationalCenterforSustainableTransportationisaconsortiumofleadinguniversitiescommittedtoadvancinganenvironmentallysustainabletransportationsystemthroughcutting-edgeresearch,directpolicyengagement,andeducationofourfutureleaders.Consortiummembersinclude:UniversityofCalifornia,Davis;UniversityofCalifornia,Riverside;UniversityofSouthernCalifornia;CaliforniaStateUniversity,LongBeach;GeorgiaInstituteofTechnology;andUniversityofVermont.Moreinformationcanbefoundat:ncst.ucdavis.edu.DisclaimerThecontentsofthisreportreflecttheviewsoftheauthors,whoareresponsibleforthefactsandtheaccuracyoftheinformationpresentedherein.ThisdocumentisdisseminatedunderthesponsorshipoftheUnitedStatesDepartmentofTransportation’sUniversityTransportationCentersprogram,intheinterestofinformationexchange.TheU.S.GovernmentandtheStateofCaliforniaassumesnoliabilityforthecontentsorusethereof.NordoesthecontentnecessarilyreflecttheofficialviewsorpoliciesoftheU.S.GovernmentandtheStateofCalifornia.Thisreportdoesnotconstituteastandard,specification,orregulation.AcknowledgmentsThisstudywasfundedbyagrantfromtheNationalCenterforSustainableTransportation(NCST),supportedbyUSDOTandCaltransthroughtheUniversityTransportationCentersprogram.TheauthorswouldliketothanktheNCST,USDOT,andCaltransfortheirsupportofuniversity-basedresearchintransportation,andespeciallyforthefundingprovidedinsupportofthisproject.WewouldalsoliketothankRosemaryChen,BlytheNishi,CatherineMarino,TannerWolvertonandFrancisDelosSantosforassistanceinthelaboriousandpainstakingworkofgroundtrothingaffordablehousingproductionestimates.Lastly,wewouldliketothankTonySertich,AmandeepKaurandCarrKunzeforprovidingsupportandestablishingacollaborativerelationshipwithCalHFAthatmadesomeofthemostdifficultdatagatheringaspectsofthisanalysispossible.SomeoftheworkinthisreportbuildsoffofpreviousworkfundedthroughtheEmergingLeadersinPolicyandPublicService(ELIPPS)program.
TheEffectThatStateandFederalHousingPoliciesHaveonVehicleMilesofTravel
ANationalCenterforSustainableTransportationResearchReport
November2016
MatthewPalm,GeographyGraduateGroup,UniversityofCalifornia,Davis
DebbieNiemeier,DepartmentofCivilandEnvironmentalEngineering,UniversityofCalifornia,Davis


i
TABLEOFCONTENTS
TABLEOFCONTENTS.......................................................................................................................i
EXECUTIVESUMMARY....................................................................................................................ii
Introduction....................................................................................................................................1
Chapter1:LiteratureReview..........................................................................................................4ProximityMechanism..................................................................................................................................5InfrastructureMechanism...........................................................................................................................9Conclusions................................................................................................................................................12
Chapter2:TheAbilityofSupplySideProgramstoPenetrateHighOpportunity,JobsandTransitRichNeighborhoods.....................................................................................................................13
TheProbabilityofAffordableHousingReachingHighOpportunityAreas............................................13GatheringTheData...............................................................................................................................14Results...................................................................................................................................................16Conclusions...........................................................................................................................................29
Chapter3:TheImpactofScaleChangesofFairMarketRentsonTransitandJobsAccessofSection8EligibleUnitsinThreeofCalifornia’sLargestMPOs.....................................................31
HousingVouchersIntheCaliforniaContext.........................................................................................32Section8andLowVMTNeighborhoods...............................................................................................32MethodsandData.................................................................................................................................34Results...................................................................................................................................................37Conclusions...........................................................................................................................................46
Chapter4:IsPrioritizingAffordableHousinginCalifornia’sRailAccessibleandJobs-RichNeighborhoodsIncreasingDevelopmentCosts?..........................................................................48
TheoreticalRational:WhyAffordableHousingNearRailShouldBeMoreExpensive..........................48OtherRailAccessRelatedFactorsContributingtoCostEscalation......................................................49WhatDeterminestheCostofAffordableHousing?..............................................................................49EmpiricalSetting....................................................................................................................................50Results...................................................................................................................................................53Conclusions...........................................................................................................................................68Limitations.............................................................................................................................................69
Conclusions...................................................................................................................................69
References....................................................................................................................................71

ii
TheEffectThatStateandFederalHousingPoliciesHaveonVehicleMilesofTravelEXECUTIVESUMMARYThisreportexaminestheabilityofexistingandproposedaffordablehousingpoliciestoalignwithsustainabletransportationgoalsinCalifornia.First,wecomparetheabilityofLowIncomeHousingTaxCredit(LIHTC)andRedevelopmentfundedprojectstolocateinneighborhoodswithtransitaccesstoemploymentversusmarketrateproductioninthesameperiod.Wefindtaxcreditfundedunitsoutperformmarketrateproductionwithrespecttojobaccessibilityviatransit,andweattributethistothescoringcriteriaofCalifornia’staxcreditallocatingbody,theTaxCreditAllocationCommittee(TCAC).However,wefindthismayhavecomeatthecostofconcentratingnewaffordablehousinginareaswithhigherpovertyrates.Atthefederallevel,wemeasurehowachangeinthedeterminationofmaximumpayoutsforSection8housingvouchers,knownasFairMarketRents(FMRs),alterstheabilityofvoucherholderstoaccesstransitandjobsrichneighborhoods.Theresultsshowthatchangingto“SmallArea”FMRs,whicharedeterminedattheZIPcodescale,dramaticallyimprovesvoucherholders’accesstojobsrichneighborhoods,butatthecostofnearlyeliminatingvoucheraccessibilityinneighborhoodsthatarecurrentlyaccessible.Andfinally,atthestatelevel,ananalysisisconductedtodetermineifCalifornia’semphasisonpromotingaffordablehousingintransitandjobsrichneighborhoodsisincreasingthecostofaffordablehousingdevelopment.Themodelingresultsindicatethataffordablehousingneartransitstopsisnotsignificantlymoreexpensive,butthatcostsincreaseslightlyforprojectsinjobsrichneighborhoods.Participationinthestate’sTransitOrientedDevelopment(TOD)housingprogramdoesnotsignificantlyimpactcosts.Theresultsofthisresearchareintendedtoinformpolicymakersateverylevelofgovernmentonhowbesttocontinuetointegratetransportationandhousingpolicieswithoutsacrificingtheprimarypurposeofouraffordablehousingpolicies:tohousepeople.
1
IntroductionIntegratinghousingandtransportationplanningisacriticalcomponentofaddressingemissionsfromthetransportationsectoroverthelongterm.Spatialimbalancesbetweenthelocationsofjobsandhousing,forexample,contributetodramaticallylongercommutetimesandcommutechallengesforgrowingregions(1,2).Theproximityofhousingtoresidents’destinationsanditsimpactontheabilityofresidents’toaccessamenitieswithoutrelyingonacarcanhaveacriticalimpactontravelbehavior(3,4).
Yetonlyrecentlyhastheintegrationofhousingandtransportationpolicybecomeamajorfocusofstateandfederalgovernments.InCalifornia,thepassageofSB375in2008washailedasmajorlandmarkinthistrend;thelawrequiresthestate’smetropolitanplanningorganizations(MPOs)toincludea“sustainablecommunitiesstrategy”aspartoftheirregionaltransportationplans(5).UnderSB375,theseplansareintendedbetterlinkhousingandtransportationtoreducevehiclemilestraveled(VMT),ultimatelyreducingcarbonemissionsfromtransportation.Atthefederallevel,theObamaadministrationusheredinaseriesofpoliciesandprogramsaimedatpromoting“sustainablecommunities,”whichincludesofferingplanninggrantsforintegratingtransportationandhousingaswellasrevampingtheHOPEVIprogramintothemoresustainable-transportationorientedChoiceNeighborhoodsInitiative(6,7).TheObamaadministrationalsointroducednewcompetitivecriteriafortheSection811and202programs,whichfinancesupportivehousingandsenioraffordablehousingrespectively,prioritizingthoseprojectswithtransitaccess(8,9).
Thisemergingsetoftransportationandhousingpoliciesisrootedintheunderstandingthatlanduseexhibitsasignificantimpactontravelbehavior.Earlyresearchersstruggledtoseparatetheeffectsoflanduseontravelbehaviorfromthepropensityofindividualstoself-selectintothekindsofneighborhoodswhichwouldallowthemtotravelastheyplease(10,11).Subsequentstudiesaccountingforself-selectionstillfindthatlanduseplaysacriticalrole(12,13).Andthelatestsetofstudies,whichseekstoaddressself-selectionandthespatialissuesinmodelingtravelbehavior,findtheexistingliteraturemaybegreatlyunderestimatingtheimportanceoflanduseinpredictingtravelbehavior(14,15).Regardlessoftheeffectsize,policymakershavealreadybeguntakingaction.
Integratinghousingwithtransportationandlanduseplanninggoalsgenerallyfollowstwooverarchingapproaches:increasingtheproximityofnewhousingtoemploymentandotherdestinations,andincreasinghousingproductionalongraillines,commonlyreferredtoastransit-orienteddevelopment(TOD).Forpolicyevaluation,thesetwoapproachesrequiretheutilizationofdifferentplanningmetricstoevaluatesuccess.Focusingonincreasingtheproximityofnewhousingtoemploymentandotherdestinationsisgenerallyaimedatrelievingjobs-housingimbalances(2,16).Traditionaljobs-housingmetrics,however,maynotreflectthejobaccessibilityoflowwageorlowskillhouseholdsthatareintendedtobenefitfromaffordablehousing:thejobstheycanaccesswillexhibitdifferentpatternsofconcentrationacrossspacefromotherhighwagejobs(17,18).ScholarshaveadvancednewmetricsutilizingthemostdetailedavailableCensusdatatomeasurejobs-housing“fit”,thebalancebetweenlowwageworkersandjobsaccessibletolowwageworkerswithinagivengeography(1).

2
Measuringthesuccessoftransit-orienteddevelopment(TODs)andintegratingaffordablehousingwithpublictransitsystemsrequireadifferentmetricforevaluatingsuccess.Publicagenciesareincreasinglyevaluatinghousingprojects’worthinessbasedonproximitytofixedroutetransitstopsandthestrengthofthemultimodalconnectivitybetweenthosestopsandsurroundingneighborhoods(19,20).
Ourresearchfocusesontheseprimarymetricstoevaluatetheeffectivenessofcurrentandproposedhousingpoliciesinincreasinglowincomehouseholds’accesstocommunitiesinwhichtheycanreducetheirvehiclemilestraveled(VMT).Weanswerthequestion:howarecurrentaffordablehousingpolicies,programsandstrategiesenablinglowincomehouseholdsservedbytheseprogramstoaccessjobsandtransitrichcommunities?
Chapter1reviewstheliteratureonlinksbetweenaffordablehousingandtransportationpolicies.Effortstoalignaffordablehousingwithtransit,jobandamenityaccessarealmostexclusivelytiedtostateandfederalsupplysideaffordablehousingprograms.Thereisalmostnoeffortbypolicymakerstoaligndemandsidevoucherprogramswithtransitandjobsaccess,thisdespitearichliteratureindicatingthatpublictransitaccessisakeyconcernofvoucherprogramparticipantswhensearchingfornewhomes.
Chapter2examinestheabilityofaffordablehousingprogramstooutperformnewmarketratehousingdevelopmentwithrespecttoplacinghousingnearmedicalfacilities,publictransportation,grocerystoresandgoodschools.Wefailtofindanyevidencethataffordablehousingprogramsoutperformmarketratehousingbyanyofthesemetrics.Amongaffordablehousingforseniors,however,weprojectssignificantlyoutperformingmarketrateproductioninplacingnewunitsneargrocerystoriesandpublictransit.
Chapter3explorestherelationshipbetweenpolicyscaleandtheabilityofdemandsidehousingvoucherprogramstoenableparticipantstoaccessjobsandtransitrichcommunities.HUDiscurrentlyexploringchangingthescaleatwhichhousingvouchermaximumpayoutsarecalculated,movingfromthemetropolitanareascaletotheZIPcodescale.Giventhespatially-auto-correlatednatureofrents,wehypothesizethattheuseoffinergeographicscalesinsettingvouchermaximumsincreasesvoucherholders’accesstohighopportunity,jobsrichcommunities.Theresultsshowdramaticimprovementsinvoucheraccesstojobsrichneighborhoodsresultingfromre-scalingvouchermaximumpayoutstothezipcodelevel.
Finally,Chapter4takesadvantageofauniquedatasetofaffordablehousingprojectbudgetstoexaminetheeffectproximitytorailstations,jobaccessandparticipationinthestateofCalifornia’sTODprogramontheperunitcostofaffordablehousingdevelopment.Nosignificanteffectsarefound.Wefindaconfluenceofotherfactors,includingwagerequirements,undergroundparkingandthescaleofprojectsaremoresignificantdriversofaffordablehousingdevelopmentcosts.
Theresultsinthesechapterswillassistaffordablehousingpolicymakersatthelocal,regional,stateandfederallevelsinidentifyingwhatleverstheyhavetoincreaseaffordablehousinginhighopportunity,jobs-richneighborhoods.Theresearchalsoaddressesanumberofimportantgapsincurrentresearch.Chapter3offersmajorinsightsonthepotentialforHUD’sproposed“SmallAreaFairMarketRents”todramaticallytransformtheeffectivenessoftheSection8
3
voucherprogram.Thelastchapteronaffordablehousingcostsalsoholdsimplicationsforpolicymakingbeyondtheissueoftransitaccessforaffordablehousing.Severalstateshaveconductedanalysisevaluatingcost-driversinaffordablehousingproduction(21,22).Ourresultsexpandontheseeffortsandoffernewinsightsintowhatis,andwhatisnotincreasingthecostoftaxcreditfinancedaffordablehousing.
4
Chapter1:LiteratureReviewWiththepassageofCaliforniaSenateBill375(SB375),California’sregionsarebeginningtoatleastattemptcoordinatedplanningofhousingandtransportation(5).However,movingfromintegratingplanningtoactualbuiltcommunitiesthatreflecttheintegratingplanningrequiressophisticatedunderstandingofthemechanismsthroughwhichhousingmarketsandtransportationsystemsendogenouslydriveeachother.Alargebodyofliteratureconcerningtheroleoftransportationinfrastructureininducingland-usechangealreadyexists(23–25).Thispaperflipsthetopicaround,tyingtogetherthetheoreticalmechanismsthroughwhichhousingpoliciesmayhelpinduceshiftsinresidents’travelbehavior.Thepaperislimitedtotherealmofaffordablehousingpolicy,themostsignificantarenawhereingovernmentintervenesinhousingmarketsbesidesmonetaryandtaxpolicy.Wedocumentsignificantneedforresearchonwhetherornotthemanyspatiallyorientedandtransportation-specificelementspresentinawidearrayofaffordablehousingpoliciesandprogramshaveanyeffectatallonresidents’travelpatterns.Wealsocallforresearchthatexaminesthecoststhatthesetransportationapproachesmayhaveonaffordablehousingprograms.Basedonourreviewoftheliterature,wecategorizethepolicies,incentivesandelementsofhousingprogramswhichmayalterresidents’transportoptionsandpreferencesusingtwocategoriesofmechanismsthroughwhichwehypothesizetheyaremostlikelytoimpactresidentstravelbehavior.Thefirstgroupfallundertheproximitymechanism.Thesearepoliciesorprogramsthatincreasetheproximityofaffordablehousingtokeytraveldestinations.Thesecondgroupfallsintowhatwewillrefertoastheinfrastructuremechanism;theseprogramsandpoliciestienewaffordablehousingtomultimodalinfrastructuredevelopment.Themechanismsaredetailedbelow:
• ProximityMechanism.Thesehousingpolicies,programsandincentivesincreasehousingconstructionnearkeytraveldestinations,regardlessofmodalinfrastructureconsiderations.Theoretically,VMTdeclinesasresidents’triplengthsareshortenedandmodeshiftstoactivetraveloccur.Thiscategorycanalsoincludelandusedecisionsthatpreventorconstraintheconstructionofnewaffordablehousingwhenthehousingistoofarawayfromexistingamenities.Thesepoliciesmightincluderequirements,forexample,thatnewaffordablehousingbebuiltinlow-poverty,jobsrichcommunities.Themostcommonfocusofthesepoliciesisonproximitytojobs,andthusisconcernedwithimprovingjobs-housingbalanceor,inthecaseofaccesstolow-wagework,alleviatingspatialmismatch.Thesepoliciesareprimarilyimplementedatthestate,localandregionalscale.
• InfrastructureMechanism.Thissetofpoliciestieshousingdevelopmenttotheavailabilityoftransportationinfrastructure(usuallytransit),orlinksthefinancingofnewaffordablehousingtoinvestmentsinnon-autotransportationmodes.ThesepoliciescaninfluenceVMTbyalteringresidents’modeoftravel.Thiscategoryencompasseseffortstoconcentratehousingdevelopmentintransit-richandwalkingandcyclingfriendlycommunitiesandcanincludepoliciesthatreduceaffordablehousingprojectscommitmentstoautomobileinfrastructurelikeparking.Policies

5
impactingVMTthroughtheinfrastructuremechanismcanbefoundateveryscaleofgovernmentfromlocalzoningincentivestothefederalredevelopmentprograms.
ThisreviewexaminesaffordablehousingpolicieshypothesizedtoimpactVMTthrougheachofthetwomechanismsbythescalesatwhichtheyareimplemented:national,state,regionalandlocalgovernment.Wediscussthepolicies,theirintent,andhighlightevidenceoftheirimpactonvehiclemilestraveled,notinggapsinourunderstanding.Whereevident,thefinancialcostsofthesepoliciesandtheircost-effectivenessrelativetootherhousingpoliciesarereviewed.
ProximityMechanism
HousingpoliciesdesignedtodecreaseVMTthroughproximitydosobyreducingthedistancebetweenhousingandhouseholds’destinations,includingwork,shopping,schoolandpublicservices.Practicallyspeaking,thisoftentakestheformofreducingjobs-housingimbalance,whichhasbeenidentifiedasbeingstronglyassociatedwithwhatscholarsterm“excesscommuting”(2,26).Theimbalanceoflowwagejobstoaffordablehousingisstronglyassociatedwithlongercommutedistancesamonglowwageworkers(1).Althoughjobs-housingbalanceshasbeenastalwartmetricintransportationplanning,somehavearguedthatthejobs-housingbalancemayattainequilibriumovertime,thusnegatingtheneedforthemetric,atleastintransportation,(27)andthatregionaltraveldemandmodelingsuggestsitmaybeeasierforpolicytosteerthelocationofhousingthanjobs(16,28).
LowincomehousingpolicieswhichreduceVMTbyreducingjobs-housingimbalancearespecificallyaddressingspatialmismatch,aproblemfirstinvokedbyWilliamJuliusWilsontodescribethemismatchbetweenthelocationoflow-skilledlaborinurbancoresandthegrowthoflow-wagejobsinsprawling,segregatedsuburbs(29).Addressingmismatch,anditsassociatedexcesscommutinghaspotentialtoreduceVMTandimprovequalityoflifeforlowincomehouseholds;lowincomecommutershavesomeofthelongestcommutetimes(30)andcommutestimearealsoincreasingthefastestamonglow-incomecommuters(31).
NationalPoliciesandtheProximityMechanism
Federalsupplysidehousingpoliciesmayexacerbatethespatialmismatchamongthepoor.Thelargestfederalsupplysidehousingprogram,thelowIncomeHousingTaxCredit(LIHTC)programhashadsomesuccessincreasingtheproductionofaffordablehousinginthesuburbs,wherejobsareplentiful(32).ButDawkinsfindsthatdespitepriorevidencesuggestingtheLIHTCprogramsarespreadingaffordablehousingintolow-wagejobsrichsuburbs(33),thehousingisstillsystematicallyconcentratedinhighpovertyneighborhoodsandhighpovertysuburbsrelativetohousingstockoverall(34).Importantly,theseunitsmaynotbelocatinginareaswheretheneedishighest(35).DawkinsandbothLangattributethistotheaddedsubsidygiventounitsin“QualifiedCensusTracts”(DDAs).Thesearelow-incomeandhighpovertyareaswhichtheDepartmentofHousingandUrbanDevelopment(HUD)offersdeepersubsidiesforLHITCfundedprojects(36).LangarguesthatbecausebuildinginDDAsoffersgreaterfinancialreward,developerschoosetoconcentratetaxcreditdevelopmentsinthosetracts—despitetheirhighpovertyrates(37).TheQCTandDDAaretheonlyspatially-orientedaspectsoftheLIHTCprogramthataresetatthefederallevel.
6
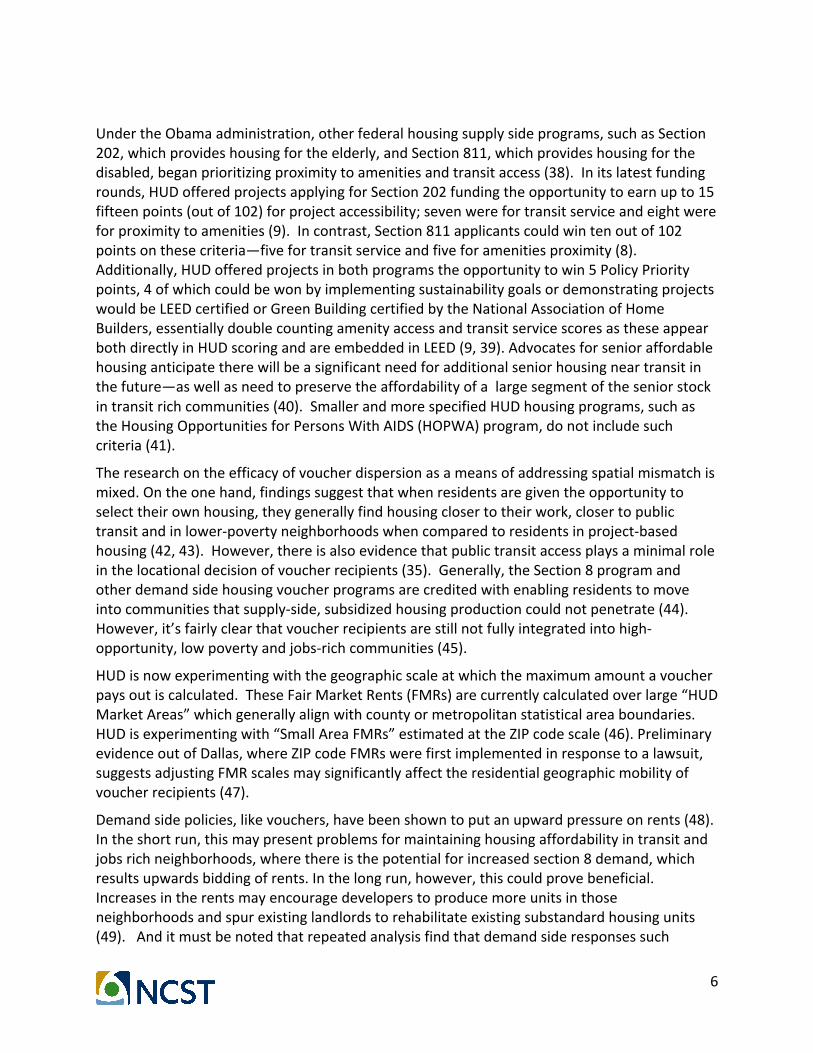
UndertheObamaadministration,otherfederalhousingsupplysideprograms,suchasSection202,whichprovideshousingfortheelderly,andSection811,whichprovideshousingforthedisabled,beganprioritizingproximitytoamenitiesandtransitaccess(38).Initslatestfundingrounds,HUDofferedprojectsapplyingforSection202fundingtheopportunitytoearnupto15fifteenpoints(outof102)forprojectaccessibility;sevenwerefortransitserviceandeightwereforproximitytoamenities(9).Incontrast,Section811applicantscouldwintenoutof102pointsonthesecriteria—fivefortransitserviceandfiveforamenitiesproximity(8).Additionally,HUDofferedprojectsinbothprogramstheopportunitytowin5PolicyPrioritypoints,4ofwhichcouldbewonbyimplementingsustainabilitygoalsordemonstratingprojectswouldbeLEEDcertifiedorGreenBuildingcertifiedbytheNationalAssociationofHomeBuilders,essentiallydoublecountingamenityaccessandtransitservicescoresastheseappearbothdirectlyinHUDscoringandareembeddedinLEED(9,39).Advocatesforsenioraffordablehousinganticipatetherewillbeasignificantneedforadditionalseniorhousingneartransitinthefuture—aswellasneedtopreservetheaffordabilityofalargesegmentoftheseniorstockintransitrichcommunities(40).SmallerandmorespecifiedHUDhousingprograms,suchastheHousingOpportunitiesforPersonsWithAIDS(HOPWA)program,donotincludesuchcriteria(41).
Theresearchontheefficacyofvoucherdispersionasameansofaddressingspatialmismatchismixed.Ontheonehand,findingssuggestthatwhenresidentsaregiventheopportunitytoselecttheirownhousing,theygenerallyfindhousingclosertotheirwork,closertopublictransitandinlower-povertyneighborhoodswhencomparedtoresidentsinproject-basedhousing(42,43).However,thereisalsoevidencethatpublictransitaccessplaysaminimalroleinthelocationaldecisionofvoucherrecipients(35).Generally,theSection8programandotherdemandsidehousingvoucherprogramsarecreditedwithenablingresidentstomoveintocommunitiesthatsupply-side,subsidizedhousingproductioncouldnotpenetrate(44).However,it’sfairlyclearthatvoucherrecipientsarestillnotfullyintegratedintohigh-opportunity,lowpovertyandjobs-richcommunities(45).
HUDisnowexperimentingwiththegeographicscaleatwhichthemaximumamountavoucherpaysoutiscalculated.TheseFairMarketRents(FMRs)arecurrentlycalculatedoverlarge“HUDMarketAreas”whichgenerallyalignwithcountyormetropolitanstatisticalareaboundaries.HUDisexperimentingwith“SmallAreaFMRs”estimatedattheZIPcodescale(46).PreliminaryevidenceoutofDallas,whereZIPcodeFMRswerefirstimplementedinresponsetoalawsuit,suggestsadjustingFMRscalesmaysignificantlyaffecttheresidentialgeographicmobilityofvoucherrecipients(47).
Demandsidepolicies,likevouchers,havebeenshowntoputanupwardpressureonrents(48).Intheshortrun,thismaypresentproblemsformaintaininghousingaffordabilityintransitandjobsrichneighborhoods,wherethereisthepotentialforincreasedsection8demand,whichresultsupwardsbiddingofrents.Inthelongrun,however,thiscouldprovebeneficial.Increasesintherentsmayencouragedeveloperstoproducemoreunitsinthoseneighborhoodsandspurexistinglandlordstorehabilitateexistingsubstandardhousingunits(49).Anditmustbenotedthatrepeatedanalysisfindthatdemandsideresponsessuch

7
housingvouchersaresignificantlymorecosteffectivethansupply-sidesubsidiesfornewhousingconstruction(50,51).
StateandRegionalPoliciesandtheProximityMechanism
StatesdirectaffordablehousingpolicythroughtheirQualifiedAllocationPlans(QAPs).TheannualQAPs,approvedbythefederalDepartmentofHousingandUrbanDevelopment(HUD),establishpolicyforthedisbursementofLowIncomeHousingTaxCredits.TheQAPsincludescoringcriteriaforcompetitivetaxcredits;pointscanbeawardedforcostefficiency,localgovernmentsubsidy,andlocation.Johnsonfindsthatfrom2000to2010,thepercentofstatesawardingpointstoprojectsforproximitytomultimodaltransportationfacilitiesrosefrom3%to31%(52).Proximitytootheramenitiessuchasparks,libraries,socialservices,banks,schools,grocerystoresandmedicalservicesincreasedfrom16%ofQAPsto56%duringthesameperiod(53).
Mostaffordablehousingpolicyismotivatedprimarilybypovertyde-concentration.JohnsonfindsQAPpolicydoesresultinsignificantlymoreLIHTCprojectsinlowerpovertycommunities(52).HUD’sownresearchalsoconcludesthattheawardingoftaxcreditstoprojectsoutsideareasofconcentratedpovertyandnearmoreamenitiesinQAPsassistsinpovertyde-concentrationandincreasesaccesstoamenities(54).Giventheseresults,wecanspeculatethatthelocationalcriteriausedinscoringforcompetitivetaxcreditfundedprojectscontributestoreducingresidents’proximitytojobsandamenities(andbyextensionreducesVMT),butsupportresearchisnotcurrentlypresentintheliterature.
BeyondtheQAPs,statescanalsoutilizelandusepolicytoreducetheseparationbetweenaffordablehousingandsuitableemployment.Severalstateshavelanduselawsdesignedtoconstrainlocaljurisdictions’exclusionaryzoningpractices.Exclusionaryzoningisaprocessbywhichcitiesensurethatpoororlowincomefamiliescannotaffordtoliveincertainneighborhoods.Mostcommunitiescreatethiseffectbyestablishingminimumlotsizes,oronlyzoningforsingle-familydetachedunits.Thelinkbetweenexclusionaryzoninginthesuburbsandspatialmismatchbetweenlowwageworkers’andavailabilityoflow-wageworkiswellestablishedintheliterature(55).Thereissomeevidencelinkingexclusionaryzoningtospatialmismatch,butthestrengthoftheassociationbetweenexclusionaryzoninginexplainingspatialmismatchrelativetoothercausesisunclear(56).However,sincespatialmismatchislinkedtoexcesscommutingamongthepoor(57),policiesaimedatoverridingexclusionaryzoninghavethepotentialtoalsoreduceexcesscommutingandthus,VMTamonglowincomehouseholds.
Inoneofthemostextensivereviewsofanti-exclusionaryzoningpoliciestodateBrattandVladeck(2014)arguethatthesepoliciesareimportantforensuringthataffordablehousingconstructionisdispersedacrossregionsandstates.Interestingly,theyfindthatcitiesthatsucceedinmeetingthesestatemandatedaffordablehousingbenchmarkstendtobelesswhite,oflowerincomesandhavelesstotalhousingconstructionrelativecitieslesssuccessfulunderidenticalstatelaws.Successfulcommunitiesunderanti-exclusionarylawsarealsolikelytobecitieswithseriousjobs-housingimbalance(58).Thereislimitedtonoresearchthatexamineshowanti-exclusionaryzoningpoliciesaffectthecostofconstructingnewhousing.Buttherelationshiparelationshipexclusionarypracticesandhigherhousingpricesexists(59).

8
Onelaststatelevelproximitymechanismisdensitybonuses.Statescanofferdensitybonusesfortheinclusionofaffordablehousingaspartofalargerdevelopmentproject.Densitybonuseshavebeenfoundtoincreasehousingproductioninalreadydense,centralizedcommunities(citation).Thisstrategyholdspromiseforproducinghousinginlow-VMTcommunities,butatthecostofconcentratingnewaffordablehousinginareaswithhigherthanaveragepovertyrates(60).
LocalGovernmentPoliciesandtheProximityMechanism
LocalgovernmenthousingpoliciesthatcanreduceVMTviatheproximitymechanismaresignificantinthattheycanenablethosejurisdictionswithseverejobs-housingimbalancesorshortagesofaffordablehousingtodirectlyspecifywheremoreaffordablehousingcanbebuilt.Thissub-sectionreviewsthesepoliciesandtheirbenefitsforVMTreduction.
Localgovernmentinclusionaryhousingmandates—arequirementthatsomepercentageofanewresidentialdevelopmentcontainaffordablehousingorthedevelopermustpayanin-lieufee—arethemostdirectmeansofensuringhousingatallincomelevelsisproducedineverycommunity.Scholarshavetraditionallyhadtroubleevaluatingtheseprograms;requirementscanvarybycityandtheoptionfordevelopmentstopayintoanaffordablehousingfundin-lieuofincludingaffordableunitsisalsoallowedinsomecities(61,62).Despitethedifficultyinevaluatingtheseprograms,therearesomepointsofintereststhathaveemergedfromtheresearch.First,inclusionaryhousingpoliciesmayalsoservetoshoreupaffordablehousingproductionincitiesthathavehistoricallyhadmoretroubleproducinghousingandhavestatehousingmandates(63).
Intheory,ifmostcitieshaverobustinclusionaryhousinglaws,theninclusionary-basedaffordableunitproductionshouldatleastparallelmarketrateproductionwithrespecttotheintra-regionalspatialdistributionofnewunits.Thetheoreticalcostofhavingtheseprogramsisthatbyreducingdeveloperprofitsthroughforcingasubsidy—theinclusionaryunits—thepolicyendsuphamperoverallhousingproduction,althoughverylittleevidenceofthishasyettobefound(Rosen,2004).Laterresearchfoundthatevidenceofpriceincreasesfrominclusionaryhousingisspuriouslydrivenbythefactthatcitieswithfastrisingpricesarethosewhichimplementthesepolicies(e.g.,theresearchmaysufferfromselectionbias)(64).Coordinationofinclusionaryzoningpoliciesacrosslocalitiesinthesameregionholdsgreaterpromiseofevenlydistributinginclusionary-zoningdevelopedaffordablesites(65).Theimportanceofregionalcoordinationofsuchpoliciesseemsobvious;developersrespondtointra-regionalvariationininclusionary-zoningrequirementsbyconcentratingconstructionincommunitieswheretherequirementsareleastexpensive.
Citiesandcountiesalsocontrollanduseandzoning,providingtheopportunityforadditionalaffordablehousingthroughamilieuoflanduseandzoningchangesthatincreasedensityinjobsandamenity-richneighborhoods.Zoningtoenablebackyardor“grannyflat”unitsbehindsinglefamilyhomescanboosttherangeofnaturallyaffordablehousing(66),especiallyintransit-orientedneighborhoods(67).Affordabilitybydesign—thelegalizationofmicro-unitsorflatswithsharedcommonareas—offersgreatpotentialinprovidingnaturallyaffordablehousingindense,expensiveareaswithcloseproximitiestoamenitiesandjobs(68).However,thisfrequentlyrequiressignificantoverhaulofexistingzoningandregulatorybarriers(69).
9
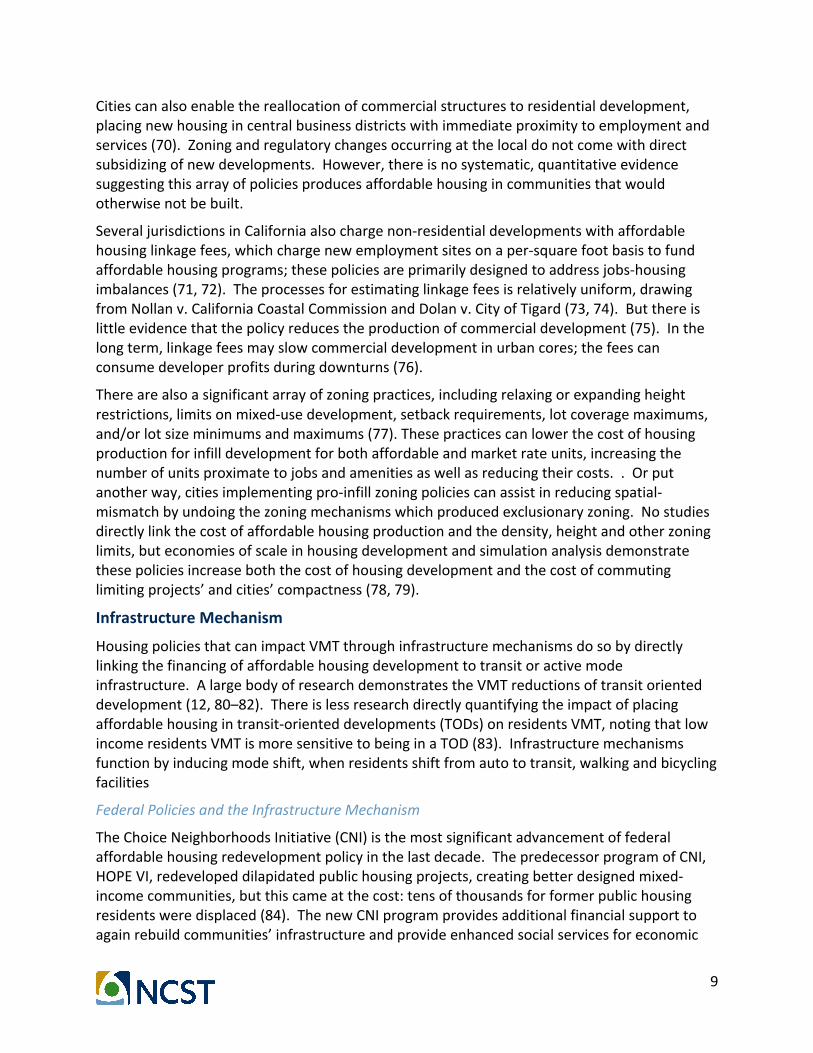
Citiescanalsoenablethereallocationofcommercialstructurestoresidentialdevelopment,placingnewhousingincentralbusinessdistrictswithimmediateproximitytoemploymentandservices(70).Zoningandregulatorychangesoccurringatthelocaldonotcomewithdirectsubsidizingofnewdevelopments.However,thereisnosystematic,quantitativeevidencesuggestingthisarrayofpoliciesproducesaffordablehousingincommunitiesthatwouldotherwisenotbebuilt.
SeveraljurisdictionsinCaliforniaalsochargenon-residentialdevelopmentswithaffordablehousinglinkagefees,whichchargenewemploymentsitesonaper-squarefootbasistofundaffordablehousingprograms;thesepoliciesareprimarilydesignedtoaddressjobs-housingimbalances(71,72).Theprocessesforestimatinglinkagefeesisrelativelyuniform,drawingfromNollanv.CaliforniaCoastalCommissionandDolanv.CityofTigard(73,74).Butthereislittleevidencethatthepolicyreducestheproductionofcommercialdevelopment(75).Inthelongterm,linkagefeesmayslowcommercialdevelopmentinurbancores;thefeescanconsumedeveloperprofitsduringdownturns(76).
Therearealsoasignificantarrayofzoningpractices,includingrelaxingorexpandingheightrestrictions,limitsonmixed-usedevelopment,setbackrequirements,lotcoveragemaximums,and/orlotsizeminimumsandmaximums(77).Thesepracticescanlowerthecostofhousingproductionforinfilldevelopmentforbothaffordableandmarketrateunits,increasingthenumberofunitsproximatetojobsandamenitiesaswellasreducingtheircosts..Orputanotherway,citiesimplementingpro-infillzoningpoliciescanassistinreducingspatial-mismatchbyundoingthezoningmechanismswhichproducedexclusionaryzoning.Nostudiesdirectlylinkthecostofaffordablehousingproductionandthedensity,heightandotherzoninglimits,buteconomiesofscaleinhousingdevelopmentandsimulationanalysisdemonstratethesepoliciesincreaseboththecostofhousingdevelopmentandthecostofcommutinglimitingprojects’andcities’compactness(78,79).
InfrastructureMechanism
HousingpoliciesthatcanimpactVMTthroughinfrastructuremechanismsdosobydirectlylinkingthefinancingofaffordablehousingdevelopmenttotransitoractivemodeinfrastructure.AlargebodyofresearchdemonstratestheVMTreductionsoftransitorienteddevelopment(12,80–82).Thereislessresearchdirectlyquantifyingtheimpactofplacingaffordablehousingintransit-orienteddevelopments(TODs)onresidentsVMT,notingthatlowincomeresidentsVMTismoresensitivetobeinginaTOD(83).Infrastructuremechanismsfunctionbyinducingmodeshift,whenresidentsshiftfromautototransit,walkingandbicyclingfacilities
FederalPoliciesandtheInfrastructureMechanism
TheChoiceNeighborhoodsInitiative(CNI)isthemostsignificantadvancementoffederalaffordablehousingredevelopmentpolicyinthelastdecade.ThepredecessorprogramofCNI,HOPEVI,redevelopeddilapidatedpublichousingprojects,creatingbetterdesignedmixed-incomecommunities,butthiscameatthecost:tensofthousandsforformerpublichousingresidentsweredisplaced(84).ThenewCNIprogramprovidesadditionalfinancialsupporttoagainrebuildcommunities’infrastructureandprovideenhancedsocialservicesforeconomic

10
revitalization(6).ChoiceNeighborhoodprojectscanspendupto15%oftheirbudgetsonCriticalCommunityImprovements(CCIs).Severalprojectscurrentlyunderwayincludeimprovedbicycleandpedestrianfacilities,andimprovedtransitservice(85–87).Despiterequiringconsiderablefederalinvestment,theinterventionsareconsideredsignificantlylessexpensivethaninactionorminorrehabilitation(88).
ResearchersonredevelopmenthaveidentifiedquantifiablemetricsbywhichCNIcouldbedeemedasuccess;onlyoneofthemetricsisassociatedwithtransportation:increasedtransitservice(7).GivensomeofthemajoraccessibilityandinfrastructurechangessoontobeunderwayinCNIcommunities,theseprojectsalsowarrantfurtherstudyastheyrepresentnaturalexperimentsthatcanadvanceourunderstandingofhownewinfrastructureinfluencestravelbehavior.
StateandRegionalPoliciesandtheInfrastructureMechanism
Californiahasexperienceproducingaffordablehousingproximatetomajortransitinfrastructure,andlinkinghousingconstructionwithinvestmentsintransitandbicycleandpedestrianfacilityupgrades.AdvocateswithHousingCaliforniahavedocumentedthatthestate’sInfillInfrastructureGrant(IIG)andTransitOrientedDevelopment(TOD)Granthavehelpedproduceover12,000affordableandmarketrateunitsatroughly$36,000perunitsinsubsidy(89).Thisanalysisdoesnotconsidertheextenttowhichsuchsubsidieswerenecessarytoensurehousingproduction,orifunitsfundedthroughthisprogrammerelyfunctionedtocrowdoutunitsthemarketwouldhavealreadyprovidedfor—assomehavesuggestedtheLIHTCprogramdoes(90).
Thereis,however,reasontobelievethatthesubsidiesprovidedbytheIIGandTODgrantsarenecessarytoatleastensuretheprovisionofaffordableunitsinTODsites,particularlythosebuiltalongfixedrouterailsystemsfixedroutetransitsystemsincreaselandandpropertyvalues.Alargebodyofliteraturesuggeststhatadjacencytofixedroutetransitcancommandlandandhousingpriceincreasesanywherefroma1%to15%(91–93).WhilethisliteratureismostlyconcernedwithadjacencytotransitsystemsasopposedtoTODdevelopments,wewouldexpecttheeffectoftransitonpropertyvaluestobestrongerinTODsastheyaredesignedandbuilttocapitalizeontransitaccessandalsoincludewalkabilityandbikeabilityintheirdesigns(94–96).Eventheprocessofplanningforpotentialtransitinvestmentsandrailexpansionscantriggerpropertyvalueincreases(97).ThetransitpremiumasonlyincreasedsincetheGreatRecession(91,98).
Takenholistically,theresearchtodatesuggeststhatsubsidizinglowincomehousingintransitorienteddevelopmentsshouldthusberoughly1%to15%moreexpensivethansubsidizinglowincomehousingelsewhere,allthingsbeingequal.It’snotcleariftheadditionalsubsidiesprovidedbytheTODandIIGprogramscoverorexceedthiscost.Iftheseprogramsfailedtomeettheadditionalcosts(associatedwithincreasedpropertyvalues),thendevelopersmaycutcostselsewhere,bargaindownzoningorparkingrequirementswithcities,orsoughtoutadditionalsubsidies.Ifthesubsidyexceededtheadditionalneed,thenprojectstakingadvantageoftheseprogramsmayhavesimplydrawnlesssubsidyfromothersourcestheywouldhavewonotherwiseorexperiencedcostinflation.

11
Californiahasalsointroduceditsownprogramforaffordablehousingproductionandrehabilitationthatmimic’stheChoiceNeighborhoodInitiative.Thenewprogram,theAffordableHousingandSustainableCommunities(AHSC)program,linksnewhousingwithimprovedgreeninfrastructure.TheproposedscoringcriteriaforAHSCprojects,andsubsequentpushbackfromvariousstakeholders,highlightsthechallengesfacingpolicymakershopingtosimultaneouslyaddresssocialequityandenvironmentalsustainabilityissues.Asofthiswriting,2016draftscoringcriteriaplaceonly30outof100pointsonemissionsreductionsandcost-effectiveness,whilerewardingjust10pointstoprojectsfordepthofhousingaffordability(e.g.unitsat30%ofareamedianincomeversusunitsat80%ofareamedianincome)(20).
TheAHSCisagoodprogramforevaluationbecauseitreliesonaspecific,uniformandreplicabletooltoestimatetheemissionsreductionsofaffordablehousingprojectsbasedontheirlocationsandattributes:CalEEMod,adevelopmentemissionsestimationmodel.CalEEModisnotaVMTestimator,butitincludesestimationofVMTproducedbysites.Itlinksprojectcostsandestimatedemissionsreductions,andcanbeapplieduniformlytoprojectsfundedthroughanysources,notjusttheAHSC.However,CalEEModisn’treallysetuptoaddressaffordablehousingandsomeadvocateshavenotedstudiessuggestthesoftwaremaybeunder-estimatingtheemissionsreductionsfromaffordablehousingcommitmentsinprojects(99).
Finally,afewambitiousmetropolitanplanningorganizations(MPO),whichareresponsiblefordisbursingtransportationdollarsattheregionalscale,havecreatedfinancialincentivestoinducedevelopmentofaffordablehousingalongsidetransitandtransitinfrastructureimprovementprograms.TheSanFranciscoBayArea’sMetropolitanTransportationCommission’sHousingIncentiveProgram(HIP),forexample,providedover$7.3milliondollarstoprovidesetper-bedroomgrantstohousingprojects,assistinginthefinancingofnearly5,000unitsallwithinathirdofamileofafixedroutetransitstopwithserviceintervalsof15minutesorlessduringpeakcommutetimes(100).
LocalPoliciesandtheInfrastructureMechanism
Thestrongestaffordablehousingproductiontoolavailabletolocaljurisdictionsistheabolitionofminimumparkingrequirementsforhousingconstruction.EvidencefromNewYorksuggestsdevelopersgenerallyonlybuildtheminimumrequiredamountofparking,andthatparkingminimumscorrelatenegativelywithdistancetotransit(101).InLosAngeles,therelaxingofparkingrequirementshasplayedacriticalroleinenablingdeveloperstoconstructmorehousing(102).Shouphaslongarguedthatparkingrequirementsartificiallyraisethecostofhousing,penalizingcar-freehouseholdswithhigherhousingcosts(103).Thereisclearevidencethatparkingavailabilityincreasesautouse(104),Activistorganizationsarenowworkingwithdevelopersandcitiestoenablenewinfilldevelopmentstobebuiltwithoutarduousminimumparkingrequirementsinexchangefordeveloperspurchasinglifetimetransitpassesfornewunitsandprioritizingbicycleparking,amongotherthings(105).However,thisapproachmayfacesomeofthemostsignificantroadblocks,astransportationandparkingrelatedcomplaintsaresomeofthemostcommontofuelNIMBY(not-in-my-backyard)backlashagainstaffordablehousingproject(106).ThisobstacleisstrongenoughthatCaliforniahadto

12
passastatelawrequiringcitiestoallowseniorandspecialneedsaffordablehousingprojectsmeetlowerminimumparkingrequirements(107).
Conclusions
NearlyallpoliciesincreasinghousinginTODsaresupplyside.Giventheweightoftheevidencethatdemandsideprogramsaremorecosteffectiveandcaninduceasupplysideresponse,policymakersshouldexploreofferingdemandsidepoliciestohelplowerincomehouseholdsaffordTODs.Policymakersshouldalsoconsideradjustexistingdemandsidepoliciestoaccountthehighercostoflivinginmoreaccessiblecommunities.
Policieswhichincreasehousingproximitytodestinations,particularlythoseembeddedinpointsystemsforvariousfundingprograms,arenotsensitivetohowlocalexclusionaryzoningmaybeconstrictingthenumberofprojectsineachlocalitythatcansuccessfullycompeteforfunding.Policymakersshouldexaminehowthisdynamicmaybeimpactinglandpricesofthoseoccasionalsitesthatpossesstherightmixofproperlocalzoningandanoptimallocationforwinningtaxcreditsorothersubsidies.Thestate’sRegionalHousingNeedsAllocation(RHNA)hasaprovenrecordofsuccess,itshouldformthebasisaroundwhichmoreaggressiveregionalhousingpoliciescanbeestablished.Forexample,thestateoranMPOcouldbegiventherighttooverridelocalplanningdecisionsonsitesprovidedinadequatesiteinventories.Inacasewheresuchasiteisinfeasibleforaprojectbecauseofheightlimitsorotherrulesthedevelopercouldapplydirectlytothestatetooverridelocalrules.
NewResearchDirections
NewresearchneedstoexamineifthelocationalscoringcriteriaofQAPimpactsthephysicalandsocialmobilityofsiteresidentsandifso,towhatextent.Thisresearchshouldalsocompareresidents’sitestotheproximityoftheirprevioushomestothesamesetofamenitiestoexaminewhichprogramsarereducingVMTbyassistingresidentialtransitionsintomorelocationefficientareas.ScholarsshouldexplorehowpolicyvariationoverspaceandtimeinLIHTCprojectscoringcriteriacontributestodifferenttransportoutcomesamongprojectresidents—andwhatcosts,bothfinancialcostsandthelossoftheabilitytoutilizehousingpolicytomeetothersocialgoals.
TheimpactoftheRHNAandsimilarprogramsonboththesupplyofaffordablehousingandthecostoflandneedfurtheranalysis.Theindividualandcumulativeimpactsofvariousaspectsoflocalzoning,fromheightlimitstoaestheticrequirementstosustainabilityrequirementsonthecostofbuildinghousingarestillunaccountedfor.Howthesecostsareunevenlyforcedontoaffordablehousingdevelopmentacrossourregionsandtheresultingincentivesurfacetheycreatehasalsonotbeenfullycharted.
Onthedemandsize,scholarsshouldexploretheroleofpolicyscaleinpredeterminingvouchereligibility,particularlythescaleatwhichFairMarketRentsforSection8vouchers.Moreimportantly,thereisalackofunderstandingofhowthemanyspatiallyorientedhousingpoliciesandprogramscoringcriteriaatmultiplelevelsofgovernmentsynergisticallydriveaffordablehousingdevelopmentintosomeareasandnotothers.

13
Chapter2:TheAbilityofSupplySideProgramstoPenetrateHighOpportunity,JobsandTransitRichNeighborhoodsConstructingaffordablehousinginlow-poverty,jobs-richcommunitieshasbeenapriorityofstateandfederalhousingpolicyfordecades.ScholarsgenerallycredittheLowIncomeHousingTaxCreditprogramwithsignificantlyimprovingthelocationalqualityofnewaffordablehousingcomparedtothemega-projectsbuiltinthe1950sand1960s(33).Verylittleresearchcomparesthelocationaloutcomesofaffordablehousingunitsbasedonthedifferenttypesofprogramswhichfundedthem.Wecomparethelocationaloutcomesofunitsfundedbythreedistincttypesofprogramsagainsteachotherandagainstmarketrateunits:inclusionaryhousingunits,redevelopmentsupportedunitsandtaxcreditfinancedunits.Wecomparehowtheseprogramsvaryinlocationaloutcomesacrossthreedistinctmetropolitanareas:theSanFranciscoBayArea,GreaterSacramento,andSanDiegoCounty.Dataisdrawnfromtheauthors’ownexaminationofmultipledifferentplanningandhousingfinancingsourcesandspanstheyearsfrom2000to2010.
Withrespecttoneighborhoodjobaccess,weunitsfundedthroughallthreetypesofprogramsunderperformagainstmarketrateunitsoverall,butthattheyperformevenlyagainstmarketrateunitsintheBayAreaandactuallyperformbetterthanmarketrateunitsintheGreaterSacramentoarea.Withrespecttoneighborhoodpovertyrates,allthreetypesofprogramsperformworsethanmarketratedevelopment.Withrespecttotransit,groceryandmedicalaccess,taxcreditfundedprojectsoutperformotherunitsbuiltbyprogramsandmarketrateunitsonlywithrespecttotransitandgroceryaccess,suggestingtheemphasisonlocationinCalifornia’sscoringcriteriafortaxcreditsareeffective,butnotuniformlyso(19).
TheProbabilityofAffordableHousingReachingHighOpportunityAreas
Theaffordablehousingtaxcreditprogramisthelargestsupply-sideaffordablehousingconstructionprogram.Meantasareplacementtolargeproject-styleaffordablehousingbuiltdirectlybythefederalgovernment,taxcreditfinancedhousingisdevelopedbyprivateandnon-profitorganizationswhocompetefortaxcreditsthattheycanselltobankstoraisefundingforsubsidizedhousing.Whilethetaxcreditprogrammayout-performtheolderhousingprojects(32),itisstillconcentratedinhigherpovertycommunitiesduetobonusesinthetaxcreditsthefederalgovernmentawardstoprojectslocatedinspecificneighborhoods(34).Inaquesttomaximizereturns,developersappeartobesystematicallylocatinginthesecommunitiesdespitetheirhigherthanaveragepovertyrates(37).Thosestateswhoutilizetheirtaxcreditallocationplanstoprioritizebuildinginlowpovertyneighborhoods,however,appeartohavesomesuccessinplacingsitesin“highopportunity”neighborhoods(53).However,California’sTaxCreditAllocationCommittee(TCAC)doesnotrewardprojectsforlocatinginlow-povertyneighborhoods,makingitunlikelytaxcreditfundedprojectsinoursamplewilloutperformmarketrateunitswithrespecttoneighborhoodpovertyrates(19).Withrespecttotransitaccess,however,taxcreditprojectsmayoutperformmarketrateunits,asTCACawardspointstocompetitiveprojectapplicationsforthoseprojectslocatedwithinahalfmileoftransitservice,alocationalincentivefoundtobeeffectiveinotherstates(19,54).

14
Thisshouldholdparticularlytrueforseniorhousing,whichisalsosubjecttospecificcriteriaaboutaccessandproximitytomedicalfacilitiesinCalifornia’staxcreditallocationplan(19).
Inclusionaryhousingcanbeexpectedtoatleastmatchmarketratedevelopmentwithrespecttolocationaloutcomesbypolicydesign.Citiesimplementmandatesonnewdevelopmentsinwhichanywherefrom10%to30%ofnewunitsinanydevelopmentmustbeaffordable,andtheseunitsarereferredtoasinclusionaryunits(62).However,somecitiesdoallowdeveloperstopayin-lieufees(108).Underpolicyregimesinwhichinclusionaryhousingpoliciesaremandatoryforalljurisdictions,inclusionaryunitsarefoundtobeevenlyspacedacrossregions(65).Giventhatinclusionaryhousingiswidespreadinuseinourcasestudyregions(109),weshouldexpectinclusionaryhousingtoperformwellcomparedtomarketratedevelopment.
California’sredevelopmentprogramisalmostcompletelyunstudiedwithrespecttothelocationaloutcomesofsites.ThemodernschemeofredevelopmentinCaliforniacommencedwithProposition18,whichenabledlocalredevelopmentagenciestoreceivefundingthroughtax-incrementfinancing(110).Subsequentpolicychangesinthestate,especiallyProposition13,createdconditionswhereincitiesincreasinglyexpandedtheirdefinitionsofredevelopment“projectareas”toincreasefundingavailability(110).Becausetheseprogramswereprimarilyconcentratedinurbanareas,however,wemayhypothesizethattheyshouldoutperformmarketrateproductionwithrespecttojobandtransitaccess,particularlyinfastgrowingregionswheremanysuburbancommunitiesmaystillbetoonewtorequiretheirownredevelopmentprograms.
GatheringTheData
ThedataonaffordablehousingwasproductionwasgatheredfollowingafivestepprocessoutlinedbyPalmandNiemeier(111).ThisprocessissummarizedinFigure1.Asjurisdictionsreportaffordablehousingtotheirrespectivemetropolitanplanningorganizations(MPOs),theprocessinvolvedsearchingthroughstateandlocalplanningrecordsidentifyingsitesandunitsuntilthedatasetmatchedwhatthejurisdictionsreportedlyproduced.ThisprocesswasnecessarybecauseCaliforniadoesnotmaintainacomprehensivedatasetonaffordablehousingproductionfromallprogramsstatewide(112).DataonmarketrateproductionwaspulledfromtheUnitedStatesCensusBureau.

15
Figure1:HousingProductionDocumentationProcess OutcomevariablesforunitsaresummarizedinTable1.Asdescribedinthepreviouschapter,ouranalysisincludesmultiplemeasuresofjobs-housingbalancethathavebeenfoundtobesignificantpredictorsof‘excesscommuting’andcommutetimes(2,16,26).Asalsodiscussedpreviously,weincludethemorelow-wageworkersensitivemeasureofjobs-housingfit(1).BasedontheirimportanceinTCACregulations,weincludeaccesstomedicalfacilitiesandgrocerystores(19,54).Wealsoincludepovertylevel,aspovertyconcentrationinprojects’siteshaslongbeenachallengesupplysideprogramshavebeentryingtoaddress(33,34).Asscholarshaveevaluatedtheeffectivenessofthelocationofaffordablehousingwithrespecttoneed,weincludethemeasureusedbythoseresearcherstodefineneed:thepercentofhouseholdsrentburdened(35).Lastly,weincludeexploratoryresultsonairqualityandschoolquality.AllmeasuresattheCensusTractScale.

16
Table1:SummaryStatisticsofOutcomeMeasuresforUnits Minimum Median Mean MaximumJobsHousingBalance(2.5MileBuffer) 0.002 0.760 1.136 9.964JobsHousingBalance(5MileBuffer) 0.088 0.877 1.061 14.540JobsWithin45MinuteAutoCommute 0.000 134369.364 186646.840 916589.448LowWageJobstoAffordableHousingFit 0.000 3.570 5.310 31.230JobsWithin45MinuteTransitCommute 0.000 657.261 5235.145 115939.862NumberofMedicalfacilitiesPer1000people(5MileBuffer) 0.000 1.280 1.490 7.680
PM2.5Concentration 4.140 9.780 9.819 12.500PercentofTractResidentsWithin.5MileofGroceryStore 0.000 35.090 44.253 100.000
PercentofHouseholdsBelow200%ofPovertyLevel 0.000 22.420 26.556 96.660
ChangeinNearestElementarySchoolAcademicPerformanceIndexScore(2000-2014)
-0.045 0.143 0.185 0.880
AcademicPerformanceIndexScore,NearestElementarySchool(2002-14
427.000 847.000 843.847 998.000
PercentofHouseholdsRentBurdened(2010-14AmericanCommunitySurvey) 15.380 48.910 49.481 85.190
Results
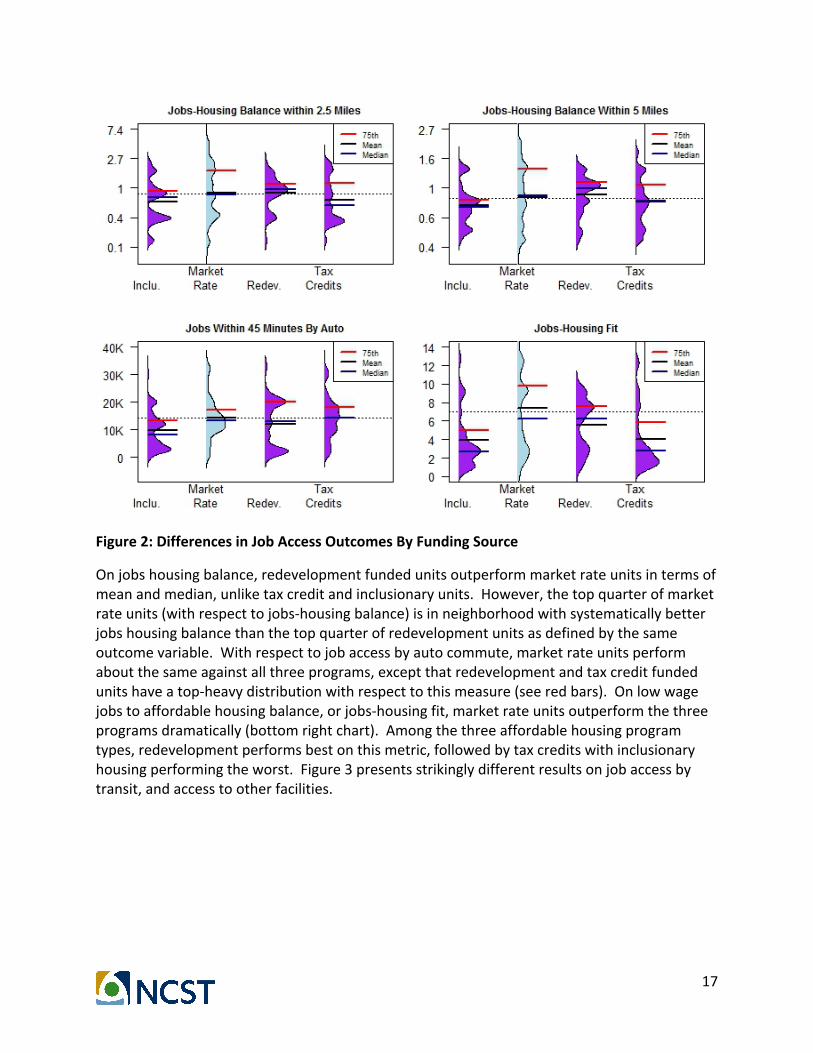
ResultsacrossallthreeregionswithrespecttojobaccessarepresentedinFigure2.Allfiguresinthissectionplotthedistributionofunitswithrespecttothelocationaloutcomelabeledaboveeachsetofdistributions.Redlinesdenotethe75thpercentileforeachdistribution.Thehighertheredbaris,thegreaterthenumberofunitsfundedbythatprogramattheupperendoftheoutcomevariable’sdistribution.Themeanforeachdistributionisinblackandmedianinblue.Thedistributionsrepresentthedistributionofunitsfundedbyeachprogram(ornot,asinthecaseofmarketrateunits).Thisisdistinctfromthedistributionofprojects,whichcancontainbetweenoneandfourhundredplusunits.
17
Figure2:DifferencesinJobAccessOutcomesByFundingSource
Onjobshousingbalance,redevelopmentfundedunitsoutperformmarketrateunitsintermsofmeanandmedian,unliketaxcreditandinclusionaryunits.However,thetopquarterofmarketrateunits(withrespecttojobs-housingbalance)isinneighborhoodwithsystematicallybetterjobshousingbalancethanthetopquarterofredevelopmentunitsasdefinedbythesameoutcomevariable.Withrespecttojobaccessbyautocommute,marketrateunitsperformaboutthesameagainstallthreeprograms,exceptthatredevelopmentandtaxcreditfundedunitshaveatop-heavydistributionwithrespecttothismeasure(seeredbars).Onlowwagejobstoaffordablehousingbalance,orjobs-housingfit,marketrateunitsoutperformthethreeprogramsdramatically(bottomrightchart).Amongthethreeaffordablehousingprogramtypes,redevelopmentperformsbestonthismetric,followedbytaxcreditswithinclusionaryhousingperformingtheworst.Figure3presentsstrikinglydifferentresultsonjobaccessbytransit,andaccesstootherfacilities.
18
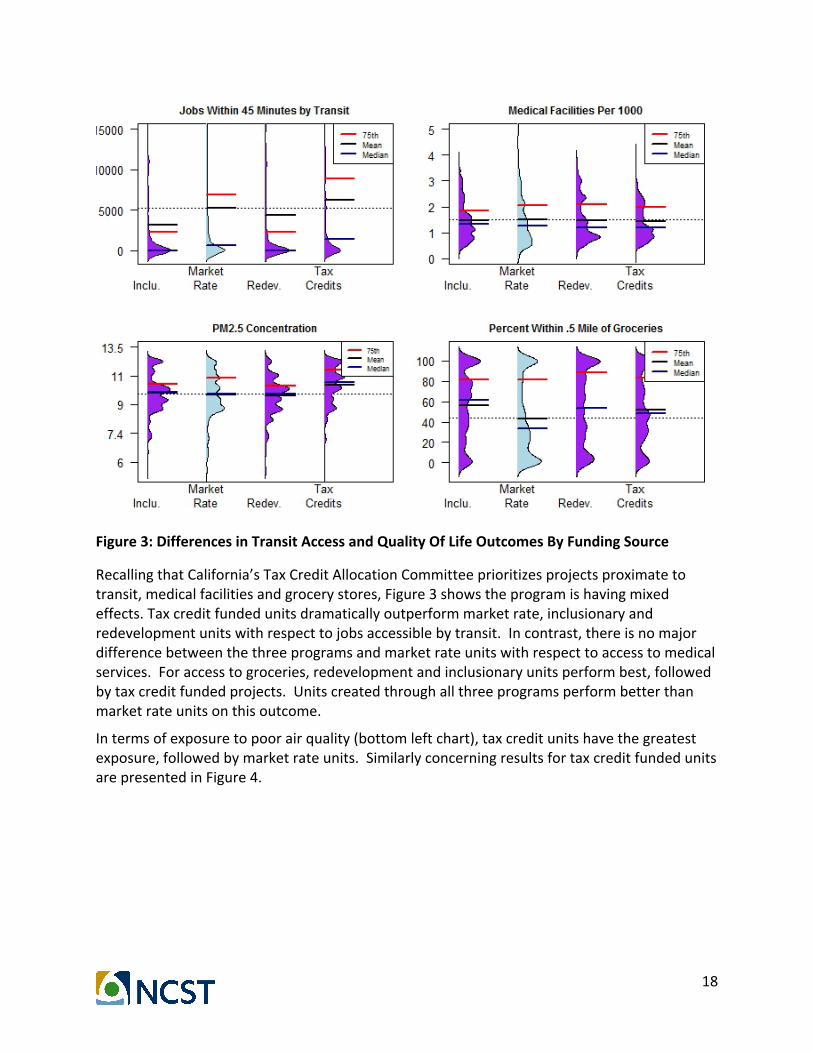
Figure3:DifferencesinTransitAccessandQualityOfLifeOutcomesByFundingSource
RecallingthatCalifornia’sTaxCreditAllocationCommitteeprioritizesprojectsproximatetotransit,medicalfacilitiesandgrocerystores,Figure3showstheprogramishavingmixedeffects.Taxcreditfundedunitsdramaticallyoutperformmarketrate,inclusionaryandredevelopmentunitswithrespecttojobsaccessiblebytransit.Incontrast,thereisnomajordifferencebetweenthethreeprogramsandmarketrateunitswithrespecttoaccesstomedicalservices.Foraccesstogroceries,redevelopmentandinclusionaryunitsperformbest,followedbytaxcreditfundedprojects.Unitscreatedthroughallthreeprogramsperformbetterthanmarketrateunitsonthisoutcome.
Intermsofexposuretopoorairquality(bottomleftchart),taxcreditunitshavethegreatestexposure,followedbymarketrateunits.SimilarlyconcerningresultsfortaxcreditfundedunitsarepresentedinFigure4.

19
Figure4:DifferencesinEducation,RentandPovertyOutcomesByFundingSource
Withrespecttopovertyrates,marketrateunitsdramaticallyoutperformunitsfundedbyallthreekindsofprograms.Taxcreditfundedunitsaredisproportionatelylocatedinneighborhoodswithhigherpovertyratesrelativetoinclusionaryandredevelopmentunits(topleftchart).Theeducationalresultsaremoremixed.WhiletheaverageAcademicPerformanceIndex(API)scoreofthenearestelementaryschoolwashighestformarketrateunits(toprightchart),theaveragechangeintheAPIfrom2000-2014waslowestformarketrateunits(bottomleftchart).ThismeansthatwhilemarketrateunitsweremorelikelytobelocatedinareaswithhigherelementaryschoolAPIscores,theaffordableunitsfundedbyallthreeprogramsarelocatinginareaswheretheschoolshaveatleastbeenimprovingoverthelastfifteenyears.Lastly,theaffordableunitsaresystematicallylocatedinareaswithhigherrentburdensthanmarketrateunits(bottomright).Thisisagoodthing,asitmeansaffordableunitsarelocatinginareaswheretheneedforaffordablehousingishigher.
Multi-RegionResults:SeniorVersusNon-SeniorHousing
Becauseseniorhousingsitesaresometimessubjecttodifferentlocationalcriteria,wepresentthespatialoutcomesofseniorprojectsrelativetobothmarketrateandotheraffordablenewconstructioninthissection.
20
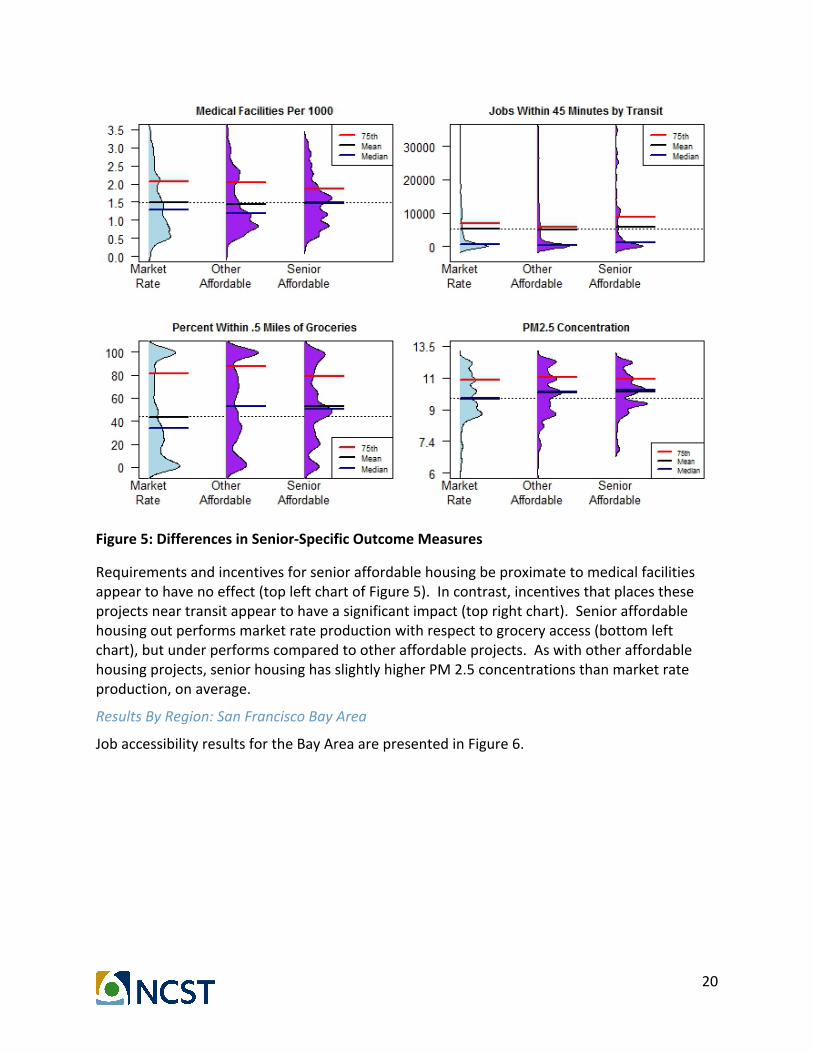
Figure5:DifferencesinSenior-SpecificOutcomeMeasures
Requirementsandincentivesforsenioraffordablehousingbeproximatetomedicalfacilitiesappeartohavenoeffect(topleftchartofFigure5).Incontrast,incentivesthatplacestheseprojectsneartransitappeartohaveasignificantimpact(toprightchart).Senioraffordablehousingoutperformsmarketrateproductionwithrespecttogroceryaccess(bottomleftchart),butunderperformscomparedtootheraffordableprojects.Aswithotheraffordablehousingprojects,seniorhousinghasslightlyhigherPM2.5concentrationsthanmarketrateproduction,onaverage.
ResultsByRegion:SanFranciscoBayArea
JobaccessibilityresultsfortheBayAreaarepresentedinFigure6.
21
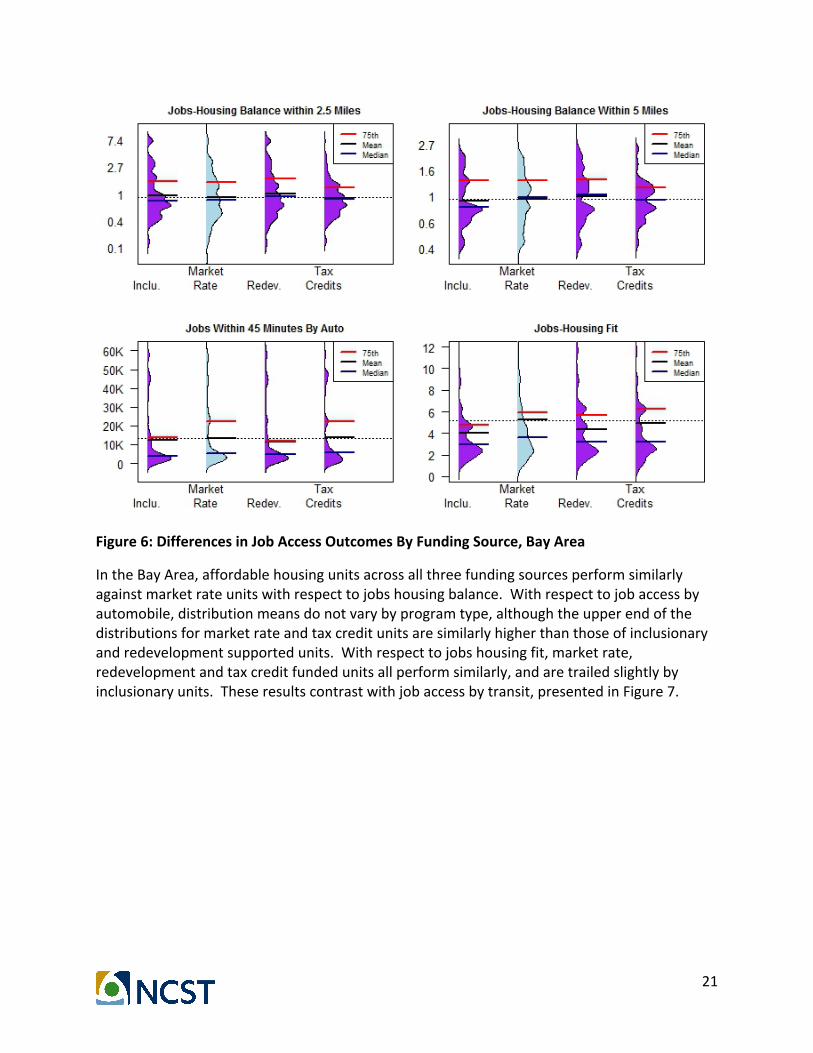
Figure6:DifferencesinJobAccessOutcomesByFundingSource,BayArea
IntheBayArea,affordablehousingunitsacrossallthreefundingsourcesperformsimilarlyagainstmarketrateunitswithrespecttojobshousingbalance.Withrespecttojobaccessbyautomobile,distributionmeansdonotvarybyprogramtype,althoughtheupperendofthedistributionsformarketrateandtaxcreditunitsaresimilarlyhigherthanthoseofinclusionaryandredevelopmentsupportedunits.Withrespecttojobshousingfit,marketrate,redevelopmentandtaxcreditfundedunitsallperformsimilarly,andaretrailedslightlybyinclusionaryunits.Theseresultscontrastwithjobaccessbytransit,presentedinFigure7.
22
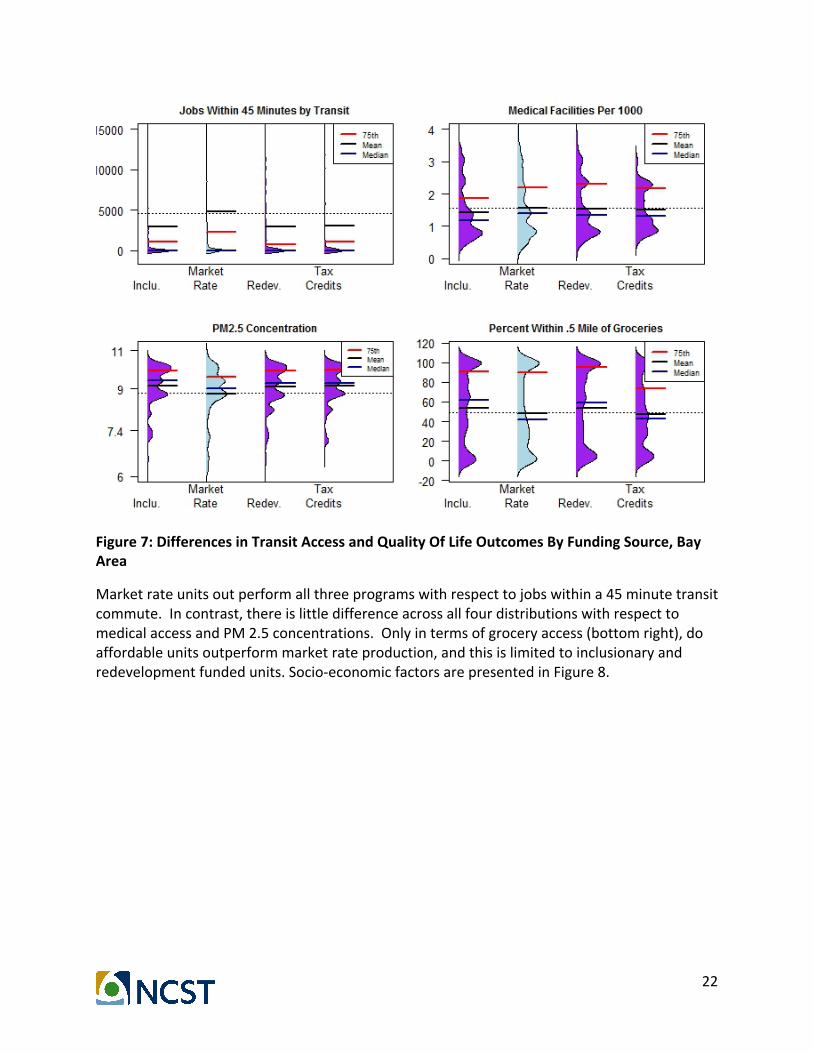
Figure7:DifferencesinTransitAccessandQualityOfLifeOutcomesByFundingSource,BayArea
Marketrateunitsoutperformallthreeprogramswithrespecttojobswithina45minutetransitcommute.Incontrast,thereislittledifferenceacrossallfourdistributionswithrespecttomedicalaccessandPM2.5concentrations.Onlyintermsofgroceryaccess(bottomright),doaffordableunitsoutperformmarketrateproduction,andthisislimitedtoinclusionaryandredevelopmentfundedunits.Socio-economicfactorsarepresentedinFigure8.

23
Figure8:DifferencesinEducation,RentandPovertyOutcomesByFundingSource,BayArea
Aswiththeoverallpatterns,intheBayAreamarketrateunitsareinlowerpovertycommunitiescomparedtoaffordableunits(topleftchart).Similarly,marketrateunitsareinareaswheretheelementaryschoolshavehigherAPIscores(toprightchart).Unliketheoverallpatterns,intheBayAreaonlyredevelopmentandtaxcreditfundedunitsoutperformmarketrateunitswithrespecttobeingnearschoolsthathavebeenimprovingoverthepast15years(bottomleftchart).
ResultsByRegion:SanDiego
JobaccessresultsforSanDiegoarepresentedinFigure9.

24
Figure9:DifferencesinJobAccessOutcomesByFundingSource,BayArea,SanDiego
InSanDiego,marketrateunitsdramaticallyoutperformaffordableunitswithrespecttojobshousingbalanceandjobs-housingfit.Inclusionaryandtaxcreditunitsinparticularlyperformmuchworseonjobs-housingfitthanmarketrateunits(bottomright).Yetwhenitcomestojobsaccessiblebyautomobilecommute,differencesaremuchsmaller:thereisalargetailamongredevelopmentsupportedunitsattheupperandlowerendsofthedistribution,andinclusionaryunitsperformslightlyworsethatmarketrateunits.ThejobaccessbytransitresultsinFigure10,however,paintamuchdifferentpicture.

25
Figure10:DifferencesinTransitAccessandQualityOfLifeOutcomesByFundingSource,SanDiego
TaxcreditunitssignificantlyoutperformmarketrateunitswithrespecttojobsaccessiblebytransitinSanDiego(topleftchart).WithrespecttomedicalfacilityaccessandPM2.5concentration,therearenomajordiscernabledifferences.Affordableunitsacrossallthreeprogramsoutperformmarketrateunitswithrespecttogroceryaccess.Despitepolicyeffortsincentivizingtaxcreditprojectsneargrocerystories,unitsfundedbythisprogramarenotinsystematicallybetterlocationswithrespecttogroceryaccessthanredevelopmentandinclusionaryunits.EducationalandpovertyoutcomesarepresentedforSanDiegoinFigure11.

26
Figure11:DifferencesinEducation,RentandPovertyOutcomesByFundingSource,SanDiego
AswiththeBayArea,marketrateunitsinSanDiegoareinneighborhoodswithsystematicallylowerpovertyratescomparedtoaffordableunits.Amongaffordableunits,thedistributionofpovertyratesisgenerallysimilarexceptthattaxcreditunitsareinareaswithsystematicallyhigherpovertyratescomparedtotheothertwogroupsofaffordableunits.SchoolqualitypatternsmatchthoseintheBayArea:affordableunitsarelocatedinareaswhereelementaryschoolAPIscoresarelowerthanformarketrateunits,buttheseareschoolswhichhaveshownmoredramaticimprovementsoverthelast15years.AffordableunitsarealsomorelikelytoendupinmoreseverelyrentburdenedneighborhoodsinSanDiego,butthegapwithrespecttomarketrateunitsissmallerforthisregionthanfortheBayArea.
ResultsByRegion:Sacramento
SacramentojobaccessibilityresultsarepresentedinFigure12.
27
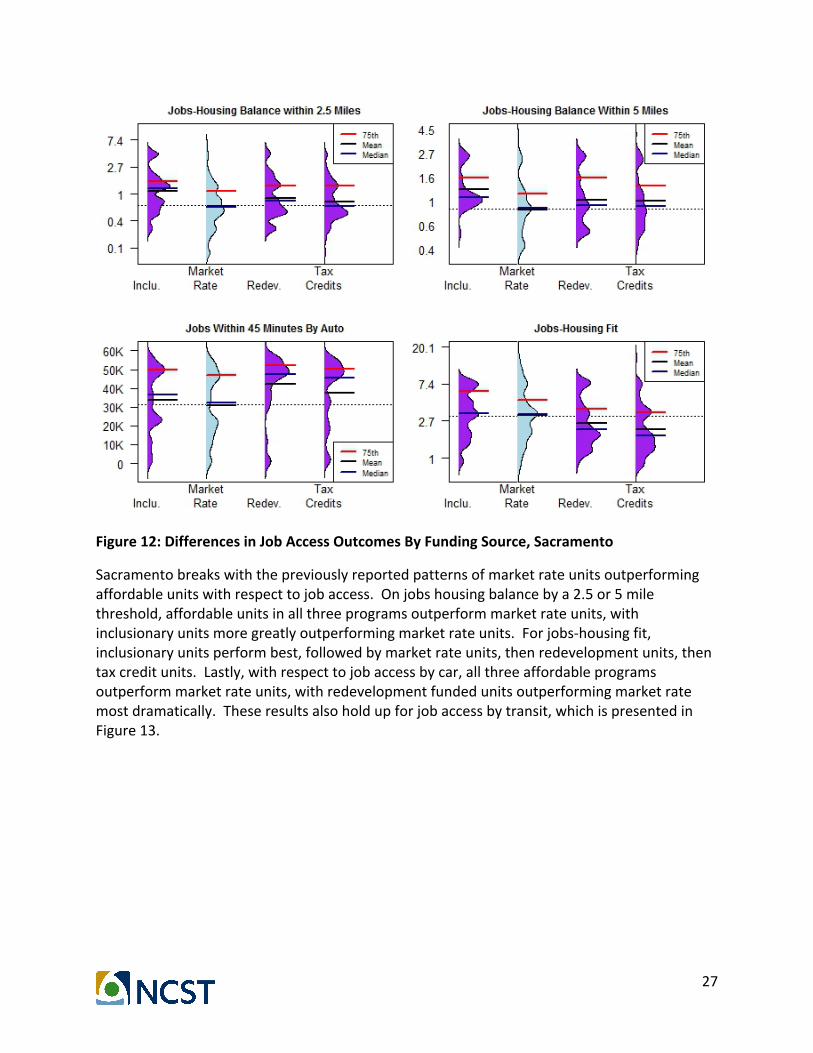
Figure12:DifferencesinJobAccessOutcomesByFundingSource,Sacramento
Sacramentobreakswiththepreviouslyreportedpatternsofmarketrateunitsoutperformingaffordableunitswithrespecttojobaccess.Onjobshousingbalancebya2.5or5milethreshold,affordableunitsinallthreeprogramsoutperformmarketrateunits,withinclusionaryunitsmoregreatlyoutperformingmarketrateunits.Forjobs-housingfit,inclusionaryunitsperformbest,followedbymarketrateunits,thenredevelopmentunits,thentaxcreditunits.Lastly,withrespecttojobaccessbycar,allthreeaffordableprogramsoutperformmarketrateunits,withredevelopmentfundedunitsoutperformingmarketratemostdramatically.Theseresultsalsoholdupforjobaccessbytransit,whichispresentedinFigure13.
28
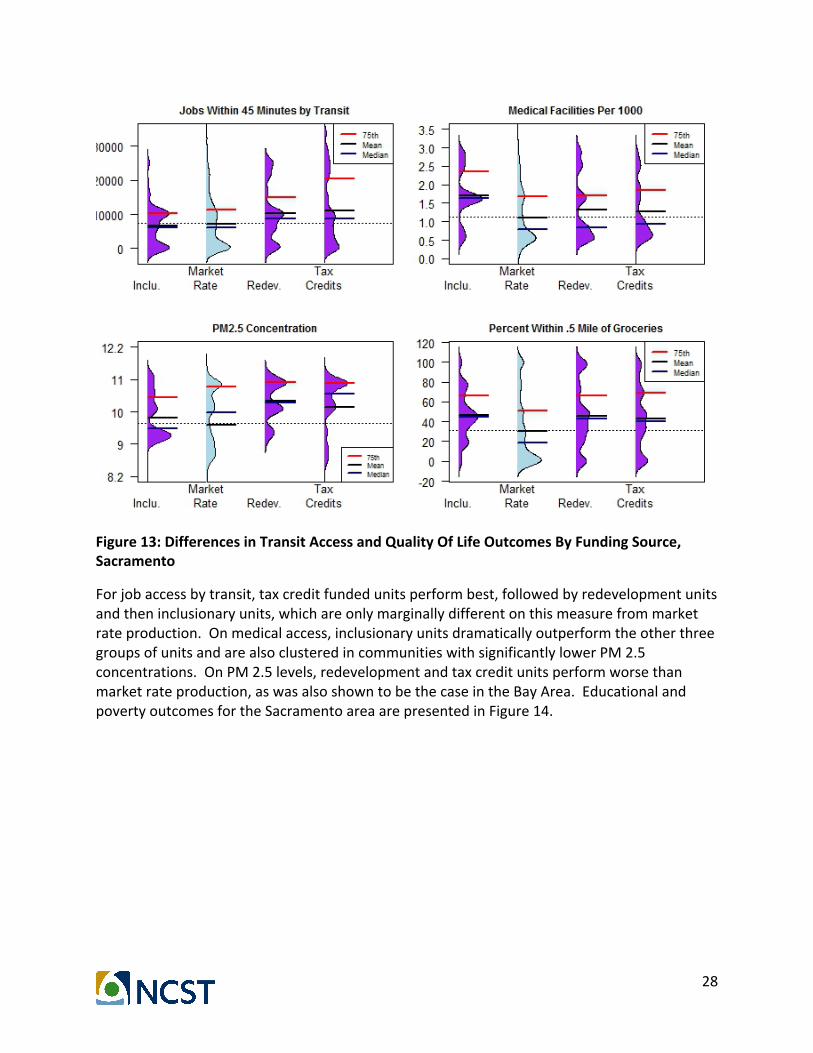
Figure13:DifferencesinTransitAccessandQualityOfLifeOutcomesByFundingSource,Sacramento
Forjobaccessbytransit,taxcreditfundedunitsperformbest,followedbyredevelopmentunitsandtheninclusionaryunits,whichareonlymarginallydifferentonthismeasurefrommarketrateproduction.Onmedicalaccess,inclusionaryunitsdramaticallyoutperformtheotherthreegroupsofunitsandarealsoclusteredincommunitieswithsignificantlylowerPM2.5concentrations.OnPM2.5levels,redevelopmentandtaxcreditunitsperformworsethanmarketrateproduction,aswasalsoshowntobethecaseintheBayArea.EducationalandpovertyoutcomesfortheSacramentoareaarepresentedinFigure14.

29
Figure14:DifferencesinEducation,RentandPovertyOutcomesByFundingSource,Sacramento
Aswithpriorregions,MarketRateunitsperformbetterwithrespecttopovertyratesandelementaryschoolAPIscoresversusaffordableproduction.Thereisoneexception:inclusionaryunitsintheSacramentoareaoutperformmarketrateandotheraffordableunitswithrespecttoelementaryschoolAPIscores.Unlikewiththepreviousregions,however,marketrateunitsalsooutperformaffordableunitswithrespecttobeinglocatednearschoolswhichhavebeenimprovingoverthelastdecade.Lastly,onlyredevelopmentandtaxcreditsupportedunitsendedupinareaswithhigherrentburdensrelativetomarketrateproduction.
Conclusions
TheeffortsofCalifornia’sTaxCreditAllocationCommittee(TCAC)toimprovetransitaccessandgroceryaccessfortaxcreditfundedsitesisworking.Amongseniorprojectsinparticulartheseresultsarethemostpronounced.However,theseresultsappeartocomeatthecostoftheseprojectslocatinginareaswithhigherpovertyrates(relativetomarketrateproduction).
Thatsaid,wefindthatbasedonMcClure’sapproachtodefiningneedasneighborhoodrentburdens(35),allthreetypesofprogramsareplacingunitsintractswithgreaterneedcomparedtomarketrateunits.ThesystematicconcentrationofaffordableunitsintractswithhigherPM2.5concentrationrelativetonewmarketrateproduction,however,isconcerningandshouldbeexploredfurther.

30
Lastly,inclusionaryunitsdonotappeartomimicthespatialdistributionofmarketrateproduction.Thismaybeduetothe‘in-lieufee’optionofmanyinclusionaryprogramsthatenabledeveloperstopayfeesin-lieuofdevelopinghousingonsite.Futureresearchshoulddissectifin-lieufeesupportedunitsareinsystematicallybetterorworselocations,asmeasuredbytheseandothermetrics,comparedtoon-siteinclusionary.Theresultscouldholdseriousimplicationsforhowcitiesshouldstructurethetrade-offtheypresentdeveloperswhenallowinganin-lieufeealternative.
TCACmightconsiderexploringalternativeapproachestoconcentratingdevelopmentinhighopportunities,likeIllinois’approachofblendingallthemetricsintoageneralindexof“highopportunity”and“lowopportunity”areasinsteadofofferingseparatesetsofpointsforspecificamenities.Howthesedifferentapproachesimpactlocationaloutcomesandassociatedcostsshouldbeexploredfurtherintheliterature.
31
Chapter3:TheImpactofScaleChangesofFairMarketRentsonTransitandJobsAccessofSection8EligibleUnitsinThreeofCalifornia’sLargestMPOsTheDepartmentofHousingandUrbanDevelopment(HUD)iscurrentlyexperimentingwithnewwaysofdefiningsubsidycapsforSection8housingvouchers.Thischange,calledthe“SmallAreaFairMarketRent”(SAFMR),shrinksthegeographicscaleatwhichvouchermaximumsarecalculatedfromtheregionlevel,knownastheHUDMarketAreatotheZIPcodelevel;thischangehasmajorimplicationsforthespatialdispersionofvoucherholdersincities.TheresultsofapilotprograminTexassuggeststhatthispolicyscalechangeisexhibitingsignificantimpactonvoucherholders’residentiallocationdecisions(47).ThepotentialforthepolicychangetoimpactvoucherholderaccessintoCalifornia’stransitandjobsrichneighborhoodscouldalsobesignificant,butasofyet,hasnotbeenstudied.Inthisstudy,wemodelhowrescalingvouchermaximumsfromtheregionalleveltotheZIPcodelevelaltersthevoucheraccessibilityofaffordablerentalunits.Wemodelthischangeusingadatabaseoffor-rentlistingsspanningthreeofCalifornia’smetropolitanplanningorganizations(MPOs):theSanFranciscoBayArea(MTC-ABAG),Sacramento(SACOG)andSanDiego(SANDAG).WespatiallycontrastourrentallistingswithdataonneighborhoodtransitrichnessandjobsaccessinordertoexaminehowtheFMRpolicyshiftmaycomplimentorcomplicateregionaleffortstoincreasehousingaffordabilityinthese“lowVMT”communities.Wecalculatevouchermaximumsatthreealternativescales,thecounty,thepublicusemicrosamplearea(PUMA)andtheZIPcode.Wecontrasthowthesesmaller-scaledFMRsaltervoucherholders’accesstoneighborhoodscomparedtothecurrentFMRsscaledovermulti-county“MarketAreas”thatgenerallyencompasslargenumbers(e.g.,millionsinsomelocations)ofresidents.
OurresultsshowthatunderexistingHUD(FMR)policy,voucherrecipientsaresystematicallypricedoutofrentallistingsinjobsandtransitrichcommunitiesandmoreover,thatvoucheraccessibleunitsareconcentratedinhighpovertyneighborhoods.Wefindthatshrinkingthegeographicscaleatwhichvouchermaximumsarecalculatedsignificantlyimprovesthevoucheraccessibilityofrentalunitsinjobsrichcommunities,butanyimprovementsinvoucheraccesstotransitrichrentalunitsislimitedtotheCityofSanFrancisco.Wefindthatthisincreasedaccessalsobringswithittheaddedbenefitofsignificantlyincreasingvoucheraccesstorentalunitsinlowpovertyneighborhoods,acriticalHUDmetric.Withinthescholarlyliterature,ourapproachisuniqueinthatwearemodeling,byneighborhood,thepercentageofactualrentallistingsthatvoucherholderscouldconsidergivenHUDvouchermaximums(theFMRs).
ThenextsectionprovidesbackgroundonhousingvoucherprogramsandthedemandforaffordabilityinCalifornia.Weprovideareviewofrelevantliteratureaswell.WethendescribeourdatasetandourapproachtomodelingalternativeFMRs,withapresentationofourresultsfollowing.Sincethedistributionofactualvoucheraccessiblemarketrentallistingsunderexistingpolicieshasneverbeenexplored,webeginourdiscussionoftheresultsbyexaminingvoucheraccesstojobsrich,transitrichandlowpovertycommunitiesunderexistingpolicies.Wethenshowhowre-scalingFMRsaltersthislandscape.Thelargebodyofresultsaresummarizedintheconclusionsectionwithrecommendationsforhousingpolicymakersfederally,statewideacrossthesethreespecificMPOs.

32
HousingVouchersIntheCaliforniaContext
Section8vouchersareafederal,demand-siderentalsubsidyprogramintroducedinthe1970saspartofashiftinfederalhousingpolicyawayfromsubstandardhousingclearanceandtowardsthegoalofreducinghouseholdrentburdens(113).HousingvouchersenableresidentstomovetoanyunitonthemarketwithrentsbelowtheHUDdeterminedFairMarketRent(FMR)maximum.TheseFMRsarebasedonthe40thpercentilerentforatwobedroomunitinthevoucherrecipients’HUDMarketAreas.1Tenantspayone-thirdoftheirincometowardsrent,withtherestpaiddirectlytothelandlordbythevoucheradministeringagency.LocalPublicHousingAuthorities(PHAs)serveasadministeringagenciesforvouchersacrossCaliforniaandtheUnitedStates.Landlordsagreeingtoacceptvouchersarerequiredtomeetanumberofobligations,includingregularinspectionsofunits,whichfrequentlydeterlandlordsfromacceptingvoucherholders(114).
Withthedemolitionofpublichousing,HUDexpandedvoucherusetoprovidedisplacedresidentswith“HousingChoiceVouchers.”Scholarsarguedthatprovidingresidentstheopportunitytomoveoutofhighpovertyneighborhoodscouldbreakacycleofpovertyre-enforcedbythespatialmismatchbetweenthelocationoflowincomehouseholdsandtheavailabilityoflowwageemploymentwithinurbanareas(29).HUDenabledresearcherstoexplicitlytestthishypothesisbydesigningapolicyexperimentinwhichsomeresidentsofdilapidatedpublichousingprojectsreceivedhousingvoucherstheycouldonlyspendinlow-povertyneighborhoods:theMovingtoOpportunity(MTO)program,theresultsofwhicharediscussedinthenextsection.
Together,thenation’shousingvoucherprogramscurrentlyserveoverfivemillionpeopleintwomillionhouseholds(115).WithinCalifornia,theprogramfacesmajordemandpressure,withwaitlistsforvouchersintheSanFranciscoBayAreaexceedingcapacitybytensofthousandsandrequiringlocaladministeringagenciestoclosewaitlists(116).Eveninareasofthestateconsideredmoreaffordable,e.g.,Fresno,waitlistsarethreetofourtimesgreaterthantheprogram’scapacity(117).Theeffectofapolicyshiftlikethere-scalingofvouchermaximumpayoutscouldsignificantlyimpacttheabilityofthisprogramtomeetthesedemandpressuresbyalteringthecostofvouchers.Thisstudyrepresentsthefirsttoexplorehowalteringthepolicystructureofthevoucherprogramcouldaffectvoucherholdersaccesstolow-VMTneighborhoods.
Section8andLowVMTNeighborhoods
MostofthevoucherliteraturecentersontheresultsoftheMTOexperimentonparticipants’healthandemploymentoutcomes,thelatterofwhichshouldtheoreticallycorrelatewithjobaccess.RecipientsoftheMTOexperimentalvouchersinitiallyreceivedonlyminorbenefitsfromparticipation(118–120).However,followupstudiesofparticipants10to15yearsafter
1HUDMarketAreasdonotalwaysoverlapwithotherregionaldelineations.Forexample,theSanFranciscoMetropolitanStatisticalAreaissplitintotwoHUDMarketAreas:onewhichincludesSanFrancisco,MarinandSanMateocountiesversusanotherwhichincludesAlamedaandContraCostacounties.2WhiletheACSdoesnotpublishsamplesizesforsmallscales,usingstate-levelsamplesizes(153)wecandeducethatthe2014-2010ACScontainsroughly390responsesperZIPcodeinCaliforniatorepresentthetotalhousingstock.AsroughlyhalfofCalifornianhouseholdsrent,theACSthusprobablyaverages195rentalunitssurveyedperZIPCode.Asroughly12%ofrenters’moveannually(154),thenwecanestimatetheACScontainsaround24
33
treatmentfoundsignificantimprovementsinsubjects’physicalandmentalhealth(118).Childrenwhosefamiliestookvouchersintolower-povertyneighborhoodsexperiencedhighercollegeattendancerates,higherearnings,andwerelesslikelytoendupassingleparents(121).Overall,however,theliteraturesuggeststhebenefitsofMTOweremuchweakerthanthe‘neighborhoodeffects’hypothesismaysuggest(122).ButifwelookattheGautreauxprogram,acourtorderedinitiativewhichprovidedvoucherstoformerpublichousingresidentsrelocatedintoChicago’shighopportunitysuburbs,dramatic,ratherthanmarginally,improvedoutcomesforrecipientswereobserved(123,124).HowdowereconcilethestrikingdifferencesbetweentheGautreauxandMTOoutcomes?SomehavearguedtherealfailureofMTOmaybetheweaknessofthetreatmentitself,whichfailedtoenablebeneficiariestobreakoutofthespatialstructureofsegregatedcities(125).
BecauseimprovingaccessibilityandmobilitywerenottheprimarymotivatorsfortheMTOexperiment,themajorMTOstudiesgenerallyoperationalizejobaccessibilityassimplytractlevelunemploymentrates,i.e.,withoutconsiderationofgeographicalproximitytoemploymentcenters.Theroleoftransportationoptionsisusuallymentionedonlyinpassing(120).Infact,manystudieslookingattheeffectsofchangesinemploymentoutcomesdonotmeasurejobaccessibilityofrecipients’newneighborhoodsatall,focusingonlyontractlevelpovertyrates(e.g.Kling,Liebman,&Katz,2007;Ludwig,Duncan,&Pinkston,2005)ormoresimplistically:walkingdistancetosomeformofpublictransit(e.g.Sanbonmatsuetal.,2003).
Therehavebeenafewstudiesoftheresidentialrelocationchoicesofvoucherrecipientswithrespecttotransitandjobaccessibility,withbothmeasuresmorerigorouslydefinedasinthetransportationandplanningliteratures.Thereismoderatelystrongevidencethathavinganautomobileimprovesemploymentoutcomes((Bania,Coulton,&Leete,2003;Blumenberg&Pierce,2014),andthatincreasedtransitaccessibilitydoesnotseemtoalterpre/postmoveemploymentstatus(128).Thatis,improvementsintransitservicedidnothelppreviouslyunemployedresidentsfindemployment.Whiletheseresultsarestriking,theBlumenberg,PierceanalysisdidnotcontextualizetheirresultswithinSampson’s(2008)critiqueofthetreatmentitself:howsignificantweretheimprovementsinjobandtransitaccessibilityexperiencedbyprogramparticipantswhoseneighborhoodrelocationoutcomeswereupwardlymobile?Couldvoucherholdersevenaffordtoaccessneighborhoodswithsignificantlyrichertransitconnectivityandjobaccessibility?
Incontrasttopreviousstudies,ourworkfillsanimportantresearchgapbyexaminingtheextenttowhichvoucherrecipientscanaffordtoliveintransitandjobsrichneighborhoodsgivenFMRconstraints.Specifically,weexplorehowaccesstohousinginhigherneighborhoodschangesundervariousFMRspatialcontextsusingactualrentalmarketdatainthreeofthenation’smostexpensiverentalmarkets:MTC,SACOG,andSANDAG.TherearefiveHUDMarketAreaswithinthesethreeMPOs:SanJose(SantaClaraCounty),theEastBay(AlamedaandContraCostacounties),SanFrancisco(SanFrancisco,MarinandSanMateocounties),Sacramento(Sacramento,PlacerandElDoradocounties)andSanDiego(SanDiegoCounty).Ourdataalsoallowsustomodelhowproposedchangestovoucherrentthresholdsmayaffecttheabilityofvoucherrecipientstoaccesslow-VMTcommunities.
34
ScaleandtheFMR
SinceHUDsFMRsarecalculatedwithmetropolitanstatisticalareamediansandpercentiles,theyareinsensitivetothemuchfinerscaleatwhichoururbanareasaresegregatedalonglinesofincomeandrace(129).NewpolicyinnovationsbyHUD,liketheSmallAreaFairMarketRents(SAFMRs),mayhavethepotentialtoconvertSection8vouchersintothekindofhighopportunityneighborhoodmobilitytreatmentthatpolicymakersintendedforMTOvouchers.ThefirstSAFMRprogramwasimplementedinDallas,Texasin2012,andwasinresponsetoacourtorderdeclaringtheexistingFMRformulasreinforcedresidentialsegregationandthuswereillegalunderfederalcivilrightslaws(130)..UndertheSAFMRpolicy,vouchermaximumsarecalculatedattheZIPcodescaleinlieuofestablishedregionallybasedformulas.Withinthreeyearsofimplementation,Dallasparticipantshadmovedintoneighborhoodswithsignificantlylowerpovertyandcrimerates(47),whileatthesametime,thecostoffinancingthevouchersactuallydeclined(131).TheDallasstudy,whileintriguing,isconstrainedinitsgeneralizabilitybytwoissues.First,thestudyresultswereachievedinoneofthenation’smostaffordablerentalmarkets:Dallas(132).Andsecond,consistentwiththepreviousliteratureonvouchers,theDallasstudies,todate,havenotexaminedvoucherrecipients’neighborhoodoutcomeswithrespecttojobaccessandtransportation.
MethodsandData
Weoffertwomajoradvancestotheliteratureonvouchers:first,weexaminethecapabilityofvoucherholderstoaccessjobaccessibleand“lowVMT”communities.Second,weexplorehowchangingtheFMRsubsidyboundariesaffectstheabilityofvoucherholderstoaccessfor-rentlistingsinlowerpovertyneighborhoods.Toaccomplishthesetwoobjectives,wetakeadvantageofadvanceddataacquisitiontoolsnowavailableandutilizeadatasetoffor-rentunitlistingsinourthreestudyareas.Thisuniquedatabaseallowsustodeterminetheextenttowhichvouchermaximumsthemselves,asopposedto,forexample,landlorddiscriminationagainstvoucherholders,preventvoucherrecipientsfromaccessingjobs-richcommunities.
DefiningLowVMTNeighborhoods
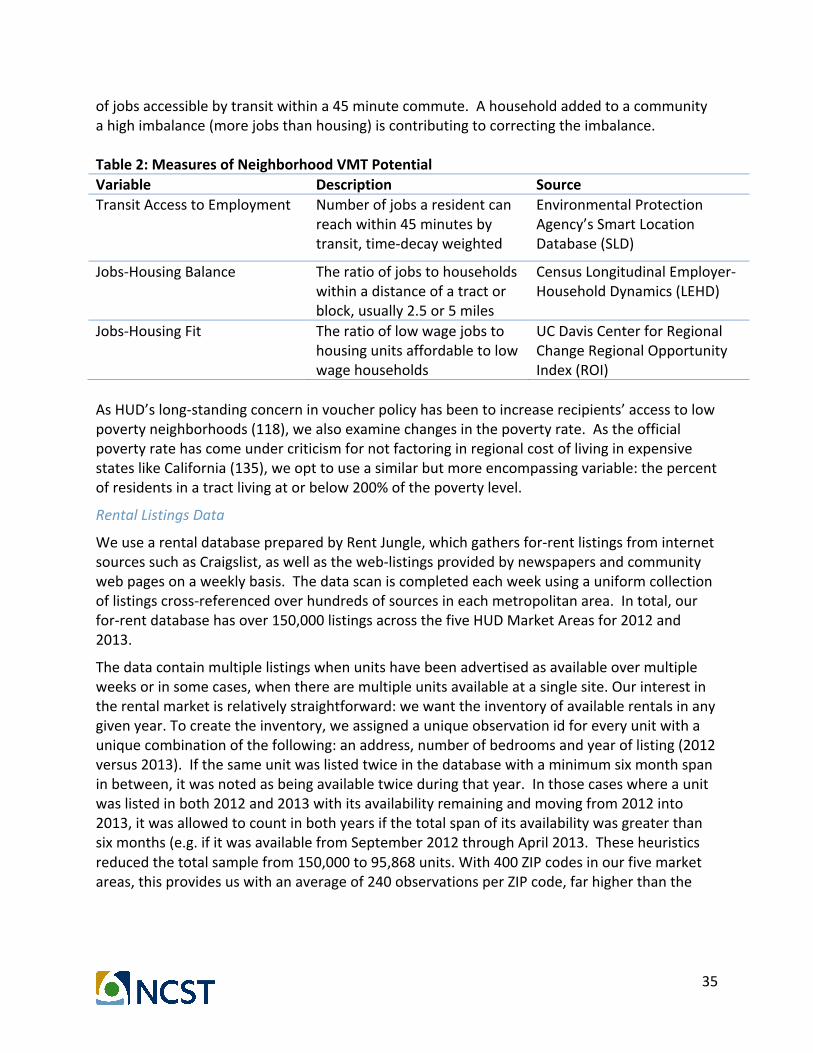
Thetransportationandplanningliteratureshasexploredawidearrayofoutcomemeasureswithrespecttojobaccessibilityandtransitaccessibility.WehavetakenfromthisliteratureandprioritizedoutcomemeasuresthatcouldbegatheredconsistentlyacrossallthreeMPOs(Table1).WeadoptedatransitaccessibilitymeasurefromtheEnvironmentalProtectionAgency’sSmartLocationDatabase.Transitaccessibilityiscorrelatedwithvoucherholders’abilitytomaintainemploymentaftermoving(128)aswellascorrelatedwithreducedVMT(4,80,133).Weselectedtwomeasuresforjobsaccessibility:jobs-housingbalanceandjobs-housingfit,ortheratiobetweenlowwagejobsandhousingunitsaffordabletolowwageworkers.Jobs-housingimbalancesacrossregionsareassociatedwithhigherVMTandexcesscommuting(3,16,26).Spatialdisparitiesinjobs-housingfitisassociatedwithcommutedistancesamonglowincomeworkers,andhasbeenshowntobeamoreeffectivemeasureofthejobaccessibilityoflowincomehouseholds(1,17,134).However,asweareinterestedinseeingthispolicyenablevoucherholderstoliveinthosejobs-richareas,wemustcounter-intuitivelydefine“lowVMT”communitiesasthosewithhighjobs-housingfit,highjobs-housingbalance,andahighnumber
35
ofjobsaccessiblebytransitwithina45minutecommute.Ahouseholdaddedtoacommunityahighimbalance(morejobsthanhousing)iscontributingtocorrectingtheimbalance.Table2:MeasuresofNeighborhoodVMTPotentialVariable Description SourceTransitAccesstoEmployment Numberofjobsaresidentcan
reachwithin45minutesbytransit,time-decayweighted
EnvironmentalProtectionAgency’sSmartLocationDatabase(SLD)
Jobs-HousingBalance Theratioofjobstohouseholdswithinadistanceofatractorblock,usually2.5or5miles
CensusLongitudinalEmployer-HouseholdDynamics(LEHD)
Jobs-HousingFit Theratiooflowwagejobstohousingunitsaffordabletolowwagehouseholds
UCDavisCenterforRegionalChangeRegionalOpportunityIndex(ROI)
AsHUD’slong-standingconcerninvoucherpolicyhasbeentoincreaserecipients’accesstolowpovertyneighborhoods(118),wealsoexaminechangesinthepovertyrate.AstheofficialpovertyratehascomeundercriticismfornotfactoringinregionalcostoflivinginexpensivestateslikeCalifornia(135),weopttouseasimilarbutmoreencompassingvariable:thepercentofresidentsinatractlivingatorbelow200%ofthepovertylevel.
RentalListingsData
WeusearentaldatabasepreparedbyRentJungle,whichgathersfor-rentlistingsfrominternetsourcessuchasCraigslist,aswellastheweb-listingsprovidedbynewspapersandcommunitywebpagesonaweeklybasis.Thedatascaniscompletedeachweekusingauniformcollectionoflistingscross-referencedoverhundredsofsourcesineachmetropolitanarea.Intotal,ourfor-rentdatabasehasover150,000listingsacrossthefiveHUDMarketAreasfor2012and2013.
Thedatacontainmultiplelistingswhenunitshavebeenadvertisedasavailableovermultipleweeksorinsomecases,whentherearemultipleunitsavailableatasinglesite.Ourinterestintherentalmarketisrelativelystraightforward:wewanttheinventoryofavailablerentalsinanygivenyear.Tocreatetheinventory,weassignedauniqueobservationidforeveryunitwithauniquecombinationofthefollowing:anaddress,numberofbedroomsandyearoflisting(2012versus2013).Ifthesameunitwaslistedtwiceinthedatabasewithaminimumsixmonthspaninbetween,itwasnotedasbeingavailabletwiceduringthatyear.Inthosecaseswhereaunitwaslistedinboth2012and2013withitsavailabilityremainingandmovingfrom2012into2013,itwasallowedtocountinbothyearsifthetotalspanofitsavailabilitywasgreaterthansixmonths(e.g.ifitwasavailablefromSeptember2012throughApril2013.Theseheuristicsreducedthetotalsamplefrom150,000to95,868units.With400ZIPcodesinourfivemarketareas,thisprovidesuswithanaverageof240observationsperZIPcode,farhigherthanthe
36
numberofnewrentersthatprovidedbytheAmericanCommunitySurvey2,andanaverageof44observationspercensustract.
ProducingAlternativeFMRs
WerecalculatefairmarketrentsatscalessmallerorequaltotheHUDMarketArea:thecounty,thePublicUseMicroSampleArea(PUMA)levelandtheZipCodeTabulationArea(henceforthreferredtoasZIPcode).WeincludedthePUMAscalebecauseitisthesmallestgeographyatwhichCensusmicrodataisavailableforproducinghypotheticalalternativeFMRs.
WhencalculatingalternativeorhypotheticalFMRs,weattemptedtoaligntheprocessateachscalewiththeprocessconstraintsHUDfaceswhendefiningFMRsattheMarketAreascale.ThisensuresthatwhenwecomparehowdifferentlyscaledFMRsaltervoucheraccesstoourrentallistingsdataset,wearemeasuringtheroleofscaleinpre-determiningvoucheraccessandnotsomeotheraspectoftheFMRformulaprocess.Forexample,HUDmustworkwithACSdataproducedonatimelag—the2012FMRswereestimatedusingthe2005-2009ACS,andthe2013FMRswereestimatedusingthe2006-2010ACS.HUDoffersinsightontheSmallAreaFMRDemonstrationDocumentationwebpageforhowsub-FMRthresholdsmightbedeterminedusingcalculationsforhypotheticalZIPcodeFMRs(136).First,HUDcalculatesMarketAreaFMRsunderestablishedformulas.Then,HUDproducesarentalratioor‘weight’foreachZIPcodewhichismultipliedbytheMarketAreaFMRtogeteachZIPcode’sFMR.TheratioisderivedbydividingZIPcodemedianrentsfromtheACSoverCore-BasedStatisticalAreamedianrents,asillustratedbelow:
ZIP2− Bedroom Median RentCBSA 2− Bedroom Median Rent ∗ HUD Market Area FMRs = ZIP FMRs
ZIPcodeswithmedianrentshigherthantheirCBSAthushaveFMRsadjustedproportionallyupwards.HUDcapstheseadjustmentfactorsat1.5,sothataZIPcode’sFMRsarenevermorethan150%oftheestablishedMarketAreaFMRs.HUDdoesnot,however,setathresholdforzipcodesbelowthemedian.Thisapproachside-stepstheproblemthatatveryfinegeographicscales,thenumberof“recentmovers”intheACSmaybetoosmalltoprovideareliableestimateofnewrents,asthemedianrentstatisticdrawsontheentiresampleofrenters.TheCBSAsarenotnecessarilythesameastheHUDMarketAreas.Forexample,TheSanJose,SanFranciscoandEastBayHUDMarketAreasareallpartofoneCBSA.ItisworthnotingthatHUDstaffbelievethatZIPcodeestimateswouldbetterrepresentsmall-scaledifferencesiftheywerenormalizedoverthebroadestpossiblearea,inthiscase,theCBSA(CorrespondencewithHUDStaffDec.32015).
2WhiletheACSdoesnotpublishsamplesizesforsmallscales,usingstate-levelsamplesizes(153)wecandeducethatthe2014-2010ACScontainsroughly390responsesperZIPcodeinCaliforniatorepresentthetotalhousingstock.AsroughlyhalfofCalifornianhouseholdsrent,theACSthusprobablyaverages195rentalunitssurveyedperZIPCode.Asroughly12%ofrenters’moveannually(154),thenwecanestimatetheACScontainsaround24new-moversperZIPcodeinCalifornia,comparedtooursampleofnearly240listingsperZIPcode.
37
Utilizingthisstrategy,weapplythisratioorweight-basedapproachusedbyHUDtotransformestablishedMarketAreaFMRsintoFMRsscaledattheCounty,PUMA,includingtheHousingIncomevariable,andZIPcodebasedFMRs.ForeachsetofalternateFMRs,thesourcetablesutilizedtocalculatetheratiosislistedinTable3.AlloftheseweredividedovertheirrespectiveCBSAmedianweightstoproducetheweights.
Table3:DataUsedtoCalculateAlternativeFMRsAlternateScale SourceDataforScaleCounty CountyMedianRentsPUMA PublicUseMicrodataSample(PUMS)file,mediancalculatedfromHINCPvariableZIPCode ZipCodeTabulationAreaMedianRentInlinewithHUD’sproposedSAFMRs,wecappedtheratiosusedtogeneratealternateFMRssothattheycouldbenohigherthan1.5timestheMarketAreaFMR.InthecaseofthePUMAFMRs,welimitedthemicrodatasampleusedtoproducethemedianrentstatistictoreflectthetypesofhouseholdsHUDincludesinMarketAreaFMRcalculation:renter-occupied,non-institutionalquarterswithakitchenandfullplumbing.
Results
SanFranciscoandOaklandHUDMarketAreas
AsmappedinFigure15below,shiftingtoZIPcodeFMRsdramaticallyreducesvoucheraccessinpocketsofformerlyhighvoucher-access,butincreasesvoucheraccesslessdramaticallyacrosslargergeographicspans.Thisamountstoa‘levelingout’ofvoucheraccessibilityacrossspace.IntheSanFranciscoHUDMarketArea,thismeansvoucheraccessibilitydeclinesinpreviouslyhighvoucheraccessareaslikethesoutheasternquadrantofSanFranciscoandtheNorthBaysuburbofSanRafael.Previouslyvoucher-inaccessiblepeninsulasuburbslikeSanMateo,RedwoodCityandPacificabecomemorevoucheraccessible,asdoesmostofSanFranciscoproper.This‘levelingout’patternisalsovisibleinsuburbswithaccesstotheBayAreaRapidTransit(BART),includingMillbraeandSanBruno.ThewesternhalfofSanFranciscoproperalsoseesgainsinvoucheraccessibilityofbetween3%and50%ofallrentalunitsdependingontheneighborhood.
IntheOaklandHUDMarketAreavoucheraccessibilityisredistributedmoredramaticallyasaresultofanFMRshift.AreaswhichpreviouslyheldhighconcentrationsvouchereligibleunitsinRichmond,WestOaklandandcentralOaklandseeprecipitousdropsinvoucheraccessibility.Meanwhile,voucheraccessibilityincreasesamongrentalunitsinthesouthernsuburbsofUnionCityandFremontaswellastheeasternsuburbsofDublin,Pleasanton,BrentwoodandLivermore.

38
Figure15PercentagePointChangesinVoucherAccessibilityWhenShiftingfromaMarketAreaFMRtoaZIPCodeFMRinSanFranciscoandtheEastBay
IntheSanFranciscoHUDMarketArea,theoverallpercentageofrentallistingsintherentaldatabasethatvoucherholderswouldbeabletoaccessrisesfrom15.7%to28.2%whenshiftingfromaZIPcodeFMR.IntheEastBay,thetotalpercentageofrentallistingsaccessibletovoucherholdersactuallydeclinesinashifttoZIPcodeFMRs,from34%accessibleto32.9%.ThissmalllossappearstocomewiththebenefitofincreasingvoucheraccessibilityintheMarketArea’ssuburbs.However,theshifttriggersadramaticlossinvoucheraccessinOaklandproper,withthepercentofrentallistingswithincitylimitsaccessibletovoucherholdersdecliningfrom38.6%to24.7%,alossofnearly50%.
ThesignificantincreaseinvoucheraccessibleunitsintheSanFranciscoHUDMarketAreadoesnotsignificantlyincreasethejobaccessibilityofthevoucher-accessiblestockrelativetothevoucherinaccessiblerentallistings,asillustratedinFigure16.TheviolinplotsinFigure16showthedistributionsofthevoucheraccessiblelistingsandvoucherinaccessiblehousinglistingsandhowthosedistributionschangeastheFMRsaredefinedatdifferentscales.Theblackbarsrepresenttheaveragesfortherespectivedistributions.AsthescaleatwhichFMRsaredefineddeclines,thevoucheraccessiblestockshiftsslightlytowardsneighborhoodswithgreaterjobs-
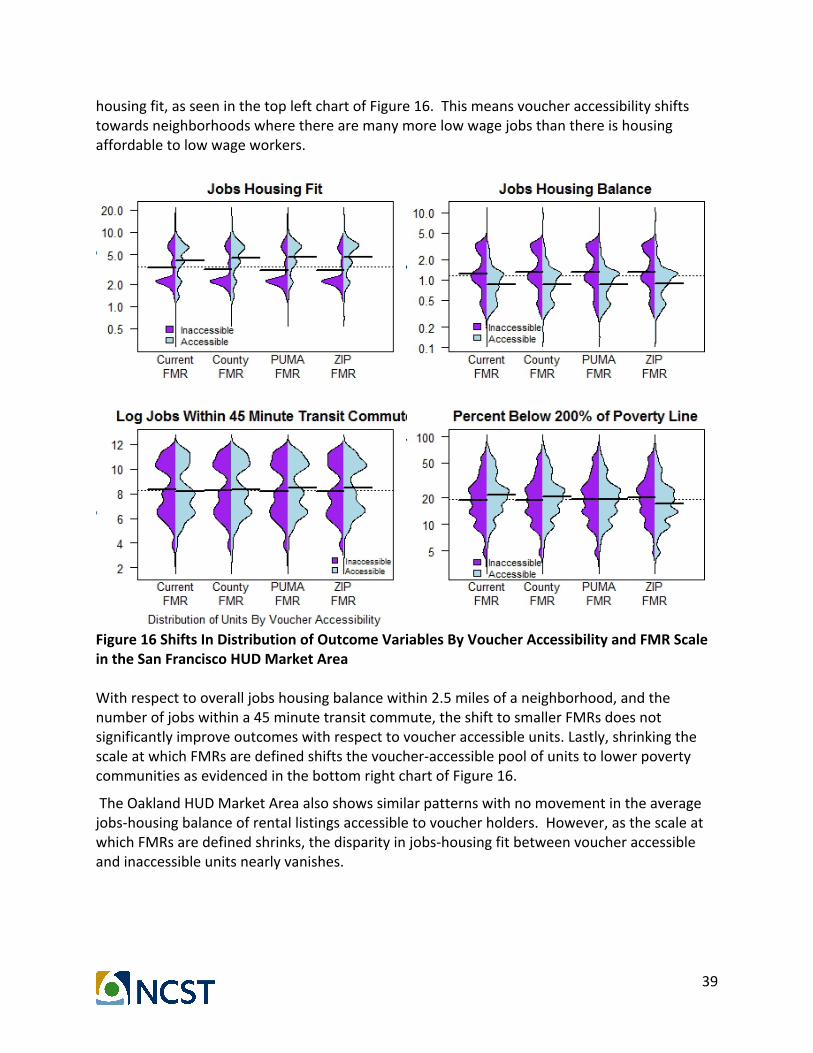
39
housingfit,asseeninthetopleftchartofFigure16.Thismeansvoucheraccessibilityshiftstowardsneighborhoodswheretherearemanymorelowwagejobsthanthereishousingaffordabletolowwageworkers.
Figure16ShiftsInDistributionofOutcomeVariablesByVoucherAccessibilityandFMRScaleintheSanFranciscoHUDMarketAreaWithrespecttooveralljobshousingbalancewithin2.5milesofaneighborhood,andthenumberofjobswithina45minutetransitcommute,theshifttosmallerFMRsdoesnotsignificantlyimproveoutcomeswithrespecttovoucheraccessibleunits.Lastly,shrinkingthescaleatwhichFMRsaredefinedshiftsthevoucher-accessiblepoolofunitstolowerpovertycommunitiesasevidencedinthebottomrightchartofFigure16.
TheOaklandHUDMarketAreaalsoshowssimilarpatternswithnomovementintheaveragejobs-housingbalanceofrentallistingsaccessibletovoucherholders.However,asthescaleatwhichFMRsaredefinedshrinks,thedisparityinjobs-housingfitbetweenvoucheraccessibleandinaccessibleunitsnearlyvanishes.
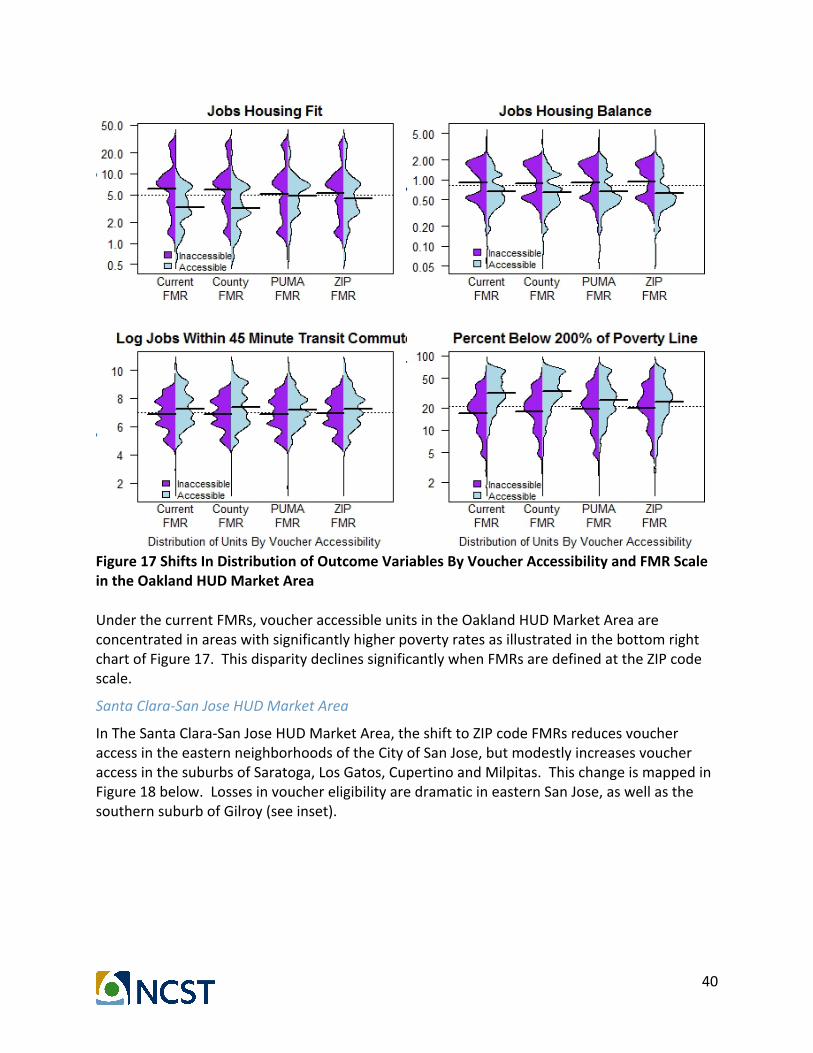
40
Figure17ShiftsInDistributionofOutcomeVariablesByVoucherAccessibilityandFMRScaleintheOaklandHUDMarketAreaUnderthecurrentFMRs,voucheraccessibleunitsintheOaklandHUDMarketAreaareconcentratedinareaswithsignificantlyhigherpovertyratesasillustratedinthebottomrightchartofFigure17.ThisdisparitydeclinessignificantlywhenFMRsaredefinedattheZIPcodescale.
SantaClara-SanJoseHUDMarketArea
InTheSantaClara-SanJoseHUDMarketArea,theshifttoZIPcodeFMRsreducesvoucheraccessintheeasternneighborhoodsoftheCityofSanJose,butmodestlyincreasesvoucheraccessinthesuburbsofSaratoga,LosGatos,CupertinoandMilpitas.ThischangeismappedinFigure18below.LossesinvouchereligibilityaredramaticineasternSanJose,aswellasthesouthernsuburbofGilroy(seeinset).

41
Figure18PercentagePointChangesinVoucherAccessibilityWhenShiftingfromaMarketAreaFMRtoaZIPCodeFMRintheSantaClara-SanJoseHUDMarketAreaDespitethelargelossofvoucheraccessibilityineastSanJoseandthemoremodestvoucheraccessgainsinthesuburbs,theoverallshareofrentallistingsinthismarketaccessibletovoucherholdersdeclinesbytwopercentagepoints,from27.7%to25.7%. ThisslightlossinoverallvoucheraccessibilitycomeswithtwomajorbenefitsillustratedinFigure19.First,thedisparityinjobs-housingfitbetweenvoucheraccessibleandinaccessiblestockvirtuallyvanishesasFMRscaledeclines(topleftchart).Second,theover-representationofvoucheraccessibleunitsinhighpovertycommunitiesalsonearlyvanishes(bottomleftchart).
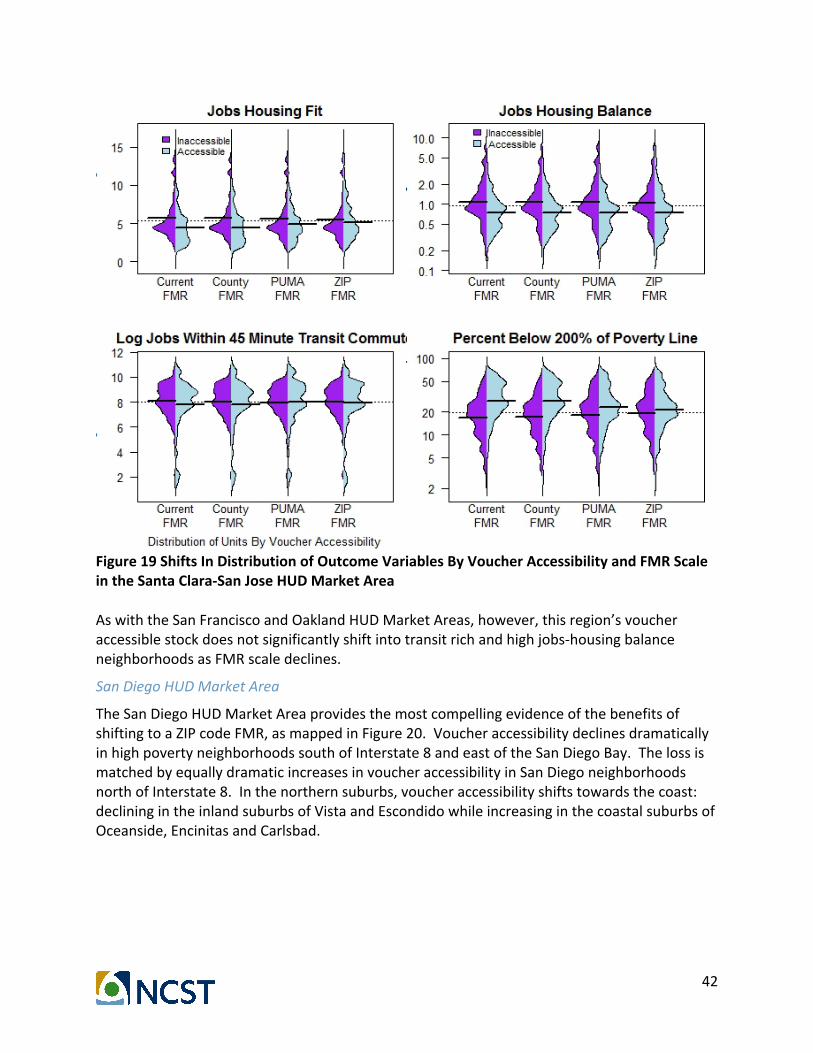
42
Figure19ShiftsInDistributionofOutcomeVariablesByVoucherAccessibilityandFMRScaleintheSantaClara-SanJoseHUDMarketArea AswiththeSanFranciscoandOaklandHUDMarketAreas,however,thisregion’svoucheraccessiblestockdoesnotsignificantlyshiftintotransitrichandhighjobs-housingbalanceneighborhoodsasFMRscaledeclines.
SanDiegoHUDMarketArea
TheSanDiegoHUDMarketAreaprovidesthemostcompellingevidenceofthebenefitsofshiftingtoaZIPcodeFMR,asmappedinFigure20.VoucheraccessibilitydeclinesdramaticallyinhighpovertyneighborhoodssouthofInterstate8andeastoftheSanDiegoBay.ThelossismatchedbyequallydramaticincreasesinvoucheraccessibilityinSanDiegoneighborhoodsnorthofInterstate8.Inthenorthernsuburbs,voucheraccessibilityshiftstowardsthecoast:decliningintheinlandsuburbsofVistaandEscondidowhileincreasinginthecoastalsuburbsofOceanside,EncinitasandCarlsbad.
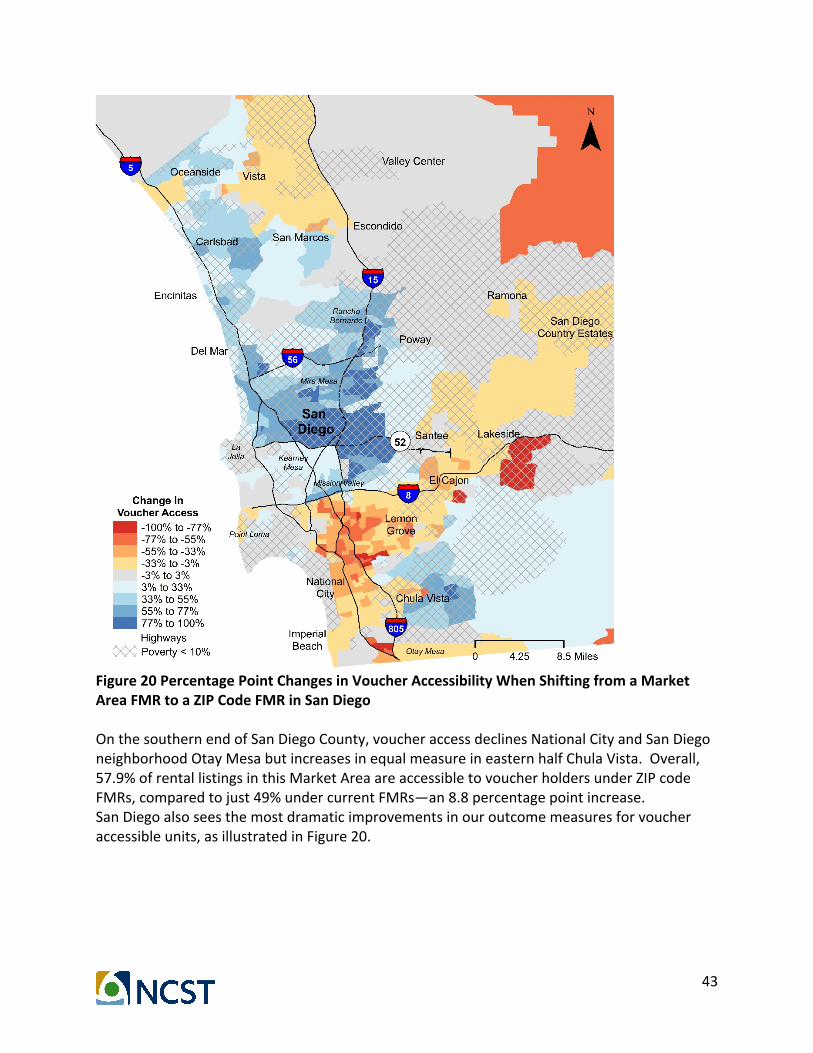
43
Figure20PercentagePointChangesinVoucherAccessibilityWhenShiftingfromaMarketAreaFMRtoaZIPCodeFMRinSanDiegoOnthesouthernendofSanDiegoCounty,voucheraccessdeclinesNationalCityandSanDiegoneighborhoodOtayMesabutincreasesinequalmeasureineasternhalfChulaVista.Overall,57.9%ofrentallistingsinthisMarketAreaareaccessibletovoucherholdersunderZIPcodeFMRs,comparedtojust49%undercurrentFMRs—an8.8percentagepointincrease.SanDiegoalsoseesthemostdramaticimprovementsinouroutcomemeasuresforvoucheraccessibleunits,asillustratedinFigure20.
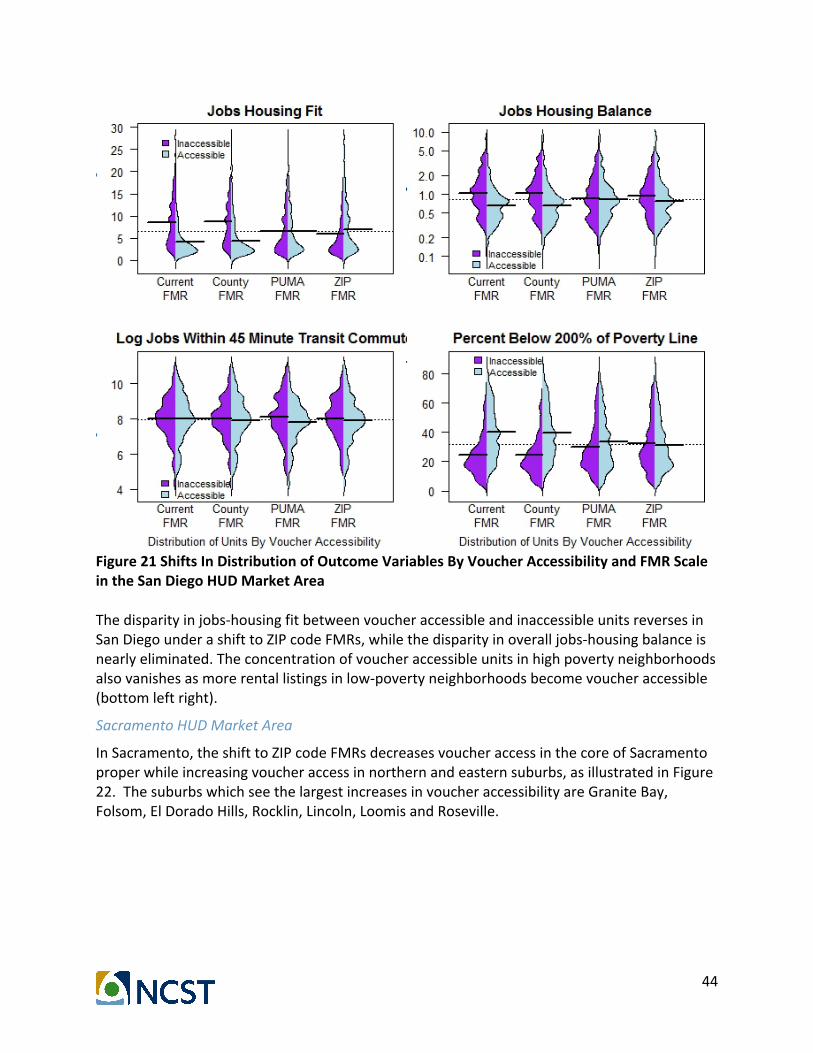
44
Figure21ShiftsInDistributionofOutcomeVariablesByVoucherAccessibilityandFMRScaleintheSanDiegoHUDMarketArea Thedisparityinjobs-housingfitbetweenvoucheraccessibleandinaccessibleunitsreversesinSanDiegounderashifttoZIPcodeFMRs,whilethedisparityinoveralljobs-housingbalanceisnearlyeliminated.Theconcentrationofvoucheraccessibleunitsinhighpovertyneighborhoodsalsovanishesasmorerentallistingsinlow-povertyneighborhoodsbecomevoucheraccessible(bottomleftright).
SacramentoHUDMarketArea
InSacramento,theshifttoZIPcodeFMRsdecreasesvoucheraccessinthecoreofSacramentoproperwhileincreasingvoucheraccessinnorthernandeasternsuburbs,asillustratedinFigure22.ThesuburbswhichseethelargestincreasesinvoucheraccessibilityareGraniteBay,Folsom,ElDoradoHills,Rocklin,Lincoln,LoomisandRoseville.

45
Figure22PercentagePointChangesinVoucherAccessibilityWhenShiftingfromaMarketAreaFMRtoaZIPCodeFMRinSacramento
SuburbscloserstotheCityofSacramento,likeRioLindaandAntelope,seemodestincreasesinvoucheraccess,asdoesthesouthernsuburbofElkGrove.TheoverallvoucheraccessibilityofrentallistingsintheSacramentoHUDMarketArearisefrom66.5%to72.9%asadirectresultoftheshifttoZIPcodeFMRs.VouchereligibilityishighestinSacramentoamongourfivecasestudyHUDmarketareasbecauseSacramento’sFMRswerecalculatedusingcensusmedianrents,asopposedto40thpercentilerents,duringtheyearscoveredbythisanalysis.HUDhassincereturnedSacramentotoFMRsbasedon40thpercentilecensusrents.
Figure23presentschangesinthedistributionofouroutcomevariablesforvoucheraccessibleandinaccessibleunitsunderdifferentFMRscales.SacramentofollowsasimilarpatterntoBayAreaHUDMarketAreas,withvoucheraccessibleunitsshiftingtolowerpovertycommunities

46
(bottomleftchart)andcommunitieswithimprovedjobs-housingfit(toprightchart).Unlikewithpreviouslyreviewedregions,voucheraccessibleunitsactuallyshifttoareaswithlowerjobs-housingbalancesasFMRscaledeclines(toprightchart).ThismaybeexplainedbythesignificantlossofvoucheraccessibleunitsinandarounddowntownSacramento—homeofthestateCapitolandlargeconcentrationofStategovernmentjobs.AswithpreviousMarketAreas,rescalingFMRsdoesnotappearto‘movetheneedle’onjobsaccessiblebytransitforvoucheraccessibleunits.
Figure23ShiftsInDistributionofOutcomeVariablesByVoucherAccessibilityandFMRScaleintheSacramentoHUDMarketArea
Conclusions
Acrossallfivecasestudy“HUDMarketAreas,”shiftingHUDFMRpolicytofinergeographicscalesincreasesvoucherholders’accesstolistedrentalunitsinlowpovertyandjobsrichneighborhoods.OnlyintheSanFranciscomarketareadoesthispolicyshiftincreasevoucherholderaccesstounitsintransit-richneighborhoods,andthenonlyslightly.IntheSacramento,SanFranciscoandSanDiegomarkets,FMRre-scalingde-concentratesor“levelsout”rentalunitavailabilityforvoucherholdersmoreevenlyacrossspace.LocalgovernmentsandpublichousingauthoritiesintheseregionsshouldconsiderworkingwithHUDtotransitiontheirvoucherprogramstoSmallAreaFairMarketRents.

47
Incontrast,re-scalingFMRsappearstomerelyshifttheun-evenconcentrationofvoucheraccessibleunitsintheEastBayawayfromOaklandandRichmondandtowardssuburbsfurthersouthandeast,withvouchereligibilityinOaklandproperdecliningby50%.TheparticularlydramaticlossofvoucheraccessibleunitsinrapidlygentrifyingeastOaklandunderthispolicyframeworkinparticularshouldbeofconcern.Furtherresearchshouldfleshoutiftheunreliabilityofrentalestimatesatsmallergeographicscalesexplainswhytheserapidlygentrifyingneighborhoodsaresosensitivetopolicyscaleshifts.PolicymakersandhousingagenciesintheSanJosemarketshouldalsobeworriedabouthowashifttosmallscaleFMRsappearstodramaticallyreducevoucheraccessibilityinlargesegmentsofeasternSanJoseandtheCityofGilroy.
TheconcerningresultsfortheEastBayandSanJosehighlightthepotentialneedforHUDtoestablishFMRfloorswhenshiftingtosmallscaledFMRsinafashionsimilartoHUD’scurrentceiling.Forexample,HUDmightconsiderensuringthatZIPcodeFMRscannotbelessthan70%oftheMarketAreaFMRsthatwouldotherwisebeinstituted.Futureresearchcandeterminewherethisthresholdmayneedtobe.
Lastly,itisimportanttohighlightthatthetremendousgainsinaccesstorentalunitsinjobsrichandlow-wagejobsrichneighborhoodsbroughtaboutbysmallerscaledFMRsdoesnotcomeattheexpensiveofHUD’seffortstogetvoucherholdersoutofhighpovertyneighborhoods.Incontrast,smallscaleFMRssignificantlyincreasethenumberoffor-rentlistingsinlow-povertyneighborhoodsthatwouldbeaccessibletovoucherholders.

48
Chapter4:IsPrioritizingAffordableHousinginCalifornia’sRailAccessibleandJobs-RichNeighborhoodsIncreasingDevelopmentCosts?Californiataxpayershavesupportedbondsinexcessofabilliondollarstofundhousingconstructionininfillparcelsandrailaccessibleneighborhoodsunderthestate’sInfillInfrastructureGrant(IIG)andTransitOrientedDevelopment(TOD)housingsubsidyprograms(89).Littleanalysishasexplicitlyexaminedhowprioritizingaffordablehousingdevelopmentintransitandjobsrichneighborhoodsinthiswayimpactsthecostofdevelopingaffordablehousinggenerally,orwithrespecttolightrailaccessspecifically.Thisisunfortunate,aspotentialcostsincreasestranslateintoareductioninthetotalnumberofaffordableunitsthatcanbeproducedgiventhelimitedhousingresourcesstatespossess.Infact,thehighcostofconstructingaffordablehousinginCaliforniarecentlyledthestate’sLegislativeAnalyst’sOfficetoconcludethatsolvingthestate’shousingcrisisbysubsidizingnewaffordablehousingconstructionwouldbeprohibitivelyexpensive(137).Inthisresearch,weaskhowmuchofthecostofaffordablehousinginCaliforniaisduetotheemphasisthatthestatehousingpolicyplacesonrailaccess.Theexistingliterature(e.g.,seetherecentsynthesisofZuketal2015)suggeststhataffordablehousingcostsshouldbeaffectedbyproximitytorail.
Nationally,oneofthemostimportantresourcesforcreatingaffordablehousingistheDepartmentofHousingandUrbanDevelopment’s(HUDs)LowIncomeHousingTaxCredit(LIHTC).ThisprogramprovidesthebudgetauthorityforstateandlocalLIHTC-allocatingagenciestoissuetaxcreditsfortheacquisition,rehabilitation,ornewconstructionofrentalhousingtargetedtolower-incomehouseholds(138).InCalifornia,abudgetauthorityinexcessof$90,000,000forLIHTCisadministeredthroughtheCaliforniaTaxCreditAllocationCommittee(TCAC).WeusedatagatheredfromtheLITHCapplicationspreparedbyaffordablehousingdeveloperstocreateadatasetofaffordablehousingprojectbudgetsfortheyears2008to2016.Usingordinaryleastsquaresandspatiallylaggedregression,wedevelopcostmodelsforaffordablehousingprojectstopredicttheeffectsofrailtransitandjobaccessonprojects’totaldevelopmentcosts(perunit).Weusespatiallyweightedregressiontothenexaminehowtheeffectsofkeydeterminantsvaryacrossspace.Thestudydataareprojectslocatedinthestate’sfourlargestmetropolitanareas:theSanFranciscoBayArea,Sacramento,LosAngelesandSanDiego.
Inbothourordinaryandspatiallylaggedmultivariateregressions,ourmodelingsuggeststhatproximitytorailstationshasonlyaveryweak(non-significant)effect(onacostperunitbasis)foraffordablehousingdevelopment.Withrespecttojobaccess,wefoundthatjobaccesswithina45minutestransitorautomobilecommutehasonlyaweakeffectoncost;however,wedofindsignificantpositiveeffectsforthejobs-housingbalanceinandaroundhousingprojects’neighborhoods.Thatis,thegreaterthejobsrelativetohousingaroundagivenproject,thehigherthetotaldevelopmentcostperunit.
TheoreticalRational:WhyAffordableHousingNearRailShouldBeMoreExpensive
Theliteratureoffersanalmostunanimousperspectiveontheimpactsoftransitinfrastructureandjobsaccessonrentsandhomevalues:asconsumersrecognizethecommutecostsavings
49
oflivingnearjobsandtransit,theybiduplandandpropertyvaluesintransitandjobsrichneighborhoods(139–141).Infact,theliteratureisclearthatcloseproximitytofixedroutetransitcanincreaselandorpropertyvaluesfrombetween1%to15%(91–93,96).TheevidenceofthiseffectisstrongerinTODs,developmentsintentionallydesignedtomaximizeresidentandemployeeuseofadjacenttransit(94,95,97,142).Panelstudiessuggesttransit-proximityhasplayedalargerroleinfluencinglandandpropertymarketssincetheGreatRecession(91,98).Therefore,wewouldexpectthataffordablehousingincloseproximitytomajorrailinfrastructureshouldalsobesignificantlymoreexpensivethanaffordablehousingbuiltelsewhere.Affordablehousingdevelopershavevoicedthisasacriticalconcern,sincetheycannotincludelandvaluesinthecalculationoftheirtaxcreditsubsidies(19).
Therearealsoasmallnumberofstudiesthathaveinconclusiveornegativeresults,suggestingthattransitmaynotalwayshaveameaningfulimpactonpropertyvalues.Onestudyoffourteencitiesfoundthattransitraisedpropertyvaluesinonlythree:Chicago,BostonandWashingtonD.C.(Kahn,2007).Gatzlaff&Smith(1993)failedtofindasignificanteffectofrailconstructiononpropertyvaluesinsinglefamilyhomesalonganewraillineinMiami.Theseresults,whichstandincontradictiontothebulkoftheliterature,raisethepossibilitythat–atleastinsomecities–therearefactorsthroughwhichtransitmayaffectpropertyvalues:itisnotenoughthatatransitstationisbuilt,thatstationmustalsomeasurablyimproveresidents’accesstojobsandamenitiestoinduceresidentstobiduprents.StudiesontheSanFranciscoBayAreahavefoundthepricepersquarefootofhousingissignificantlyinfluencedbythenumberofjobswithina45commuteshed(59,145).Thissuggeststhatanyanalysisoftransitproximityshouldincludemeasuresofjobaccessibilitythatmayaffectaffordablehousingdevelopmentcosts.
OtherRailAccessRelatedFactorsContributingtoCostEscalation
Affordablehousingadjacenttomajorrailtransitmayappearmoreexpensivenotjustbecauseofincreasedlandvalues,butalsobecausetheseprojectstendtobeinfillprojectsthatfaceadditionalexpensessuchasroadsandsewageupgrades(77,89).Additionally,projectsintheseneighborhoodsmaybemoreexpensivebecausestructuresmaybesignificantlytaller,requiringmoreexpensiveinputsandtheinclusionofexpensiveattributeslikeelevators(21).Theoretically,manynon-railaccessibleinfillprojectsalsofacetheseaddedcosts,butmuchofthecostscanberecoupedthroughmarketvaluesales.Practicallyspeaking,whentheavailablelandneartransitiszonedhighdensityorrequiressignificantinfrastructureupgrades—thesearethecoststhestatebearswhenitpromotesaffordabledevelopmentnearrail.
WhatDeterminestheCostofAffordableHousing?
Labor,landandmaterialarethebasicdriversofhousingproductioncosts,includingaffordablehousingcosts(146).Thesefactorsarebothspaceandtimevariant,requiringempiricalmodelingofaffordablecosttrendstoaccountforlabormarkettrendsovertimeandthespatialsegmentationoflaborandlandmarkets.Mostoftheothervariablesreviewedintheliteratureaffectaffordablehousingcoststhroughaproject’slandvaluesorthedemandforlaborormaterialinputs.Wecanthusexpecthousingandlabormarketsthemselvestobesignificantpredictorsofaffordablehousingcosts.Wealsoexpectthatanyregulatorymandatesthatrequireincreasedwagesforconstructionworkersorhigherqualitymaterialstoincreasethe

50
costofaffordablehousingprojects,asprevailingwagelawshavebeenfoundtoincreaseaffordablehousingdevelopmentcostsbetween8%and12%inmultiplesite-specificanalysis(147).Economiesofscaledoexistinaffordablehousingproduction,withperunitdevelopmentcostsdecliningasthenumberofunitsinaprojectincreases(21).Moreunitsonsmallerparcelsofland,orhigherdensities,canhelpoffsetlandcosts(ibid).Zoningstandardsandregulationscanalsoaffectcosts.Minimumparkingrequirementshavebeentargetedasprimeculpritsofhigherdevelopmentcostsinhousing,includingaffordablehousingprojects(22,102,103).
Manyattributesofanaffordablehousinginfillprojectarepre-determinednotbylocalzoningregulationsorlabormarketconditions,butbythepopulationsservedbytheprojects.InCalifornia,statelawandtaxcreditregulationsofferavariedsetofstandardslikeparkingrequirementsandunitsizes,whichdependonthepopulationaprojectserves(19).LegislationrecentlypassedinCaliforniapreventsaprojectservingseniors,forexample,fromrequiringanythingmorethan.5parkingspaceperseniorunitand.3spacesperspecialneedsunit(148).Single-ResidentOccupancy(SRO)projectsrequiremuchfewersquarefootagethanprojectsaimedatlargefamilies.Thus,thetypeofprojectandpopulationservedcanbeasignificantpredictorofprojectcosts.
Finally,theincomeoflevelsofresidentsexpectedtodwellinaffordablehousingprojectsalsoindirectlyaffectsprojectcostsbecauserentsaredeterminedbyincomes.Practitionersrefertothisasthe“depthofaffordability.”Rentsonataxcreditfundedsitearegenerallynomorethanonethirdofahousehold’sincome,sothelowertheaverageincomeofresidentsonsite,thelowertherentsandthegreaterthe“depthofaffordability,”andthus,theamountofsubsidyneeded.Inthelastdecade,someevidencesuggeststhatdevelopersmaybelocatinginsitesthatminimizetheamountofsubsidyfamiliesarereceivingbylocatinginareaswhererentsarealreadylowerortheprojectscanwinspecialspatiallydefined“bonus”subsidiesfromtaxcreditallocatingagencies(37).
EmpiricalSetting
WecompiledtheapplicationsforLowIncomeHousingTaxCredits(LIHTC)thatweresubmittedtotheCaliforniaTaxCreditAllocationCommittee(TCAC)from2008through2016.WeusedRtoextractandcompileourdataset.Thecompetitionforfundingisstiffandbecausemanyprojectscanendupapplyingfortaxcreditsmultipletimes,weidentifiedandremovedduplicateprojects,keepingonlytheverylatestapplicationforeachproject.Limitingthedatasettothelatestapplicationsofnewconstructionprojectsresultedinatotalsamplesizeof949.Wealsoeliminatedobservationslocatedinregionswithlittletonorailinfrastructure.Theanalysiswasconstrainedtothestate’sfourlargestmetropolitanplanningorganizations,allofwhichcontainmajortransitsystems:SanFranciscoBayArea,GreaterSacramentoArea,GreaterLosAngelesAreaandInlandEmpire,andSanDiegoCounty.Finally,projectsoftendidnotcontaincompleteinformation,andthesewerealsoeliminated.Thefinalcompletedatasetusedforthisanalysiscontained496observations(Table1).

51
Table4:DataPreparationandRemainingSampleSizeDataCleaningStep Remaining
SampleSizeInitialTaxCreditProjectApplications,2008to2016 2012Removenon-NewConstructionprojects 1340Removerepeatapplications,keeplatestandfinalapplication 864RemoveprojectsoutsidemajorMPOswithrail651Afterremovingprojectswithmissingorincompleterecords 496TheinformationcontainedintheTCACapplicationsincluded12variablesofinteresttous;thesevariableswerefoundtobesignificantinpreviousstudiesofaffordablehousingcosts(21,22).Ouranalysisdatasetincludesawidedistributionofdevelopmentcostperunit,includingseveralprojectswithcostsbelow$200,000perunit(Table5).Thedistributionoftotalunitsperprojecttracksthedistributionofthenumberofparkingspaces,aswouldbeexpectedgiventheirpairwisecorrelationof.71.AsevidencedinTable2thevastmajorityofprojectsweredevelopedforlargefamilies(60%),followedbyseniors(22%).Afifth(N=104)oftheprojectsarewithinhalfmileofrailstop,and12.5%arewithinaquartermile.Countyindicatorvariablesareincludedasproxiesfordifferencesinthelandandlabormarketsacrossthestate.
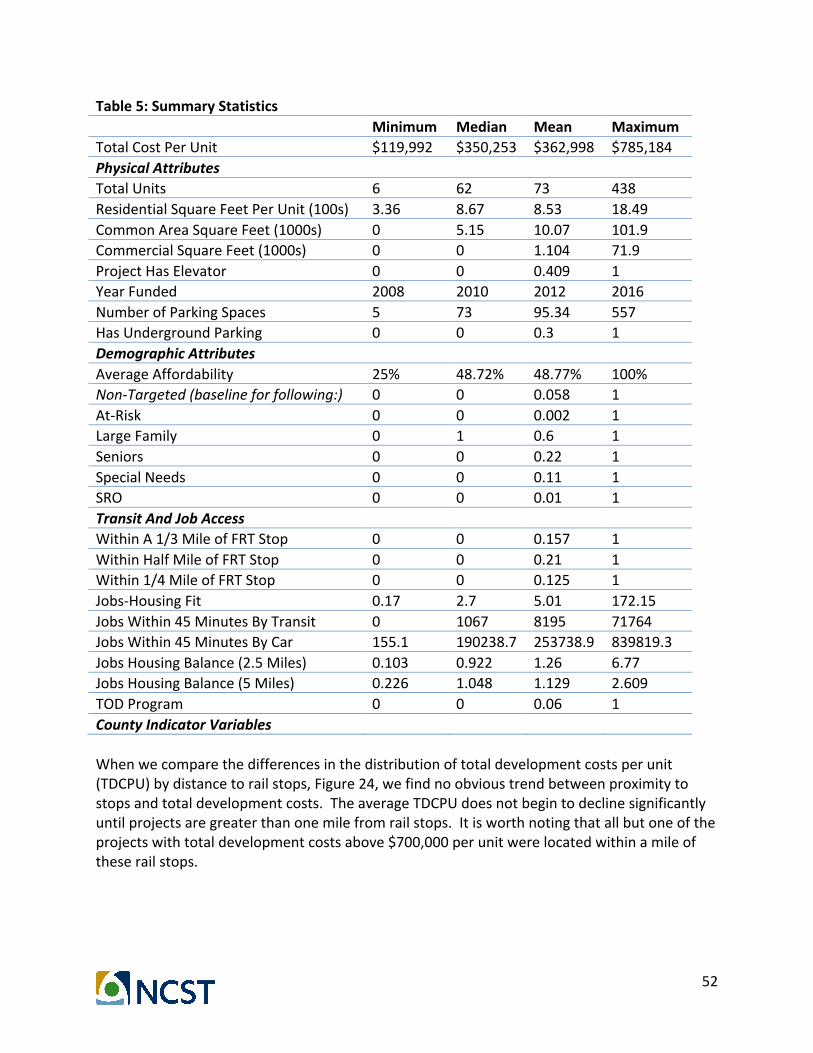
52
Table5:SummaryStatistics Minimum Median Mean MaximumTotalCostPerUnit $119,992 $350,253 $362,998 $785,184PhysicalAttributes
TotalUnits 6 62 73 438ResidentialSquareFeetPerUnit(100s) 3.36 8.67 8.53 18.49CommonAreaSquareFeet(1000s) 0 5.15 10.07 101.9CommercialSquareFeet(1000s) 0 0 1.104 71.9ProjectHasElevator 0 0 0.409 1YearFunded 2008 2010 2012 2016NumberofParkingSpaces 5 73 95.34 557HasUndergroundParking 0 0 0.3 1DemographicAttributes
AverageAffordability 25% 48.72% 48.77% 100%Non-Targeted(baselineforfollowing:) 0 0 0.058 1At-Risk 0 0 0.002 1LargeFamily 0 1 0.6 1Seniors 0 0 0.22 1SpecialNeeds 0 0 0.11 1SRO 0 0 0.01 1TransitAndJobAccess
WithinA1/3MileofFRTStop 0 0 0.157 1WithinHalfMileofFRTStop 0 0 0.21 1Within1/4MileofFRTStop 0 0 0.125 1Jobs-HousingFit 0.17 2.7 5.01 172.15JobsWithin45MinutesByTransit 0 1067 8195 71764JobsWithin45MinutesByCar 155.1 190238.7 253738.9 839819.3JobsHousingBalance(2.5Miles) 0.103 0.922 1.26 6.77JobsHousingBalance(5Miles) 0.226 1.048 1.129 2.609TODProgram 0 0 0.06 1CountyIndicatorVariables
Whenwecomparethedifferencesinthedistributionoftotaldevelopmentcostsperunit(TDCPU)bydistancetorailstops,Figure24,wefindnoobvioustrendbetweenproximitytostopsandtotaldevelopmentcosts.TheaverageTDCPUdoesnotbegintodeclinesignificantlyuntilprojectsaregreaterthanonemilefromrailstops.Itisworthnotingthatallbutoneoftheprojectswithtotaldevelopmentcostsabove$700,000perunitwerelocatedwithinamileoftheserailstops.

53
Figure24:DistributionsofTotalCostPerUnitbyDistancetoRail,LRTorTrolleyStops
Forourmodeling,weestablishedindicatorvariablesforprojectsthatarewithinaquartermile,one-thirdmileorone-halfmileofarailtransitstop.OurdistancesarebasedonstudiesidentifyingthesethresholdsasrelevantindeterminingtheeffectofTODsontravelbehavior(82).Welimitedourcalculationstopassengerrail,lightrailandtrolleystops,withbusesexcluded.ThisisconsistentwiththeCalifornia’sTransitOrientedDevelopment(TOD)Program,whichinpracticehasonlyfundedprojectsincloseproximitytothesetypesoftransitsystems(89).ThisprogramusesProposition1bondmoneyandisexecutedthroughtheDepartmentofHousingandCommunityDevelopment(HCD).WeincludeaseparateindicatorvariabledesignatingiftheprojectreceivedfundsfromtheTODprogram.
Tocapturejobaccessibility,weconstructedavariableidentifyingjobswithina45minutetransitorautomobilecommute(145).Wealsoincludedtwometricsofjobs-housingbalance:1)totaljobs-housingbalancewithin2.5milesofahousingsite’scensustractand2)totaljobs-housingbalancewithin5milesofasite’scensustract.Theplacementofmoreaffordablehousingincommunitieswithlargeimbalancesmaycontributetoareductioninexcesscommutingcreatedbysuchimbalances(2,16).Lastly,sincetheseareaffordablehousingprojects,wealsotestforjobs-housingfit,whichistheratiobetweenlowwageworkersandhousingunitsaffordabletolowwageworkerswithin2.5milesofacensustract.Thismeasurehasbeenfoundtostronglypredictthecommutetimesanddistancesofthelowwageworkerswhomaybeeligibleforaffordablehousing,makingitsrelationshiptoaffordablehousingcostscriticallyimportantforouranalysis(1,17).
Results
Theliteratureonmodelingaffordablehousingismixedinitsapproach.Someworksuggestsgeographicallyweightedregressionperformsbestinpredictingrentsandpropertyvalues(149),

54
whileothersmaintainthattraditionalOLSwithspatialindicatorvariablesprovidesthemostrobustresults(150).Thus,wetooktwoapproaches.WemodeledthehousingcostsasafunctionofspatialindicatorsusingOLS.Wealsospecifiedmodelsutilizingaspatiallagapproachwhich,aswewilldiscuss,correctedforspatialautocorrelationintheBayAreaandGreaterSacramentoregions.Aspartofourresults,wealsopresentdetailedmappingofhowtheeffectsoncostsofkeyindependentvariablesvaryacrossspace.
OLSResults
OurOLSmodelspecificationresultsarepresentedinTable6.Forvisualsimplicity,theCountyIndicatorvariablesforeachofthemodelsarepresentedseparatelyinTable7.Consistentwiththeliterature,wefindevidenceofeconomiesofscale:thetotalnumberofunitscorrelatesnegativelyandsignificantlywithtotaldevelopmentcosts.Therelationshipisinelastic:aonepercentincreaseinthetotalnumberofunitsproducesa0.17%to0.18%decreaseintotaldevelopmentcostsperunit.
Residentialsquarefeetperunit,ourproxyforunitsize,correlatespositivelywithtotaldevelopmentcostsasexpected,asdoescommercialsquarefootage.Commonareasquarefootageispositivelybutinsignificantlyassociatedwithtotaldevelopmentcosts.Thepresenceofanelevatorisveryweaklybutpositivelyassociatedwithprojectcosts.Perhapsduetothecollinearityissuediscussedintheprevioussection,wedonotfindthenumberofparkingunitscorrelatingsignificantlywithtotaldevelopmentcosts.However,wedofindthepresenceofundergroundparkingissignificant,andmayincreasethetotaldevelopmentcostbybetween5.7%and7%perunit.
Theaverageaffordabilitylevelofaproject’saffordableunitscorrelatesnegativelywithtotaldevelopmentcost;weexpectthisbasedontheliterature.Putanotherway:aonepercentincreaseintheHUD-definedincomelevelsofresidents(requiringshallowersubsidies)decreasestotaldevelopmentcostby0.7%.Relativetothebaselineofprojectsthatserveat-riskpopulations,onlyprojectstargetedatseniorsaresignificantlydifferent,havingTDCPUsbetween9%and9.5%lower.Projectsfacingtheprevailingwagerequirementarebetween15%and16%moreexpensivethanthosethatarenotrequiredtopayprevailingwages.
Model1(M1)presentstheresultsfortransitproximitywithinathirdofamile,whileModel2(M2)andModel3(M3)covertransitproximitywithinahalfmileandquarterofmilerespectively.Model4(M4)presentsresultsforlowwagejobstoaffordablehousingfit.Model5(M-5)presentsresultsforjobswithina45minutetransitcommuteandModel6(M6)presentsresultsforjobswithina45minuteautocommute.Models7and8presentjobshousingbalanceresultswithin2.5mileand5milebufferrespectively,andModel9presentsresultsforparticipationinthestate’sTODaffordablehousingprogram.

55
Table6:OLSRegressionsOn(DependentVariableisLogofTotalDevelopmentCostsPerUnit)
Baseline M1 M2 M3 M4 M5 M6 M7 M8 M9Intercept -53.331*** -51.923*** -52.274*** -52.809*** -52.601*** -53.037*** -53.519*** -54.158*** -52.306*** -54.054***
PrevailingWageRequired 0.158*** 0.156*** 0.156*** 0.158*** 0.16*** 0.159*** 0.159*** 0.156*** 0.156*** 0.16***
TotalUnits -0.168*** -0.171*** -0.174*** -0.17*** -0.168*** -0.167*** -0.168*** -0.181*** -0.176*** -0.168***ResidentialSqft. 0.016** 0.016** 0.016** 0.017** 0.016** 0.016** 0.016** 0.017** 0.017** 0.016**
CommonAreaSqft. 0.001^ 0.001 0.001^ 0.001 0.001 0.001^ 0.001^ 0.001 0.001 0.001^CommercialSqft. 0.013*** 0.012*** 0.012*** 0.012*** 0.013*** 0.013*** 0.013*** 0.012*** 0.013*** 0.013***
ProjectHasElevator 0.038^ 0.035^ 0.036^ 0.036^ 0.036^ 0.038^ 0.038^ 0.042* 0.042* 0.038^YearFunded 0.033*** 0.033*** 0.033*** 0.033*** 0.033*** 0.033*** 0.033*** 0.034*** 0.033*** 0.034***
NumberofParkingSpaces 0.006 0.008 0.01 0.007 0.008 0.006 0.006 0.017 0.011 0.006
HasUndergroundParking 0.058** 0.054** 0.054** 0.056** 0.057** 0.058** 0.059** 0.046* 0.047* 0.059**AverageAffordability -0.005*** -0.005*** -0.005*** -0.005*** -0.005*** -0.005*** -0.005*** -0.005*** -0.005*** -0.005***
At-Risk -0.095 -0.095 -0.121 -0.095 -0.103 -0.1 -0.097 -0.053 -0.102 -0.095LargeFamily 0.059 0.057 0.057 0.057 0.059 0.059 0.059 0.073^ 0.063 0.06
Seniors -0.103* -0.102* -0.101* -0.103* -0.104* -0.104* -0.103* -0.076^ -0.094* -0.102*
SpecialNeeds -0.018 -0.018 -0.019 -0.018 -0.02 -0.018 -0.018 0.002 -0.013 -0.019SRO 0.098 0.093 0.099 0.093 0.096 0.097 0.096 0.119 0.092 0.102
In1/3MileofRailStop
0.032 InHalfMileofRailStop
0.029
In1/4MileofRailStop
0.025 Jobs-HousingFit
-0.001
Jobs45MinutesByTransit
0 Jobs45MinutesByCar
0
JobsHousingBal.2.5Mi.
0.028** JobsHousingBal.5Mi.
0.046*
InTODProgram
-0.017
R-Squared 0.6554 0.6567 0.6567 0.6561 0.6567 0.6555 0.6555 0.6631 0.6595 0.6556AdjustedRSquared 0.6276 0.6282 0.6282 0.6275 0.6281 0.6269 0.6269 0.6351 0.6312 0.6269
Moran'sIP(NorthMPOs) 0.000*** 0.000*** 0.000*** 0.000*** 0.000*** 0.000*** 0.000*** 0.000*** 0.001*** 0.001***Moran'sIP(SouthMPOs) .968 .984 .936 .990 .965 .959 .948 .775 .763 .763
SignificanceLevels:***.001,**.01,*.05,^.1
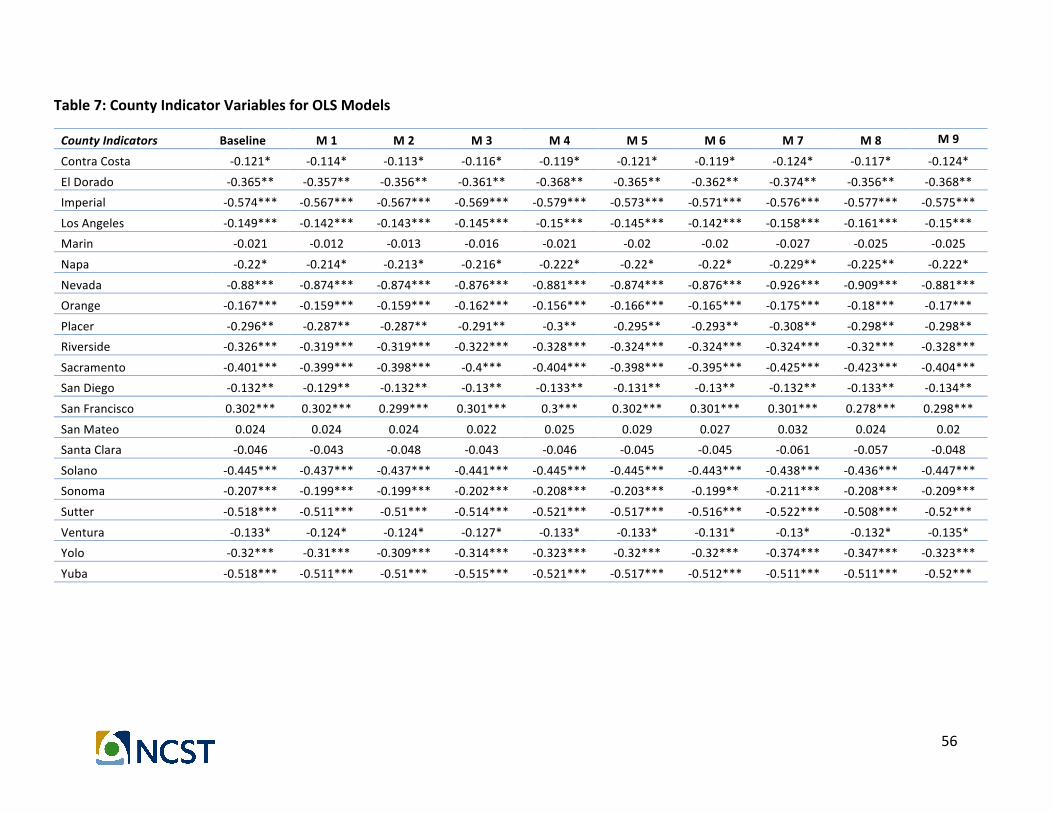
56
Table7:CountyIndicatorVariablesforOLSModels
CountyIndicators Baseline M1 M2 M3 M4 M5 M6 M7 M8 M9
ContraCosta -0.121* -0.114* -0.113* -0.116* -0.119* -0.121* -0.119* -0.124* -0.117* -0.124*
ElDorado -0.365** -0.357** -0.356** -0.361** -0.368** -0.365** -0.362** -0.374** -0.356** -0.368**Imperial -0.574*** -0.567*** -0.567*** -0.569*** -0.579*** -0.573*** -0.571*** -0.576*** -0.577*** -0.575***
LosAngeles -0.149*** -0.142*** -0.143*** -0.145*** -0.15*** -0.145*** -0.142*** -0.158*** -0.161*** -0.15***Marin -0.021 -0.012 -0.013 -0.016 -0.021 -0.02 -0.02 -0.027 -0.025 -0.025
Napa -0.22* -0.214* -0.213* -0.216* -0.222* -0.22* -0.22* -0.229** -0.225** -0.222*
Nevada -0.88*** -0.874*** -0.874*** -0.876*** -0.881*** -0.874*** -0.876*** -0.926*** -0.909*** -0.881***Orange -0.167*** -0.159*** -0.159*** -0.162*** -0.156*** -0.166*** -0.165*** -0.175*** -0.18*** -0.17***
Placer -0.296** -0.287** -0.287** -0.291** -0.3** -0.295** -0.293** -0.308** -0.298** -0.298**Riverside -0.326*** -0.319*** -0.319*** -0.322*** -0.328*** -0.324*** -0.324*** -0.324*** -0.32*** -0.328***
Sacramento -0.401*** -0.399*** -0.398*** -0.4*** -0.404*** -0.398*** -0.395*** -0.425*** -0.423*** -0.404***SanDiego -0.132** -0.129** -0.132** -0.13** -0.133** -0.131** -0.13** -0.132** -0.133** -0.134**
SanFrancisco 0.302*** 0.302*** 0.299*** 0.301*** 0.3*** 0.302*** 0.301*** 0.301*** 0.278*** 0.298***
SanMateo 0.024 0.024 0.024 0.022 0.025 0.029 0.027 0.032 0.024 0.02SantaClara -0.046 -0.043 -0.048 -0.043 -0.046 -0.045 -0.045 -0.061 -0.057 -0.048
Solano -0.445*** -0.437*** -0.437*** -0.441*** -0.445*** -0.445*** -0.443*** -0.438*** -0.436*** -0.447***Sonoma -0.207*** -0.199*** -0.199*** -0.202*** -0.208*** -0.203*** -0.199** -0.211*** -0.208*** -0.209***
Sutter -0.518*** -0.511*** -0.51*** -0.514*** -0.521*** -0.517*** -0.516*** -0.522*** -0.508*** -0.52***
Ventura -0.133* -0.124* -0.124* -0.127* -0.133* -0.133* -0.131* -0.13* -0.132* -0.135*Yolo -0.32*** -0.31*** -0.309*** -0.314*** -0.323*** -0.32*** -0.32*** -0.374*** -0.347*** -0.323***
Yuba -0.518*** -0.511*** -0.51*** -0.515*** -0.521*** -0.517*** -0.512*** -0.511*** -0.511*** -0.52***
57
Noneoftherailtransitindicatorvariablesincludedintheregressionsofaresignificantatorbeyondthe.05level.Moreover,noneofthecoefficientsregistereffectsaregreaterthan3%.Thejobs-housingfit,orthejobs-housingbalanceexperiencedbylowwageworkers,isuncorrelatedwithtotaldevelopmentcostperunit.
RelativetoAlameda,SanFranciscoisthemostexpensivecountyinoursample(Table3),followedbyVentura,SanMateoandSantaClara.TheinclusionofourspatiallysensitiverailandjobsaccessvariablesdonotappeartosignificantlyalterCountyindicatorvariables.
Model5(M5)presentsresultsforjobswithina45minutetransitcommuteandModel6presentsresultsforjobswithina45minuteautocommute.Neitheraresignificant.Incontrast,Totaljobs-housingbalancewithinbotha2.5mileradiusandfivemileradius,aresignificantlyandpositivelyassociatedwithperunitdevelopmentcostsasdemonstratedinModelsM7andM8.Model9presentsresultsfortheeffectsofparticipationinthestateTODprogram,whichhavenosignificanteffectoncosts.
Themodelspecificationsaccountfor66%ofthevarianceinthedependentvariable,whichislowerthanthe80%attainedbyapreviousstudyofaffordablehousingdevelopmentcostsinCalifornia(21).However,thatstudyhadamuchsmallersample(284projectsversusour496),whichmaypartiallyexplainthedifference.Additionally,thepreviousanalysisincludedavariableonconstructionmaterialqualitythatwewereunabletoreplicate.
WeranseparateMoran’sItestsofspatialautocorrelationinthemodelresidualsfortheNorthversusSouthMPOs,andfoundhighlysignificantspatialautocorrelationintheBayAreaandSacramento,butnoneinLosAngelesandSanDiego.Toensurethespatialautocorrelationwouldnotbiasourresults,weduplicatedourOLSregressionswithaspecifiedspatiallag,theresultsofwhicharepresentedinthenextsubsection.
SpatiallyLaggedRegressionsThefirsthalfofthespatiallylaggedregressionsarepresentedinTable8.Asintheprevioussubsection,Countyindicatorvariablesarepresentedinseparatetableforeaseofreading,Table9.Inthesemodels,totalunitcountandresidentialsquarefeetperunitretaintheirsignificanteffects.Commercialsquarefootageretainsitpositiveandsignificantimpactoncosts,with1,000squarefeetofcommercialspaceincreasingcostsbyroughly5%perunit.Undergroundparkingandyearfundedalsomaintainpositiveandsignificantcoefficients.
Amongdemographicvariables,averageaffordabilityandseniorprojectsretaintheirstatisticalinfluenceoncost,withprojectsforseniorsregisteringperunittotaldevelopmentcostsat11-12%lowerthanthebaselinegroup,projectsforAt-Riskpopulations.

58
Table8:SpatialLagModelResults Baseline Model1 Model2 Model3 Model4 Model5 Model7 Model8 Model9Intercept -44.396*** -42.647*** -43.848*** -43.668*** -43.456*** -44.396*** -47.01*** -43.973*** -44.862***
PrevailingWageRequired 0.153*** 0.15*** 0.15*** 0.152*** 0.154*** 0.153*** 0.152*** 0.15*** -0.155***
TotalUnits -0.177*** -0.182*** -0.183*** -0.18*** -0.176*** -0.177*** -0.19*** -0.184*** -0.155***ResidentialSquareFeetPerUnit 0.015** 0.015** 0.015** 0.015** 0.015** 0.015** 0.016** 0.016** 0.015**
CommonAreaSquareFeet 0.002* 0.002* 0.002* 0.002* 0.002* 0.002* 0.001^ 0.002* 0.001*CommercialSquareFeet 0.058** 0.059** 0.055** 0.059** 0.058** 0.058** 0.048* 0.053** 0.058**
ProjectHasElevator 0.027 0.023 0.025 0.024 0.025 0.027 0.032^ 0.032^ 0.03^YearFunded 0.027*** 0.026*** 0.027*** 0.027*** 0.027*** 0.027*** 0.028*** 0.027*** 0.028***
NumberofParkingSpaces 0.017 0.02 0.021 0.019 0.018 0.017 0.028 0.022 0.003
HasUndergroundParking 0.057** 0.051** 0.053** 0.053** 0.057** 0.057** 0.046* 0.046* 0.056**AverageAffordability -0.005*** -0.005*** -0.005*** -0.005*** -0.005*** -0.005*** -0.005*** -0.005*** -0.006***
At-Risk -0.149 -0.147 -0.177 -0.147 -0.155 -0.149 -0.102 -0.152 -0.134LargeFamily 0.035 0.03 0.031 0.03 0.034 0.035 0.049 0.042 0.049
Seniors -0.118** -0.116** -0.115** -0.117** -0.118** -0.118** -0.091* -0.105* -0.12**
SpecialNeeds -0.048 -0.047 -0.049 -0.048 -0.05 -0.048 -0.026 -0.038 -0.046SRO 0.073 0.066 0.074 0.066 0.071 0.073 0.095 0.07 0.078
WithinA1/3MileofRailStop
0.047^ WithinHalfMileofRailStop
0.034
Within1/4MileofRailStop
0.039 Jobs-HousingFit
-0.001
Jobs45MinutesByTransit
-0.084 Jobs45MinutesByCar
JobsHousingBalance(2.5Mi.)
0.029*** JobsHousingBalance(5Mi.)
0.051**
InTODProgram
0.029
Rho 0.22429 0.23589 0.23704 0.22929 0.20545 0.22429 0.25516^ 0.21441 0.2275
LRTestp-value 0.143 0.1216 0.120 0.133 0.185 0.146 0.091 0.16 0.134AIC -246.85 -248.65 -247.14 -247.1 -246.04 -246.85 -256.58 -252.1 -258.09
AICforLinearModel -246.71 -248.25 -246.73 -246.85 -246.27 -246.71 -255.73 -252.12 -257.85SignificanceLevels:***.001,**.01,*.05,^.1

59
Table9:CountyIndicatorsForSpatialLagModels
CountyIndicatorVariables Baseline Model1 Model2 Model3 Model4 Model5 Model7 Model8 Model9
ContraCosta -0.084 -0.075 -0.076 -0.077 -0.084 -0.318* -0.087 -0.081 -0.076
ElDorado -0.318* -0.301* -0.303* -0.308* -0.325* -0.418** -0.318* -0.309* -0.307*Imperial -0.418** -0.399** -0.4** -0.407** -0.435** -0.111** -0.398** -0.428*** -0.403**
LosAngeles -0.111** -0.1* -0.103* -0.105* -0.115** -0.024 -0.117** -0.127** -0.111*Marin -0.024 -0.01 -0.014 -0.016 -0.025 -0.2* -0.029 -0.028 -0.018
Napa -0.2* -0.187* -0.189* -0.192* -0.205* -0.78*** -0.202* -0.206* -0.184*
Nevada -0.78*** -0.765*** -0.767*** -0.771*** -0.791*** -0.135** -0.81*** -0.817*** -0.762***Orange -0.135** -0.12* -0.122* -0.125* -0.128* -0.208^ -0.141** -0.153** -0.127*
Placer -0.208^ -0.188 -0.191 -0.196 -0.221^ -0.252*** -0.204^ -0.215^ -0.197Riverside -0.252*** -0.235** -0.237** -0.242*** -0.261*** -0.299*** -0.236*** -0.248*** -0.249***
Sacramento -0.299*** -0.29** -0.288** -0.294** -0.31*** -0.098^ -0.305*** -0.327*** -0.284**SanDiego -0.098^ -0.091^ -0.095^ -0.094^ -0.102^ 0.281*** -0.091^ -0.101* -0.086
SanFrancisco 0.281*** 0.282*** 0.278*** 0.281*** 0.281*** 0.027 0.279*** 0.255*** 0.289***
SanMateo 0.027 0.026 0.026 0.023 0.029 -0.048 0.036 0.028 0.043SantaClara -0.048 -0.043 -0.049 -0.044 -0.049 -0.372** -0.058 -0.061 -0.042
Solano -0.372** -0.355** -0.358** -0.363** -0.379** -0.179** -0.352** -0.365** -0.358**Sonoma -0.179** -0.164* -0.166* -0.17** -0.185** -0.413** -0.177** -0.182** -0.166*
Sutter -0.413** -0.396** -0.397** -0.404** -0.425** -0.121* -0.4** -0.406** -0.397**
Ventura -0.121* -0.105^ -0.108^ -0.111* -0.123* -0.249* -0.115* -0.12* -0.106^Yolo -0.249* -0.229* -0.227* -0.238* -0.261* -0.408** -0.281* -0.281* -0.24*
Yuba -0.408** -0.391** -0.392** -0.399** -0.42** -44.396*** -0.386** -0.404** -0.399**

60
Amongourrailtransitmeasures,theindicatorforbeingwithinathirdofamileofarailstopisweaklysignificantandshowsaneffectofraisingprojectcostsbyanaverageof4.7%.Noothermeasuresoftransitproximityaresignificant.AswiththeOLSregressions,ourjobs-housingbalancemetricsarehighlysignificantandshowapositiveeffectwhilejobshousingfitandparticipationintheTODprogramshownosignificanteffects.Thelog-likelihoodtestp-valuesforallninemodelsplusthebaselinemodelareinsignificant,indicatingthatthesemodelspecificationshavecorrectedthespatialautocorrelation.TheRhovalues,whichindicatetheimpactofthespatiallag,rangebetween.20and.26,buttheRhoisstatisticallysignificantinonlyonecase(Model7).Models7and9alsoperformbestaccordingtotheAkaikeInformationCriteria(AIC),despiteparticipationintheTODProgram(Model9)beingstatisticallyinsignificant.
GeographicallyWeightedRegressionResults
OurnextstepwastoincludethevariablesspecifiedinModels7and8inourgeographicallyweightedregression(GWR)analysis.GWRishelpfulforunderstandinghowcostsvaryacrossspace.WhenusingOLS,weassumethattheestimatedcoefficientsremainthesameacrossaregion;GWRallowstheestimatedcoefficientstovarywithintheregion(151).Whilepromising,wepresenttheseresultscautiously—whatisimportanthereishowthereportedcoefficienteithergrowsorshrinksacrossspace,ratherthanwhatitsabsolutevalueis.
ThevariationincoefficientresultsforModel7andModel8arepresentedinTable10.DuetotheincreasedimportanceofspaceincalculatingcoefficientsinGWR,modelscanbeeasilyover-specifiediftoomanyspatiallyauto-correlatedvariablesareincluded.Theinclusionofsetsofindicatorvariablesrepresentingdifferentgroups,likepopulationsserved,canalsopresentproblemsforthisapproach.Thus,themodelsinthissubsectiononlyretainthevariablesfrompreviouslypresentedmodelsthatdonotintroducethesecomplications.
AscoefficientsvaryacrossspaceinGWR,Table10presentssummarystatisticsforeachofthecoefficientsinthemodel.The“Global”columnonthefarrightendofTable10istheoverallcoefficientforthevariablefortheregionasawhole.Theestimatedcoefficientsforjobs-housingbalancewithina2.5mileradiusofaprojectarepositivewhenmeasuredat80%oftheobservations.Surprisingly,averageaffordabilityisalsomeasuredashavingapositiveeffectatnearlyaquarteroftheobservations.Atoveraquarterofthelocationsinthesample,commercialsquarefootageregistersanegativecoefficient.Theeffectoftheprevailingwageisuniformlypositive,buttheeffectdiffersspatially,withthemaximumeffectover100%greaterthantheminimum.

61
Table10:GeographicallyWeightedRegressionForModel7,Job-HousingBalance(2.5MileBuffer)
Minimum 1stQuantile Median 3rd
Quantile Max Global
Model7Intercept -119.7 -103.6 -39.79 -28.8 -19.38 -58.924LogTotalUnits -0.293 -0.242 -0.217 -0.148 -0.068 -0.182HasPrevailingWage 0.109 0.153 0.179 0.217 0.263 0.204AverageAffordability -0.014 -0.006 -0.002 0 0.002 -0.004ResidentialSquareFeetPerUnit 0.009 0.023 0.028 0.038 0.056 0.03CommonAreaSquareFeet 0 0.001 0.002 0.003 0.006 0.003CommercialSquareFeet -0.109 -0.022 0.029 0.067 0.086 0.054Year 0.016 0.021 0.026 0.058 0.066 0.036LogParkingSpaces -0.04 0.005 0.031 0.049 0.1 0.005UndergroundParking -0.019 0.058 0.075 0.1 0.3 0.125Jobs-HousingBalance(2.5Miles) -0.015 0.005 0.031 0.036 0.086 0.022
Model8
Intercept -65.09 -64.86 -33.57 -30.16 -29.71-
56.0425LogTotalUnits -0.252 -0.251 -0.235 -0.175 -0.174 -0.182PaidPrevailingWage 0.158 0.161 0.163 0.205 0.206 0.199AverageAffordability -0.006 -0.006 -0.002 -0.002 -0.002 -0.005ResidentialSquareFeetPerUnit 0.02 0.021 0.023 0.032 0.032 0.031CommonAreaSquareFeet 0.002 0.002 0.003 0.003 0.003 0.003CommercialSquareFeet 0.028 0.03 0.031 0.062 0.063 0.056Year 0.021 0.022 0.023 0.039 0.04 0.034ParkingSpaces 0.005 0.006 0.031 0.046 0.047 0.005UndergroundParking 0.081 0.082 0.081 0.13 0.132 0.116Jobs-HousingBalance(5Miles) 0.058 0.06 0.071 0.072 0.077 0.065
ModelDiagnostics Model7 Model8 AICc -71.24 -158.71
AIC -93.19 -238.29 ResidualSumofSquares 23.19 15.91 Quasi-GlobalR^2 0.4499 0.622

62
Wecanmapthespatialvariationthecoefficientsofthesevariablesacrossspace.Thishelpsustounderstandhowtheimportanceofthevariablesinimpactingdevelopmentcostsvariescrossspace.Theimportanceintheseresultsisnotnecessarilytheactualcoefficientsatdifferentpointsinspace,buttheireffectsrelativetootherregions.Figure25presentsthespatialvariationintheeffectofJobs-HousingBalancewithin2.5milesofsites’censustracts.Theeffectofjobs-housingbalanceonhousingcosts(ata2.5milebuffer)ishighestinSanDiegoCountyandalongthefringesofRiversideCountyinthesouth.Inthenorth,theeffectishigherinSantaClaraCountyandSanFranciscoCity,butapproacheszerointhenorthernsuburbsofSanFrancisco,theEastBayinandaroundOaklandproperandmuchofthegreaterSacramentoArea.Allthingsequal,jobshousingbalanceincreasesthecostofaffordablehousingproductioncostsinSanDiego,SantaClaraandSanFranciscocounties,whileitdoesnotappeartoeffectcostsinSacramentoandtheEastBay.
Figure25:SpatialVariationinJobs-HousingBalance(2.5MileBuffer)CoefficientinGeographicallyWeightedRegression
TheeffectsofcommercialsquarefootagearepresentedinFigure26.TheinclusionofcommercialspaceinprojectsappearstohaveanegativeimpactwithintheLosAngelesarea,

63
andregistersthestrongestpositiveeffectsintheSanFranciscoBayAreaandSacramento.CommercialsquarefeetregistersaweakpositiveeffectonhousingcostsinthecountiessouthofLosAngeles:Orange,SanDiego,RiversideandImperial.ThenegativeeffectinandarounddowntownLosAngelescouldmeanthattheinclusionofcommercialspaceinsomeprojectsthereenableddeveloperstosecurebetterlendingtermsoverallfortheirprojectsifdemandforcommercialspacewashighthere.
Figure26:SpatialVariationinCommercialSquareFootageCoefficientinGeographicallyWeightedRegression
ThespatialpatternintheeffectofaverageaffordabilityispresentedinFigure27.Recallthatthehighertheaverageaffordability,theshallowerthesubsidythatisrequired.Thus,inareaswherethecoefficientisnegative,deepersubsidiesarepresumablyincreasingdevelopmentcostswhileapositivecoefficientsuggestsdeepaffordabilitytherecorrelateswithreducedprojectcosts.Whilethisseemscounter-intuitive,asingleSROsorseniorprojectcouldexertthiseffectinanarea.
DepthofaffordabilityisraisingcostsmostdramaticallyinSantaClaraCounty,homeofSiliconValley,andmuchoftheSacramentoregion.Theeffectofthisvariableisclosertozerooreven
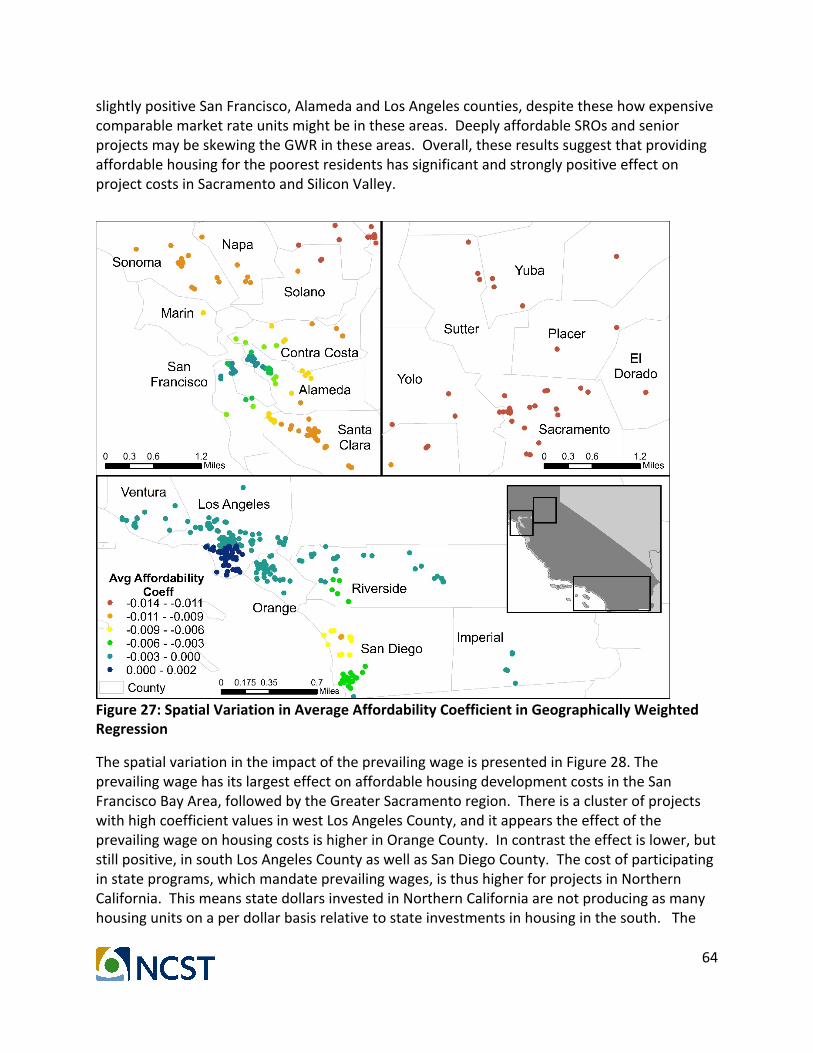
64
slightlypositiveSanFrancisco,AlamedaandLosAngelescounties,despitethesehowexpensivecomparablemarketrateunitsmightbeintheseareas.DeeplyaffordableSROsandseniorprojectsmaybeskewingtheGWRintheseareas.Overall,theseresultssuggestthatprovidingaffordablehousingforthepoorestresidentshassignificantandstronglypositiveeffectonprojectcostsinSacramentoandSiliconValley.
Figure27:SpatialVariationinAverageAffordabilityCoefficientinGeographicallyWeightedRegression
ThespatialvariationintheimpactoftheprevailingwageispresentedinFigure28.TheprevailingwagehasitslargesteffectonaffordablehousingdevelopmentcostsintheSanFranciscoBayArea,followedbytheGreaterSacramentoregion.ThereisaclusterofprojectswithhighcoefficientvaluesinwestLosAngelesCounty,anditappearstheeffectoftheprevailingwageonhousingcostsishigherinOrangeCounty.Incontrasttheeffectislower,butstillpositive,insouthLosAngelesCountyaswellasSanDiegoCounty.Thecostofparticipatinginstateprograms,whichmandateprevailingwages,isthushigherforprojectsinNorthernCalifornia.ThismeansstatedollarsinvestedinNorthernCaliforniaarenotproducingasmanyhousingunitsonaperdollarbasisrelativetostateinvestmentsinhousinginthesouth.The
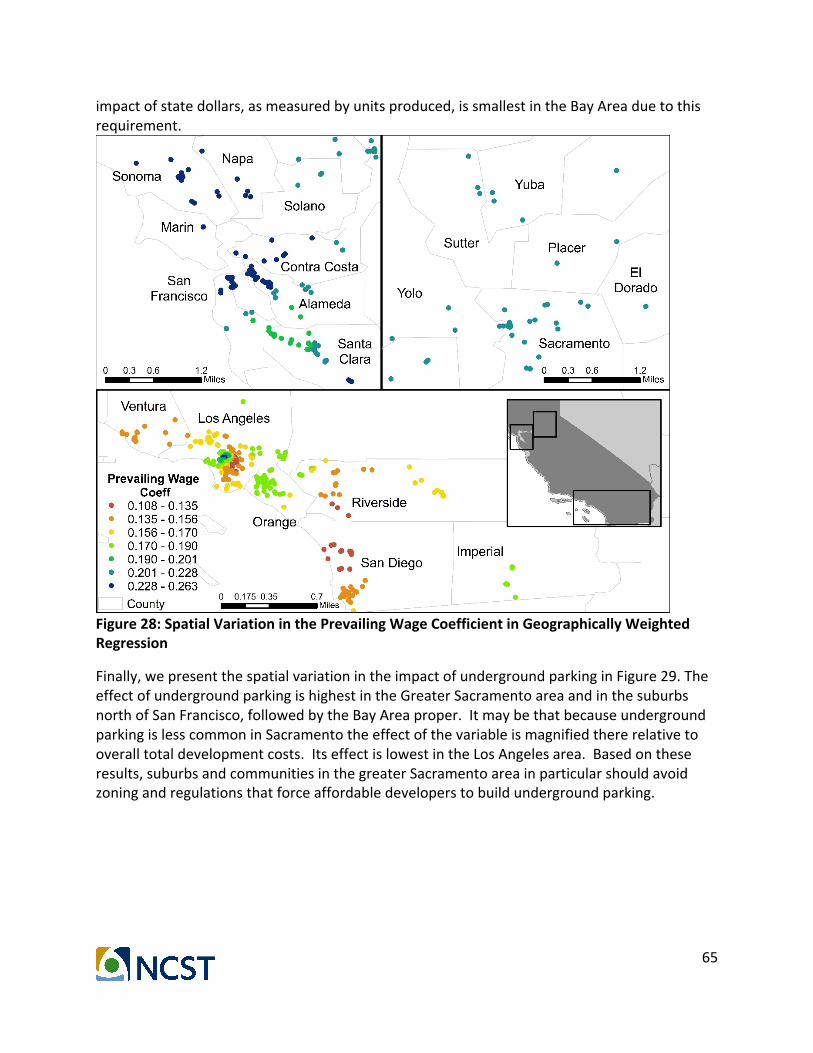
65
impactofstatedollars,asmeasuredbyunitsproduced,issmallestintheBayAreaduetothisrequirement.
Figure28:SpatialVariationinthePrevailingWageCoefficientinGeographicallyWeightedRegression
Finally,wepresentthespatialvariationintheimpactofundergroundparkinginFigure29.TheeffectofundergroundparkingishighestintheGreaterSacramentoareaandinthesuburbsnorthofSanFrancisco,followedbytheBayAreaproper.ItmaybethatbecauseundergroundparkingislesscommoninSacramentotheeffectofthevariableismagnifiedthererelativetooveralltotaldevelopmentcosts.ItseffectislowestintheLosAngelesarea.Basedontheseresults,suburbsandcommunitiesinthegreaterSacramentoareainparticularshouldavoidzoningandregulationsthatforceaffordabledeveloperstobuildundergroundparking.
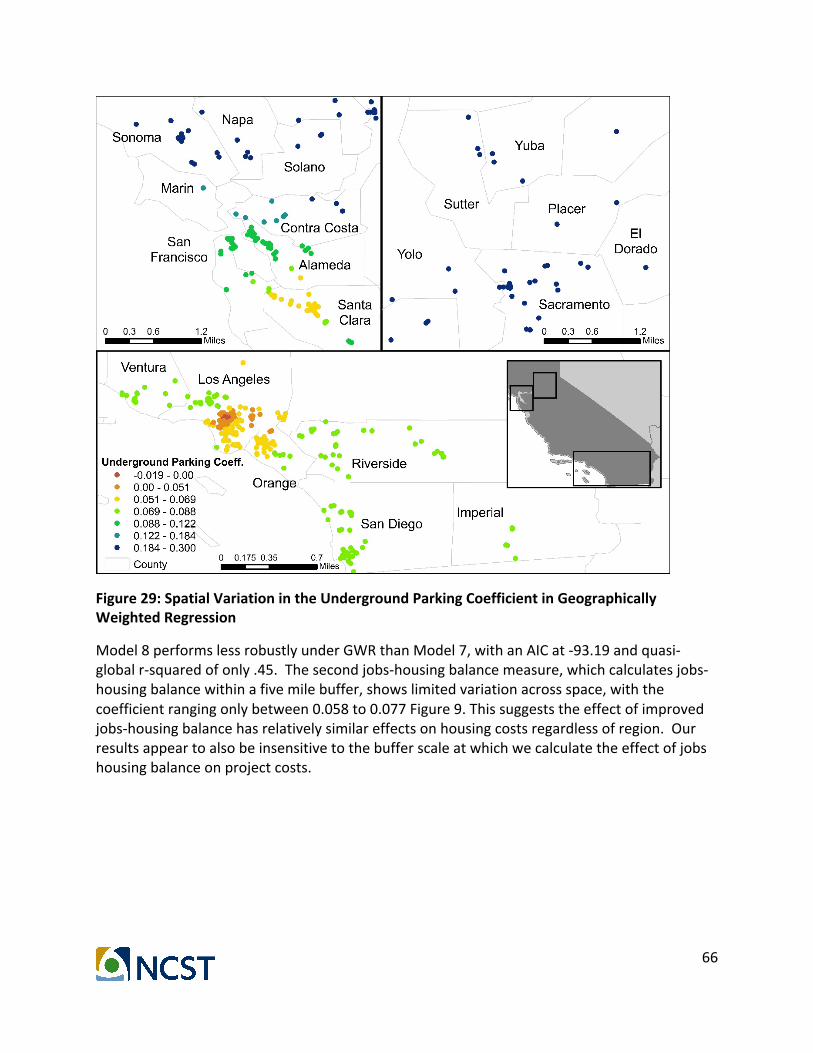
66
Figure29:SpatialVariationintheUndergroundParkingCoefficientinGeographicallyWeightedRegression
Model8performslessrobustlyunderGWRthanModel7,withanAICat-93.19andquasi-globalr-squaredofonly.45.Thesecondjobs-housingbalancemeasure,whichcalculatesjobs-housingbalancewithinafivemilebuffer,showslimitedvariationacrossspace,withthecoefficientrangingonlybetween0.058to0.077Figure9.Thissuggeststheeffectofimprovedjobs-housingbalancehasrelativelysimilareffectsonhousingcostsregardlessofregion.Ourresultsappeartoalsobeinsensitivetothebufferscaleatwhichwecalculatetheeffectofjobshousingbalanceonprojectcosts.

67
Figure30:SpatialVariationintheJobs-HousingBalance(5MileBuffer)CoefficientinGeographicallyWeightedRegression
Aswiththepreviousjobs-housingbalancemetric,theimpactofthismeasureishighestinSanDiegoCountyandtheInlandEmpire,andislowestintheSanFranciscoBayArea.Thedifferencebetweenthetwojobs-housingbalancemeasuresmaybeinthenatureofthespatialconcentrationofjobsacrossthesefourregions.However,thattheyshowsimilartrendsacrossthestatelendsconfidencetoouranalysis.Regardlessofthebufferdistanceusedonjobs-housingbalance,policiespushingaffordablehousingtolocateinjobsrichareaswillhaveagreaterimpactoncostsinmoresuburbancountieslikeRiversideandSanDiegothanintheBayArea.

68
ComparingModels’EffectivenessAccordingtoboththeAkaikeInformationCriteriaandresidualsumofsquares,traditionalordinaryleastsquares(OLS)withspatialindicatorvariablesperformedbestforthetwomodelswetestedwithallthreetechniques.Geographicallyweightedregression(GWR)explainedtheleastamountofvariabilityinthedata.ThesemodeldiagnosticsarepresentedinTable11.
Table11:ComparingSpatialModelingApproachesWithRSSAndAIC
OLS
SpatialLag GWR
Model713.68 14.71 15.91-272.7 -256.58 -238.29
Model813.82 14.85 23.19-267.7 -252.1 -93.19
Thesefindingscorroboratetheconclusionsofotherswhohaveexaminedtherelativeeffectivenessofspatialapproachesinmodelinghousingmarkets(150).WhetherwechoosethemoreefficientbutbiasedOLS(duetospatialautocorrelation),ortheunbiasedbutlessefficientspatiallagapproach,thekeyindependentvariablesofinterestyieldcoefficientswiththesamesignsandsignificancelevels,inspiringconfidenceintherobustnessofthefindings.
Conclusions
Wedonotfindthatthestate’sfocusofprioritizingaffordablehousingintegrationwithrailtransitandjobaccessisincreasingthecostsofprovidingaffordablehousing.Noneofourmeasuresofrailtransitorjobaccesssignificantlyaffectdevelopmentcosts(perunit),withtheexceptionofjobs-housingbalance.Aoneunitincreaseinthejobs-housingbalancewithin2.5milesofaproject’scensustractincreasesdevelopmentcostsby2.9%,whileaoneunitincreaseinthejobs-housingbalancewithin5milesofaprojectincreasesdevelopmentcostsbyover5%.ThemagnitudeoftheseeffectsisgreaterinsouthernCalifornia,particularlyinSanDiegoCounty.WithinnorthernCalifornia,theeffectsaregreatestinSantaClaraCounty(SiliconValley).Theseresultsareintuitive,asjobsgrowthhasbeenidentifiedasaprimarydriverofincreasinghousingcostsinthatregion(152).Buttheseresultsshouldnotbringdismay,thatmovingfromacommunitywithonejobperhousingunittotwojobsperhousingunitwill,onaverage,increasecostsatorunder5%isasmallpriceforadramaticincreaseinjobaccessibility.
Ourcostmodelsconfirmpreviousanalysisthatsuggestseconomiesofscaleexistinaffordablehousingdevelopment:asthenumberofunitsrises,perunitcostdeclines.Wefindthatincludingcommercialspaceonsitesincreasescosts,althoughthiseffectisweakerorpotentiallyreversedinandarounddowntownandwestLosAngeles.Wefindthatadheringtoprevailingwagelawsincreasesdevelopmentcostsby15%onaverage,withtheeffecthigherintheSanFranciscoBayAreaandlowerinSouthernCalifornia.Undergroundparkingsignificantlyincreasescostsaswell.
69
Wefoundaverythinbodyofresearchestimatingthedriversofaffordablehousingprojectcosts.Giventhevolumeoftaxdollarsexpendedonsupplysideaffordablehousingconstructionprograms,additionalresearchshouldrefineandexpandonthemodelspresentedhereandelsewhereintheliterature.Thisanalysisshouldfocusontheroleofregulatoryrequirementsandincentivesplacedoncompetitivelyallocatedsubsidiesforaffordablehousingincludingandbeyondtheprevailingwageandlocationalimpactsmeasuredhere.
Limitations
Wepreferredtoincludesomesortofindexedvariableofminimumparkingrequirementsforsites,inlinewiththeliterature(102).However,intheTCACapplicationsmanyapplicantslistedthetotalnumberofparkingspacesprovidedinsteadoftheminimumparkingrequirementsdespiteclearinstructionsrequiringtheregulatoryinformation.Asaresult,wecouldonlyusethetotalnumberofparkingspacesrequired,althoughwefoundthisvariabletobestronglyco-linearwiththetotalnumberofunits(correlation.71),makingusuncertainitwouldproducesignificantresults.Wewerealsounabletoidentifyprojects’actualheightsoridentifyanyvariablesonmaterialquality,whichhavebeenfoundtohaveasignificantandpositiveeffectsonprojectcosts(21,22).
ConclusionsThisreportoffersnewinsightsontheperformanceofaffordablehousingpoliciesandprogramsthataredesignedtomovesustainabletransportationgoalsforward.Itiscrucialthatfederal,stateandregionalpoliciesarecoordinatedtoaddressthespatialimbalancesbetweenthelocationsofjobsandhousing,asthiswilllessenresidents’commuteburdensandvehiclemilesoftravel(1,2).Whilechallengesremain,thepromiseofCalifornia’sSB375toimproveregionalcommuteandhousingcostoutcomesislargelyvalidatedbythisresearch,assumingtherequisitepolicyrecommendationsareinplace.
There-scalingofhousingvoucherthresholdsholdsthepotentialtodramaticallyimprovethelandscapeforvoucherrecipients,increasingthenumberofunitstheycanaffordtoaccessinjobsandtransitrichcommunities.Butthiscomesataclearcost:areductioninoverallunitsaccessibletovoucherholders,anddramaticlossesofvoucheraccessinneighborhoodscurrentlyaffordabletovoucherholders.ThisanalysiswillprovevaluabletotheDepartmentofHousingandUrbanDevelopment,localpublichousingauthorities,localgovernmentsandlocaladvocacyorganizationsallconcernedwithoptimizingtheeffectivenessofhousingvoucherprograms.Additionalanalysisshouldexplorehowthispolicychangemayaffectoneotheraspectofvoucherrecipientshousingexperience:namelytheabilitytoaccesshigherqualityunits.
Affordablehousingproximatetorail,doesnotshowsignsofbeingsystematicallymoreexpensivethanotherprojects,offeringhopethatfurtherintegrationofhousingandtransportationplanningmaynotbeasexpensiveastheliteraturesometimessuggests.WealsoshowedinChapter4thatotherpolicyfactorsmayactuallybemorepronouncedindrivingaffordablehousingcostsupward,likemandatorycommonareas,parkingrequirements,mixedusedevelopmentandprevailingwagerequirements.Affordablehousingdevelopers,financiers

70
andagencies,bothinandoutsideofCalifornia,canbenefitfromthisresearch,whichwillhopefullyinspireothermoredetailedexaminationsofaffordablehousingdevelopmentcosttrends.
Whiletheresultsofthisreportarepromising,cautioniswarranted.ProfessionalsinthefieldofaffordablehousinghavedescribedthepolicyprocessinCalifornialike“aChristmasTree”or“thecenterofthespokesonabicycle”anecdotallywhenprovidingfeedbackonthisreport.WhattheymeanisthatfornewhousingfundingtobeapprovedinCalifornia,itmustalwaysintersectwiththeinterestsofotherpoliticalcoalitionsconcernedwithtransit,foodaccess,airquality,solarpower,education,publichealth,racialjusticeorimmigrants’rights,tonamejustafew.Inthecoalitionbuildingprocess,thefocusonsimplyprovidingadequate,affordableandavailablehousingcanbelost.Thiscanmeancostsriseandbothstateeffortandfundingcanbewasted.Thesignificanceoftheseresultsandthepromisetheyofferforintegratingaffordablehousingwithsustainabletransportationdonotundermineinanyway,thefacttheprimarypurposeoftheprogramsstudiedherearetohousepeoplewhowouldotherwisebeseverelyrentburdenedorhomeless.
71
References1. Karner,A.,andC.Benner.95thAnnualMeetingoftheTransportationResearchBoard:
NationalAcademyofSciences,2016.2. Ma,K.-R.,andD.Banister.Extendedexcesscommuting:Ameasureofthejobs–housing
imbalanceinSeoul.UrbanStud.,Vol.43,No.11,2006,pp.2099–2113.Availableat:http://usj.sagepub.com/cgi/doi/10.1080/00420980600945245.
3. Ewing,R.,andR.Cervero.TravelandtheBuiltEnvironment:ASynthesis.Transp.Res.Rec.J.Transp.Res.Board,Vol.1780,No.3,2001,pp.87–114.Availableat:http://trrjournalonline.trb.org/doi/abs/10.3141/1780-10.
4. Salon,D.,M.G.Boarnet,S.Handy,S.Spears,andG.Tal.HowdolocalactionsaffectVMT?Acriticalreviewoftheempiricalevidence.Transp.Res.partDTransp.Environ.,Vol.17,No.7,2012,pp.495–508.
5. Campora,G.A.SenateBill375(SB375)Chapter728,Statuesof2008.Sacramento,2013.Availableat:http://www.hcd.ca.gov/hpd/SB375/sb375_final100413.pdf.
6. Pendall,R.,andL.Hendey.ABriefLookattheEarlyImplementationofChoiceNeighborhoods.Washington,D.C.,2013.Availableat:http://www.urban.org/sites/default/files/alfresco/publication-pdfs/412940-A-Brief-Look-at-the-Early-Implementation-of-Choice-Neighborhoods.PDF.
7. Smith,R.etal.MonitoringSuccessinChoiceNeighborhoods :AProposedApproachtoPerformanceMeasurement.2010.
8. HUD.NoticeofFundingAvailability(NOFA)forFiscalYear(FY)2010Section811SupportiveHousingforPersonswithDisabilitiesProgram.2010.Availableat:http://archives.hud.gov/funding/2010/811nofa.pdf.
9. HUD.NoticeofFundingAvailability(NOFA)forHUD’sFiscalYear2010Section202SupportiveHousingfortheElderlyProgram.2010.
10. Handy,S.,X.J.Cao,andP.L.Mokhtarian.Correlationorcausalitybetweenthebuiltenvironmentandtravelbehavior?EvidencefromNorthernCalifornia.Transp.Res.PartDTransp.Environ.,Vol.10,No.6,2005,pp.427–444.
11. Brownstone,D.,andT.F.Golob.Theimpactofresidentialdensityonvehicleusageandenergyconsumption.J.UrbanEcon.,Vol.65,No.1,2009,pp.91–98.Availableat:http://www.sciencedirect.com/science/article/pii/S0094119008001095.
12. Ewing,R.,S.Hamidi,F.Gallivan,A.C.Nelson,andJ.B.Grace.StructuralequationmodelsofVMTgrowthinUSurbanisedareas.UrbanStud.,Vol.51,No.14,2014,pp.3079–3096.Availableat:http://usj.sagepub.com/content/early/2014/02/10/0042098013516521.abstract.
13. Heres-Del-Valle,D.,andD.Niemeier.CO2emissions:Areland-usechangesenoughforCaliforniatoreduceVMT?Specificationofatwo-partmodelwithinstrumentalvariables.Transp.Res.PartBMethodol.,Vol.45,No.1,2011,pp.150–161.Availableat:http://www.sciencedirect.com/science/article/pii/S0191261510000536.
14. Lee,J.-S.,J.Nam,andS.-S.Lee.BuiltEnvironmentImpactsonIndividualModeChoice:AnEmpiricalStudyoftheHouston-GalvestonMetropolitanArea.Int.J.Sustain.Transp.,Vol.8,No.6,2014,pp.447–470.Availableat:
72
http://dx.doi.org/10.1080/15568318.2012.716142.15. Hong,J.,Q.Shen,andL.Zhang.Howdobuilt-environmentfactorsaffecttravel
behavior?Aspatialanalysisatdifferentgeographicscales.Transportation(Amst).,Vol.41,No.3,2014,pp.419–440.Availableat:http://dx.doi.org/10.1007/s11116-013-9462-9.
16. Balauce,J.,R.Cervero,andM.Duncan.WhichReducesVehicleTravelMore:Jobs-HousingBalauceorRetail-HousingMixing?2004,pp.475–491.
17. Horner,M.W.HowDoesIgnoringWorkerClassAffectMeasuringtheJobs-HousingBalance?Transp.Res.Rec.,Vol.2163,2010,pp.57–64.
18. Marion,B.,andM.W.Horner.ComparisonofSocioeconomicandDemographicProfilesofExtremeCommutersinSeveralU.S.MetropolitanStatisticalAreas.Transp.Res.Rec.,Vol.2013,No.-1,2008,pp.38–45.
19. CTCAC.CALIFORNIATAXCREDITALLOCATIONCOMMITTEEREGULATIONSIMPLEMENTINGTHEFEDERALANDSTATELOWINCOMEHOUSINGTAXCREDITLAWS.2015,pp.87.
20. AHSCStaff.2015-2016AffordableHousingandSustainableCommunitiesProgram.Sacramento,CA,2015.Availableat:https://www.sgc.ca.gov/docs/Draft_2015-16_Affordable_Housing_and_Susatainable_Communities_Program_Guidelines.pdf.
21. AffordableHousingCostStudy.Sacramento,CA,2014.Availableat:http://www.hcd.ca.gov/hpd/docs/FinalAffordableHousingCostStudyReport-with-coverv2.pdf.
22. 2015CostContainmentReport.St.Paul,MN,2015.23. Funderburg,R.G.,H.Nixon,M.G.Boarnet,andG.Ferguson.Newhighwaysandlanduse
change:Resultsfromaquasi-experimentalresearchdesign.Transp.Res.PartAPolicyPract.,Vol.44,No.2,2010,pp.76–98.Availableat:http://linkinghub.elsevier.com/retrieve/pii/S0965856409001232.
24. Guiliano,G.TheGeographyofUrbanTransport,edsHansonS,GuilianoG2004.25. Cervero,R.,andJ.Landis.TwentyyearsoftheBayAreaRapidTransitSystem:Landuse
anddevelopmentimpacts.Transp.Res.PartAPolicyPract.,Vol.31,No.4,1997,pp.309–333.Availableat:http://www.sciencedirect.com/science/article/pii/S0965856496000274.
26. Cervero,R.Jobs-housingbalancerevisited:trendsandimpactsintheSanFranciscoBayArea.J.Am.Plan.Assoc.,Vol.62,No.4,1996,pp.492–511.
27. Giuliano,G.ISJOBS-HOUSINGBALANCEATRANSPORTATIONISSUE?Transp.Res.Rec.,No.1305,1991,.
28. Horner,M.,andA.Murray.AMulti-objectiveApproachtoImprovingRegionalJobs-HousingBalance.Reg.Stud.,Vol.37,No.2,2003,pp.135–146.Availableat:http://www.tandfonline.com/doi/abs/10.1080/0034340022000057514[AccessedDecember17,2014].
29. Wilson,W.J.TheTrulyDisadvantaged.UniversityofChicagoPress,Chicago,1987.30. Roberto,E.CommutingtoOpportunity:TheWorkingPoorandCommutingintheUnited
State.Washington,D.C.,2008.Availableat:http://web.stanford.edu/group/scspi/_media/pdf/key_issues/transportation_policy.pdf.
73
31. Schleith,D.,andM.Horner.Commuting,JobClusters,andTravelBurdens.Transp.Res.Rec.J.Transp.Res.Board,Vol.2452,2014,pp.19–27.Availableat:http://trrjournalonline.trb.org/doi/10.3141/2452-03.
32. McClure,K.KirkMcClure’s“Thelow-incomehousingtaxcreditprogramgoesmainstreamandmovestothesuburbs.”Hous.PolicyDebate,Vol.17,No.3,2006,pp.461–472.Availableat:http://search.proquest.com/docview/36861314?accountid=13042\nhttp://oxfordsfx.hosted.exlibrisgroup.com/oxford?url_ver=Z39.88-2004&rft_val_fmt=info:ofi/fmt:kev:mtx:journal&genre=article&sid=ProQ:ProQ:ibssshell&atitle=Kirk+McClure’s+'The+low-income+hou.
33. Freeman,L.SitingAffordableHousing :LocationandNeighborhoodTrendsofLowIncomeHousingTaxCreditDevelopmentsinthe1990s.Washington,D.C.,2004.Availableat:http://www.brookings.edu/research/reports/2004/04/metropolitanpolicy-freeman.
34. Dawkins,C.TheSpatialPatternofLowIncomeHousingTaxCreditProperties:ImplicationsforFairHousingandPovertyDeconcentrationPolicies.J.Am.Plan.Assoc.,Vol.79,No.3,2013,pp.222–234.Availableat:10.1080/01944363.2014.895635.
35. McClure,K.Arelow-incomehousingtaxcreditdevelopmentslocatingwherethereisashortageofaffordableunits?Hous.PolicyDebate,Vol.20,No.2,2010,pp.153–171.Availableat:http://dx.doi.org/10.1080/10511481003738260.
36. Hollar,M.,andK.Usowski.Low-IncomeHousingTaxCreditQualifiedCensusTracts.CityscapeAJ.PolicyDev.Res.,Vol.9,No.3,2007,pp.153–160.
37. Lang,B.J.Locationincentivesinthelow-incomehousingtaxcredit:Arequalifiedcensustractsnecessary?J.Hous.Econ.,Vol.21,No.2,2012,pp.142–150.Availableat:http://linkinghub.elsevier.com/retrieve/pii/S105113771200023X.
38. HUD.ObamaAdministrationAnnounes$749MilliontoFundHousingForVeryLow-IncomeSeniorsandPersonsWithDisabilities.hud.gov,2011,Availableat:http://portal.hud.gov/hudportal/HUD?src=/press/press_releases_media_advisories/2011/HUDNo.11-266[AccessedJanuary5,2016].
39. USGBC.LEED.U.S.GreenBuild.Counc.,2015,Availableat:http://www.usgbc.org/leed#rating[AccessedJanuary5,2016].
40. Harrell,R.PreservingAffordabilityandAccessinLivableCommunities:SubsidizedHousingOpportunitiesNearTransitandthe50+Population.Washington,D.C.,.
41. HUD.NoticeofFundingAvailability(NOFA)forHUD’sFiscalYear2011HOUSINGOPPORTUNITIESFORPERSONSWITHAIDS(HOPWA).2011.Availableat:http://archives.hud.gov/funding/2011/hopwanofa.pdf.
42. Bania,N.,C.Coulton,andL.Leete.PublicHousingAssistance,PublicTransportation,andtheWelfare-to-WorkTransition.CityscapeAJ.PolicyDev.Res.,Vol.6,No.2,2003,pp.7–44.
43. Song,W.,andK.Keeling.GeospatialTechnologiesandAdvancingGeographicDecisionMaking:IssusandTrends,edAlbertDP2012.
44. McClure,K.Section8andMovementtoJobOpportunity:ExperienceafterWelfareReforminKansasCity.Hous.PolicyDebate,Vol.15,No.1,2004,pp.99–131.Availableat:http://www.tandfonline.com/doi/abs/10.1080/10511482.2004.9521496.

74
45. Mcclure,K.TheforGuidingProspectsChoiceVoucherHousingtoHighNeighborhoodsHouseholdsOpportunity.Vol.12,No.3,2014,pp.101–122.
46. Kahn,P.B.,andG.B.Newton.TheSmallAreaFMRDemonstration.Cityscape,Vol.15,No.1,2013,pp.325–328.
47. Collinson,R.,andP.Ganong.IncidenceandPriceDiscrimination :EvidencefromHousingVouchers.2013.
48. Susin,S.RentVouchersandthePriceofLow-IncomeHousing.Berkeley,CA,1999.Availableat:http://escholarship.org/uc/item/67d5x29s.
49. Rydell,C.P.SupplyResponsetotheHousingAllowanceProgram.SantaMonica,CA,1981.Availableat:https://www.rand.org/content/dam/rand/pubs/notes/2007/N1338.pdf.
50. DiPasquale,D.,D.Fricke,andD.Garcia-Diaz.ComparingtheCostsofFederalHousingAssistancePrograms.Washington,D.C.,2002.Availableat:http://www.cityresearch.com/reports/FederalHousingPrograms.pdf.
51. Shroder,M.,andA.Reiger.VouchersversusProductionRevisited.J.Hous.Res.,Vol.11,No.1,2000,pp.91–107.
52. Johnson,M.PovertyDeconcentrationPrioritiesinLow-IncomeHousingPolicy:AContentAnalysisofLow-IncomeHousingTaxCredit(LIHTC)QualifiedAllocationPlans.VirginiaCommonwealthUniversity,2014.Availableat:http://scholarscompass.vcu.edu/cgi/viewcontent.cgi?article=4399&context=etd.
53. Johnson,M.HandbookonPovertyintheUnitedStates,edsHaymesS,VidaldeHaymesM,MillerR2014.
54. Ellen,I.,K.Horn,Y.Kuai,R.Pazuniak,andM.D.Wiliams.EffectofQAPIncentivesontheLocationofLIHTCProperties.FallsChurch,VA,2015.
55. Fischel,W.Aneconomichistoryofzoningandacureforitsexclusionaryeffects.UrbanStud.,Vol.41,No.2,2004,pp.317–340.
56. Ihlanfeldt,K.Exclusionaryland-useregulationswithinsuburbancommunities:areviewoftheevidenceandpolicyprescriptions.UrbanStud.,Vol.41,No.2,2004,pp.261–283.Availableat:http://usj.sagepub.com/cgi/doi/10.1080/004209803200165244[AccessedJune11,2015].
57. Horner,M.W.SpatialDimensionsofUrbanCommuting:AReviewofMajorIssuesandTheirImplicationsforFutureGeographicResearch�.Prof.Geogr.,Vol.56,No.2,2004,pp.160–173.
58. Raphael,S.,andM.A.Stoll.JobSprawlandtheSuburbanizationofPoverty.Washington,D.C.,2010.
59. Cervero,R.,andM.Duncan.Neighbourhoodcompositionandresidentiallandprices:doesexclusionraiseorlowervalues?UrbanStud.,Vol.41,No.2,2004,pp.299–315.Availableat:http://usj.sagepub.com/cgi/doi/10.1080/0042098032000165262.
60. Sherry,R.,andB.E.Enderle.Examiningspatialpatternsinaffordablehousing:thecaseofCaliforniadensitybonusimplementation.J.Hous.BuiltEnviron.,Vol.27,No.4,2012,pp.413–425.
61. Alcock,J.AnAnalysisofInclusionaryHousingProgramsinOrangeandSanDiegoCountiesTableofContents.UniversityofCalifornia,Davis,2005.

75
62. Mukhija,V.,L.Regus,S.Solvin,andA.Das.TheInclusionaryHousingExperienceinSouthernCalifornia :AnEvaluationoftheProgramsinLosAngelesandOrangeCounties.LosAngeles,2007.Availableat:http://164.67.163.139/Documents/areas/ctr/ziman/2008-14.pdf.
63. Calavita,N.,andK.Grimes.InclusionaryHousinginCalifornia:TheExperienceofTwoDecades.J.Am.Plan.Assoc.,Vol.64,No.2,1998,pp.150–169.Availableat:http://www.tandfonline.com/doi/abs/10.1080/01944369808975973[AccessedJune11,2015].
64. Fitzgerald,J.TheEffectofInclusionaryZoningOntheHousingMarket:EvidencefromCalifornia.GeorgetownUniversity,2010.Availableat:https://repository.library.georgetown.edu/bitstream/handle/10822/553726/fitzgeraldJulie.pdf?sequence=1.
65. Kontokosta,C.E.Doinclusionaryzoningpoliciesequitablydisperseaffordablehousing?Acomparativespatialanalysis.J.Hous.BuiltEnviron.,2015,pp.569–590.Availableat:http://link.springer.com/10.1007/s10901-014-9430-5.
66. Wegmann,J.,andK.Chapple.Hiddendensityinsingle-familyneighborhoods:backyardcottagesasanequitablesmartgrowthstrategy.J.Urban.Int.Res.PlacemakingUrbanSustain.,Vol.7,No.3,2014,pp.307–329.Availableat:http://dx.doi.org/10.1080/17549175.2013.879453.
67. Chapple,K.,J.Wegmann,A.Nemirow,andC.Dentel-Post.YesinMyBackyard:MobilizingtheMarketforSecondaryUnits.2011,Availableat:https://escholarship.org/uc/item/6fz8j6gx.
68. Talen,E.AffordabilityinNewUrbanistandStrategy.Vol.32,No.4,2010,pp.489–510.69. Madar,J.HousingChangingHouseholds:RegulatoryChallengesforMicro-Unitsand
AccssoryDewllingUnits.StanfordLawPolicyRev.,Vol.25,No.53,2014,pp.53–90.70. Remøy,H.T.,andT.J.M.VanDerVoordt.Anewlife:conversionofvacantoffice
buildingsintohousing.Facilities,Vol.25,No.3/4,2007,pp.88–103.71. Shaldjian,R.AssessingtheValidityofLinkingPrograms:ACaseStudyofDestin,Florida’s
InnovativeAttainableWorkforceHousingProgram.J.L.UseEnviron.Law,2009,pp.337–367.
72. HenningJr,J.A.MitigatingPriceEffectswithaHousingLinkageFee.Calif.LawRev.,Vol.78,No.3,1990,Availableat:http://scholarship.law.berkeley.edu/californialawreview/vol78/iss3/3.
73. NollanvCaliforniaCoastalCommission.1987.74. Dolanv.CityofTigard.1994.75. Goetz,E.Office-HousingLinkageinSanFrancisco.J.Am.Plan.Assoc.,Vol.55,No.1,
1989,pp.66–77.Availableat:http://www.tandfonline.com/doi/abs/10.1080/01944368908975403.
76. Huffman,F.,andM.Smith.MarketEffectsofOfficeDevelopmentLinkageFees.J.Am.Plan.Assoc.,Vol.54,No.2,1988,pp.217–224.Availableat:http://www.tandfonline.com/doi/abs/10.1080/01944368808976477.
77. Wheeler,S.AnnualConferenceoftheAssociationofCollegiateSchoolsofPlanning,2001.Availableat:

76
http://citeseerx.ist.psu.edu/viewdoc/download?doi=10.1.1.148.3024&rep=rep1&type=pdf.
78. Bertaud,A.,andJ.Brueckner.Analyzingbuilding-heightrestrictions:predictedimpactsandwelfarecosts.Reg.Sci.UrbanEcon.,Vol.35,2005,pp.109–125.
79. Kulish,M.,A.Richards,andC.Gillitzer.UrbanStructureandHousingPrices:SomeEvidenceFromAustralianCities.2011.Availableat:http://www.rba.gov.au/publications/rdp/2011/pdf/rdp2011-03.pdf.
80. Renne,J.L.,andR.Ewing.Transit-OrientedDevelopment:AnExaminationofAmerica’sTransitPrecinctsin2000&2010.2013,.
81. Nasri,A.,andL.Zhang.Theanalysisoftransit-orienteddevelopment(TOD)inWashington,D.C.andBaltimoremetropolitanareas.Transp.Policy,Vol.32,2014,pp.172–179.Availableat:http://linkinghub.elsevier.com/retrieve/pii/S0967070X14000055.
82. Cervero,R.TransportationTechnologiesforSustainability,2013.83. Transform,andCHPC.WhyCreatingandPreservingAffordableHomesNearTransitIsa
HighlyEffectiveClimateProtectionStrategytheStateCreatedtheCaliforniaHousingPartnershipCorpora-.SanFrancisco,2014.Availableat:http://www.transformca.org/sites/default/files/CHPCTFAffordableTODClimateStrategyBOOKLETFORMAT.pdf.
84. Popkin,S.J.etal.ADecadeofHOPEVI :ResearchFindingsandPolicyChallenges.2004.85. HOPESF.HopeSF.2014,Availableat:http://hope-sf.org/alice-griffith.php[Accessed
January4,2016].86. O.H.C.D.,C.O.P.ATTACHMENT39:CONCEPTUALSITEPLANDESIGN.Philadelphia,2014.
Availableat:http://www.pha.phila.gov/media/101228/att39conceptualdesign.pdf.87. SHA.ProjectInformationandReports.2014,Availableat:
http://seattlehousing.net/redevelopment/yesler-terrace/project-information-reports/[AccessedJanuary4,2016].
88. Turner,M.A.etal.EstimatingthePublicCostsandBenefitsofHOPEVIInvestments:MethodologicalReport.2007.Availableat:http://alexandriava.gov/uploadedFiles/planning/info/CostsandBenefitsofHOPEVI.pdf.
89. Sprowls,S.,N.Cataline,J.Brown,andK.C.Naungayan.EvaluationofCalifornia’sTransit-OrientedDevelopment(TOD)HousingandInfillInfrastructureGrant(IIG)Programs.Sacramento,2005.Availableat:http://www.mitod.org/pdf/Final_TOD-IIG_Report_April2011.pdf.
90. Eriksen,M.D.,andS.S.Rosenthal.Crowdouteffectsofplace-basedsubsidizedrentalhousing:NewevidencefromtheLIHTCprogram.J.PublicEcon.,Vol.94,No.11-12,2010,pp.953–966.Availableat:http://linkinghub.elsevier.com/retrieve/pii/S0047272710000885.
91. Wardrip,B.K.PublicTransit’sImpactonHousingCosts :InsightsFromHous.PolicyRes.,No.August,2011,.
92. Palm,M.,B.Gregor,H.Wang,andB.S.McMullen.Thetrade-offsbetweenpopulationdensityandhouseholds�transportation-housingcosts.Transp.Policy,Vol.36,2014,pp.160–172.Availableat:http://linkinghub.elsevier.com/retrieve/pii/S0967070X14001504[AccessedNovember3,2014].
77
93. Debrezion,G.,E.Pels,andP.Rietveld.TheImpactofRailwayStationsonResidentialandCommercialPropertyValue:AMeta-analysis.J.RealEstateFinanc.Econ.,Vol.35,No.2,2007,pp.161–180.Availableat:http://link.springer.com/10.1007/s11146-007-9032-z.
94. Duncan,M.TheImpactofTransit-orientedDevelopmentonHousingPricesinSanDiego,CA.UrbanStud.,Vol.48,No.1,2011,pp.101–127.Availableat:http://usj.sagepub.com/cgi/doi/10.1177/0042098009359958.
95. Hess,D.B.,andT.M.Almeida.ImpactofProximitytoLightRailRapidTransitonStation-areaPropertyValuesinBuffalo,NewYork.UrbanStud.,Vol.44,No.May2006,2007,pp.1041–1068.
96. Bowes,D.R.,andK.R.Ihlanfeldt.IdentifyingtheImpactsofRailTransitStationsonResidentialPropertyValues.J.UrbanEcon.,Vol.50,No.1,2001,pp.1–25.Availableat:http://www.sciencedirect.com/science/article/pii/S0094119001922144.
97. Knaap,G.J.,C.Ding,andL.D.Hopkins.DoPlansMatter ?TheEffectsofLightRailPlanson.J.Plan.Educ.Res.,Vol.21,No.1,2001,pp.32–39.
98. Welch,T.F.TheLong-TermPropertyValueEffectsofTransitInvestments :AComprehensiveMulti-MethodApproachWordCount :Submitt.toTransp.Res.Rec.,No.January,2015,pp.1–22.
99. Cohen,S.CommentsreCEQAStreamliningforInfillProjects(SB226).Oakland,CA,2012.Availableat:http://resources.ca.gov/ceqa/docs/226_Transform.pdf.
100. Heminger,S.USDOT-ECMTWorkshoponSustainableTravel,2003.Availableat:http://www.hud.gov/offices/cpd/about/conplan/pdf/mtc_housing_incentive_11-2003.pdf.
101. McDonnell,S.,J.Madar,andV.Been.MinimumparkingrequirementsandhousingaffordabilityinNewYorkCity.Hous.PolicyDebate,Vol.21,No.1,2011,pp.45–68.Availableat:http://www.tandfonline.com/doi/abs/10.1080/10511482.2011.534386.
102. Manville,M.,andD.Shoup.Parkingrequirementsasabarriertohousingdevelopment :regulationandreforminLosAngeles.LosAngeles,2010.
103. Shoup,D.TheHighCostofFreeparking.J.Plan.Educ.Res.,Vol.17,1997,pp.3–20.104. Weinberger,R.Deathbyathousandcurb-cuts:Evidenceontheeffectofminimum
parkingrequirementsonthechoicetodrive.Transp.Policy,Vol.20,2012,pp.93–102.Availableat:http://www.sciencedirect.com/science/article/pii/S0967070X11001028.
105. TransForm.GREENTRIP.2015,Availableat:http://www.transformca.org/landing-page/greentrip[AccessedJanuary4,2016].
106. Scally,C.P.,andJ.R.Tighe.DemocracyinAction?:NIMBYasImpedimenttoEquitableAffordableHousingSiting.Hous.Stud.,Vol.00,No.0,2015,pp.1–21.Availableat:http://www.tandfonline.com/doi/full/10.1080/02673037.2015.1013093[AccessedJune8,2015].
107. Curry,M.GovernorSignsBilltoEaseParkingRequirementforAffordableHousing.STREETSBLOGCalif.,2015,Availableat:http://cal.streetsblog.org/2015/10/12/governor-brown-signs-bill-loosening-parking-requirements-for-affordable-housing/[AccessedJanuary4,2016].
108. Schuetz,J.,R.Meltzer,andV.Been.31FlavorsofInclusionaryZoning:ComparingPoliciesFromSanFrancisco,Washington,DC,andSuburbanBoston.J.Am.Plan.Assoc.,
78
Vol.75,No.4,2009,pp.441–456.Availableat:http://www.tandfonline.com/doi/abs/10.1080/01944360903146806[AccessedMay12,2015].
109. AffordablebyChoice:TrendsinCaliforniaInclusionaryHousingPrograms.SanFrancisco,CA,Availableat:http://www.calruralhousing.org/wp-content/uploads/2010/10/SampleIHReport.pdf.
110. Blount,C.,W.Ip,I.Nakano,andE.Ng.RedevelopmentAgenciesinCalifornia :History,Benefits,Excesses,andClosureRedevelopmentAgenciesinCalifornia.WashingtonD.C.,2014.
111. Palm,M.,andD.Niemeier.Theeffectivenessofregionalhousingpolicy:evidencefromtheSanFranciscoBayArea.Davis,CA,2015.Availableat:http://explore.regionalchange.ucdavis.edu/ourwork/publications/executive-committee-publications/the-effectiveness-of-regional-housing-policy-evidence-from-the-san-francisco-bay-area.
112. Bratt,R.G.,andA.Vladeck.AddressingRestrictiveZoningforAffordableHousing:ExperiencesinFourStates.Hous.PolicyDebate,Vol.24,No.3,2014,pp.594–636.Availableat:http://dx.doi.org/10.1080/10511482.2014.886279.
113. Bratt,R.G.AWitheringCommitment.NewJersey,1997.Availableat:http://www.nhi.org/online/issues/94/bratt.html.
114. Popkin,S.J.,andM.K.Cunningham.CHACSection8Program:BarriersToSuccessfulLeasingUp.Washington,DC,1999.Availableat:http://www.urban.org/sites/default/files/alfresco/publication-pdfs/409003-CHAC-Section-Program-Barriers-to-Successful-Leasing-Up.PDF.
115. Fischer,W.ResearchShowsHousingVouchersReduceHardshipandProvidePlatformforLong-TermGainsAmongChildren.Cent.Budg.PolicyPriorities,2015,Availableat:http://www.cbpp.org/research/housing/research-shows-housing-vouchers-reduce-hardship-and-provide-platform-for-long-term?fa=view&id=4098[AccessedMay8,2016].
116. Abramsky,S.GentrificationintheBayArea.Cap.Main,2016,Availableat:http://capitalandmain.com/latest-news/issues/labor-and-economy/gentrification-in-the-bay-area-0224/.
117. Castillo,A.,B.Anderson,andB.Lee.Apartmentscrawlingwithmice,roachesbutfearfultenantsstayquiet.SacramentoBee,2016,Availableat:http://www.sacbee.com/latest-news/article76429037.html.
118. Sanbonmatsu,L.etal.MovingtoOpportunityforFairHousingDemonstrationProgramFinalImpactsEvaluation.Washington,D.C.,2003.
119. Collinson,R.,I.G.Ellen,andJ.Ludwig.LOW-INCOMEHOUSINGPOLICy.2015.120. Ludwig,J.etal.WhatCanWeLearnaboutNeighborhoodEffectsfromtheMovingto
OpportunityExperiment?Am.J.Sociol.,Vol.114,No.1,2008,pp.144–188.Availableat:http://www.jstor.org/stable/10.1086/588741.
121. Chetty,R.,N.Hendren,andL.F.Katz.TheEffectsofExposuretoBetterNeighborhoodsonChildren:NewEvidencefromtheMovingtoOpportunityExperiment.2015.Availableat:http://scholar.harvard.edu/files/lkatz/files/mto_manuscript_may2015.pdf.
122. Fan,Y.ThePlanners’WaragainstSpatialMismatch:LessonsLearnedandWaysForward.
79
J.Plan.Lit.,Vol.27,No.February,2012,pp.153–169.123. Rosenbaum,J.E.Changingthegeographyofopportunitybyexpandingresidential
choice:LessonsfromtheGautreauxprogram.Hous.PolicyDebate,Vol.6,No.1,1995,pp.231–269.Availableat:http://www.tandfonline.com/doi/abs/10.1080/10511482.1995.9521186.
124. DeLuca,S.,G.J.Duncan,M.Keels,andR.M.Mendenhall.Gautreauxmothersandtheirchildren:anupdate.Hous.PolicyDebate,Vol.20,No.1,2010,pp.7–25.Availableat:http://www.tandfonline.com/doi/abs/10.1080/10511481003599829[AccessedJuly13,2014].
125. Sampson,R.J.MovingtoInequality:NeighborhoodEffectsandExperimentsMeetSocialStructure.Am.J.Sociol.,Vol.114,No.1,2008,pp.189–231.
126. Kling,J.R.,J.B.Liebman,andL.F.Katz.Experimentalanalysisofneighborhoodeffects.Econometrica,Vol.75,No.1,2007,pp.83–119.
127. Ludwig,J.,G.J.Duncan,andJ.C.Pinkston.Housingmobilityprogramsandeconomicself-sufficiency:Evidencefromarandomizedexperiment.J.PublicEcon.,Vol.89,No.1,2005,pp.131–156.
128. Blumenberg,E.,andG.Pierce.ADrivingFactorinMobility?Transportation’sRoleinConnectingSubsidizedHousingandEmploymentOutcomesintheMovingtoOpportunity(MTO)Program.J.Am.Plan.Assoc.,Vol.80,No.1,2014,pp.52–66.Availableat:http://www.tandfonline.com/doi/abs/10.1080/01944363.2014.935267[AccessedDecember2,2014].
129. Reardon,S.F.,andK.Bischoff.AnnualMeetingoftheAmericanSociologicahAssociationResearchCommittee,2008.Availableat:http://web.pop.psu.edu/projects/mss/income_inequality_and_income_segregation_jan2010.pdf.
130. Horner,K.RentalsubsidiestobebasedonZIPcode.DallasMorningNews,2010,Availableat:http://www.dallasnews.com/news/community-news/dallas/headlines/20100924-Rental-subsidies-to-be-based-on-86.ece.
131. Fischer,W.Neighborhood-BasedSubsidyCapsCanMakeHousingVouchersMoreEfficientandEffective.Washington,DC,2015.Availableat:http://www.cbpp.org/sites/default/files/atoms/files/6-10-15hous.pdf.
132. Ellen,I.G.,andB.Karfunkel.RentingInAmerica’sLargestMetropolitanAreasRentingInAmerica’sLargestMetropolitanAreasAuthors.NewYork,NewYork,2016.Availableat:http://furmancenter.org/files/NYU_Furman_Center_Capital_One_National_Affordable_Rental_Housing_Landscape_2016.pdf.
133. Salon,D.FinalReport:QuantifyingtheeffectoflocalgovernmentactionsonVMT.2014.Availableat:http://www.arb.ca.gov/research/apr/past/09-343.pdf.
134. Layman,C.C.,andM.W.Horner.ComparingMethodsforMeasuringExcessCommutingandJobs-HousingBalance.Transp.Res.Rec.J.Transp.Res.Board,Vol.2174,No.-1,2010,pp.110–117.Availableat:http://trb.metapress.com/openurl.asp?genre=article&id=doi:10.3141/2174-15.
135. Blank,R.M.,andM.H.Greenberg.ImprovingtheMeasurementofPoverty.Washington,D.C.,2008.Availableat:
80
http://www.brookings.edu/~/media/Research/Files/Papers/2008/12/poverty-measurement-blank/12_poverty_measurement_blank.PDF.
136. SmallAreaFMRs.UnitedStatesCensusBur.,2016,Availableat:https://www.huduser.gov/portal/datasets/fmr/smallarea/index.html[AccessedJuly7,2016].
137. Taylor,M.California’sHighHousingCostsCuasesandConsequences.Sacramento,CA,2016.Availableat:http://www.lao.ca.gov/Reports/2016/3345/Low-Income-Housing-020816.pdf.
138. LIHTCDatabase:ListofLIHTC-AllocatingAgencies.DepartmenfHous.UrbanDev.,2016,Availableat:http://lihtc.huduser.gov/agency_list.htm[AccessedOctober25,2016].
139. Alonso,W.LocationandLandUse;towardaGeneralTheoryofLandRent.HarvardUniversityPress,Cambridge,1964.
140. Muth,R.Citiesandhousing.UniversityofChicagoPress,Chicago,1969.141. Mills,E.Anaggregatemodelofresourceallocationinametropolitanarea.Am.Econ.
Rev.Pap.Proc.,Vol.57,No.2,1967,pp.197–210.142. Pan,Q.Theimpactsofanurballightrailsystemonresidentialpropertyvalues:acase
studyoftheHoustonMETRORailtransitline.Transp.Plan.Technol.,Vol.36,No.2,2013,pp.145–169.
143. Kahn,M.E.GentrificationTrendsinNewTransit-OrientedCommunities:Evidencefrom14CitiesThatExpandedandBuiltRailTransitSystems.RealEstateEcon.,2007,pp.155–182.
144. Gatzlaff,D.H.,andM.T.Smith.TheimpactoftheMiamiMetrorailonthevalueofresidencesnearstationlocations.LandEcon.,Vol.69,No.1,1993,pp.54–66.
145. Kok,N.,P.Monkkonen,andJ.Quigley.Landuseregulationsandthevalueoflandandhousing:Anintra-metropolitananalysis.J.UrbanEcon.,Vol.81,2014,pp.136–148.
146. Kahn,J.A.WhatDrivesHousingPrices?.NewYork,NewYork,2008.Availableat:https://www.newyorkfed.org/medialibrary/media/research/staff_reports/sr345.pdf.
147. Lesar,J.AddressingTheHousingAffordabilityCrisis:ActionPlanForSanDiego.SanDiego,CA,2015.Availableat:http://sdhc.org/uploadedFiles/Media_Center/Significant_Documents_Reports/SDHCHousingAffordabilityCrisisReport.pdf.
148. Eveleigh,M.Californiagovernorsignsbilltoeaseparkingrequirementsandcreatemoreaffordablehousing.SmartGrowthAm.,2015,pp.1.Availableat:http://www.smartgrowthamerica.org/2015/10/12/california-governor-signs-bill-to-ease-parking-requirements-and-create-more-affordable-housing/[AccessedAugust15,2016].
149. Löchl,M.,andK.W.Axhausen.Modelinghedonicresidentialrentsforlanduseandtransport.J.Transp.L.Use,Vol.3,No.2,2010,pp.39–63.
150. Bourassa,S.,E.Cantoni,andM.Hoesli.PredictingHousePriceswithSpatialDependence :AComparisonofAlternativeMethods.J.RealEstateRes.,Vol.32,No.2,2010,pp.139–159.
151. Brunsdon,C.,A.S.Fotheringham,andM.E.Charlton.GeographicallyWeightedRegression:AMethodforExploringSpatialNonstationarity.Geogr.Anal.,Vol.28,No.4,1996,.

81
152. Study:BayAreaCan’tKeepUpWithJob,IncomeGrowthinSiliconValley.CBSSanFr.,2016,pp.1.Availableat:http://sanfrancisco.cbslocal.com/2016/02/16/study-bay-area-cant-keep-up-with-job-income-growth-in-silicon-valley/[AccessedAugust15,2016].
153. SampleSize.UnitedStatesCensusBur.,2016,Availableat:http://www.census.gov/acs/www/methodology/sample-size-and-data-quality/sample-size/index.php[AccessedJuly7,2016].
154. U.S.MoverRateRemainsStableatAbout12PercentSince2008,CensusBureauReports.UnitedStatesCensusBur.,2015,Availableat:http://www.census.gov/newsroom/press-releases/2015/cb15-47.html[AccessedJuly7,2016].