Embed Size (px)
Citation preview

The Effectiveness of Monetary Policy Anchors: Firm-Level Evidence
J. Lawrence Broz Department of Political Science
University of California, San Diego 9500 Gilman Dr. M/C 0521 La Jolla, CA 92093-0521 email: [email protected]
and
Michael Plouffe Department of Political Science
University of California, San Diego 9500 Gilman Dr. M/C 0521 La Jolla, CA 92093-0521
email: [email protected]
Second Draft: November 4, 2008
First presented at the conference on "The Political Economy of Monetary Anchors," The Leonard Davis Institute for International Relations, Hebrew University of Jerusalem, May 25-26, 2008. Also presented at the 2008 Annual Meeting of the American Political Science Association, August 28-31, 2008. We thank William R. Clark, William Keech, and other conference participants for comments.

1
Title: The Effectiveness of Monetary Policy Anchors: Firm-Level Evidence
Abstract: Analyses of monetary policy posit that exchange-rate pegs, inflation targets,
and central bank independence can discipline monetary policy decision-making and serve
as anchors for private sector inflation expectations. Yet there are few direct, micro-level
empirical tests of these arguments. We offer cross-national evidence on the effectiveness
of monetary anchors in controlling private sector inflation expectations. Using firm-level
data from the World Bank’s World Business Environment Survey (81 countries, ~10,000
firms), we find robust evidence that fixed exchange-rate commitments significantly and
substantively reduce private sector concerns about inflation. By contrast, we find no
evidence that either inflation targeting or central bank independence is related to firm
owners' inflation concerns. Overall, our results suggest that private sector inflation
expectations are sensitive only to the most transparent, constraining, and costly of
monetary anchors: exchange-rate pegs.

2
1. Introduction
The literature on monetary policy highlights the role of institutional commitments in
stabilizing private-sector inflation expectations. Central bank independence, (CBI)
inflation targeting (IT), and fixed exchange rates (Pegs) are widely viewed as institutions
that have the capacity to mitigate private sector concerns that policymakers will exploit
them after they have locked in their price, wage, and investment decisions. While
previous empirical work has looked at the institutional correlates of realized inflation
levels, we use firm-level data to directly assess the impact of monetary anchors on private
sector inflation concerns and expectations. We find that fixed exchange rates mitigate
firm owners' concern with inflation; firm owners’ concern about inflation falls by as
much as 10 percentage points under a pegged regime. By contrast, other commitment
institutions--central bank independence and inflation targets --are uncorrelated with
private-sector inflation expectations.
Considerable research has investigated the use of central bank independence,
inflation targets, and fixed exchange rates as institutions that governments might use to
establish policy credibility. In empirical work, however, private-sector expectations
have been skipped over in favor of approaches that model macroeconomic aggregates--
inflation, the output gap, etc--as a reduced form function of commitment institutions and
other influences. This has left a gap between positive theories of monetary institutions,
which rest on private agent microfoundations, and empirical work, which lack micro-
level treatments altogether.1
1 See, however, Crowe (2006).

3
If certain monetary institutions are inherently more credible than others, then not
only inflation but also private-sector inflation expectations must differ systematically
across countries that differ in their institutions. If central bank independence reduces
inflation, then firm owners in countries with more independent central banks should
perceive their governments’ promises of low inflation to be more credible. Likewise, if
inflation targets and exchange-rate pegs anchor inflation expectations, we should expect
to find that firm managers in countries with such regimes perceive policymakers to be
more credible than firm owners in countries that lack these anchoring institutions.
Examining the impact of institutions at the individual level of analysis is necessary
because the structure of incentives provided by a country’s monetary institutions must
work through private agents to have aggregate effects.
Improvements in cross-national survey information allow us to analyze the effects
of institutions on individual perceptions. We draw upon the World Bank’s World
Business Environment Survey (WBES) for our firm-level data. In 1999, the WBES was
administered to over 10,000 firms in 81 countries; the stated purpose of the survey was to
identify the features of a country’s investment climate that matter most for productivity
and growth, from the perspective of private-sector actors. The WBES assessed the
institutional and policy environment for private enterprise using a common survey
instrument, administered to a representative sample of firms in each country. This
standardized approach allows us to draw consistent, cross-national inferences from the
data.
Our micro-level approach provides a more direct test of institutional theories of
monetary credibility and reduces some of the inferential difficulties associated with

4
current work. For example, the problem of endogeneity in cross-country inflation
regressions--i.e., inflation-averse countries may select independent central banks, as in
Posen (1993)--is less of a concern since it is unlikely that firm owners’ survey responses
“cause” monetary institutions. Our empirical approach remains consistent with
prevailing institutional theories but we differ in that we test these arguments at the
individual level of analysis. Our findings are thus relevant to the wider body of literature
and suggest new avenues for research.
The plan of the paper is as follows. In section 2, we describe our research design
and contrast it with existing work on monetary institutions. Section 3 presents our
dependent variables from the WBES and assesses their validity. Section 4 presents our
measures on monetary commitment regimes and provides preliminary evidence on how
these regimes relate to private sector inflation expectations. Section 5 contains our
empirical models and findings, and Section 6 concludes.
2. Monetary Institutions: Theory and Evidence
One of the most widely accepted models of inflation is that of Barro and Gordon
(1983). In that paper, the authors look at the costs and benefits of surprise inflation in a
game between the monetary authority and the private sector. After the monetary authority
has announced its policy and the private sector has taken actions that rely on that policy,
the authority has an incentive to raise output above its full employment level through
surprise inflation. In a rational-expectations equilibrium, where inflation is predicted
correctly by the private sector, output remains at its full employment level, but inflation is
higher than it would have been had the monetary authority been able to pre-commit.

5
This rational-expectations model of inflation and inflation expectations has been a
workhorse for thinking about issues of credibility and institutional design. Rogoff (1985)
offers an institutional precommitment in which the policymaker delegates monetary
policy to an independent and conservative central banker who places a higher weight on
the inflation goal. The private sector, upon observing that the conservative central banker
is in charge of monetary policy, writes lower inflation into its wage and price contracts.
However, delegation to an independent central bank forces a tradeoff between lowering
inflation and stabilizing the real economy. Because a conservative central banker places a
lower weight on the output stabilization goal, the banker responds too little to real shocks.
An ancillary literature considers institutions that bring about commitment to low inflation
while allowing some degree of flexibility to stabilize the economy. Lohmann (1992)
proposes a partially independent conservative central banker that accommodates political
pressures when extreme shocks hit the economy. Other solutions to the "credibility vs.
flexibility" tradeoff include an exchange-rate target with an escape clause (Flood and
Isard 1989, Canavan and Tommasi 1997), an inflation target for a transparent and
accountable central bank (Bernanke et al 1999, Bernanke and Mishkin 1997), and optimal
contracts for central bankers (Walsh 1995).
A large body of empirical work on inflation is built upon the Barro-Gordon
framework. Some earlier studies found that CBI and low inflation are correlated
(Cukierman 1992, Grilli et al 1991, and Alesina and Summers 1993). However, there is
debate about both the measurement of CBI and the causality of its relationship to
inflation (Forder 1998, Berger, de Haan, and Eijffinger 2001, de Haan and Kooi 2001).
With respect to exchange-rate regimes, Ghosh et al. (1997) found that pegs are associated

6
with lower inflation, but at the cost of more variable output than in flexible exchange-rate
regimes. Similarly, Bleaney and Francisco (2007) provide more evidence that hard pegs
(currency boards and common currency arrangements) are associated with lower
inflation--again at the cost of slower and more volatile growth--than either floats or soft
peg regimes. As for inflation targeting, the evidence is by and large supportive of its
association with lower inflation levels and inflation volatility, perhaps without increasing
output volatility (Mishkin 2007, IMF 2005).2
The typical estimation strategy in this literature is to regress cross-country
inflation rates (or some other macroeconomic aggregate) on the relevant monetary anchor
while controlling for a host of country-level factors. But according to the theory of
inflation, monetary commitment institutions do not directly affect inflation rates; rather,
institutions influence individual perceptions and behaviors which, in aggregate, influence
inflation. Private-actor agency lies between institutions and aggregate outcomes. This
suggests that empirical research would benefit from estimating the impact of monetary
anchors on individual inflation perceptions, if not on the economic behaviors of private
agents.
Figure 1 diagrams the causal pathway modeled in institutional theories of
monetary policy and contrasts it with research designs evident in current empirical work.
The heavy horizontal arrows depict the theoretical relationship between institutions, the
perceptions and behaviors of private sector actors, and inflation. Most researchers,
2 However, Ball and Sheridan (2005) caution that the decision to adopt inflation targeting is an endogenous choice, such that countries with higher initial inflation are more likely to choose it. They suggest that the apparent success of inflation targeting is simply reversion to the mean: inflation fell faster in inflation targeting countries that started with high inflation than in non-targeting countries with initially lower inflation.

7
however, skip over these the intermediate steps in the casual process and run regressions
of inflation on institutions (depicted by the upper dashed arrow). This avoids the crucial
issue of whether monetary institutions affect individual perceptions and behavior and
thereby imposes the causality relationship from the outset. Regardless of the institution
that commits monetary policy to low inflation--central bank independence, exchange-rate
pegs, inflation targets--every institutional theory works through individual expectations
and actions. That is, institutions affect inflation and other macroeconomic outcomes by
encouraging certain expectations and behaviors and discouraging others. Our approach is
to test this intermediate stage of the analysis. To this end, we utilize individual responses
from business owners to questions from the WBES to develop distinct indicators for
individual "inflation expectations."
3. Operationalizing Private Sector "Inflation Expectations"
In this section, we present our operationalization of private sector "inflation
expectations" and analyze the validity of our measure. Our data come from the WBES, an
81-country cross-sectional firm-level survey conducted in developed and developing
countries in 1999 by the World Bank.3 At least 100 firms were interviewed in each
country, with an overall total of 10,090 firms in the sample. The survey has a number of
questions on the business environment in which firms operate, including assessments of
monetary policy conditions and institutions.4 The database also includes information on
3 For a general discussion of the WBES, see Batra, Kaufmann, and Stone (2003). 4 Beck, Demirguc-Kunt, and Maksimovic (2004) use the WBES to explore the effects of financial obstacles on firm growth. Broz and Weymouth (2007) utilize the WBES to examine the connection between the political party orientation of government and firms'

8
firm ownership (foreign, government), firm size, sales performance, sector of operation
(manufacturing, services, agriculture), and export orientation, which we tap as control
variables.
In most macroeconomic models, the inflation expectations of price and wage
setters are a crucial factor in the inflation process. But data on the price expectations of
business firms--the price setters in the first instance--as well as information on nominal
wage expectations is scarce. The most widely used surveys ask household consumers, as
opposed to firms or labor representatives, about their inflation expectations (Mankiw,
Reis, and Wolfers 2004). For example, the University of Michigan’s “Survey of
Consumer Attitudes and Behavior” has tracked the inflation expectations of U.S.
households for over 50 years by asking consumers to predict the change in prices over the
next 12 months. Since consumers do not set prices or wages, these surveys do not
measure the forecasts of the individuals that matter in models of inflation.5
One of the advantages of the WBES is that it is a survey of business owners and
managers, so that people with the capacity to set prices form the pool of respondents. A
shortcoming is that the WBES does not explicitly ask businesses to forecast inflation.
Nevertheless, we think one of the WBES queries on inflation is forward-looking and
approximates of the concept of “inflation expectations." We label this indicator
"INFLATION," which is firm owners' response to the following query:
perceptions of property rights. Broz, Frieden, and Weymouth (2008) use the WBES to analyze firms' attitudes toward exchange rates. 5 The Livingston “Survey of Professional Forecasters,” conducted quarterly by the Federal Reserve Bank of Philadelphia, comes closer to measuring the expectations of price-setting firms, since respondents come largely from the business world. But, like the Michigan consumer survey, data are limited to the United States.
9
“Please judge on a four point scale how problematic inflation is for the operation and growth of your business.”
Answers vary between 1 (no obstacle), 2 (minor obstacle), 3 (moderate obstacle), and 4
(major obstacle). We think this variable is a reasonable proxy for price-setters’ inflation
expectations. On the one hand, the frame of the query --“operation and growth of your
business”--suggests a forecast. “Growth” is, of course, a forward-looking concept. On
the other hand, “operation” suggests a short-run (recent past, current, near future)
perspective. This part of the frame, however, is not a severe problem for our analysis
because existing survey measures of inflation expectations correlate strongly with current
inflation levels (Thomas 1999). Since other types of respondents (consumers and
business economists) have been shown to pay a great deal of attention to recent inflation
data when forming expectations about future inflation--even for forecasts as far out as
five years--we believe our variable captures business expectations as well as a more
explicitly forward-looking query might. Later in the paper, we return to this issue and
analyze two other WBES queries about firm owners’ perceptions of the monetary policy
environment. Our results are robust to these alternative measures of the dependent
variable.
Our measure of businesses’ inflation expectations, INFLATION, has a mean of
2.8 and a standard deviation of 1.07. Overall, 34 percent of all firms in the sample report
that inflation is a major obstacle to the operation and growth of their businesses. Another
26 percent see inflation as a moderate obstacle, while 23 percent of firms view inflation
as minor obstacle, and 16 percent view inflation as no obstacle at all. Table 1 indicates
that the concern with inflation not only varies across firms within a country but it also

10
varies significantly across countries. The table lists the country average of INFLATION
for the top and bottom ten countries in the sample; it also reports actual inflation for each
country in 1999, the year of the survey. With few exceptions, the lists are intuitively
appealing: in the ten countries where firms reported the least concern with inflation,
actual inflation averaged just 2.7 percent. Bosnia, the country where firms expressed the
least concern with inflation despite a 1999 inflation rate of 8.4 percent, saw a steady
decline in inflation over the previous five years, with inflation running at 3.9 percent over
that period. By contrast, in the ten countries where firms reported the most concern with
inflation, recent inflation averaged 71.2 percent. The exception--Kazakhstan--had
relatively low inflation the year of the survey but inflation over the previous five years
averaged 49.6 percent. We therefore claim sufficient support for the face validity of
INFLATION and use it as the main dependent variable in our regressions.
4. Monetary Anchors and Private Sector Inflation Expectations
High and volatile inflation distorts private sector decision-making with regard to
investment, savings, and production, and ultimately leads to slower economic growth. A
number of institutions have been suggested to lower inflation expectations by way of
credible monetary policy commitment. These institutions include an independent central
banker that places a higher weight on inflation stabilization than the private sector
(Rogoff 1985), an incentive contract that penalizes central bank governors either by loss
of compensation or prestige (Walsh 1995), and a monetary policy commitment rule such
as an inflation target (Bernanke et al. 1999). Pegging the exchange rate to a stable foreign
currency provides another institution for providing a credible commitment to low
inflation (Ravenna 2005). As Frankel (1999) has observed, choosing the exchange rate

11
as the nominal anchor and importing credibility from abroad has the advantage of being
relatively easy to implement and provides an easily observable commitment to monetary
policy.6
Our research goal is to examine whether monetary commitment institutions
anchor private sector inflation expectations in the manner specified by theory. In this
section, we describe our measures of monetary institutions and provide some preliminary
comparisons of firm owner inflation expectations across these regimes.
With respect to exchange rate regimes, we want to assess how firms' inflation
expectations are conditioned by the country’s exchange-rate regime. For this purpose, we
need to classify countries by exchange-rate regime. We employ two classifications of de
facto exchange rate regimes: Levy-Yeyati and Sturzenegger (2005), and Reinhart and
Rogoff (2004). Although the methods differ, both classifications attempt to capture the
actual behavior of the exchange rate. Levy-Yeyati and Sturzenegger categorize countries
as floats or pegs according to observed changes in the nominal exchange rate, the
volatility of these changes, and the volatility of international reserves. Reinhart and
Rogoff, exploit the conditional probability of the exchange rate staying within a given
range over a rolling five-year window, and use information about parallel (dual market)
exchange rates in determining whether a regime continues from one year to the next. We
collapse RR into three regimes (0 = Float, 1 = Intermediate, 2 = Fixed) and take values
for 1999 and call this variable "PEG (RR)." We take the LYS 3-way classification for
6 There is a large literature on why pegged regimes may be crisis prone, an issue that is beyond the scope of this paper.
12
1999 and label it "PEG (LYS)".7 Our results are robust to these alternative de facto
regime classification schemes.8
We also include a de jure measure of exchange-rate regime on the grounds that an
announced regime may be more easily observed by private-sector actors than a de facto
regime. "PEG (IMF)" is the regime the government announces and reports to the IMF.
As above, we take values from 1999 and construct a 3-way indicator (0 = Float, 1 =
Intermediate, and 2 = Fixed).
To test the effects of central bank independence on firm owner expectations about
inflation, we use three alternative measures. For de jure CBI, as written into countries’
laws and legal systems, we use the Polillo and Guillén (2005) update of the Cukierman,
Webb, and Neyapti (1992) index. Polillo and Guillén replicated the Cukierman, Webb,
and Neyapti method to update the de jure CBI index for the 1992-2000 period. Our
variable, "CBI (CWN)," is the 1999 value of the Polillo and Guillén index for countries
in our sample.9
Our second measure of de jure central bank independence is from Mahadeva and
Sterne (2000). Unlike the CBI (CWN) index, which was coded by academic experts on
the basis of a reading of central banking statutes, Mahadeva and Sterne's index is
7 Please see the data appendix for details. 8 Neither of these classifications systematically codes basket pegs as a unique category; thus, we are unable to determine how firms respond to de facto single-currency pegs relative to softer pegs. 9 We also utilized Crowe and Meade's (2007) update of the Cukierman, Webb, and Neyapti index. The Crowe and Meade CBI index data were for the end of 2003, four years after the WBES was conducted. For this reason, we prefer the Polillo and Guillén data. However, regression results using the Crowe and Meade data are substantively the same. We are grateful to Chris Crowe and Ellen Meade for graciously sharing their data.

13
constructed from a 1998 survey administered directly to central bankers. Under the
auspices of the Bank of England, the survey was designed along the lines of Cukierman's
(1992) de jure approach. The resulting composite CBI index is a weighted average of
central banker responses to questions about (1) their statutory obligation to focus on price
stability, (2) target independence, (3) their instrument independence, (4) the finance of
government deficits, (5) and the term of office of the governor. The index, which we
label, "CBI (M&S)," was administrated in 1998 across 94 economies. As such, it
provides timely coverage for our purposes; we obtain values for 51 of the 81 countries in
the WBES sample.10
Our third measure of CBI is a de facto indicator. Based on pioneering work by
Cukierman (1992), it is the central bank governor turnover rate. This measure relies on
the assumption that governors who resist political pressure will be replaced; high
governor turnover is interpreted as indicating political interference in the conduct of
monetary policy.11 Our variable, "CBI (TURNOVER)", is the turnover rate of central
bank governors for the five years between 1995 and 1999. These data are from Ghosh,
Gulde, and Wolf (2002).
Inflation targeting is another institutional framework that can help constrain
monetary policy and achieve low and stable inflation. In contrast to targeting the
exchange rate of an anchor currency, inflation targeting involves targeting inflation
directly. Under this regime, the central bank is mandated, and commits to, a numerical
10 As with other de jure CBI indicies, this one is subjective. However, it is open to the additional criticism that the responses of central bankers may be particularly biased. 11 Of course, low turnover need not indicate independence since a governor that is pliant to (political) pressure would not have to be replaced.

14
target in the form of a level or a range for annual inflation. This means the inflation
forecast (over some horizon) becomes the intermediate target of policy. Other
distinguishing features of inflation targeting are greater central bank transparency and
accountability. These features are important because inflation targeting is supposed to
enhance credibility while allowing the central bank some flexibility to respond to shocks.
On the one hand, the medium-term inflation target makes it clear that low inflation is the
primary goal of monetary policy, yielding an increase in credibility. On the other, greater
transparency and accountability are meant to compensate for the greater operational
flexibility that inflation targeting offers. Short-term deviations of inflation from the
medium-run forecast target are possible and do not necessarily translate into losses in
credibility.
Mishkin's (2004) definition of inflation targeting thus has five elements: (1) an
announced, numerical, medium-term inflation target, (2) price stability as primary goal of
monetary policy, (3) an information-inclusive strategy in which many variables are used
for deciding the setting of policy instruments, (4), high transparency of the monetary
policy strategy through communication with the private sector about the plans,
objectives, and decisions of the monetary authorities, and (5) accountability of the central
bank for attaining its inflation objectives.
We draw upon two sources for data on inflation targeting regimes. The first is the
Mishkin and Schmidt-Hebbel (2002) classification of IT countries that met the above
criteria prior to the WBES survey in 1999. We use a binary indicator for the variable, "IT
(MISHKIN)": 1 if an inflation target regime was in place prior to 1999, 0 otherwise. In
the WBES sample of countries, inflation targeting countries are Canada, Chile, Czech

15
Rep, Mexico, Poland, Sweden, and the United Kingdom. We exclude Spain since it
adopted the Euro in January 1999.
Our second indicator of IT comes from Mahadeva and Sterne (2000) who
construct an index of IT from the responses of central bankers to a 1998 survey. One of
the purposes of the survey was to gauge the relative emphasis that a central bank places
on inflation, the exchange rate, and money targets. The survey thus provides a measure
of the degree to which a country's policy focused on a particular target, rather than
assuming that a policy framework could be classified entirely committed to a single
target. The index for "inflation target focus" is the equally-weighted average of
numerical responses to four questions: (1) Is your regime described as inflation targeting?
(2) Do you publish a specific target/monitoring range now? (3) In practice, how highly
do you rank this objective? (4) Does inflation prevail when there are policy conflicts?
The variable, "IT (M&S)" ranges from 0, for a country that does not focus on targeting
inflation at all, to 1, for a central bank whose focus is entirely on targeting inflation.
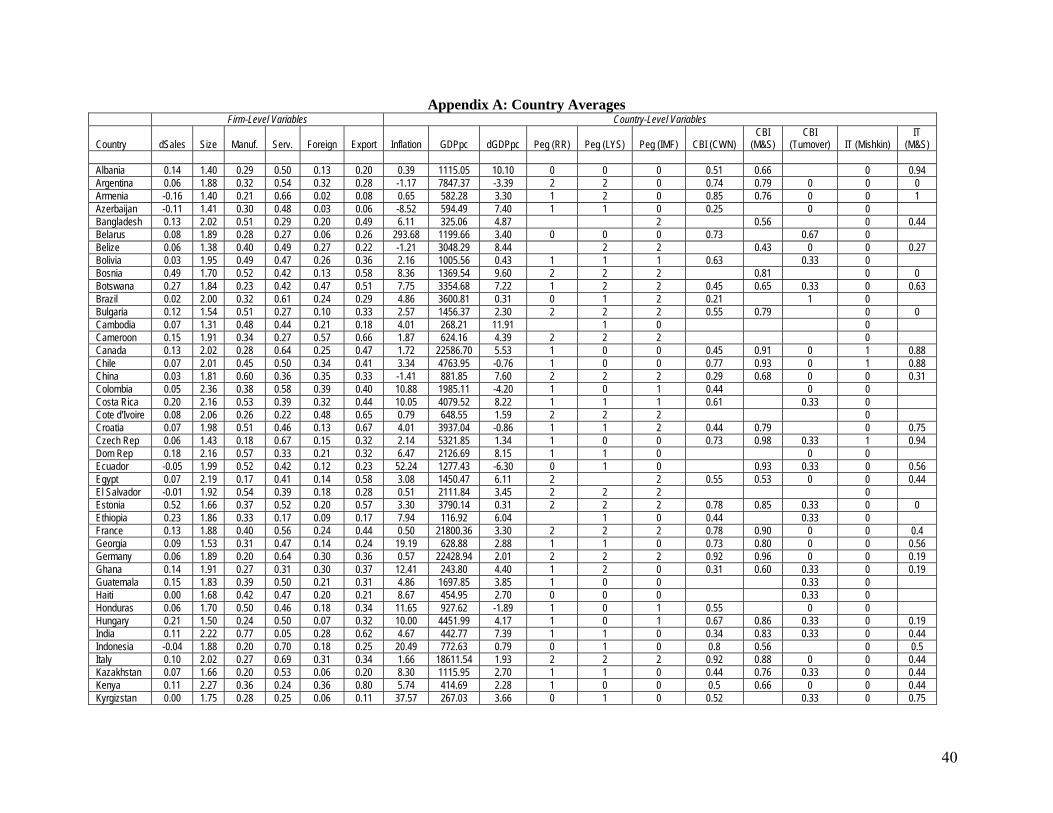
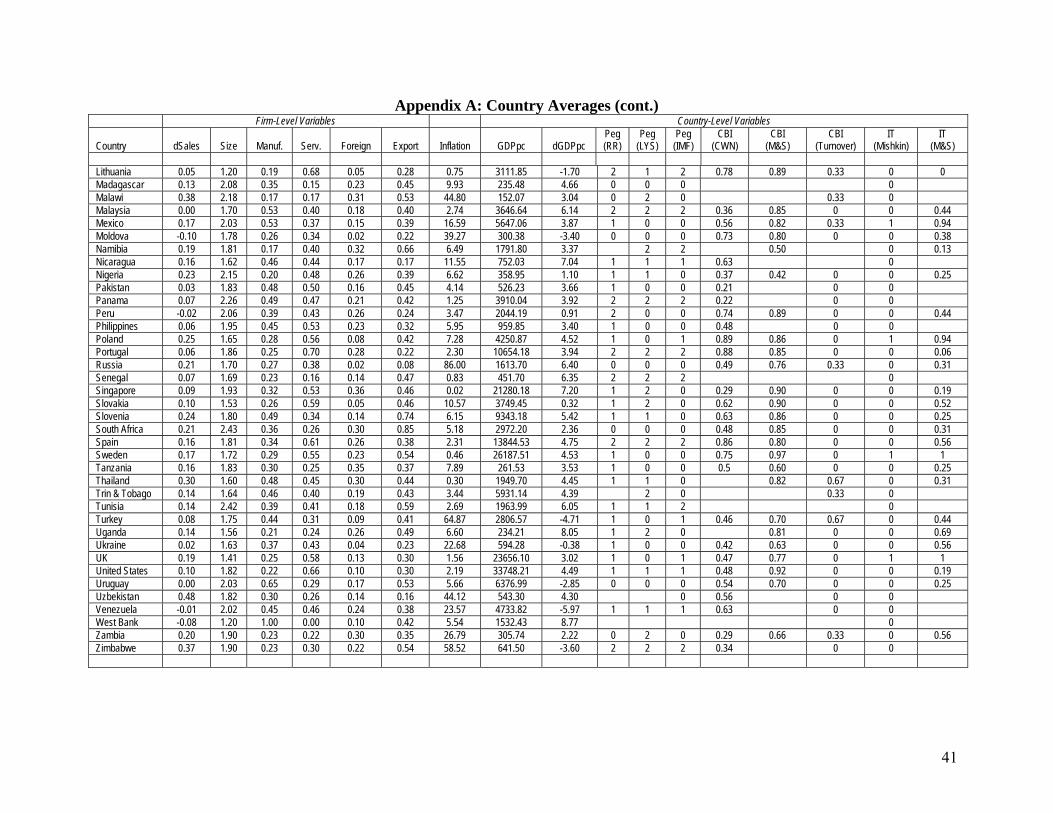
We thus have multiple indicators of each monetary institution, as well as a mix of
de jure and de facto indicators of these institutions. See Appendix A for country values
of all our data; summary statistics are in Table 2.
Having described our data, we provide preliminary comparisons of firms'
concerns about inflation across these monetary commitment regimes. Figures 2-4 group
firm owners by the commitment institution they operate under--pegs, CBI, and IT--and
reports their average responses to the WBES query about inflation. Values range from 1,
indicating that firm owners think inflation is a “no obstacle,” to 4, which means inflation
is perceived as “major obstacle.” Figure 2 illustrate how the exchange-rate regime
16
relates to firms' inflation concerns, using the three-way (Float, Intermediate, Fixed) de
facto indicator from Reinhart and Rogoff (2004). The average response among firms
operating in fixed exchange-rate environments is 2.4, which is closest to the “minor
obstacle” response, versus the 3.2 average for firms in floating exchange rate regimes,
which is above the “moderate obstacle” response. Figure 3 and Figure 4 repeat the
exercise using regime indicators from Levy-Yeyati and Sturzenegger and the IMF.
Regardless of the measure we use--RR, LYS, or IMF-- the distributions in Figures 2-4
reveal that firms operating in pegged regimes are consistently less concerned about
inflation than firms in floats.
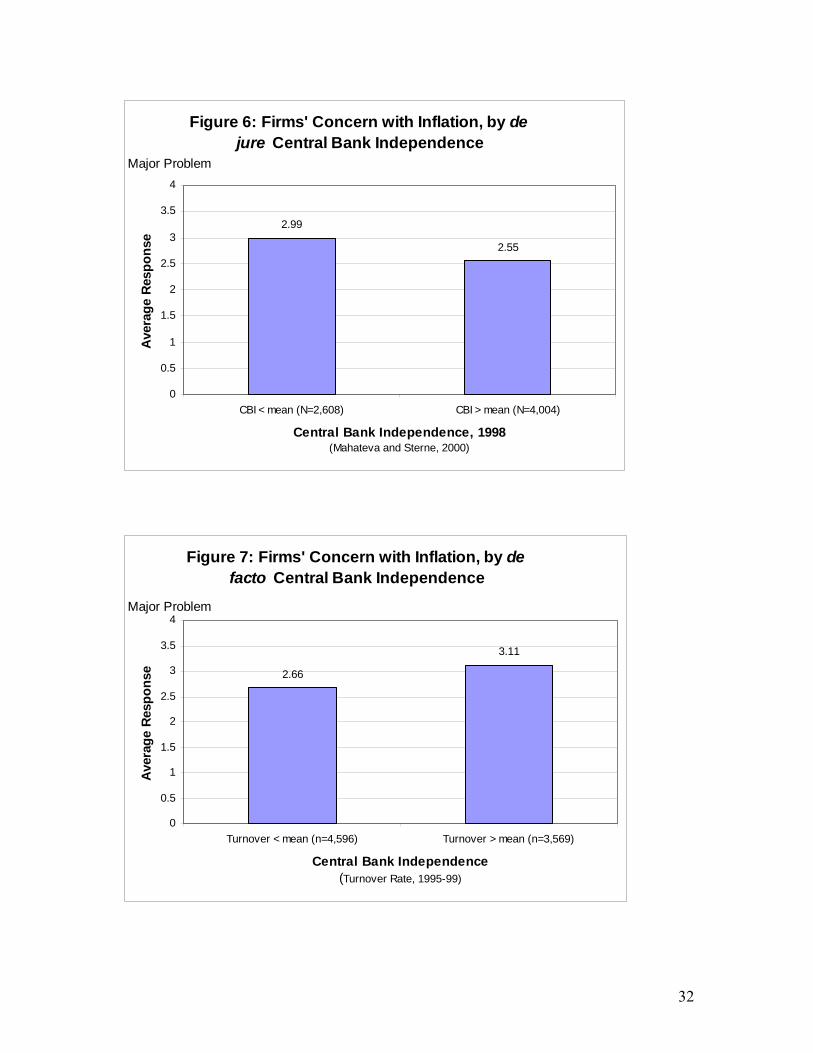
Figures 5-7 explore the link between inflation concerns and CBI. To do so, we
collapsed our three indicators for CBI into binary variables, where 0 indicates a level of
CBI that is below the mean level in our data, and 1 indicates CBI above the mean. The
figures are average responses across the regimes. With respect to de jure CBI as proxied
by the Cukierman, Webb, and Neyapti (Polillo and Guillén) measure, firms in high CBI
countries are slightly more concerned about inflation than firms in low CBI settings,
which runs against our priors (Figure 5). However, the de jure indicator from Mahateva
and Sterne (Figure 6), and the de facto measure based on governor turnover (Figure 7),
both suggest that CBI reduces inflation concerns among business owners and managers.
Figures 8 and 9 plot the relationship between inflation targets and firms' average
inflation concerns. As with the distributions for CBI, the alternative indicators for IT
regimes yield conflicting results. When IT is proxied by the Mishkin sample (Figure 8),
there is prima facia support for the claim that inflation targets anchor price concerns. But
when the Mahateva and Sterne data are used, (Figure 9), IT seems to have a perverse

17
effect, as firms in nations that focus more on targeting inflation report greater concern
with inflation than firms in nations that focus less on targeting inflation.
This preliminary evidence suggests that fixed exchange rates contribute to a
perception among businesspeople that inflation is less of a problem to their firms. There
is less consistent evidence that CBI and IT have a similar effect. To further assess the
evidence and control for other factors that might contribute to these differences, we move
to regression analysis.
5. Model and Results
Survey responses may reflect other firm- or country-level characteristics besides
monetary institutions. For firm-level controls, we use the responses to five other WBES
questions: sales change, firm size, sector of operation, foreign ownership, and export
orientation. Firms that experience sales increases may be more successful and therefore
less likely to view inflation as a problem. Our variable, SALES CHANGE, is the percent
change in firm sales over the previous three years. Larger firms may be more established
and therefore less likely to find inflation a problem. Our measure, FIRM SIZE, is an
ordered response where 1=small (5-50 employees), 2=medium (51-500 employees), and
3=large (>500 employees). Firms in manufacturing and services may have greater market
power than firms in agriculture and, consequently, may be able to pass through price
increases to customers. We use binary indicators for MANUFACTURING and
SERVICES, treating agriculture as the reference sector. Firms with foreign ownership
and an export orientation might be more diversified internationally and therefore less
subject to price shocks in the home market. Our binary indicators are FOREIGN

18
OWNED and EXPORTER, which respectively indicate if some share of the firm is
owned by foreign nationals and some portion of its sales are exported.
We also include several country-level variables in our models to control for
national factors other monetary institutions. Firms in more developed countries may have
less concern with inflation, so we control for per capita GDP in 1999. Firms in countries
with higher rates of economic growth may be less concerned with inflation so we control
for growth performance with the change in GDP per capita between 1998 and 1999.
Lastly, we control for inflation, measured as the change in consumer prices between 1998
and 1999.12 We include inflation as a control because inflation might affect the types of
monetary institutions a nation adopts as well as individuals’ perceptions of inflation as a
problem. For instance, recent inflation could positively influence worries about inflation
while at the same time increasing the likelihood that a government fixes the exchange
rate, grants greater autonomy to the central bank, or adopts inflation targeting. Leaving
inflation out of the model would thus bias the effects of monetary institutions on private
sector inflation expectations.
We run ordered probit models with robust standard errors clustered by country to
estimate the following equation:
(INFLATION EXPECTATIONS)ij = α + β1 (REGIME)ij + β2 (FIRM)ij + β3 (ECONOMY)j + εij
where the subscripts stand for firm i in country j. The dependent variable is INFLATION
EXPECTATIONS, the response of firm i in country j. We use three ordered responses
12 Our results are robust to 5 year averages and logs of these three country-level variables.

19
from the WBES as alternative measures of the dependent variable (see above). Our
variable of interest is REGIME, which represents one of three monetary institutions
designed to credibly commit policy to low inflation: fixed exchange rates, CBI, and
inflation targeting. The vectors FIRM and ECONOMY are the firm- and country-level
controls described above.
Table 3 presents results of regressing our indicator of businesses’ inflation
expectations, INFLATION, on the type of exchange-rate regime and a set of control
variables. The dependent variable records firms' ordered responses to the WBES inquiry,
"How problematic is inflation to the operation and growth of your business?" Answers
range from 1=“No Obstacle” to 4=“Major Obstacle”. Model 1 estimates the effects
controlling for firm-level characteristics; all coefficients are signed correctly and
significant. Model 2 adds country-level control variables. Intuitively, higher inflation
increases the likelihood that a firm will perceive inflation to be a problem while the level
of economic development and recent economic growth both significantly reduce
businesses' concern about inflation.
Models 3-5 introduce our three measures of exchange rate regime: RR, LYS and
IMF. Each is coded as 0=Float, 1=Intermediate, and 2=Peg, so negative estimates
indicate that pegging reduces concerns about inflation. The estimates are indeed all
negative and statistically significant. Overall, firms report more problems with inflation
in floating regimes than firms operating under pegged exchange rates.
As the magnitudes of ordered probit results are difficult to interpret directly, we
simulated the change in the predicted probability of observing a "4=Major Obstacle"
response as we moved the exchange-rate regime indicators from a float to a peg (i.e.,

20
from 0 to 2), holding other independent variables in Models 3-5 at their means.13 The
effects are substantively important. The probability that a firm will report inflation to be
a "Major Obstacle" decreases by 10.4 percentage points as the regime environment
moves from an RR float to an RR peg. A move from an LYS float to an LYS peg
reduces the likelihood of this response by 7.2 percentage points. The impact of a change
in official IMF regimes falls between these two estimates: firm owners are 9 percentage
points less likely to report that inflation is a major obstacle under a de jure peg.
Other monetary institutions appear unrelated, or perversely related, to firm
responses. Table 4 reports results as we introduce our indicators of CBI and IT to the
baseline model. Model 1 is the base model, containing firm- and country-level controls.
Models 2-3 include PEG (RR) and PEG (LYS) for the purposes of comparison. Models
4-6 introduce our three indicators of CBI. Although CBI (CWN) and CBI
(TURNOVER) have the correct sign, none of these CBI proxies is significant. The two
indicators for inflation targeting have the wrong sign--IT appears to increase inflation
concerns among firm owners--and in the case of the survey-based measure, IT (M&S) is
significant at the 5 percent level.
The perverse effect of IT on firms' inflation concerns is puzzling. To pursue the
matter further, we ran Models 7 and 8 again and included a measure of central bank
"transparency." Since IT requires transparency in order to compensate for its relatively
high level of discretion, our thought was that we should control for central bank
13 The simulations were performed with “Clarify” (Tomz et al 1998). We set FIRM SIZE to 2, and MANUFACTURING, SERVICES, FOREIGN OWNED, and EXPORTER to 1. All country-level controls were held at their means.

21
transparency to obtain more predictable results on the IT variables.14 The results (not
reported) indicate that there is no direct relationship between transparency and inflation
concerns. More importantly, with the transparency control included in Model 8, IT
(M&S) estimate remains positive and significant (at the 10 percent level). Thus, if IT has
any effect on the perceptions of firms in our sample, it is to increase concerns about
inflation. It may be that inflation targeting is an endogenous variable, such that countries
that had greater problems with inflation in the past were more likely to have selected IT
as a focus for central bank policy. A cursory look at our data doesn’t support this
interpretation, however, as countries where central bankers gave greater focus to
targeting inflation by 1999 experienced lower average inflation rates over the prior five
year period than countries with below average attention to IT. In countries with above-
the-mean values of IT, as measured by Mahadeva and Sterne index, prices rose 23.9
percent per year on average from 1994 to 1998. By contrast, inflation was even higher--
28.9 percent--in countries with below average attention to inflation targeting.
Even if endogeneity can account for our positive estimate on the IT (M&S)
coefficient, the result does not suggest that adoption of an IT regime itself mitigates
inflation concerns among businesses. Policymakers may need to earn a reputation for
their commitment to low inflation by maintaining low and stable prices for some period
after the adoption of an IT regime. Unlike commitment to a fixed exchange-rate regime,
which implies an automatic policy rule that is easily verified by way of currency
fluctuations in the foreign exchange market, inflation targeting permits more discretion
14 The transparency variable if from Crowe and Meade (2007), who create a transparency index from five dimensions of central bank transparency: political, economic, policy, procedural, and operational.

22
for policymakers. IT allows central bankers the discretion on how and when to bring
inflation back to the target; it also allows them the discretion to change targets. All this
discretion contrasts sharply with the binding constraint and the transparency of an
exchange rate peg. Businesses may thus be skeptical about how policymakers will use
this discretion when an IT regime is initially adopted, leading to an increased focus on
inflation-related concerns when conducting their affairs
We now assess the robustness of our initial results to alternative measures of the
dependent variable, also from the WBES dataset. Although these measures are derived
from survey queries that are further removed from the concept of “inflation
expectations,” they capture firm owner perceptions of the macroeconomic policy
environment and are thus relevant to our analysis. A following WBES survey question
gauges firm owners' perception of the predictability of economic and financial policies:
"Do you regularly have to cope with unexpected changes in economic and financial policies which materially affect your business? Changes in economic and financial policies are ..."
Answers vary between 1 (completely predictable), 2 (highly predictable), 3 (fairly
predictable), 4 (fairly unpredictable), 5 (highly unpredictable), and 6 (completely
unpredictable). This variable, "PREDICTABILITY," provides an indication of the extent
to which firms find unstable/uncertain government policies problematic to the operation
and growth of their business. Perceptions of economic policy instability are related to the
concept of monetary policy "credibility." In particular, if a government is credible in its
policy announcements, then its policies will be perceived as more stable and certain.

23
In another monetary-related inquiry, the WBES asked firms to rate the quality and
efficiency of the central bank:
"Please rate the overall quality and efficiency of services delivered by the following public agencies: The Central Bank."
Answers vary between 1 (Very Good), 2 (Good), 3 (Slightly Good), 4 (Slightly Bad), 5
(Bad), and 6 (Very Bad). While quality and efficiency are subjective terms, we expect
responses to this question to be related to the central bank's performance in credibly
committing to low inflation. In this broad sense, the inquiry taps into the private sector's
perception that the central bank behaves in a time-consistent manner.
In Table 5 we give results of ordered probit regressions of PREDICTABILITY--
an alternative measure of government credibility from the WBES. The dependant
variable, PREDICTABILITY, is the firm owner response to the inquiry: “Do you
regularly have to cope with unexpected changes in economic and financial policies which
materially affect your business? Changes in economic and financial policies are:
1=completely predictable to 6=completely unpredictable." Our estimates once again
support a role for exchange-rate pegs in anchoring private-sector inflation expectations
and building credibility for the commitment to low inflation. Both the PEG (RR) and the
PEG (LYS) estimates are negative and significant. By contrast, all of the other monetary
anchoring institutions except CBI (TURNOVER) are wrongly signed (but insignificant)
in Models 4-8.
Table 6 presents results using CB QUALITY as the dependent variable. This
variable ranges from 1="Very Good" to 6="Very Bad" and captures firms' responses to
inquiry: “Please rate the overall quality and efficiency of services delivered by the

24
following public agencies or services: The Central Bank." Our indicators of the
exchange rate regime return estimates that are negative and significant (in the case of the
RR measure), suggesting that pegs improve assessments of the central bank. In addition,
central bank independence, as proxied by CBI (TURNOVER), makes it more likely that
firms will rate the central bank as low quality. All other monetary anchors have no
relationship to assessments of central bank quality, although IT is in the expected
direction.
6. Conclusion
We have examined micro-level evidence to see if institutions actually influence the
individual perceptions of price-setting businesses in the manner stipulated in theory.
Micro-processes underlie all theories of inflation, but empirical scholarship has largely
ignored the intermediate stage where human agency stands between institutions and
aggregate economic outcomes. In this paper, we utilized firm-level data from a large,
cross-national survey to assess the impact of alternative monetary commitment
institutions on individual inflation perceptions in the private sector. We found that
exchange-rate pegging reduces concerns about inflation, improves perceptions of
economic policy certainty and stability, and raises regard for the central bank among
business people. However, firm-owner responses in our sample seem unaffected by
inflation targeting and central bank independence.
In principle, all three monetary anchors should yield improvements in private
sector credibility. But pegging has three characteristics that give it an advantage over
inflation targets and central bank independence in raising credibility. First, pegs are
transparent. Choosing the exchange rate as the nominal anchor and importing credibility

25
from abroad has the advantage of being a more easily observable commitment to
monetary policy than either CBI or IT (Frankel 2002). Atkeson and Kehoe (2001) show
formally that the greater transparency of an exchange rate peg reduces the credibility
problems that arise when a government cannot commit to monetary policies. Broz (2002)
shows that low-credibility non-democracies are more like to choose pegs than
democracies because pegs provide the transparency that autocracies lack. While an
exchange-rate target is a simple and verifiable promise, CBI and IT are more difficult to
observe, even for academic specialists!
A second characteristic of fixed exchange rates that helps anchor expectations is
that pegs eliminate discretion. By delegating monetary policy authority to the anchor
currency's central bank, exchange-rate targets result in losing much, if not all, monetary
autonomy. By contrast, the entire logic of adopting CBI or IT is to allow a modicum of
policy flexibility so that monetary instruments can be used for stabilization purposes.
But this discretion may result in a loss of credibility.
Third, pegging is costly. Not only does pegging require governments to sacrifice
domestic policy autonomy, it can also cause speculative attacks unrelated to the
fundamentals. In the sprint of signaling models, the costliness of adopting a peg could be
what makes pegging so credible in the eyes of the private sector in our data. The
knowledge that costly trade-offs exist lends credibility to the commitment since it would
not be optimal to incur the costs of pegging unless the commitment to low inflation is
unusually strong (Flood and Isard 1989)
These theoretical considerations provide a foundation for interpreting our results.
Of course, further research is needed before we draw definitive conclusions.

26
Bibliography Alesina, Alberto and Lawrence H. Summers. 1993. "Central Bank Independence and
Macroeconomic Performance: Some Comparative Evidence." Journal of Money, Credit, and Banking 25, 2 (May): 151-62.
Atkenson, Andrew and Patrick Kehoe. 2001. “The Advantage of Transparent Instruments of Monetary Policy.” NBER Working Paper No.8681
Ball, Laurence and Niamh Sheridan. 2003. “Does Inflation Targeting Matter?” NBER Working Paper No. 9577.
Barro, Robert J. and Gordon, David B. 1983. “A Positive Theory of Monetary Policy in a Natural Rate Model.” Journal of Political Economy 91(4):589-610.
Batra, Geeta, Daniel Kaufmann and Andrew H. W. Stone. 2003. Investment Climate around the World: Voices of the Firms from the World Business Environment Survey. Washington, DC: The World Bank.
Beck, Thorsten, Asli Demirguc-Kunt, Vojislav Maksimovic. 2004. " Bank Competition and Access to Finance: International Evidence." Journal of Money, Credit & Banking 36 (3): 627-648.
Berger, Helge, Jakob de Haan, and Sylvester Eijffinger. 2001. “Central Bank Independence: An Update of Theory and Evidence.” Journal of Economic Surveys 15 (1):3-40.
Bernanke, Ben S., Thomas Laubach, Frederic S. Mishkin, and Adam S. Posen. 1999. Inflation Targeting: Lessons from the International Experience. Princeton, NJ: Princeton University Press.
Bernanke, Ben S. and Frederic S. Mishkin (1997) “Inflation Targeting: A New Framework for Monetary Policy?” Journal of Economic Perspectives 11(2):97-116.
Bleaney, Michael, and Manuela Francisco (2007) “Exchange Rate Regimes, Inflation and Growth in Developing Countries – An Assessment.” The B.E. Journal of Macroeconomics 7, 1 (Topics), Article 18. Available at: http://www.bepress.com/bejm/vol7/iss1/art18
Broz, J. Lawrence. 2002. "Political System Transparency and Monetary Commitment Regimes." International Organization 56, 4 (Autumn):863-889.
Broz, J. Lawrence, Jeffry Frieden, and Stephen Weymouth. 2008. "Exchange Rate Policy Attitudes: Direct Evidence from Survey Data." IMF Staff Papers 55 (3): forthcoming.
Broz, J. Lawrence and Stephen Weymouth. 2007. "Interests versus Institutions as Determinants of Property Rights: Evidence from Survey Data." Unpublished working paper.
Calvo, Guillermo A., and Végh, Carlos. 1999. "Inflation Stabilization and BOP Crises in Developing Countries." In Handbook of Macroeconomics, Vol. 1C, ed. John B. Taylor and Michael Woodford, pp. 1531-1614. Amsterdam: North-Holland.
Canavan, Chris and Mariano Tommasi. 1997. "On the Credibility of Alternative Exchange-Rate Regimes." Journal of Developmental Economics 54 (1):101–22.
Clarke, George, Robert Cull and Maria Soledad Martinez Peria. 2001. “Does Foreign Bank Penetration Reduce Access to Credit in Developing Countries? Evidence from Asking Borrowers.” World Bank Policy Research Working Paper 2716.

27
Crowe, Christopher. 2006. “Testing the Transparency Benefits of Inflation Targeting: Evidence from Private Sector Forecasts.” Working Paper 06/289, International Monetary Fund.
Crowe, Christopher and Ellen E. Meade. 2007. "The Evolution of Central Bank Governance around the World." Journal of Economic Perspectives 21, 4 (Fall): 69–90.
Cukierman, Alex, 1992, Central Bank Strategy, Credibility, and Independence (Cambridge: MIT Press).
Cukierman, Alex, Steven B. Webb, and Bilin Neyapti. 1992. Measuring the Independence of Central Banks and Its Effect on Policy Outcomes. World Bank Economic Review 6 (3):353–98.
Cukierman, Alex, and Steven B. Webb. 1995. Political Influence on the Central Bank: International Evidence. World Bank Economic Review 9 (3):397–423.
de Haan, Jakob and Willem Kooi. 2000. Does Central Bank Independence Really Matter? New Evidence for Developing Countries Using a New Indicator. Journal of Banking and Finance 24 (4):646–64.
de Haan, Jakob and Gert Jan Van ’t Hag. 1995. Variation in Central Bank Independence Across Countries: Some Provisional Empirical Evidence. Public Choice 85 (3–4):335–51.
Forder, James. 1998. "Central Bank Independence: Conceptual Clarifications and Interim Asessment." Oxford Economic Papers 51 (3): 307-334.
Flood, Robert and Peter Isard. 1989. Monetary Policy Strategies. IMF Staff Papers 36 (3):612-32.
Frankel, Jeffrey. 1999. “No Single Currency Regime is Right for All Countries or at All Times.” Princeton Essays in International Finance No. 215, Princeton University Press.
Giavazzi, Francesco and Marco Pagano. 1988. "The Advantage of Tying One’s Hands: EMS Discipline and Central Bank Credibility." European Economic Review 32 (5):1055–82.
Ghosh, Atish R., Anne-Marie Gulde, and Holger Wolf. 2002. Exchange Rate Regimes, Choices and Consequences. Cambridge, Massachusetts and London, England: The MIT Press.
Grilli, V., D. Masciandaro and Guido Tabellini. 1991. "Institutions and Policies." Economic Policy 6: 341-392.
IMF. 2005. “Does Inflation Targeting Work in Emerging Markets?” World Economic Outlook, 2005. Chapter 4, pp. 161-86. Washington D.C.: International Monetary Fund.
Keefer, Philip and David Stasavage (2003). "The Limits of Delegation: Veto Players, Central Bank Independence and the Credibility of Monetary Policy." American Political Science Review (August).
Kydland, Finn E. and Prescott, Edward C. 1977. “Rules Rather Than Discretion: The Inconsistency of Optimal Plans.” Journal of Political Economy 85(3): 473-491.
Leiderman, Leonardo and Lars E. O. Svensson. 1995. Inflation Targets. Washington, D.C.: Brookings.
Levy-Yeyati, Eduardo and Federico Sturzenegger. 2005. "Classifying Exchange Rate Regimes: Deeds vs. Words." European Economic Review 49(6): 1603-1635.
28
Lohmann, Susanne. 1992. “Optimal Commitment in Monetary Policy: Credibility versus Flexibility." American Economic Review 82(1):273-286.
Mankiw, N. Gregory, Ricardo Reis, and Justin Wolfers. 2003. "Disagreement about Inflation Expectations," NBER Macroeconomics Annual, pp. 209-248.
Mahadeva, Lavan and Gabriel Sterne. 2000. Monetary Frameworks in a Global Context. New York: Routledge.
Mishkin, Frederic S. 2004. “Can Inflation Targeting Work in Emerging Market Countries?” NBER Working Paper No. 10646.
Mishkin, Frederic S. and Klaus Schmidt-Hebbel. 2007. "Does Inflation Targeting Make a Difference?" NBER Working Paper No. 12876
Mishkin, Frederic S. and Klaus Schmidt-Hebbel. 2002. “One Decade of Inflation Targeting in the World: What Do We Know and What Do We Need to Know?” In Inflation Targeting: Design, Performance, Challenges, edited by N. Loayza and R. Soto, 171–219. Santiago: Central Bank of Chile.
Pétursson, Thórarinn G. 2004. "Formulation of Inflation Targeting Around the World." Central Bank of Iceland, Monetary Bulletin 2004 (1):57-84
Polillo, Simone and Mauro F. Guillén. 2005. “Globalization Pressures and the State: The Global Spread of Central Bank Independence.” American Journal of Sociology 110, 6 (May):1764-1802.
Posen, Adam S. 1993. "Why Central Bank Independence Does Not Cause Low Inflation: There is no Institutional Fix for Politics." In Finance and the International Economy: 7 ed. Richard O'Brien. Oxford: Oxford University Press, 40–65.
Ravenna, Federico. 2005. “The European Monetary Union as a Commitment Device for New EU Member States.” ECB Working Paper 516, European Central Bank, August 2005.
Reinhart, Carmen M. and Kenneth Rogoff. 2004. "The Modern History of Exchange Rate Arrangements: A Reinterpretation." Quarterly Journal of Economics 119 (1):1-48.
Rogoff, Kenneth. 1985, “The Optimal Degree of Commitment to an Intermediate Target.” Quarterly Journal of Economics 100:1169-1190.
Shambaugh, Jay. 2003. “The Effect of Fixed Exchange Rates on Monetary Policy.” Quarterly Journal of Economics 119:301-52.
Thomas, Lloyd B. 1999. "Survey Measures of Expected U.S. Inflation." Journal of Economic Perspectives 13 (Fall):125-44.
Tomz, Michael, Jason Wittenberg, and Gary King. 1998. "CLARIFY: Software for Interpreting and Presenting Statistical Results." Version 1.2. Cambridge MA: Harvard University.
Walsh, Carl E. 1995. “Optimal Contracts for Central Bankers.” American Economic Review 85(1):150-167.

29
Figure 1: The Causal Pathway from Institutions to Aggregate Outcomes
Notes: The heavy horizontal black arrows indicate the causal pathway in the rational expectations theory of inflation. The upper dashed line depicts empirical research that bypasses individual expectations and behavior. Inside the oval is our approach: we estimate the impact of precommitment institutions on private sector inflation expectations.
Precommitment institution
Private sector
inflation expectations
Inflation outcome
Private sector
price/wage setting
Cross-Country Inflation Regressions
Our Approach

30
Figure 2: Firms' Concern with Inflation, by de facto Exchange Rate Regime
3.232.83
2.40
0
0.5
1
1.5
2
2.5
3
3.5
4
Float Intermediate FixedExchange Rate Regime, 1999 (Reinhart and Rogoff)
Ave
rage
Res
pons
eMajor Problem
Figure 3: Firm Owners' Concern with Inflation, by de facto Exchange Rate Regime
3.00 2.882.45
00.5
11.5
22.5
33.5
4
Float Intermediate FixedExchange Rate Regime, 1999 (Levy-Yeyati & Sturzenegger)
Ave
rage
Res
pons
e
Major Problem

31
Figure 4: Firms' Concern with Inflation, by de jure Exchange Rate Regime
2.97 2.87
2.39
0
0.5
1
1.5
2
2.5
3
3.5
4
Float Intermediate Peg
Exchange Rate Regime, 1999 (Official IMF classification)
Ave
rage
Res
pons
eMajor Problem
Figure 5: Firms' Concern with Inflation, by de jure Central Bank Independence
2.74 2.90
0 0.5
1 1.5
2 2.5
3 3.5
4
CBI < mean (N=3,782) CBI > mean (N=3,360)
Central Bank Independence, 1999Cukierman, Webb, Neyapti (Polillo and Guillén)
Ave
rage
Res
pons
e
Major Obstacle
32
Figure 6: Firms' Concern with Inflation, by de jure Central Bank Independence
2.99
2.55
0
0.5
1
1.5
2
2.5
3
3.5
4
CBI < mean (N=2,608) CBI > mean (N=4,004)
Central Bank Independence, 1998(Mahateva and Sterne, 2000)
Ave
rage
Res
pons
eMajor Problem
Figure 7: Firms' Concern with Inflation, by de facto Central Bank Independence
2.66
3.11
0
0.5
1
1.5
2
2.5
3
3.5
4
Turnover < mean (n=4,596) Turnover > mean (n=3,569)
Central Bank Independence(Turnover Rate, 1995-99)
Aver
age
Resp
onse
Major Problem

33
Figure 8: Firms' Concern with Inflation, by Inflation Targeting
2.86
2.46
0
0.5
1
1.5
2
2.5
3
3.5
4
No Target Target
Inflation Targeting, 1999 (Mishkin)(Canada, Chile, Czech Rep, Mexico, Poland, Sw eden, UK)
Aver
age
Resp
onse
Major Problem
Figure 9: Firms' Concern with Inflation, by Inflation Targeting
2.692.84
0
0.5
1
1.5
2
2.5
3
3.5
4
Focus on Inflation < mean (N=4,222) Focus on Inflation > mean (N=2,515)
Inflation Targeting, 1998(Mahadeva and Sterne, 2000)
Aver
age
Res
pons
e
Major Problem

34
Table 1: Firm Owners' Inflation Concern, Country Averages Country Inflation
Concern Inflation
1999 1. Bosnia 1.32 8.362. Singapore 1.56 0.023. Sweden 1.69 0.464. Tunisia 1.74 2.695. Germany 1.86 0.576. Botswana 1.95 7.757. France 1.97 0.508. Argentina 2.01 -1.179. Panama 2.02 1.2510. Namibia 2.02 6.49 … top 10 mean 1.81 2.69 70. Russia 3.51 86.0071. Zambia 3.52 26.7972. Turkey 3.56 64.8773. Kazakhstan 3.57 8.3074. Malawi 3.60 44.8075. Belarus 3.65 293.6876. Kyrgizstan 3.73 37.5777. Ecuador 3.76 52.2478. Zimbabwe 3.84 58.5279. Moldova 3.84 39.27 ... bottom 10 mean 3.66 71.20
Note: "Inflation Concern" is the average of firm owner responses, by country, to the WBES inquiry: “Please judge on a four point scale how problematic inflation is to the operation and growth of your business:” (1 = “No Obstacle” to 4 = “Major Obstacle”). "Inflation" is the percentage change in consumer prices in 1998-1999.

35
Table 2: Summary Statistics
Firm-Level Variables Mean Std. Dev. Min. Max. INFLATION CONCERN 2.083 1.074 1 4SALES CHANGE 0.124 0.477 -1 9FIRM SIZE 1.792 0.753 1 3MANUFACTURING 0.362 0.481 0 1SERVICES 0.431 0.495 0 1FOREIGN OWNERSHIP 0.189 0.391 0 1EXPORTER 0.359 0.48 0 1
Country-Level Variables Mean Std. Dev. Min. Max. INFLATION 16.955 38.231 -8.516 293.679GDPpc 4.0019 6.448 .1169 33.748dGDPpc 3.541 3.841 -6.299 11.91PEG (RR) 1.006 0.68 0 2PEG (LYS) 0.928 0.819 0 2PEG (IMF) 0.657 0.866 0 2CBI (CWN) 0.552 0.19 0.21 0.92CBI (M&S) 0.781 0.122 0.416 0.978CBI (TURNOVER) 0.19 0.25 0 1IT (MISHKIN) 0.087 0.283 0 1IT (M&S) 0.456 0.285 0 1

36
Table 3: "Inflation Concern," by Exchange Rate Regime (Ordered Probit Regressions of Firm-Level Responses)
1 2 3 4 5 Sales change -0.067 -0.054 -0.052 -0.066 -0.046 (0.039)* (0.030)* (0.028)* (0.029)** (0.028)* Firm size -0.057 -0.097 -0.109 -0.098 -0.099 (0.028)** (0.025)*** (0.025)*** (0.025)*** (0.023)*** Manufacturing -0.227 -0.178 -0.156 -0.151 -0.161 (0.060)*** (0.045)*** (0.045)*** (0.043)*** (0.042)*** Services -0.226 -0.153 -0.161 -0.16 -0.146 (0.067)*** (0.048)*** (0.049)*** (0.048)*** (0.047)*** Foreign owned -0.212 -0.101 -0.091 -0.119 -0.091 (0.065)*** (0.054)* (0.054)* (0.054)** (0.053)* Exporter -0.332 -0.148 -0.174 -0.172 -0.132 (0.064)*** (0.050)*** (0.047)*** (0.049)*** (0.049)*** Inflation, 1999 0.008 0.007 0.007 0.008 (0.004)** (0.003)** (0.003)** (0.003)** GDPpc, 1999 -0.039 -0.038 -0.038 -0.035 (0.007)*** (0.007)*** (0.007)*** (0.007)*** dGDPpc, 1999 -0.036 -0.035 -0.035 -0.044 (0.011)*** (0.013)*** (0.011)*** (0.013)*** Peg (RR) -0.183 (0.089)** Peg (LYS) -0.13 (0.055)** Peg (IMF) -0.169 (0.055)*** Observations 7886 7807 7093 7577 7778Pseudo R2 0.014 0.071 0.081 0.076 0.078 Robust standard errors in parentheses, clustered by country * significant at 10%; ** significant at 5%; *** significant at 1% Note: The dependant variable, "Inflation Concerns" is the firm owner response to the WBES inquiry: “Please judge on a four point scale how problematic inflation is to the operation and growth of your business:” (1="No Obstacle"...to... 4="Major Obstacle").

37
Table 4: "Inflation Concern," by Monetary Anchor (Ordered Probit Regressions of Firm-Level Responses)
1 2 3 4 5 6 7 8
Sales change -0.054 -0.052 -0.066 -0.050 -0.088 -0.053 -0.054 -0.083
(0.030)* (0.028)* (0.029)** (0.030)* (0.025)*** (0.031)* (0.030)* (0.026)*** Firm size -0.097 -0.109 -0.098 -0.103 -0.083 -0.09 -0.097 -0.081 (0.025)*** (0.025)*** (0.025)*** (0.026)*** (0.026)*** (0.027)*** (0.025)*** (0.024)*** Manufacturing -0.101 -0.091 -0.119 -0.118 -0.083 -0.114 -0.101 -0.087
(0.054)* (0.054)* (0.054)** (0.055)** (0.056) (0.055)** (0.054)* (0.055) Services -0.148 -0.174 -0.172 -0.160 -0.117 -0.142 -0.149 -0.134 (0.050)*** (0.047)*** (0.049)*** (0.053)*** (0.047)** (0.052)*** (0.049)*** (0.046)*** Foreign owned -0.178 -0.156 -0.151 -0.179 -0.162 -0.158 -0.178 -0.156 (0.045)*** (0.045)*** (0.043)*** (0.048)*** (0.053)*** (0.050)*** (0.046)*** (0.052)*** Exporter -0.153 -0.161 -0.16 -0.135 -0.085 -0.115 -0.153 -0.092 (0.048)*** (0.049)*** (0.048)*** (0.052)*** (0.048)* (0.051)** (0.048)*** (0.047)* Inflation, 1999 0.008 0.007 0.007 0.008 0.015 0.008 0.008 0.016 (0.004)** (0.003)** (0.003)** (0.003)** (0.003)*** (0.004)** (0.004)** (0.003)*** GDPpc, 1999 -0.039 -0.038 -0.039 -0.039 -0.037 -0.041 -0.040 -0.035 (0.007)*** (0.007)*** (0.007)*** (0.007)*** (0.009)*** (0.008)*** (0.008)*** (0.007)*** dGDPpc, 1999 -0.036 -0.035 -0.035 -0.030 -0.025 -0.036 -0.036 -0.031 (0.011)*** (0.013)*** (0.011)*** (0.013)** (0.015)* (0.015)** (0.011)*** (0.015)** PEG (RR) -0.183
(0.089)** PEG (LYS) -0.13
(0.055)** CBI (CWN) -0.252
(0.246) CBI (M&S) 0.19 (0.471) CBI (Turnover) 0.083 (0.227) IT (Mishkin) 0.011 (0.15) IT (M&S) 0.323
(0.161)** Observations 7807 7093 7577 6510 5327 6640 7807 5444 Pseudo R2 0.073 0.082 0.077 0.080 0.092 0.083 0.073 0.099 Robust standard errors in parentheses, clustered by country * significant at 10%; ** significant at 5%; *** significant at 1% Note: The dependant variable, "Inflation Concerns" is the firm owner response to the WBES inquiry: “Please judge on a four point scale how problematic inflation is to the operation and growth of your business:” (1="No Obstacle"...to... 4="Major Obstacle").

38
Table 5: "Economic Policy Predictability," by Monetary Anchor (Ordered Probit Regressions of Firm-Level Responses)
1 2 3 4 5 6 7 8
Sales change -0.018 -0.013 -0.024 -0.017 -0.045 -0.022 -0.019 -0.035 (0.027) (0.032) (0.03) (0.023) (0.03) (0.029) (0.027) (0.031) Firm size -0.093 -0.107 -0.099 -0.113 -0.137 -0.094 -0.092 -0.142 (0.029)*** (0.028)*** (0.028)*** (0.034)*** (0.033)*** (0.030)*** (0.029)*** (0.033)*** Manufacturing -0.028 -0.016 -0.027 -0.031 -0.061 -0.027 -0.027 -0.05 (0.048) (0.045 (0.042) (0.046) (0.047) (0.047) (0.048) (0.047) Services -0.059 -0.062 -0.068 -0.091 -0.09 -0.063 -0.06 -0.08 (0.046) (0.047) (0.046) (0.047)* (0.051)* (0.048) (0.046) (0.05) Foreign owned -0.121 -0.107 -0.109 -0.121 -0.151 -0.126 -0.12 -0.143
(0.044)*** (0.043)** (0.043)** (0.050)** (0.050)*** (0.046)*** (0.045)*** (0.050)*** Exporter -0.074 -0.066 -0.074 -0.059 -0.014 -0.091 -0.076 -0.01
(0.040)* (0.038)* (0.039)* (0.042) (0.05) (0.039)** (0.040)* (0.048) Inflation, 1999 0.004 0.002 0.003 0.004 0.008 0.003 0.004 0.008
(0.002)** (0.001)* (0.002)* (0.002)* (0.002)*** (0.002)* (0.002)** (0.002)*** GDPpc, 1999 -0.012 -0.009 -0.012 -0.018 -0.015 -0.011 -0.013 -0.012
(0.005)** (0.016) (0.005)** (0.006)** (0.006)** (0.007)* (0.005)** (0.006)** dGDPpc, 1999 -0.005 -0.006 -0.003 -0.002 0.015 0.001 -0.005 0.013 (0.017) (0.016) (0.017) (0.018) (0.018) (0.02) (0.017) (0.019) PEG (RR) -0.21
(0.082)** PEG (LYS) -0.097
(0.058)* CBI (CWN) 0.244
(0.310) CBI (M&S) 0.425 (0.618) CBI (Turnover) 0.299 (0.198) IT (Mishkin) 0.061 (0.121) IT (M&S) 0.107 (0.142) Observations 6778 6475 6581 5818 4995 6171 6778 5108 Pseudo R2 0.017 0.022 0.019 0.018 0.026 0.019 0.017 0.026 Robust standard errors in parentheses, clustered by country * significant at 10%; ** significant at 5%; *** significant at 1% Note: The dependant variable, "Economic Policy Predictability" is the firm owner response to the WBES inquiry: “Do you regularly have to cope with unexpected changes in economic and financial policies which materially affect your business? Changes in economic and financial policies are: 1=completely predictable... to...6=completely unpredictable."

39
Table 6: "Central Bank Quality," by Monetary Anchor (Ordered Probit Regressions of Firm-Level Responses)
1 2 3 4 5 6 7 8
Sales change -0.061 -0.057 -0.06 -0.078 -0.066 -0.104 -0.058 -0.074
(0.047) (0.049) (0.051) (0.049) (0.049) (0.047)** (0.045) (0.052) Firm size -0.107 -0.116 -0.107 -0.085 -0.108 -0.102 -0.111 -0.105
(0.034)*** (0.034)*** (0.035)*** (0.035)** (0.037)*** (0.035)*** (0.034)*** (0.036)*** Manufacturing -0.003 0.009 -0.015 -0.011 0.035 -0.046 -0.006 0.009
(0.08) (0.081) (0.081) (0.078) (0.082) (0.076) (0.08) (0.078) Services -0.09 -0.097 -0.111 -0.093 -0.043 -0.128 -0.09 -0.073 (0.083) (0.084) (0.084) (0.084) (0.082) (0.083) (0.083) (0.08) Foreign owned -0.045 -0.053 -0.05 -0.067 0.028 -0.055 -0.048 0.016 (0.06) (0.061) (0.059) (0.058) (0.068) (0.058) (0.058) (0.066) Exporter -0.16 -0.164 -0.178 -0.197 -0.156 -0.197 -0.155 -0.159
(0.070)** (0.069)** (0.070)** (0.071)*** (0.076)** (0.071)*** (0.069)** (0.077)** Inflation, 1999 0.004 0.002 0.004 0.004 0.009 0.003 0.004 0.009
(0.002)* (0.002) (0.002)* (0.002)* (0.003)*** (0.002) (0.002)* (0.003)*** GDPpc, 1999 -0.016 -0.013 -0.016 -0.014 -0.014 -0.015 -0.014 -0.015
(0.008)** (0.008) (0.008)** (0.009)* (0.011) (0.009)* (0.009) (0.009) dGDPpc, 1999 -0.008 -0.009 -0.008 0.002 0 -0.003 -0.008 0.001 (0.017) (0.019) (0.018) (0.022) (0.027) (0.024) (0.017) (0.025) PEG (RR) -0.207
(0.088)** PEG (LYS) -0.013
(0.073) CBI (CWN) 0.052
(0.348) CBI (M&S) 0.066
(0.665) CBI (Turnover) 0.366 (0.227)* IT (Mishkin) -0.182 (0.188) IT (M&S) -0.052 (0.237) Observations 5757 5382 5607 4799 4083 5119 5757 4164 Pseudo R2 0.021 0.026 0.022 0.023 0.032 0.027 0.022 0.034 Robust standard errors in parentheses * significant at 10%; ** significant at 5%; *** significant at 1% Note: The dependant variable, "Central Bank Quality" is the firm owner response to the WBES inquiry: “Please rate the overall quality and efficiency of services delivered by the following public agencies or services: The Central Bank." Responses range from 1="Very Good"...to...6="Very Bad."
40
Appendix A: Country Averages Firm-Level Variables Country-Level Variables
Country dSales Size Manuf. Serv. Foreign Export Inflation GDPpc dGDPpc Peg (RR) Peg (LYS) Peg (IMF) CBI (CWN) CBI
(M&S) CBI
(Turnover) IT (Mishkin) IT
(M&S) Albania 0.14 1.40 0.29 0.50 0.13 0.20 0.39 1115.05 10.10 0 0 0 0.51 0.66 0 0.94 Argentina 0.06 1.88 0.32 0.54 0.32 0.28 -1.17 7847.37 -3.39 2 2 0 0.74 0.79 0 0 0 Armenia -0.16 1.40 0.21 0.66 0.02 0.08 0.65 582.28 3.30 1 2 0 0.85 0.76 0 0 1 Azerbaijan -0.11 1.41 0.30 0.48 0.03 0.06 -8.52 594.49 7.40 1 1 0 0.25 0 0 Bangladesh 0.13 2.02 0.51 0.29 0.20 0.49 6.11 325.06 4.87 2 0.56 0 0.44 Belarus 0.08 1.89 0.28 0.27 0.06 0.26 293.68 1199.66 3.40 0 0 0 0.73 0.67 0 Belize 0.06 1.38 0.40 0.49 0.27 0.22 -1.21 3048.29 8.44 2 2 0.43 0 0 0.27 Bolivia 0.03 1.95 0.49 0.47 0.26 0.36 2.16 1005.56 0.43 1 1 1 0.63 0.33 0 Bosnia 0.49 1.70 0.52 0.42 0.13 0.58 8.36 1369.54 9.60 2 2 2 0.81 0 0 Botswana 0.27 1.84 0.23 0.42 0.47 0.51 7.75 3354.68 7.22 1 2 2 0.45 0.65 0.33 0 0.63 Brazil 0.02 2.00 0.32 0.61 0.24 0.29 4.86 3600.81 0.31 0 1 2 0.21 1 0 Bulgaria 0.12 1.54 0.51 0.27 0.10 0.33 2.57 1456.37 2.30 2 2 2 0.55 0.79 0 0 Cambodia 0.07 1.31 0.48 0.44 0.21 0.18 4.01 268.21 11.91 1 0 0 Cameroon 0.15 1.91 0.34 0.27 0.57 0.66 1.87 624.16 4.39 2 2 2 0 Canada 0.13 2.02 0.28 0.64 0.25 0.47 1.72 22586.70 5.53 1 0 0 0.45 0.91 0 1 0.88 Chile 0.07 2.01 0.45 0.50 0.34 0.41 3.34 4763.95 -0.76 1 0 0 0.77 0.93 0 1 0.88 China 0.03 1.81 0.60 0.36 0.35 0.33 -1.41 881.85 7.60 2 2 2 0.29 0.68 0 0 0.31 Colombia 0.05 2.36 0.38 0.58 0.39 0.40 10.88 1985.11 -4.20 1 0 1 0.44 0 0 Costa Rica 0.20 2.16 0.53 0.39 0.32 0.44 10.05 4079.52 8.22 1 1 1 0.61 0.33 0 Cote d'Ivoire 0.08 2.06 0.26 0.22 0.48 0.65 0.79 648.55 1.59 2 2 2 0 Croatia 0.07 1.98 0.51 0.46 0.13 0.67 4.01 3937.04 -0.86 1 1 2 0.44 0.79 0 0.75 Czech Rep 0.06 1.43 0.18 0.67 0.15 0.32 2.14 5321.85 1.34 1 0 0 0.73 0.98 0.33 1 0.94 Dom Rep 0.18 2.16 0.57 0.33 0.21 0.32 6.47 2126.69 8.15 1 1 0 0 0 Ecuador -0.05 1.99 0.52 0.42 0.12 0.23 52.24 1277.43 -6.30 0 1 0 0.93 0.33 0 0.56 Egypt 0.07 2.19 0.17 0.41 0.14 0.58 3.08 1450.47 6.11 2 2 0.55 0.53 0 0 0.44 El Salvador -0.01 1.92 0.54 0.39 0.18 0.28 0.51 2111.84 3.45 2 2 2 0 Estonia 0.52 1.66 0.37 0.52 0.20 0.57 3.30 3790.14 0.31 2 2 2 0.78 0.85 0.33 0 0 Ethiopia 0.23 1.86 0.33 0.17 0.09 0.17 7.94 116.92 6.04 1 0 0.44 0.33 0 France 0.13 1.88 0.40 0.56 0.24 0.44 0.50 21800.36 3.30 2 2 2 0.78 0.90 0 0 0.4 Georgia 0.09 1.53 0.31 0.47 0.14 0.24 19.19 628.88 2.88 1 1 0 0.73 0.80 0 0 0.56 Germany 0.06 1.89 0.20 0.64 0.30 0.36 0.57 22428.94 2.01 2 2 2 0.92 0.96 0 0 0.19 Ghana 0.14 1.91 0.27 0.31 0.30 0.37 12.41 243.80 4.40 1 2 0 0.31 0.60 0.33 0 0.19 Guatemala 0.15 1.83 0.39 0.50 0.21 0.31 4.86 1697.85 3.85 1 0 0 0.33 0 Haiti 0.00 1.68 0.42 0.47 0.20 0.21 8.67 454.95 2.70 0 0 0 0.33 0 Honduras 0.06 1.70 0.50 0.46 0.18 0.34 11.65 927.62 -1.89 1 0 1 0.55 0 0 Hungary 0.21 1.50 0.24 0.50 0.07 0.32 10.00 4451.99 4.17 1 0 1 0.67 0.86 0.33 0 0.19 India 0.11 2.22 0.77 0.05 0.28 0.62 4.67 442.77 7.39 1 1 0 0.34 0.83 0.33 0 0.44 Indonesia -0.04 1.88 0.20 0.70 0.18 0.25 20.49 772.63 0.79 0 1 0 0.8 0.56 0 0.5 Italy 0.10 2.02 0.27 0.69 0.31 0.34 1.66 18611.54 1.93 2 2 2 0.92 0.88 0 0 0.44 Kazakhstan 0.07 1.66 0.20 0.53 0.06 0.20 8.30 1115.95 2.70 1 1 0 0.44 0.76 0.33 0 0.44 Kenya 0.11 2.27 0.36 0.24 0.36 0.80 5.74 414.69 2.28 1 0 0 0.5 0.66 0 0 0.44 Kyrgizstan 0.00 1.75 0.28 0.25 0.06 0.11 37.57 267.03 3.66 0 1 0 0.52 0.33 0 0.75
41
Appendix A: Country Averages (cont.) Firm-Level Variables Country-Level Variables
Country dSales Size Manuf. Serv. Foreign Export Inflation GDPpc dGDPpc Peg (RR)
Peg (LYS)
Peg (IMF)
CBI (CWN)
CBI (M&S)
CBI (Turnover)
IT (Mishkin)
IT (M&S)
Lithuania 0.05 1.20 0.19 0.68 0.05 0.28 0.75 3111.85 -1.70 2 1 2 0.78 0.89 0.33 0 0 Madagascar 0.13 2.08 0.35 0.15 0.23 0.45 9.93 235.48 4.66 0 0 0 0 Malawi 0.38 2.18 0.17 0.17 0.31 0.53 44.80 152.07 3.04 0 2 0 0.33 0 Malaysia 0.00 1.70 0.53 0.40 0.18 0.40 2.74 3646.64 6.14 2 2 2 0.36 0.85 0 0 0.44 Mexico 0.17 2.03 0.53 0.37 0.15 0.39 16.59 5647.06 3.87 1 0 0 0.56 0.82 0.33 1 0.94 Moldova -0.10 1.78 0.26 0.34 0.02 0.22 39.27 300.38 -3.40 0 0 0 0.73 0.80 0 0 0.38 Namibia 0.19 1.81 0.17 0.40 0.32 0.66 6.49 1791.80 3.37 2 2 0.50 0 0.13 Nicaragua 0.16 1.62 0.46 0.44 0.17 0.17 11.55 752.03 7.04 1 1 1 0.63 0 Nigeria 0.23 2.15 0.20 0.48 0.26 0.39 6.62 358.95 1.10 1 1 0 0.37 0.42 0 0 0.25 Pakistan 0.03 1.83 0.48 0.50 0.16 0.45 4.14 526.23 3.66 1 0 0 0.21 0 0 Panama 0.07 2.26 0.49 0.47 0.21 0.42 1.25 3910.04 3.92 2 2 2 0.22 0 0 Peru -0.02 2.06 0.39 0.43 0.26 0.24 3.47 2044.19 0.91 2 0 0 0.74 0.89 0 0 0.44 Philippines 0.06 1.95 0.45 0.53 0.23 0.32 5.95 959.85 3.40 1 0 0 0.48 0 0 Poland 0.25 1.65 0.28 0.56 0.08 0.42 7.28 4250.87 4.52 1 0 1 0.89 0.86 0 1 0.94 Portugal 0.06 1.86 0.25 0.70 0.28 0.22 2.30 10654.18 3.94 2 2 2 0.88 0.85 0 0 0.06 Russia 0.21 1.70 0.27 0.38 0.02 0.08 86.00 1613.70 6.40 0 0 0 0.49 0.76 0.33 0 0.31 Senegal 0.07 1.69 0.23 0.16 0.14 0.47 0.83 451.70 6.35 2 2 2 0 Singapore 0.09 1.93 0.32 0.53 0.36 0.46 0.02 21280.18 7.20 1 2 0 0.29 0.90 0 0 0.19 Slovakia 0.10 1.53 0.26 0.59 0.05 0.46 10.57 3749.45 0.32 1 2 0 0.62 0.90 0 0 0.52 Slovenia 0.24 1.80 0.49 0.34 0.14 0.74 6.15 9343.18 5.42 1 1 0 0.63 0.86 0 0 0.25 South Africa 0.21 2.43 0.36 0.26 0.30 0.85 5.18 2972.20 2.36 0 0 0 0.48 0.85 0 0 0.31 Spain 0.16 1.81 0.34 0.61 0.26 0.38 2.31 13844.53 4.75 2 2 2 0.86 0.80 0 0 0.56 Sweden 0.17 1.72 0.29 0.55 0.23 0.54 0.46 26187.51 4.53 1 0 0 0.75 0.97 0 1 1 Tanzania 0.16 1.83 0.30 0.25 0.35 0.37 7.89 261.53 3.53 1 0 0 0.5 0.60 0 0 0.25 Thailand 0.30 1.60 0.48 0.45 0.30 0.44 0.30 1949.70 4.45 1 1 0 0.82 0.67 0 0.31 Trin & Tobago 0.14 1.64 0.46 0.40 0.19 0.43 3.44 5931.14 4.39 2 0 0.33 0 Tunisia 0.14 2.42 0.39 0.41 0.18 0.59 2.69 1963.99 6.05 1 1 2 0 Turkey 0.08 1.75 0.44 0.31 0.09 0.41 64.87 2806.57 -4.71 1 0 1 0.46 0.70 0.67 0 0.44 Uganda 0.14 1.56 0.21 0.24 0.26 0.49 6.60 234.21 8.05 1 2 0 0.81 0 0 0.69 Ukraine 0.02 1.63 0.37 0.43 0.04 0.23 22.68 594.28 -0.38 1 0 0 0.42 0.63 0 0 0.56 UK 0.19 1.41 0.25 0.58 0.13 0.30 1.56 23656.10 3.02 1 0 1 0.47 0.77 0 1 1 United States 0.10 1.82 0.22 0.66 0.10 0.30 2.19 33748.21 4.49 1 1 1 0.48 0.92 0 0 0.19 Uruguay 0.00 2.03 0.65 0.29 0.17 0.53 5.66 6376.99 -2.85 0 0 0 0.54 0.70 0 0 0.25 Uzbekistan 0.48 1.82 0.30 0.26 0.14 0.16 44.12 543.30 4.30 0 0.56 0 0 Venezuela -0.01 2.02 0.45 0.46 0.24 0.38 23.57 4733.82 -5.97 1 1 1 0.63 0 0 West Bank -0.08 1.20 1.00 0.00 0.10 0.42 5.54 1532.43 8.77 0 Zambia 0.20 1.90 0.23 0.22 0.30 0.35 26.79 305.74 2.22 0 2 0 0.29 0.66 0.33 0 0.56 Zimbabwe 0.37 1.90 0.23 0.30 0.22 0.54 58.52 641.50 -3.60 2 2 2 0.34 0 0

42
Appendix B: Data and Sources Variable Source Description Sales change WBES Reported percentage change in
sales over the past three years Firm size WBES Firm size, ordered (1-3: small,
medium, large) Manufacturing sector WBES Firm operates in the
manufacturing sector, binary (1, 0; yes, no)
Services sector WBES Firm operates in the services sector, binary (1, 0; yes, no)
Foreign ownership WBES Foreign ownership of firm, binary (1, 0; yes, no)
Exports WBES Firm exports production, binary (1, 0; yes, no)
Inflation, 1999 WDI Inflation in consumer prices, 1999
GDPpc, 1999 WDI Per capita GDP/1000. 1999 data (in 2000 USD)
GDP growth, 1999 WDI GDP growth, 1999, in 2000 USD PEG (RR) Reinhart and Rogoff 2004 de facto exchange-rate regime,
ordered variable (0=float, 1=intermediate, 2=peg). Taken from mgcode, where 1 = peg, 2-3 = intermediate, 4-5 = float (5 corresponds to “freely falling”, which denotes a floating regime with at least forty percent inflation in a given year).
PEG (LYS) Levy-Yeyati and Sturzenegger 2005
de facto exchange-rate regime, ordered variable (0=float, 1=intermediate, 2=peg).
PEG (IMF) IMF, Annual Report on Exchange Arrangements and Exchange Restrictions
de jure exchange-rate regime, ordered variable (0=float, 1=intermediate, 2=peg).
CBI (CWN) Polillo and Guillén (2005) de jure CBI index for 1999, update of the Cukierman, Webb, and Neyapti (1992) data
CBI (M&S) Mahadeva and Sterne 2000 CBI index from a 1998 survey of central bankers. Values range from 0 to 1.
CBI (TURNOVER) Ghosh, Gulde, and Wolf 2002 de facto CBI: CB governor turnover rate, per five years.
IT (MISHKIN) Mishkin and Schmidt-Hebbel, 2002
Binary indicator; 1 if country was an inflation targeter prior to 1999.
IT (M&S) Mahadeva and Sterne 2002 "Inflation focus" is a weighted index of inflation targeting from a 1998 survey of central bankers.