Embed Size (px)
Citation preview
This Article is brought to you for free and open access by the Student Journals and Publications at University of New Hampshire Scholars' Repository. It has been accepted for inclusion in Perspectives by an authorized editor of University of New Hampshire Scholars' Repository. For more information, please contact [email protected].
Recommended Citation Coyman, Jill (2015) "The Effects of Alcohol Use on Academic Performance Among College Students," Perspectives: Vol. 7 , Article 5. Available at: https://scholars.unh.edu/perspectives/vol7/iss1/5
Follow this and additional works at: https://scholars.unh.edu/perspectives
Perspectives
Volume 7 2015 Article 5
9-1-2015
The Effects of Alcohol Use on Academic Performance Among The Effects of Alcohol Use on Academic Performance Among
College Students College Students
Jill Coyman University of New Hampshire, Durham


The Effects of Alcohol Use on Academic Performance
Among College Students
Jill Coyman
ABSTRACT
This study examines college students’ alcohol use and how it affects their academic
performance, specifically looking at grade point average (GPA). An online survey was given out to male and female students at the University of New Hampshire. Survey
questions focused on how much a particular student drank on average, and then asked for a cumulative GPA. The results of the survey show no direct correlation between the independent variable of alcohol use and the dependent variable of academic performance.
Further research, including a larger and more representative sample, would improve the findings.
1
Coyman: The Effects of Alcohol Use on Academic Performance Among College
Published by University of New Hampshire Scholars' Repository, 2015

Introduction
This research focuses on the effect alcohol use on college students’ academic
performance. Past research has shown the prevalence of alcohol use among colle ge
students. It has been found that a majority of students partake in drinking alcohol. It
has also been found that some students are able to successfully manage their
academic work in spite of drinking alcohol. Despite this finding, not all students are
successfully able to partake in both activities. This topic is socially important
because alcohol use is very common among students on college campuses. Alcohol
use is negatively affecting some students and families by causing potential dropouts
and failing classes. On the other hand, some students know how to balance their
academic work with their social life and not let it affect their academic performance.
The objective of this research is to successfully learn about binge drinking within
the UNH campus and how it is affecting students’ GPA.
Literature Review
Singleton and Wolfston (2009) examined alcohol consumption, amount of
sleep, and academic performance. The authors show the relationship between
alcohol use and sleep, alcohol use and academic performance, and sleep and
academic performance. The participants from Northeastern were 89% white, 98%
ranged between the ages of 18-22 years, and 82% lived on campus. In short, they
hypothesized and concluded that students who drink more alcohol maintain poor
sleep patterns, which negatively affects academic performance.
Gillespie et al. (2007) examined alcohol, marijuana, and cocaine use among college
students. The authors found that two out of five college students in the United States
are binge drinkers. According to the Federal Bureau of Investigation, there were
more than 1.25 million arrests for drug abuse violations in 2004 (Gillespie et al.,
2007). Alcohol and drug use can lead to poor decision making, like breaking the law,
sexual abuse, getting in fights, etc. Of the respondents, 92.4% were white and the
average age was 22.3 years. This study found that a little more than 68% reported
using alcohol and/or drugs during the past year. Gillespie et al. (2007) looked at
how many times a student drank alcohol in a week which then determined how
many alcoholic drinks they consume on average.
2
Perspectives, Vol. 7 [2015], Art. 5
https://scholars.unh.edu/perspectives/vol7/iss1/5
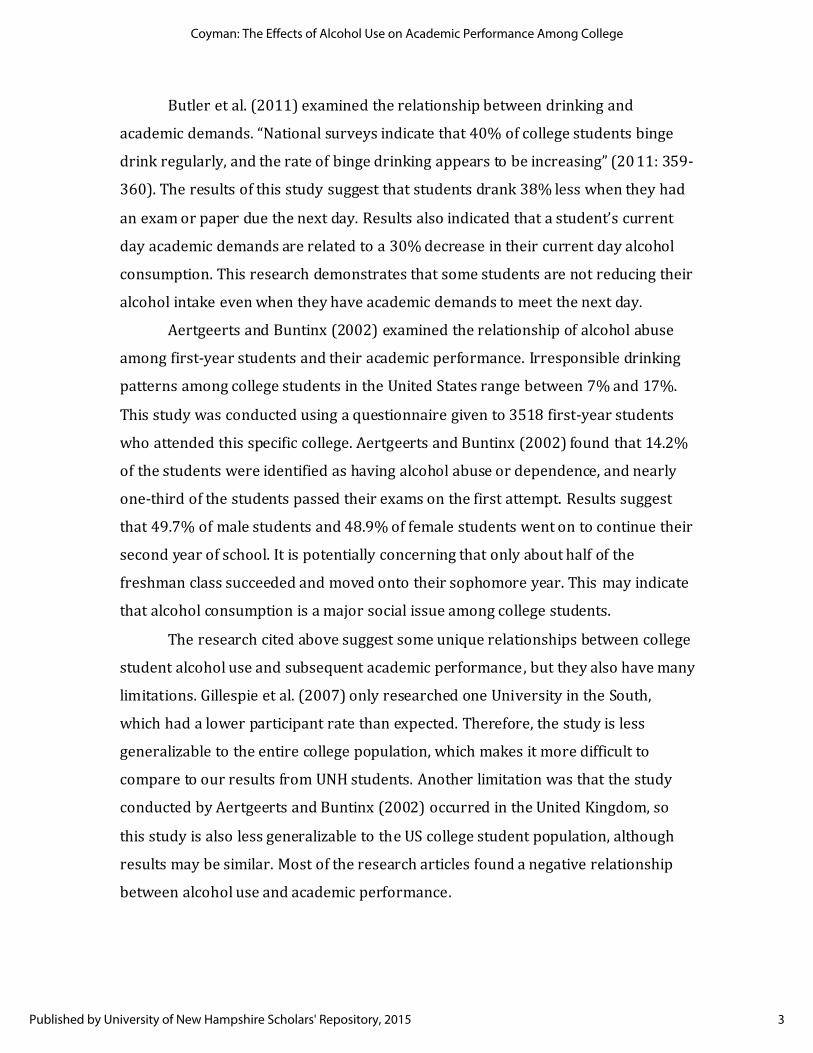
Butler et al. (2011) examined the relationship between drinking and
academic demands. “National surveys indicate that 40% of college students binge
drink regularly, and the rate of binge drinking appears to be increasing” (2011: 359-
360). The results of this study suggest that students drank 38% less when they had
an exam or paper due the next day. Results also indicated that a student’s current
day academic demands are related to a 30% decrease in their current day alcohol
consumption. This research demonstrates that some students are not reducing their
alcohol intake even when they have academic demands to meet the next day.
Aertgeerts and Buntinx (2002) examined the relationship of alcohol abuse
among first-year students and their academic performance. Irresponsible drinking
patterns among college students in the United States range between 7% and 17%.
This study was conducted using a questionnaire given to 3518 first-year students
who attended this specific college. Aertgeerts and Buntinx (2002) found that 14.2%
of the students were identified as having alcohol abuse or dependence, and nearly
one-third of the students passed their exams on the first attempt. Results suggest
that 49.7% of male students and 48.9% of female students went on to continue their
second year of school. It is potentially concerning that only about half of the
freshman class succeeded and moved onto their sophomore year. This may indicate
that alcohol consumption is a major social issue among college students.
The research cited above suggest some unique relationships between college
student alcohol use and subsequent academic performance, but they also have many
limitations. Gillespie et al. (2007) only researched one University in the South,
which had a lower participant rate than expected. Therefore, the study is less
generalizable to the entire college population, which makes it more difficult to
compare to our results from UNH students. Another limitation was that the study
conducted by Aertgeerts and Buntinx (2002) occurred in the United Kingdom, so
this study is also less generalizable to the US college student population, although
results may be similar. Most of the research articles found a negative relationship
between alcohol use and academic performance.
3
Coyman: The Effects of Alcohol Use on Academic Performance Among College
Published by University of New Hampshire Scholars' Repository, 2015

Hypotheses
The present research hypothesis is that using alcohol has a negative effect on
college student’s academic performance. The independent variable is alcohol use
and the dependent variable is academic performance. The null hypothesis is that
students who use alcohol are no more likely to do worse in their academics
compared to students who do not drink alcohol. The alternative hypothesis is that
students who abuse alcohol are more likely to have a worse GPA.
Research Method
Sample
In mid-April, all students enrolled in the Sociology Research Methods course
fielded surveys to a convenience sample of fellow UNH students. A convenience
sample is a nonrandom sample which utilizes a nonsystematic selection method that
often produces samples very unlike the population. Benefits of using a convenience
sample are low cost and time efficiency. It is most efficient for our class’ research to
send out surveys to fellow UNH students to gather data in a reasonable amo unt of
time before the semester ends. One major limitation of a convenience sample is that
it systematically excludes some individuals, and it is not representative of the larger
population. These surveys were administered through Qualtrics, which is an online
survey program. Emails were sent out to the students with the link to the survey to
fill out at their own convenience. The research subjects completed the survey
anonymously and they were not compensated. The first page of the survey
contained the consent form, which describes the rights of the participant in taking
this survey. Anonymity was ensured because signatures were not requested. Data
from the survey was collected anonymously and entered into the Qualtrics program.
This research may offer potential benefits for participants and the UNH community
by virtue of investigating how academic performance is related to alcohol and drug
use. There are also some potential risks associated with participation in this study,
namely that the survey could illicit harm to the participants if they are partaking in
the survey while they are currently failing classes due to alcohol use. People who
will be excluded from this study are students who do not have access to a computer
or email. The research participants are not generalizable to the entire population of
4
Perspectives, Vol. 7 [2015], Art. 5
https://scholars.unh.edu/perspectives/vol7/iss1/5

U.S. college students, because UNH students do not represent every college in the
US.
Variables
The online survey asks 74 close-ended questions to the 223 survey
respondents, both males and females from each grade. Alcohol use was
operationalized using the following questions: “In an average week, about how
many days do you consume alcohol?” The respondents were then given the
following five options: “I do not drink, about 1 day per week, about 2 days per week,
about 3 days per week, or about 4 or more days per week.” The second question
regarding academic performance was stated as follows: “What is your cumulative
GPA?” The respondents were then given the options: “Below 2.0, 2.0-2.49, 2.5-2.99,
3.0-3.49, or above 3.5.” The class reviewed the questions to make sure there would
be no confusion from the participants to ensure they were answered effectively.
Results
Table 1. Sample Characteristics
Gender
Male 41%
Female 59%
Academic Class Standing
Freshman 18%
Sophomore 27%
Junior 35%
Senior 20%
Race/Ethnicity
White 85%
Black 6%
Hispanic 5%
Asian 2%
Other 2%
5
Coyman: The Effects of Alcohol Use on Academic Performance Among College
Published by University of New Hampshire Scholars' Repository, 2015

Age 18-19 31%
20-21 54%
22-23 15%
24+ 0% ___________________________________________________________
Table 1 includes information regarding the respondents who participated in our
survey. More females (59%) than males (41%) took the survey, and a majority of these
individuals were white (85%). Academic class standing varied; fewer freshmen
participated in the survey (18%), compared to 27% sophomore, 35% junior, and 20%
senior. More than half of the respondents were aged 20-21 (54%), with the remaining
31% aged 18-19. These results show standard characteristics of our sample.
Figure 2 shows the frequency distribution for the independent variable, alcohol
use. The survey question that yielded these results is “In an average week, about how
many days do you consume alcohol?” This table shows that most students vary on how
much they drink. The most common response was drinking about three days per week
(33%). Drinking both one or two days per week received 25%, only 8% reported about
four or more days per week, and 9% reported not drinking at all.
9%
25%
25%
33%
9%
0 10 20 30 40 50 60 70
I do not drink
Drink about 1 day per week
Drink about 2 days per week
Drink about 3 days per week
Drink about 4 days or more per week
Number of Respondents who answered Yes
Res
po
nse
Figure 2. Frequency Distribution of Alcohol Consumption
6
Perspectives, Vol. 7 [2015], Art. 5
https://scholars.unh.edu/perspectives/vol7/iss1/5
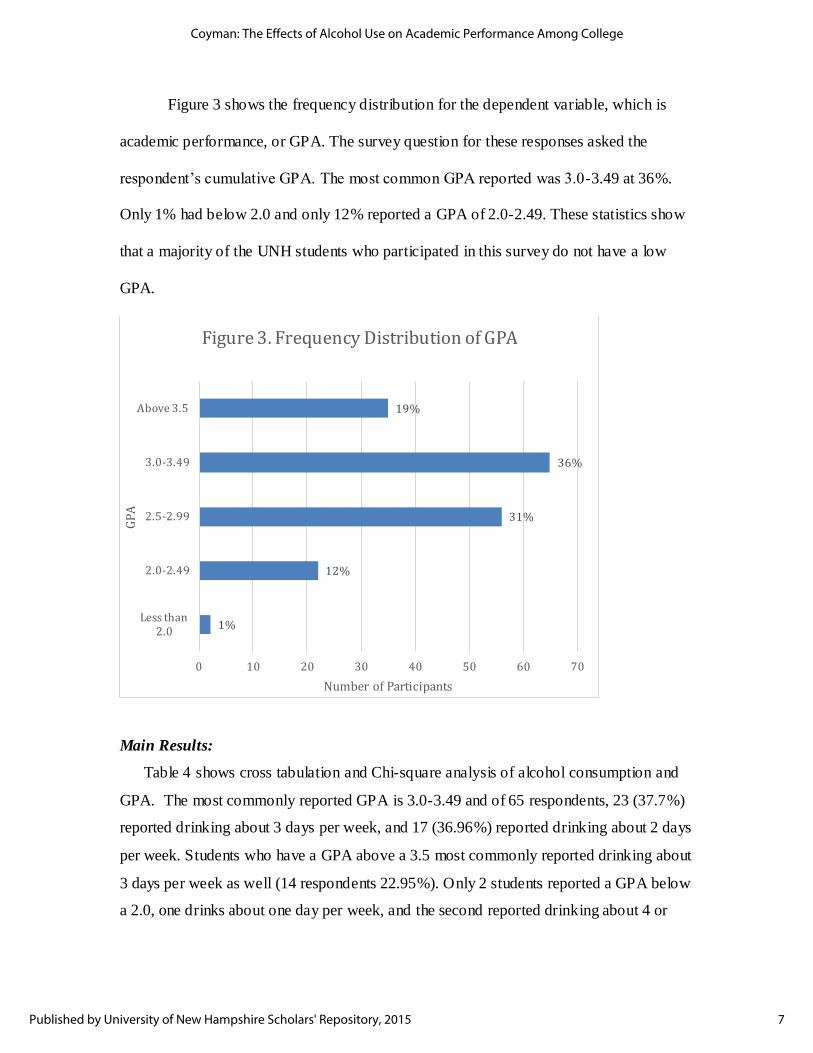
Figure 3 shows the frequency distribution for the dependent variable, which is
academic performance, or GPA. The survey question for these responses asked the
respondent’s cumulative GPA. The most common GPA reported was 3.0-3.49 at 36%.
Only 1% had below 2.0 and only 12% reported a GPA of 2.0-2.49. These statistics show
that a majority of the UNH students who participated in this survey do not have a low
GPA.
Main Results:
Table 4 shows cross tabulation and Chi-square analysis of alcohol consumption and
GPA. The most commonly reported GPA is 3.0-3.49 and of 65 respondents, 23 (37.7%)
reported drinking about 3 days per week, and 17 (36.96%) reported drinking about 2 days
per week. Students who have a GPA above a 3.5 most commonly reported drinking about
3 days per week as well (14 respondents 22.95%). Only 2 students reported a GPA below
a 2.0, one drinks about one day per week, and the second reported drinking about 4 or
1%
12%
31%
36%
19%
0 10 20 30 40 50 60 70
Less than 2.0
2.0-2.49
2.5-2.99
3.0-3.49
Above 3.5
Number of Participants
GP
A
Figure 3. Frequency Distribution of GPA
7
Coyman: The Effects of Alcohol Use on Academic Performance Among College
Published by University of New Hampshire Scholars' Repository, 2015

more days per week. The most common response was drinking about 3 days per week,
regardless of their GPA.
Table 4. In an average week, about how many days do you consume alcohol?
I do not drink
Drink 1 day per week
Drink 2 days per week
Drink 3 days per week
Drink 4 or more days per
week
Total
Below 2.0 0 0.00%
0 0.0%
1 2.17%
0 0.00%
1 7.14%
2 1.11%
2.0-2.49 2
14.29%
9
20.00%
3
6.52%
5
8.20%
3
21.43%
22
12.22%
2.5-2.99 2 14.29%
14 31.11%
16 34.78%
19 31.15%
5 35.71%
56 31.11%
3.0-3.49 7
50.00%
14
31.11%
17
36.96%
23
37.70%
4
28.57%
65
36.11%
Above 3.5 3 21.43%
8 17.75%
9 19.57%
14 22.95%
1 7.14%
35 19.44%
Total 14
100%
45
100%
46
100%
61
100%
14
100%
180
100%
Chi Square 16.13
Degrees of Freedom 16
p-value .44
The Chi-square analysis p-value is 0.44, which indicates that the null hypothesis
cannot be rejected. Specifically, there is not a significant relationship between GPA and
alcohol consumption. 224 respondents participated in this survey and those students who
consume alcohol are not more likely to have a worse GPA than students who do not
consume alcohol
A limitation of this study is the low number of participants, making the results
less generalizable, although our results are suggestive in some cases. To improve this
research, the survey should be distributed to a larger sample of the college population, not
just one campus. Future research should define the term alcohol use and find out the most
common days to drink alcohol, and the student’s drinking decisions based on what they
have for schoolwork the next day. Further research should determine if college students
8
Perspectives, Vol. 7 [2015], Art. 5
https://scholars.unh.edu/perspectives/vol7/iss1/5

are actually being responsible with the amount of alcohol they consume, or are they just
getting by and managing to pass their classes.
9
Coyman: The Effects of Alcohol Use on Academic Performance Among College
Published by University of New Hampshire Scholars' Repository, 2015

References
Aertgeerts, Bert and Frank Buntinx. 2002. “The Relation between Alcohol Use or Dependence and Academic Performance in First-Year College Students.”
Journal of Adolescent Health 31(3): 223-225. Butler, Adam B., Desiree Spencer and Kama Dodge. 2011. “Academic Demands are
Associated with Reduced Alcohol Consumption by College Students: Evidence from a Daily Analysis.” Journal of Drug Education 41(4): 359-367.
Gillespie, Wayne, Jessica L. Holt and Roger L. Blackwell. 2007. “Measuring Outcomes Of Alcohol, Marijuana, and Cocaine use among College Students: A
Preliminary Test of the Shortened Inventory of Problems – Alcohol and Drugs (SIP-AD).” Journal of Drug Issues 37(3): 549-568.
Singleton, Royce A. and Amy R. Wolfston. 2009. “Alcohol Consumption, Sleep, and Academic Performance among College Students.” Journal of Studies on
Alcohol and Drugs 70(3): 355-363.
10
Perspectives, Vol. 7 [2015], Art. 5
https://scholars.unh.edu/perspectives/vol7/iss1/5