Embed Size (px)
Citation preview
The Effects of Arsenic on Thiobacillus ferrooxidans
Mandi Caudill
Columbia University Earth and Environmental Engineering Department
Masters Thesis
May 2003

EXECUTIVE SUMMARY
Arsenic is a heavy metal that occurs both naturally in the earth's crust and is
caused by anthropologic means such as mining and combustion of fossil fuels. It is also
an acute poison. Arsenic contamination of drinking water is an issue that has been
receiving national and global attention. On a national level, the United States
Environmental Protection Agency recently reduced the allowable limits of arsenic in
drinking water from 50 parts per billion to 10 parts per billion. Internationally, the mass
poisoning of the Bangladeshi people through groundwater drinking sources has received
worldwide awareness.
Bioremediation is a technology that has begun to be perceived as a feasible
option for water and soil clarification and remediation. However to make bioremediation
a viable alternative to more traditional treatment technologies, more research needs to be
conducted. Because the valance state of arsenic species determines its toxicity,
bioavailability, and solubility, understanding the way in which various types of microbes
and plants change arsenic speciation is imperative in the design of bioremediation
techniques.
Laboratory experiments were conducted to determine the effects of As(III) and
As(V) on Thiobacillus ferrooxidans. Even though Thiobacillus ferrooxidans is a widely
studied bacterium due to its use in bioleaching of mining ores, new characteristics have
been discovered through this study.
Three main conclusions can be drawn from the results of this research. First,
As(lII) and As(V) modifY the physiology and the surface charge of Thiobacillus
ferrooxidans in different ways. Secondly, this research suggests that As(V) is more toxic
to Thiobacillus ferrooxidans than As(III) in the presence of iron. A finding of this
research that has not been previously documented is fact that the Thiobacillus
ferrooxidans in this study, whether adapted or unadapted to As(III), grow better in the
presence of As(III) than without any arsenic at all. These fmdings have many
implications and have spawned topics for further investigations.
TABLE OF CONTENTS
I. Introduction . . . . . . . . . . . . . . . . . . . . . . . . . . . . . . . . . . . . . . . . . . . . . . .. . . . . . . . . . . . . . . . . . . . . . . . . . . . . . . .. 1
II. Background Infonnation . . ... . . .. . . . . .... . . . . '" ....... , .................................... 3 A. Arsenic . . . . . . . . . . . . .. . . . . . . . . . . . . . . . . . . . . ... . . . . . . , .................................... 3
1. Environmental Chemistry 2. Health Effects 3. Microbial Interactions
B. Thiobacillus ferrooxidans . . . . . . . .. . . . . . . . . . . .. . . . . . . . .. . .. . . . . . . . . . . . . . . . . . .... . . . . . . . . 5 1. Physiology 2 . Arsenic Toxicity 3. Microbial Oxidation and Reduction of Arsenic
C. Bioremediation .. . .. . . . . ... . . . . . . ... . . . . . , ................................................. 9 1. Bioremediation Techniques 2. Bioremediation Mechanisms for Inorganic Pollutants 3. Bioremediation and Arsenic 4. Evaluation of Bioremediation
D. Phytoremediation .................................................................... 13 1. Types of Phytoremediation 2. Mechanisms for Remediating Elemental Pollutants 3. Arsenic and Phytoremediation 4. Evaluation of Phytoremediation
III. Aims of Research ...................................................................... 18
IV. Materials and Methods . . . . . ... . . . . . . . .. . . . . . . . .. . . .. . . . ... . . . . . . . . . . . . . . ... . . . ... . . 19 A. Thiobacillus fe"ooxidans Adaptation B. Zeta Potential C. Growth �te D. AFM
V. Results . . . . . . . . . . . . . . . . . . . .. . . . . . . . . . . . . . . . '" ............................. '" ........ 23 A. Thiobacillus ferrooxidans Adaptation A. Zeta Potential B. Growth Rate Curves C. AFM
VI. Discussion of Results . . . ... . . ... . . . . . . . .. . . . . . .. .. . .. , .................................... 44
VII. Conclusions . . . . . ... . . .. . . . . . ... . . . . . . . . . . . . .. .. . . . . . . . ... . ... . . . . . . . . . ... . . . . . . . . . . .. . .... 47
VIII. Recommendations . .. . . . . . .. . . .. . . . .. .. . . . . . . . . . . . . . . . .. . . . . . . . .. . .. . . . . . . . . .. . . . . . . .. . 49
References
LIST OF FIGURES
Figure 1 Figure 2 Figure 3 Figure 4 Figure 5 Figure 6 Figure 7 Figure 8 Figure 9 Figure 10 Figure 1 1 Figure 12 Figure 13 Figure 14 Figure 15 Figure 16 Figure 17 Figure 18 Figure 19 Figure 20 Figure 21 Figure 22 Figure 23 Figure 24 Figure 25
Zeta Potential of Bacteria Adapted to 1 mL As(III) . . . . . . . . . . . . . . . . . . . . . . . . . . 24 Zeta Potential of Bacteria Adapted to 3mL As(III) . . . . . . . . . . . . . . . . .. . . . . . . . . 24 Zeta Potential of Bacteria Adapted to 5mL As(III) . . . . . . . . . . . . . . . . . . . . . . . . . . . 25 Zeta Potential of Bacteria Adapted to 1 mL As(V) . . . . . . . .. . . . . . . . . . . . . .. . . . . . 25 Zeta Potential of Bacteria Adapted to 3mL As(V) . . . . . . . . . . . . . . . . . . . . . . . . . . . . 26 Zeta Potential of Bacteria Adapted to 5mL As(V) . . . . . . . . . . . . . . . . . . . . . . . . . . . . 26 IEP for Bacteria Adapted to Arsenic . . . . . . . . . . . . . . . . .. . . . . . . . . . . . . . . . . . . . . . . . . 27 Zeta Potential at pH 8 . . . . . . . . . . . . . . . . . . . . . . . . . . . . . . . . . . . . . . . . . . . . . . . . . . . . . . . . . . . . 29 Growth Rate Curves - ImL As(III) . . . . . . . . . . . . . . . .. . . . . . . . . . . . . . . . . . . . .. .. . . . . .3 1 Growth Rate Curve - 3mL As(III) .. . . . '" . . . . . . . . . . . . . . . . . . . . . . ... . . .. . . . . . . . . . . 3 1 Growth Rate Curve - 5mL As(III) . . . . . . . . . . . . . . . . . . . . . . . . . . . . . . . . . . . . . . . . . . . . . . 32 Growth Rate Curve - ImL As(V) . .. . . . . . . . . . ... . . . . . . . . . . . . .. . .. . . .. . . . . . . . . . . . 32 Growth Rate Curve - 3mL As(V) .. . . . . . . . . . . . . . . . . . . . . . . . . . . . . . . . . . . . . . . . . . . . . .33 Growth Rate Curves 5mL As(V) . . . . . . . . . . . . . . . . . . . . . . . . . . . . . . . . . . . . . . . . . . .. . . . .33 Growth Rate Curve· 25mL As(III) . . . . . . . . . . . . . . . . . . . . . . . . . . . . . . . . . . . .. . . . . . . .. 34 Growth Rate Curves - 5mL As(III) - No Iron .. . . . . . . . . . .. . . . . . . . . . . . . . . . . . . . . .34 Lag Duration for Unadapted Bacteria . . . . . . . . . . . . . . . . . . . . . . . . . . . . . . . . . . . . . . . . . . 36 Lag Duration for Adapted Bacteria . . . . .. . . . . . . . . . . . . . . . . . . . . . . . . . . . . . . . . . . . . . . .36 Growth Duration for Unadapted Bacteria . . . . . . . . . .. . . . . . . . . . . . . . . . . . . . . . . . . . . 37 Growth Duration for Adapted Bacteria . . . . . .. , . . . . . . . , . . . . , . . . . . . . . . . . . . . , . . . . 37 Cell Count of Bacteria Exposed to As(III) for 150 Hours . . . . . . . . . . . . . . . . . . 38 Cell Count of Bacteria Exposed to As(V) for 150 Hours . . . . . . . . . . . . . . . . . . . 38 Unadapted Bacteria Cell .. . . . . . . . . . . . . . . . . ... . . . . . . . . . . . . . . . . .. . .. . . . . . . . . . . . . . . .. 4 1 As(lII)-Adapted Bacterial Cell . . . . . . . . . .. . . . . . . . . . . . . . . . . . . . . . . . . . . . . . . . . . . . . . ..42 As(Y)-Adapted Bacterial Cell . . . . . .. . . . . . . . . . . . . . . . . . . . . . . . . . . . . . . . . . . . . . . . . . . . . .43
LIST OF TABLES
Table 1 Table 2 Table 3 Table 4 Table 5 Table 6
Comparison of Treatment Methods . . . . . . . . . . . . . . . . . . . . . . . . . . . . . . . . .. . . . . . . . . . . . 12 Arsenic Concentrations of Adapted Bacteria . . . . . . . . . . . . . . . . . . . . . . . . . . . . . . . . . . . 23 IEP Results . . . . . . . .. . . . . . . . . . . . . . . . ... . . . . . . . . . . . . . . . . . . . . . . . . .. . . . . . . . . . . . . . . . . . . ... 27 Minimum Zeta Potential Results . . . . . . . . . . . . . . . . . . . . . . . . . . . . . . . . . . . . . . . . . . . . . . . . 28 Duration of Growth Phases . . . . . . . . . . . . . . . . . . . . . . . . .. . . . . . . . . . . . . . . . . . . . . . .. . . . . . 35 Size Comparison of Unadapted and Adapted Bacterial Cells . . . . . . . . . .. . . .40

ACKNoWLEDGEMENTS
There are many people who deserve my thanks and appreciation for helping me with this research. First of all, I would like to thank Professor Somasundaran for admitting me into his research group for the year and supporting my study. I would especially like to thank Namita Deo for mentoring me and helping me through every stage of my research even after she had moved to Cincinnati to pursue other career opportunities. I would also extend my thanks to all of Somasundaran's research group for their guidance and would particularly like to mention the group members that have showed me how to conduct part of my experiments: Dr. Zhonghua Pan for mixing the arsenic solution with me, ling Wang for helping me with the AFM, Lei Zhang for assisting me with the ICP, and Puspendu Deo for always being willing to loan me water and glassware. And fmally, I would like to thank my friends and family for supporting me and being understanding of my limited free time this year.

I. INTRODUCTION
Arsenic contamination is a worldwide environmental issue. Currently, there is a
focus on the problem of arsenic in drinking water both nationally and globally. The
arsenic issue in Bangladesh has recently been gaining international awareness.
In the 1960's, the people of Bangladesh were encouraged by the government and
internal relief organizations to use groundwater from wells for their source of drinking
water due to the bacterial contamination of the surface waters in the area. It has now
been discovered that most of the ground water wells have very high levels of naturally
occurring arsenic which has slowly been killing the people who have heeded the
suggestions from the government and internal relief organizations.
Nationally, the Environmental Protection Agency (EPA) has recently reduced the
arsenic limits in drinking water from 50 parts per billion (Ppb) to 10 ppb due to its proven
toxicity and detrimental health effects. This legislation became effective in February of
2002, while the water utilities must be in compliance by the beginning of 2006.
While several methods have been employed such as adsorption/coagulations,
precipitation, oxidation, and ion exchange, at the present, there is no efficient, cost
effective method for the removal of arsenic from drinking water. Arsenic is one of the
most difficult metals to remove from water, especially at low concentrations. It is a
costly process that also requires the addition of many other chemicals to treat the water.
Innovative removal methods need to be designed for this purpose.
Columbia University has been awarded a grant to research arsenic contamination
in both Bangladesh and at sites within the United States. This research project is a

collaborative effort between various disciplines of the University; the School of Public
Health, the Lamont Doherty Earth Observatory, the College of Physicians and Surgeons,
and the Earth and Environmental Engineering Department. The Engineering department
has been brought into the joint project to research ways in which to remediate arsenic
contaminated sites.
This thesis research investigates ways to reduce the toxicity of arsenic using
bioremediation. It involves the use of Itbiomimicry" which is a newly coined phrase that
describes the concept of designing technology to imitate biological processes occurring in
nature. It has been documented that some microbial and plant species have the
capability to metabolize arsenic, although the mechanisms of this metabolism are not yet
clearly understood ( 14). In addition, certain bacteria have been used to remove metals
from the soil, a process called "bioleaching". These two concepts spawned the idea for
my thesis research.
2

II. BACKGROUND INFORMATION
A. Arsenic
Arsenic is a heavy metal that occurs both naturally in the earth's crust and is
caused by anthropologic means such as mining and combustion offossil fuels. It is also
an acute poison. Due to the fact that arsenic is odorless and tasteless, it is widely known
for its criminal use in homicides.
1. Environmental Chemistry
Arsenic exists naturally in four valence states: +5 , + 3 , 0, and -3. The most
common forms of arsenic are +5 , also denoted as As(V) or arsenate, and +3, As(III) or
arsenite. Arsenite is much more toxic than arsenate. The current literature states that
arsenite is anywhere from 10 to 100 times more toxic than arsenate. (1,7,11).
Not only does toxicity vary with arsenic's valence state but also the solubility,
bioavailability, and mobility (11). Although both As(II!) and As(V) are soluble, As(III)
has a higher solubility than As(V) and therefore has increased bioavailability and
mobility as compared to As(V) (7).
2. Health Effects
Long term exposure to elevated levels of arsenic through ingestion of
contaminated water or food causes many types of cancer such as skin, lung, liver,
bladder, and kidney (3,6). Additionally, respiratory illnesses, cardiovascular disease,
birth defects, and death have also been attributed to arsenic contamination (3). Skin
lesions are a sign of advanced stages of arsenic poisoning (4,11). These lesions are
3
apparent in the population of Bangladeshis. A study conducted in 2001 found that of the
5,000 well ownerS interviewed in Bangladesh, twenty-one percent had skin lesions (6).
As previously mentioned, the EPA recently reduced its allowable levels of arsenic
in drinking water from 50 ppb to 10 ppb. In Bangladesh the drinking wells have levels of
arsenic contamination as high as 1000-2000 ppb, with a few isolated wells testing
between 3000-4000 ppb (4). It is reported that over the half of the hand pumped wells in
the country have arsenic levels higher than 50 ppb (5) and as many as 200,000 to 270,000
cancer deaths related to arsenic exposure have occurred. The source of contamination is
naturally occurring, caused by arsenic rich river sediments leaching into the groundwater.
Although the issue in Bangladesh has been quoted as being the "largest mass
poisoning case in the world right now" (4), arsenic contamination of drinking water is not
limited to Bangladesh. Other incidents have occurred in Taiwan, Mexico, India,
Thailand, Poland, Peru, Chile, Argentina, Canada, Hungary, Japan, New Zealand, Spain,
and even the United States (1,3,11). The contamination of these sites is due to both
naturally occurring and anthropogenic sources.
3. Microbial Interactions
Oxidation and reduction reactions of the arsenic species occurs naturally, but at a
very slow pace. Although, arsenic is toxic to most microorganisms, thus inhibiting their
growth, certain microorganisms can facilitate these reactions through various processes
such as As(V) respiration and As(III) oxidation (9). These reactions affect the mobility,
solubility, and bioavailability of arsenic as a result of the valence state change. A more
4

detailed analysis of the interactions with specific types of bacteria and arsenic is
discussed is the following section.
B. Thiobacillus ferrooxidans
Thiobacillus ferrooxidans (T. ferrooxidans) is a microorganism that was first
discovered in acid mine drainage and isolated in 1947. It has been widely studied due to
its bioleaching capabilities. The following sections will provide a background on
bacteria's physiology and known intemctions with arsenic. The last part of this section
will discuss various species of bacteria that have been documented to oxidize or reduce
arsenic.
1. Physiology
T. ferrooxidans is a gram-negative, non-spore forming bacterium. It is motile by
use of its single polar flagellum. It is rod shaped with dimensions of approximately 0.5-
0.6 J.1m wide and 1.0-2 .0 J.1ID long (15,17). It can be found single or in pairs, and also in
short chains although this does not occur as often (15).
As a chemolithotrophic bacterium, T. ferrooxidans oxidizes iron or sulfur
compounds as its source of energy. Iron is oxidized from ferrous (Fe +2) to ferric (Fe +3)
by T. ferrooxidans according to the following equation (17):
4FeS04 + O2 + 2HzS04 -- 2Fez(S04h + 2HzO
The growth of T. ferrooxidans is documented as being absolutely dependent on the
oxidation of iron for survival (18).
5
T. ferrooxidans is autotrophic meaning that it able to survive with carbon dioxide
as its sole carbon source. It is an aerobic organism, as well as mesophilic and
acidophilic, with optimal growth at temperatures between 25 and 30°C and pH between
2.0 and 2.5 (17).
2. Arsenic Toxicity
Arsenic is toxic to T. ferrooxidans, causing a decrease in the growth rate
and eventual death. The levels at which arsenic becomes toxic to T. ferrooxidans are not
agreed upon. Even though some heavy metals can be toxic to T. ferrooxidans, the
bacteria can be adapted to tolerate much higher concentrations than it naturally would
allow. There have been a variety of arsenic toxicity levels documented with numbers
ranging anywhere from 0.8 ppm (17) to 40,000 ppm (8). As(IH) is documented as being
three to eight times more toxic to T. ferrooxidans than As(V) (8,28).
Studies have also been conducted which argue that the toxicity of As(IH) and
As(V) on bacteria is dependent on the availability of an energy source (28). Furthermore,
Breed at al stated that their results suggest that As(III) may not three times as toxic as
As(V) as has been previously reported (28).
It has been documented that the addition of 10 ppm of As(III), Mn(III), Sn(H),
Co(II), Cu(II), and Zn (H), cr, and N03' in the bacteria medium of T. ferrooxidans had
no effect on the iron oxidation and therefore the growth of the bacteria (16). The study
was conducted to ensure that the bioleaching abilities of T. ferrooxidans would not be
compromised by other heavy metals that may be present in the ore.
6

3. Microbial Oxidation and Reduction of Arsenic
Due to the different characteristics of arsenic species, it is important to understand
the way in which microbes oxidize and reduce arsenic. Microorganisms have been
reported to oxidize As(III) and/or reduce As(V) (9,10,13,19,20). Some autotrophs have
even been discovered to utilize As(III) as their sole energy source. Additionally, species
of heterotrophs have the ability to convert As(III) to As(V) as a secondary source of
energy or as a mechanism of detoxification (20).
The first identified arsenite·oxidizing bacterium, Bacillus arsenoxidans, was
reported in 1918 in South Africa. Green discovered the bacterium in a cattle-dipping
solution that used arsenite to protect against insect bites (20). Bacillus arsenoxidans was
not tested to determine if it could grow with arsenite as its sole energy source and
unfortunately will not be tested since the organism was lost.
Since that time, other arsenite-oxidizing bacteria have been documented. In 1949,
15 strains of bacteria were discovered again in cattle-dipping solution, but this time in
Queens, Australia (20). Other arsenite-oxidizing bacteria have been discovered in
arsenite enriched raw sewage, arsenic-contaminated sites, and geothermically active
areas.
Most of the arsenite-oxidizing bacteria have been proven or assumed to be
heterotrophic, which means they need organic material for their energy source and
therefore cannot grow with arsenite as the only nutrient source. Another example of such
a heterotroph is Thermus aquaticus and Thermus thermophilus that are found in areas of
geothermal activities such as the hot springs of Yellowstone National Park (9).
7

A new isolate within the Thermus genus was discovered in 2001. This bacterium,
designated, Thermus HR 13, was isolated from a geothennal environment in northern
California (9) and has the ability to use arsenic as a secondary energy source.
Arsenite-oxidizing bacterium have been discovered that are chemolithotrophs and
are able to utilize arsenite as their sole energy source, although to date only two such
strains have been reported. The first isolated bacterium of this type was reported in 1981
in the fonner Soviet Union. It was a gram-negative, motile, rod-shaped bacterium
isolated from an arsenopyrite gold mine, named Pseudomonas arsenitoxidans. The
bacterium was found to have a slow growth rate with a doubling time of approximately 2
days (13, 20).
In 2000, a chemolithotrophic bacterium was reported from Australia, again from
an arsenopyrite gold mine, which has a much more rapid growth rate than Pseudomonas
arsenitoxidans, with a doubling time on the order of 7 .6 hours. This bacterium was
named NT-26 and has the ability to use arsenite as its sole energy source. It is gram
negative, motile, and rod-shaped, but possesses two subterminal flagella (13).
Some strains of Alcaligenes faecalis have been isolated that are not able to use
arsenite as their sole energy source, but actually "survive better in the presence of arsenite
than in its absence" (20). It is noted that this phenomena suggests that the bacteria is
obtaining at least secondary energy from the oxidation of the arsenite. Alcaligenes
faecalis are motile with a single peritrichous flagella, rod-shaped and approximately 1
Jlm.
It has been documented that T. ferrooxidans does not oxidize arsenite to arsenate
(19), but T. ferrooxidans can oxidize arsenic-containing materials such as AS2S3, FeAsS,
8
CU3AsS4. It is thought that the newly formed arsenate in the cultures was either a result
of oxidation from ferric iron or autoxidation in conjunction with the metabolite, but not
the bacteria itself (20).
C. Bioremediation
Bioremediation is defined as the process by which living organisms act to degrade
or transform hazardous organic contaminants (38) or stabilize, solubilize, or reduce the
toxicity of inorganic contaminants. These living organisms are most commonly bacteria,
fungi, algae, and/or plants. There are many applications of bioremediation from the
treatment of mining drainage and other industrial sites to detoxifYing sewer sludge and
contaminated soil and water (33).
There is a major difference in the management of organic verses inorganic
contaminates. Organic contaminants can be biologically broken down to
environmentally safe compounds with carbon dioxide and water being the final products.
This cannot be accomplished with inorganic contaminants because metals are already in
their most fundamental form and cannot be destroyed (34).
1. Bioremediation Techniques
Several techniques are used in the field of bioremediation. Some of the more
common ones will be presented here. The time frame, funds available, and concentration
of contaminants are the deterministic factors involved in selecting a bioremediation
technique (36).
9

Land fanning is the process by which microorganisms and nutrients are mixed
with contaminated soil, usually with a backhoe, to treat the contaminated land (36). This
process requires a liner to contain the contaminants and the by-products of the reactions.
Another type of bioremediation uses a sequencing batch reactor (SBR). This
process involves adding the contaminated soil or water in a reactor along with microbes
and nutrients. This technique allows for optimization of removal parameters such as pH,
contact time, and concentration since it is a controlled environment (36).
Compo sting uses microorganisms and aeration to convert organic matter into soil
enrichment nutrients. This is a technique that has been used by fanners for many years
(36), but it is not available to inorganic compounds.
2. Bioremediation Mechanisms for Inorganic Pollutants
This section will discuss the mechanisms by which organisms are able to perfonn
bioremediation of inorganic pollutants. Biosorption is the uptake of metals by microbial
cells in which no energy is required. This process enables the microbes to remove high
amounts of metals from water and soil (37). Bioaccumulation is similar to biosorption,
but in this case the uptake of the metal requires energy.
Bioremediation may also be accomplished by oxidation/reduction. These
reactions can be catalyzed directly or indirectly. Some organisms have the capability to
be the terminal electron acceptor. Other organisms facilitate the oxidation/reduction
reaction by their excretions, also referred to as metabolites in the case of bacteria (37).
Precipitation is another mechanism by which inorganic contaminate can be
remediated. This mechanism involves the reaction of a metallic ion with a product of
10

microbial metabolism (37). The reaction results in a precipitate that can then be filtered
out of the waste stream and therefore rendered less toxic.
Finally, methylation is a process than can be used only if the product is nontoxic.
A large number of metals can be methylated by microorganism, but many of the products
are toxic. Therefore, this is a process that can be used only in very specific cases such as
selenium (37).
3. Bioremediation and Arsenic
Many of the mechanisms mentioned above are possible in the bioremediation of
arsenic. There is evidence of microbial oxidation/reduction as mentioned in previous
sections. Also arsenic can be methylated, but as its products are toxic, this is not a
technique that is viable for bioremediation. Arsenic is also subject to precipitation.
Phytoremediation is a type of bioremediation that has great potential to remediate
arsenic contaminated sites. This topic will be discussed in detail in the following section.
4. Evaluation of Bioremediation
One of the major advantages of bioremediation is its cost benefits.
Bioremediation techniques generally cost one-third to one-half of the price of more
conventional methods (33). Because some of the bioremediation techniques can be
applied on-site, bulk excavation is not required which reduces the cost and the potential
for further contamination from the diesel trucks as well as spills or accidents (36). There
is no additional environmental pollution caused by bioremediation which is a key
advantage (33). Furthermore, large amounts of solid waste are not produced that then
11
need to be disposed of as in other treatment methods (35). Therefore, bioremediation is
capable of remediating contaminated sites and not just transferring the pollutants to
different mediums.
Although bioremediation is being used and has the potential to be implemented on
a wider scale, there are still some issues that need to be reviewed in order for it to achieve
its maximum capabilities. One of the disadvantages of bioremediation is the fact that it is
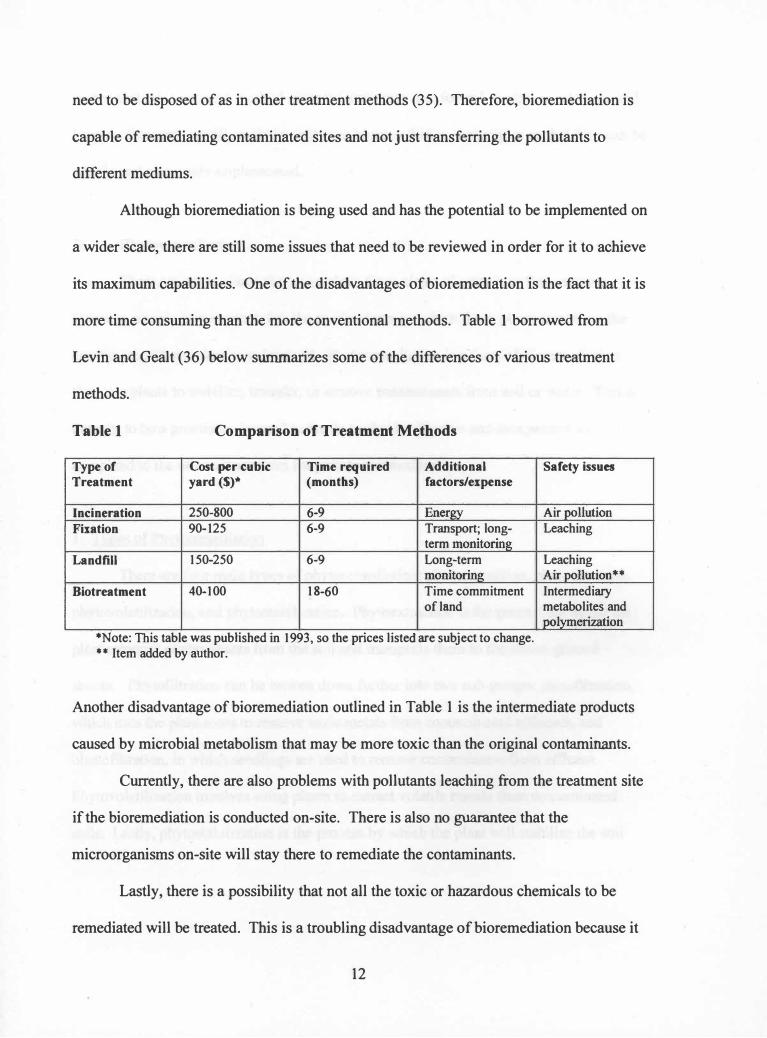
more time consuming than the more conventional methods. Table 1 borrowed from
Levin and Gealt (36) below summarizes some of the differences of various treatment
methods.
Table 1 Comparison of Treatment Methods
Type of Cost per cubic Time required Additional Treatment yard (S)* (months) factors/expense
Incineration 250-800 6-9 Energy Fixation 90-125 6-9 Transport; long-
term monitoring Landfill 150-250 6-9 Long-term
monitoring Biotreatment 40-100 18-60 Time commitment
ofland
·Note: This table was pubbshed m 1993, so the pnces lIsted are subject to change. *- Item added by author.
Safety issues
Air pollution Leaching
Leaching Air�lution·· Intermediary metabolites and polymerization
Another disadvantage of bioremediation outlined in Table 1 is the intermediate products
caused by microbial metabolism that may be more toxic than the original contaminants.
Currently, there are also problems with pollutants leaching from the treatment site
if the bioremediation is conducted on-site. There is also no guarantee that the
microorganisms on-site will stay there to remediate the contaminants.
Lastly, there is a possibility that not all the toxic or hazardous chemicals to be
remediated will be treated. This is a troubling disadvantage of bioremediation because it
12

means that this treatment method gives no assurance that federal or state regulations will
be met. Research is still needed to enhance bioremediation techniques so that they can be
widely and accurately implemented.
D. Phytoremediation
There are some plants that can reduce the toxicity of arsenic or that can even
thrive on arsenic as a nutrient, but the mechanisms by which these plants transform the
arsenic are still not clearly understood. Phytoremediation is a form of bioremediation
that uses plants to stabilize, transfer, or remove contaminants from soil or water. This is
thought to be a promising "green" technology that is effective and inexpensive as
compared to the other alternatives for pollutant remediation.
1. Types of Phytoremediation
There are four main types of phytoremediation: phytoextraction, phytofiltration,
phytovolatilization, and phytostabilization. Phytoextraction is the process by which the
plant removes contaminants from the soil and transports them to the above-ground
shoots. Phytofiltration can be broken down further into two sub-groups: rhizofiltration,
which uses the plant roots to remove toxic metals from contaminated effiuents, and
blastofiltration, in which seedlings are used to remove contaminants from effiuent.
Phytovolatilization involves using plants to extract volatile metals from contaminated
soils. Lastly, phytostabilization is the process by which the plant will stabilize the soil
13

contaminants, not allowing them to leach from the site, or reduce the toxicity of the
contaminants but not remove them from the soil (21, 22).
Two types of plant species are able to be used for phytoremediation.
Pseudometallophytes are plants that are able to survive on both metal-contaminated and
non-contaminated soils. Metallophytes are those that can only grow on metal
contaminated soil (24).
2. Mechanisms for Remediating Elemental Pollutants
There are three main mechanisms by which plants can remediate elemental
pollutants such as arsenic, lead, and mercury. The first is adsorption onto the plant roots.
The roots have a very large surface area, as well as the capability to bind to the elemental
pollutants due to the fact that the roots are used to uptake elemental nutrients to the plant
(23).
The second mechanism is hyperaccumulation which involves concentrating the
toxic pollutants in the above-ground biomass of the plant. Hyperaccumulation is defined
as the plant containing a concentration of a metal ion greater than 0.1-1 % of the dry plant
weight (23). Because elemental pollutants are toxic, it is thought that hyperaccumulation
is used to compartmentalize the metal to keep it from interfering with the normal
processes of the plant (14).
The last mechanism of elemental remediation in plants that will be discussed is
transformation of the element to a less toxic species. As previously mentioned,
characteristics of some elements are dependent upon their oxidation or valence states as
14

is the case with arsenic. In an effort to reduce the toxicity of these elements, the plant
may transform the contaminant to a more harmless state (23).
3. Arsenic and Phytoremediation
Plants have been discovered that have the ability to remediate arsenic through the
various mechanisms outline above. Some of these are naturally occurring, others have
been grown on arsenic-contaminated lands, and others still have been genetically
modified to have an affinity for arsenic (14,25,26).
The Brake fern, Pteris vittata, is one example of a plant that has been reported to
naturally hyperaccumulate arsenic (14,25). It can contain levels of arsenic one hundred
times that of the soil. It has been suggested that As(V) is converted to As (III) from the
roots to the fronds (14). Other sources have indicated that it is much more efficient for
plants to uptake As(V) as opposed to As(III) (12).
4. Evaluation ofPhytoremediation
Phytoremediation is a promising technique that is still in its early stages of
research. It has many benefits including that it is effective and economically viable. One
project that used sunflowers and Indian mustard to clean up a contaminated lead site
saved over $1 million by using phytoremediation as opposed to traditional methods (27).
In addition, the method is not very labor intensive as plants maintain themselves
for the most part. Phytoremediation techniques are also solar energy driven therefore
money is saved on power generation as well. Another benefit of phytoremediation is that
it is capable of treating low concentrations of contaminants. Finally, phytoremediation is
15

a natural technique that allows plants to cleanse the environment without the addition of
other chemicals and possibly more pollution. Because phytoremediation can be done in
situ, there is a reduction in the amount of large trucks that are needed to haul the
contaminated soil to other locations and therefore air pollution caused by the diesel trucks
is reduced.
There are some concerns with the use of phytoremediation for toxic contaminants.
One of the limitations is the fact that the plants take time to grow and therefore the
remediation is not instantaneous. It is even sited that some crops could take several
months or even seasons to remediate the pollution to levels within the regulatory
standards (27). Therefore, phytoremediation cannot be implemented on sites that are an
immediate threat to human health.
Another limitation of phytoremediation is the process that is used by
hyperaccumulators. Because the plants are drawing the pollutants up into their above
ground biomass, there is the risk that animals could consume the leaves and therefore
bioaccumulate the pollutant, possibly resulting in the toxin making its way all the way up
the food chain to humans. A possible solution for this is to keep the area fenced off. But
then there is also the risk of pollinators carrying the toxins to other locations (26), which
a fence would not prevent.
Additionally, inorganic metals cannot be rendered non-toxic or degraded as in
organic contaminants. The metals will be recycled between the soil and the plant, as the
plant uptakes the metal from the soil, storing it in its leaves or shoot. When the plant
dies, the biomass will be degraded back into the soil, but the metals will still exist.
16

Therefore, the plants must be harvested and landfilled or incinerated in order to dispose
of the toxic metal.
Furthermore, plants can only uptake contaminants that are within the reach of
their roots. The majority of plants have a root mass that occupies only the top 30 cm of
soil (39) which may not be where the pollutants are located.
Currently, there are also problems with pollutants leaching from the treatment
site. The roots do not form an impervious barrier around the contaminated site. Also in
reference to the soil ecology that works together with the plant roots, there is also no
guarantee that microorganisms that aid in the uptake of pollutants will stay on-site.
Lastly, there is a possibility that not all the toxic or hazardous chemicals to be
remediated will be treated. This is a troubling disadvantage of phytoremediation because
it means that this treatment method gives no assurance that federal or state regulations
will be met.
17

III. AIMS OF THE RESEARCH
The main purpose of this research is to investigate ways to remove or reduce the
toxicity of arsenic in water. Because the behavior of arsenic is dependent on its valence
state, it is important to understand the effects that each species, namely, arsenite and
arsenate, have on microorganisms that are present in the environment.
This thesis research provides information on the effects of As(III) and As(V) on
T ferrooxidans. This study compares the zeta potential which is an indicator of surface
electrochemical properties of unadapted bacteria, As(III)-adapted bacteria, and As(V)
adapted bacteria. It also investigates the effects of As(III) and As(V) on the growth of
unadapted bacteria, As(III)-adapted bacteria, and As(V)-adapted bacteria through
development of growth rate curves. Additionally, the morphology of unadapted and
adapted bacteria is compared by use of the AFM.
18

IV. MATERIALS AND METHODOLOGY
A. Thiobacillus ferrooxidans Adaptation
T. ferrooxidans is a widely studied bacterium due to its bioleaching capabilities.
Therefore, T. ferrooxidans was chosen for these experiments because of the availability
information through the scientific literature. The growth medium used for the
T.ferrooxidans was the 9K medium developed by Silverman and Ludgren (15 ) with 44.8
gIL of FeS04 * 7 H20 (Aldrich Chemical Company, 99% purity) as the energy source.
The 9K medium consists of 3 gIL (N�hS04(Fisher Scientific, 99. 99% purity), O.lgIL
KCI (Aldrich Chemical Company, 9�1o purity), 0.5gIL K2HP04 (Fisher Scientific,
100.1 % purity), O.5gIL MgS04 * 7 H20 (Aldrich Chemical Company, 99. 9�1o purity),
and 0 .01 gil CO(N03)2 (Mallinckrodt, Inc., 98.5% purity) added to 80 mL of triple
distilled water. The pH of the medium was adjusted to approximately 2 using H2S04
(Amend Drug and Chemical Company, Inc., 95.8% purity) and then sterilized in an
autoclave and subsequently cooled to room temperature. The FeS04 * 7 H20 was mixed
with 20 mL of triple distilled water, the pH adjusted to approximately 2 , then sterilized
using a vacuum filter then added to the medium. It was inoculated with 10% bacteria by
volume. The medium was contained in a 250-mL Erlenmeyer flask and kept on an
orbital shaker at 200 rpm at room temperature.
The bacterial medium was adapted to As(lII) and As(V) by repeated subculturing.
This entailed incrementally increasing the amount of arsenic for each subsequent
medium. Initially, 1 mL of an AS20S solution As(V) was added to the 9K medium
inoculated with 10% unadapted T. ferrooxidans. After the bacteria reached full growth,
approximately 6 days from inoculation, that bacterium was used to inoculate the next
19
flask in addition to 2 mL of the As20s solution. This process continued until5mL of the
As(V) solution was added which correlates to a concentration of 14.36 ppm.
The bacteria was adapted to As(III) in the same way, starting with unadapted
bacteria, except that a AsCl) (Aldrich Chemical Company, 99.99% purity) solution was
used. This solution was prepared by diluting the AsCh with triple distilled water and
adding 2.65 mL of HCI in order to dissolve the powder in solution. The solution was
then filtered through 150 mm diameter filtered paper to remove any impurities. The final
concentration of the highest level of As(III) solution added was 5 mL which correlates
12 . 38 ppm.
The triple distilled water used in these experiments was prepared by distilling
single distilled water by boiling the water with KMn04, a strong oxidant, to remove all
organic contaminants. The resulting double water was then collected in a second
chamber which was distilled again to remove all impurities. The product of the second
distillation was then collected in a third chamber which resulted in triple distilled water
which has a pH of approximately 6.5.
B. Zeta Potential
There are two stages involved in the zeta potential measurements. First, the
bacteria cells were harvested so that the iron precipitate in the flasks would not affect the
zeta potential readings. In order to accomplish this, the metabolite of the fully grown
bacteria was filtered through 150 mm diameter filter paper. The filtered metabolite was
then centrifuged at 10 ,000 rpm for 25 minutes. After the supernatant was poured off, the
cell pellet was dispersed in a pH 2 solution prepared by adding H2S04 to triple distilled
20

water . These cells were then centrifuged for 10 minutes at 1000 rpm and dispersed in
pH 2 solution three more times. The washed cells were then stored in a refrigerator for
future use. For the purpose of this research, it is assumed that washing does not have an
effect on the zeta potential results. This can be concluded because the results were
verified using two sample sets.
In order to prepare the samples for the zeta potential measurement, the following
procedure was used. Ten drops of the washed cells were added to 200 mL of a 0.0005 M
KN03 solution. The solution was mixed and divided into 10 vials of 20 mL each and the
pH was adjusted with HN03 (Ruger Chemical Company, Inc., 69.9% purity) and NaOH
(Fisher Scientific) so that a representative range of pHs were available. The ten samples
were then put on an orbital shaker for at least an hour, after which the pH was measured
again and readjusted if necessary. The zeta potential was measured for each of the
samples using a Zeta-Meter System 3 .0 by Zeta-Meter Incorporated. The average zeta
potential and standard deviation were recorded for the various pHs of each sample.
c. Growth Rate
The growth rate curves of unadapted bacteria, various concentrations of both
As(III) and As(V)-adapted bacteria, and two experimental mediums were developed.
The medium for which the growth rate curve was to be developed was inoculated at time
zero and kept on an orbital shaker at 200 rpm at room temperature following the
procedure outlined in section A. Thiobacillus ferrooxidans Adaptation.
The medium was taken off the shaker at least 10 minutes prior to the growth
measurements in order to let the precipitated iron settle. One drop of the bacterial
21

metabolite was extracted on a daily basis in order to record the nwnber of viable bacteria
cells using a Petroff-Hausser counting chamber. The cells were viewed at a
magnification of forty through a monitor connected to the Nikon microscope.
D. Atomic Force Microscopy (AFM)
The samples of unadapted, As(III)-adapted, and As(V)-adapted bacteria were
prepared by air drying one drop of each bacterial metabolite on glass for one hour. The
glass was cut afterwards to fit the individual disks used for the AFM. Silicon-nitrite tips
were used to scan the samples in contact mode. The AFM images were recorded using a
MultiMode™ Scanning Probe Microscope and Nanoscope lIla Scanning Probe
Controller by Digital Instruments.
22

v. RESULTS
A. Thiobacillus ferrooxidans Adaptation
T ferrooxidans was adapted to both As(III) and As(V). Table 2 outlines the
concentrations of the adapted bacteria for this research.
Table 2 Arsenic Concentrations of Adapted Bacteria
Volume of Arsenic Solution added to l00mL medium
As(Ill) 1 mL
2 mL
3 mL
4 mL
S mL
As (V) 1 mL
2 mL
3 mL
4 mL
S mL
B. Zeta Potential
Concentration (ppm)
2.S9
S.09
7.56
9.90
1 2.3-8
2 .98
S .90
8.77
I 1 .S9
1 4.36
The zeta potential of the unadapted and adapted bacteria was measured in order to
monitor surface electrochemical changes. It has been documented that unadapted T
ferrooxidans have an isoelectric point (lEP) at pH 2 .4 (29). My research has verified
these findings.
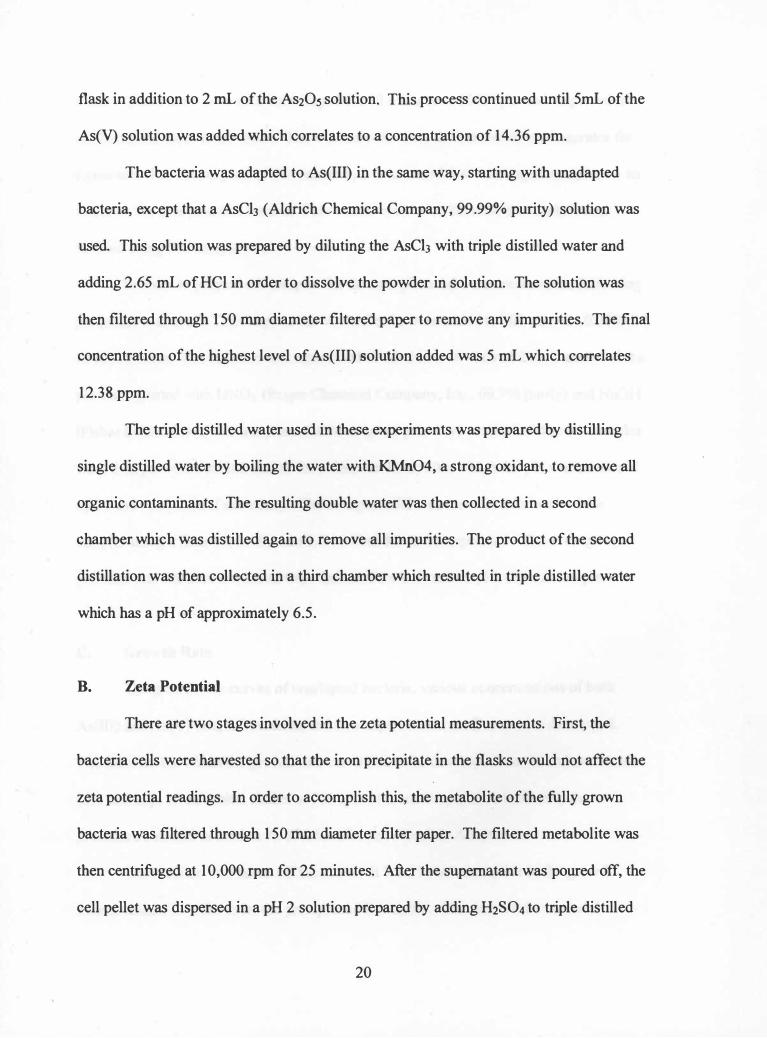
The results for the zeta potential readings are grouped by the concentration to
which the bacterial cells were adapted. Two sets of measurements were taken for each.
23
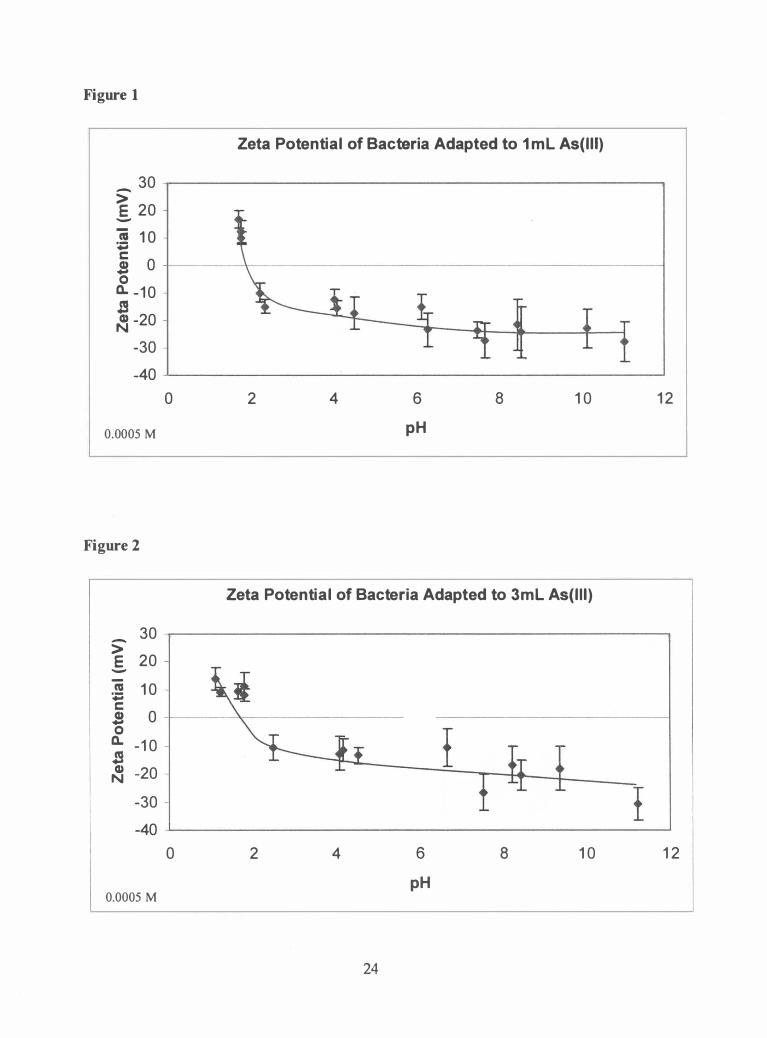
Figure 1
Zeta Potential of Bacteria Adapted to 1 mL As(l I I)
- 30 > E 20 -:! 1 0 ... c
0 S 0
0. -1 0 J! � -20
-30
-40
0 2 4 6 8 1 0 1 2
0.0005 M pH
Figure 2
Zeta Potential of Bacteria Adapted to 3mL As(lI I)
- 30 > E 20 --CIS 1 0 ;; c S 0 0
0. -1 0 S CI) -20 N
-30 I -40
0 2 4 6 8 1 0 1 2
pH 0.0005 M
24
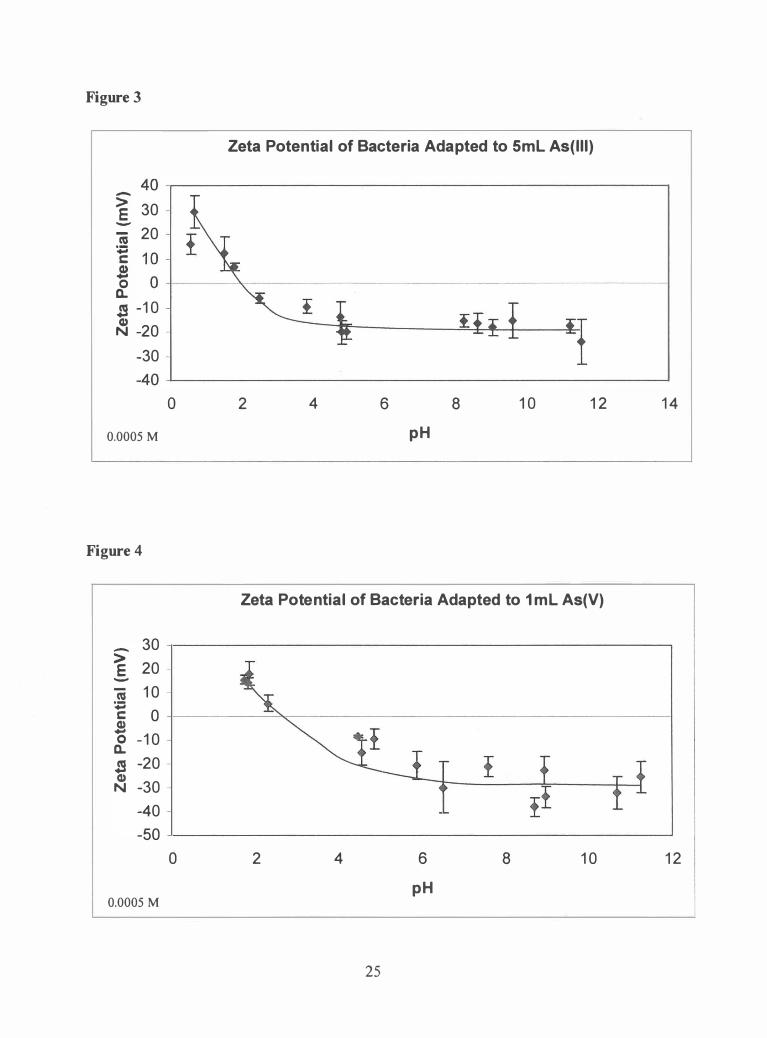
Figure 3
Zeta Potential of Bacteria Adapted to 5mL As(lI I)
40.---------------------------------------------. -
::e 30
:; 20 +=l C 1 0 -
� O+-----�------------------------------------� a.. S -1 0 CD N -20 -
-30 -
-40�------------------------------------------�
o 2 4 6 8 1 0 1 2 1 4
0.0005 M pH
Figure 4
Zeta Potential of Bacteria Adapted to 1 mL As(V)
- 30 >
20 E -
CIS 1 0 +=l
0 C .s
- 1 0 0 a.. S -20 CD
-30 N
-40
-50
0 2 4 6 8 1 0 1 2
pH 0.0005 M
25

Figure 5
Zeta Potential of Bacteria Adapted to 3mL As(V)
30.----------------------------------------------.
>" 20 E =- 1 0 -� � O+----------y----------------------------------� .s o - 1 0
0. J! -20 CD N -30 -
-40 -
-50�--------------------------------------------�
o
0.0005 M
Figure 6
- 20 > E 1 0 -
� +l 0 c: .s
- 1 0 0 0. J! -20 CD N
-30
-40
0
0.0005 M
2 4 6
pH
8 1 0
Zeta Potential of Bacteria Adapted to 5mL As(V)
2 4 6 8 1 0
pH
26
1 2
1 2

This research shows that there is a marked difference in surface electrochemical
properties between As(III)-adapted and As(V)-adapted T. ferrooxidans. The following
table contains the average IEP for each set of samples.
Table 3 IEP Results
Arsenic Concentration in Set 1 IEP (pH) Set 2 IEP (pH) Growth Medium (ppm)
As(IIl) 2.59 2.0 2.0 7 .56 2.2 2.9 12 .38 2.2 2 .8
As(V) 2.98 3 .2 3 .3 8.77 3 .4 3 .2 14.36 3 .2 3 .0
The average IEP for the cells adapted to As(V) is 3.2 ± 0. 1 . The average IEP for As(III)
is calculated to be 2.3 ± 0.3. The Figure 7 presents these results graphically.
Figure 7
IEP for Bacteria Adapted to Arsenic ___ As( l I l )
-+- As(V) 4.00 3 .50
0.. • • w 3.00 ... .... 0
::t 2 .50 .. -c. -
2.00 1 .50 1 . 00
0 5 1 0 1 5 Concentration of Arsenic (ppm)
27
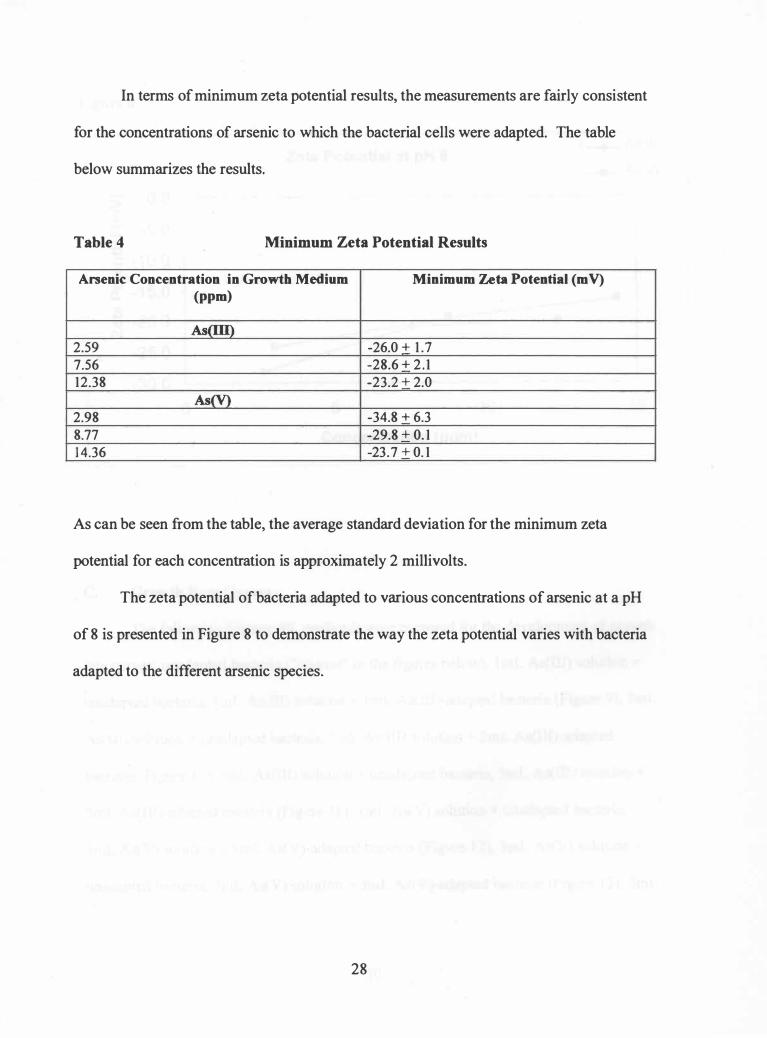
In terms of minimum zeta potential results, the measurements are fairly consistent
for the concentrations of arsenic to which the bacterial cells were adapted. The table
below summarizes the results.
Table 4 Minimum Zeta Potential Results
Arsenic Concentration in Growth Medium Minimum Zeta Potential (m V) (ppm)
As(III) 2.59 -26.0 + 1 .7
7.56 -28.6 + 2 . 1
12.38 -23.2 + 2.0
As(V) 2.98 -34.8 + 6.3
8.77 -29.8 + 0. 1
1 4.36 -23.7 + 0. 1
As can be seen from the table, the average standard deviation for the minimum zeta
potential for each concentration is approximately 2 millivolts.
The zeta potential of bacteria adapted to various concentrations of arsenic at a pH
of 8 is presented in Figure 8 to demonstrate the way the zeta potential varies with bacteria
adapted to the different arsenic species.
28

Figure 8
Zeta Potential at pH 8
- 0.0 > E - -5.0 -C'G
� ; -1 0.0
-
� -1 5 .0 S
� CD -20.0
N
-25.0 -30 .0
0
C. Growth Rate Curves
5 Concentration (ppm)
--+- As(l l I )
___ As(V)
..
•
1 0 1 5
The following thirteen 9K mediums were prepared for the development of growth
rate curves: unadapted bacteria ("control" in the figures below), I mL As(III) solution +
unadapted bacteria, fmL As (III) solution + 1 mL As(III)-adapted bacteria (Figure 9), 3mL
As(III) solution + unadapted bacteria, 3mL As(III) solution + 3mL As(III)-adapted
bacteria (Figure 1 0), 5mL As (III) solution + unadapted bacteria, 5mL As(III) solution +
5mL As(III)-adapted bacteria (Figure 1 1 ), I mL As(V) solution + unadapted bacteria,
I mL As(V) solution + I mL As(V)-adapted bacteria (Figure 1 2), 3mL As(V) solution +
unadapted bacteria, 3mL As(V) solution + 3mL As(V)-adapted bacteria (Figure 1 3), 5mL
29

As(V) solution + unadapted bacteria, and SmL As(V) solution + SmL As(V)-adapted
bacteria (Figure 14).
In addition, two experimental mediums were prepared. Twenty-five mL of
As(III) solution was added which was inoculated with 10 mL of SmL As(III)-adapted
bacteria (Figure I S). The second experimental medium was used to investigate whether
or not As(III)-adapted bacteria could use As(III) as its sole energy source. For this
investigation, the 9K growth medium was prepared without the iron. Five mL of As(III)
solution was added and inoculated with washed 5mL As(III)-adapted bacteria cells
(Figure 16).
30
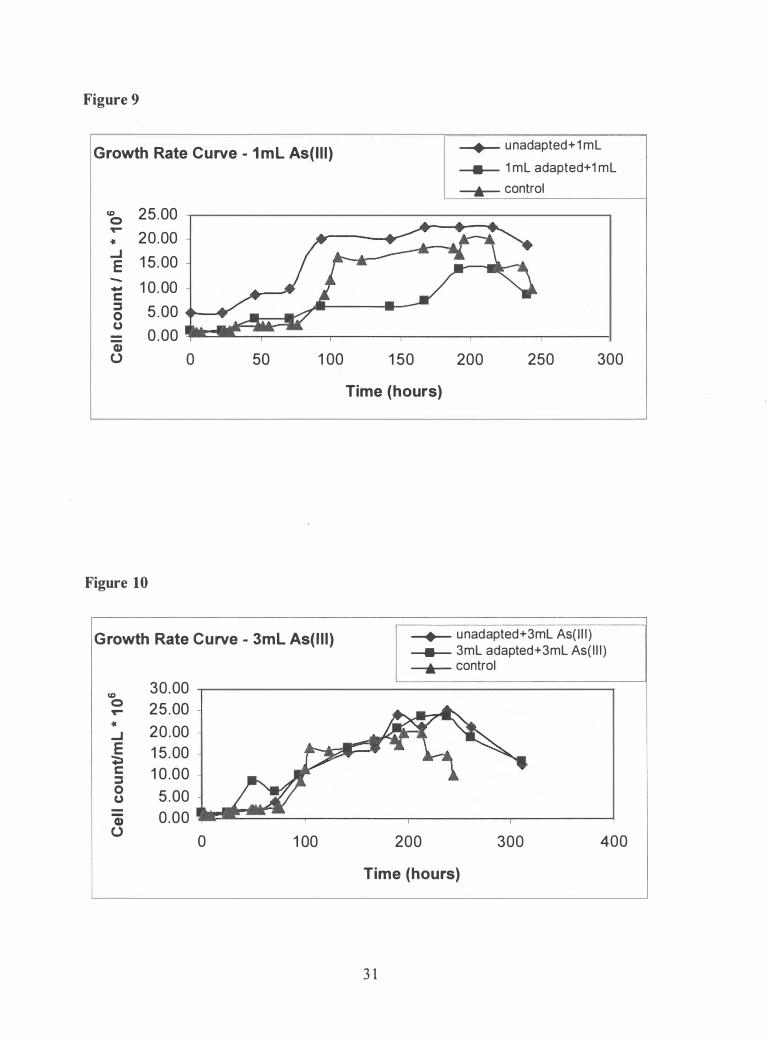
Figure 9
Growth Rate Curve - 1 mL As(l I I )
CD 25.00 0 -
20.00 -Ie
-I 1 5. 00 E
-1 0. 00 --
c :::s 5 . 00 0 (,J
'i 0 . 00
u 0 50 1 00
Figure 10
Growth Rate Curve - 3mL As(l I I )
CD 30.00 0
25.00 ---Ie
20.00 -I E 1 5. 00 +;I c 1 0 .00 :::s 0
5 . 00 -(,J
'i 0.00 u
0 1 00
1 50
-+- unadapted+1 mL
___ 1 mL adapted+1 mL
---..- control
200 250 300
Time (hours)
-+- unadapted+3mL As( l I l ) ___ 3mL adapted+3mL As( l I l ) ---..- control
200 300 400
Time (hours)
3 1

Figure 1 1
Growth Rate Curve - SmL As{l I I )
<D 30.00 0
25.00 � it
20.00 -..J E 1 5.00 -";:a c: 1 0 .00 ::s 0
5.00 (J
Q) 0 . 00 (.)
0 1 00
Figure 12
Growth Rate Curve - 1 mL As{V)
25.00 -<D 0
20.00 -� it
..J 1 5 . 00 -E
";:a 1 0.00 -c:
::s 0
5 . 00 (J
Q) 0 . 00 (.)
0 50 1 00
-+- unadapted + SmL As( l l I )
� 5mL adapted + 5mL As( l l I ) -..- control
200 300 400
Time (hours)
1 50
Time (hours)
32
-+- unadapted+1 mL � 1 mL adapted + 1 mL -..- control
200 250 300

Figure 13
Growth Rate Curve - 3mL As(V) -+-- unadapted+3mL
� 3mL adapted + 3mL
25.00 _.r-________________________ �=�=====co=n=tro=I========��1 CD
�20.00 it ..J E1 5 .00 +:I §1 0.00 -o to) 5.00 -Q ������_,------,_----_r----_,------�--� o 0.00 ..,.
o 50 1 00
Figure 1 4
Growth Rate Curves 5mL As(V)
CD 25.00 0 "l'"" it 20.00 ..J E 1 5.00 +:I c :::J 0 1 0 .00 to) CD 5.00
0 0.00
0 50 1 00
1 50 200 Time (hours)
1 50 Time (hrs)
33
250 300 350
-+-- unadapted+5mL
� 5mL adapted+5mL
� control
200 250 300

Figure 15
Growth Rate Curve - 25mL As(l I I ) -+- 5mLadapted+25mL As( l l I ) ____ control
co 40.00 0
-it
-I 30.00 E
+:I c 20.00 � 0 CJ
1 0. 00 -Q; (J
0.00
0 1 00 200 300 400
Time (hours)
Figure 16
Growth Rate Curves .. 5mL As(l I I ) - No Iron
co 0 25.00 -...
-I 20.00 E
+:I 1 5.00 c � 1 0.00 0 CJ 5.00 -Q; 0.00 (J
0 50
��--������--------� -+- 5mL adapted + 5mL As( l I l ) - no iron
____ control
1 00 1 50 200 250 300
Time (hours)
34
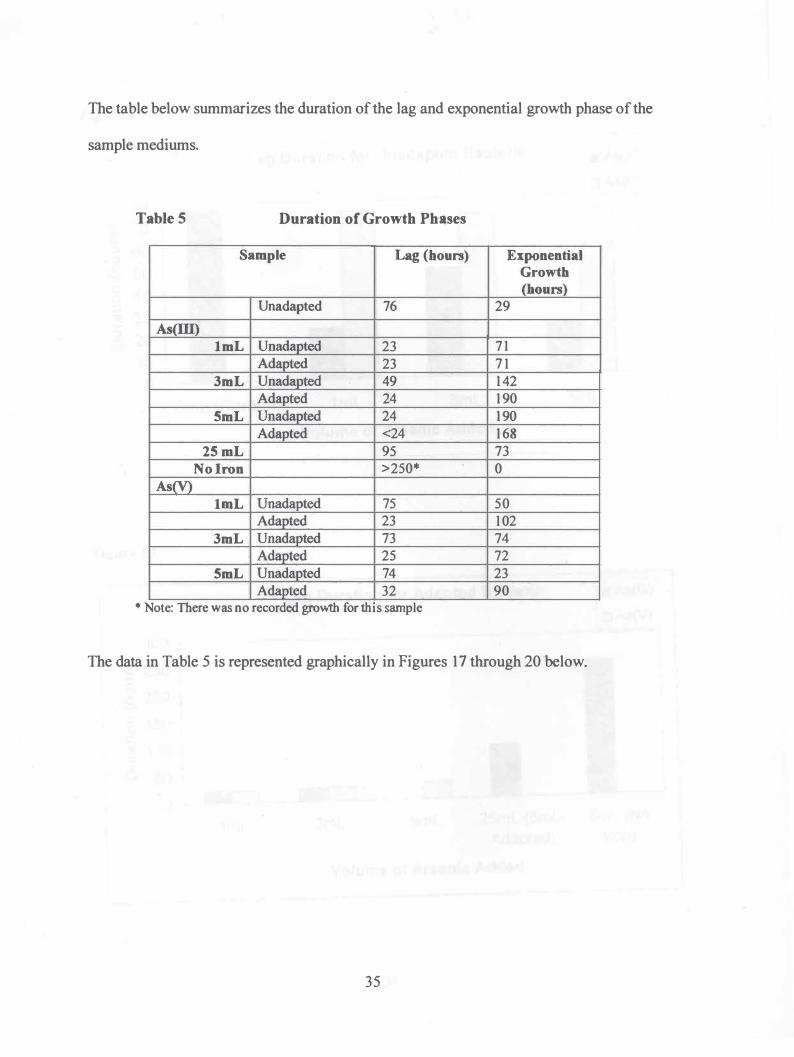
The table below summarizes the duration of the lag and exponential growth phase of the
sample mediums.
Table 5 Duration of Growth Phases
Sample Lag (bours) EXlWnential Growth (hours)
Unadapted 76 29
As(III) ImL Unadapted 23 7 1
Adapted 23 7 1
3mL Unadapted 49 1 42
Adapted 24 1 90
5mL Unadapted 24 1 90
Adapted <24 1 68
25 mL 95 73
No Iron >250· 0
As(V) ImL Unadapted 75 50
Adapted 23 1 02
3mL Unadapted 73 74
Adapted 25 72
5mL Unadapted 74 23
Adapted 32 90
• Note: There was no recorded growth for thIS sample
The data in Table 5 is represented graphically in Figures 17 through 20 below.
35
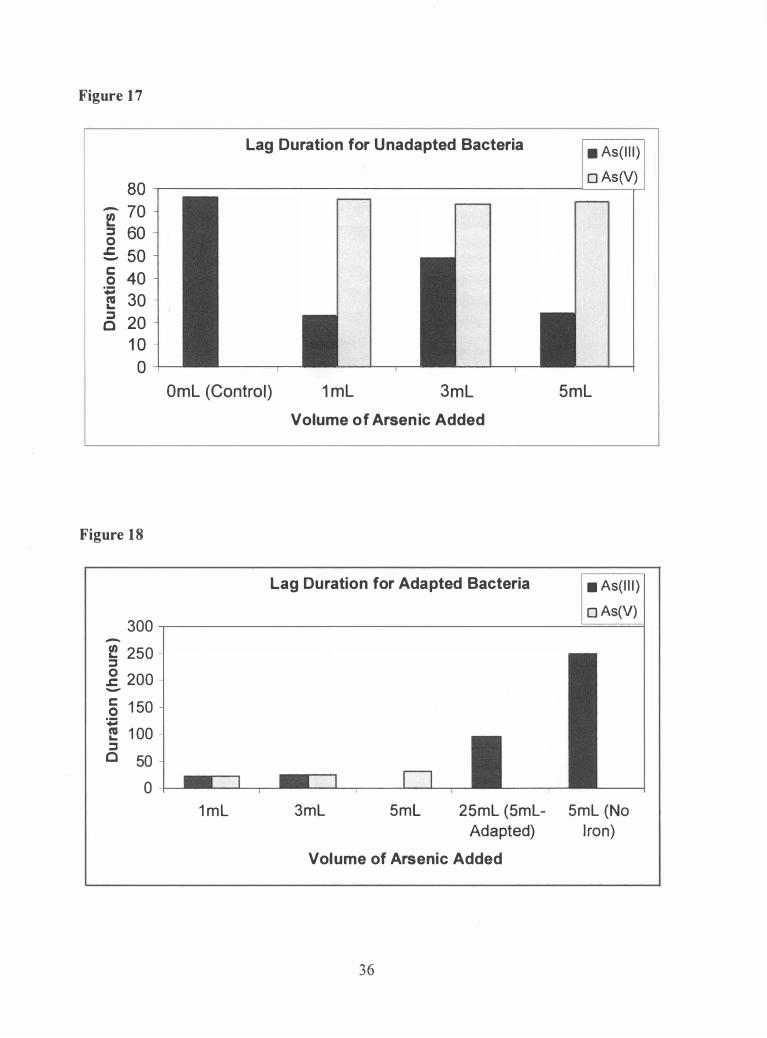
Figure 17
Lag Duration for Unadapted Bacteria • As(l I l ) o As0l) 80 .-------------------------------------�----�
- 70 � g 60 :S 50 § 40
� f! 30 c5 20
1 0 o
Figure 1 8
300 -� 250 ::J � 200 -
c 1 50 0 � CIS 1 00 ... ::J
0 50
0
OmL (Control) 1 mL 3mL Volume of Arsen ic Added
Lag Duration for Adapted Bacteria
1 m L 3mL 5mL 2SmL (SmL
Adapted)
Volume of Arsenic Added
36
5mL
• As(l I l ) o As(V)
5mL (No
I ron)

Figure 19
Growth Duration for Unadapted Bacteria • As(l I l) o As(V)
200 �--------------------------------�==� .. ..
f! :s 1 50 o
.c .. r'"
5 1 00 .-
-
i! a 50
0 +--
OmL (Control)
Figure 20
1 mL 3mL 5mL
Volume of Arsenic Added
Growth Duration for Adapted Bacteria • As(I I I ) o As(V)
200 ,------------------------------------L--� -... ..
� g 1 50
.c
5 1 00 .-
-
i! :s 50 o
O +-
1 mL 3mL 5mL
Vol ume of Arsenic Added
37
25mL (5mLAdapted)

Figures 2 1 and 22 show the cell count for unadapted and adapted bacteria exposed to
As(III) and As(V) for 1 50 hours.
Figure 21
(0 25 0 T""
20 '"
...I
� 1 5 -s:: :s 1 0 0
(.)
G) 5 (.)
0
Figure 22
20
<0 0 1 5 T""
'"
...I E
- 1 0 -s:: :s 0 5 (.)
G) (.) 0
Cell Count of Bacteria Exposed to As(lI I)
for 1 50 Hours • Unadapted Cells • Adapted Cells
OmL 1 mL 3mL 5mL 25mL (5mL-
Volume of As(lI I) in Medium Adapted)
5mL (No Iron)
Cell Count of Bacteria Exposed to As(V) - Unadapted Cell�
OmL
for 1 50 Hours _ Adapted Cells
1 m L 3mL 5mL
Volume of As(V) Added to Medium
38
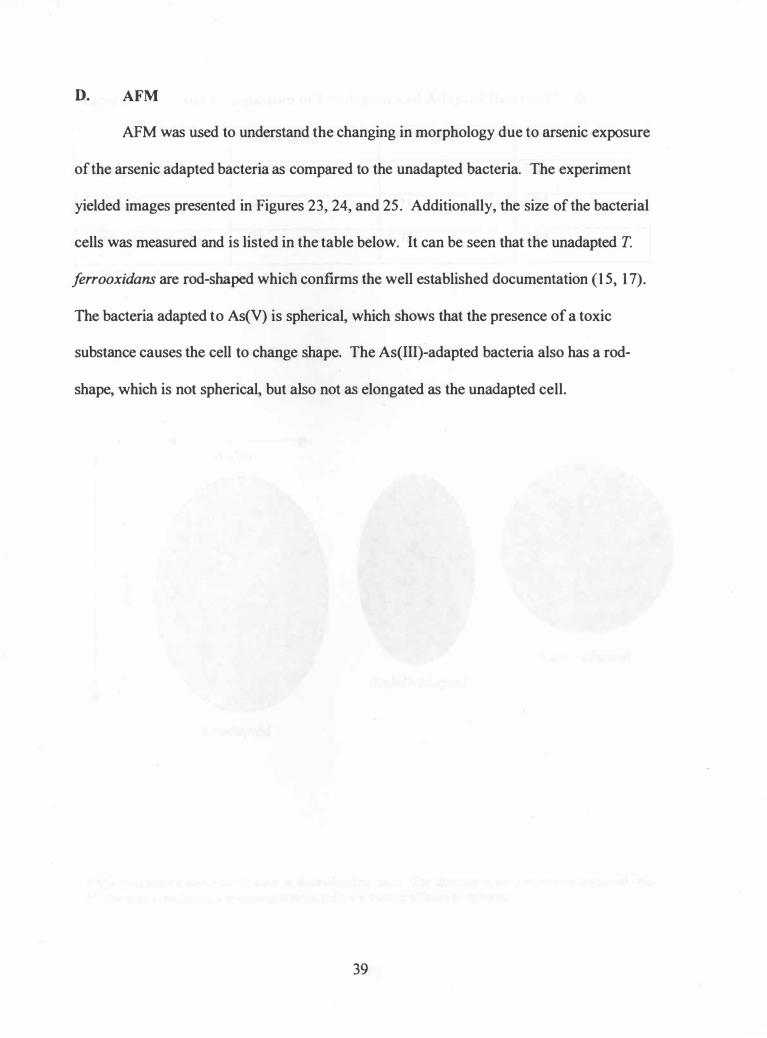
D. AFM
AFM was used to understand the changing in morphology due to arsenic exposure
of the arsenic adapted bacteria as compared to the unadapted bacteria. The experiment
yielded images presented in Figures 23, 24, and 25. Additionally, the size of the bacterial
cells was measured and is listed in the table below. It can be seen that the unadapted T.
ferrooxidans are rod-shaped which confirms the well established documentation (15, 1 7).
The bacteria adapted to As(V) is spherical, which shows that the presence of a toxic
substance causes the cell to change shape. The As(III)-adapted bacteria also has a rod
shape, which is not spherical, but also not as elongated as the unadapted cell.
39

Table 6 Size Comparison of Unadapted and Adapted Bacterial Cells
Length (Jlm) Width (Jlm) Area** (Jlmz)
Unadapted cells 2.46 1 .80 3 .48
As(llI)-adapted cells 1 .97 1 .2 1 1 .87
As(V)-adapted cells 1 .78 1 .78 2.49
... . Width
As(V)-adapted
As(III)-adapted
Unadapted
* The cells shown above are to scale in dimensionless units. The diagram is for comparison purposed only. * * The area calculation is assuming that the cells are perfect ellipses or spheres.
40

Figure 23 Unadapted AFM Images
Arial View
11M
X 2 . 000 IIM/di y
2D View
5 . 0 pm
2 . 5 pm
4 1
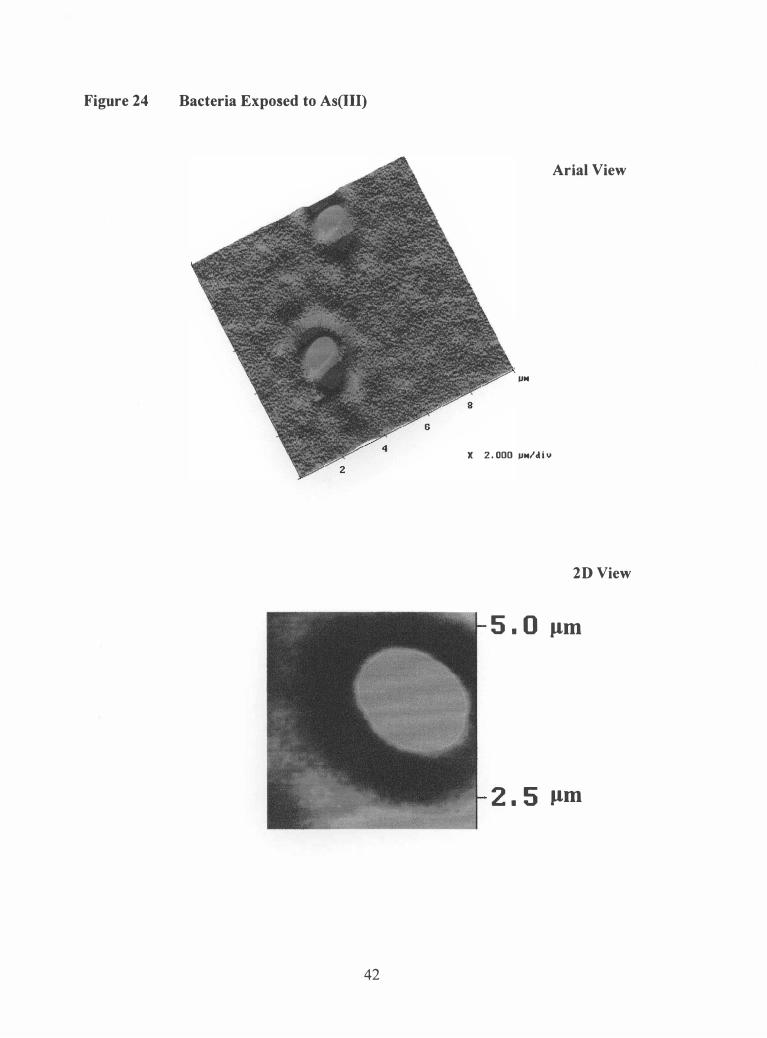
Figure 24 Bacteria Exposed to As(IU)
Arial View
J.lM
X 2 . 000 J.lM/d i "
2D View
5 . 0 pm
2 . 5 pm
42

Figure 25 Bacteria Exposed to As(V)
Arial View
X 5 . 000 Jllf/di v
2D View
2 . 5 5 . 0 7 . 5 flm
43

VI. DISCUSSION OF RESULTS
The results of the experiments have shown that not only does T. ferrooxidans
have a response to arsenic exposure, but that it behaves differently to As(III) and As(V).
The IEP detennined by the zeta potential measurements of the unadapted cells as
compared to the cells adapted to As(III) and As(V) at various concentrations shows that
the different species of arsenic alter the surface charge of the cells in diverse ways
possibly due to the secretion of different products on the cell surface.
The AFM results show the morphology of the arsenic adapted bacterial cells.
When bacterial cells are exposed to toxic substances, they change their surface
morphology. It is apparent that the As(V) is more toxic to T. ferrooxidans as the cell
shape of the As(V)-adapted bacteria is completely spherical as compared to the As(III)
adapted bacterial cells which are still rod-shaped. It is interesting to note that the As(III)
adapted cells have the smallest idealized area. As(V)-adapted bacteria cells are 1 .3 times
larger and unadapted cells are 1 .9 times larger than the As(III)-adapted cells.
The growth rates curves were very instrumental in determining the effects of
As(III) and As(V) on the growth of the unadapted and adapted cells. The average lag
period for all the adapted cells was fairly unifonn with exception of the 5mL As(III)
adapted bacteria which had lag duratio.n of less than 24 hours, refer to Figure 1 8 for a
graphical representation. The average lag for the adapted cells is 25± 3 hours, if the
duration of 5mL As(III)-adapted bacteria is not included. The unadapted cells with
various levels of As(V) added have a lag duration of 74 ± 1 hours. The unadapted cells
which were exposed to As(lII) do not have such a consistent lag period, but the average
value is 32 ± 1 1 hours which is substantially less than the lag period of the As(V). A
44

comparison of the lag durations can be seen in the bar graph in Figure 1 7. This suggests
that As(V) is more toxic to T. ferrooxidans than is As(II!) because the bacteria takes
approximately twice as long to acclimate to the arsenic before growth can begin.
The exponential growth durations varied more than did the lag phases, however
there are general trends that can be seen. The average duration for As(V)-adapted bacteria
with As(V) added to the medium was 88 ± 1 1 hours and 49 ± 1 7 hours for unadapted
bacteria with the addition of As(V). For the mediums with As(III) added, the adapted
bacteria had an average of 1 43 ± 48 hours and 1 34 ± 42 hours for unadapted bacteria. In
both arsenic species, the adapted bacteria exhibited a longer growth phase than did the
unadapted bacteria. However, the growth phase was substantially longer with the
addition of As(II!) than with As(V) whether or not the bacteria was adapted as seen in
Figures 1 9 and 20. This suggests that T. ferrooxidans grow better in the presence of
As(II!) or may be able to use As(III), directly or indirectly, as a nutrient source.
In Figures 9 through 1 1 , it can be seen that the growth of the bacteria is not
inhibited by the addition of 1 to 5 mL of As(III) solution to the medium. In fact with the
exception of adapted bacteria in the I mL As(II!) growth curve, both the unadapted and
adapted bacteria have higher cell counts with As(III) than without the addition of arsenic
at all, see Figure 21 . This again suggests that T. ferrooxidans prefers As(III) in its growth
environment and may possibly be oxidizing As(III) to use as a direct or indirect nutrient
source for growth.
Figures 1 2 through 14 as well as Figure 22 pertain to the bacterial mediums with
various levels of As(V) added. It can be seen that the growth of the adapted and
unadapted bacteria is inhibited by As(V) and the adapted cells have a higher growth rate
45
than the unadapted cells. This trend however does not hold true for bacteria with 3mL of
As(V) added, neither the unadapted or adapted cells seem to be affected by the addition
of As(V). The general trend suggested that As(V) may be more toxic to T. ferrooxidans
than AsCII!).
Because the bacteria appeared to be proliferating on As(III), the growth rate
curves for two experimental bacteria mediums were developed. The first one measured
the growth of 5mL As(V)-adapted bacteria when 25 mL of As(lIT) were added to the
medium, see Figure 1 5. There was very little growth at the beginning with a lag period
of 95 hours. This duration is significantly longer than the 32 hours that it took unadapted
bacteria to acclimate to even 5 mL of As(IIT) this comparison can be seen in Figure 1 8.
The initial growth phase had a growth rate of 1 .47* 106 cells/mL per day, which then
jumped to a growth rate of 20· 1 06 cells/mL per day after the 241 tb hour. This shows that
although it took the bacteria longer to adjust to the higher level of AS(lII), it had the
highest cell count of all the various bacterial samples. These results again suggest that
As(III) directly or indirectly provides a source of nutrients for T. ferrooxidans.
The second experimental medium was inoculated with 5mL As(III)-adapted
washed bacterial cells and 5mL of As(III), but contained no iron as a nutrient source, see
Figure 1 6. The T. ferrooxidans did not grow with As(IIT) as the sole energy source. It
also did not begin the death phase until after 2 1 8 hours which again suggests that AS(lII)
is not as toxic to T. ferrooxidans as has been previously reported.
46

VU. CONCLUSION
Bioremediation is a field in which much more research is needed for it to become
a viable treatment technology that can compete with the more traditional technologies for
heavy metal remediation. In terms of heavy metals, such as arsenic, in which their
characteristics are dependent upon their oxidation states, it is important to examine the
effects that the various oxidation states have on bacteria. This thesis provides
information on the effects of As(lII) and As(V) on T. ferrooxidans which is vital if the
bacterium is to be used effectively for bioremediation techniques. Three main
conclusions can be drawn from this research.
First, As(III) and As(V) modify the morphology of T. ferrooxidans in different
ways. This is evident in the results of the zeta potential readings as well as the AFM.
The zeta potential shows that the surface charge of the bacterial cells is altered depending
on which species of arsenic the bacteria is exposed. Additionally, the AFM has shown
that the shape of the bacterial cell is varies depending on whether it is exposed to As(lII)
or As(V).
Secondly, this study suggests that As(V) is more toxic to T. ferrooxidans than
As(III) in the presence of iron. This can be seen in the growth curves. This conclusion is
supported by the results of Breed et al (28) that arsenic toxicity on a mixed culture,
including T. ferrooxidans, is dependent on the availability of an energy source and that
As(III) may not have the toxicity levels that have been previously reported. .
A finding of this research that has not been previously documented is fact that the
T. ferrooxidans in this study, whether adapted or unadapted to As(lII), grows better in
the presence of As(III) than without any arsenic at all . But as formerly recognized,
47

T ferrooxidans cannot grow with As(III) as its sole source of energy. The bacteria could
be using the As(III) as a secondary source of energy in conjunction with the iron by
indirectly oxidizing the As(III) to As(V) by the bacterial metabolites. This reaction could
in turn cause the iron to be reduced from Fe(III) to Fe(I1), making the ferric iron available
to be.oxidized by the bacteria as a nutrient source. Another type of bacteria has been
documented with this property to "survive better in the presence of arsenic", Alcaligenes
faecalis (20). This bacteria is also motile, rod-shaped, and approximately the same size
as T ferrooxidans.
48

VIII. RECOMMENDATION
This research provides the foundation for which further research can expand
upon. There are many directions that can be explored. As this research was conducted to
investigate how T. ferrooxidans could be used to remove or detoxify arsenic in drinking
water, the bacteria was adapted to arsenic levels within the vicinity of 1 0 ppb which is
new allowable level of arsenic in drinking water for the United States and 4000 ppb
which is the concentration of some of the highest arsenic contaminated sources in
Bangladesh. The bacteria could be adapted to higher levels for research involving the
remediation of arsenic contaminated industrial sites which reach concentrations in the
tens of thousands ppb. Additionally, research could be conducted on the use of T.
ferrooxidans for bioremediation of heavy metals other than arsenic.
Phytoremediation is also a plausible technique for arsenic remediation, although
more research is needed. It is important to understand the microbial activity in
conjunction with oxidization/reduction of arsenic compounds as it relates to the soil
ecosystem. Because the arsenic species determines its toxicity, bioavailability, and
solubility, understanding the way in which various types of microbes and plants change
arsenic's speciation is imperative in the design of bioremediation techniques. It is
docwnented ( 12) that most plants uptake As(V) much more readily than As(III). If this is
the case, bacteria that oxidizes As(III) could be used as a pretreatment to convert As(III)
to As(V).
On a genetic level, there are many opportunities for further investigation and
exploration of the effects of arsenic on T. ferrooxidans. Sectional analysis of the
bacterial cells of the arsenic adapted bacteria could be performed. This would give
49
insight into the mechanisms that are involved in cell's metabolism of As(III) and As(V).
Additionally, an analysis could be conducted to detennine the products that are secreted
on the cell surface from the interactions with As(III) and As(V). Further research could
also be conducted to fmd out why As(III) is less toxic than As(V) for T ferrooxidans
when for most species it is As(V) that is more detrimental.
Another very interesting question is why does T ferrooxidans appear to survive
better in the presence of As(III) than without any arsenic at all. This preliminary research
suggests that the T ferrooxidans is using As(III) as a secondary nutrient source through
the oxidation/reduction reactions between the arsenic and iron. The species of arsenic in
the medium before, during, and after growth could also be determined to see how much
of the As(III) is being converted to As(V). Although the arsenic speciation detennination
alone would not be enough to conclude that the T ferrooxidans is using As (III) as a
nutrient source because it has been documented that the metabolites from T ferrooxidans
are capable of oxidizing As(III) as well. As stated before, it is possible that the
metabolites are oxidizing the arsenic which in tum in reducing the iron, making it an
available source of nutrients. Therefore, the species of iron in the medium before, during,
and after growth should be determined as well to understand the oxidation/reduction
reactions that are taking place in the bacterial medium.
There are also many experiments that could be conducted to more acutely focus
this finding that As(III) is less toxic than As(V) for T. ferrooxidans when a nutrient
source is present. The parameters involved with this phenomena need to be investigated
such as the required ratio of the nutrient source to As(III). Another question to be
explored could be at what point is the As(III) not only harmless to the bacteria, but the
50
bacterial metabolites are able to facilitate oxidation/reduction reactions with the arsenic.
If it is proven that this type of reaction is indeed taking place in which the As(III) being
converted to As(V), then more research should be conducted on the optimal levels of
As (Ill) and As(V) the bacteria can tolerate in the growth medium, as this study has shown
that As(V) is more toxic to T. ferrooxidans in the presence of iron.
There are many directions that this introductory study may lead from the small
scale of genetics and microbiology to the larger scale implementation of remediation
techniques. This study has opened the door for many intriguing queries to be
investigated and answers discovered.
5 1

REFERENCE
1 . Viraraghavan, T., Subramanian, K.S., Aruldoss, J.A. 1 999. Arsenic in Drinking Water- Problems and Solutions. Water Science Technology 40(2):69-76
2. Somasundaran, P. 1 999. Project Description: Study of Assessment and Remediation of Arsenic Enrichment in Groundwater. Department of Earth and Environmental Engineering, Columbia University
3. World Health Organization. 2002. Arsenic in Drinking Water Fact Sheet. www.who.intlinf-fs/en/fact2 l O.html accessed October 23, 2002
4. Lepkowski, Wit. 1 998. Arsenic Crisis in Bangladesh. C&EN Washington. November 1 6, 1 998: 27-29
5 . Hering, Janet, Dutta, Subijoy. 2000. In-Situ Remediation of Arsenic-Contaminated Groundwater: Proposal For A Pilot in West Bengal, India.
6. Turpeinen, Riina, 2002. Interactions between Metals, Microbes, and Plants -Bioremediation of Arsenic and Lead Contaminated Soils. Department of Ecological and Environmental Sciences, University of Helsinki
7. Parvez, M.F., Ahsan, H., Chen, Y., van Geen, A., Hussain, A.Z.M.I., Momotaj, H., Horneman, A., Dhar, R., Zheng, Y., Stute, M., Simpson, H.J., Slavkovich, V., loIacono, N.J., Shahnewas, M., Ahmed, K.M., Graziano, J .H. 200 1 . The Arsenic Problem and Its Awareness in Bangladesh Population: Results of a Large Population-based Survey. Arsenic in Drinking Water an International Conference at Columbia University, New York, November 226-27, 2001
8. Harvey, P.I., Crundwell, F.K. 1 996. The Effect of As(III) on the Growth of Thiobacillus ferrooxidans in an Electrolytic Cell under Controlled Redox Potentials. Minerals Engineering 9(1 0): 1 059- 1068
9. Gihring, Thomas M., Druschel, Gregory K., McClenskey, R. Blaine, Jamers, Robert J., Banfield, Jillian F. 200 1 . Rapid Arsenite Oxidation by Thermus aquaticus and Thermus thermophilus: Field and Laboratory Investigations. Environmental Science Technology 35 : 3857-3862
10. Gihring, Thomas M., Banfield, Jillian F. 200 1 . Arsenite Oxidation and Arsenate Respiration by a New Thermus isolate. FEMS Microbiology Letters 204: 335-340
1 1 . Bhawan, Jal Vigyan. 2000. Arenic: Occurrence, Toxicity and Speciation Techniques. Water Resources 34(1 7): 4304-43 12
52

12. Ritchie, A.W., Harrington, C.F., Haris, P.I., Jenkins, R.O. 2002. Mobilisation of Arsenic from Contaminated Soil via Bacterial Arsenate Respiration. www.math.ohio-state.edu/�tanveer/icben02final/parvezhans.octI 5.doc accessed March 6, 2003
1 3 . Santini, Joanne M., Sly, Lindsay I., Schnagl, Roger D., Macy, Joan M . 2000. A New Chemolithoautotrophic Arsenite-Oxidizing Bacterium Isolated from a Gold Mine: Phylogenetic, Physiological, and Preliminary Biochemical Studies. Applied and Environmental Microbiology: 92-91
14. Meharg, Andrew A., Hartley-Whitaker, Jeanette. 2002. Arsenic Uptake and Metabolism in Arsenic Resistant and Nonresistant Plant Species. New Phytologist 1 54: 29-43
1 5. Jensen, Anders B., Webb, Colin. 1 995. Ferrous Sulphate Oxidation Using Thiobacillus ferrooxidans: a Review. Process Biochemistry 30(3): 225-236
16. De, G.C., Oliver, D.J., Pesic, B.M. 1 996. Effects of Heavy Metals on the Ferrous Iron Oxidizing Ability of Thiobacillus flrrooxidans. Hydrometallurgy 44:53-63
1 7. Natarajan, K.A. 1 998. Microbes Minerals and Environment. Department of Metllurgy, Inida Institute of Science, Bangalore. Geological Survey of India. 43-56
1 8. Sugio, Tsuyoshi, Fuhioka, Akira, Tsuchiya, MOOo, Shibusawa, Naiki, Iwahori, Kenji, Kamimura, Kazuo. 1998. Isolation and Some Properties of a Strain of the Iron-Oxidizing Bacterium Thiobacillus ferrooxidans Resistant to 2,4-Dinitrophenol. Journal of Fermentation and Bioengineering 86( 1 ): 1 34- 137
19. Ehrlich, Henry Lutz, 2002. Geomicrobiology, Fourth Edition, Marcel Dekker, Inc. New York, NY. 303-326
20. Frankenberger, William T. Jr. 2002. Environmental Chemistry of Arsenic, Marcel Dekker, Inc. New York, NY. 3 1 3-361
2 1 . Chaney, Rufus L., Malik, Minnie, Li, Yin M., Brown, Sally L., Brewer, Eric P., Angle, J. Scott, Baker, Alan JM. 1 997. Phytoremediation of Soil Metals. Current Opinion in Biotechnology 8: 279·284
22. Rasjin, nya, Smith, Robert D., Salt, David E. 1997. Phytoremediation of Metals: Using Plants to Remove Pollutants from the Environment. Current Opinion in Biotechnology 8: 221 -226
53

23. Meagher, Richard B., 2000. Phytoremediation of Toxic Elemental and Organic Pollutants. Current Opinion in Plant Biology 3 : 1 53-162
24. Dahmani-Muller, H., van Oort, F., Ge1ie, B., Balabane, M. 1 999. Strategies of Heavy Metal Uptake by Three Plant Species Growing Near a Metal Smelter. Environmental Pollution 109:23 1 -238
25. Ma, Lena Q., Komar, Kenneth M., Tu, Cong, Zhang, Weihua, Cai, Yong, Kennelley, Elizabeth D. 200 1 . A Fern that Hyperaccumulates Arsenic. Nature 409, 579
26. Weise, Elizabeth. 2002. Poison-Craving Plant, Germ Designed to Suck Up Pollutants; 'Bio-remediation' Shows Promise. USA Today, October 8, 2002
27. Revkin, Andrew C. 2001 . New Pollution Tool: Toxic Avengers With Leaves. The New York Times, March 6, 2001
28. Breed, A.W., Glatz, A., Hansford, G.S., Harrison, S.T.L. 1 996. The Effect of As(III) and As(V) on the Batch Bioleaching of a Pyrite-Arsenopyrite Concentrate. Minerals Engineering 9 ( 12): 1 235-1252
29. West, R.J., Stephens, G.M., Cilliers, J.J. 1 998. Zeta Potential of Silver Absorbing Thiobacillusferrooxidans. Mineral Engineering 1 1 (2): 1 89-1 94
30. Helfferich, Carla. 1 994. Domesticating the Gold Bugs, and the Copper Bugs Too. Geophysical Institute, University of Alaska, Fairbanks, Alaska Science Forum, June 1 6, 1 994
3 1 . Tenny, Ron, Adams, Jack. 200 1 . Ferric Salts Reduce Arsenic in Mine Effluent by Combining Chemical and Biological Treatment. Environmental Science and Engineering. www.esemag.coml01 0 1Iferric.html. accessed October 1 5, 2002
32. Oremland, Ronald. 2002. Microbial Redox Cycling of Arsenic Oxyanions in Anoxic Environments. u.s. Geological Survey Artificial Recharge Workshop Proceedings, Sacremento, California, April 2-4, 2002
33. Bosecker, K. 200 1 . Microbial Leaching in Environmental Clean-up Programmes. Hydrometallurgy 59: 245-248
34. Valls, Marc, de Lorenzo, Victor. 2002. Exploiting the Genetic and Biochemical Capacities of Bacteria for the Remediation of Heavy Metal Pollution. FEMS Microbiology Review 26: 327-338
35. Costly, S.C., Wallis, F.M. Bioremediation of Heavy Metals in a Synthetic
54
Wastewater Using a Rotating Biological Contactor. Water Resources 35 ( 1 5): 371 5-3723
36. Levin, Morris A., Gealt, Micheal A. 1993. Overview of Biotreatment Practices and Promises. In: Biotreatment of Industrial and Hazardous Waste. McGraw-Hill, Inc. pp. 1 - 1 8
37. Alexander, Martin. 1 999. Biodegradation and Bioremediation. Academic Press
38. Bioremediation and Phytoremediation Glossary. 1 998. http://members.tripod.coml-bioremediation accessed April 13 , 2003
39. Hinchee, Robert, Means, Jeffery L., Burris, David R., 1995. Bioremediation of Inorganics. Battelle Memorial Institute
55