Embed Size (px)
Citation preview
University of Northern Iowa University of Northern Iowa
UNI ScholarWorks UNI ScholarWorks
Dissertations and Theses @ UNI Student Work
2016
The effects of blended learning on critical thinking in a high The effects of blended learning on critical thinking in a high
school Earth Science class school Earth Science class
Renee Nicole Borglum University of Northern Iowa
Let us know how access to this document benefits you
Copyright ©2016 Renee Nicole Borglum
Follow this and additional works at: https://scholarworks.uni.edu/etd
Part of the Earth Sciences Commons, and the Educational Methods Commons
Recommended Citation Recommended Citation Borglum, Renee Nicole, "The effects of blended learning on critical thinking in a high school Earth Science class" (2016). Dissertations and Theses @ UNI. 236. https://scholarworks.uni.edu/etd/236
This Open Access Thesis is brought to you for free and open access by the Student Work at UNI ScholarWorks. It has been accepted for inclusion in Dissertations and Theses @ UNI by an authorized administrator of UNI ScholarWorks. For more information, please contact [email protected].
THE EFFECTS OF BLENDED LEARNING ON CRITICAL THINKING
IN A HIGH SCHOOL EARTH SCIENCE CLASS
An Abstract of a Thesis
Submitted
in Partial Fulfillment
of the Requirements for the Degree
Master of Arts
Renee Nicole Borglum
University of Northern Iowa
May 2016
ABSTRACT
This study analyzed the effects of differing levels of technology use in a high
school Earth Science class on student performance on the Classroom Test of Scientific
Reasoning (CTSR). Blended learning manipulates the combination of hands-on
activities, classroom discussions, online discussions, interactive simulations and a variety
of assessments that engage, instruct and assess student learning. Critical thinking is the
set of skills and dispositions that foster problem solving, reasoning ability and self-
regulation. The increasing use of technology in the classroom and fluctuation of content
standards prompted this research. The results have implications for the classroom teacher
of a wide range of ages and content areas as well as parents.
The control group experienced eclectic and reduced use of technology while the
treatment group used a Learning Management System and an increased use of
technology. Both groups had the same classroom teacher, curriculum, and assessments.
The CTSR was given at the beginning and end of the semester in conjunction with a
qualitative survey.
All students improved their CTSR score. There was no statistical difference in
CSTR scores between treatment and control groups or between genders or age groups.
This implicates that the level of technology used in a classroom does not directly impact
critical thinking ability. Future studies could provide a more drastic difference in the
amount of technology used or measure growth over an entire academic year.
THE EFFECTS OF BLENDED LEARNING ON CRITICAL THINKING
IN A HIGH SCHOOL EARTH SCIENCE CLASS
A Thesis
Submitted
in Partial Fulfillment
of the Requirements for the Degree
Master of Arts
Renee Nicole Borglum
University of Northern Iowa
May 2016
ii
This Study by: Renee Borglum
Entitled: The Effects of Blended Learning on Critical Thinking in a High School Earth Science Class
has been approved as meeting the thesis requirement for the
Degree of Master of Arts in Science Education
___________ _____________________________________________________
Date Dr. Kyle Gray, Chair, Thesis Committee
___________ _____________________________________________________
Date Dr. Dawn Del Carlo, Thesis Committee Member
___________ _____________________________________________________
Date Dr. Lyn Countryman, Thesis Committee Member
___________ _____________________________________________________
Date Dr. Kavita Dhanwada, Dean, Graduate College
iii
ACKNOWLEDGEMENTS
I would like to recognize the support and encouragement from my family and
friends throughout my master’s education. My husband Jamie Borglum and my mother-
in-law Maxine Borglum kept me going when I was ready to give up. My grandmother
Joan Croxdale Sites inspired me to become a teacher in the first place. My daughters
Adali, Emilia and Livia, father-in-law Jim Borglum, my parents Marc and Adrian
Brideau, my sister Janelle Brideau and Sue Shankland have all given me the incentive I
needed throughout the program.
I am grateful to my thesis committee members Dr. Kyle Gray, Dr. Dawn Del
Carlo and Dr. Lyn Countryman for their time, feedback and expertise on my Master of
Arts in Science Education degree.
I would like to acknowledge my friends and colleagues at Waverly-Shell Rock
High School for supporting me throughout my career. I also appreciate all of my students.
Without every one of these people, I would not be completing my degree.
iv
TABLE OF CONTENTS
PAGE
LIST OF TABLES ............................................................................................................ vi
LIST OF FIGURES ........................................................................................................ vii
CHAPTER 1. INTRODUCTION ........................................................................................1
How Does Blended Learning Affect Critical Thinking Skills? ...... ....................... 1
Literature Overview on Blended Learning and Critical Thinking ...... ................... 2
Blended Learning Compared to Online Learning ..............................................2
Blended Learning Compared to Traditional Learning .......................................3
Critical Thinking ................................................................................................4
The Missing Pieces ..................................................................................................4
The Benefits of this Study........................................................................................6
CHAPTER 2. LITERATURE REVIEW ............................................................................7
What is Blended Learning? ......................................................................................7
Creating a Blended Learning Environment .............................................................8
Comparing Blended Learning to Traditional Methods ..........................................11
Comparing Blended Learning to Online Learning ................................................12
Benefits of Blended Learning ................................................................................13
Measuring Critical Thinking ..................................................................................14
CHAPTER 3. METHODS ................................................................................................17
Data Collection .....................................................................................................17
v
Study Setting ..........................................................................................................20
Data Analysis .........................................................................................................21
CHAPTER 4. RESULTS ...................................................................................................23
Demographics .......................................................................................................23
Classroom Test of Scientific Reasoning ...............................................................24
CTSR Pretest ...................................................................................................24
CTSR Posttest ..................................................................................................24
Changes in CTSR Scores .................................................................................25
Survey ...................................................................................................................27
Survey Before .................................................................................................27
Survey After ....................................................................................................27
Changes in Survey Responses ........................................................................29
CHAPTER 5. DISCUSSION .............................................................................................31
Classroom Test of Scientific Reasoning ................................................................31
Survey ....................................................................................................................32
Reservations ...........................................................................................................33
Conclusions ............................................................................................................35
REFERENCES ..................................................................................................................36
APPENDIX A: IRB CONSENT FORM ...........................................................................40
APPENDIX B: CLASSROOM TEST OF SCIENTIFIC REASONING .........................44
APPENDIX C: CTSR FORM ............................................................................................54
APPENDIX D: SURVEY ..................................................................................................63
vi
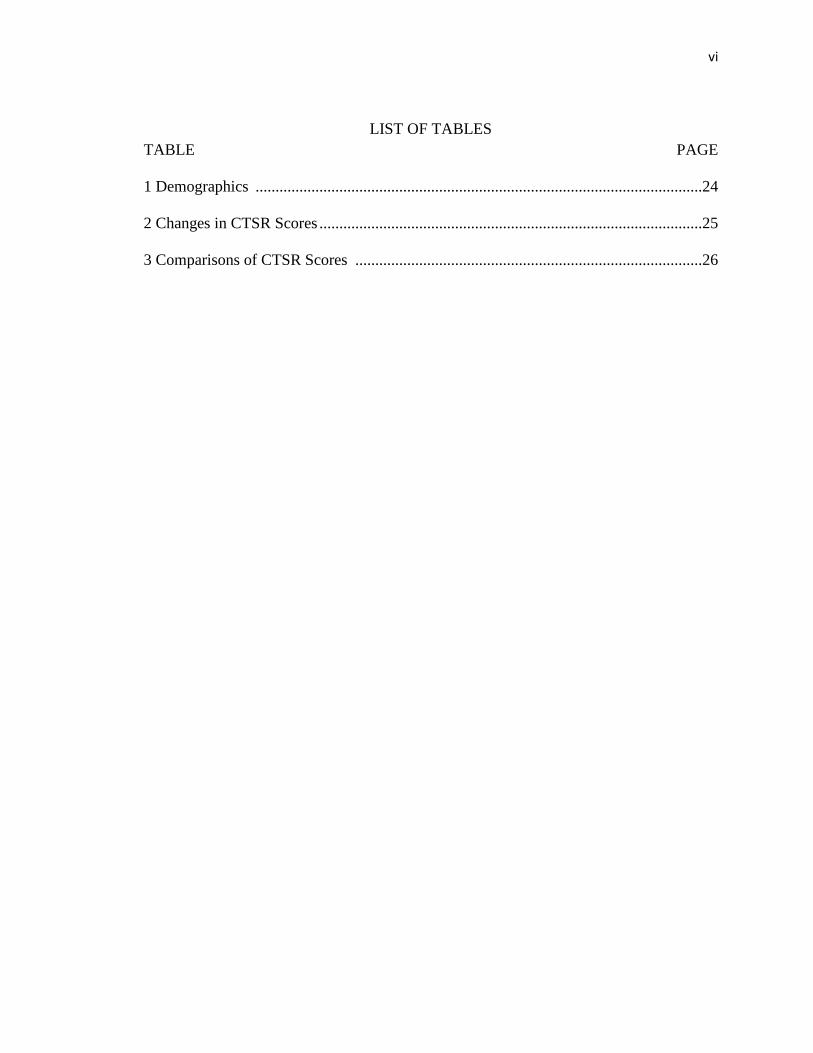
LIST OF TABLES TABLE PAGE
1 Demographics ................................................................................................................24
2 Changes in CTSR Scores ................................................................................................25
3 Comparisons of CTSR Scores .......................................................................................26
vii
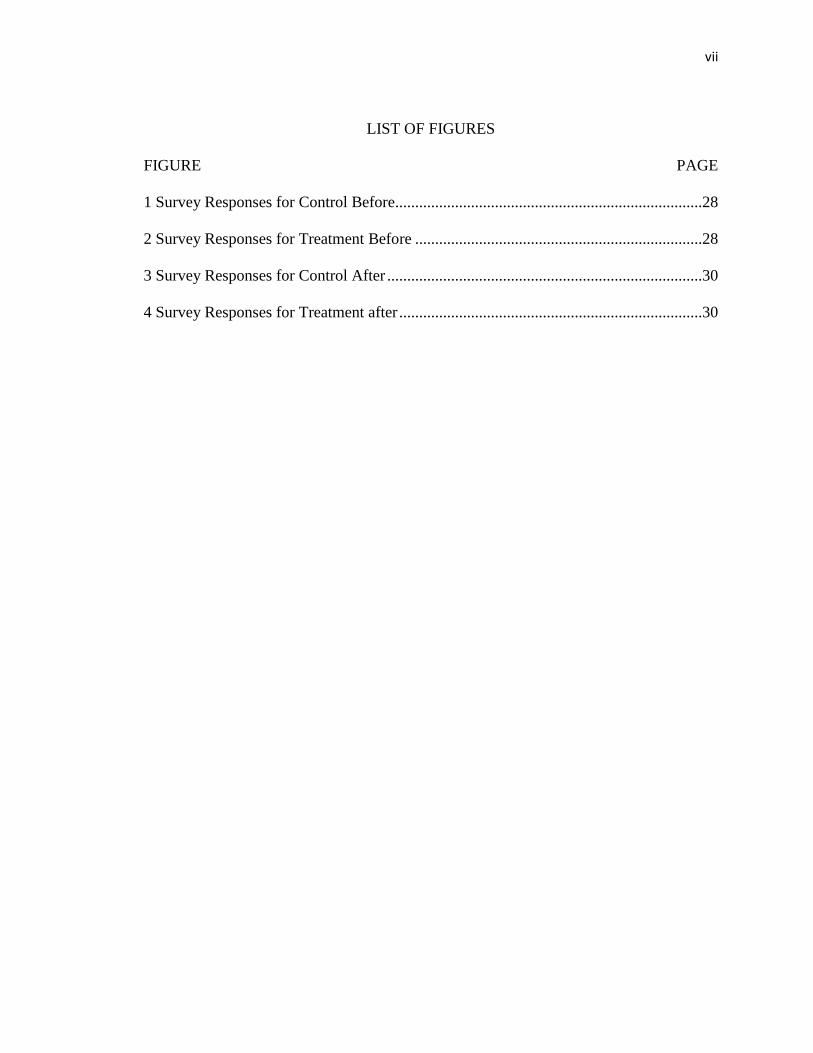
LIST OF FIGURES
FIGURE PAGE
1 Survey Responses for Control Before.............................................................................28
2 Survey Responses for Treatment Before ........................................................................28
3 Survey Responses for Control After ...............................................................................30
4 Survey Responses for Treatment after ............................................................................30
1
CHAPTER 1
INTRODUCTION
How Does Blended Learning Affect Critical Thinking Skills?
As teachers adopt more computer-based educational technology into their
classrooms, it is easy to focus on the tools and not the teaching or the learning. Blended
learning is a catch-phrase with multiple meanings, but the focus here is on a combination
of hands-on activities, classroom discussions, online discussions, interactive simulations
and a variety of assessments that engage, instruct and assess student learning. Unlike
traditional teaching, asynchronous interactions are a major component of blended
learning. This means that students and teachers do not have to be in the same place at the
same time. Interactions may be discussions, assignment submissions, messaging, or other
tools that do not require teachers and students to be simultaneously engaged. For
instance, some students may do an activity early in the morning, others during the day,
and still others in the evening, while the teacher checks in and gives feedback at night.
Instead of focusing on how blended learning helps on standardized tests or improves
grades, this study examined whether a systematic blended approach could improve
critical thinking skills. Understanding how a blended learning classroom model affects
critical thinking skills may be beneficial to teachers of many ages and disciplines, parents
and post-secondary students.
Anticipated results included increased critical thinking for all students, a significant
difference in the treatment group compared to the control group, a significant preference
2
for technology in the treatment group compared to the control group and no difference
between groups in their science or climate perceptions.
Literature Overview on Blended Learning and Critical Thinking
The literature on blended learning gives some insight into why technology is taking
such an expanding role in education. Currently, a single, uniform definition of blended
learning does not exist. Rather, several definitions have been posed. Oliver and Trigwell
(2005), Singh (2003), Sahin (2010) pose various definitions that could be applied to a
variety of high quality, face-to-face classrooms that use multiple tools in instruction. The
benefits of blended learning have been identified by Suanpang, Petocz, and Kalceff
(2004), Taradi, Taradi, Radic, and Porkrajac (2004) and Bonk and Graham (2004). The
considerations that should be taken into account when designing a blended classroom
have been identified by Gardner (1983) as well as Khan and Granato (2008). Demand for
blended learning experiences was studied by Picciano and Seaman (2009).
Blended Learning Compared to Online Learning
If a blended environment has benefits, why not go all the way to an online classroom?
With the technology boom, educators are seeking the best ways to use computers and
online tools in the classroom. Allen, Seaman, and Garrett (2007) outlined some statistics
that illustrate the sweeping movement for college classrooms integrating technology.
They found that at the Bachelor’s level, 16.3% of program offerings were online and
13.8% were blended. The largest increase in the percent of course sections taught online
occurred at colleges and universities with enrollments over 15,000 students. In 2003,
3.47% of all courses at these schools were taught online, but by 2005 that number had
3
increased to 10.35%. In fact, the demand far surpassed the supply for blended and online
classes.
However, subjects that are abstract, controversial, or complex require concrete
learning experiences and are not good candidates for fully online courses (Rossett,
Douglis & Frazee, 2003). Experiential learning is heavily documented and is the
foundation for hands-on experiences such as lab activities (Kolb, 1984). Experiential
learning focuses on learning as a continual process of understanding that evolves as new
experiences are compared to those of the past. Because science is complex, uses
experiential learning, can be abstract, and is at times controversial, a fully online science
course would not be as successful as one that is blended.
Blended Learning Compared to Traditional Learning
One outcome of the expansion and implementation of blended learning is a shift in
roles in the classroom. Comas-Quinn (2011) identified the pedagogical shift that has to
take place for blended learning to be successful. Teachers fade from the ultimate
dispenser of knowledge to a facilitator of learning, while students transition from
information sponges to active seekers of knowledge. This model closely parallels inquiry-
based and constructivist methods of instruction. Collaboration and problem solving in a
student-driven setting is prevalent. This pedagogy does not necessarily require
technology for implementation.
So is a blended classroom actually better than a traditional classroom for fostering
critical thinking skills? Several studies suggest that using computer technology improves
more than academic performance, and multiple studies have shown that the sense of
4
community, engagement, and collaboration are improved (Dziuban, Moskal, & Hartman,
2005; Rovai & Jordan, 2004; So & Brush, 2007). However, there is very little research on
how critical thinking is benefited by blended learning.
Critical Thinking
Critical thinking encompasses the skills and dispositions that foster problem solving,
reasoning ability and self-regulation. A study of college students found a direct
correlation between scores on a critical thinking assessment and GPA (Facione, 2011).
Critical thinking is the focus of this study because the content standards are always
fluctuating. When students leave school and become active members of society, reciting
facts may not be a marketable skill. However, being able to solve problems, self-regulate,
analyze, and interpret information are valuable life skills that good critical thinking
develops (Facione, 2011).
Several instruments have been developed to measure critical thinking skills including
the Test of Logical Thinking, Group Assessment of Logical Thinking, Watson-Glaser
Critical Thinking Assessment-Form S, the Cornell Critical Thinking Test (CCTT) and the
Classroom Test of Scientific Reasoning (CTSR).
The Missing Pieces
This study attempts to fill in the gap between the push to use technology in the
classroom and the need to develop critical thinking skills in students. As teachers replace
traditional tools and activities with an assortment of Web 2.0 tools, more classrooms are
blended. By using a blended-learning approach, the roles of teachers and students change.
Students are given more control over their learning and teachers facilitate more than they
5
directly instruct. There is ample access to Web 2.0 tools that teachers can exchange for
traditional lessons in their classrooms as well as multiple Learning Management Systems
(LMS) that aggregate many tools into one user interface. This makes blended learning a
possibility for any classroom teacher with student access to devices and the internet. In an
Australian study, it was found that universities had a better understanding of the
technology than the educational pedagogy behind implementing a LMS (Ellis & Calvo,
2007).
Over the past 100 years, reform movements within science education have swung like
a pendulum from dedicating the majority of class time on content to inquiry oriented
science instruction (DeBoer, 1991). To date, no happy medium has been found due in
part to the constraints of time in the classroom and ever-changing content standards that
must be met. Understanding how to use one tool to build a skill such as critical thinking
may allow teachers more flexibility to incorporate the best of both worlds. The
experiential learning can be done in the classroom, and the content can be emphasized
using technology. At the same time, a life skill such as critical thinking may be fostered.
While critical thinking has several measures, there are qualitative pieces of blended
learning that have been evaluated as well. Qualitative surveys about how students
perceive their understanding of the material (Suanpang et al., 2004), their value of
technology, their collaborative effectiveness (So & Brush, 2007), their involvement in the
class as a community (Rovai & Jordan, 2004), and their level of engagement have helped
to paint a complete picture of the differences between blended and traditional classrooms.
6
The Benefits of this Study
By examining the quantitative results on a critical-thinking assessment tool and
the qualitative results of surveys, this study may benefit teachers of any age group or
discipline. Secondary Science is the area studied; however, there are parallels in
elementary settings as well as post-secondary and graduate levels. The skill of critical
thinking is applicable to nearly all age groups and settings. Understanding the extent to
which blended learning affects critical thinking may enable teachers and professors to
mindfully decide when to use technology. In addition, parents contemplating online
schools for grades K-12 may be interested the impact of blended learning on critical
thinking. Lastly, post-secondary students who are investigating online degree programs
could apply these findings to their decision making process. The emphasis of this study is
to measure how a blended learning environment impacts the development of critical
thinking skills.
7
CHAPTER 2
LITERATURE REVIEW
What is Blended Learning?
Blended learning is a broadly used but poorly defined term. Blending can refer to
mixing e-learning with traditional learning, mixing online learning with face-to-face
instruction, mixing media, mixing contexts, mixing learning theories, or mixing
pedagogies (Oliver & Trigwell, 2005). With such a broad definition of blended learning,
it would be easier to identify what unblended learning is. Nearly every teacher at every
level uses some level of blending. “A single mode of instructional delivery may not
provide sufficient choices, engagement, social contact, relevance, and context needed to
facilitate successful learning and performance” (Singh, 2003, p. 51). Sahin (2010)
defined blended learning as a continuum from entirely face-to-face instruction to an
entirely online experience.
To create a blended-learning situation, not only does the content need to be presented
in a variety of ways, but the various learning needs of the students should to be taken into
account. Learners with high linguistic intelligence may excel at absorbing pages of text
while students with other strengths may struggle with this particular task (Gardner, 1983).
Khan’s Octagonal Framework (2008) identified eight angles to consider while
developing, delivering, managing, and evaluating blended learning. Ethical dilemmas,
institutional restrictions, pedagogical boundaries, technological limitations, interface
design issues, evaluation requirements, management practices, and resource support
availability are the eight angles to keep in mind while instituting a blended-learning
8
program (Khan & Granato, 2008). This framework aids in planning, development,
management, and evaluation of blended-learning programs so that a meaningful learning
environment can be created (Singh, 2003). Bonk and Graham (2004) found the strengths
of combining a computer-mediated environment and a face-to-face environment include
flexibility, participation, depth of participation, human connection, and spontaneity. All
of these benefits could not be achieved in just one mode of instruction. A study of 1,000
undergraduate statistics students found significant increases in their attitudes toward
statistics for those students who experienced online learning compared to students who
experienced a traditional setting (Suanpang et al., 2004). Blended learning is worth the
investment because there is significant evidence that students achieve at a higher level
than traditional courses without losing student satisfaction (Taradi et al., 2004).
This study defines blended learning as the combination of hands-on activities,
classroom discussions, online discussions, interactive simulations, and a variety of
assessments that engage, instruct, and assess student learning. According to Alonso,
Lopez, Manrique and Vies (2005), “The most efficient teaching model is a blended
approach, which combines self-paced learning, live e-learning, and face-to-face
classroom learning” (p. 234).
Creating a Blended Learning Environment
While many instructors already use a variety of media to teach, there are some
specific tools that are proven to improve the blended learning experience. Blogging or
online discussions are one way to have students communicate asynchronously and
communicating in this manner expands student learning (Colombo & Colombo, 2007).
9
Once students leave the traditional brick-and-mortar setting, they typically don’t think
about the material until the next class session. Using asynchronous communication
encourages students to reflect on what they learned in class and to apply it to themselves.
Blogs can be used to reinforce, review, enrich, and introduce new material (Colombo &
Colombo, 2007).
Online calendars allow the teacher to continually update information and send alerts
to students as events approach. A traditional posted calendar can still be updated and
inform students where relevant content can be found; however, content posted online can
be rich with hyperlinks and videos and has the advantage of being accessible when and
where the student chooses. Delivering content face to face and via paper requires the
student to be present and to physically have the content in order to make up for an
absence. Submitting assignments online allows the teacher to know precisely when it was
turned in. It can be graded conveniently with numerical, text, and voice feedback.
Material assignments allow more free-form feedback but must be handled repeatedly
between collecting, grading, and returning.
Beyond traditional assignments, a new set of online tools, commonly referred to as
Web 2.0, provide a host of innovative ways to apply student learning. Teachers now have
access to a large array of online tools that are interactive rather than passive sources of
information. Typically, Web 2.0 tools are software applications built on the Web as
opposed to on a desktop and include, but are not limited to, tests and quizzes, surveys,
bookmark sharing, picture sharing, social networking, tools to create posters, and sites
where students can create and share presentations. Presentation tools include Prezi,
10
Toontastic, Pic Collage, Educreations, iMovie and many more. Videos, animations, voice
recordings, sound effects, and more can be incorporated into these presentations.
Conventional presentations such as speeches, posters, brochures, and scrapbooks provide
a variety of media to be used as well. All of these tools can be used as outlets for students
to express themselves and to interact with the material in ways that are not possible in the
brick-and-mortar setting of traditional classrooms. To measure learning, online
assessment tools take testing to another level.
Online assessment tools can be formatted to match a paper and pencil test. Multiple
question formats can be used; however, the ability to shuffle questions means that
students are not looking at the same question at the same time. Instant feedback lets the
student know how they did and what they did wrong. Some are even adaptive and
modify the content based on the responses. Teachers have access to statistical reports that
help point out concepts that need re-teaching or expansion. Standard assessments have
many of the same features but require more time on behalf of the teacher. A combination
of all of these tools is called a Learning Management System (LMS).
An LMS is a centralized system hosted by a university or school district which
enables students to access, submit and receive feedback on assignments, hold discussions,
take quizzes, access learning material and interact with the instructor along with a myriad
of other functions. There are a number of social networking sites and other Web 2.0 tools
that can accomplish some of these same objectives. Using an LMS is superior to an
aggregation of tools because it concentrates all of those tools on one platform. This
allows for deeper communication between students and between student and teacher,
11
there is consistency for students, and long term documents such as e-portfolios can be
recorded. Furthermore, accessibility is guaranteed, and there is a filter for inappropriate
materials (Sclater, 2008). There are several LMSs available such as WebCT, BlackBoard,
Canvas, Sakai, and dotLRN. In some countries such as Denmark, Finland, and South
Korea, one LMS is adopted nationwide (U.S. Department of Education, 2011). Of these
choices, faculty and students have rated Instructure’s Canvas a superior option when
compared to Blackboard’s Learn from an academic standpoint (Robertshaw, 2015).
Faculty that piloted Canvas noted that it was easier to set up a course and easier to grade
in Canvas compared to Blackboard. Students commented that access to grades and files
was better on Canvas than Blackboard. It is essential that the users be familiar with the
functions and expectations of the technology before content is delivered, observed
Melton (2006). It is unlikely that using an LMS can transform education. Many LMS
systems restrict teaching pedagogy by providing a framework that tends to be self-
contained and focused on delivering information (Goodwin-Jones, 2012). As teachers are
exposed to alternative ways of using technology, different teaching pedagogies can be
used within an LMS.
Comparing Blended Learning to Traditional Methods
As education has evolved, learning theories have developed from behaviorism and
conditioning to constructivism and inquiry. “Constructivism learning theory, which
focuses on knowledge construction based on learner’s previous experience, is a good
match for e-learning” (Koohang, Riley, & Smith, 2009, p. 91). Teachers are no longer the
dispensers of knowledge. Instead, they are facilitators, mentors and providers of tech
12
support while they are constantly updating and renovating both online and face-to-face
aspects of their courses. Making this shift is more than learning a few technological tools,
it is a pedagogical shift that takes time and training (Comas-Quinn, 2011). This same
pedagogy can be applied without the technology; however, for blended learning to be
effective, it is essential.
Similarly, the students are not empty vessels to be filled and tested. Blended learning
allows for more frequent formative assessment because the responses are automatically
recorded and provide the data in a variety of helpful ways such as by student or by
question to inform instruction. Input from students about what they like and dislike can
be collected anonymously and influence changes in the course. In addition, test scores
and student satisfaction were significantly higher in a blended setting versus a traditional
setting (Taradi et al., 2004).
Comparing Blended Learning to Online Learning
A blended classroom can take on three different forms. First, it depends on the
content, the teacher, and the students to determine whether face-to-face, blended, or
online learning is most appropriate. Courses that are abstract, complex, or controversial
need more than a purely online interface (Rossett et al., 2003). A well-blended classroom
can be customized, integrated, flexible, and contain redundancy (Rossett et al., 2003).
The number of both fully online and blended course offerings have significantly
increased, especially in higher education (Allen et al., 2007). The technology explosion
has led to an increase in classes that utilize blended learning tools. Currently,
undergraduate institutions offer more online courses (64%) than blended courses (55%;

13
Allen et al., 2007). Because online is outpacing blended, it has been suggested that
blended courses are simply a stepping stone to being fully online. However, the number
of blended courses is too high to justify this claim (Allen et al., 2007). Based on a survey
completed by Eduventures, the demand for online or blended courses far exceeds the
supply, and there is ample room for growth in this area (Allen et al., 2007).
Benefits of Blended Learning
The “learning” in blended learning usually gets much less attention than the
“blended.” The benefits of blended learning include an increased sense of community
(Rovai & Jordan, 2004), higher levels of engagement and interaction (Dziuban et al.,
2006) and improved collaboration (So & Brush, 2007). Yet, there is a lack of studies that
explore the link between blending and improved learning.
A skill that may be enhanced in a blended classroom is critical thinking. Critical
thinking, like blended learning, is difficult to define. There are numerous cognitive skills
and personal dispositions that constitute critical thinking. Critical thinkers interpret,
analyze, evaluate, and infer (Facione, 2011). Critical thinkers are able to self-regulate,
explain, and inquire. They are well-informed, trustful, open-minded, flexible and honest.
A prevalent pattern is that critical thinking is measured to a far greater degree at the
postsecondary level than at the secondary level. A Google Scholar search for “critical
thinking postsecondary” resulted in 65,000 articles. Of those articles, 63% were included
in a search with addition of “online.” A similar search for “critical thinking high school”
yields a higher initial number of 267,000. However, only 32% of that remains when
“online” is added to the search. This is important to study at the high school level if it is
14
expected at the postsecondary level. Additionally, critical thinking is necessary for a
rational and democratic society.
Measuring Critical Thinking
There are several measures of critical thinking: the Test of Logical Thinking (TOLT),
the Group Assessment of Logical Thinking (GALT), the Watson-Glaser Critical
Thinking Appraisal: Form S (WGCTA-FS), the California Critical Thinking Skills Test
(CCTST) and the Classroom Test of Scientific Reasoning (CTSR).
The TOLT measures the ability to control variables, while using proportional,
combinatorial, probabilistic, and correlational reasoning (Tobin & Capie, 1981). The test
contains ten items that each require both a correct response and justification for that
response. Trials on grades 6 through college were shown to be reliable (Tobin & Capie,
1981). The TOLT has been used to predict performance in conceptual chemistry,
conditional reasoning performance, and mechanics conceptions (Jiang, Xu, Garcia, &
Lewis, 2010). Low TOLT scores indicate a need for concrete instruction and
development of formal reasoning.
The GALT measures six logical operations by presenting 21 problems that require an
answer and a justification (Roadrangka, Yeany & Padilla, 1983). GALT scores were used
to correlate students’ problem solving ability and their risk of failure in college chemistry
and microbiology grades (Jiang et al., 2010).
Both the TOLT and the GALT are paper and pencil exams requiring respondents to
select an answer and justify it. The main difference is that the GALT measures concrete
thinking while the TOLT measures reasoning skills.
15
The WGCTA-FS consists of 40 items that measure five critical skills: inference,
recognition of assumptions, deduction, interpretation, and evaluation of arguments. This
test was designed to measure students’ ability to recognize assumptions, evaluate
arguments, and appraise inferences (Norris, 1985). An examination of this assessment
found that the sub-categories are not telling, and the test should be used only as a general
measure of competency (Bernard et al., 2008).
A fourth measure, the CCTST, has succeeded in “detecting the growth in critical
thinking skills which is hypothesized to occur during college level instruction” (Facione,
1990, p. 13). This test measures five cognitive skills: analysis, evaluation, inference,
deductive reasoning, and inductive reasoning. The 34-item multiple choice test
successfully detects growth in critical thinking skills in college courses (Facione,
1990). Terry and Ervin (2012) did not find any variable that was statistically significant
of age, gender, grade point average, standardized test scores, ethnic background, major,
and transfer students. Although not statistically significant, students who had completed
more than 18 hours of coursework online scored slightly lower than average. When used
as a pre-test and post-test, the CSTR measures improvement in student critical thinking ,
and students who begin with a low score tend to see more improvement than those who
begin with a high score (Phillips, Chestnut, & Rospond, 2004).
Finally, the CTSR has 24 multiple choice questions that measure concrete, early-
formal and formal thinking skills (Lawson, 1978). It has been used as a pre and post-test
to measure growth in student thinking skills (Lawson, 2001). Coletta and Phillips (2005)
suggest using the CTSR with a Forced Concept Inventory to “measure the effectiveness

16
of alternative interactive engagement strategies” (p. 1). A nation-wide assessment of
grades 7-12 used the CTSR to establish grade level norms (O’Donnell, 2011). The 24
multiple choice questions are usually paired, asking first for the correct answer and then
the correct reason for that answer.
This study is needed because the majority of studies performed about blended
learning have focused on postsecondary experiences. However, the number of K-12
students who were enrolled in online courses jumped 47% from 2005-2006 to 2007-2008
(Picciano & Seaman, 2009). The purpose of this study is to determine how critical
thinking skills are affected by a blended learning environment as measured by the CTSR
as a pre-test and post-test as well as a qualitative survey completed at the beginning and
end of the study.
17
CHAPTER 3
METHODS
Data Collection
During this study, the dependent variable was the level of critical thinking ability in
students as measured by the Classroom Test of Scientific Reasoning (CTSR). The
independent variable was the classroom setting students experienced while using science
to build their critical thinking skills. This study collected data from five sections of a high
school Earth Science course. Three of the sections were part of the treatment group and
experienced a blended environment. These students were enrolled in Canvas and were
expected to use its features including the online calendar; receiving content
electronically; receiving, completing, and submitting assignments electronically; and
using collaboration tools such as Google Docs to work on summative projects as well as
take assessments and receive feedback. The remaining two sections of Earth Science
served as the control group. These students still had access to technology including a
Chromebook, the internet for research and online bulletin boards like Padlet but did not
have access to Canvas. As a result, their instructional experiences for this course were
more traditional. For example, this group depended on the written schedule in the
classroom, received printed and presented content, turned assignments into the teacher on
paper, took tests and quizzes on paper, and received all feedback on paper.
The same instructor taught all 5 sections and approximately the same pace was
followed in both settings. Other than the use of the online tools in Canvas, the same
teaching pedagogy was applied to both groups. This was an inquiry-based class that
18
focused on answering a driving question by completing assignments and activities. The
focus was on deep, cross-curricular understanding of a few big ideas rather than
skimming the surface of a large number of concepts. Both groups participated in hands-
on learning activities, read and applied content, maintained a paper notebook that
organized and documented learning, submitted assignments, and created and presented
summative projects as well as summative assessments.
Throughout the study, the treatment group made extensive use of technology by using
the LMS Canvas to facilitate their learning. Canvas supported a wide array of features.
The calendar displayed all events from all of the student’s classes. Events were linked to
content, websites, or assignments. Students were notified by email if the instructor added
or changed an event. Content was stored as a variety of files and accessed through
multiple parts of the system. The teacher chose to hide or show pieces depending on what
students needed at the time. Assignments were submitted as file uploads, URL links, text
entries, or media recordings. Collaboration between students happened on shared Google
Docs and were facilitated through Canvas. Quizzes were made accessible to different
groups at different times. Questions were grouped and shuffled, and feedback was turned
on and off. Questions were a blend of multiple choice, multiple correct, true/false, fill in
the blank, matching and essay. Daily announcements were posted summarizing the
lesson.
The control group did not have access to Canvas and experienced a traditional version
of the same class. Content was printed and presented. Assignments were collected. Tests
19
and quizzes were paper and pencil copies of the same test given electronically to the
treatment group.
The data were collected using a full time teacher who agreed to administer the test,
assign a random 3 digit code to each student, cross-reference the received consent forms
(Appendix A) and notify the Primary Investigator of the code numbers that could not be
included in the data analysis. This person is referred to in this study as the Conduit. The
Classroom Tests of Scientific Reasoning was given during a full length class period of 45
minutes under the supervision of the Conduit with the Primary Investigator out of the
room. Each student received a random 3 digit code from the Conduit to use as an
anonymous identification so that scores could be compared before and after the study.
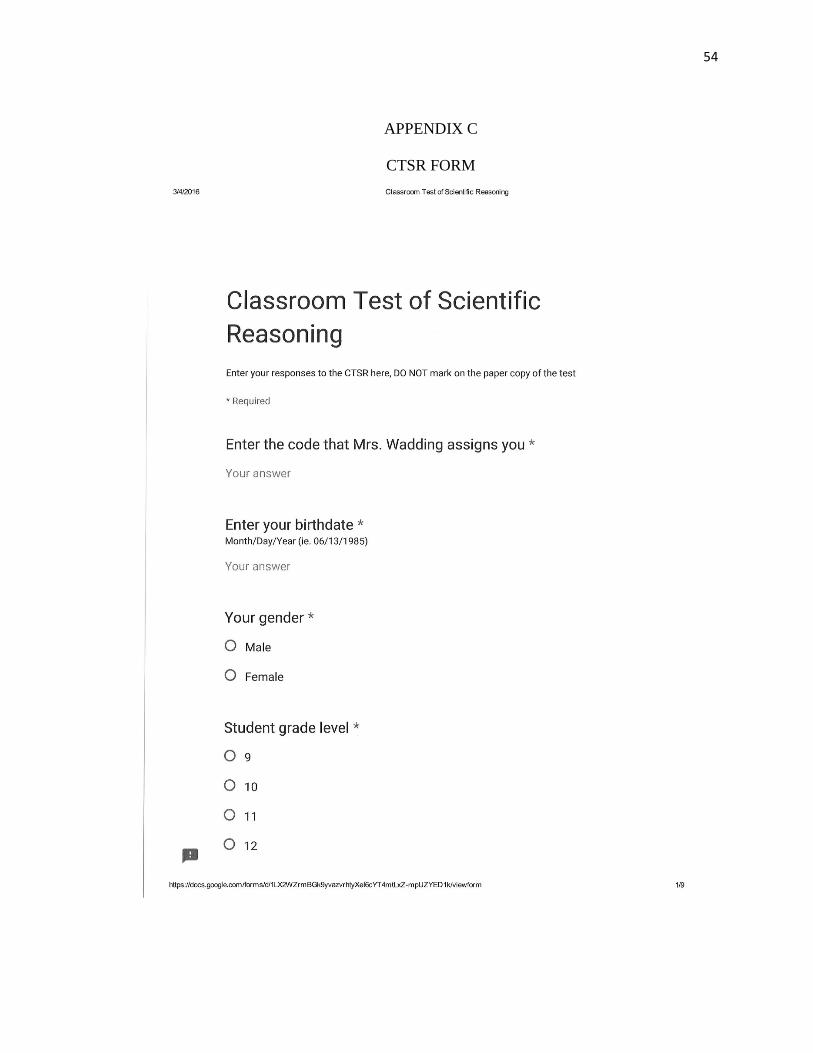
Paper copies of the test were distributed (Appendix B) and answers were recorded in a
Google Form (Appendix C). Birthdate, gender and grade level questions were only
included as a way for the Conduit to identify and correct codes that were not entered
correctly. The form was sent through Canvas for the treatment sections and via email for
the control sections. The tests were collected as students finished. Students then used the
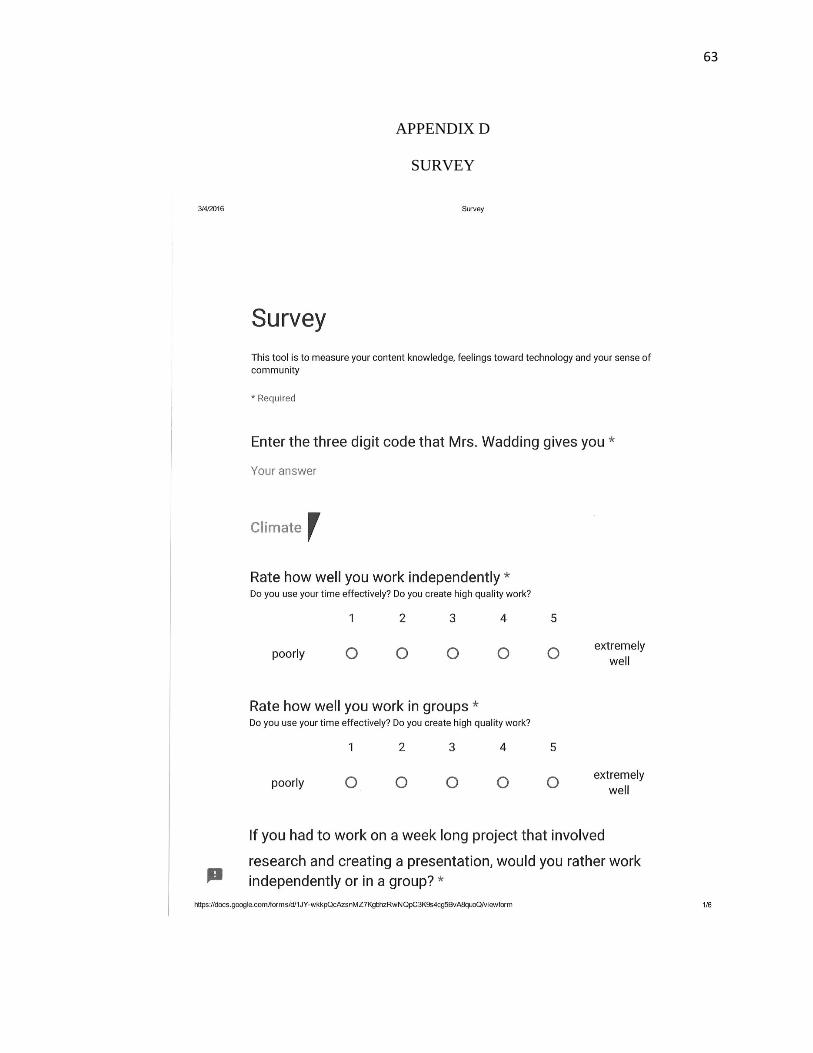
same 3 digit code to complete a Survey in Google Forms (Appendix D).
This was the best method for this study because it attempted to reduce bias. Rather
than using personal observations or an instrument that has not been researched, this study
used the Classroom Test of Scientific Reasoning (CTSR) by Anton Lawson. This test was
chosen for its ease of access, simple scoring due to multiple choice questions, the ability
to add to a national database, and its successful use in other studies. The CTSR has been
reviewed and used in multiple applications because it is statistically valid (Lawson,
20
1978). O’Donnell (2011) recommended the use of this test to compare reasoning skills to
a national average. It was also age appropriate and relevant to science because science
requires the skill of critical thinking, and by their freshman year, students had matured to
the point that critical thinking could be reasonably expected of them. Comparing scores
before and after the experiment clearly illustrated the gains made within the confines of
the study and could be easily compared between the treatment and control groups.
Comparing the progress of whole sections showed the average gains achieved.
Comparing by gender highlighted any inequality between male and female students.
Utilizing a survey provided qualitative data to balance and support the quantitative
results. By using the same course, the same instructor and comparable groups of students,
results are validated. Using a blend of quantitative and qualitative data was the best
choice for this experiment, because the results revealed a complete picture of the benefits
and potential drawbacks of teaching in a blended-learning environment.
Study Setting
This study took place in Waverly-Shell Rock Senior High School. In the building,
there were 630 students, with 10% receiving special education services for an Individual
Education Plan (IEP), and 19.21% participating in the state’s Free and Reduced Lunch
program (Iowa Department of Education, 2014). The graduation rate was 98.18%. On the
Iowa Test of Educational Development, the 9th grade cohort scored above the state
average in math, science and reading. Every student was issued a Chromebook at the
beginning of the year. Chromebooks are slightly smaller than a traditional laptop and use
the internet to run Google applications such as Docs. All freshmen were required to take
21
Earth Science their first semester in high school and it is a graduation requirement. This
course used an inquiry-based curriculum and heavily emphasized how we know what we
know about the Earth’s history, processes, and place in space.
Five sections of Earth Science were used in this study. The starting number of
students was 135 but 2 students left part way through the semester leaving the final
number of participants at 133. The demographics of all sections were approximately the
same but some differences naturally occurred. All sections were almost entirely
composed of Freshmen. Earth Science is a graduation requirement, so any students who
did not pass the course as a freshman had to retake the course. The upperclassmen totaled
2 sophomores and 6 seniors. Interestingly, all of the upperclassmen were male. There
were several students with Individual Education Plans (IEPs) who participated in this
course, and consequently, there was a Special Education teacher who was consulted on
accommodations and modifications needed for those students. A third demographic that
was unpredictable was the ratio of males to females. Finally, each academic class has a
unique social composition that can affect their academic performance.
Data Analysis
Before this study began, the parents of all participants were asked to sign Institutional
Review Board (IRB) consent and assent forms as part of their beginning of the year
orientation. Signed consent/assent forms were collected and stored by front office
personnel until after the post-test was taken. Only the results from participants with a
signed parental assent form were used.
22
During the first week of class (August, 2015), all five sections took the CTSR as a
baseline pre-test. During the last week of the study (December, 2015), all sections took
the CTSR as a post-test. The data was then collected, analyzed and compared.
Pre- and post-test scores were evaluated using a paired, two-tailed t-test to determine
statistical significance. The overall scores were compared by control versus treatment,
gender, and grade level and the t-tests assumed unequal variances because the sample
sizes were different. For this study, significance was set at p < .05.
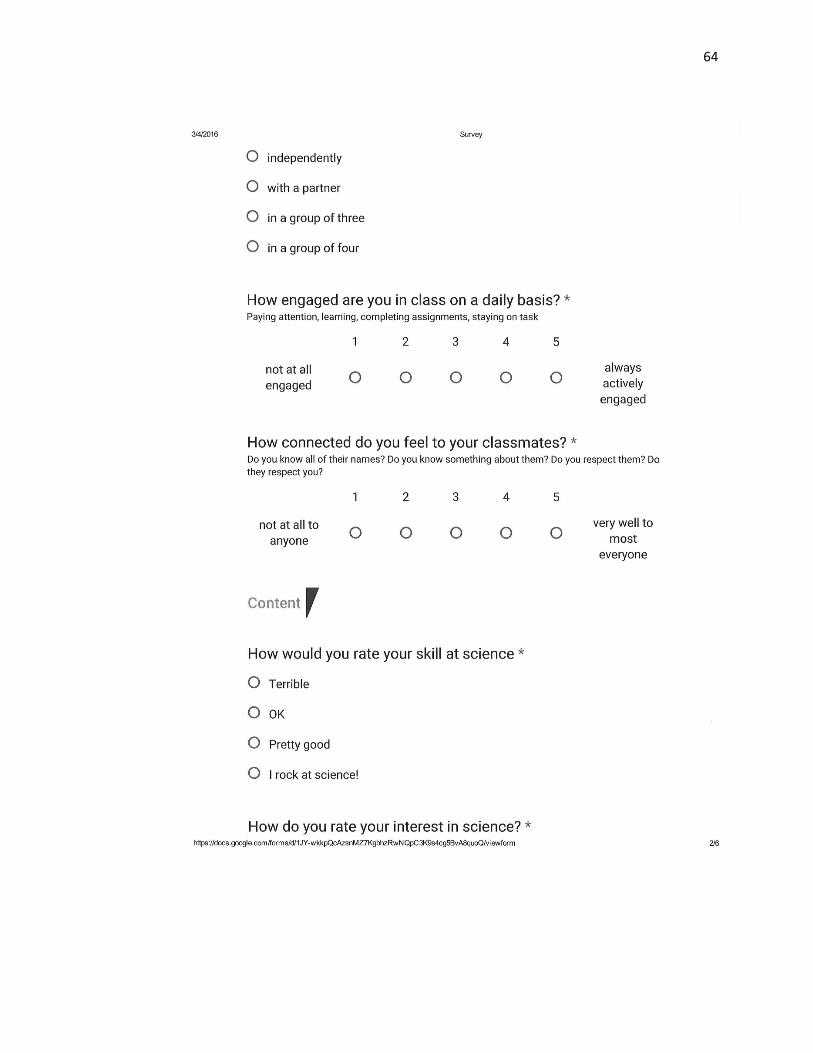
Additionally, a Likert-scale survey was administered concurrently with the CTSR.
Students were asked about their knowledge of the subject, their feelings toward
technology in general, their feelings toward technology in education, and some
environmental questions (collaboration, sense of community, level of engagement etc.).
Responses were compared by student from pre- to post-test as well as by section and
gender to provide a complete analysis of the functionality and usefulness of a blended
learning environment.
23
CHAPTER 4
RESULTS
Demographics
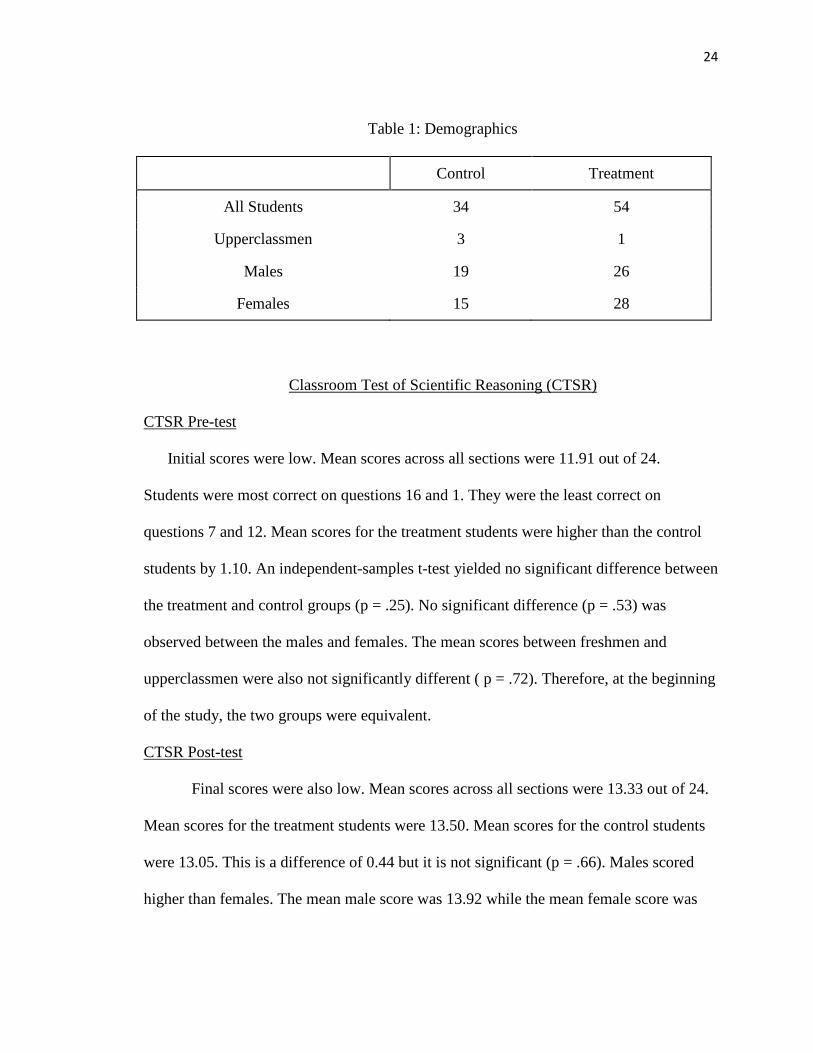
The 133 total participants were divided into five sections. Two sections became the
control group while the remaining three sections formed the treatment group. Some
sections were fairly balanced between males and females while in two sections the males
outnumbered females nearly 2 to 1. At least one upperclassman was in each section
except for Section 7. There were 20 students with an Individual Education Plan.
Some student data was excluded from analysis. Of the original 135 participants, only
103 assent forms were signed and returned to the office. The Conduit matched these
forms to the students’ 3 digit codes and notified the Primary Investigator of the codes that
could not be included in the analysis. As a result, data from 32 students were removed. In
addition, 135 students participated in the pre-test however only 128 students participated
in the post-test. By matching the 3 digit code numbers, data from students who did not
complete both assessments were removed from the study and not included in any
subsequent analysis. The number of participants who returned a signed consent form and
completed both assessments totaled 88 with 34 in the control group and 54 in the
treatment group. The 88 students included in this study consisted of 45 males and 43
females and only four upperclassmen (Table 1). As a result of these demographics, there
was a broad range of ability, interest, and ages in this study. The best effort was given to
account for the unique nature of the students in each class.
24
Table 1: Demographics
Control Treatment
All Students 34 54
Upperclassmen 3 1
Males 19 26
Females 15 28
Classroom Test of Scientific Reasoning (CTSR)
CTSR Pre-test
Initial scores were low. Mean scores across all sections were 11.91 out of 24.
Students were most correct on questions 16 and 1. They were the least correct on
questions 7 and 12. Mean scores for the treatment students were higher than the control
students by 1.10. An independent-samples t-test yielded no significant difference between
the treatment and control groups (p = .25). No significant difference (p = .53) was
observed between the males and females. The mean scores between freshmen and
upperclassmen were also not significantly different ( p = .72). Therefore, at the beginning
of the study, the two groups were equivalent.
CTSR Post-test
Final scores were also low. Mean scores across all sections were 13.33 out of 24.
Mean scores for the treatment students were 13.50. Mean scores for the control students
were 13.05. This is a difference of 0.44 but it is not significant (p = .66). Males scored
higher than females. The mean male score was 13.92 while the mean female score was

25
12.59. The p-value (p = .18) indicates that this was not significant. The mean scores
between freshmen and upperclassmen showed no meaningful difference (p = .28). Table
2 summarizes these results.
Table 2: Changes in CTSR Scores
Statistically significant p-values < .05 are in bold.
Mean CTSR Scores
Group Pre-test Post-test Difference p-value
All Students 11.91 13.33 1.42 .045
Males 12.16 13.92 1.76 .049
Females 11.59 12.59 1.00 .285
Control Group 11.24 13.06 1.82 .071
Section 1 11.83 12.17 0.33 .843
Section 4 10.91 13.55 2.64 .040
Treatment Group 12.33 13.5 1.67 .231
Section 2 12.20 13.40 1.20 .397
Section 3 12.82 13.18 0.35 .815
Section 7 12 13.94 1.94 .387
Freshmen 11.94 13.20 1.26 .090
Upperclassmen 11.25 16 4.75 .011 Changes in CTSR Scores
Across all sections, scores increased significantly from an average of 11.91 on the
pre-test to 13.33 on the post-test (p = .045). Scores from the treatment group improved by
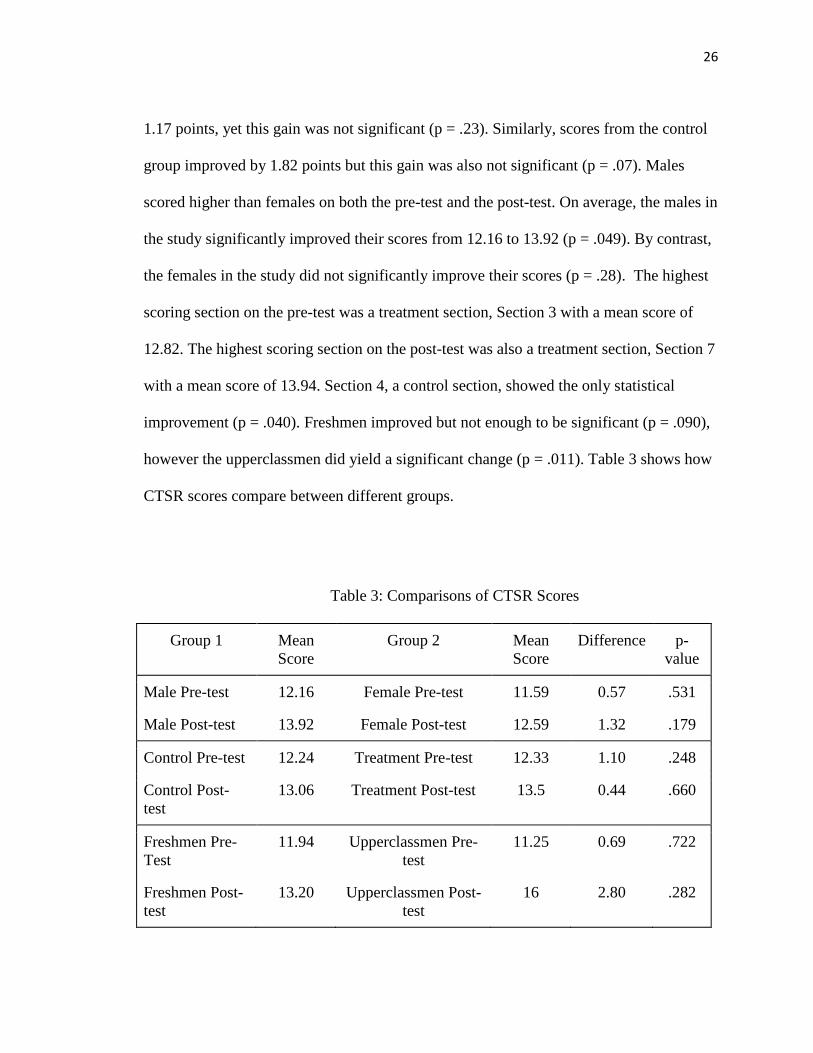
26
1.17 points, yet this gain was not significant (p = .23). Similarly, scores from the control
group improved by 1.82 points but this gain was also not significant (p = .07). Males
scored higher than females on both the pre-test and the post-test. On average, the males in
the study significantly improved their scores from 12.16 to 13.92 (p = .049). By contrast,
the females in the study did not significantly improve their scores (p = .28). The highest
scoring section on the pre-test was a treatment section, Section 3 with a mean score of
12.82. The highest scoring section on the post-test was also a treatment section, Section 7
with a mean score of 13.94. Section 4, a control section, showed the only statistical
improvement (p = .040). Freshmen improved but not enough to be significant (p = .090),
however the upperclassmen did yield a significant change (p = .011). Table 3 shows how
CTSR scores compare between different groups.
Table 3: Comparisons of CTSR Scores
Group 1 Mean Score
Group 2 Mean Score
Difference p-value
Male Pre-test 12.16 Female Pre-test 11.59 0.57 .531
Male Post-test 13.92 Female Post-test 12.59 1.32 .179
Control Pre-test 12.24 Treatment Pre-test 12.33 1.10 .248
Control Post-test
13.06 Treatment Post-test 13.5 0.44 .660
Freshmen Pre-Test
11.94 Upperclassmen Pre-test
11.25 0.69 .722
Freshmen Post-test
13.20 Upperclassmen Post-test
16 2.80 .282

27
Survey
Students used their same assigned 3 digit code on the survey as well so that
comparisons could be made between CTSR results and survey responses. The survey was
sent and completed as a Google Form (Appendix D) that was sent through Canvas for the
treatment sections and via email for the control sections.
Survey Before
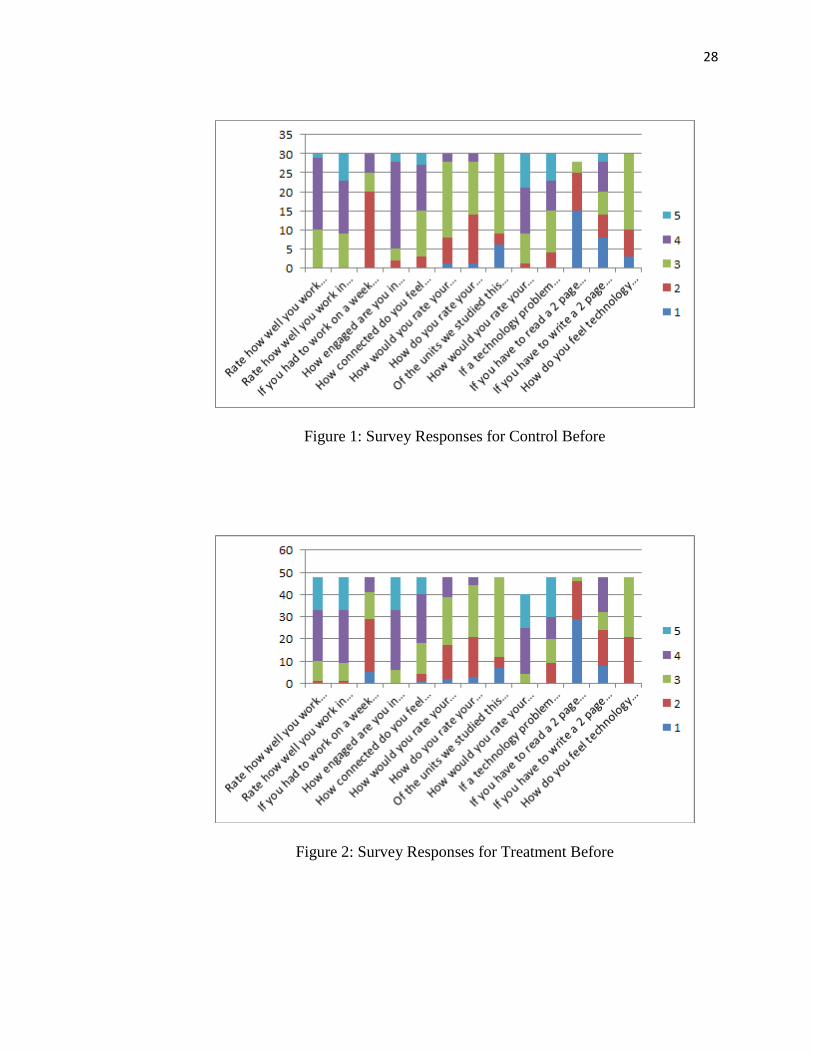
When asked how well they worked independently, 19% said “extremely well.”
For how well they worked in groups, 52% responded 4 out of 5. Engagement in class was
ranked as 4 out of 5 by 60%. The most common response to “How connected do you feel
to your classmates” was 4 out of 5 by 38%. Interest in Science was limited to “there are a
few things that catch my interest” as the most common response (46%). Half prefer to
read on paper. To solve technology problems, the most frequent response was “ask a
friend for help” (32%). “Technology does not make learning easier or harder” was
selected by 59%. Control sections were less confident in their ability to work
independently. Figure 1 summarizes the responses to the initial survey for the control
sections. Figure 2 summarizes the responses to the initial survey for the treatment
sections.
Survey After
When asked how well they worked independently, 27% said “extremely well”.
For how well they worked in groups, 60% said 4 out of 5. Engagement in class was
ranked as 4 out 5 by 62%.
28
Figure 1: Survey Responses for Control Before
Figure 2: Survey Responses for Treatment Before
29
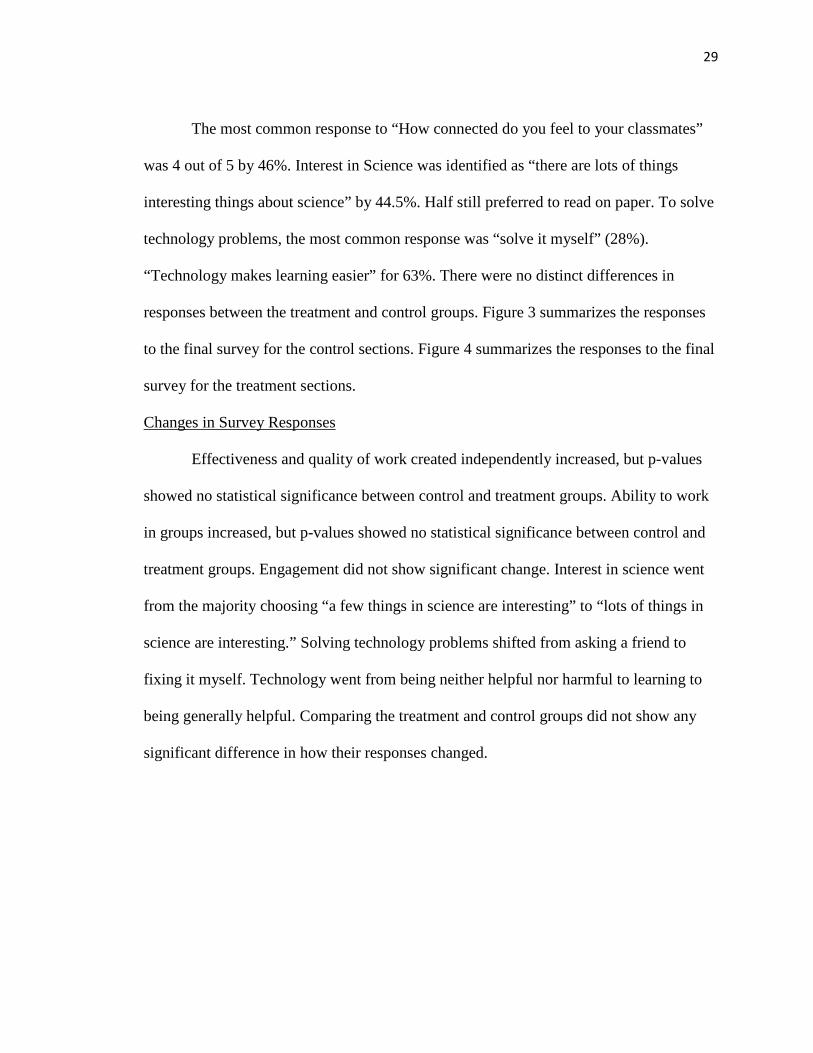
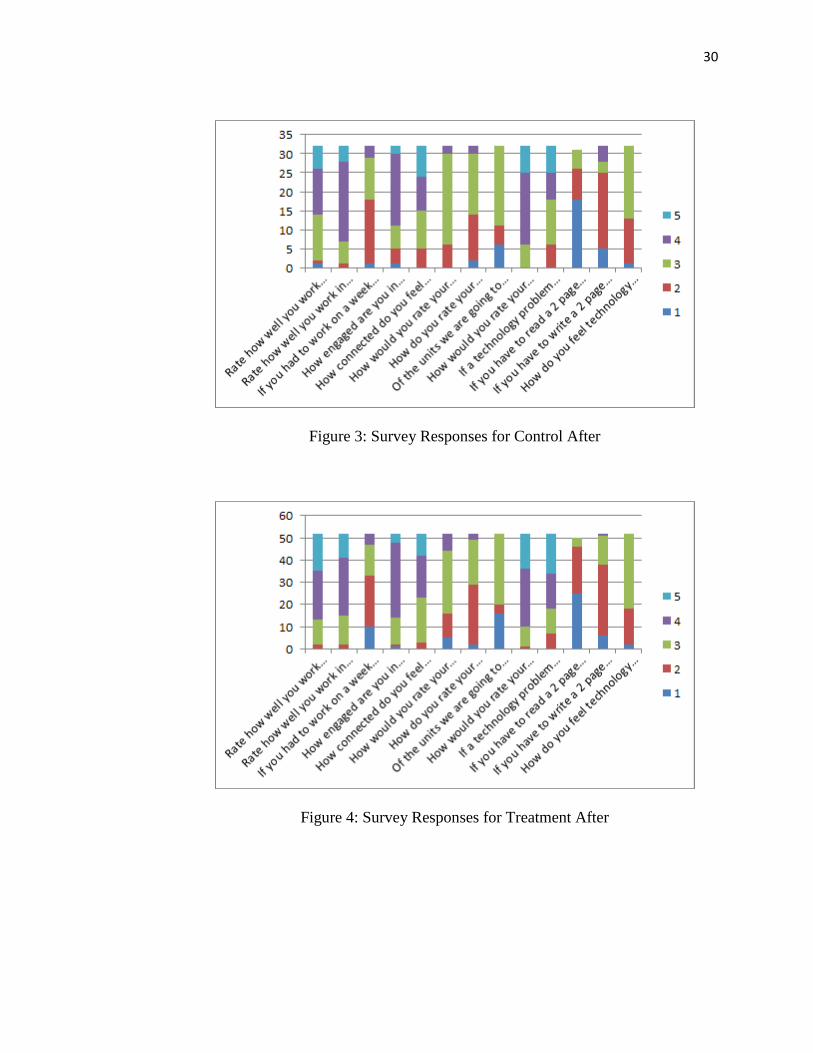
The most common response to “How connected do you feel to your classmates”
was 4 out of 5 by 46%. Interest in Science was identified as “there are lots of things
interesting things about science” by 44.5%. Half still preferred to read on paper. To solve
technology problems, the most common response was “solve it myself” (28%).
“Technology makes learning easier” for 63%. There were no distinct differences in
responses between the treatment and control groups. Figure 3 summarizes the responses
to the final survey for the control sections. Figure 4 summarizes the responses to the final
survey for the treatment sections.
Changes in Survey Responses
Effectiveness and quality of work created independently increased, but p-values
showed no statistical significance between control and treatment groups. Ability to work
in groups increased, but p-values showed no statistical significance between control and
treatment groups. Engagement did not show significant change. Interest in science went
from the majority choosing “a few things in science are interesting” to “lots of things in
science are interesting.” Solving technology problems shifted from asking a friend to
fixing it myself. Technology went from being neither helpful nor harmful to learning to
being generally helpful. Comparing the treatment and control groups did not show any
significant difference in how their responses changed.
30
Figure 3: Survey Responses for Control After
Figure 4: Survey Responses for Treatment After
31
CHAPTER 5
DISCUSSION
Classroom Test of Scientific Reasoning (CTSR)
The CTSR has been used and validated for PreK-12 to measure critical thinking
and scientific reasoning. Literature searches did not reveal any studies correlating critical
thinking and blended learning in science using the CTSR. This study did not show any
statistical difference in CTSR scores between students experiencing a blended learning
environment or a traditional learning environment. Statistically supported differences
were limited to males and upperclassmen Males who both showed significant
improvement regardless of their experience. Upperclassmen also showed improvement.
This is consistent with data collected by de Armendi (2014) who found that male medical
and nursing students had higher mean raw CTSR scores than females in the same
programs.
The lack of a significant difference in scores between the control and treatment
sections suggests that there is not a connection between a blended environment and
critical thinking. This opposes the hypothesis that there would be a difference between
groups. The significant growth overall shows that critical thinking developed during this
this study, regardless of the level of technology used. This supports the hypothesis that
critical thinking would improve in both groups. The slight male advantage does not
correlate with being in the treatment or control group and did not remain throughout the
study. Only one control section showed statistical improvement while no treatment
groups did.
32
This data reveals that while technology gets a lot of attention, it does not
necessarily correlate to critical thinking. This implies that an increase in technology is not
required to achieve gains in critical thinking. Therefore, teachers willing to embrace
technology do not have to sacrifice critical thinking skills just as teachers who do not
have access to technology are not limited in their ability to improve critical thinking
skills. It is the pedagogy in the classroom that affects critical thinking, not the level or use
of technology. The same inquiry-based pedagogy was applied to both groups and both
groups improved their critical thinking.
Survey
Survey responses did not reveal any distinct differences between control and
treatment groups. Overall, there were some changes worth discussing. Interest in science
improved from the beginning of the study to the end regardless of how much technology
was used. This indicates that technology did not affect the participant's perception of
science. Rather it shows that exposure to science increased their interest. This supports
the hypothesis that perceptions of science would improve regardless of which group
students were in. The ability to fix a technology problem independently improved over
the course of the study. Technology went from being viewed as neither helpful nor
harmful to learning to something that makes learning easier in both groups. These
changes can be attributed to using technology either in Earth Science or in other courses
as well. By becoming familiar with the Chromebooks and learning how to solve
problems, students had to become more independent. This opposes the hypothesis that
students would prefer technology in the treatment group more than in the control group.
33
This survey data supports the CTSR data in that there was not a significant
difference in responses between the treatment and control groups. Overall, there was an
improvement but this was not due to the amount of technology used. This implies that not
all classes need to use technology systemically for students to gain proficiency in using it
and solving problems with it.
Reservations
Not all student data could be included due to not receiving their consent to use
data and some students only took one measure. Out of the 133 participants, only 88 data
sets could be used. Additionally, technology was still used in the control group just to a
lesser extent. Students still conducted research, created electronic flyers and used an
electronic corkboard to explore other student’s work. Also, because the entire is 1 to 1
with technology, students also used technology in other classes and outside of school.
The selection of control groups being the co-taught sections may have resulted in
inaccuracies. A higher percentage of students with an IEP and the presence of a co-
teacher may have had unmeasured effects on the data and experiment. The difference in
sample size between freshmen and upperclassmen might make the upperclassmen data
invalid. Additionally, the situations of those upperclassmen were markedly different from
the freshmen. The upperclassmen were either retaking the course because they had
previously failed it or were taking it as an easier alternative to Chemistry. This could
have affected the data due to their attitude at being stuck in a freshmen class.
Throughout the study, there were a few differences between the treatment and
control sections in terms of logistics. The control sections took less time to grade daily
34
work but more time to grade assessments. The control section participants asked more
content related questions on a regular basis while the treatment sections asked primarily
procedural questions. These differences may have had an effect on how questions were
answered and the quality of feedback given.
If this study were to be repeated, there are a few suggested changes. For the
consent/assent forms, there may have been a higher rate of return if the study could have
been explained in person rather sending it home. Treatment sections should have a
completely electronic “notebook” that would be submitted and graded through Canvas.
This will make the notebook a single resource for the students which would be more
comparable to the control sections. This would also reduce the grading burden on the
teacher by creating one platform to assess instead of two. The survey questions should be
reworded to be easier to evaluate. There were some questions that did not reveal much
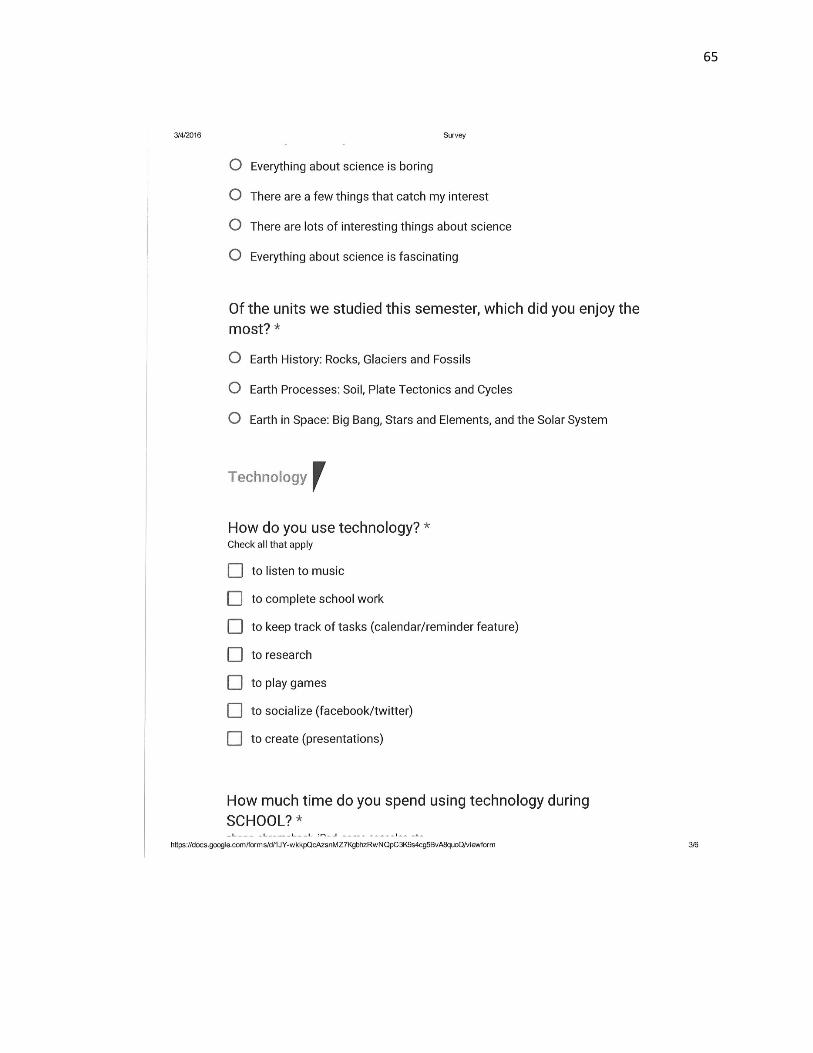
information because of how they were worded. The use of technology questions were not
presented in the results because they were not in the same Likert-scale form and could
not be compared like the rest of the questions. Other questions were very difficult to
analyze because responses were non-numerical. Since there was an average increase in
scores, measuring critical thinking in blended and traditional classrooms after a full year
science course might yield a greater difference in scores.
To determine the longevity of the gains in critical thinking, the CTSR will be
reassessed in the spring of 2017 to the same students.
35
Conclusions
This study aimed to determine a correlation between the level of technology used
in the classroom and performance on a critical thinking assessment. Due to the absence of
statistically supported differences, this study shows that there is not a connection between
critical thinking as measured by the CTSR and the implementation of technology in the
classroom experience. Qualitative survey results support this conclusion by showing no
distinct difference between treatment and control groups and their perception of the
classroom climate, interest in science or use of technology. These results indicate that it is
not technology that impacts critical thinking rather the pedagogy used in the classroom.
36
REFERENCES
Allen, I., Seaman, J., & Garrett, R. (2007). Blending in: The extent and promise of blended education in the United States. Newburyport, MA: Sloan Consortium.
Alonso, F., Lopez, G., Manrique, D., & Vies, J. (2005). An instructional model for
web-based e-learning education with a blended learning process approach. British Journal of Educational Technology, 36(2), 217-235.
Bernard, R. M., Zhang, D., Abrami, P. C., Sicoly, F., Borokhovski, E., & Surkes, M.
A. (2008). Exploring the structure of the Watson–Glaser Critical Thinking Appraisal: One scale or many subscales? Thinking Skills and Creativity, 3(1), 15-22.
Bonk, C., & Graham, C. (2004). Blended learning systems: Definition, current trends
and future directions. Handbook of blended learning: global perspectives, local designs. San Francisco, CA: Pfeiffer Publishing.
Coletta, V. P. & Phillips, J. A. (2005) Interpreting FCI scores: Normalized gain,
preinstruction scores and scientific reasoning ability. American Journal of Physics, 73 (12), 1172-1182.
Colombo, M. , & Colombo, P. (2007). Blogging to improve instruction in
differentiated science classrooms. Phi Delta Kappan, 89(1), 60-63.
Comas-Quinn, A. (2011). Learning to teach online or learning to become an online teacher: An exploration of teachers' experiences in a blended learning course. ReCALL, 23(3), 218-232.
de Armendi, A. (2014). Medical and nursing students’ cognitive levels measured by
the Classroom Test of Scientific Reasoning and correlation to knowledge gained from lecture, simulation or lecture with simulation. (Doctoral dissertation). Retrieved from shareok.org
DeBoer, G. E. (1991). A history of ideas in science education: Implications for
practice. New York, NY: Teachers College Press.
Dziuban, C., Moskal, P., & Hartman, J. (2005). Higher education, blended learning and the generations: knowledge is power-no more. In Elements of quality online education: Engaging communities. Needham, MA: Sloan Center for Online Education.
Ellis, R. A. & Calvo, R. A. (2007). Minimum Indicators to Assure Quality of LMS-
supported Blended Learning. Educational Technology & Society, 10(2), 60-70.
37
Facione, P. (1990). The California critical thinking skills test: college level technical
report #1 – experimental validation and content validity. Santa Clara University. ERIC document (ED 327-549).
Facione, P. (2011). Critical thinking: What it is and why it counts. Hermosa Beach,
CA: Insight Assessment. Retrieved from http://www.insightassessment.com/About-Us/Measured-Reasons/pdf-file/Critical-Thinking-What-It-Is-and-Why-It-Counts-PDF/(language)/eng-US
Gardner, H. (1983). Frames of mind: The theory of multiple intelligences.
Philadelphia, PA: Basic Books.
Goodwin-Jones, R. (2012). Emerging technologies: challenging hegemonies in online learning. About Language Reading and Technology, 16(2), 4-13.
Iowa Department of Education. (2014). Iowa Department of Education Public
Reporting Website. Retrieved from reports.educateiowa.gov
Jiang, B., Xu, X., Garcia, A., & Lewis, J. (2010). Comparing two tests of formal reasoning in a college chemistry context. Journal of Chemical Education, 87(12), 1430-1437.
Khan, B.H. & Granato, L.A. (2008). Program Evaluation in E-learning. Retrieved
June 3, 2012 from http://asianvu.com/bk/elearning_evaluation_article.pdf
Kolb, D. A. (1984). Experiential learning: Experience as the source of learning and development (Vol. 1). Englewood Cliffs, NJ: Prentice-Hall.
Koohang, A., Riley, L., & Smith, T. (2009). E-learning and constructivism: from
theory to application. Interdisciplinary Journal of E-learning and Learning Object, 5, 91-109.
Lawson, A. E. (1978). The development and validation of a Classroom Test of
Formal Reasoning. Journal of Research in Science Teaching, 15(1), 11-24.
Lawson, A. E. (2001, March). Promoting creative and critical thinking skills in college biology. Bioscene, 27(1), 13-24.
Melton, J. (2006). The LMS moodle: A usability evaluation. Language Issues.
Prefectural University of Kumamoto.
Norris, S. P. (1985). Synthesis of research on critical thinking. Educational Leadership, 42(8), 40-45.
38
O’Donnell, J. O. (2011). Creation of national norms for scientific thinking skills using
the Classroom Test of Scientific Reasoning. (Unpublished Master’s Thesis). Winona State University, Winona, MN.
Oliver, M., & Trigwell, K. (2005). Can "blended learning" be redeemed? E-Learning,
2(1), 17-26.
Phillips, C. R., Chesnut, R. J., & Rospond, R. M. (2004). The California Critical Thinking instruments for benchmarking, program assessment and directing curricular change. American Journal of Pharmaceutical Education, 68(4), 1-8.
Picciano, A. G. & Seaman, J. (2009). K-12 online learning: A 2008 follow-up of the
survey of U.S. school district administrators. Newburyport, MA: Sloan Consortium.
Roadrangka, V., Yeany, R. H., & Padilla, M. J. (1983). The construction of a group
assessment of logical thinking (GALT). Annual meeting of the National Association for Research in Science Teaching, Dallas, TX. 148-154.
Robertshaw, M. B. (2015). Canvas Pilot Assessment. Office of Institutional
Assessment at Purdue University. Rossett, A., Douglis, F., & Frazee, R. (2003). Strategies for building blended
learning. Learning Circuits, 4(7), 1-8.
Rovai, A., & Jordan, H. (2004). Blended learning and sense of community: A comparative analysis with traditional and fully online graduate courses. International Review of Research in Open and Distance Learning, 5(2). Retrieved from http://www.irrodl.org
Sahin, M. (2010). Blended learning in vocational education: an experimental study.
International Journal of Vocational and Technical Education, 2(6), 95-101. Sclater, N., (2008). Web 2.0, personal learning environments, and the future of
learning management systems. Boulder, CO: EDUCAUSE Center for Applied Research: Research Bulletin, 2008(13), 1-13.
Singh, H. (2003). Building effective blended learning programs. Educational
Technology, 43(6), 51-54.
So, H., & Brush, T. (2007). Student perceptions of collaborative learning, social presence and satisfaction in a blended learning environment: relationships and critical factors. Computers in Education, 5(9), 318-336.

39
Suanpang, P., Petocz, P., & Kalceff, W. (2004). Student Attitudes to Learning
Business Statistics: Comparison of Online and Traditional Methods. Educational Technology & Society, 7(3), 9-20.
Taradi, S., Taradi, M., Radic, K & Pokrajac, N. (2004) Blending problem-based
learning with web technology positively impacts student learning outcomes in acid-base physiology. Advanced Physiological Education, 29, 35-39.
Terry, N., & Ervin, B. (2012). Student performance on the California Critical
Thinking Skills Test. Academy of Educational Leadership Journal, 16, 25-34.
Tobin, K. G., & Capie, W. (1981). The development and validation of a group test of logical thinking. Educational and Psychological Measurement, 41(2), 413-423.
U.S. Department of Education. (2011) International experiences with technology in
education: Final report. Washington, DC. Retrieved from www2.ed.gov/about/offices/list/os/technology/iete-full-report.doc
40
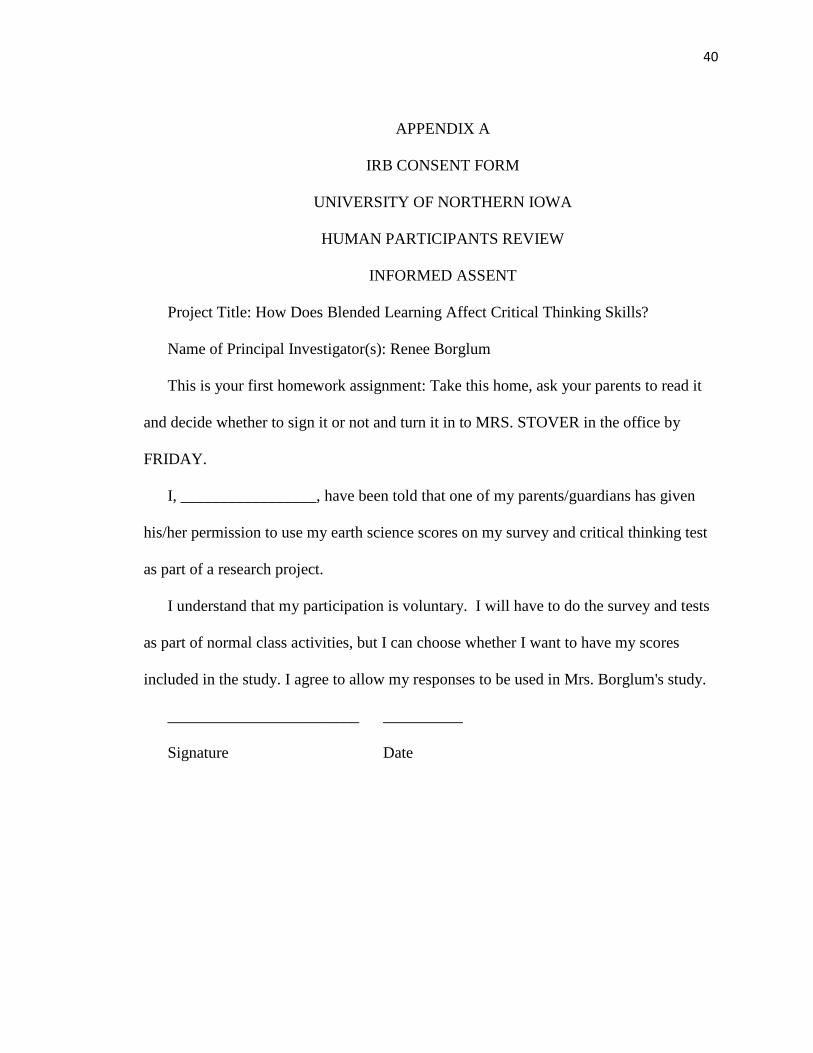
APPENDIX A
IRB CONSENT FORM
UNIVERSITY OF NORTHERN IOWA
HUMAN PARTICIPANTS REVIEW
INFORMED ASSENT
Project Title: How Does Blended Learning Affect Critical Thinking Skills?
Name of Principal Investigator(s): Renee Borglum
This is your first homework assignment: Take this home, ask your parents to read it
and decide whether to sign it or not and turn it in to MRS. STOVER in the office by
FRIDAY.
I, _________________, have been told that one of my parents/guardians has given
his/her permission to use my earth science scores on my survey and critical thinking test
as part of a research project.
I understand that my participation is voluntary. I will have to do the survey and tests
as part of normal class activities, but I can choose whether I want to have my scores
included in the study. I agree to allow my responses to be used in Mrs. Borglum's study.
________________________ __________
Signature Date

41
UNIVERSITY OF NORTHERN IOWA
HUMAN PARTICIPANTS REVIEW
PARENTAL PERMISSION
Purpose: I am a Master’s student at the University of Northern Iowa. I am conducting
research about the ways in which technology impacts critical thinking in Science. To see
whether technology affects critical thinking, I will be teaching my sections of Earth
Science a little differently this year. In some sections, technology such as Canvas and
Google Docs will be used to communicate, assign, complete and grade assignments and
to collaborate on group work. In other sections, technology will be used as little as
possible. All students will receive the same content, complete the same assignments and
get the same amount of work time. I am asking for permission to use your student’s data.
The following information is provided to help you make an informed decision whether or
not to allow me to use the results of critical thinking tests and surveys in my research.
Procedure: This study will run for the entire Fall semester. All classes will be taught
by Mrs. Borglum. The same curriculum will be taught through the same assignments and
assessments and all students will have the same expectations. The differences between
the classes will generally be in the scope of technology used:
Daily announcements posted on Canvas vs written on the whiteboard
Assignments will be assigned, submitted and graded on Canvas vs on paper,
completed by hand and graded by hand
Group work will be conducted through shared Google Docs vs on paper
42
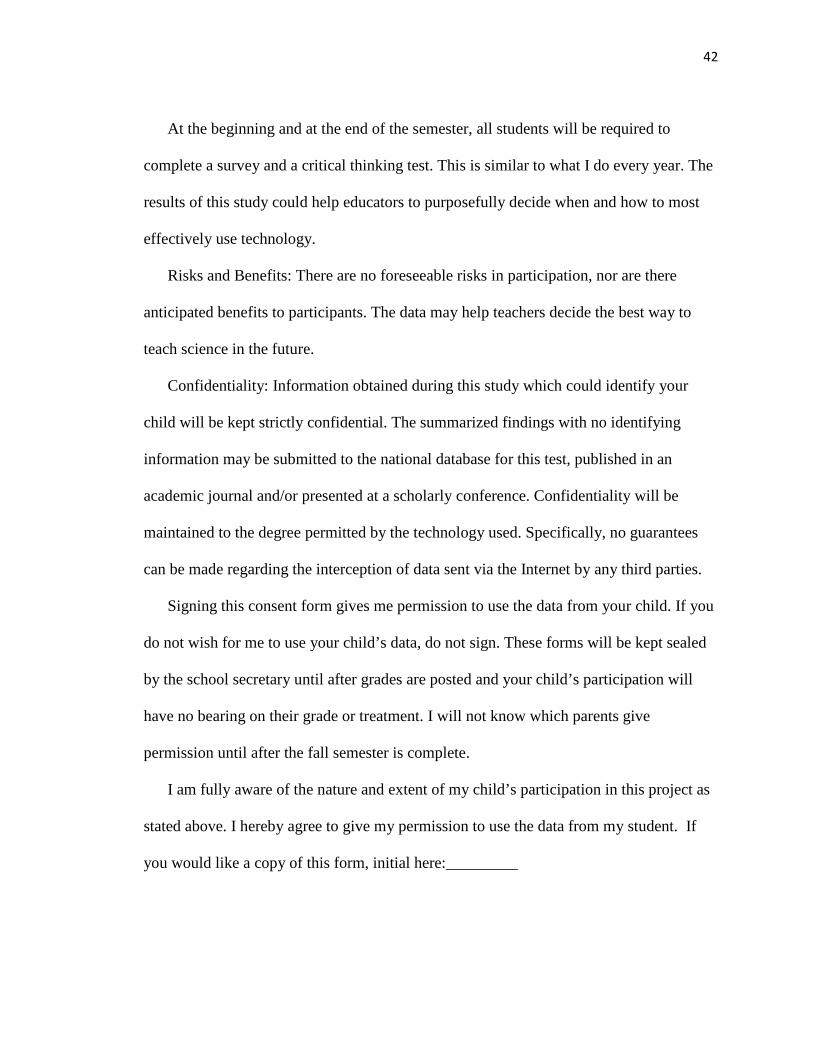
At the beginning and at the end of the semester, all students will be required to
complete a survey and a critical thinking test. This is similar to what I do every year. The
results of this study could help educators to purposefully decide when and how to most
effectively use technology.
Risks and Benefits: There are no foreseeable risks in participation, nor are there
anticipated benefits to participants. The data may help teachers decide the best way to
teach science in the future.
Confidentiality: Information obtained during this study which could identify your
child will be kept strictly confidential. The summarized findings with no identifying
information may be submitted to the national database for this test, published in an
academic journal and/or presented at a scholarly conference. Confidentiality will be
maintained to the degree permitted by the technology used. Specifically, no guarantees
can be made regarding the interception of data sent via the Internet by any third parties.
Signing this consent form gives me permission to use the data from your child. If you
do not wish for me to use your child’s data, do not sign. These forms will be kept sealed
by the school secretary until after grades are posted and your child’s participation will
have no bearing on their grade or treatment. I will not know which parents give
permission until after the fall semester is complete.
I am fully aware of the nature and extent of my child’s participation in this project as
stated above. I hereby agree to give my permission to use the data from my student. If
you would like a copy of this form, initial here:_________
43
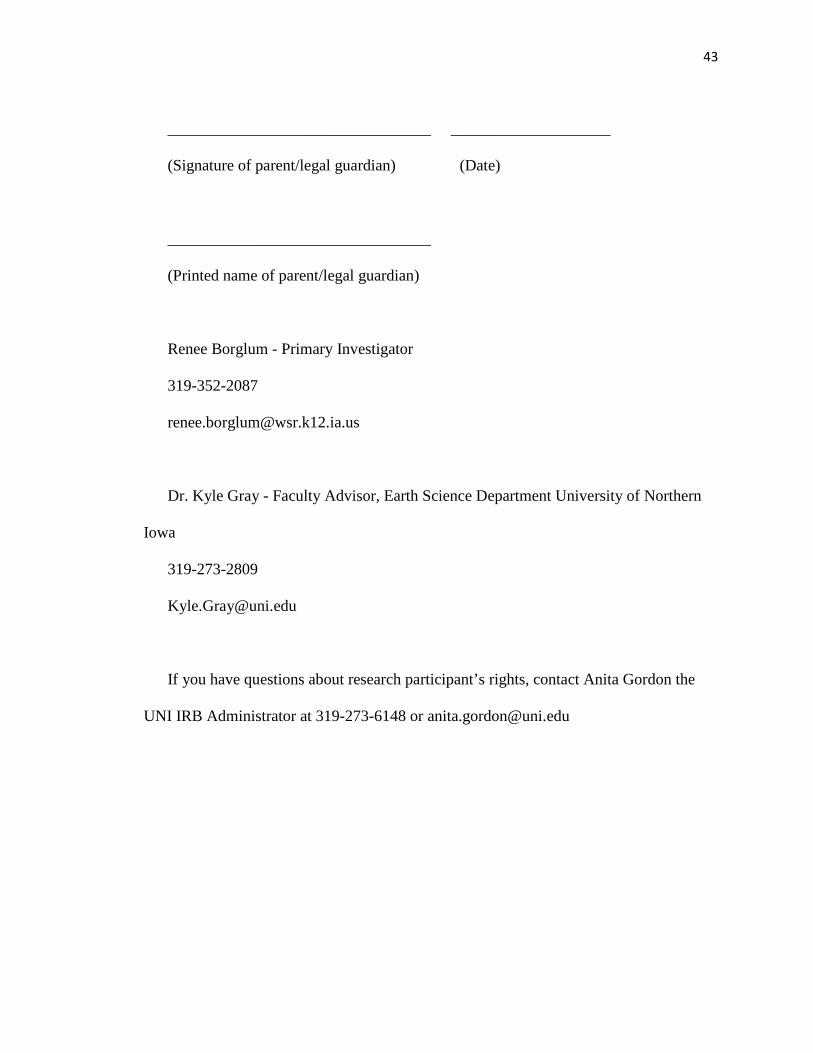
_________________________________ ____________________
(Signature of parent/legal guardian) (Date)
_________________________________
(Printed name of parent/legal guardian)
Renee Borglum - Primary Investigator
319-352-2087
Dr. Kyle Gray - Faculty Advisor, Earth Science Department University of Northern
Iowa
319-273-2809
If you have questions about research participant’s rights, contact Anita Gordon the
UNI IRB Administrator at 319-273-6148 or [email protected]
44
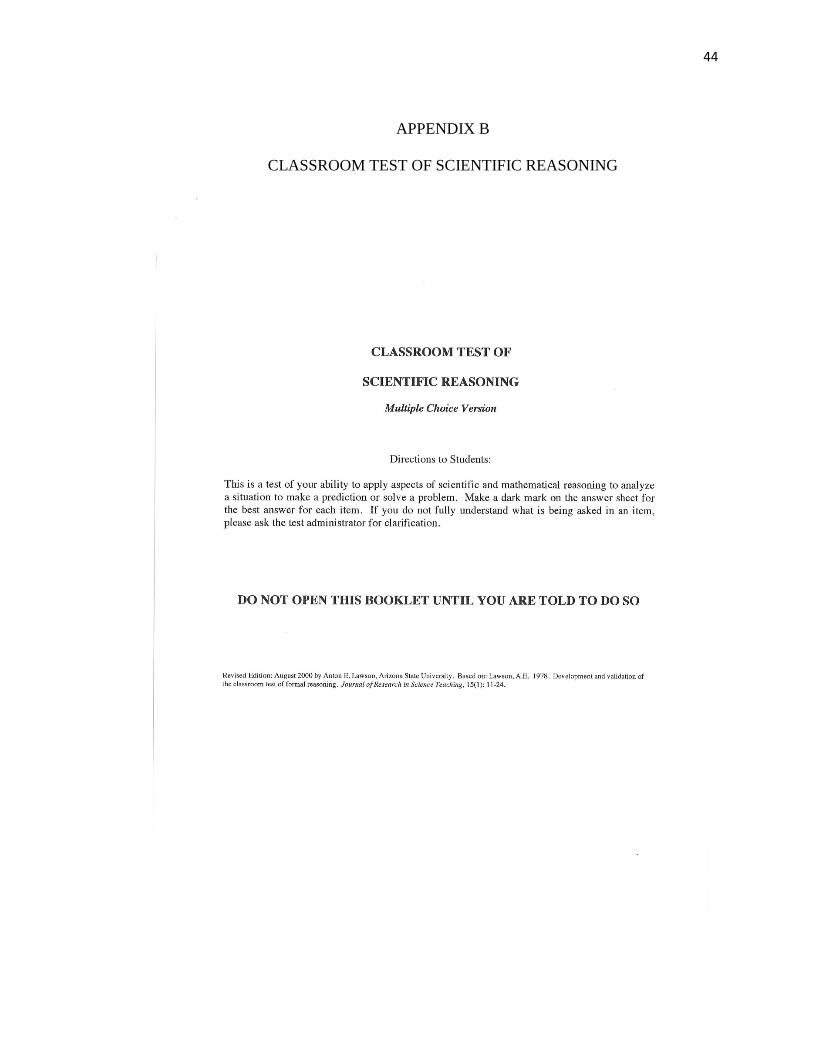
APPENDIX B
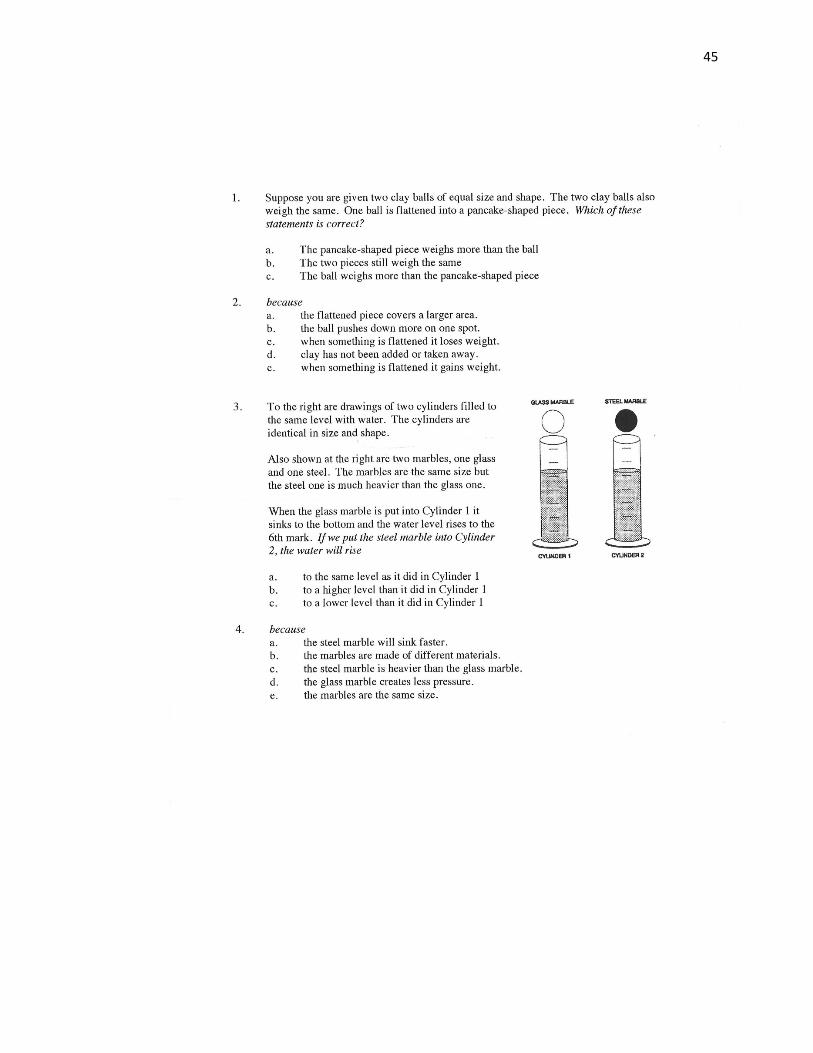
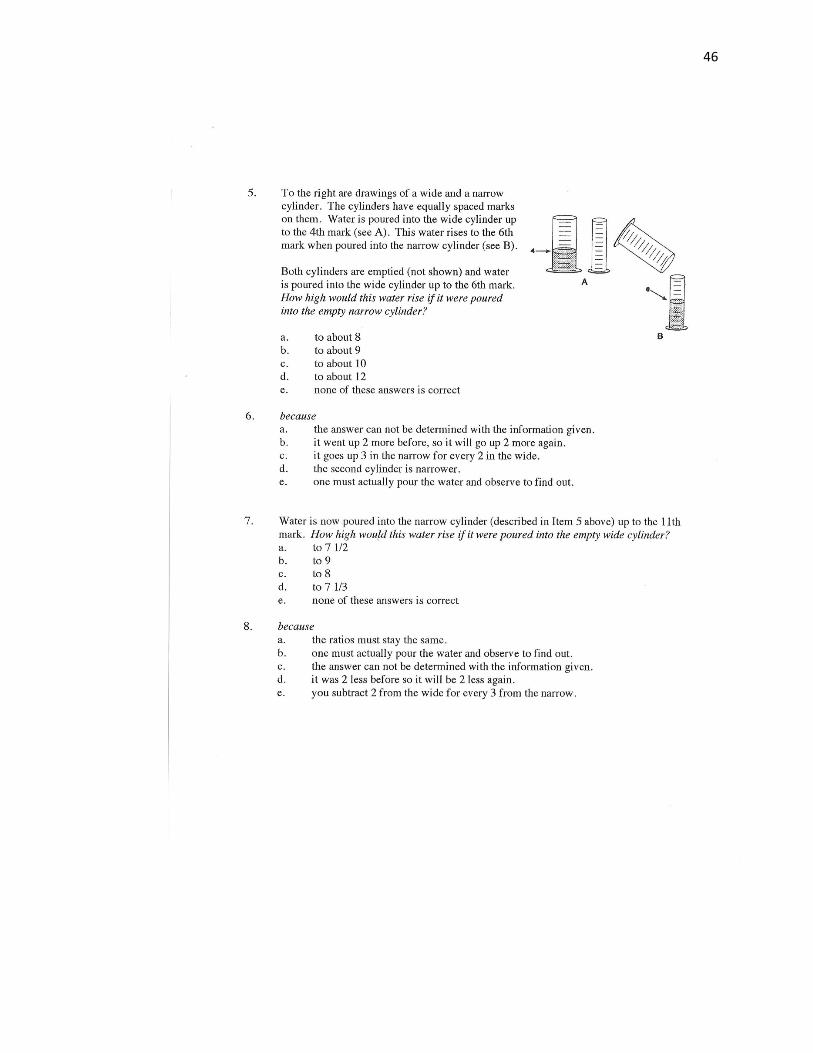
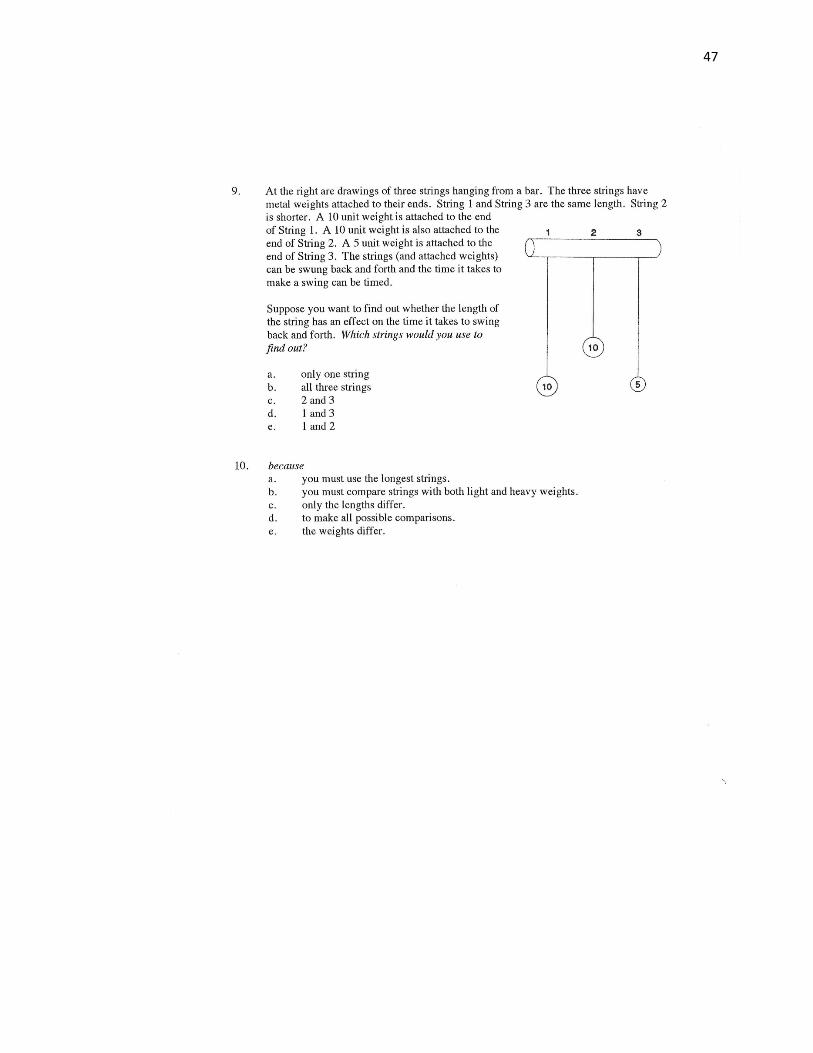
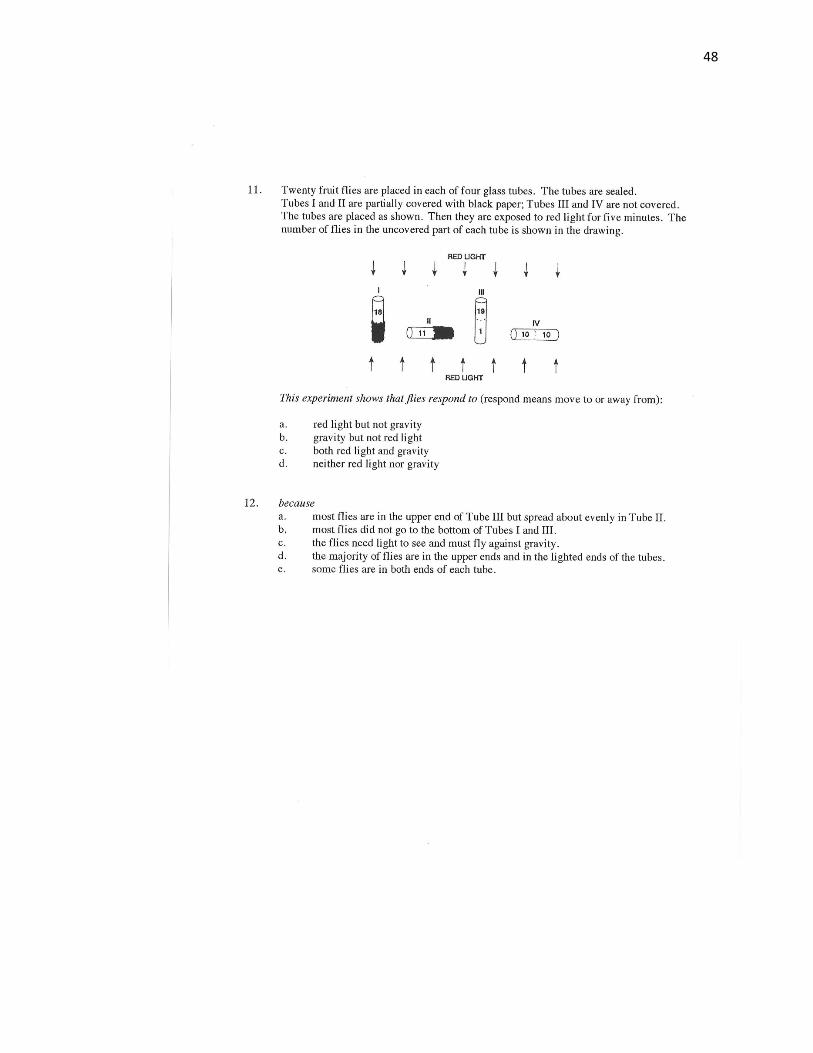
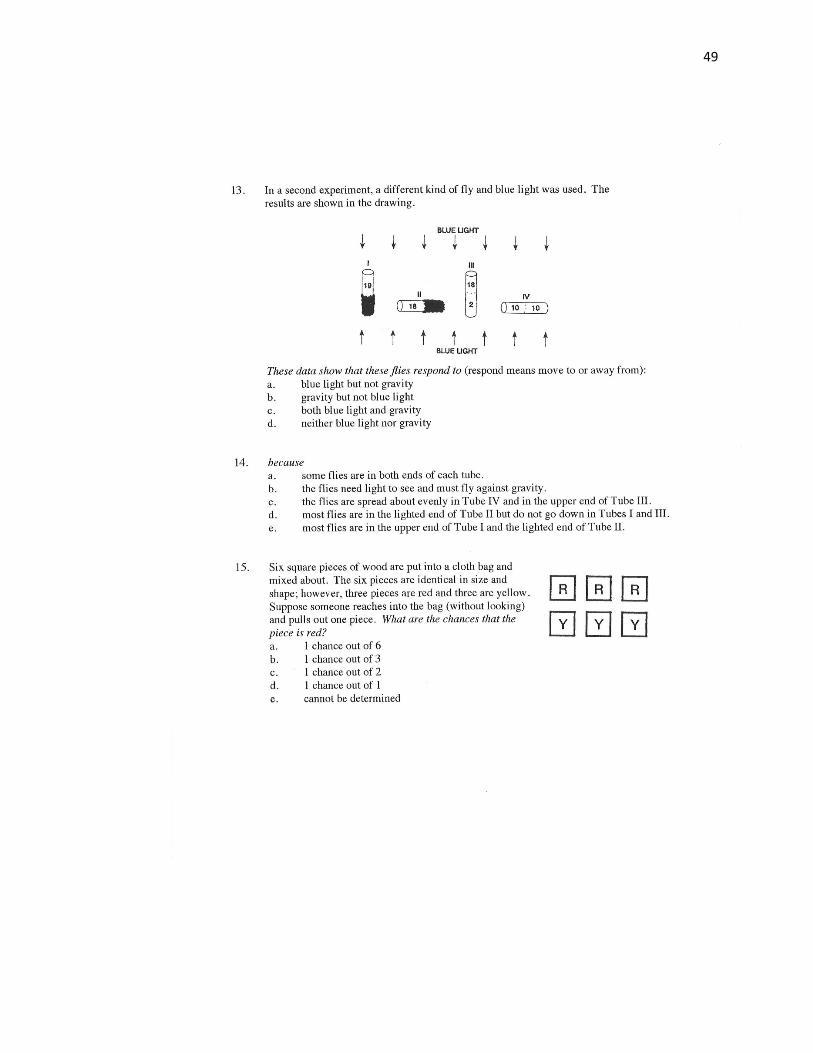
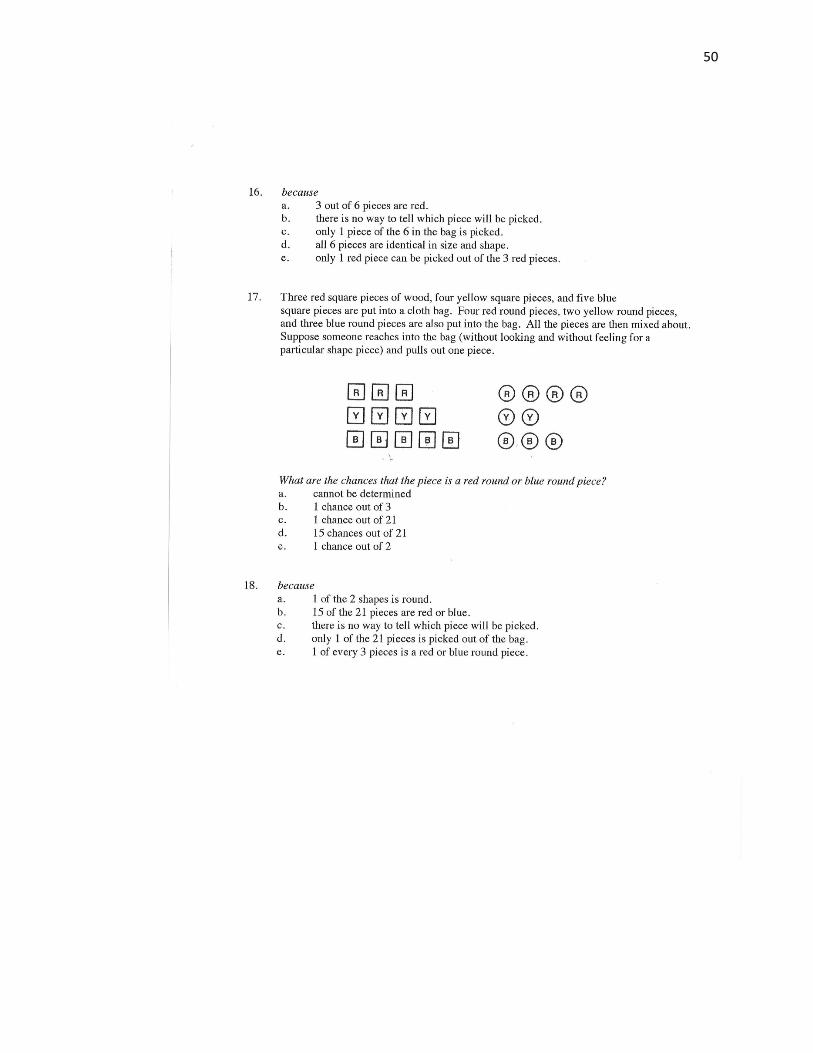
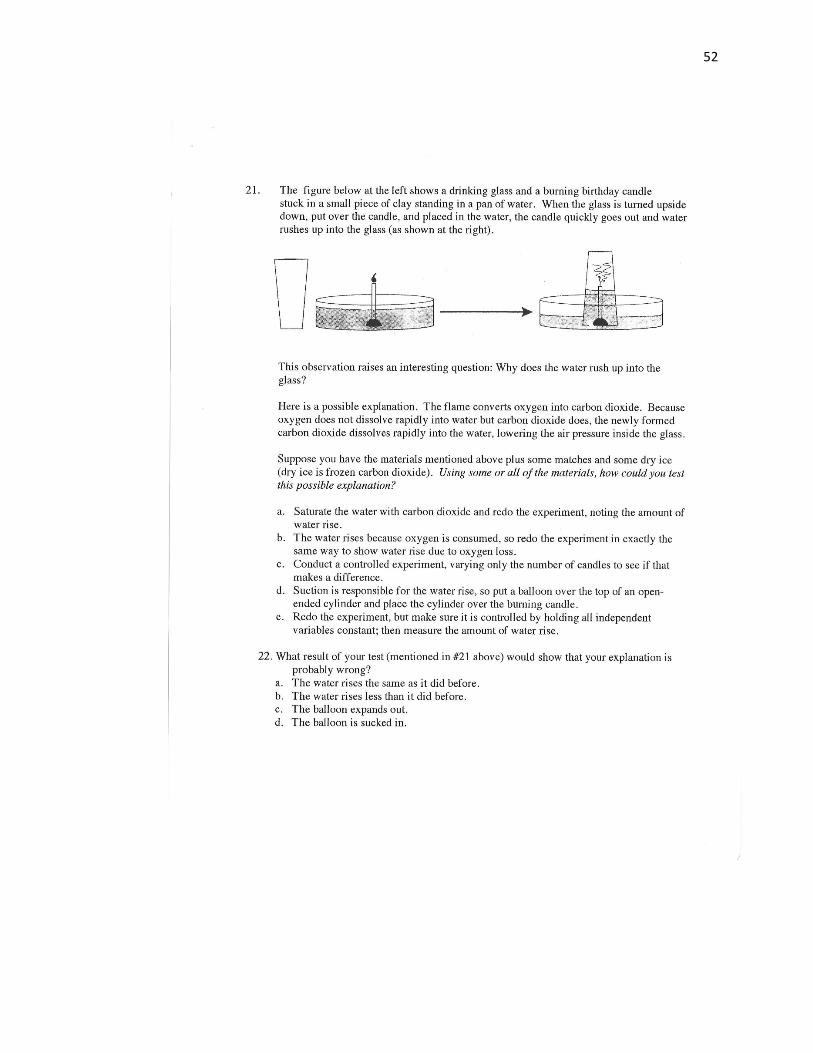
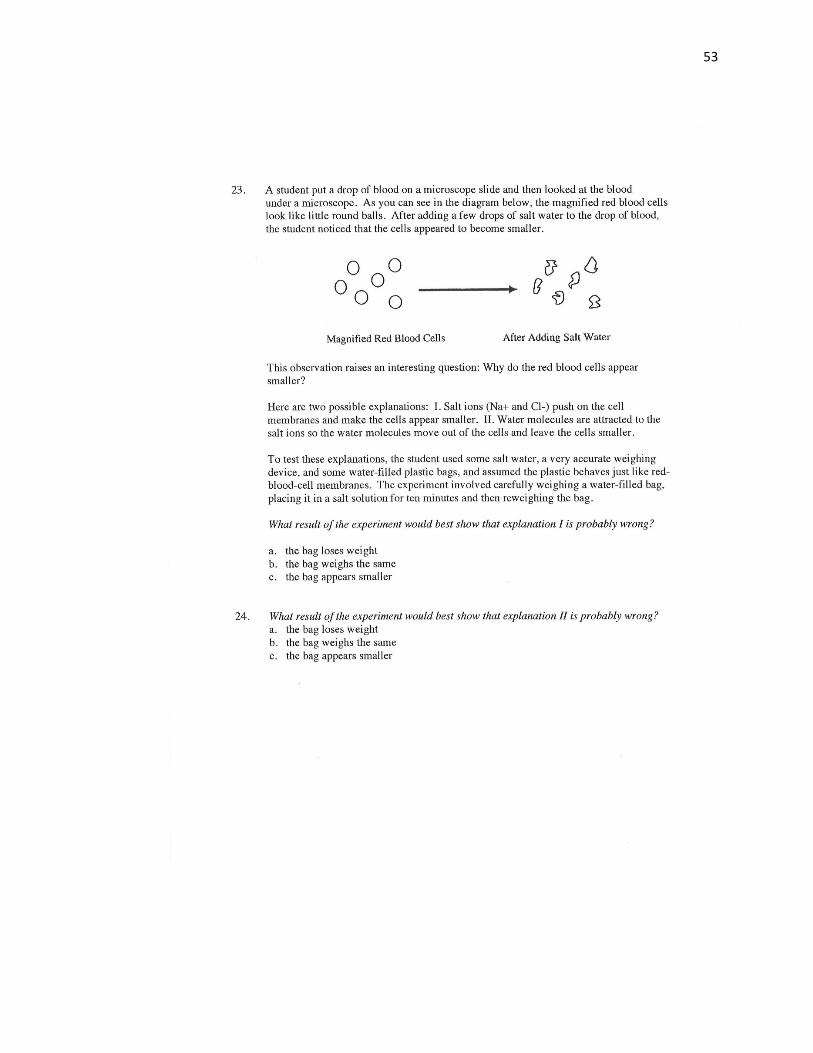
CLASSROOM TEST OF SCIENTIFIC REASONING
45
46
47
48
49
50

51
52
53
54
APPENDIX C
CTSR FORM
55
56
57
58
59
60
61
62
63
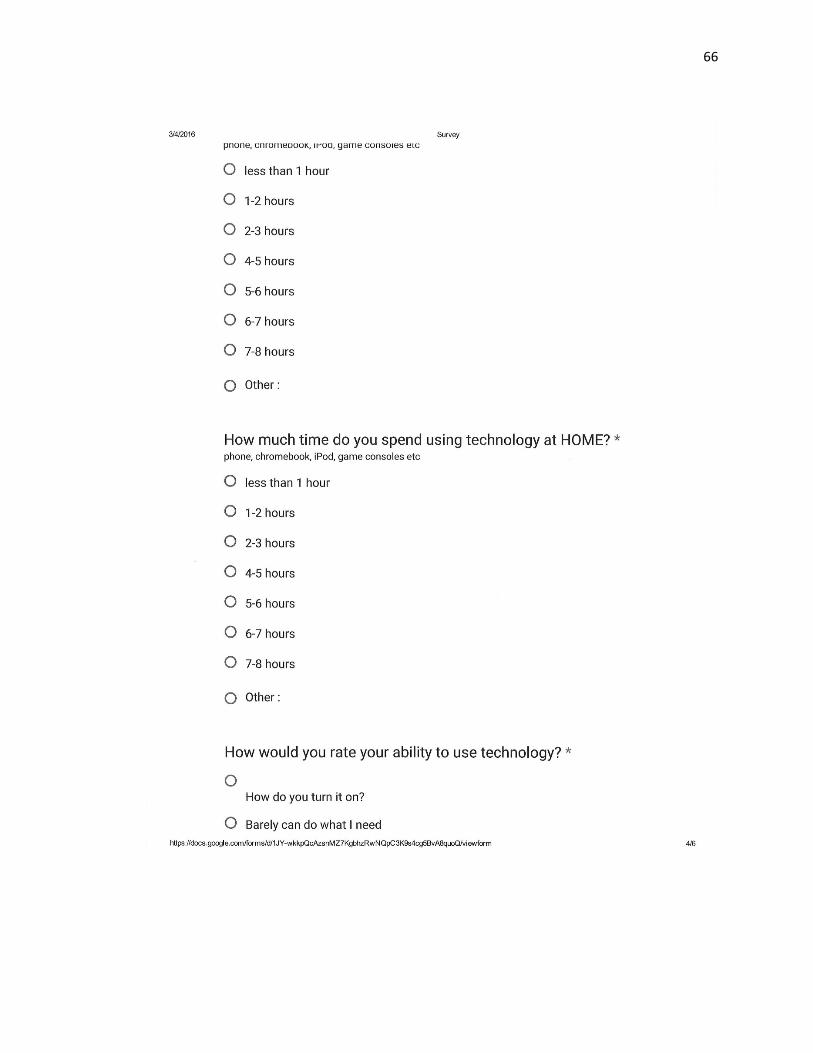
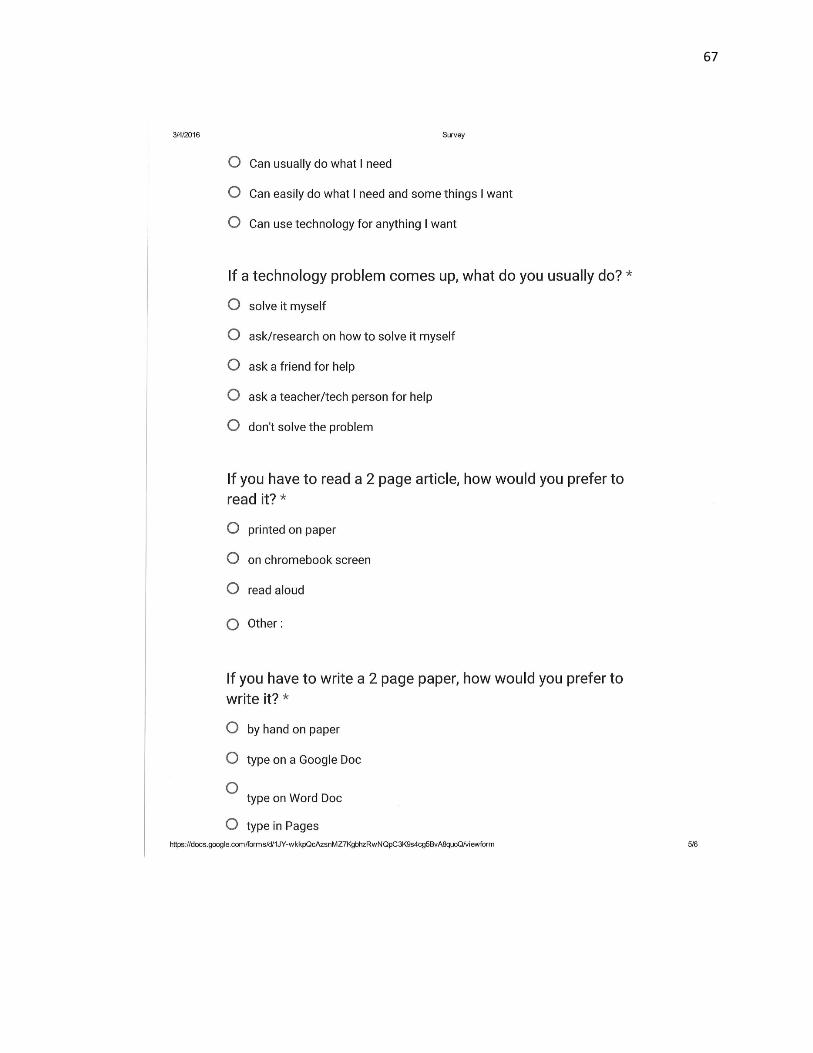
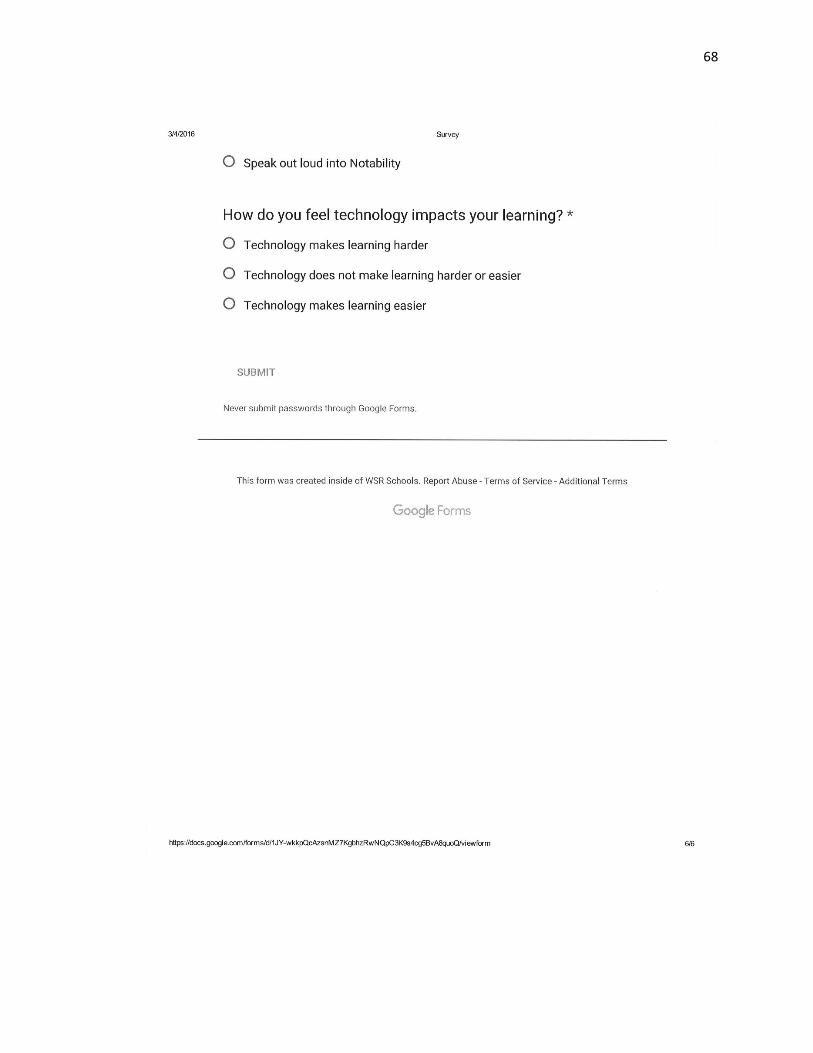
APPENDIX D
SURVEY
64
65
66
67
68