Embed Size (px)
Citation preview
1
The Effects of Cognitive Acceleration – and speculation about causes of these effects.
Philip Adey and Michael Shayer, King’s College London
Introduction
Our first paper in a peer reviewed journal reporting the effects of Cognitive Acceleration (CA) appeared in 1990, the latest in 2010. This paper will review the main experimental designs, samples, tests used, and effect sizes obtained over this 20 year period and will summarise the essential characteristics of CA interventions, which include social construction. Attributing the effects to one particular characteristic is impossible from the CA literature alone, but some clues as to the relative importance of different features may emerge from a wider reading around effective thinking programs. This paper will be in two parts: the first part reviews the evidence for the effects of Cognitive Acceleration, and the second part unpicks the characteristics of cognitive acceleration and attempts to apportion the effects reported in the first part to particular characteristics. If you do not know what cognitive acceleration is, take a quick look at the introduction to Part II before reading Part I. PART I: The quantitative evidence base for effects of Cognitive Acceleration Definitions, environment and instruments National education system.
All of the results reported in this review unless otherwise stated were obtained from students in English schools. In general children start school in Year 1 when they reach the age of 5 years, spend six years in primary school, then from five to seven more years in secondary school. There were some middle schools spanning the primary secondary border but they are becoming rare. A National Curriculum (NC) specifying learning objectives in all subject areas at each age was introduced in 1984 and with it a series of national tests at ages 7, 11, and 14 were added to the long-established 16+ examination known as the General Certificate of Education (GCSE). The three tests introduced with the NC are known, confusingly to Americans, as SATs at Key Stages (KS) 1, 2, and 3. In England SAT is variously believed to stand for Statutory Assessment Tests, Standard Attainment Tests, Standardised Achievement Tests and Standard Assessment Tests. Cognitive Acceleration programs
Cognitive Acceleration is a generic term which encompasses intervention programs at a range of ages, in a range of subject contexts and with varying degrees of intensity and duration, although none could be regarded as a quick fix. The range is from Let’s Think!, typically used in weekly 30-minute sessions with 5-year olds for one year, to Cognitive Acceleration through Science (or Math) Education, which consist of thirty
2
60 to 80-minute lessons used once every two weeks for two years with 12-14 year olds. The common features of all CA programmes are that they (1) challenge student’s thinking, (2) highlight the social construction of knowledge and understanding and (3) encourage metacognition. More detail of these features are given in Part II. Tests
For evaluation of the effects of CA programs we have relied heavily on scores on the nationally set tests listed above, but we have also used locally set tests of content knowledge and, most importantly, tests of levels of cognitive development known as Piagetian Reasoning Tasks, PRTs, (or sometimes, depending on our audience, as Science Reasoning Tasks). PRTs were developed as group tests which follow closely original Piagetian interview protocols (Shayer, Adey, & Wylam, 1981). They are effective measures of fluid general intelligence but unlike IQ tests their validity is transparent, that is, one can see the reasoning or mis-reasoning being employed as students are required to construct their response. PRT norms for the population of England and Wales were established in a survey of 14,000 students aged 9 to 16 years in 1975/76. The norms have since changed significantly, but that is another story (Shayer, Coe, & Ginsburg, 2007; Shayer & Ginsbrg, 2009) With those preliminary explanations completed, we can turn to the substance of the paper. The evidence for the effects of CA will be presented in seven subsections (I – VII) arranged partly chronologically, partly by subject context and age level. In this part full references are given in the body of the text to offer a sense of timing as CA developed over the years. I: The Original Experiment
Results published in 4 papers in JRST, and one in Cognition and Instruction: Adey, P., & Shayer, M. (1990). Accelerating the development of formal thinking in
middle and high school students. Journal of Research in Science Teaching, 27(3), 267 - 285.
Shayer, M., & Adey, P. (1992a). Accelerating the development of formal thinking II: Postproject effects on science achievement. Journal of Research in Science Teaching, 29(1), 81-92.
Shayer, M., & Adey, P. (1992b). Accelerating the development of formal thinking III: Testing the permanency of the effects. Journal of Research in Science Teaching, 29(10), 1101-1115.
Shayer, M., & Adey, P. (1993). Accelerating the development of formal operational thinking in high school pupils, IV: Three years on after a two-year intervention. Journal of Research in Science Teaching, 30(4), 351-366.
Adey, P., & Shayer, M. (1993). An exploration of long-term far-transfer effects following an extended intervention programme in the high school science curriculum. Cognition and Instruction, 11(1), 1 - 29.
In 1985 Cognitive Acceleration through Science Education (CASE) was introduced into 10 classes in 7 schools of different types. Results were compared with matched control classes from the same schools. After the two year intervention, students were
3
followed for a further two or three years. The program of intervention and testing is shown in figure 1:
Figure 1: The original experimental design.
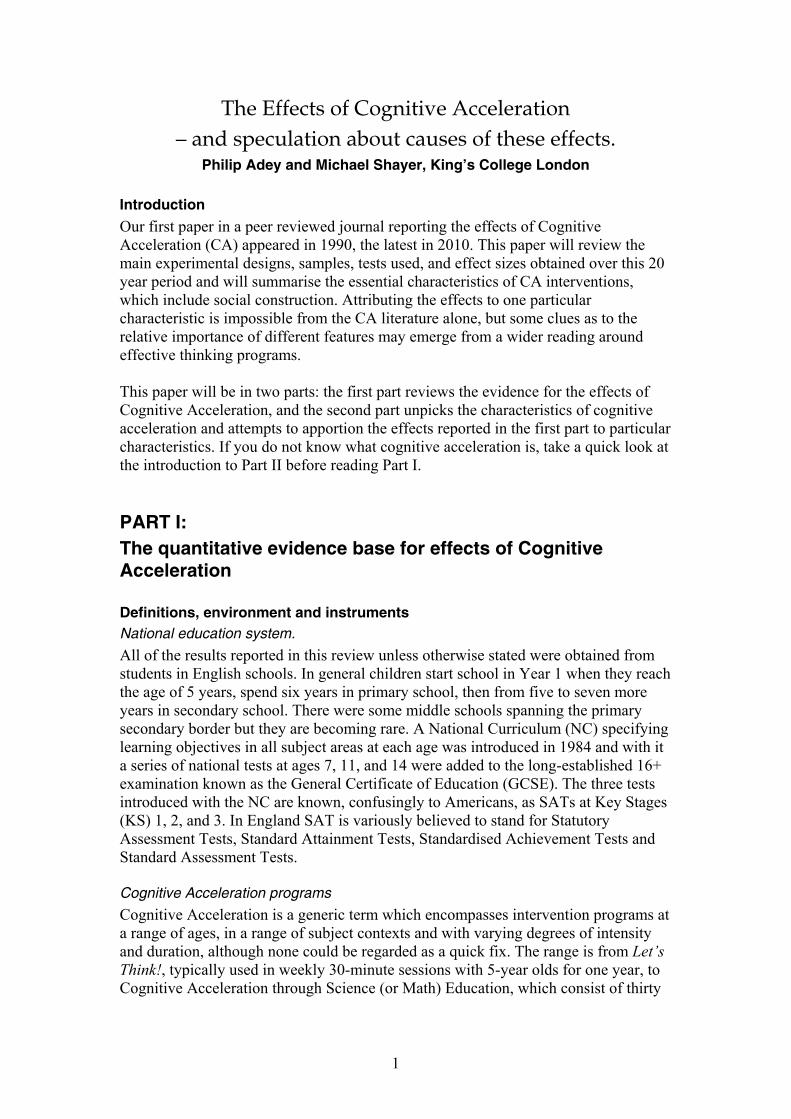
Effect sizes obtained are summarised in figure 2. Only significant differences from controls are given.:
Figure 2: Summary of effect sizes at immediate post and delayed tests of cognitive
development and academic achievement
Note: 1) Long term effects, up to three years after a two year intervention 2) Far transfer effects into English from an intervention in science 3) An apparent age/gender interaction, but this is confounded by other variables and
has never been replicated.
4
II: The next generation of results, value-added data from CASE
Two papers published as reports from King’s College, with the substance of the first one subsequently included in a paper in IJSE: Shayer, M. (1996). Long term effects of Cognitive Acceleration through Science
Education on achievement: November 1996: London: King’s College Centre for the Advancement of Thinking.
Shayer, M. (1999a). GCSE 1999: Added-value from schools adopting the CASE Intervention. London: King’s College Centre for the Advancement of Thinking.
Shayer, M. (1999b). Cognitive Acceleration through Science Education II: its effect and scope. International Journal of Science Education, 21(8), 883-902.
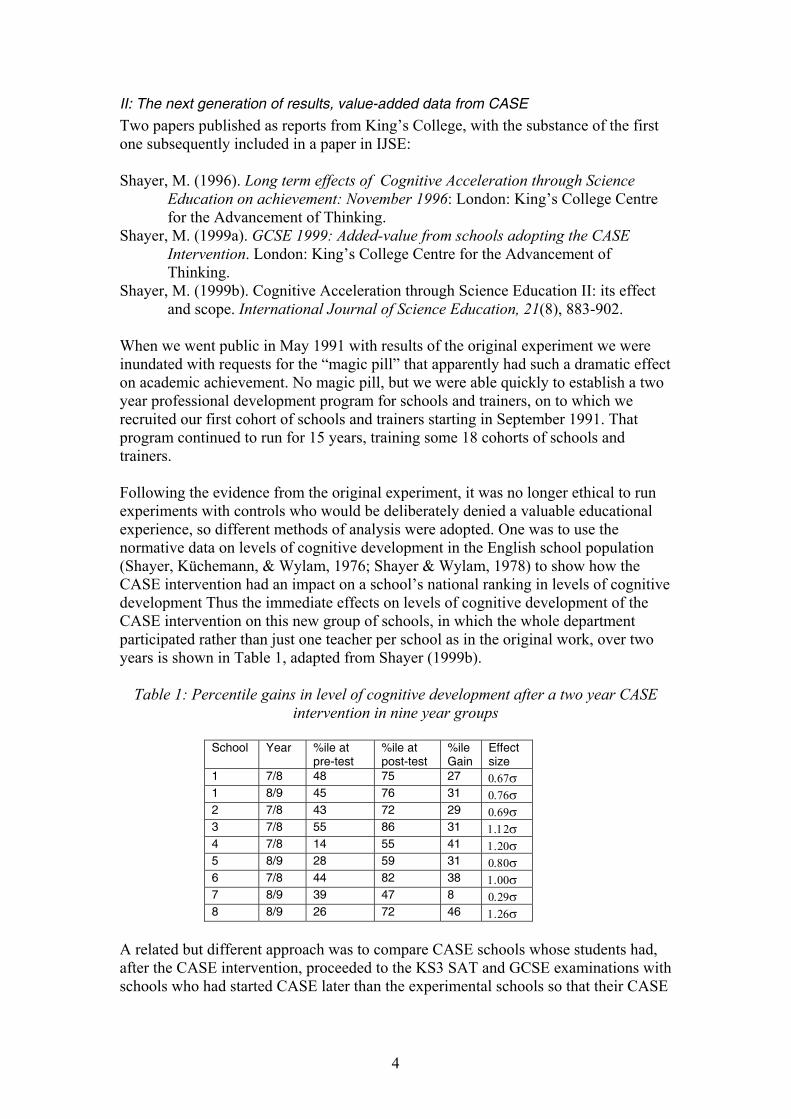
When we went public in May 1991 with results of the original experiment we were inundated with requests for the “magic pill” that apparently had such a dramatic effect on academic achievement. No magic pill, but we were able quickly to establish a two year professional development program for schools and trainers, on to which we recruited our first cohort of schools and trainers starting in September 1991. That program continued to run for 15 years, training some 18 cohorts of schools and trainers. Following the evidence from the original experiment, it was no longer ethical to run experiments with controls who would be deliberately denied a valuable educational experience, so different methods of analysis were adopted. One was to use the normative data on levels of cognitive development in the English school population (Shayer, Küchemann, & Wylam, 1976; Shayer & Wylam, 1978) to show how the CASE intervention had an impact on a school’s national ranking in levels of cognitive development Thus the immediate effects on levels of cognitive development of the CASE intervention on this new group of schools, in which the whole department participated rather than just one teacher per school as in the original work, over two years is shown in Table 1, adapted from Shayer (1999b).
Table 1: Percentile gains in level of cognitive development after a two year CASE intervention in nine year groups
School Year %ile at
pre-test %ile at post-test
%ileGain
Effect size
1 7/8 48 75 27 0.67σ 1 8/9 45 76 31 0.76σ 2 7/8 43 72 29 0.69σ 3 7/8 55 86 31 1.12σ 4 7/8 14 55 41 1.20σ 5 8/9 28 59 31 0.80σ 6 7/8 44 82 38 1.00σ 7 8/9 39 47 8 0.29σ 8 8/9 26 72 46 1.26σ
A related but different approach was to compare CASE schools whose students had, after the CASE intervention, proceeded to the KS3 SAT and GCSE examinations with schools who had started CASE later than the experimental schools so that their CASE
5
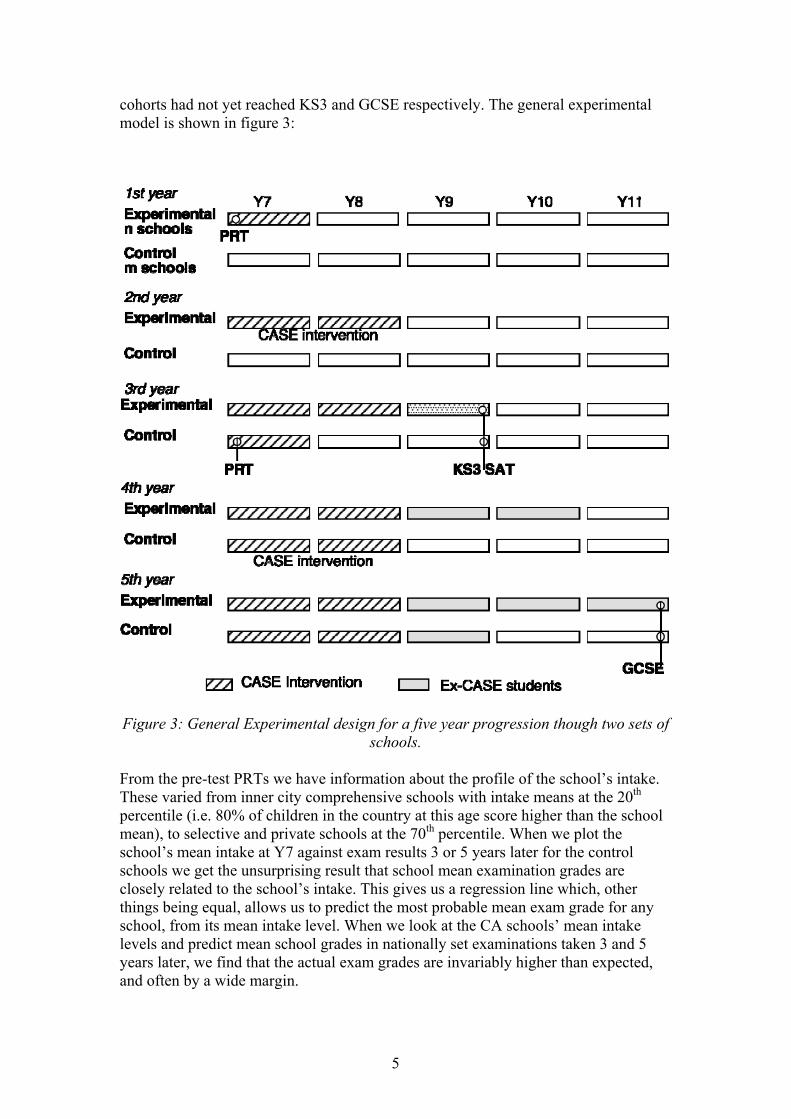
cohorts had not yet reached KS3 and GCSE respectively. The general experimental model is shown in figure 3:
Figure 3: General Experimental design for a five year progression though two sets of
schools. From the pre-test PRTs we have information about the profile of the school’s intake. These varied from inner city comprehensive schools with intake means at the 20th percentile (i.e. 80% of children in the country at this age score higher than the school mean), to selective and private schools at the 70th percentile. When we plot the school’s mean intake at Y7 against exam results 3 or 5 years later for the control schools we get the unsurprising result that school mean examination grades are closely related to the school’s intake. This gives us a regression line which, other things being equal, allows us to predict the most probable mean exam grade for any school, from its mean intake level. When we look at the CA schools’ mean intake levels and predict mean school grades in nationally set examinations taken 3 and 5 years later, we find that the actual exam grades are invariably higher than expected, and often by a wide margin.
6
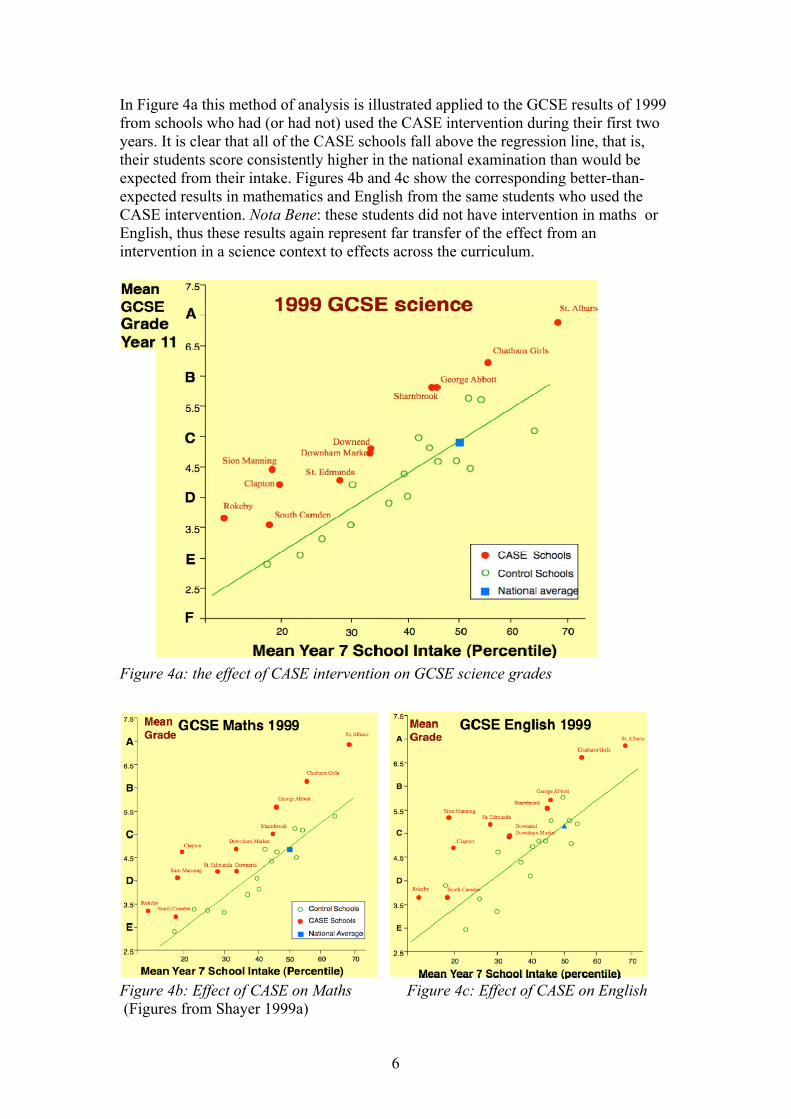
In Figure 4a this method of analysis is illustrated applied to the GCSE results of 1999 from schools who had (or had not) used the CASE intervention during their first two years. It is clear that all of the CASE schools fall above the regression line, that is, their students score consistently higher in the national examination than would be expected from their intake. Figures 4b and 4c show the corresponding better-than-expected results in mathematics and English from the same students who used the CASE intervention. Nota Bene: these students did not have intervention in maths or English, thus these results again represent far transfer of the effect from an intervention in a science context to effects across the curriculum.
Figure 4a: the effect of CASE intervention on GCSE science grades
Figure 4b: Effect of CASE on Maths Figure 4c: Effect of CASE on English (Figures from Shayer 1999a)

7
We have accumulated a large amount of such data from CASE (the secondary science embodiment of Cognitive Acceleration) during the period 1992-2000 and for reasons of space (and avoidance of tedium, given what is still to come in this paper) I will present just a small sample in tabular form. Table 2 shows the “gains” (i.e the difference between predicted and obtained) in percentages of students gaining level 6 in the KS3 SATs. Schools numbered 1 … 11 participated directly in the PD programme offered at King’s College London from September 1991 onwards. The schools with letters A-E were all trained by a trainer who participated in our King’s PD course. In other words these latter schools represent one step of a cascade. The educational significance of this is that it shows that the CA pedagogy is transferable, it is not locked into the capabilities of its originators. Table 2: Value-added by CASE to KS3 SAT taken one year after conclusion of 2-year
intervention. Gains (Obtained-Predicted) in % level 6 or>
School Science Maths English Direct PD
1 39.5*** 26.7** 0.1** 2 13.4** 21.6* 23.7** 3 40.8*** 40.8** 38.1* 4 2.5** 8.2** 5.2 9 9.9* 15.3 11.4
10 5.0 24.1*** 0.9 11 24.7* 30.2** 26.4
Trainer A 11.3* 24.4** B 26.1* 48.9*** 49.5** C 15.3* 14.8 22.3 D 31.5** 16.9 10.3 E 27.5** 32.4*** 23.4**
*** p<.001 ** p<.005 * p<.01 Table 3: Value-added by CASE to % attaining grade C or above in GCSE taken three
years after conclusion of 2-year intervention. School Science Maths English
1 34.3** 29.3** 16.2 2 21.8** 23.2** 30.9** 3 34.4** 39.6** 35.3** 4 9.2* 11.0** 10.4* 9 37.0** 26.9** 20.6*
** p<.01 * p< .05 (Tables 2 and 3 adapted from Shayer 1999b) III Cognitive Acceleration through Mathematics Education, CAME
Following the success of Cognitive Acceleration through Science, in 1993 Michael Shayer, with David Johnson and Mundher Adhami, initiated an equivalent project in mathematics using the same principles and ‘shape’ of an intervention (one lesson per two weeks for two years in Years 7 & 8), but addressing the schemata underlying the mathematics curriculum. The main results of the first CAME trials are given in:
8
Shayer, M., & Adhami, M. (2007). Fostering Cognitive Development Through the Context of Mathematics: Results of the CAME Project. Educational Studies in Mathematics, 64(3), 265-291.
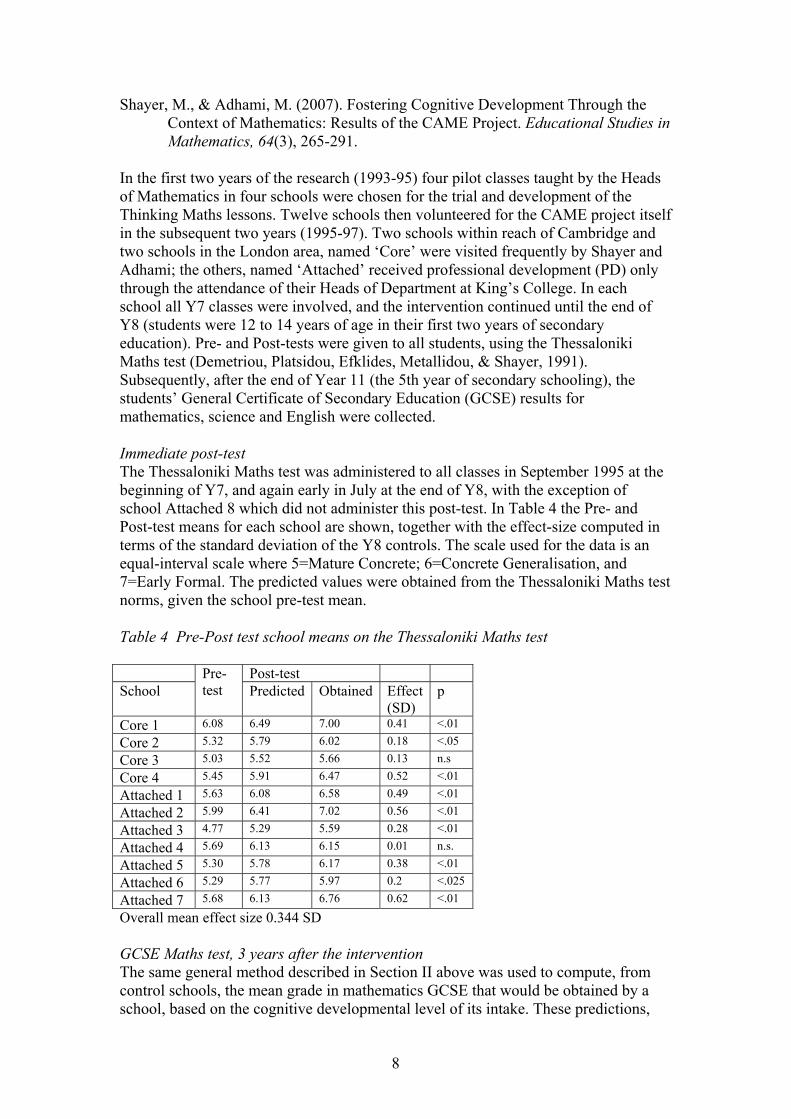
In the first two years of the research (1993-95) four pilot classes taught by the Heads of Mathematics in four schools were chosen for the trial and development of the Thinking Maths lessons. Twelve schools then volunteered for the CAME project itself in the subsequent two years (1995-97). Two schools within reach of Cambridge and two schools in the London area, named ‘Core’ were visited frequently by Shayer and Adhami; the others, named ‘Attached’ received professional development (PD) only through the attendance of their Heads of Department at King’s College. In each school all Y7 classes were involved, and the intervention continued until the end of Y8 (students were 12 to 14 years of age in their first two years of secondary education). Pre- and Post-tests were given to all students, using the Thessaloniki Maths test (Demetriou, Platsidou, Efklides, Metallidou, & Shayer, 1991). Subsequently, after the end of Year 11 (the 5th year of secondary schooling), the students’ General Certificate of Secondary Education (GCSE) results for mathematics, science and English were collected. Immediate post-test The Thessaloniki Maths test was administered to all classes in September 1995 at the beginning of Y7, and again early in July at the end of Y8, with the exception of school Attached 8 which did not administer this post-test. In Table 4 the Pre- and Post-test means for each school are shown, together with the effect-size computed in terms of the standard deviation of the Y8 controls. The scale used for the data is an equal-interval scale where 5=Mature Concrete; 6=Concrete Generalisation, and 7=Early Formal. The predicted values were obtained from the Thessaloniki Maths test norms, given the school pre-test mean. Table 4 Pre-Post test school means on the Thessaloniki Maths test Pre-
test Post-test
School Predicted Obtained Effect (SD)
p
Core 1 6.08 6.49 7.00 0.41 <.01
Core 2 5.32 5.79 6.02 0.18 <.05
Core 3 5.03 5.52 5.66 0.13 n.s
Core 4 5.45 5.91 6.47 0.52 <.01
Attached 1 5.63 6.08 6.58 0.49 <.01
Attached 2 5.99 6.41 7.02 0.56 <.01
Attached 3 4.77 5.29 5.59 0.28 <.01
Attached 4 5.69 6.13 6.15 0.01 n.s.
Attached 5 5.30 5.78 6.17 0.38 <.01
Attached 6 5.29 5.77 5.97 0.2 <.025
Attached 7 5.68 6.13 6.76 0.62 <.01
Overall mean effect size 0.344 SD GCSE Maths test, 3 years after the intervention The same general method described in Section II above was used to compute, from control schools, the mean grade in mathematics GCSE that would be obtained by a school, based on the cognitive developmental level of its intake. These predictions,
9
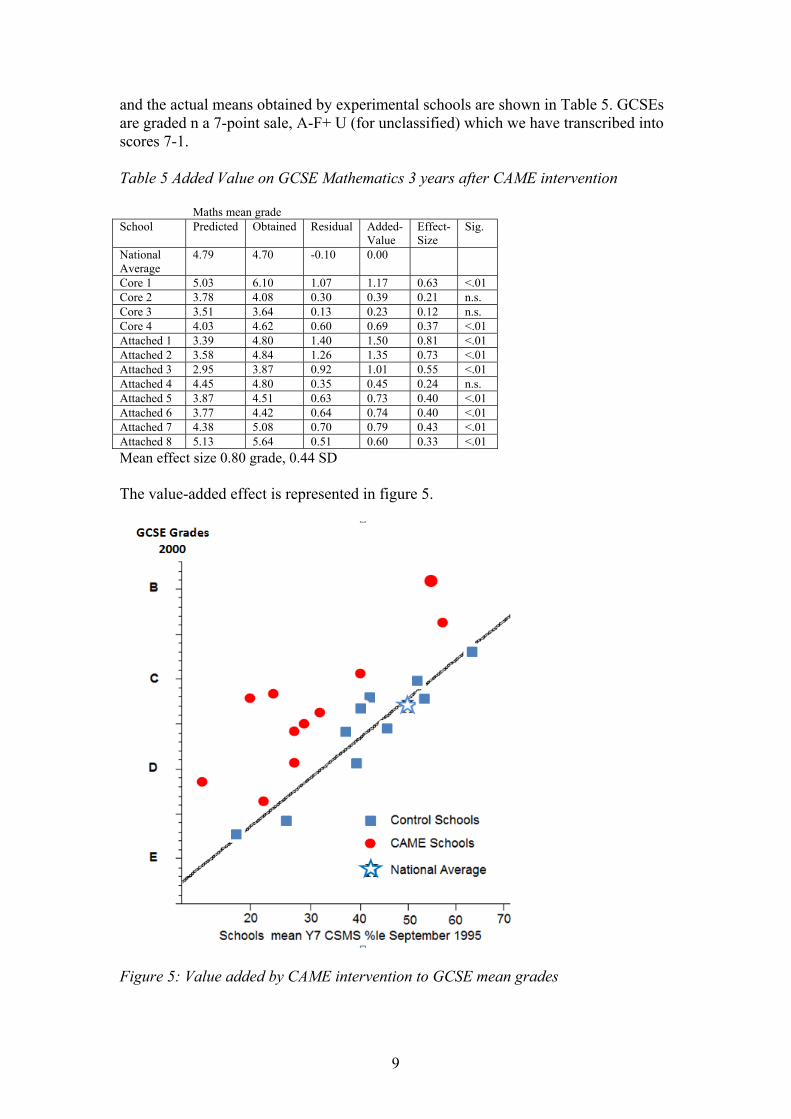
and the actual means obtained by experimental schools are shown in Table 5. GCSEs are graded n a 7-point sale, A-F+ U (for unclassified) which we have transcribed into scores 7-1. Table 5 Added Value on GCSE Mathematics 3 years after CAME intervention Maths mean grade School Predicted Obtained Residual Added-
Value Effect-Size
Sig.
National Average
4.79 4.70 -0.10 0.00
Core 1 5.03 6.10 1.07 1.17 0.63 <.01 Core 2 3.78 4.08 0.30 0.39 0.21 n.s. Core 3 3.51 3.64 0.13 0.23 0.12 n.s. Core 4 4.03 4.62 0.60 0.69 0.37 <.01 Attached 1 3.39 4.80 1.40 1.50 0.81 <.01 Attached 2 3.58 4.84 1.26 1.35 0.73 <.01 Attached 3 2.95 3.87 0.92 1.01 0.55 <.01 Attached 4 4.45 4.80 0.35 0.45 0.24 n.s. Attached 5 3.87 4.51 0.63 0.73 0.40 <.01 Attached 6 3.77 4.42 0.64 0.74 0.40 <.01 Attached 7 4.38 5.08 0.70 0.79 0.43 <.01 Attached 8 5.13 5.64 0.51 0.60 0.33 <.01 Mean effect size 0.80 grade, 0.44 SD The value-added effect is represented in figure 5.
Figure 5: Value added by CAME intervention to GCSE mean grades
10
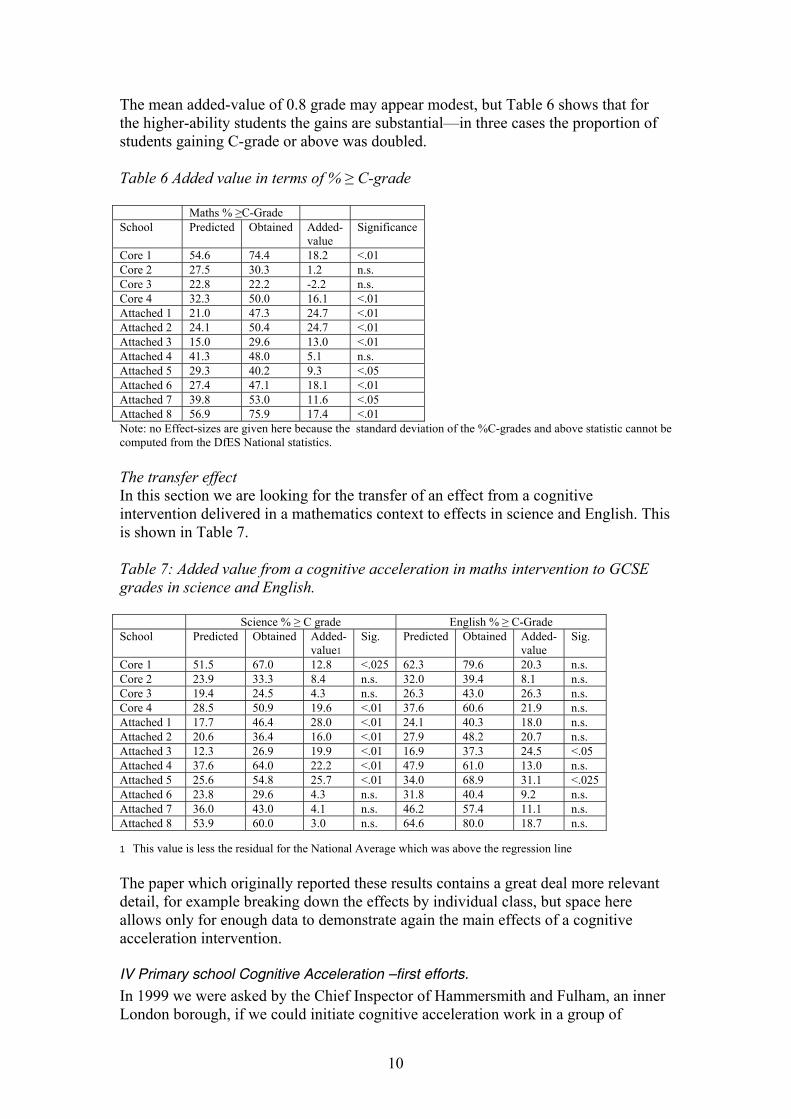
The mean added-value of 0.8 grade may appear modest, but Table 6 shows that for the higher-ability students the gains are substantial—in three cases the proportion of students gaining C-grade or above was doubled. Table 6 Added value in terms of % ≥ C-grade Maths % ≥C-Grade School Predicted Obtained Added-
value Significance
Core 1 54.6 74.4 18.2 <.01 Core 2 27.5 30.3 1.2 n.s. Core 3 22.8 22.2 -2.2 n.s. Core 4 32.3 50.0 16.1 <.01 Attached 1 21.0 47.3 24.7 <.01 Attached 2 24.1 50.4 24.7 <.01 Attached 3 15.0 29.6 13.0 <.01 Attached 4 41.3 48.0 5.1 n.s. Attached 5 29.3 40.2 9.3 <.05 Attached 6 27.4 47.1 18.1 <.01 Attached 7 39.8 53.0 11.6 <.05 Attached 8 56.9 75.9 17.4 <.01 Note: no Effect-sizes are given here because the standard deviation of the %C-grades and above statistic cannot be computed from the DfES National statistics. The transfer effect In this section we are looking for the transfer of an effect from a cognitive intervention delivered in a mathematics context to effects in science and English. This is shown in Table 7. Table 7: Added value from a cognitive acceleration in maths intervention to GCSE grades in science and English.
Science % ≥ C grade English % ≥ C-Grade School Predicted Obtained Added-
value1 Sig. Predicted Obtained Added-
value Sig.
Core 1 51.5 67.0 12.8 <.025 62.3 79.6 20.3 n.s. Core 2 23.9 33.3 8.4 n.s. 32.0 39.4 8.1 n.s. Core 3 19.4 24.5 4.3 n.s. 26.3 43.0 26.3 n.s. Core 4 28.5 50.9 19.6 <.01 37.6 60.6 21.9 n.s. Attached 1 17.7 46.4 28.0 <.01 24.1 40.3 18.0 n.s. Attached 2 20.6 36.4 16.0 <.01 27.9 48.2 20.7 n.s. Attached 3 12.3 26.9 19.9 <.01 16.9 37.3 24.5 <.05 Attached 4 37.6 64.0 22.2 <.01 47.9 61.0 13.0 n.s. Attached 5 25.6 54.8 25.7 <.01 34.0 68.9 31.1 <.025 Attached 6 23.8 29.6 4.3 n.s. 31.8 40.4 9.2 n.s. Attached 7 36.0 43.0 4.1 n.s. 46.2 57.4 11.1 n.s. Attached 8 53.9 60.0 3.0 n.s. 64.6 80.0 18.7 n.s. 1 This value is less the residual for the National Average which was above the regression line The paper which originally reported these results contains a great deal more relevant detail, for example breaking down the effects by individual class, but space here allows only for enough data to demonstrate again the main effects of a cognitive acceleration intervention. IV Primary school Cognitive Acceleration –first efforts.
In 1999 we were asked by the Chief Inspector of Hammersmith and Fulham, an inner London borough, if we could initiate cognitive acceleration work in a group of
11
primary schools in a particularly disadvantaged area. Rather than just dilute the materials we already had for Years 7 & 8 to make them accessible to Years 5 and 6, we decided that more adventurous policy was justified: we would start again from first principles and invent a completely new CA program for children in their first year of schooling, aged about 5 years. The materials, which came to be known as Let’s Think!, are designed to be delivered to one group of six children once per week. During the LT sessions the teacher focuses on this one group for about 30 minutes while other children do their own work possibly with the help of a teachers’ assistant. Within a week the teacher can get around to all of the children in a class of 30. First results from the Primary school work are described in: Adey, P., Robertson, A., & Venville, G. (2002). Effects of a cognitive stimulation
programme on Year 1 pupils. British Journal of Educational Psychology, 72, 1-25.
Venville, G., Adey, P., Larkin, S., & Robertson, A. (2003). Fostering thinking through science in the early years of schooling. International Journal of Science Education, 25(11), 1313-1332.
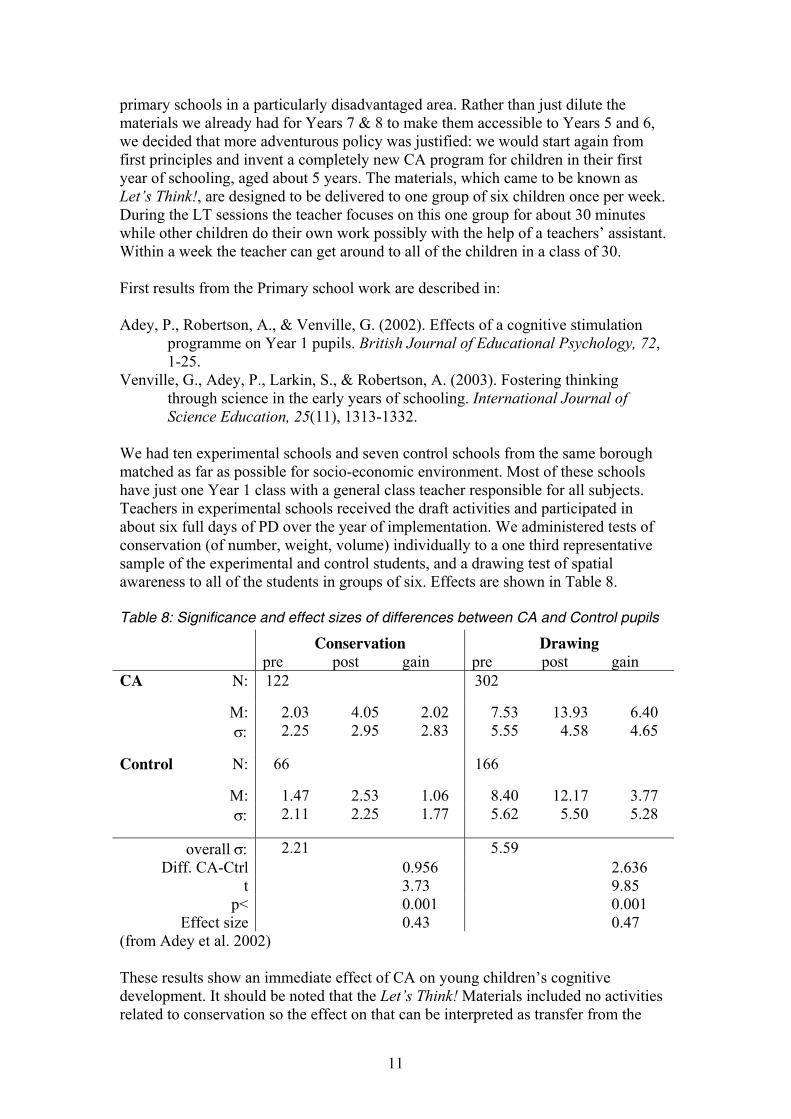
We had ten experimental schools and seven control schools from the same borough matched as far as possible for socio-economic environment. Most of these schools have just one Year 1 class with a general class teacher responsible for all subjects. Teachers in experimental schools received the draft activities and participated in about six full days of PD over the year of implementation. We administered tests of conservation (of number, weight, volume) individually to a one third representative sample of the experimental and control students, and a drawing test of spatial awareness to all of the students in groups of six. Effects are shown in Table 8. Table 8: Significance and effect sizes of differences between CA and Control pupils
Conservation Drawing pre post gain pre post gain CA N: 122 302
M: 2.03 4.05 2.02 7.53 13.93 6.40 σ: 2.25 2.95 2.83 5.55 4.58 4.65
Control N: 66 166
M: 1.47 2.53 1.06 8.40 12.17 3.77 σ: 2.11 2.25 1.77 5.62 5.50 5.28
overall σ: 2.21 5.59 Diff. CA-Ctrl 0.956 2.636
t 3.73 9.85 p< 0.001 0.001 Effect size 0.43 0.47
(from Adey et al. 2002) These results show an immediate effect of CA on young children’s cognitive development. It should be noted that the Let’s Think! Materials included no activities related to conservation so the effect on that can be interpreted as transfer from the

12
particular schema addressed to the broader context of intellectual development in general. Figure 6 shows the data class by class in terms of ‘residualised gain scores’, the gains made by each class on each test minus the gain expected from the control class’s data. By definition the mean of the control class rg scores must be zero.
Figure 6: Residualised gain scores by classes Year 1 children exposed to Lets Think! V Primary Mathematics and long term effects
The development of Let’s Think! for Year 1 was followed swiftly by a parallel and then extended program for the first two years of primary school with a focus on mathematics. This program was eventually published as Let’s Think through Maths!. The long term evaluation of LT! and LTTM! is fraught with methodological problems as there is a rapid turnover of students and teachers in these schools and a great variety in the curriculum experiences of children as they progress through the six years of primary school. One cohort may be exposed to LT! only in Y1 and have no other CA experience for six years. At the other extreme a child may conceivably get LT! and LTTM! in Y1, LTTM! in Y2, LTTS! (see section VII) in Y3 and Y4, and PCAME in Y5 and Y6 – in other words a full six years of CA exposure. Michael Shayer has worked his way carefully through this minefield and has been able to report with some confidence on the effects on CA in primary schools in two main papers: Shayer, M., & Adhami, M. (2003). Realising the cognitive potential of children 5-7
with a mathematics focus. International Journal of Educational Research, 39, 743-775.
Shayer, M., & Adhami, M. (2010). Realizing the Cognitive Potential of Children 5 to 7 with a Mathematics focus: Post-test and long-term Effects of a two-year intervention. British Journal of Educational Psychology, 80, 363-369.
-3
-2
-1
0
1
2
3
4
5
11 31 02 20 14 21 09 28 08 18 16 12 32 07 24 27 23 29 25 26 22 30
CA Classes Control Classes
conservationdrawing
class number
Res
idu
alsi
ed G
ain

13
LTTM! Activities are conducted with the whole class, an episode typically starting with problem exploration with children grouped around the teacher, followed by small group work at tables, and then again around the teacher to share findings and difficulties. One LTTM! lesson might consist of two or three such episodes. The whole program consists of about 12 lessons in Year 1 and 18 lessons in Year 2. The experimental group consisted of 8 classes in Hammersmith and Fulham (H&F, see section IV) and 10 classes in Bournemouth, a town on the South coast of England with an average population. Control classes were also identified in those two boroughs. Experimental teachers participated in an extensive PD program. The intervention and testing schedule is shown in table 9.
Table 9: Intervention and testing schedule for LTTM! evaluation Year Experimental schools Control schools Sep 2002–July 2003
Pre-test: Piagetian Spatial Relations test
Y1 teachers use Let’s Think each week during the year
Y1 use 10 TM lessons during the year Sep 2003–July 2004
Y2 teachers use 15 TM lessons during the year and also ‘bridge’ to their numeracy work
July 2004 Post-tests: Piagetian Spatial Relations test and KS1 SATs in Maths and English July 2008 Long-term tests: KS2 SATs in Maths and English
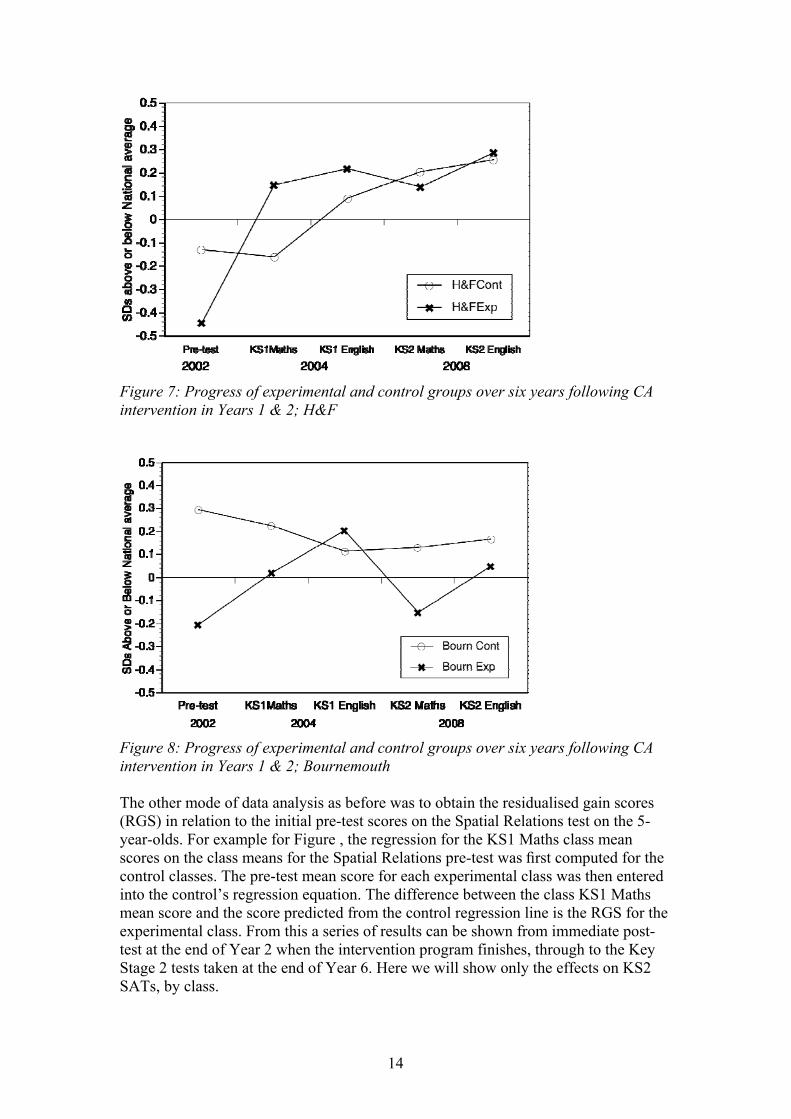
The spatial relation test is a PRT which is administered to six children at a time in Y1, but can be used with a whole class of 7-year olds. The most graphic way to display the results is in terms of changes to the experimental and control groups over six years in relation to national norms, based on the pre-test with the PRT Spatial Perception. [If we do not spell out the detail of the reliability and validity of every test in this paper, it is because to do so would make it unacceptably long. Please accept that these sort of issues have been comprehensively covered in the review process of having the papers accepted in high-status journals]. Figures 7 and 8 show the gains in standard deviation terms of experimental and control groups in H&F and Bournemouth. Note that the x axes are not scalar. It is clear that in both boroughs the experimental group has made significantly greater gains than have the control groups.
14
Figure 7: Progress of experimental and control groups over six years following CA intervention in Years 1 & 2; H&F
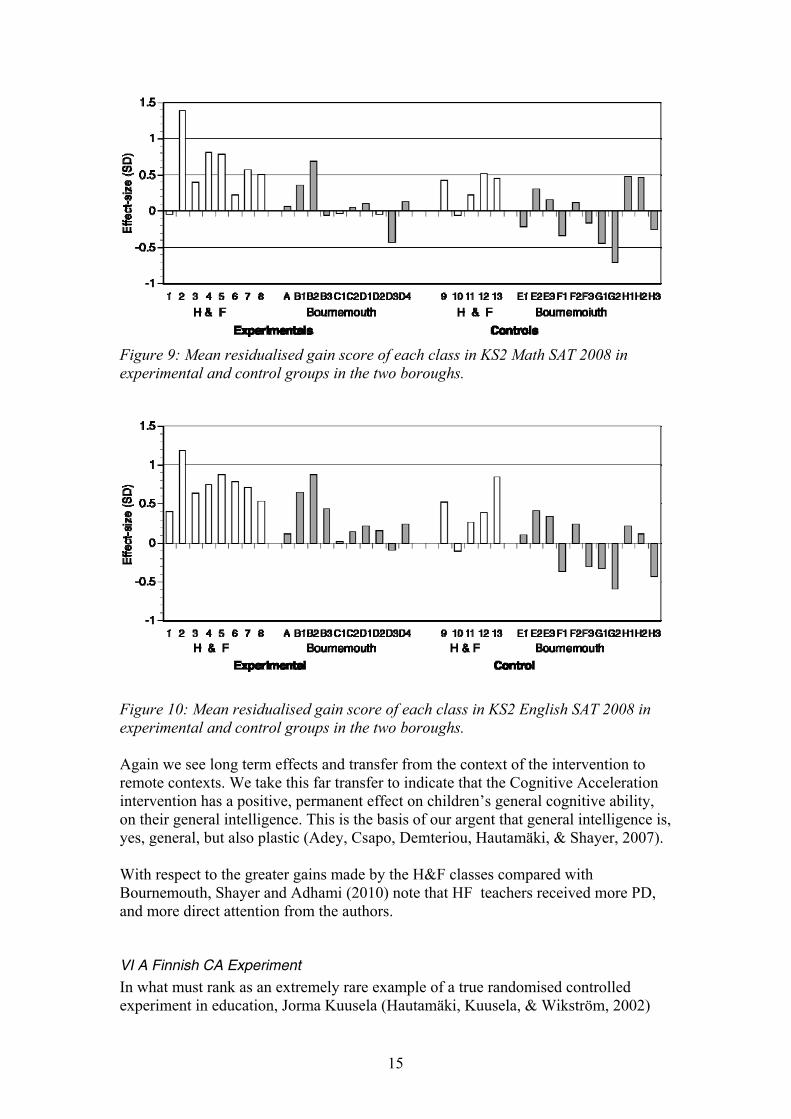
Figure 8: Progress of experimental and control groups over six years following CA intervention in Years 1 & 2; Bournemouth The other mode of data analysis as before was to obtain the residualised gain scores (RGS) in relation to the initial pre-test scores on the Spatial Relations test on the 5-year-olds. For example for Figure , the regression for the KS1 Maths class mean scores on the class means for the Spatial Relations pre-test was first computed for the control classes. The pre-test mean score for each experimental class was then entered into the control’s regression equation. The difference between the class KS1 Maths mean score and the score predicted from the control regression line is the RGS for the experimental class. From this a series of results can be shown from immediate post-test at the end of Year 2 when the intervention program finishes, through to the Key Stage 2 tests taken at the end of Year 6. Here we will show only the effects on KS2 SATs, by class.
15
Figure 9: Mean residualised gain score of each class in KS2 Math SAT 2008 in experimental and control groups in the two boroughs.
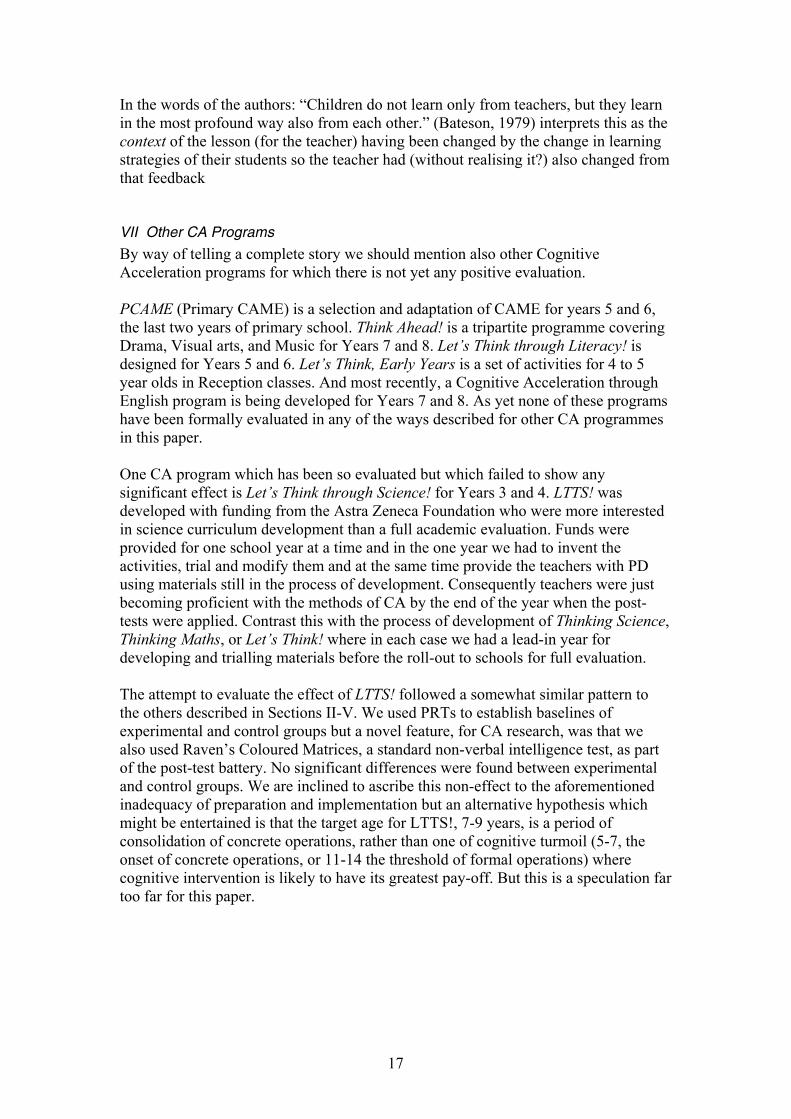
Figure 10: Mean residualised gain score of each class in KS2 English SAT 2008 in experimental and control groups in the two boroughs. Again we see long term effects and transfer from the context of the intervention to remote contexts. We take this far transfer to indicate that the Cognitive Acceleration intervention has a positive, permanent effect on children’s general cognitive ability, on their general intelligence. This is the basis of our argent that general intelligence is, yes, general, but also plastic (Adey, Csapo, Demteriou, Hautamäki, & Shayer, 2007). With respect to the greater gains made by the H&F classes compared with Bournemouth, Shayer and Adhami (2010) note that HF teachers received more PD, and more direct attention from the authors. VI A Finnish CA Experiment
In what must rank as an extremely rare example of a true randomised controlled experiment in education, Jorma Kuusela (Hautamäki, Kuusela, & Wikström, 2002)

16
took the whole population of Year 6 (age 12+) from all of the primary schools in one town, Vihti (population 23,000) in Finland as their sample. The final study sample was 276 students who were randomly assigned regardless of their normal school or class to one of three conditions: CASE, CAME, or no treatment, each condition containing 92 students. The children were transported around the town in buses and taxis to attend the CA lessons all administered by Kuusela himself to groups of about 23. It must have been a logistical nightmare. The intervention program was only for one year rather than the normal (for CASE and CAME) 2 years and consisted of weekly CASE or CAME lessons of 90 minutes duration. All students were pretested at the start of Year 6 and then given immediate post test at the end of Year 6 and delayed tests at the end of Year 7 and again at the end of Year 8. The test battery, for which Finnish normative data was available, accessed higher cognitive functions (Ross & Ross, 1977) (four scales: deductive reasoning, missing premises, relevant-and-irrelevant information, questioning strategies) and mental arithmetic (WISC-Arithmetic with one extra (last) item from Volume and Heaviness of PRTs). Post tests included two PRTs. Other, qualitative, factors were also assessed. The surprising results of this experiment were that not only did the CASE and CAME treatment groups make significant advances in cognitive development compared with national norms, but so did the control group! The CASE and CAME groups made slightly larger gains than the controls but the differences did not reach significance. On the other hand, at immediate post-test all of the Vihti students showed a gain of more that one s.d. against national norms, highly significant. Table 10 shows the proportions of students at each developmental level at immediate and at first post test. Table 10 The distribution of concrete and formal levels of thinking in the major types of control groups in the 6th and the 7th grade
On the average, about 15 % of 13-year-olds and about 19 % of 14-year-olds are formal thinkers in Finland, and the pre-tests had established that the Vihti school population was near to average. In hindsight it is not so difficult to explain this initially surprising result in terms of social construction. Consider what it must have been like in each Year 6 class in Vihti that year. Each week first one third of your class is taken away to a CAME lesson, then another third are taken away to a CASE lesson. Do the students not talk with one another when they are reunited? Do the CASE and CAME students, two-thirds of the class, not question more, probe more deeply, generate more constructive arguments?
6t h gr ade Cont r ol CAME (%) Cont r ol CASE (%) Cont r ol A l l (%)conr et e lev el 70 55 63f or mal lev el 30 45 39
100 100 100
7t h gr ade Cont r ol CAME (%) Cont r ol CASE (%) Cont r ol A l l (%)conr et e lev el 50 61 54f or mal lev el 50 39 46
100 100 100
17
In the words of the authors: “Children do not learn only from teachers, but they learn in the most profound way also from each other.” (Bateson, 1979) interprets this as the context of the lesson (for the teacher) having been changed by the change in learning strategies of their students so the teacher had (without realising it?) also changed from that feedback VII Other CA Programs
By way of telling a complete story we should mention also other Cognitive Acceleration programs for which there is not yet any positive evaluation. PCAME (Primary CAME) is a selection and adaptation of CAME for years 5 and 6, the last two years of primary school. Think Ahead! is a tripartite programme covering Drama, Visual arts, and Music for Years 7 and 8. Let’s Think through Literacy! is designed for Years 5 and 6. Let’s Think, Early Years is a set of activities for 4 to 5 year olds in Reception classes. And most recently, a Cognitive Acceleration through English program is being developed for Years 7 and 8. As yet none of these programs have been formally evaluated in any of the ways described for other CA programmes in this paper. One CA program which has been so evaluated but which failed to show any significant effect is Let’s Think through Science! for Years 3 and 4. LTTS! was developed with funding from the Astra Zeneca Foundation who were more interested in science curriculum development than a full academic evaluation. Funds were provided for one school year at a time and in the one year we had to invent the activities, trial and modify them and at the same time provide the teachers with PD using materials still in the process of development. Consequently teachers were just becoming proficient with the methods of CA by the end of the year when the post-tests were applied. Contrast this with the process of development of Thinking Science, Thinking Maths, or Let’s Think! where in each case we had a lead-in year for developing and trialling materials before the roll-out to schools for full evaluation. The attempt to evaluate the effect of LTTS! followed a somewhat similar pattern to the others described in Sections II-V. We used PRTs to establish baselines of experimental and control groups but a novel feature, for CA research, was that we also used Raven’s Coloured Matrices, a standard non-verbal intelligence test, as part of the post-test battery. No significant differences were found between experimental and control groups. We are inclined to ascribe this non-effect to the aforementioned inadequacy of preparation and implementation but an alternative hypothesis which might be entertained is that the target age for LTTS!, 7-9 years, is a period of consolidation of concrete operations, rather than one of cognitive turmoil (5-7, the onset of concrete operations, or 11-14 the threshold of formal operations) where cognitive intervention is likely to have its greatest pay-off. But this is a speculation far too far for this paper.
18
Part 2 What is the Magic Ingredient in Cognitive Acceleration? In Part 1 I have tried to summarise the major effects on cognitive development and on academic achievement generally following on intervention of Cognitive Acceleration at different ages and in different subject contexts. The overall picture is of a reliable, sustained, substantial, long-term and general effect on students’ intellectual development. In this part we must address the nature of CA, what characteristics it possesses which seem likely to be responsible for the effects that it has. One might also ask Why doesn’t everyone use CA? Answers to both questions are related. Firstly we must note what Cognitive Acceleration is not. It is not just a set of print and IT resources which can be bought as a package and implemented without thought. It cannot be totally encapsulated in such resources. CA is not tied to particular subjects, nor to particular age groups, although we have found some subject areas and age groups to be more amenable to stimulation than others. The CA package for a particular subject and age (for example, Thinking Science for grades 6 & 7) does not exhaust the possibilities at that age and subject, many more opportunities for curriculum invention exist. CA does not offer a definition of good teaching, although it provides guidance to effective classroom practice for particular outcomes. CA is not a magic bullet but it does provide—for the teacher that realises this—a Sample scheme from which general teaching/learning principles can be learnt. Also the actual structure of the CA lessons implicitly embody the method (not all of which is explicit). The core principles of CA, what we refer to as its main Pillars, are threefold: 1. Cognitive Conflict: From Piaget we get the notion of the necessity for students to actively construct knowledge in contrast to the passive absorption of teacher’s delivery. Moreover, the mind is programmed to develop in response to stimulation so that the experience of an input which does not fit with existing cognitive structures causes re-structuring and equilibration to a higher level. From Vygotsky we get a sense of the degree of cognitive conflict that can be productive, as the Zone of Proximal Development delineates the borders of ‘too easy’ and ‘too difficult’. CA activities whether for 5- or 14-year olds aim to provide challenge, occasions which make students stop and think, puzzles which can be worked out with guided thought. Of course the wide range of levels of cognitive development found at one age in any school system makes hitting the best location within the ZPD a challenge in itself. It cannot be achieved by curriculum resources alone, but depends on the development of the art by teachers, and on identifying activities which have a wide range of difficulty levels. 2. Social Construction. Vygotsky shows us that intelligence is a social thing; we develop our minds in a group, discussing, arguing constructively, building on one another’s ideas, listening, reconstructing, and contributing. The classroom atmosphere has to be right for this sort of dialogue to flourish and, dare one say it, very different from the standard classroom where the teacher has the knowledge which is dispensed to the students. A CA classroom is a ferment of ideas being offered around, with the
19
teacher playing a critical and very difficult role of steering, accepting, encouraging, and refereeing the rules for discourse. 3. Metacognition. Reflecting on one’s own learning and thinking process serves a number of purposes. It helps to consolidate what has been learned and, more importantly how it has been learned. One delightful trick in a CA lesson is to ask the students near the end firstly what they have learned, and then: “And did I tell you that?” No. “So how did you come to learn it?”. In addition to having cognitive benefits, this type of dialogue is immensely empowering for students, giving them what Carol Dweck (Dweck & Henderson, 1988) describes as an enactive view of their own abilities, that they can pull themselves up by their own bootstraps. In addition to these thee Pillars, there are other contextual features of Cognitive Acceleration lessons such as the lead-in process called Concrete Preparation and the linking of the content of the CA lesson to the regular curriculum, called Bridging, but it is thee three pillars outlined above that we believe are central to the efficacy of CA. Now I know that it is our Pillar 2, Social Construction, which is of most interest to this LRDC conference but unfortunately the three pillars are inextricably intertwined with one another. It would not be possible, even in principle, to run an experiment to tease out the separate effects of each pillar. Try to imagine a series of lessons which generated high level social construction but involved minimum cognitive conflict or metacognition. What would generate the dialogue? You cannot have a very interesting argument about phenomena which are already well-known and well-understood by all participants. In practice it is the cognitive conflict that generates the social construction and it is the process of exploring explanations through dialogue which maintains the cognitive conflict. Metacognition is another opportunity for social construction and it, too, brings its own quota of cognitive conflict. Interestingly it is sometimes the more able students, for whom it is difficult to generate cognitive conflict, who find difficulty with the process of explaining how they learned something, or how they solved a problem. “I just did it”, “It’s obvious” are typical responses. Equally, what sort of experience would it be to encounter a puzzling phenomenon but have no opportunity to discuss it, to explore possible explanations with peers under the guidance of a teacher? I think it would be very frustrating and if repeated would be seriously de-motivating. Each of the three pillars is necessary, none by themselves is sufficient. I believe that the veracity of this position is reinforced by inspection of other successful “Thinking” programs. For example, Philosophy for Children (Lipman, Sharp, & Oscanyan, 1980; Topping & Trickey, 2007a, 2007b) generates high level dialogue with moral and social problems, and Feuerstein’s Instrumental Enrichment (Feuerstein, Rand, Hoffman, & Miller, 1980) uses very open-ended problems to stimulate dialogue. These programs, which come from different roots than Cognitive Acceleration may eschew the term ‘Cognitive Conflict’ but a rose by any other name… Finally, why doesn’t everyone use CA or for that matter other proven Thinking programmes? The answer lies in the descriptions above of the essential pillars of CA: it is difficult, and it is very different from the sort of teaching which appears to be the stock-in-trade of most school inspectors, school Principals, and government policy

20
makers. They have all been to school, so they are all experts in education and know that a good lesson must have clear behavioural objectives and an assessed outcome (Ahem). Over the last thirty years we have generally not found it difficult to introduce the principles and practice of Cognitive Acceleration to teachers, given time and coaching. What has been the sticking point, why CA has not taken over the world, is that it requires a bit of effort to understand and to implement, and that it makes no claim to be a Quick Fix which will yield results before the next election. CA requires a significant input of professional development of teachers … but the constraints, design and delivery of such PD programmes would be the subject of another paper. Other references
Adey, P., Csapo, B., Demteriou, A., Hautamäki, J., & Shayer, M. (2007). Can We Be Intelligent About Intelligence? Why Education Needs the Concept of Plastic General Ability. The Educational Research Review, 2(2), 75-97.
Bateson, G. (1979). Mind and Nature New York: E.P. Dutton Dweck, C. S., & Henderson, V. L. (1988). Theories of Intelligence: background and
measures: University of Illinois. Feuerstein, R., Rand, Y., Hoffman, M., & Miller, M. (1980). Instrumental
Enrichment: an intervention programme for cognitive modifiability. Baltimore: University Park Press.
Hautamäki, J., Kuusela, J., & Wikström, J. (2002). CASE and CAME in Finland: "The second wave". Harrogate: 10th International Conference on Thinking.
Lipman, M., Sharp, M., & Oscanyan, F. (1980). Philosophy in the classroom. (2nd ed.). Philadelphia: Temple University Press.
Shayer, M., Adey, P., & Wylam, H. (1981). Group tests of cognitive development- ideals and a realisation. Journal of Research in Science Teaching, 18(2), 157-168.
Shayer, M., Coe, R., & Ginsburg, D. (2007). 30 Years on—a large anti-‘Flynn effect’? the Piagetian test Volume & Heaviness norms 1975-2003. British Journal of Educational Psychology, 77(1), 25-41.
Shayer, M., & Ginsbrg, D. (2009). Thirty years on- a large anti-Flynn effect? (II): 13- and 14-year olds. Piagetian tests of formal operations norms 1976-2006/7. British Journal of Educational Psychology, 79(3), 409-418.
Shayer, M., Küchemann, D., & Wylam, H. (1976). The distribution of Piagetian stages of thinking in British middle and secondary school children. British Journal of Educational Psychology, 46, 164-173.
Shayer, M., & Wylam, H. (1978). The distribution of Piagetian stages of thinking in British middle and secondary school children. II - 14- to 16- year olds and sex differentials. British Journal of Educational Psychology(48), 62-70.
Topping, K. J., & Trickey, S. (2007a). Collaborative philosophical enquiry for school children: Cognitive effects at 10-12 years. British Journal of Educational Psychology, 77(2), 271-278.
Topping, K. J., & Trickey, S. (2007b). Collaborative philosophical enquiry for school children: Cognitive gains at 2-year follow-up. British Journal of Educational Psychology, 77(4), 787-796.