Embed Size (px)
Citation preview
A contribution of Federal Aid in Wildlife Restoration, Michigan Project W-147-R
Equal Rights for Natural Resource Users The Michigan Department of Natural Resources provides equal opportunities for employment and access to Michigan's natural resources. Both State and Federal laws prohibit discrimination on the basis of race, color, national origin, religion, disability, age, sex, height, weight or marital status under the U.S. Civil Rights Acts of 1964 as amended, 1976 MI PA 453, 1976 MI PA 220, Title V of the Rehabilitation Act of 1973 as amended, and the 1990 Americans with Disabilities Act, as amended. If you believe that you have been discriminated against in any program, activity, or facility, or if you desire additional information, please write: Human Resources, Michigan Department of Natural Resources, PO Box 30473, Lansing MI 48909-7973, or Michigan Department of Civil Rights, Cadillac Place, 3054 West Grand Blvd, Suite 3-600, Detroit, MI 48202, or Division of Federal Assistance, U.S. Fish & Wildlife Service, 4401 North Fairfax Drive, Mail Stop MBSP-4020, Arlington, VA 22203. For information or assistance on this publication, contact Michigan Department of Natural Resources, Wildlife Division, P.O. Box 30444, MI 48909. This publication is available in alternative formats upon request.
Michigan Department of Natural Resources Wildlife Division Report No. 3699
September 2021
EFFECTS OF COVID-19 ON MICHIGAN TURKEY HUNTING IN 2020
Brian J. Frawley
ABSTRACT
Coronavirus disease (COVID-19) is an infectious disease caused by a newly discovered coronavirus. COVID-19 restrictions (e.g., stay at home requirements, travel restrictions, and keeping physical distance) were enacted to limit its spread in Michigan during 2020, and these restrictions may have impacted turkey hunter behavior. In 2020, licenses were purchased by 105,650 people, an increase of 22,578 license buyers (27% increase) from 2019. About 25% of the license buyers in 2020 were new (i.e., had not purchased a license during the previous 12 years). License buyers were asked to indicate whether COVID-19 caused them to (1) buy a spring turkey hunting license, (2) spend more time hunting, (3) reduce the distance they traveled to hunt, (4) hunt alone more often, or (5) struggle to locate a hunting area. Overall, 39% of license buyers (41,023) agreed that COVID-19 had caused them to take at least one of these five actions. An estimated 15% of all license buyers and 24% of new license buyers agreed that COVID-19 had made them more likely to buy a license. About 20% of license buyers indicated that they increased the amount of time they hunted in 2020 because of COVID-19. About 13% hunted alone more frequently and 10% of license buyers reduced the distance they traveled to hunt. About 7% of license buyers indicated that they found it more difficult to locate a hunting area. Although COVID-19 restrictions appeared to have increased the number of people buying hunting licenses in Michigan (i.e., cited by 15% of the license buyers), hunting regulation changes (e.g., changing the opening day of seasons from Monday to Saturday and increasing the length of most seasons) probably also motivated additional people to purchase licenses in 2020.
2
INTRODUCTION In 2020, the spring turkey (Meleagris gallopavo) hunting season occurred from April 18 through June 7 for most of Michigan. Shortly before the season began, restrictions were implemented to limit the spread of the coronavirus disease (COVID-19), a new contagious respiratory disease that can cause serious illness or death in humans. Beginning in mid-March 2020, residents were urged to reduce in-person gatherings and limit non-essential travel (Executive orders 2020-5, 2020-9, 2020-21, and 2020-42). Also, in-person school learning (kindergarten through 12th grade) was suspended for the remainder of the school year (Executive orders 2020-5, 2020-35, and 2020-65), and non-essential workers were ordered to stay at home until June 1 (Executive orders 2020-21, 2020-42, 2020-59, 2020-70, 2020-77, 2020-92, 2020-96, and 2020-110). In addition, turkey hunters were encouraged to hunt as close to home as possible. The most restrictive COVID-19 rules coincided with the spring turkey hunting season in Michigan. Thus, these COVID-19 regulations may have changed turkey hunting activity. Questions were added to the annual harvest survey (Frawley 2021) to determine how COVID-19 regulations may have changed hunting behavior. Determining how COVID-19 regulations changed hunting behavior may be important because it may affect future hunting seasons and regulations.
METHODS The Michigan Department of Natural Resources (MDNR) currently sells hunting licenses using a statewide electronic license sales system. This system allowed the MDNR to maintain a central database containing license sales information (e.g., sales transactions and customer profiles). From this database, the sex, birth date, state and county of residence, and license purchasing history of each spring turkey hunting license buyer were determined during 2009-2020. Following the 2020 spring turkey hunting season, a questionnaire (Appendix A) was sent to 15,442 randomly selected people that had purchased a turkey hunting license (mentored youth [<10 years old], junior resident [10-16], resident turkey [17-64], senior resident turkey [65+], nonresident turkey, apprentice (person >9 years old who did not have a hunter safety certificate), and Pure Michigan hunting licenses). Normally, the annual harvest survey would have been conducted immediately after the season had ended (i.e., June-October); however, the 2020 survey was delayed because of the COVID-19 pandemic. The 2020 survey data were collected during September-December. All license buyers that received the questionnaire were asked to indicate how important turkey hunting was to them compared to their other recreational activities and to describe their turkey hunting skill level. Also, license buyers were presented with several statements describing the potential impact of COVID-19 on their behavior (e.g., were they more likely to buy a license or to hunt more often?) and were asked to indicate whether COVID-19 had affected their behavior. Responses included “strongly agree,” “agree,” “neither,” “disagree,” “strongly disagree,” and “unsure.” License buyers were asked whether they planned to continue to hunt turkeys in Michigan in the next 2
3
years. Responses included “very likely,” “somewhat likely,” “not very likely,” “not at all likely,” and “not sure.” COVID-19 may cause older hunters to change their behavior more than younger ones because younger people may take more risks than older people (Zhou et al. 2020). Female hunters may also change their hunting behavior more than males because males may take more risks than females; therefore, males might ignore the COVID-19 restrictions more often than females (Feingold 1994, Byrnes et al. 1999). Because of these potential differences between ages and gender, estimates were calculated separately for ten different age classes (1-9, 10-19, 20-29, 30-39, 40-49, 50-59, 60-69, 70-79, 80+ years old) and each gender. Hunters living in urban areas (with high human density) may be more affected by the COVID-19 traveling restrictions than hunters living in rural counties; thus, estimates were calculated separately for rural and urban areas. The U.S. Census Bureau classified counties as completely rural, mostly rural, and mostly urban (US Census Bureau 2010). Completely rural counties included counties where 100% of the population in the county lived in areas that have less than 1,000 people per square mile (Antrim, Arenac, Baraga, Benzie, Keweenaw, Lake, Missaukee, Montmorency, Ogemaw, Ontonagon, Osceola, and Oscoda). Mostly rural counties included counties where 50.1% to 99.9% of the population lived in areas with less than 1,000 people per square mile (Alcona, Alger, Allegan, Alpena, Barry, Branch, Cass, Charlevoix, Cheboygan, Clare, Clinton, Crawford, Emmet, Gladwin, Gogebic, Gratiot, Hillsdale, Huron, Ionia, Iosco, Iron, Kalkaska, Lapeer, Leelanau, Lenawee, Luce, Mackinac, Manistee, Mason, Mecosta, Menominee, Montcalm, Newaygo, Oceana, Otsego, Presque Isle, Roscommon, St. Joseph, Sanilac, Schoolcraft, Shiawassee, Tuscola, Van Buren, and Wexford). Mostly urban counties included counties with greater than 50,000 people and greater than 50% of the residents living in areas with more than 1,000 people per square mile (Bay, Berrien, Calhoun, Chippewa, Delta, Dickinson, Eaton, Genesee, Grand Traverse, Houghton, Ingham, Isabella, Jackson, Kalamazoo, Kent, Livingston, Macomb, Marquette, Midland, Monroe, Muskegon, Oakland, Ottawa, Saginaw, St. Clair, Washtenaw, and Wayne). Estimates were calculated using a stratified random sampling design that included 18 strata (Frawley 2021). Hunters were stratified based on the management unit where their license was valid (13 management units). Hunters who purchased a license that could be used in multiple management units (mentored youth hunters, PMH license holders, and licenses for hunts 234 and 301) were treated as separate strata (strata 14-17). Moreover, people that had voluntarily reported information about their hunting activity via the internet were treated as a separate stratum (eighteenth stratum). A 95% confidence limit (CL) was calculated for all estimates. This CL could be added to and subtracted from an estimate to calculate the 95% confidence interval. The confidence interval was a measure of the precision associated with the estimate and implies the true value would be within this interval 95 times out of 100. Estimates were based on information collected from random samples of hunting license buyers. Thus, these estimates were subject to sampling errors (Cochran 1977). Estimates were not adjusted for possible response or nonresponse biases.
4
Statistical tests are used routinely to determine the likelihood that differences among estimates are larger than expected by chance alone. The overlap of 95% confidence intervals was used to determine whether estimates differed. Non-overlapping 95% confidence intervals were equivalent to stating the difference between the means was larger than would be expected 95 out of 100 times (P<0.05), if the study had been repeated (Payton et al. 2003).
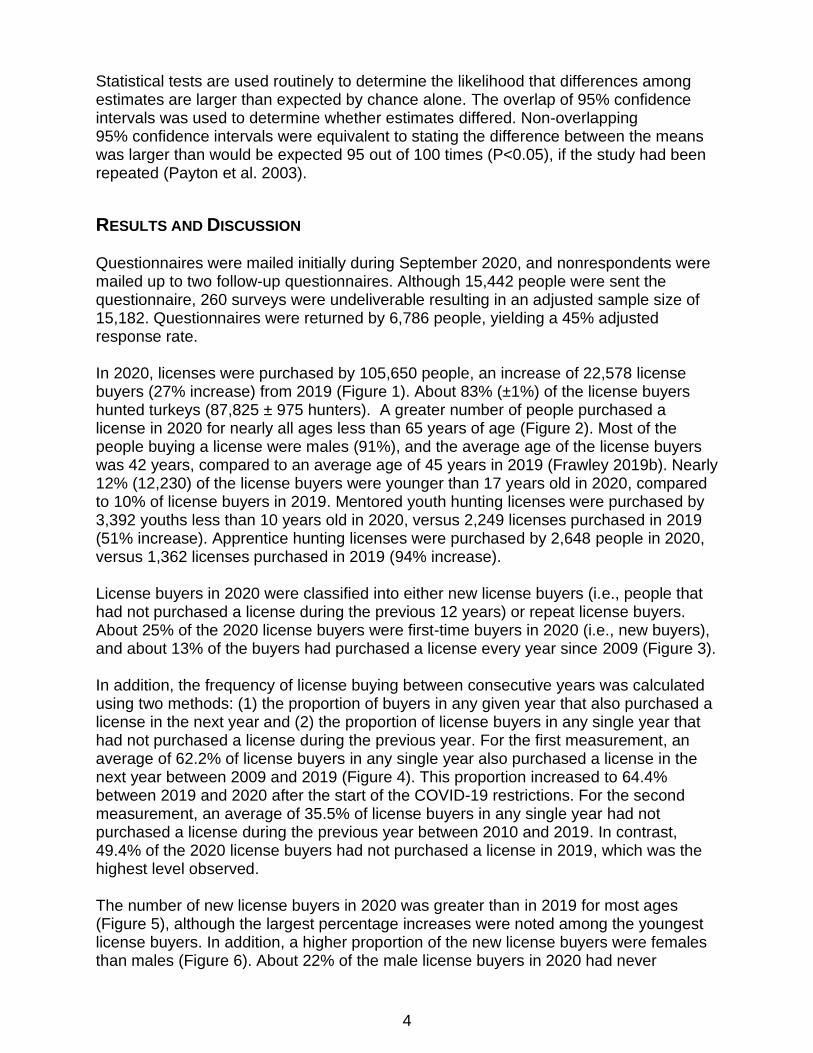
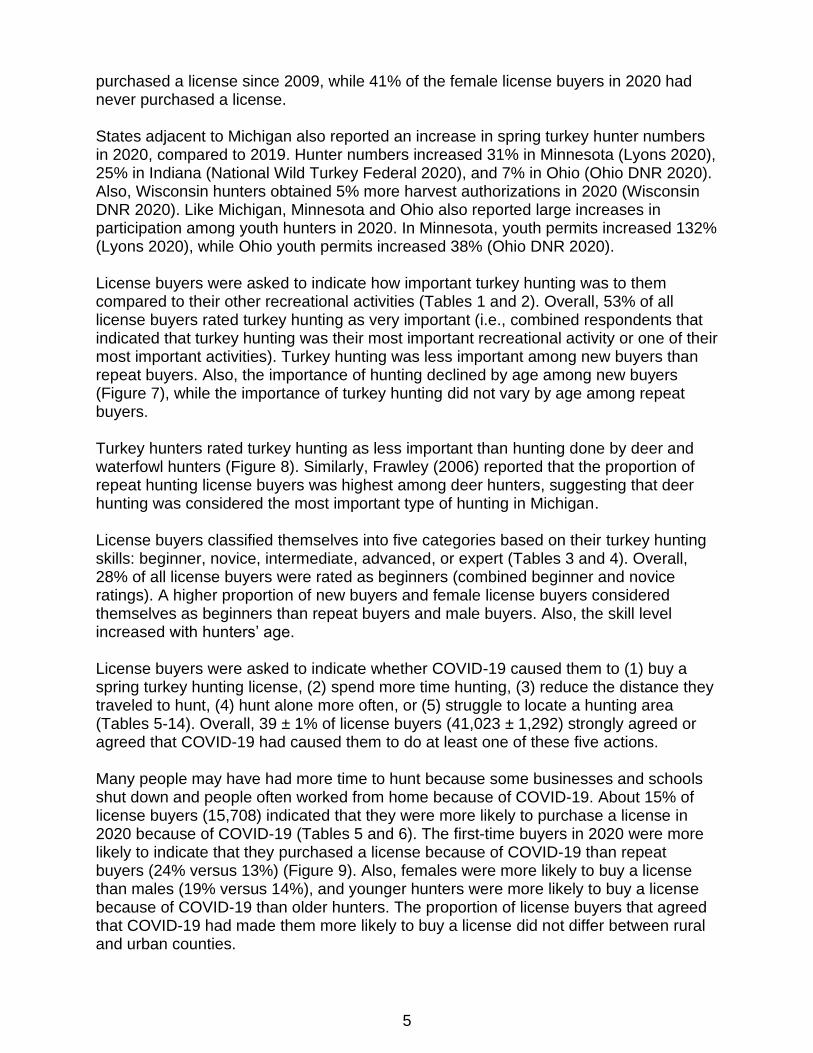
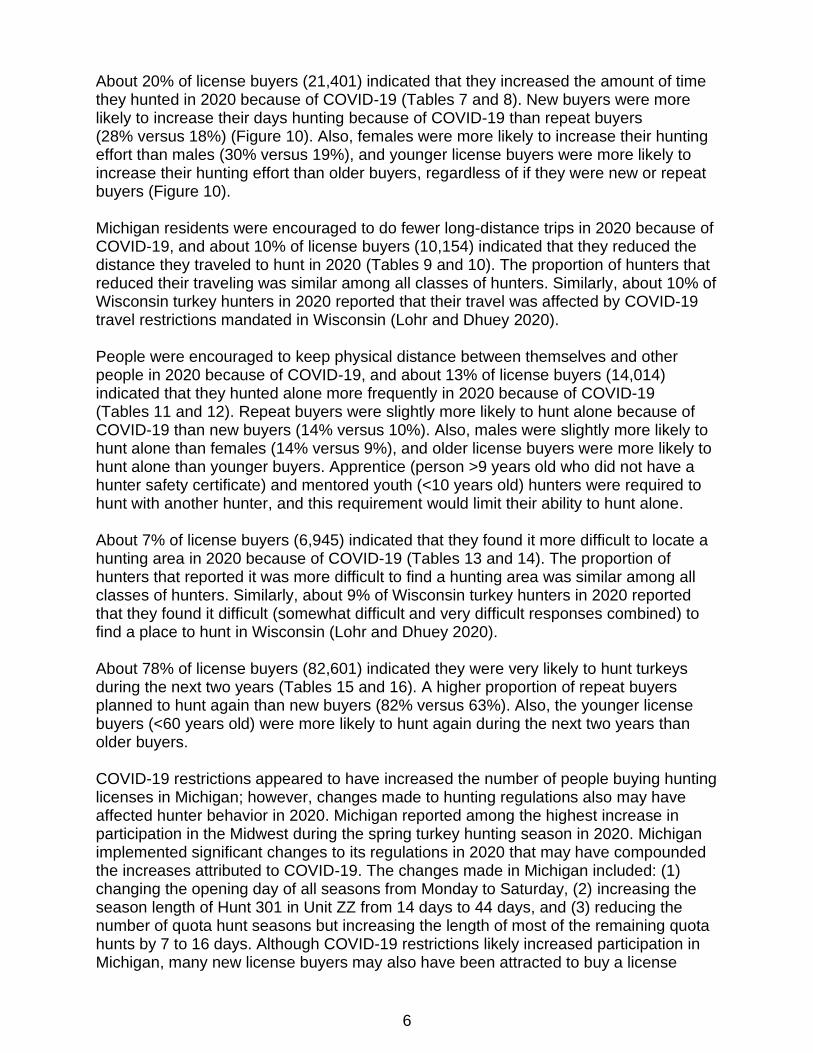
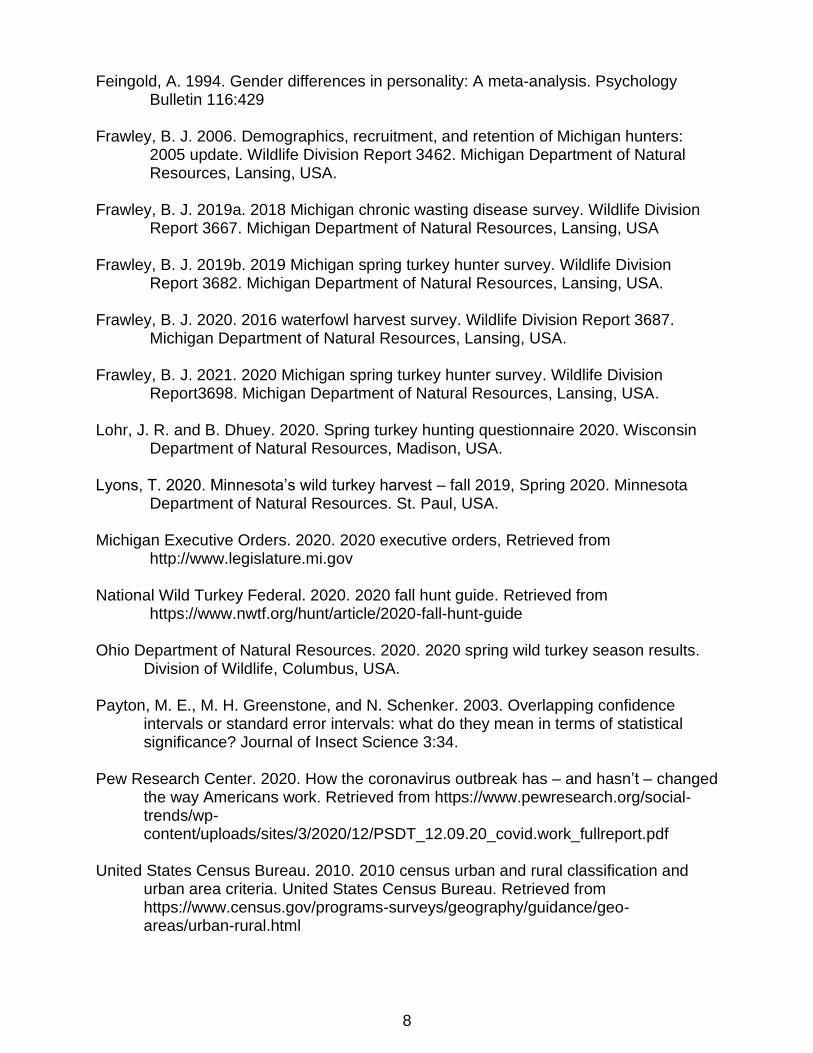
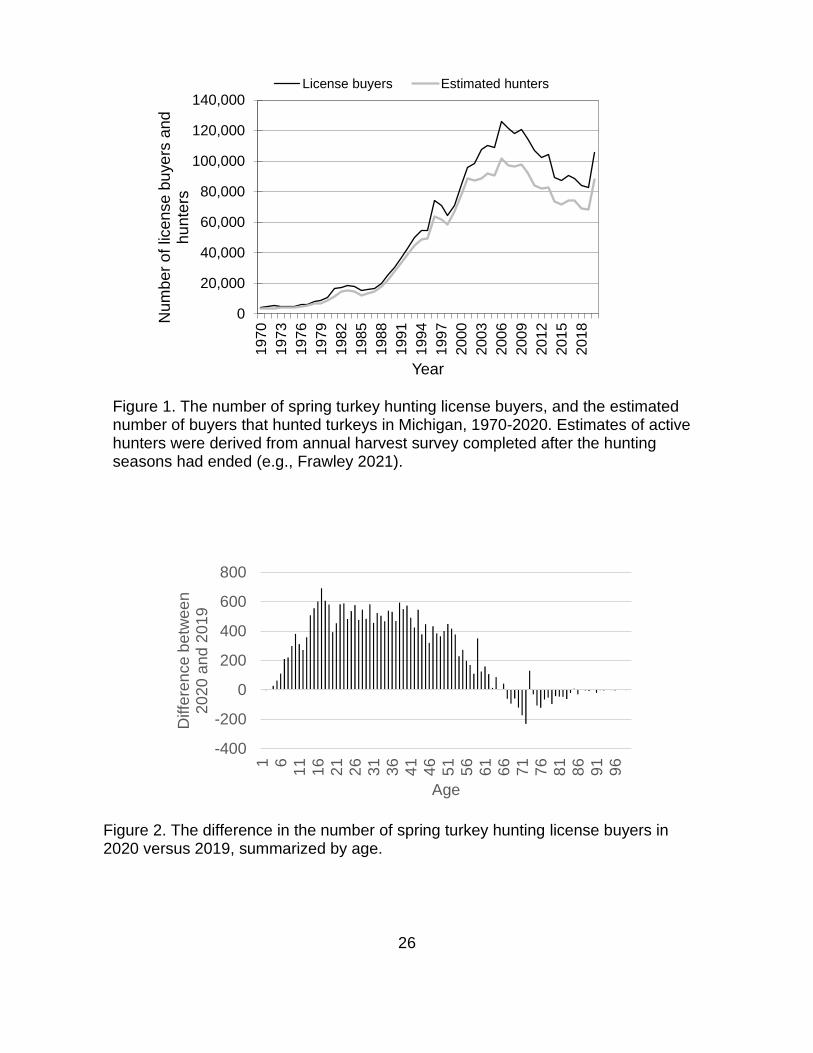
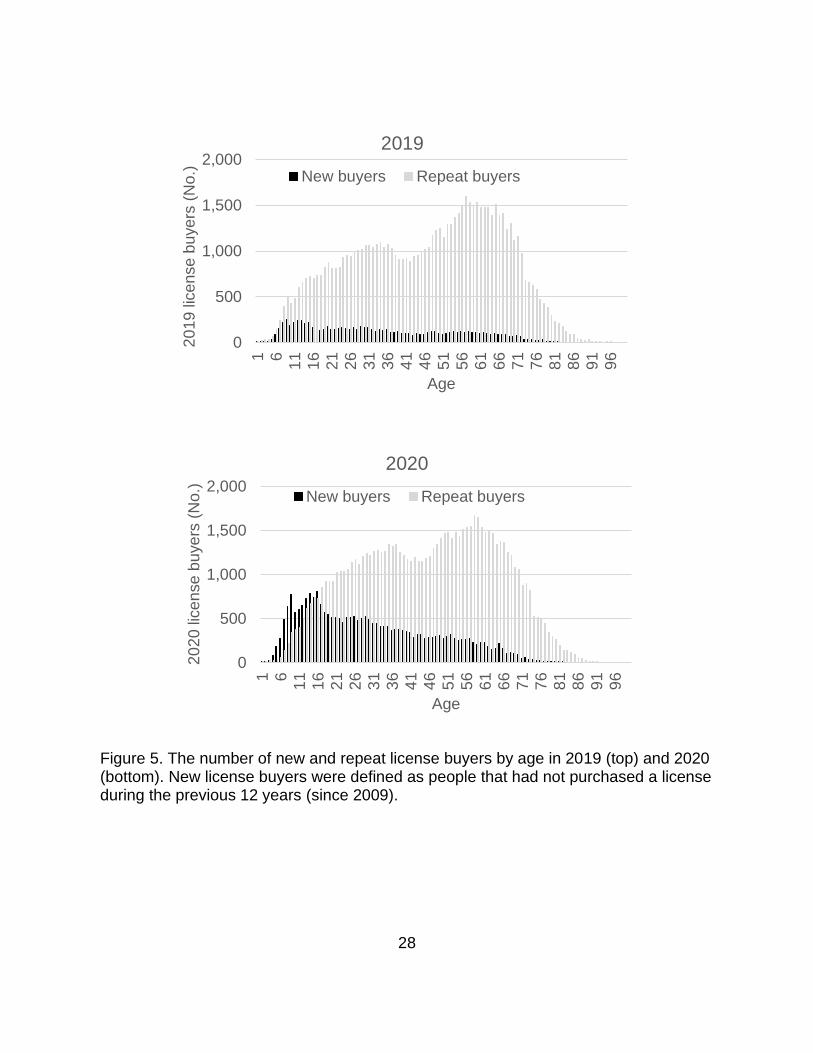
RESULTS AND DISCUSSION Questionnaires were mailed initially during September 2020, and nonrespondents were mailed up to two follow-up questionnaires. Although 15,442 people were sent the questionnaire, 260 surveys were undeliverable resulting in an adjusted sample size of 15,182. Questionnaires were returned by 6,786 people, yielding a 45% adjusted response rate. In 2020, licenses were purchased by 105,650 people, an increase of 22,578 license buyers (27% increase) from 2019 (Figure 1). About 83% (±1%) of the license buyers hunted turkeys (87,825 ± 975 hunters). A greater number of people purchased a license in 2020 for nearly all ages less than 65 years of age (Figure 2). Most of the people buying a license were males (91%), and the average age of the license buyers was 42 years, compared to an average age of 45 years in 2019 (Frawley 2019b). Nearly 12% (12,230) of the license buyers were younger than 17 years old in 2020, compared to 10% of license buyers in 2019. Mentored youth hunting licenses were purchased by 3,392 youths less than 10 years old in 2020, versus 2,249 licenses purchased in 2019 (51% increase). Apprentice hunting licenses were purchased by 2,648 people in 2020, versus 1,362 licenses purchased in 2019 (94% increase). License buyers in 2020 were classified into either new license buyers (i.e., people that had not purchased a license during the previous 12 years) or repeat license buyers. About 25% of the 2020 license buyers were first-time buyers in 2020 (i.e., new buyers), and about 13% of the buyers had purchased a license every year since 2009 (Figure 3). In addition, the frequency of license buying between consecutive years was calculated using two methods: (1) the proportion of buyers in any given year that also purchased a license in the next year and (2) the proportion of license buyers in any single year that had not purchased a license during the previous year. For the first measurement, an average of 62.2% of license buyers in any single year also purchased a license in the next year between 2009 and 2019 (Figure 4). This proportion increased to 64.4% between 2019 and 2020 after the start of the COVID-19 restrictions. For the second measurement, an average of 35.5% of license buyers in any single year had not purchased a license during the previous year between 2010 and 2019. In contrast, 49.4% of the 2020 license buyers had not purchased a license in 2019, which was the highest level observed. The number of new license buyers in 2020 was greater than in 2019 for most ages (Figure 5), although the largest percentage increases were noted among the youngest license buyers. In addition, a higher proportion of the new license buyers were females than males (Figure 6). About 22% of the male license buyers in 2020 had never
5
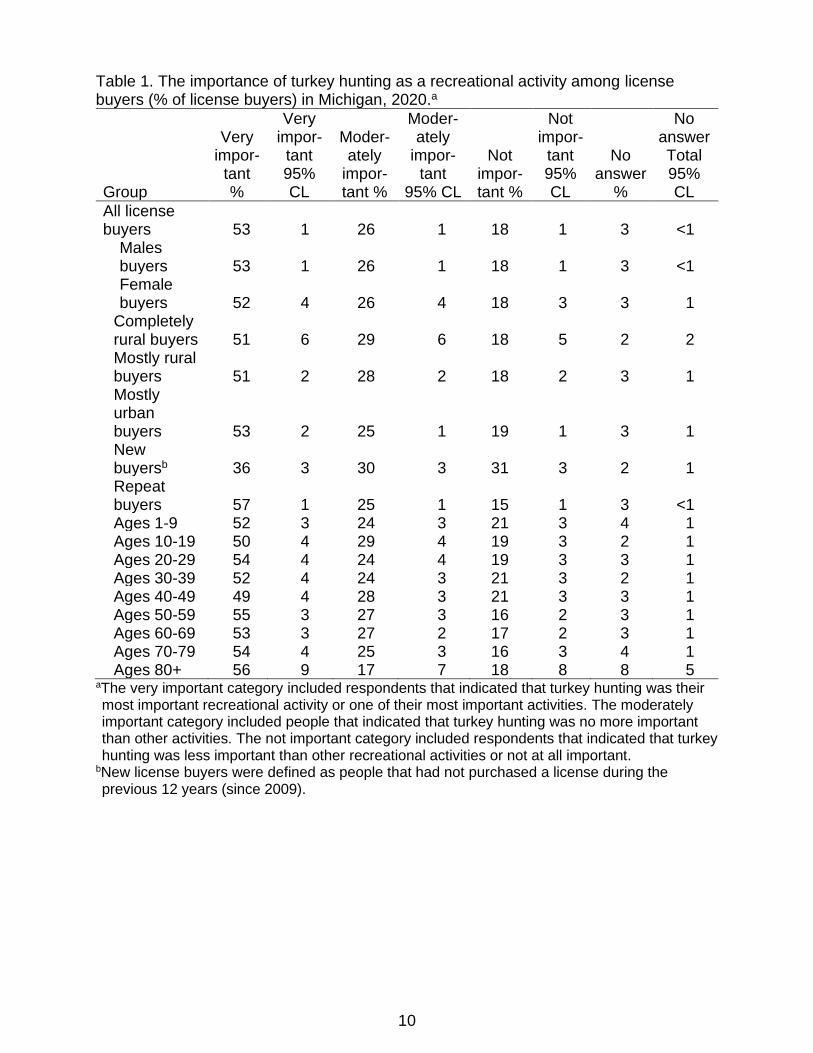
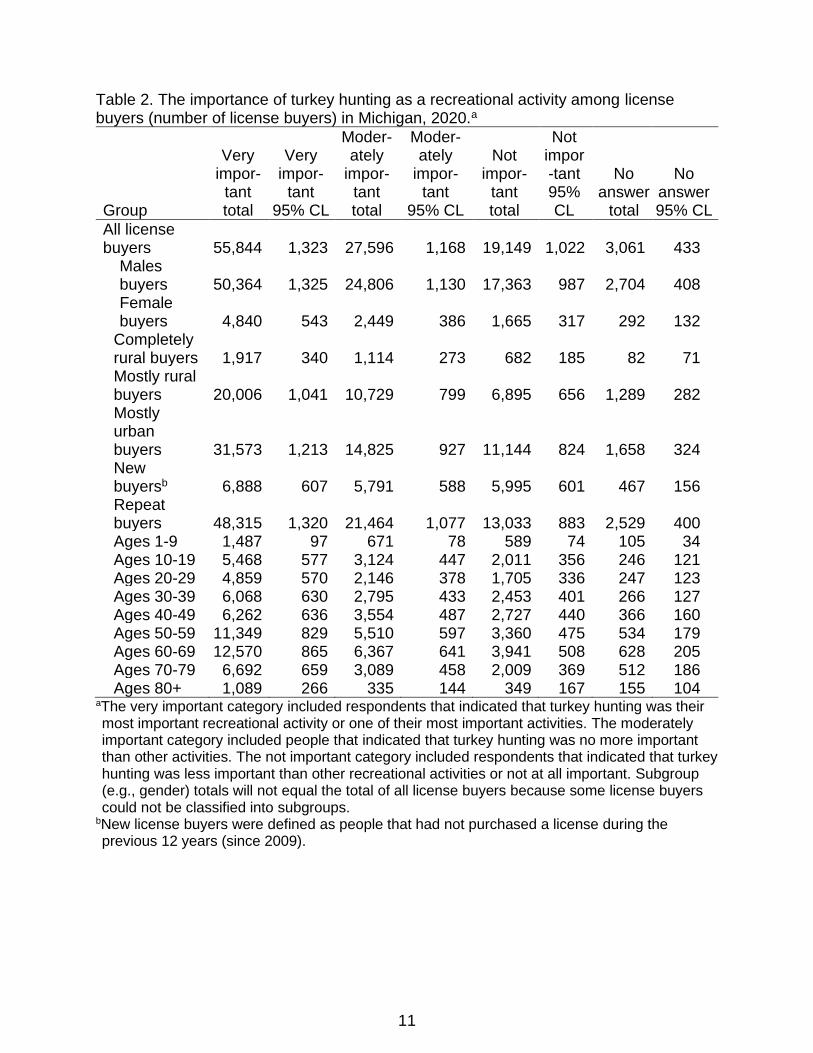
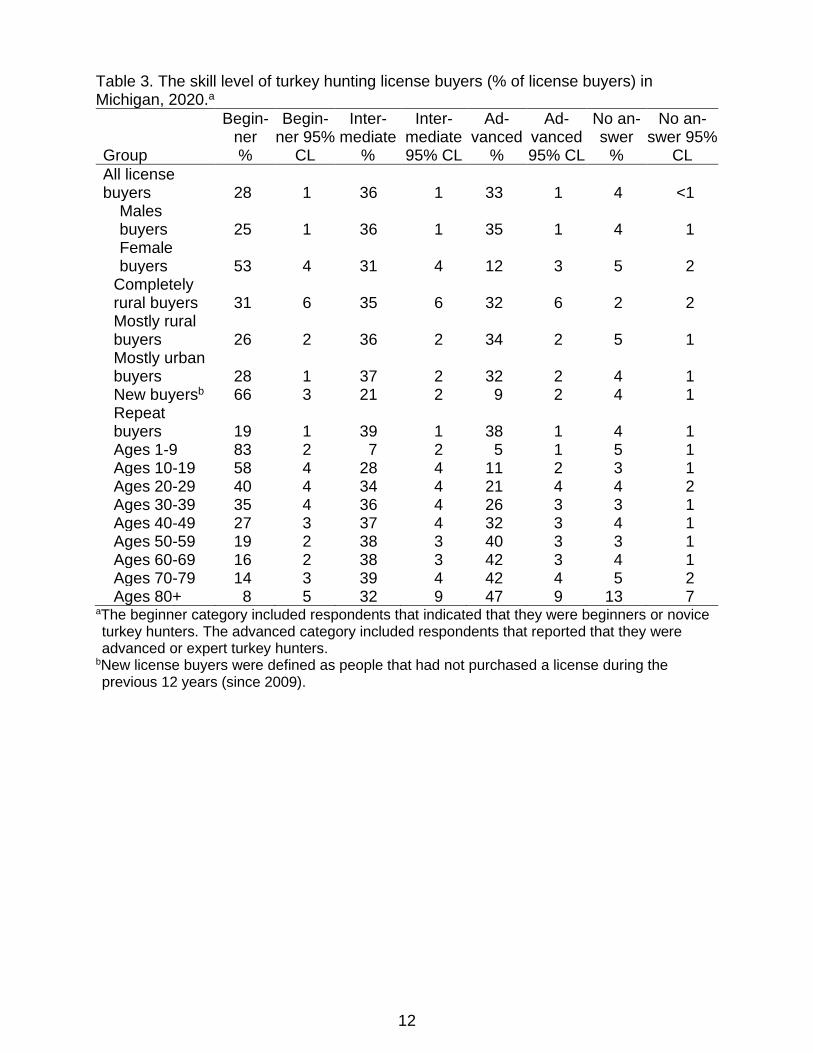
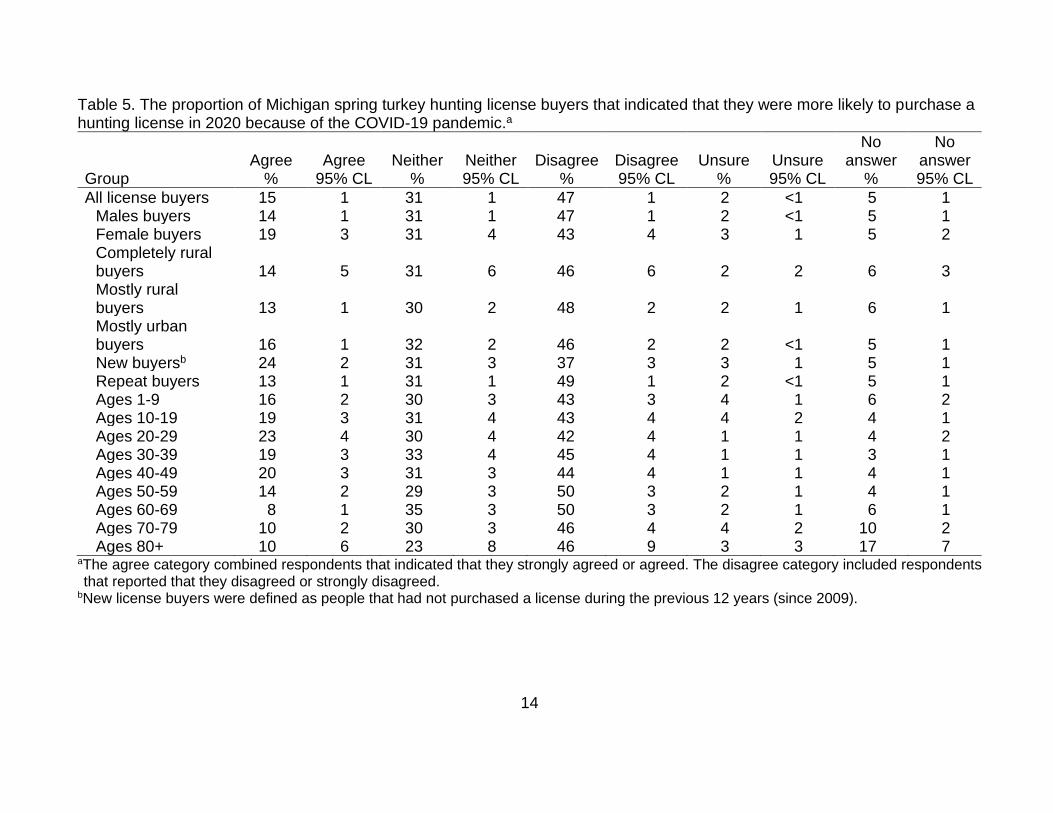
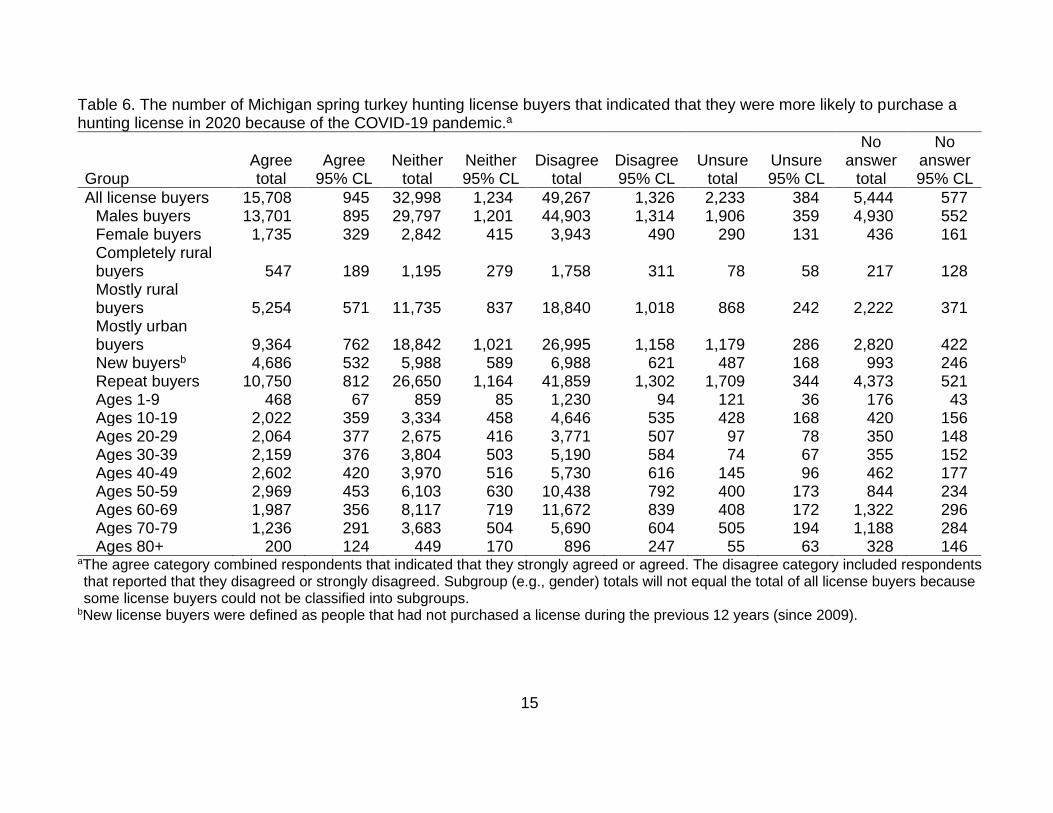
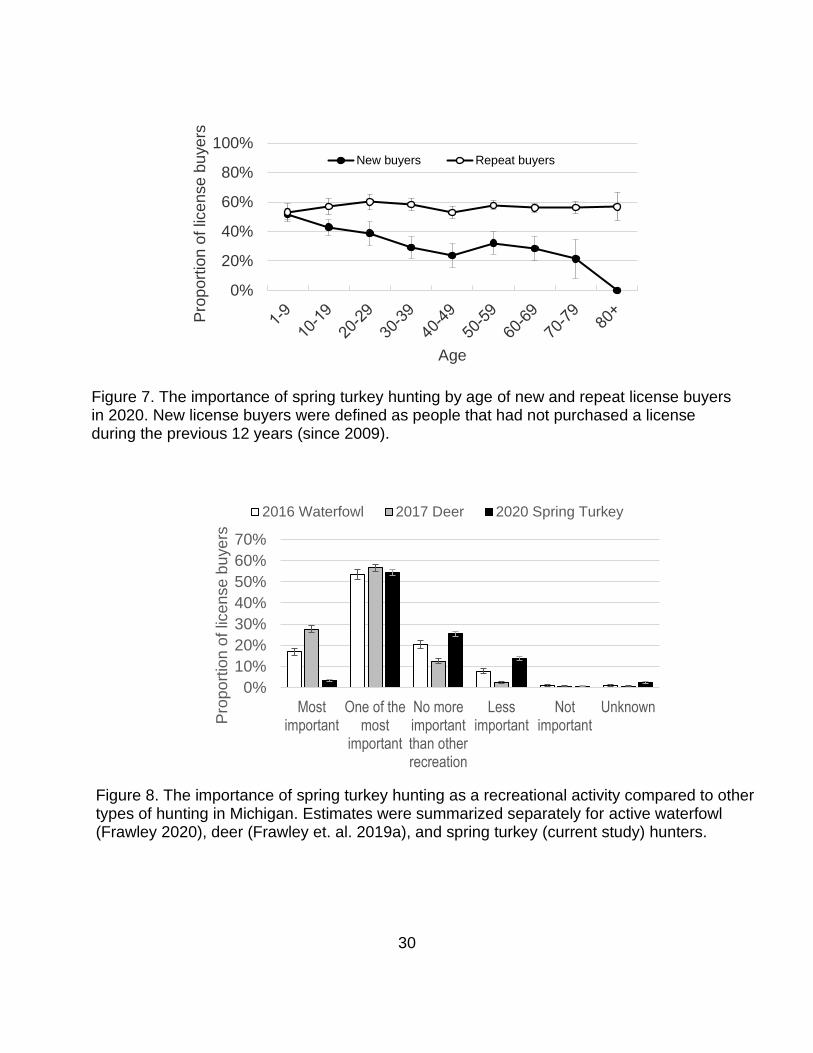
purchased a license since 2009, while 41% of the female license buyers in 2020 had never purchased a license. States adjacent to Michigan also reported an increase in spring turkey hunter numbers in 2020, compared to 2019. Hunter numbers increased 31% in Minnesota (Lyons 2020), 25% in Indiana (National Wild Turkey Federal 2020), and 7% in Ohio (Ohio DNR 2020). Also, Wisconsin hunters obtained 5% more harvest authorizations in 2020 (Wisconsin DNR 2020). Like Michigan, Minnesota and Ohio also reported large increases in participation among youth hunters in 2020. In Minnesota, youth permits increased 132% (Lyons 2020), while Ohio youth permits increased 38% (Ohio DNR 2020). License buyers were asked to indicate how important turkey hunting was to them compared to their other recreational activities (Tables 1 and 2). Overall, 53% of all license buyers rated turkey hunting as very important (i.e., combined respondents that indicated that turkey hunting was their most important recreational activity or one of their most important activities). Turkey hunting was less important among new buyers than repeat buyers. Also, the importance of hunting declined by age among new buyers (Figure 7), while the importance of turkey hunting did not vary by age among repeat buyers. Turkey hunters rated turkey hunting as less important than hunting done by deer and waterfowl hunters (Figure 8). Similarly, Frawley (2006) reported that the proportion of repeat hunting license buyers was highest among deer hunters, suggesting that deer hunting was considered the most important type of hunting in Michigan. License buyers classified themselves into five categories based on their turkey hunting skills: beginner, novice, intermediate, advanced, or expert (Tables 3 and 4). Overall, 28% of all license buyers were rated as beginners (combined beginner and novice ratings). A higher proportion of new buyers and female license buyers considered themselves as beginners than repeat buyers and male buyers. Also, the skill level increased with hunters’ age. License buyers were asked to indicate whether COVID-19 caused them to (1) buy a spring turkey hunting license, (2) spend more time hunting, (3) reduce the distance they traveled to hunt, (4) hunt alone more often, or (5) struggle to locate a hunting area (Tables 5-14). Overall, 39 ± 1% of license buyers (41,023 ± 1,292) strongly agreed or agreed that COVID-19 had caused them to do at least one of these five actions. Many people may have had more time to hunt because some businesses and schools shut down and people often worked from home because of COVID-19. About 15% of license buyers (15,708) indicated that they were more likely to purchase a license in 2020 because of COVID-19 (Tables 5 and 6). The first-time buyers in 2020 were more likely to indicate that they purchased a license because of COVID-19 than repeat buyers (24% versus 13%) (Figure 9). Also, females were more likely to buy a license than males (19% versus 14%), and younger hunters were more likely to buy a license because of COVID-19 than older hunters. The proportion of license buyers that agreed that COVID-19 had made them more likely to buy a license did not differ between rural and urban counties.
6
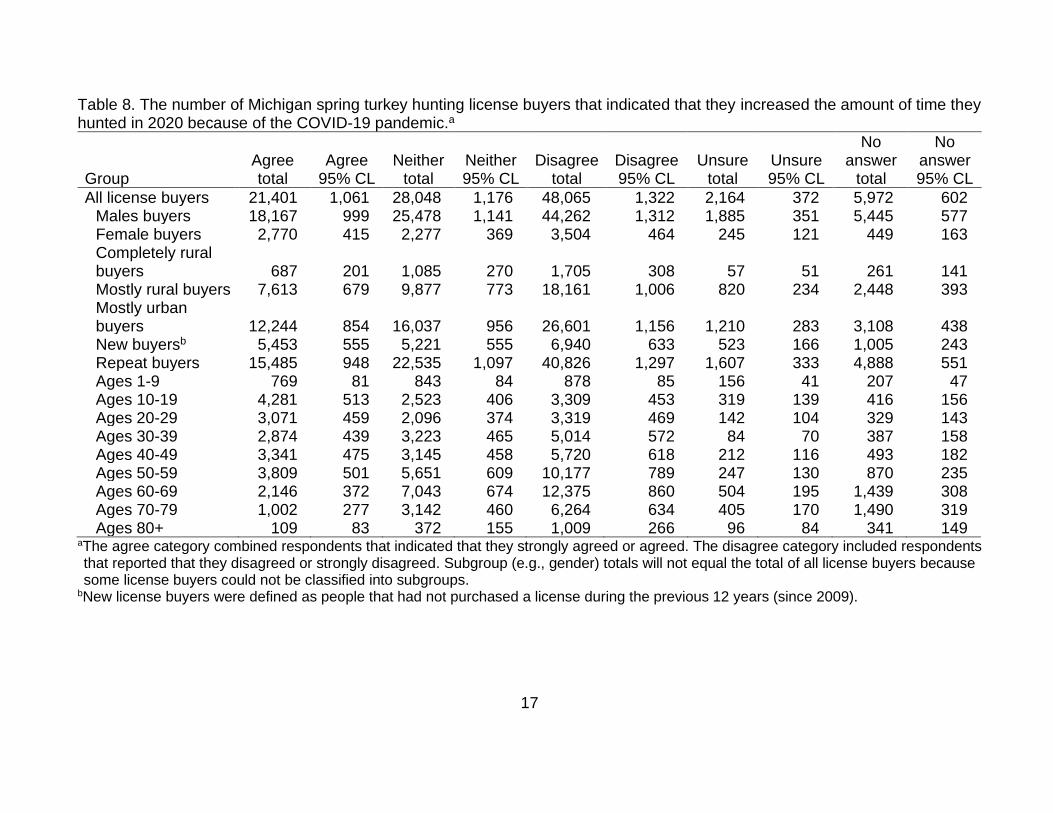
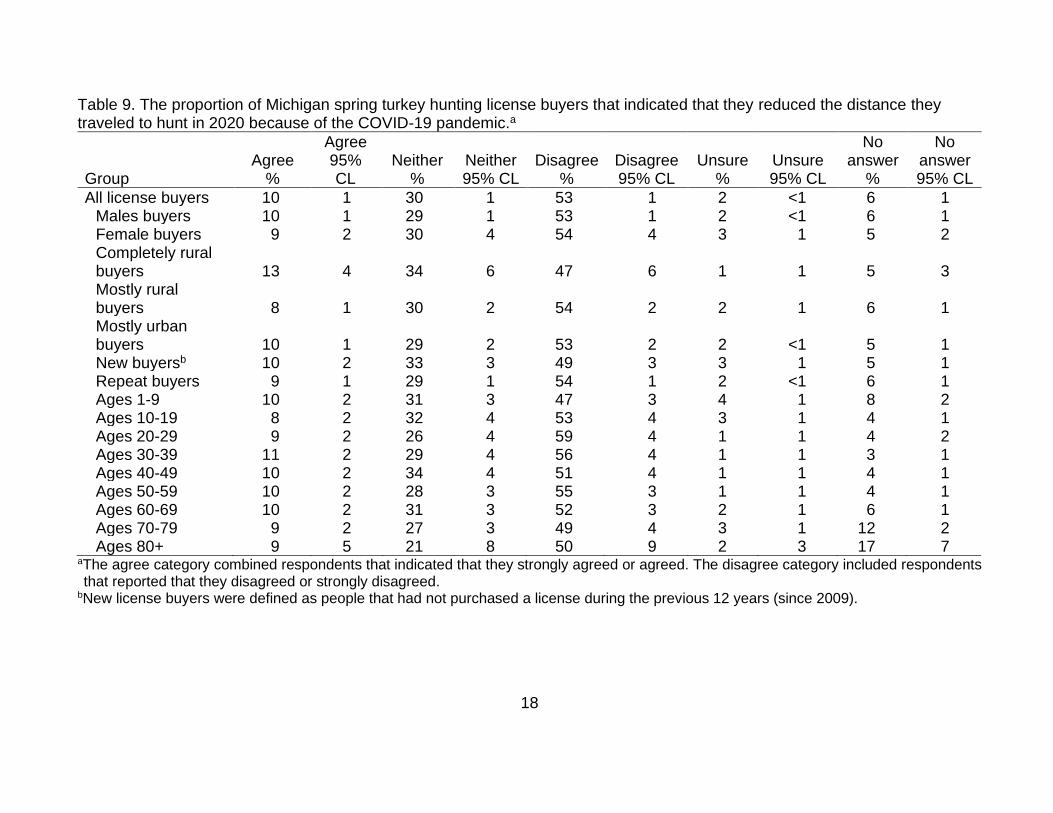
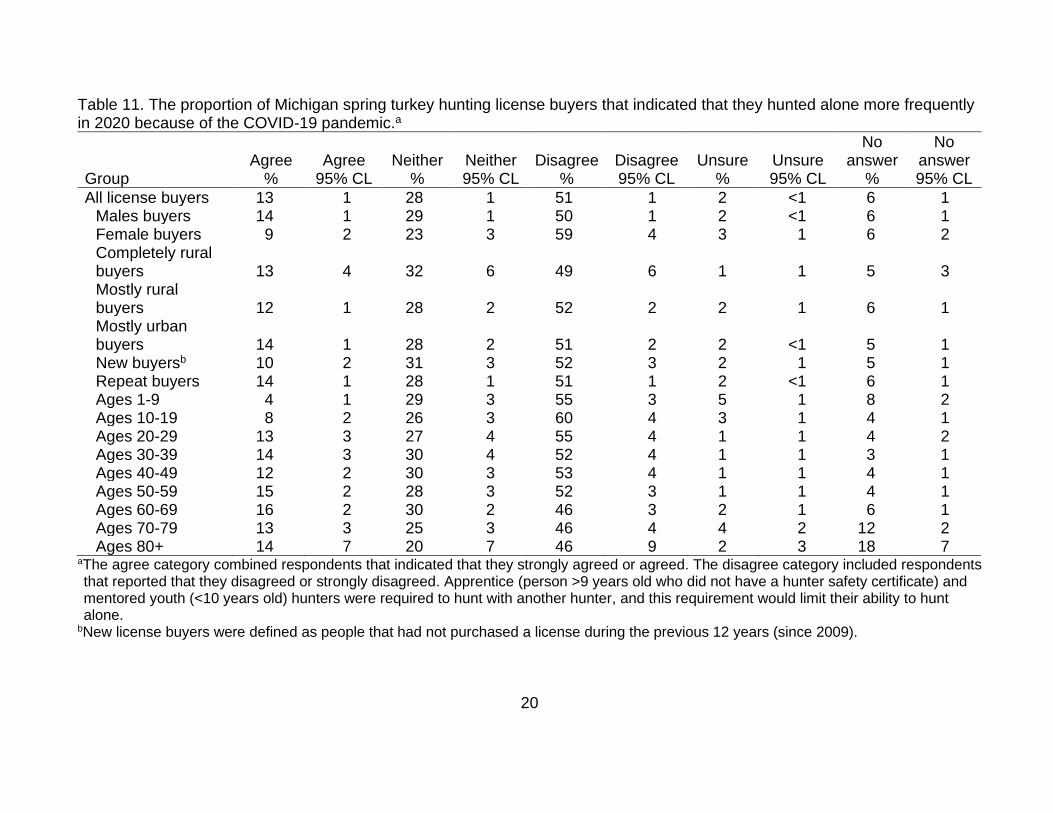
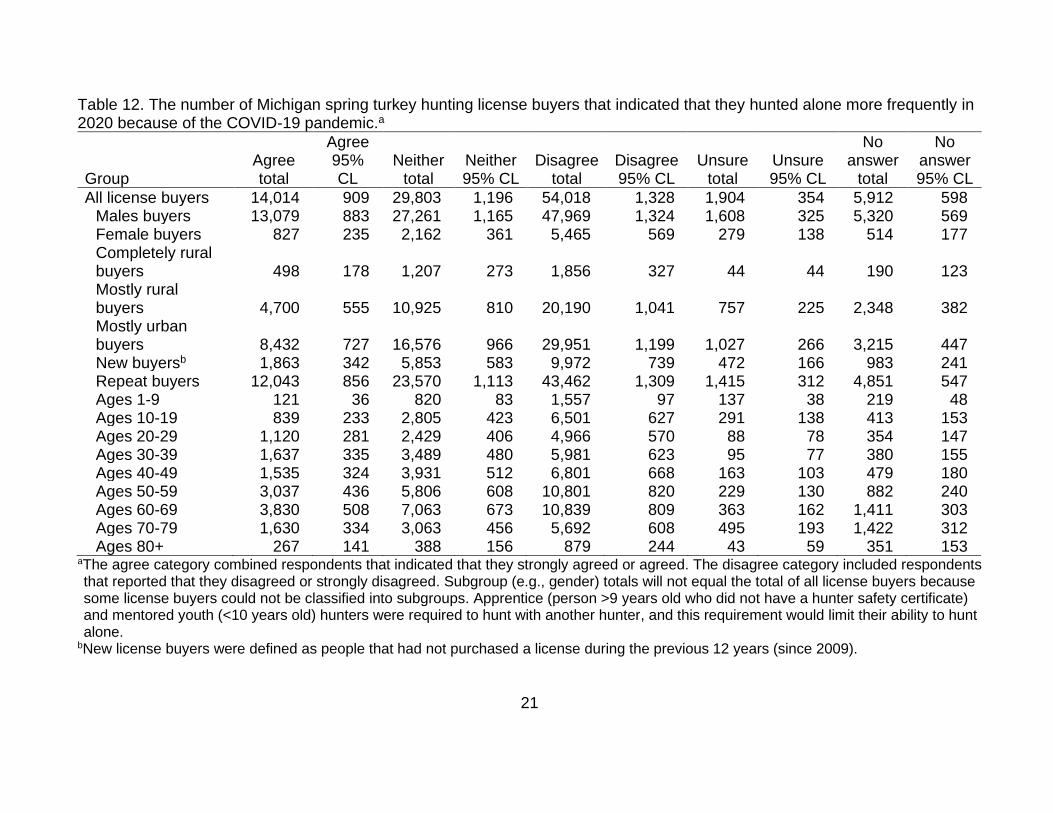
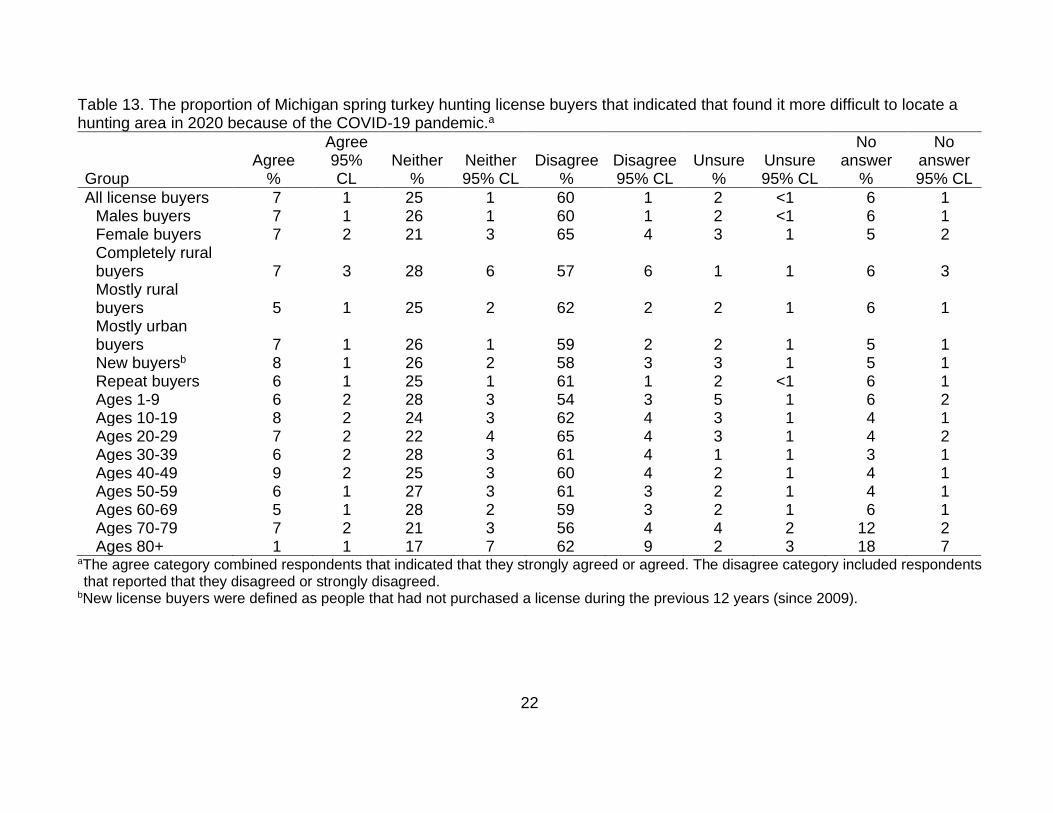
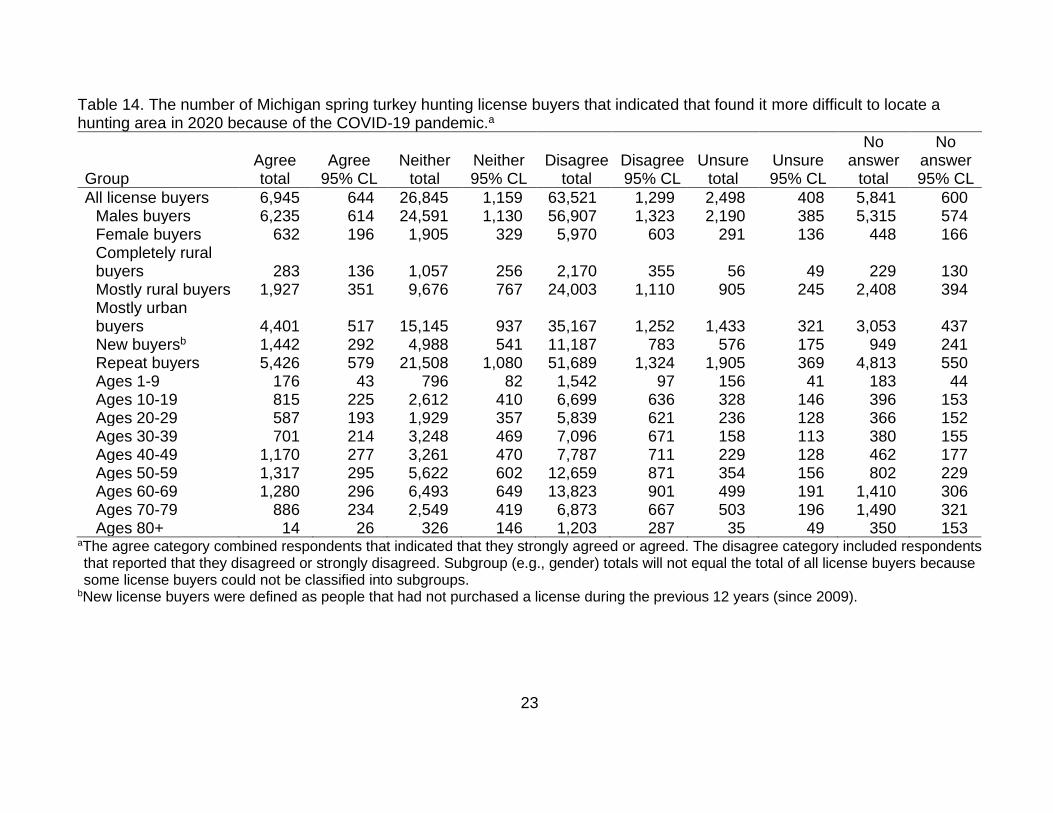
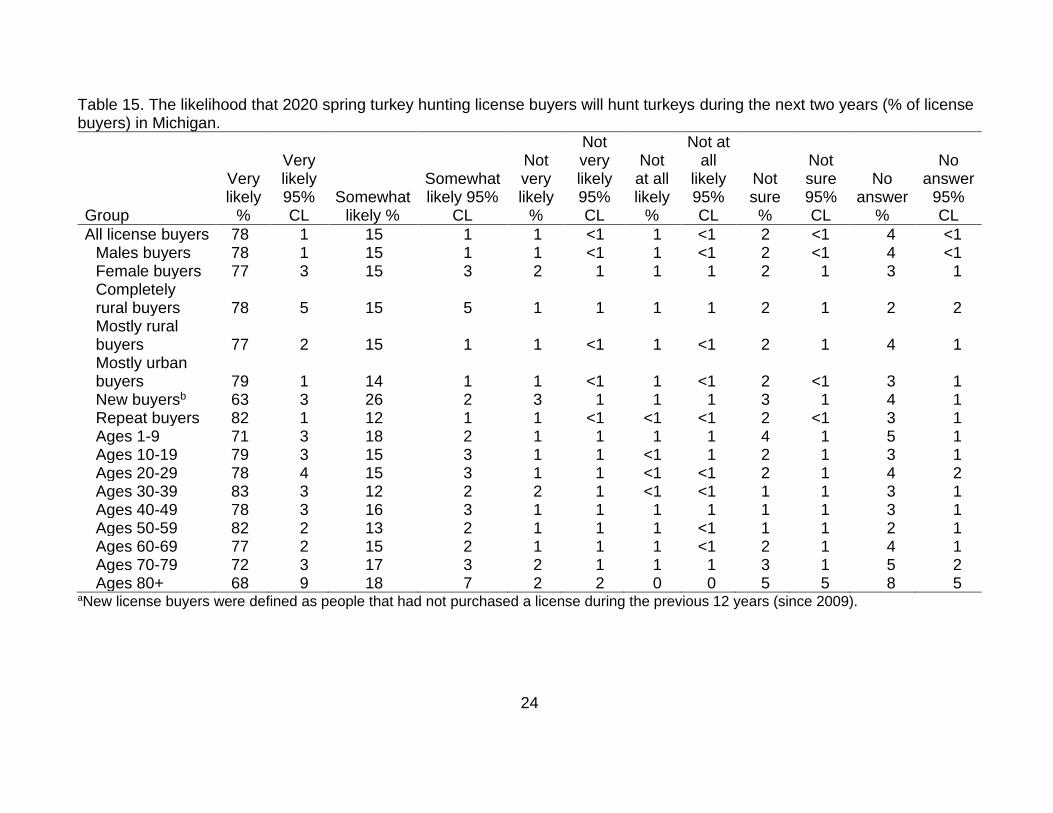
About 20% of license buyers (21,401) indicated that they increased the amount of time they hunted in 2020 because of COVID-19 (Tables 7 and 8). New buyers were more likely to increase their days hunting because of COVID-19 than repeat buyers (28% versus 18%) (Figure 10). Also, females were more likely to increase their hunting effort than males (30% versus 19%), and younger license buyers were more likely to increase their hunting effort than older buyers, regardless of if they were new or repeat buyers (Figure 10). Michigan residents were encouraged to do fewer long-distance trips in 2020 because of COVID-19, and about 10% of license buyers (10,154) indicated that they reduced the distance they traveled to hunt in 2020 (Tables 9 and 10). The proportion of hunters that reduced their traveling was similar among all classes of hunters. Similarly, about 10% of Wisconsin turkey hunters in 2020 reported that their travel was affected by COVID-19 travel restrictions mandated in Wisconsin (Lohr and Dhuey 2020). People were encouraged to keep physical distance between themselves and other people in 2020 because of COVID-19, and about 13% of license buyers (14,014) indicated that they hunted alone more frequently in 2020 because of COVID-19 (Tables 11 and 12). Repeat buyers were slightly more likely to hunt alone because of COVID-19 than new buyers (14% versus 10%). Also, males were slightly more likely to hunt alone than females (14% versus 9%), and older license buyers were more likely to hunt alone than younger buyers. Apprentice (person >9 years old who did not have a hunter safety certificate) and mentored youth (<10 years old) hunters were required to hunt with another hunter, and this requirement would limit their ability to hunt alone. About 7% of license buyers (6,945) indicated that they found it more difficult to locate a hunting area in 2020 because of COVID-19 (Tables 13 and 14). The proportion of hunters that reported it was more difficult to find a hunting area was similar among all classes of hunters. Similarly, about 9% of Wisconsin turkey hunters in 2020 reported that they found it difficult (somewhat difficult and very difficult responses combined) to find a place to hunt in Wisconsin (Lohr and Dhuey 2020). About 78% of license buyers (82,601) indicated they were very likely to hunt turkeys during the next two years (Tables 15 and 16). A higher proportion of repeat buyers planned to hunt again than new buyers (82% versus 63%). Also, the younger license buyers (<60 years old) were more likely to hunt again during the next two years than older buyers. COVID-19 restrictions appeared to have increased the number of people buying hunting licenses in Michigan; however, changes made to hunting regulations also may have affected hunter behavior in 2020. Michigan reported among the highest increase in participation in the Midwest during the spring turkey hunting season in 2020. Michigan implemented significant changes to its regulations in 2020 that may have compounded the increases attributed to COVID-19. The changes made in Michigan included: (1) changing the opening day of all seasons from Monday to Saturday, (2) increasing the season length of Hunt 301 in Unit ZZ from 14 days to 44 days, and (3) reducing the number of quota hunt seasons but increasing the length of most of the remaining quota hunts by 7 to 16 days. Although COVID-19 restrictions likely increased participation in Michigan, many new license buyers may also have been attracted to buy a license

7
because of the new regulations. This may explain why the number of Michigan license buyers in 2020 increased by 27% from 2019, but only 15% of the license buyers reported that they were more likely to purchase a license in 2020 because of COVID-19. Furthermore, few regulation changes were made in Ohio and Wisconsin in 2020, and these states reported more modest increased participation (5-7% increase). This suggests that both regulatory changes and COVID-19 restrictions contributed to the larger gains in participation reported in Michigan. Consequently, a higher proportion of these new hunters may be maintained when COVID-19 restrictions are reduced or eliminated. Beginning in March 2020, COVID-19 regulations forced many people to work remotely. Among Americans that could work remotely, 71% of these people were working from home all or most of the time (Pew Research Center 2020). These COVID-19 regulations may change how work is done in the future. About 54% of workers that could work remotely would prefer to work from home all or most of the time when the coronavirus outbreak is over. Among workers that shifted to remote working, 49% say they had more flexibility to choose when they worked. This flexibility likely allowed more people to pursue recreational activities such as turkey hunting. Maintaining the new license buyers may be a challenge because turkey hunting was less important among new buyers than repeat buyers. Also, a lower proportion of new buyers planned to hunt again than repeat buyers. However, more flexible work schedules may allow many of these new buyers to continue to pursue hunting. The Michigan DNR needs to investigate ways to keep these new license buyers engaged when the coronavirus outbreak is over (Brown 2020). For example, providing new learning opportunities and sending license buyers reminders about upcoming seasons may be effective in retaining more of these new license buyers.
ACKNOWLEDGMENTS I thank all the turkey hunters that provided information. Theresa Riebow completed the data entry. Adam Bump, Mike Donovan, Dustin Isenhoff, and Sara Thompson reviewed a draft version of this report.
LITERATURE CITED Brown, A. 2020. The pandemic created new hunters. states need to keep them. The
Pew Charitable Trusts. Retrieved from https://www.pewtrusts.org/en/research-and-analysis/blogs/stateline/2020/12/14/the-pandemic-created-new-hunters-states-need-to-keep-them
Byrnes, J.P.; Miller, D.C.; Schafer, W.D. 1999, Gender differences in risk taking: A
meta-analysis. Psychology Bulletin 125:367. Cochran, W. G. 1977. Sampling techniques. John Wiley & Sons, New York. USA.
8
Feingold, A. 1994. Gender differences in personality: A meta-analysis. Psychology Bulletin 116:429
Frawley, B. J. 2006. Demographics, recruitment, and retention of Michigan hunters:
2005 update. Wildlife Division Report 3462. Michigan Department of Natural Resources, Lansing, USA.
Frawley, B. J. 2019a. 2018 Michigan chronic wasting disease survey. Wildlife Division
Report 3667. Michigan Department of Natural Resources, Lansing, USA Frawley, B. J. 2019b. 2019 Michigan spring turkey hunter survey. Wildlife Division
Report 3682. Michigan Department of Natural Resources, Lansing, USA. Frawley, B. J. 2020. 2016 waterfowl harvest survey. Wildlife Division Report 3687.
Michigan Department of Natural Resources, Lansing, USA. Frawley, B. J. 2021. 2020 Michigan spring turkey hunter survey. Wildlife Division
Report3698. Michigan Department of Natural Resources, Lansing, USA. Lohr, J. R. and B. Dhuey. 2020. Spring turkey hunting questionnaire 2020. Wisconsin
Department of Natural Resources, Madison, USA. Lyons, T. 2020. Minnesota’s wild turkey harvest – fall 2019, Spring 2020. Minnesota
Department of Natural Resources. St. Paul, USA. Michigan Executive Orders. 2020. 2020 executive orders, Retrieved from
http://www.legislature.mi.gov National Wild Turkey Federal. 2020. 2020 fall hunt guide. Retrieved from
https://www.nwtf.org/hunt/article/2020-fall-hunt-guide Ohio Department of Natural Resources. 2020. 2020 spring wild turkey season results.
Division of Wildlife, Columbus, USA. Payton, M. E., M. H. Greenstone, and N. Schenker. 2003. Overlapping confidence
intervals or standard error intervals: what do they mean in terms of statistical significance? Journal of Insect Science 3:34.
Pew Research Center. 2020. How the coronavirus outbreak has – and hasn’t – changed
the way Americans work. Retrieved from https://www.pewresearch.org/social-trends/wp-content/uploads/sites/3/2020/12/PSDT_12.09.20_covid.work_fullreport.pdf
United States Census Bureau. 2010. 2010 census urban and rural classification and
urban area criteria. United States Census Bureau. Retrieved from https://www.census.gov/programs-surveys/geography/guidance/geo-areas/urban-rural.html
9
Wisconsin Department of Natural Resources. 2020. Preliminary 2020 spring turkey harvest registrations up from 2019 [Press release]. Retrieved from https://dnr.wi.gov/news/releases/
Zhou, F., T. Yu, R. Du, G. Fan, Y. Liu, Z. Liu, and L. Guan. 2020. Clinical course and
risk factors for mortality of adult inpatients with COVID-19 in Wuhan, China: A retrospective cohort study. Lancet 395:1054–1062.
10
Table 1. The importance of turkey hunting as a recreational activity among license buyers (% of license buyers) in Michigan, 2020.a
Group
Very impor-
tant %
Very impor-
tant 95% CL
Moder-ately
impor-tant %
Moder-ately
impor-tant
95% CL
Not impor-tant %
Not impor-
tant 95% CL
No answer
%
No answer Total 95% CL
All license buyers 53 1 26 1 18 1 3 <1
Males buyers 53 1 26 1 18 1 3 <1 Female buyers 52 4 26 4 18 3 3 1
Completely rural buyers 51 6 29 6 18 5 2 2 Mostly rural buyers 51 2 28 2 18 2 3 1 Mostly urban buyers 53 2 25 1 19 1 3 1 New buyersb 36 3 30 3 31 3 2 1 Repeat buyers 57 1 25 1 15 1 3 <1 Ages 1-9 52 3 24 3 21 3 4 1 Ages 10-19 50 4 29 4 19 3 2 1 Ages 20-29 54 4 24 4 19 3 3 1 Ages 30-39 52 4 24 3 21 3 2 1 Ages 40-49 49 4 28 3 21 3 3 1 Ages 50-59 55 3 27 3 16 2 3 1 Ages 60-69 53 3 27 2 17 2 3 1 Ages 70-79 54 4 25 3 16 3 4 1 Ages 80+ 56 9 17 7 18 8 8 5
aThe very important category included respondents that indicated that turkey hunting was their most important recreational activity or one of their most important activities. The moderately important category included people that indicated that turkey hunting was no more important than other activities. The not important category included respondents that indicated that turkey hunting was less important than other recreational activities or not at all important.
bNew license buyers were defined as people that had not purchased a license during the previous 12 years (since 2009).
11
Table 2. The importance of turkey hunting as a recreational activity among license buyers (number of license buyers) in Michigan, 2020.a
Group
Very impor-
tant total
Very impor-
tant 95% CL
Moder-ately
impor-tant total
Moder-ately
impor-tant
95% CL
Not impor-
tant total
Not impor-tant 95% CL
No answer
total
No answer 95% CL
All license buyers 55,844 1,323 27,596 1,168 19,149 1,022 3,061 433
Males buyers 50,364 1,325 24,806 1,130 17,363 987 2,704 408 Female buyers 4,840 543 2,449 386 1,665 317 292 132
Completely rural buyers 1,917 340 1,114 273 682 185 82 71 Mostly rural buyers 20,006 1,041 10,729 799 6,895 656 1,289 282 Mostly urban buyers 31,573 1,213 14,825 927 11,144 824 1,658 324 New buyersb 6,888 607 5,791 588 5,995 601 467 156 Repeat buyers 48,315 1,320 21,464 1,077 13,033 883 2,529 400 Ages 1-9 1,487 97 671 78 589 74 105 34 Ages 10-19 5,468 577 3,124 447 2,011 356 246 121 Ages 20-29 4,859 570 2,146 378 1,705 336 247 123 Ages 30-39 6,068 630 2,795 433 2,453 401 266 127 Ages 40-49 6,262 636 3,554 487 2,727 440 366 160 Ages 50-59 11,349 829 5,510 597 3,360 475 534 179 Ages 60-69 12,570 865 6,367 641 3,941 508 628 205 Ages 70-79 6,692 659 3,089 458 2,009 369 512 186 Ages 80+ 1,089 266 335 144 349 167 155 104
aThe very important category included respondents that indicated that turkey hunting was their most important recreational activity or one of their most important activities. The moderately important category included people that indicated that turkey hunting was no more important than other activities. The not important category included respondents that indicated that turkey hunting was less important than other recreational activities or not at all important. Subgroup (e.g., gender) totals will not equal the total of all license buyers because some license buyers could not be classified into subgroups.
bNew license buyers were defined as people that had not purchased a license during the previous 12 years (since 2009).
12
Table 3. The skill level of turkey hunting license buyers (% of license buyers) in Michigan, 2020.a
Group
Begin-ner %
Begin-ner 95%
CL
Inter-mediate
%
Inter-mediate 95% CL
Ad-vanced
%
Ad-vanced 95% CL
No an-swer
%
No an-swer 95%
CL
All license buyers 28 1 36 1 33 1 4 <1
Males buyers 25 1 36 1 35 1 4 1 Female buyers 53 4 31 4 12 3 5 2
Completely rural buyers 31 6 35 6 32 6 2 2 Mostly rural buyers 26 2 36 2 34 2 5 1 Mostly urban buyers 28 1 37 2 32 2 4 1 New buyersb 66 3 21 2 9 2 4 1 Repeat buyers 19 1 39 1 38 1 4 1 Ages 1-9 83 2 7 2 5 1 5 1 Ages 10-19 58 4 28 4 11 2 3 1 Ages 20-29 40 4 34 4 21 4 4 2 Ages 30-39 35 4 36 4 26 3 3 1 Ages 40-49 27 3 37 4 32 3 4 1 Ages 50-59 19 2 38 3 40 3 3 1 Ages 60-69 16 2 38 3 42 3 4 1 Ages 70-79 14 3 39 4 42 4 5 2 Ages 80+ 8 5 32 9 47 9 13 7
aThe beginner category included respondents that indicated that they were beginners or novice turkey hunters. The advanced category included respondents that reported that they were advanced or expert turkey hunters.
bNew license buyers were defined as people that had not purchased a license during the previous 12 years (since 2009).

13
Table 4. The skill level of turkey hunting license buyers (number of license buyers) in Michigan, 2020.a
Group
Begin-ner total
Begin-ner 95%
CL
Inter-mediate
total
Inter-mediate 95% CL
Ad-vanced
total
Ad-vanced 95% CL
No an-swer total
No an-swer 95%
CL
All license buyers 29,451 1,164 37,606 1,277 34,488 1,246 4,104 512
Males buyers 24,040 1,094 34,405 1,251 33,174 1,234 3,619 481 Female buyers 4,900 523 2,849 432 1,081 269 416 170
Completely rural buyers 1,170 255 1,325 286 1,211 280 88 73 Mostly rural buyers 10,022 758 13,826 904 13,298 885 1,773 345 Mostly urban buyers 16,571 952 21,632 1,079 18,860 1,023 2,138 372 New buyersb 12,628 806 4,009 508 1,806 339 698 208 Repeat buyers 16,311 962 33,245 1,240 32,448 1,227 3,337 466 Ages 1-9 2,369 89 203 46 144 39 137 38 Ages 10-19 6,300 609 3,077 448 1,185 280 288 142 Ages 20-29 3,608 490 3,078 451 1,907 365 365 154 Ages 30-39 4,051 508 4,215 532 2,976 447 340 152 Ages 40-49 3,495 486 4,767 565 4,176 526 472 182 Ages 50-59 3,918 520 7,912 706 8,233 709 690 207 Ages 60-69 3,838 501 8,994 749 9,755 776 919 253 Ages 70-79 1,704 353 4,752 557 5,199 584 648 208 Ages 80+ 161 99 609 202 912 247 246 139
aThe beginner category included respondents that indicated that they were beginners or novice turkey hunters. The advanced category included respondents that reported that they were advanced or expert turkey hunters. Subgroup (e.g., gender) totals will not equal the total of all license buyers because some license buyers could not be classified into subgroups.
bNew license buyers were defined as people that had not purchased a license during the previous 12 years (since 2009).
14
Table 5. The proportion of Michigan spring turkey hunting license buyers that indicated that they were more likely to purchase a hunting license in 2020 because of the COVID-19 pandemic.a
Group Agree
% Agree
95% CL Neither
% Neither 95% CL
Disagree %
Disagree 95% CL
Unsure %
Unsure 95% CL
No answer
%
No answer 95% CL
All license buyers 15 1 31 1 47 1 2 <1 5 1 Males buyers 14 1 31 1 47 1 2 <1 5 1 Female buyers 19 3 31 4 43 4 3 1 5 2 Completely rural buyers 14 5 31 6 46 6 2 2 6 3 Mostly rural buyers 13 1 30 2 48 2 2 1 6 1 Mostly urban buyers 16 1 32 2 46 2 2 <1 5 1 New buyersb 24 2 31 3 37 3 3 1 5 1 Repeat buyers 13 1 31 1 49 1 2 <1 5 1 Ages 1-9 16 2 30 3 43 3 4 1 6 2 Ages 10-19 19 3 31 4 43 4 4 2 4 1 Ages 20-29 23 4 30 4 42 4 1 1 4 2 Ages 30-39 19 3 33 4 45 4 1 1 3 1 Ages 40-49 20 3 31 3 44 4 1 1 4 1 Ages 50-59 14 2 29 3 50 3 2 1 4 1 Ages 60-69 8 1 35 3 50 3 2 1 6 1 Ages 70-79 10 2 30 3 46 4 4 2 10 2 Ages 80+ 10 6 23 8 46 9 3 3 17 7
aThe agree category combined respondents that indicated that they strongly agreed or agreed. The disagree category included respondents that reported that they disagreed or strongly disagreed.
bNew license buyers were defined as people that had not purchased a license during the previous 12 years (since 2009).
15
Table 6. The number of Michigan spring turkey hunting license buyers that indicated that they were more likely to purchase a hunting license in 2020 because of the COVID-19 pandemic.a
Group Agree total
Agree 95% CL
Neither total
Neither 95% CL
Disagree total
Disagree 95% CL
Unsure total
Unsure 95% CL
No answer
total
No answer 95% CL
All license buyers 15,708 945 32,998 1,234 49,267 1,326 2,233 384 5,444 577 Males buyers 13,701 895 29,797 1,201 44,903 1,314 1,906 359 4,930 552 Female buyers 1,735 329 2,842 415 3,943 490 290 131 436 161 Completely rural buyers 547 189 1,195 279 1,758 311 78 58 217 128 Mostly rural buyers 5,254 571 11,735 837 18,840 1,018 868 242 2,222 371 Mostly urban buyers 9,364 762 18,842 1,021 26,995 1,158 1,179 286 2,820 422 New buyersb 4,686 532 5,988 589 6,988 621 487 168 993 246 Repeat buyers 10,750 812 26,650 1,164 41,859 1,302 1,709 344 4,373 521 Ages 1-9 468 67 859 85 1,230 94 121 36 176 43 Ages 10-19 2,022 359 3,334 458 4,646 535 428 168 420 156 Ages 20-29 2,064 377 2,675 416 3,771 507 97 78 350 148 Ages 30-39 2,159 376 3,804 503 5,190 584 74 67 355 152 Ages 40-49 2,602 420 3,970 516 5,730 616 145 96 462 177 Ages 50-59 2,969 453 6,103 630 10,438 792 400 173 844 234 Ages 60-69 1,987 356 8,117 719 11,672 839 408 172 1,322 296 Ages 70-79 1,236 291 3,683 504 5,690 604 505 194 1,188 284 Ages 80+ 200 124 449 170 896 247 55 63 328 146
aThe agree category combined respondents that indicated that they strongly agreed or agreed. The disagree category included respondents that reported that they disagreed or strongly disagreed. Subgroup (e.g., gender) totals will not equal the total of all license buyers because some license buyers could not be classified into subgroups.
bNew license buyers were defined as people that had not purchased a license during the previous 12 years (since 2009).

16
Table 7. The proportion of Michigan spring turkey hunting license buyers that indicated that they increased the amount of time they hunted in 2020 because of the COVID-19 pandemic.a
Group Agree
% Agree
95% CL Neither
% Neither 95% CL
Disagree %
Disagree 95% CL
Unsure %
Unsure 95% CL
No answer
%
No answer 95% CL
All license buyers 20 1 27 1 45 1 2 <1 6 1 Males buyers 19 1 27 1 46 1 2 <1 6 1 Female buyers 30 4 25 4 38 4 3 1 5 2 Completely rural buyers 18 5 29 6 45 6 2 1 7 4 Mostly rural buyers 20 2 25 2 47 2 2 1 6 1 Mostly urban buyers 21 1 27 2 45 2 2 <1 5 1 New buyersb 28 3 27 3 36 3 3 1 5 1 Repeat buyers 18 1 26 1 48 1 2 <1 6 1 Ages 1-9 27 3 30 3 31 3 5 1 7 2 Ages 10-19 39 4 23 3 31 4 3 1 4 1 Ages 20-29 34 4 23 4 37 4 2 1 4 2 Ages 30-39 25 3 28 3 43 4 1 1 3 1 Ages 40-49 26 3 24 3 44 4 2 1 4 1 Ages 50-59 18 2 27 3 49 3 1 1 4 1 Ages 60-69 9 2 30 2 53 3 2 1 6 1 Ages 70-79 8 2 26 3 51 4 3 1 12 2 Ages 80+ 6 4 19 7 52 9 5 4 18 7
aThe agree category combined respondents that indicated that they strongly agreed or agreed. The disagree category included respondents that reported that they disagreed or strongly disagreed.
bNew license buyers were defined as people that had not purchased a license during the previous 12 years (since 2009).
17
Table 8. The number of Michigan spring turkey hunting license buyers that indicated that they increased the amount of time they hunted in 2020 because of the COVID-19 pandemic.a
Group Agree total
Agree 95% CL
Neither total
Neither 95% CL
Disagree total
Disagree 95% CL
Unsure total
Unsure 95% CL
No answer
total
No answer 95% CL
All license buyers 21,401 1,061 28,048 1,176 48,065 1,322 2,164 372 5,972 602 Males buyers 18,167 999 25,478 1,141 44,262 1,312 1,885 351 5,445 577 Female buyers 2,770 415 2,277 369 3,504 464 245 121 449 163 Completely rural buyers 687 201 1,085 270 1,705 308 57 51 261 141 Mostly rural buyers 7,613 679 9,877 773 18,161 1,006 820 234 2,448 393 Mostly urban buyers 12,244 854 16,037 956 26,601 1,156 1,210 283 3,108 438 New buyersb 5,453 555 5,221 555 6,940 633 523 166 1,005 243 Repeat buyers 15,485 948 22,535 1,097 40,826 1,297 1,607 333 4,888 551 Ages 1-9 769 81 843 84 878 85 156 41 207 47 Ages 10-19 4,281 513 2,523 406 3,309 453 319 139 416 156 Ages 20-29 3,071 459 2,096 374 3,319 469 142 104 329 143 Ages 30-39 2,874 439 3,223 465 5,014 572 84 70 387 158 Ages 40-49 3,341 475 3,145 458 5,720 618 212 116 493 182 Ages 50-59 3,809 501 5,651 609 10,177 789 247 130 870 235 Ages 60-69 2,146 372 7,043 674 12,375 860 504 195 1,439 308 Ages 70-79 1,002 277 3,142 460 6,264 634 405 170 1,490 319 Ages 80+ 109 83 372 155 1,009 266 96 84 341 149
aThe agree category combined respondents that indicated that they strongly agreed or agreed. The disagree category included respondents that reported that they disagreed or strongly disagreed. Subgroup (e.g., gender) totals will not equal the total of all license buyers because some license buyers could not be classified into subgroups.
bNew license buyers were defined as people that had not purchased a license during the previous 12 years (since 2009).
18
Table 9. The proportion of Michigan spring turkey hunting license buyers that indicated that they reduced the distance they traveled to hunt in 2020 because of the COVID-19 pandemic.a
Group Agree
%
Agree 95% CL
Neither %
Neither 95% CL
Disagree %
Disagree 95% CL
Unsure %
Unsure 95% CL
No answer
%
No answer 95% CL
All license buyers 10 1 30 1 53 1 2 <1 6 1 Males buyers 10 1 29 1 53 1 2 <1 6 1 Female buyers 9 2 30 4 54 4 3 1 5 2 Completely rural buyers 13 4 34 6 47 6 1 1 5 3 Mostly rural buyers 8 1 30 2 54 2 2 1 6 1 Mostly urban buyers 10 1 29 2 53 2 2 <1 5 1 New buyersb 10 2 33 3 49 3 3 1 5 1 Repeat buyers 9 1 29 1 54 1 2 <1 6 1 Ages 1-9 10 2 31 3 47 3 4 1 8 2 Ages 10-19 8 2 32 4 53 4 3 1 4 1 Ages 20-29 9 2 26 4 59 4 1 1 4 2 Ages 30-39 11 2 29 4 56 4 1 1 3 1 Ages 40-49 10 2 34 4 51 4 1 1 4 1 Ages 50-59 10 2 28 3 55 3 1 1 4 1 Ages 60-69 10 2 31 3 52 3 2 1 6 1 Ages 70-79 9 2 27 3 49 4 3 1 12 2 Ages 80+ 9 5 21 8 50 9 2 3 17 7
aThe agree category combined respondents that indicated that they strongly agreed or agreed. The disagree category included respondents that reported that they disagreed or strongly disagreed.
bNew license buyers were defined as people that had not purchased a license during the previous 12 years (since 2009).
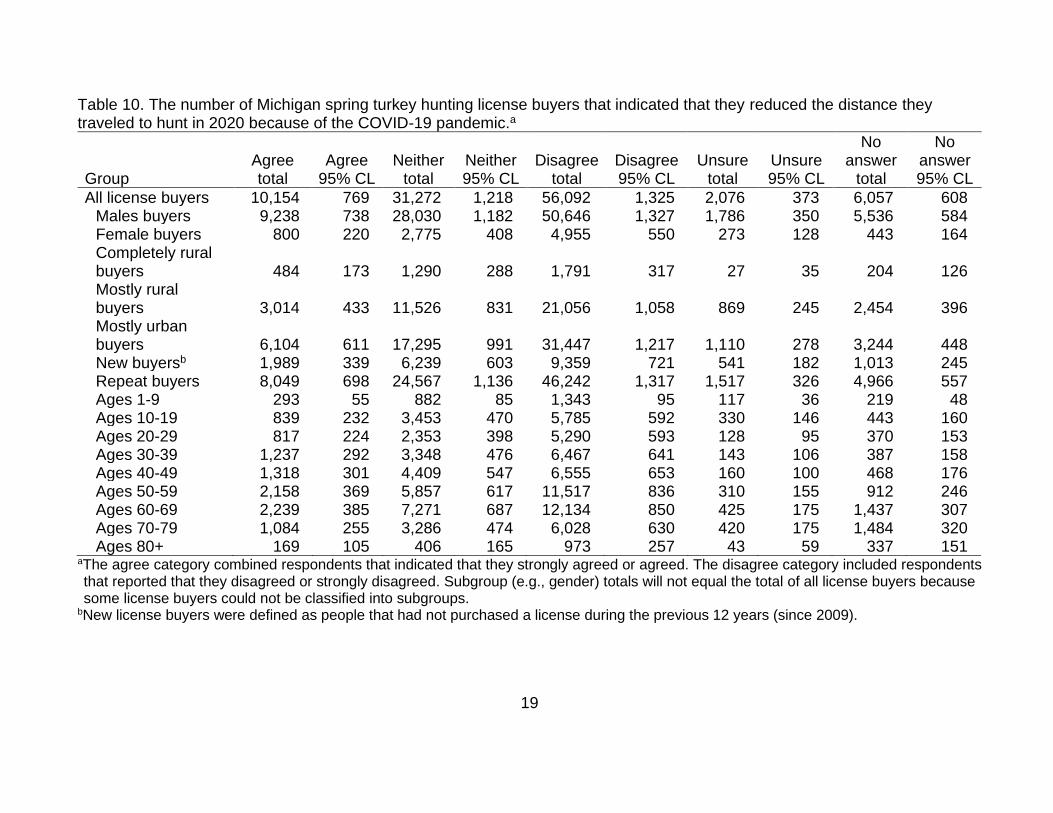
19
Table 10. The number of Michigan spring turkey hunting license buyers that indicated that they reduced the distance they traveled to hunt in 2020 because of the COVID-19 pandemic.a
Group Agree total
Agree 95% CL
Neither total
Neither 95% CL
Disagree total
Disagree 95% CL
Unsure total
Unsure 95% CL
No answer
total
No answer 95% CL
All license buyers 10,154 769 31,272 1,218 56,092 1,325 2,076 373 6,057 608 Males buyers 9,238 738 28,030 1,182 50,646 1,327 1,786 350 5,536 584 Female buyers 800 220 2,775 408 4,955 550 273 128 443 164 Completely rural buyers 484 173 1,290 288 1,791 317 27 35 204 126 Mostly rural buyers 3,014 433 11,526 831 21,056 1,058 869 245 2,454 396 Mostly urban buyers 6,104 611 17,295 991 31,447 1,217 1,110 278 3,244 448 New buyersb 1,989 339 6,239 603 9,359 721 541 182 1,013 245 Repeat buyers 8,049 698 24,567 1,136 46,242 1,317 1,517 326 4,966 557 Ages 1-9 293 55 882 85 1,343 95 117 36 219 48 Ages 10-19 839 232 3,453 470 5,785 592 330 146 443 160 Ages 20-29 817 224 2,353 398 5,290 593 128 95 370 153 Ages 30-39 1,237 292 3,348 476 6,467 641 143 106 387 158 Ages 40-49 1,318 301 4,409 547 6,555 653 160 100 468 176 Ages 50-59 2,158 369 5,857 617 11,517 836 310 155 912 246 Ages 60-69 2,239 385 7,271 687 12,134 850 425 175 1,437 307 Ages 70-79 1,084 255 3,286 474 6,028 630 420 175 1,484 320 Ages 80+ 169 105 406 165 973 257 43 59 337 151
aThe agree category combined respondents that indicated that they strongly agreed or agreed. The disagree category included respondents that reported that they disagreed or strongly disagreed. Subgroup (e.g., gender) totals will not equal the total of all license buyers because some license buyers could not be classified into subgroups.
bNew license buyers were defined as people that had not purchased a license during the previous 12 years (since 2009).
20
Table 11. The proportion of Michigan spring turkey hunting license buyers that indicated that they hunted alone more frequently in 2020 because of the COVID-19 pandemic.a
Group Agree
% Agree
95% CL Neither
% Neither 95% CL
Disagree %
Disagree 95% CL
Unsure %
Unsure 95% CL
No answer
%
No answer 95% CL
All license buyers 13 1 28 1 51 1 2 <1 6 1 Males buyers 14 1 29 1 50 1 2 <1 6 1 Female buyers 9 2 23 3 59 4 3 1 6 2 Completely rural buyers 13 4 32 6 49 6 1 1 5 3 Mostly rural buyers 12 1 28 2 52 2 2 1 6 1 Mostly urban buyers 14 1 28 2 51 2 2 <1 5 1 New buyersb 10 2 31 3 52 3 2 1 5 1 Repeat buyers 14 1 28 1 51 1 2 <1 6 1 Ages 1-9 4 1 29 3 55 3 5 1 8 2 Ages 10-19 8 2 26 3 60 4 3 1 4 1 Ages 20-29 13 3 27 4 55 4 1 1 4 2 Ages 30-39 14 3 30 4 52 4 1 1 3 1 Ages 40-49 12 2 30 3 53 4 1 1 4 1 Ages 50-59 15 2 28 3 52 3 1 1 4 1 Ages 60-69 16 2 30 2 46 3 2 1 6 1 Ages 70-79 13 3 25 3 46 4 4 2 12 2 Ages 80+ 14 7 20 7 46 9 2 3 18 7
aThe agree category combined respondents that indicated that they strongly agreed or agreed. The disagree category included respondents that reported that they disagreed or strongly disagreed. Apprentice (person >9 years old who did not have a hunter safety certificate) and mentored youth (<10 years old) hunters were required to hunt with another hunter, and this requirement would limit their ability to hunt alone.
bNew license buyers were defined as people that had not purchased a license during the previous 12 years (since 2009).
21
Table 12. The number of Michigan spring turkey hunting license buyers that indicated that they hunted alone more frequently in 2020 because of the COVID-19 pandemic.a
Group Agree total
Agree 95% CL
Neither total
Neither 95% CL
Disagree total
Disagree 95% CL
Unsure total
Unsure 95% CL
No answer
total
No answer 95% CL
All license buyers 14,014 909 29,803 1,196 54,018 1,328 1,904 354 5,912 598 Males buyers 13,079 883 27,261 1,165 47,969 1,324 1,608 325 5,320 569 Female buyers 827 235 2,162 361 5,465 569 279 138 514 177 Completely rural buyers 498 178 1,207 273 1,856 327 44 44 190 123 Mostly rural buyers 4,700 555 10,925 810 20,190 1,041 757 225 2,348 382 Mostly urban buyers 8,432 727 16,576 966 29,951 1,199 1,027 266 3,215 447 New buyersb 1,863 342 5,853 583 9,972 739 472 166 983 241 Repeat buyers 12,043 856 23,570 1,113 43,462 1,309 1,415 312 4,851 547 Ages 1-9 121 36 820 83 1,557 97 137 38 219 48 Ages 10-19 839 233 2,805 423 6,501 627 291 138 413 153 Ages 20-29 1,120 281 2,429 406 4,966 570 88 78 354 147 Ages 30-39 1,637 335 3,489 480 5,981 623 95 77 380 155 Ages 40-49 1,535 324 3,931 512 6,801 668 163 103 479 180 Ages 50-59 3,037 436 5,806 608 10,801 820 229 130 882 240 Ages 60-69 3,830 508 7,063 673 10,839 809 363 162 1,411 303 Ages 70-79 1,630 334 3,063 456 5,692 608 495 193 1,422 312 Ages 80+ 267 141 388 156 879 244 43 59 351 153
aThe agree category combined respondents that indicated that they strongly agreed or agreed. The disagree category included respondents that reported that they disagreed or strongly disagreed. Subgroup (e.g., gender) totals will not equal the total of all license buyers because some license buyers could not be classified into subgroups. Apprentice (person >9 years old who did not have a hunter safety certificate) and mentored youth (<10 years old) hunters were required to hunt with another hunter, and this requirement would limit their ability to hunt alone.
bNew license buyers were defined as people that had not purchased a license during the previous 12 years (since 2009).
22
Table 13. The proportion of Michigan spring turkey hunting license buyers that indicated that found it more difficult to locate a hunting area in 2020 because of the COVID-19 pandemic.a
Group Agree
%
Agree 95% CL
Neither %
Neither 95% CL
Disagree %
Disagree 95% CL
Unsure %
Unsure 95% CL
No answer
%
No answer 95% CL
All license buyers 7 1 25 1 60 1 2 <1 6 1 Males buyers 7 1 26 1 60 1 2 <1 6 1 Female buyers 7 2 21 3 65 4 3 1 5 2 Completely rural buyers 7 3 28 6 57 6 1 1 6 3 Mostly rural buyers 5 1 25 2 62 2 2 1 6 1 Mostly urban buyers 7 1 26 1 59 2 2 1 5 1 New buyersb 8 1 26 2 58 3 3 1 5 1 Repeat buyers 6 1 25 1 61 1 2 <1 6 1 Ages 1-9 6 2 28 3 54 3 5 1 6 2 Ages 10-19 8 2 24 3 62 4 3 1 4 1 Ages 20-29 7 2 22 4 65 4 3 1 4 2 Ages 30-39 6 2 28 3 61 4 1 1 3 1 Ages 40-49 9 2 25 3 60 4 2 1 4 1 Ages 50-59 6 1 27 3 61 3 2 1 4 1 Ages 60-69 5 1 28 2 59 3 2 1 6 1 Ages 70-79 7 2 21 3 56 4 4 2 12 2 Ages 80+ 1 1 17 7 62 9 2 3 18 7
aThe agree category combined respondents that indicated that they strongly agreed or agreed. The disagree category included respondents that reported that they disagreed or strongly disagreed.
bNew license buyers were defined as people that had not purchased a license during the previous 12 years (since 2009).
23
Table 14. The number of Michigan spring turkey hunting license buyers that indicated that found it more difficult to locate a hunting area in 2020 because of the COVID-19 pandemic.a
Group Agree total
Agree 95% CL
Neither total
Neither 95% CL
Disagree total
Disagree 95% CL
Unsure total
Unsure 95% CL
No answer
total
No answer 95% CL
All license buyers 6,945 644 26,845 1,159 63,521 1,299 2,498 408 5,841 600 Males buyers 6,235 614 24,591 1,130 56,907 1,323 2,190 385 5,315 574 Female buyers 632 196 1,905 329 5,970 603 291 136 448 166 Completely rural buyers 283 136 1,057 256 2,170 355 56 49 229 130 Mostly rural buyers 1,927 351 9,676 767 24,003 1,110 905 245 2,408 394 Mostly urban buyers 4,401 517 15,145 937 35,167 1,252 1,433 321 3,053 437 New buyersb 1,442 292 4,988 541 11,187 783 576 175 949 241 Repeat buyers 5,426 579 21,508 1,080 51,689 1,324 1,905 369 4,813 550 Ages 1-9 176 43 796 82 1,542 97 156 41 183 44 Ages 10-19 815 225 2,612 410 6,699 636 328 146 396 153 Ages 20-29 587 193 1,929 357 5,839 621 236 128 366 152 Ages 30-39 701 214 3,248 469 7,096 671 158 113 380 155 Ages 40-49 1,170 277 3,261 470 7,787 711 229 128 462 177 Ages 50-59 1,317 295 5,622 602 12,659 871 354 156 802 229 Ages 60-69 1,280 296 6,493 649 13,823 901 499 191 1,410 306 Ages 70-79 886 234 2,549 419 6,873 667 503 196 1,490 321 Ages 80+ 14 26 326 146 1,203 287 35 49 350 153
aThe agree category combined respondents that indicated that they strongly agreed or agreed. The disagree category included respondents that reported that they disagreed or strongly disagreed. Subgroup (e.g., gender) totals will not equal the total of all license buyers because some license buyers could not be classified into subgroups.
bNew license buyers were defined as people that had not purchased a license during the previous 12 years (since 2009).
24
Table 15. The likelihood that 2020 spring turkey hunting license buyers will hunt turkeys during the next two years (% of license buyers) in Michigan.
Group
Very likely
%
Very likely 95% CL
Somewhat likely %
Somewhat likely 95%
CL
Not very likely
%
Not very likely 95% CL
Not at all likely
%
Not at all
likely 95% CL
Not sure %
Not sure 95% CL
No answer
%
No answer
95% CL
All license buyers 78 1 15 1 1 <1 1 <1 2 <1 4 <1 Males buyers 78 1 15 1 1 <1 1 <1 2 <1 4 <1 Female buyers 77 3 15 3 2 1 1 1 2 1 3 1 Completely rural buyers 78 5 15 5 1 1 1 1 2 1 2 2 Mostly rural buyers 77 2 15 1 1 <1 1 <1 2 1 4 1 Mostly urban buyers 79 1 14 1 1 <1 1 <1 2 <1 3 1 New buyersb 63 3 26 2 3 1 1 1 3 1 4 1 Repeat buyers 82 1 12 1 1 <1 <1 <1 2 <1 3 1 Ages 1-9 71 3 18 2 1 1 1 1 4 1 5 1 Ages 10-19 79 3 15 3 1 1 <1 1 2 1 3 1 Ages 20-29 78 4 15 3 1 1 <1 <1 2 1 4 2 Ages 30-39 83 3 12 2 2 1 <1 <1 1 1 3 1 Ages 40-49 78 3 16 3 1 1 1 1 1 1 3 1 Ages 50-59 82 2 13 2 1 1 1 <1 1 1 2 1 Ages 60-69 77 2 15 2 1 1 1 <1 2 1 4 1 Ages 70-79 72 3 17 3 2 1 1 1 3 1 5 2 Ages 80+ 68 9 18 7 2 2 0 0 5 5 8 5
aNew license buyers were defined as people that had not purchased a license during the previous 12 years (since 2009).

25
Table 16. The likelihood that 2020 spring turkey hunting license buyers will hunt turkeys during the next two years (number of license buyers) in Michigan.a
Group
Very likely total
Very likely 95% CL
Somewhat likely total
Somewhat likely
95% CL
Not very likely total
Not very likely
95% CL
Not at all likely total
Not at all likely 95% CL
Not sure total
Not sure 95% CL
No answ
er total
No answer
95% CL
All license buyers 82,601 1,089 15,414 933 1,310 290 583 191 2,014 359 3,729 486 Males buyers 74,558 1,200 13,848 894 1,166 277 514 180 1,807 347 3,344 464 Female buyers 7,162 654 1,391 290 144 87 65 64 174 84 310 132 Completely rural buyers 2,958 417 572 186 53 50 40 43 78 57 94 89 Mostly rural buyers 29,862 1,193 5,987 611 471 170 202 108 883 244 1,513 313 Mostly urban buyers 47,032 1,314 8,149 704 707 223 325 151 927 247 2,061 363 New buyersb 12,042 802 4,887 541 579 192 264 126 628 195 742 213 Repeat buyers 69,678 1,237 10,352 793 730 218 315 144 1,353 300 2,913 434 Ages 1-9 2,014 96 507 69 27 17 31 19 125 37 148 40 Ages 10-19 8,534 716 1,607 308 118 83 36 63 240 124 315 139 Ages 20-29 7,000 675 1,315 294 83 72 27 35 183 112 351 149 Ages 30-39 9,600 774 1,367 305 178 105 28 33 74 63 336 151 Ages 40-49 10,054 794 2,106 384 130 90 70 69 147 95 403 167 Ages 50-59 16,993 986 2,667 419 215 118 129 83 253 133 497 174 Ages 60-69 18,199 1,008 3,454 480 290 153 186 112 470 179 907 254 Ages 70-79 8,899 752 2,048 369 235 118 76 77 418 175 625 212 Ages 80+ 1,304 290 342 161 34 46 0 0 101 92 147 100
aSubgroup (e.g., gender) totals will not equal the total of all license buyers because some license buyers could not be classified into subgroups.
bNew license buyers were defined as people that had not purchased a license during the previous 12 years (since 2009).
26
0
20,000
40,000
60,000
80,000
100,000
120,000
140,000
1970
1973
1976
1979
1982
1985
1988
1991
1994
1997
2000
2003
2006
2009
2012
2015
2018
Num
be
r o
f lic
en
se
bu
ye
rs a
nd
h
un
ters
Year
License buyers Estimated hunters
Figure 1. The number of spring turkey hunting license buyers, and the estimated number of buyers that hunted turkeys in Michigan, 1970-2020. Estimates of active hunters were derived from annual harvest survey completed after the hunting seasons had ended (e.g., Frawley 2021).
-400
-200
0
200
400
600
800
1 61
11
62
12
63
13
64
14
65
15
66
16
67
17
68
18
69
19
6
Diffe
ren
ce
be
twe
en
2
02
0 a
nd
20
19
Age
Figure 2. The difference in the number of spring turkey hunting license buyers in 2020 versus 2019, summarized by age.

27
0%
5%
10%
15%
20%
25%
30%
1 2 3 4 5 6 7 8 9 10 11 12
20
20
lic
en
se
bu
ye
rs (
%)
Years licenses purchased
Figure 3. The number of years that 2020 spring turkey hunting license buyers had purchased a license in Michigan, 2009-2020.
0%
10%
20%
30%
40%
50%
60%
70%
80%
Lic
en
se
bu
ye
rs (
%)
Year
New buyers Repeat buyers
Figure 4. The proportion of new and repeat license buyers in Michigan during 2010-2020. New license buyers were defined as the proportion of buyers in a year that had not purchased a license in the previous year. Repeat license buyers was defined as the proportion of buyers in a year that also purchased a license in the next year.
28
0
500
1,000
1,500
2,000
1 61
11
62
12
63
13
64
14
65
15
66
16
67
17
68
18
69
19
6
20
19
lic
en
se
bu
ye
rs (
No.)
Age
2019
New buyers Repeat buyers
0
500
1,000
1,500
2,000
1 61
11
62
12
63
13
64
14
65
15
66
16
67
17
68
18
69
19
6
20
20
lic
en
se
bu
ye
rs (
No.)
Age
2020
New buyers Repeat buyers
Figure 5. The number of new and repeat license buyers by age in 2019 (top) and 2020 (bottom). New license buyers were defined as people that had not purchased a license during the previous 12 years (since 2009).

29
0
200
400
600
800
1,000
1,200
1,400
1,600
1,800
1 61
11
62
12
63
13
64
14
65
15
66
16
67
17
68
18
69
19
6
20
20
lic
en
se
bu
ye
rs (
No.)
Age
New buyers - males Repeat buyers - males
0
50
100
150
200
250
1 6
11
16
21
26
31
36
41
46
51
56
61
66
71
76
81
86
91
96
20
20
lic
en
se
bu
ye
rs (
No.)
Age
New buyers - females Repeat buyers - females
Figure 6. The number of new and repeat license buyers for males (top) and females (bottom) by age in 2020. New license buyers were defined as people that had not purchased a license during the previous 12 years (since 2009).
30
0%
20%
40%
60%
80%
100%
Pro
po
rtio
n o
f lic
en
se
bu
ye
rs
Age
New buyers Repeat buyers
Figure 7. The importance of spring turkey hunting by age of new and repeat license buyers in 2020. New license buyers were defined as people that had not purchased a license during the previous 12 years (since 2009).
Figure 8. The importance of spring turkey hunting as a recreational activity compared to other types of hunting in Michigan. Estimates were summarized separately for active waterfowl (Frawley 2020), deer (Frawley et. al. 2019a), and spring turkey (current study) hunters.
0%
10%
20%
30%
40%
50%
60%
70%
Mostimportant
One of themost
important
No moreimportantthan otherrecreation
Lessimportant
Notimportant
Unknown
Pro
po
rtio
n o
f lic
en
se
bu
ye
rs
2016 Waterfowl 2017 Deer 2020 Spring Turkey

31
0%
10%
20%
30%
40%
50%
60%
Pro
po
rtio
n o
f lic
en
se
bu
ye
rs
Age
New buyers
Repeat buyers
0%5%
10%15%20%25%30%35%40%45%50%
Pro
po
rtio
n o
f lic
en
se
bu
ye
rs
Age
New buyers
Repeat buyers
Figure 9. The proportion of 2020 license buyers that agreed that they were more likely to purchase a license because of COVID-19. Estimates provided separately for age and license buyer type (new versus repeat). New license buyers were defined as people that had not purchased a license during the previous 12 years (since 2009).
Figure 10. The proportion of 2020 license buyers that agreed that they had hunted more because of COVID-19. Estimates provided separately for age and license buyer type (new versus repeat). New license buyers were defined as people that had not purchased a license during the previous 12 years (since 2009).

32
APPENDIX A
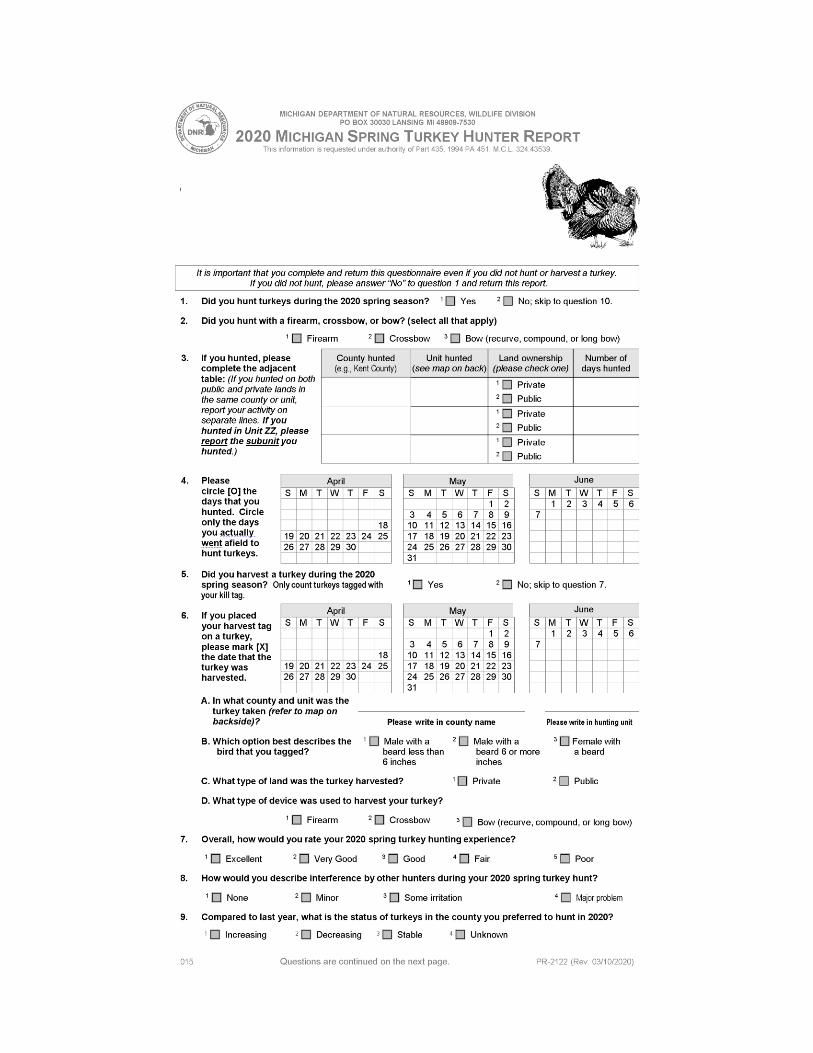
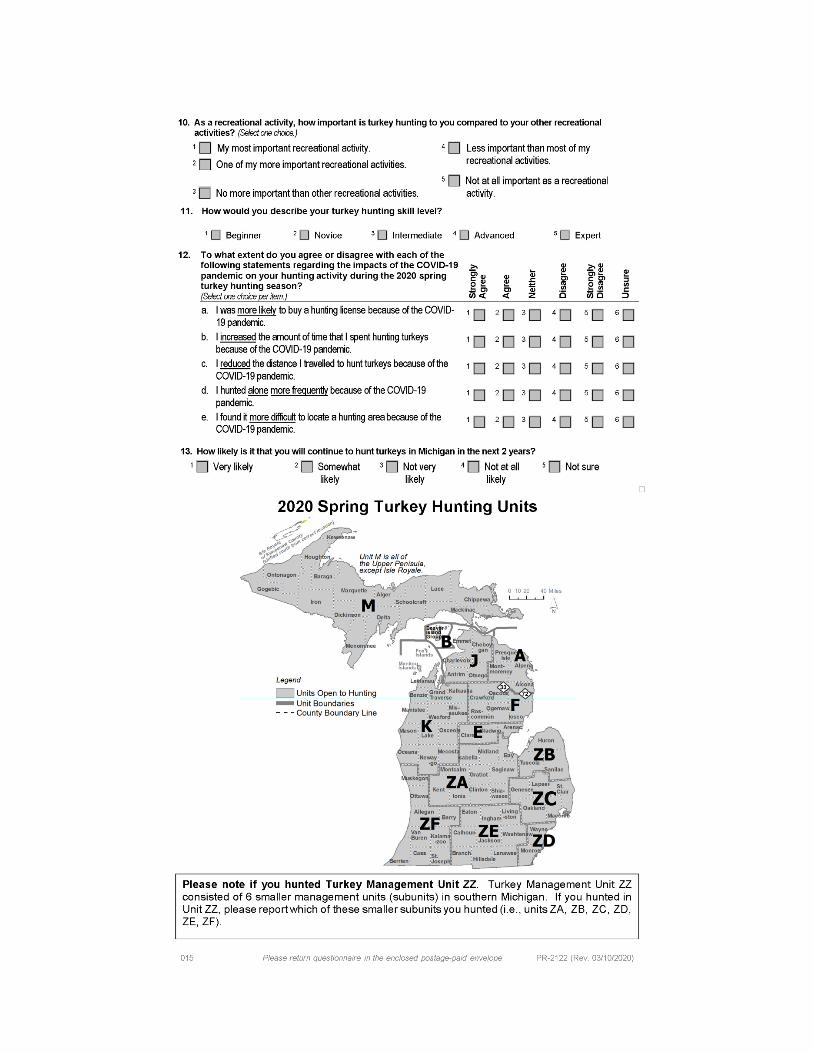
The questionnaire that was used for the 2020 Spring Turkey Harvest Survey.
33
34