Embed Size (px)
Citation preview
The Effects of Demonetization on Financial Inclusion in India
November 8, 2017
Dr. Samuel Schueth, Director of Research
Alex Moler, Senior Research Manager
1
Report Overview
Since 2013 InterMedia has implemented annual Financial Inclusion Insights (FII) surveys to track changes in financial inclusion in India using individual interviews with a nationally representative sample of 45,000 adults. The survey was underway on November 9, 2016 when approximately 85 percent of the banknotes in circulation in India were invalidated by the policy known as demonetization. The invalid notes had to be exchanged for new ones at banks and other financial institutions. The timing of demonetization presented an opportunity to measure its impact on financial inclusion using a panel survey of 1,600 randomly selected individuals in the states of Gujarat, Madhya Pradesh, and Rajasthan. These panelists were first interviewed for the FII survey roughly one month prior to Nov. 9, and then re-interviewed seven months later.
The before and after comparison found that demonetization led to increases in account registration, and active and advanced use of registered accounts. After demonetization, registered account holders of all financial institutions increased, especially banks. All demographic groups showed gains in financial inclusion after demonetization, and increases in account registration were greatest among women and rural residents. Inclusion increased among adults living below the poverty line at a slower rate than their richer counterparts.
A small portion of the study group – 7 percent – adopted cashless payments to facilitate transactions during the cash shortage. Nearly all merchants remain cash-dependent. Mobile money showed a small increase in users relative to other financial services.
Despite difficulties caused by the cash shortage created by demonetization, a majority of panelists agreed that the policy was necessary to combat “black money.” Majorities also agreed that the effects of demonetization were more beneficial than disruptive, the demonetization policy was successfully implemented, and cash will be used less often in the future for routine purposes.
2
Table of Contents
List of Acronyms, Figures and Tables ............................................................................................................ 3 Executive Summary ....................................................................................................................................... 4
Study Overview ........................................................................................................................................ 5 Key Findings ............................................................................................................................................. 5
Introduction ................................................................................................................................................ 10
Study Objectives .................................................................................................................................... 11
Methodology ............................................................................................................................................... 12
Sampling ................................................................................................................................................. 12
Consumer Component ........................................................................................................................ 12
Merchant Component ......................................................................................................................... 14
Questionnaire ........................................................................................................................................ 14 Analysis .................................................................................................................................................. 14
Findings and Discussion .............................................................................................................................. 15
The Customer Journey after Demonetization........................................................................................ 15
All Financial Institutions ...................................................................................................................... 16
The Bank Customer Journey ............................................................................................................... 18
The Mobile Money Customer Journey ................................................................................................ 19
The Nonbank Financial Institution Customer Journey ........................................................................ 19
Consumer Response to Demonetization ............................................................................................... 21 Merchant Response to Demonetization ................................................................................................ 23
Conclusion ................................................................................................................................................... 24 Annex I – Analysis Outputs......................................................................................................................... 26 Annex 2 – Methodology Supporting Documentation ................................................................................. 35
3
List of Acronyms, Figures and Tables
Acronyms DFS Digital financial services
FI Financial inclusion
FII Financial Inclusion Insights
NBFI Nonbank Financial Institution
PMJDY Pradhan Mantri Jan-Dhan Yojana
Figures Figure 1: Customer journey for all financial institutions 4 Figure 2: Change in the size of customer journey segments after demonetization 6 Figure 3: Customer journey for all financial institutions, by gender 7 Figure 4: Customer journey framework overview 15 Figure 5: The bank customer journey 18 Figure 6: The mobile money customer journey 19 Figure 7: The nonbank financial institution customer journey 20 Figure 8: Difficulties conducting transactions during cash shortage 21 Figure 9: Agreement with select outcomes of demonetization 23 Figure 10: Change in institutional trust after demonetization 23 Figure 11: Merchant adoption of cashless payments 24 Figure 12: Attitudes towards cashless payments during demonetization 24
Tables Table 1: Demographic distribution of the Wave 4 sample and the consumer panel 13
4
Executive Summary
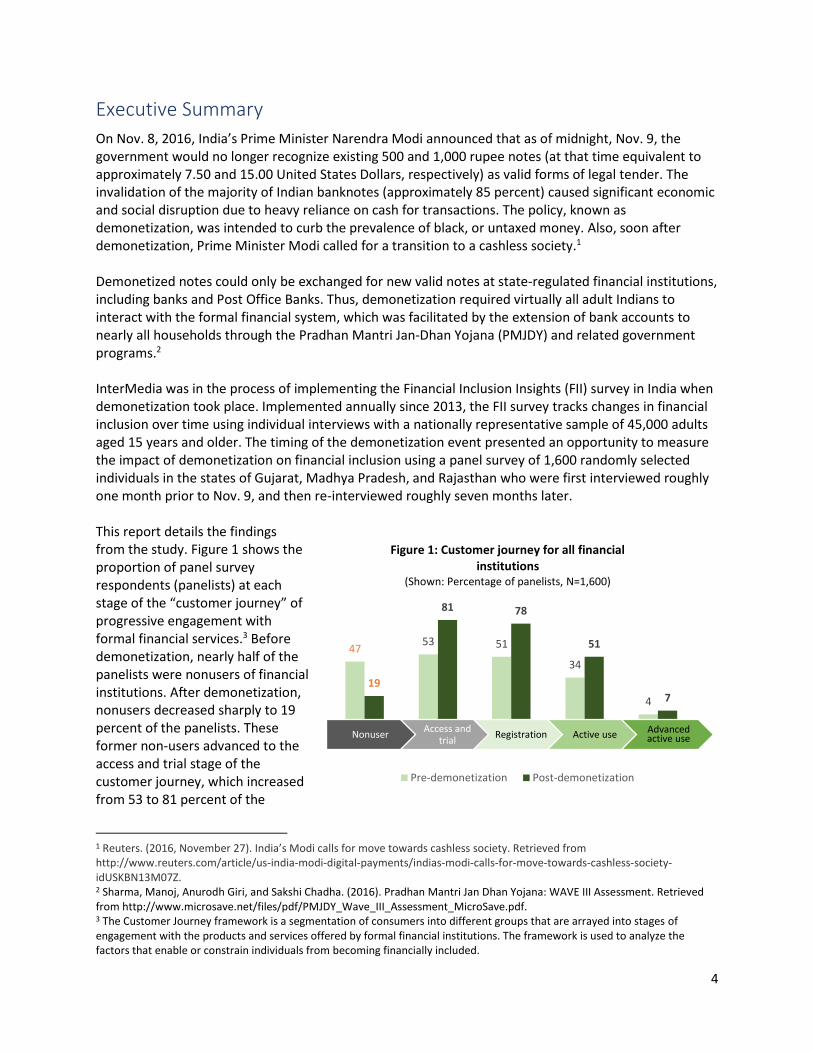
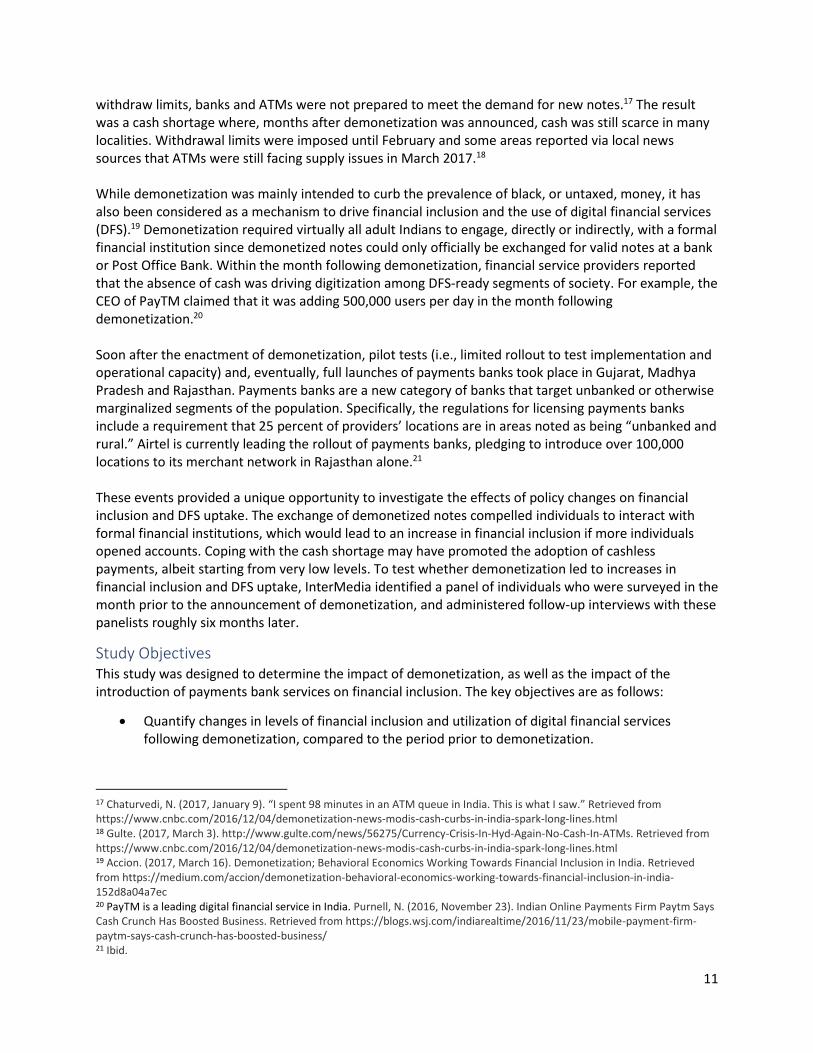
On Nov. 8, 2016, India’s Prime Minister Narendra Modi announced that as of midnight, Nov. 9, the government would no longer recognize existing 500 and 1,000 rupee notes (at that time equivalent to approximately 7.50 and 15.00 United States Dollars, respectively) as valid forms of legal tender. The invalidation of the majority of Indian banknotes (approximately 85 percent) caused significant economic and social disruption due to heavy reliance on cash for transactions. The policy, known as demonetization, was intended to curb the prevalence of black, or untaxed money. Also, soon after demonetization, Prime Minister Modi called for a transition to a cashless society.1 Demonetized notes could only be exchanged for new valid notes at state-regulated financial institutions, including banks and Post Office Banks. Thus, demonetization required virtually all adult Indians to interact with the formal financial system, which was facilitated by the extension of bank accounts to nearly all households through the Pradhan Mantri Jan-Dhan Yojana (PMJDY) and related government programs.2 InterMedia was in the process of implementing the Financial Inclusion Insights (FII) survey in India when demonetization took place. Implemented annually since 2013, the FII survey tracks changes in financial inclusion over time using individual interviews with a nationally representative sample of 45,000 adults aged 15 years and older. The timing of the demonetization event presented an opportunity to measure the impact of demonetization on financial inclusion using a panel survey of 1,600 randomly selected individuals in the states of Gujarat, Madhya Pradesh, and Rajasthan who were first interviewed roughly one month prior to Nov. 9, and then re-interviewed roughly seven months later. This report details the findings from the study. Figure 1 shows the proportion of panel survey respondents (panelists) at each stage of the “customer journey” of progressive engagement with formal financial services.3 Before demonetization, nearly half of the panelists were nonusers of financial institutions. After demonetization, nonusers decreased sharply to 19 percent of the panelists. These former non-users advanced to the access and trial stage of the customer journey, which increased from 53 to 81 percent of the
1 Reuters. (2016, November 27). India’s Modi calls for move towards cashless society. Retrieved from http://www.reuters.com/article/us-india-modi-digital-payments/indias-modi-calls-for-move-towards-cashless-society-idUSKBN13M07Z. 2 Sharma, Manoj, Anurodh Giri, and Sakshi Chadha. (2016). Pradhan Mantri Jan Dhan Yojana: WAVE III Assessment. Retrieved from http://www.microsave.net/files/pdf/PMJDY_Wave_III_Assessment_MicroSave.pdf. 3 The Customer Journey framework is a segmentation of consumers into different groups that are arrayed into stages of engagement with the products and services offered by formal financial institutions. The framework is used to analyze the factors that enable or constrain individuals from becoming financially included.
4753 51
34
4
19
81 78
51
7
Figure 1: Customer journey for all financial institutions
(Shown: Percentage of panelists, N=1,600)
Pre-demonetization Post-demonetization
NonuserAccess and
trialRegistration Active use Advanced
active use
5
panelists. Nearly all of those who had accessed an account also held an account registered in their name, as the proportion of account holders rose from 51 percent to 78 percent of the panelists. Active users of financial accounts (used an account in the past 90 days) increased to 51 percent of panelists after demonetization, from 34 percent pre-demonetization. Active users who used advanced services (beyond deposit and withdrawal) grew substantially, but remained a small portion of the study group overall. Thus, after demonetization, more customers advanced to every stage of the customer journey − from access and trial of financial services, to account registration, to active use of registered accounts, to active use of advanced services − compared to pre-demonetization. Demonetization should, therefore, be considered an effective policy for increasing inclusion and engagement with formal financial services in India.
Study Overview This study had two components: 1) a consumer panel survey comprised of randomly selected adults aged 15 years and older who were interviewed as part of the Financial Inclusion Insights (FII) India Wave 4 survey before the demonetization event on Nov. 8, 2016;4 and 2) a merchant portion comprised of randomly selected shopkeepers responsible for business decision making. A total of 1,600 eligible consumers living in the states of Gujarat, Rajasthan, and Madhya Pradesh were re-interviewed in April-May 2017 to facilitate meaningful comparisons before and after demonetization. A total of 508 shop owners or merchant “key decision makers” were also interviewed at their places of business. The merchants were administered a 15-minute questionnaire to collect data on the characteristics of their businesses, their customers, and their experience conducting business amid demonetization, especially with respect to the impact of accepting (or not accepting) cashless payments. These surveys were designed to investigate three key areas: changes in the proportion of Indian adults who are considered financially included (i.e., possessing an account, in one’s own name, at a full-service financial institution); changes in utilization of digital financial services (DFS); and changes in attitudes and financial behaviors after demonetization. A variety of statistical analyses were performed on the data to quantify changes in financial inclusion after demonetization.
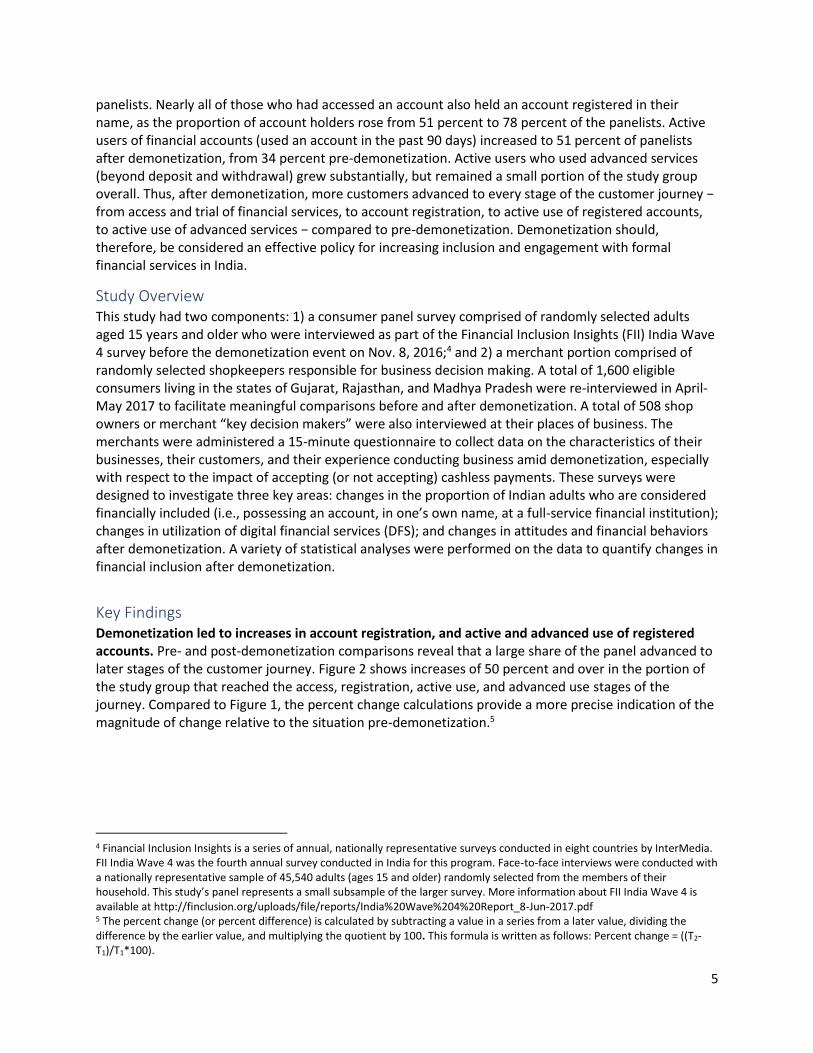
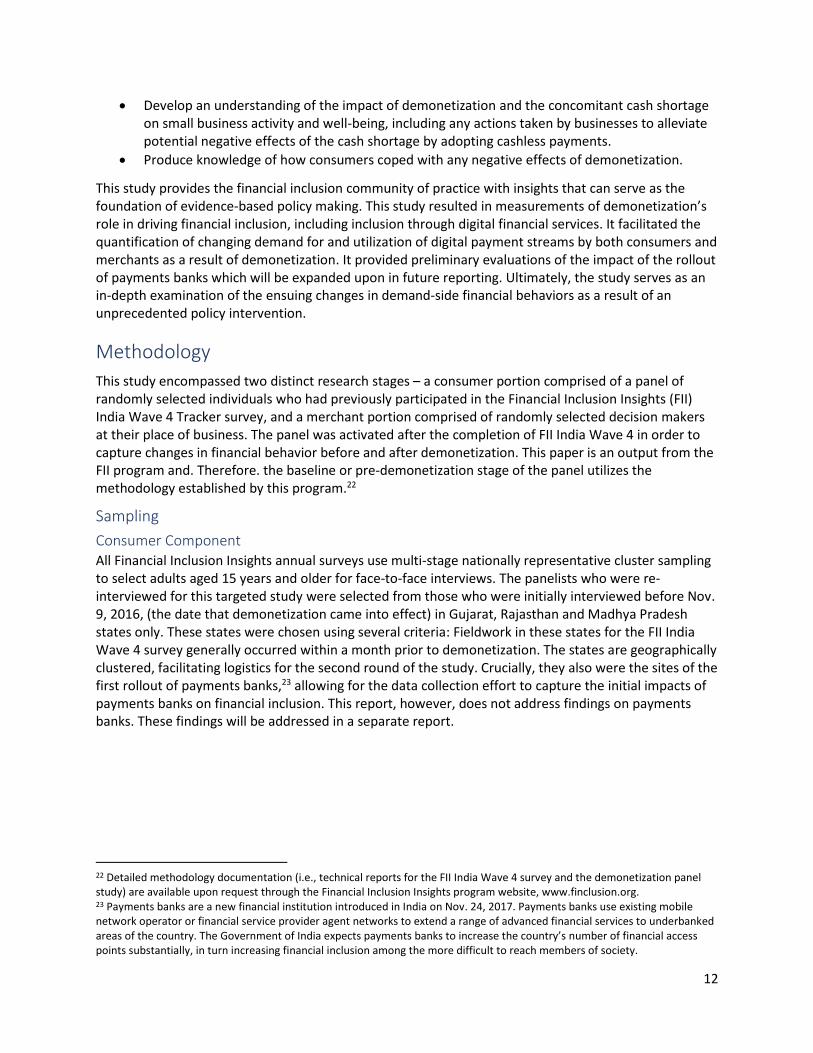
Key Findings Demonetization led to increases in account registration, and active and advanced use of registered accounts. Pre- and post-demonetization comparisons reveal that a large share of the panel advanced to later stages of the customer journey. Figure 2 shows increases of 50 percent and over in the portion of the study group that reached the access, registration, active use, and advanced use stages of the journey. Compared to Figure 1, the percent change calculations provide a more precise indication of the magnitude of change relative to the situation pre-demonetization.5
4 Financial Inclusion Insights is a series of annual, nationally representative surveys conducted in eight countries by InterMedia. FII India Wave 4 was the fourth annual survey conducted in India for this program. Face-to-face interviews were conducted with a nationally representative sample of 45,540 adults (ages 15 and older) randomly selected from the members of their household. This study’s panel represents a small subsample of the larger survey. More information about FII India Wave 4 is available at http://finclusion.org/uploads/file/reports/India%20Wave%204%20Report_8-Jun-2017.pdf 5 The percent change (or percent difference) is calculated by subtracting a value in a series from a later value, dividing the difference by the earlier value, and multiplying the quotient by 100. This formula is written as follows: Percent change = ((T2-T1)/T1*100).
6
Access and trial – The proportion of panelists that had accessed a full-service financial institution increased by 53 percent after demonetization. That is, over half of the nonusers in the pre-demonetization period had accessed an institution by the time of the post-demonetization interview.
Registration – The proportion of the study group that held a registered account also increased by 53 percent after demonetization. Nearly all those who had accessed a financial institution held a registered account.
Active use – The proportion of the study group who used their accounts in the 90 days preceding the post-demonetization interview increased by 50 percent compared to the pre-demonetization period.
Advanced active use – Starting from a low baseline, the proportion of the study group who used their account actively, and also completed at least one advanced financial activity, increased by 75 percent post-demonetization.
Demonetization had a strongly positive effect on increasing financial inclusion relative to previous policies. While the data collected for this study is not nationally representative and, therefore, not directly comparable to the annual surveys of India implemented by InterMedia, the change in the proportion of study group members who became registered bank account holders after demonetization exceeds the changes observed previously. For example, the implementation of Pradhan Mantri Jan-Dhan Yojana (PMJDY) in 2014 coincided with a only a 34 percent increase in the proportion of the population that held a registered financial account over 2013-2016.6 All demographic groups showed gains in financial inclusion after demonetization. A greater share of nearly all demographic groups advanced at all stages of the customer journey post-demonetization. The only exception to the overall finding was the lack of movement from active use to advanced active use among panelists living below the $2.50/day poverty line.7 Financial inclusion increased fastest among women and rural residents. A critical measure of social inclusion is whether or not achievement gaps exist between demographic groups. For example, a gender gap exists if a greater proportion of men own a bank account than the proportion of women who own a bank account. Prior to demonetization, gaps in advancement along the customer journey existed for gender, urban vs. rural locality, and above vs. below the $2.50 per day poverty line. After demonetization, the demographic gaps shifted as follows:
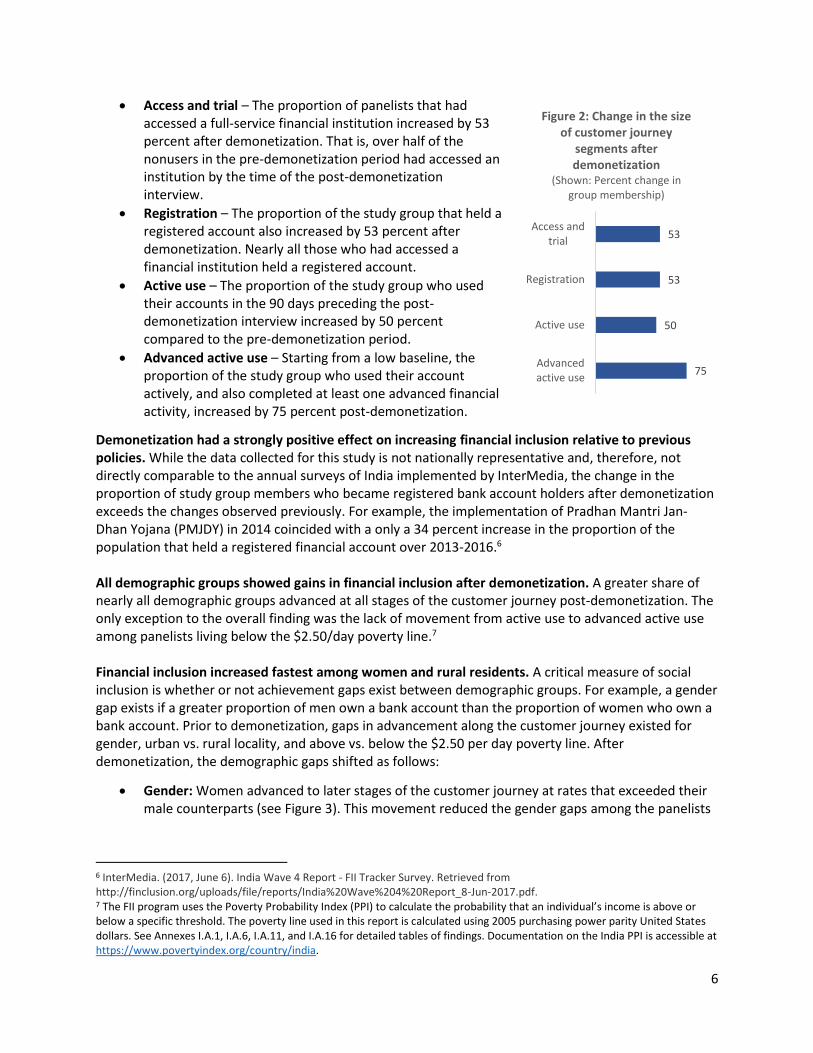
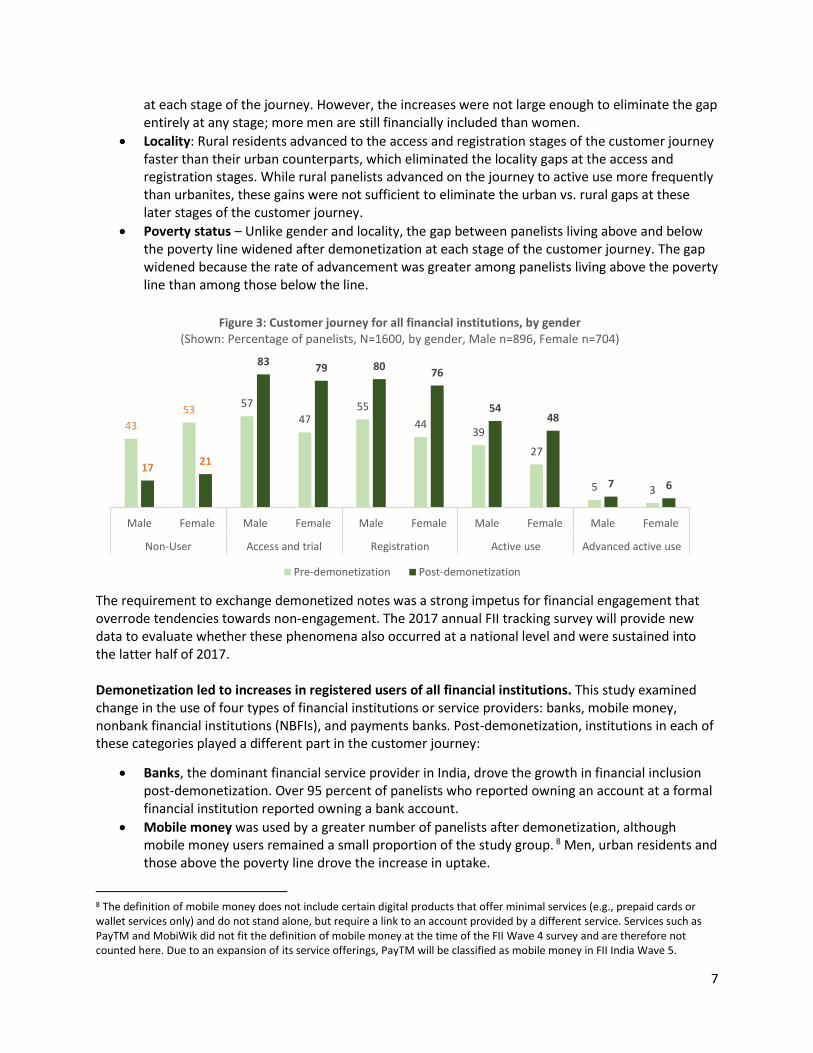
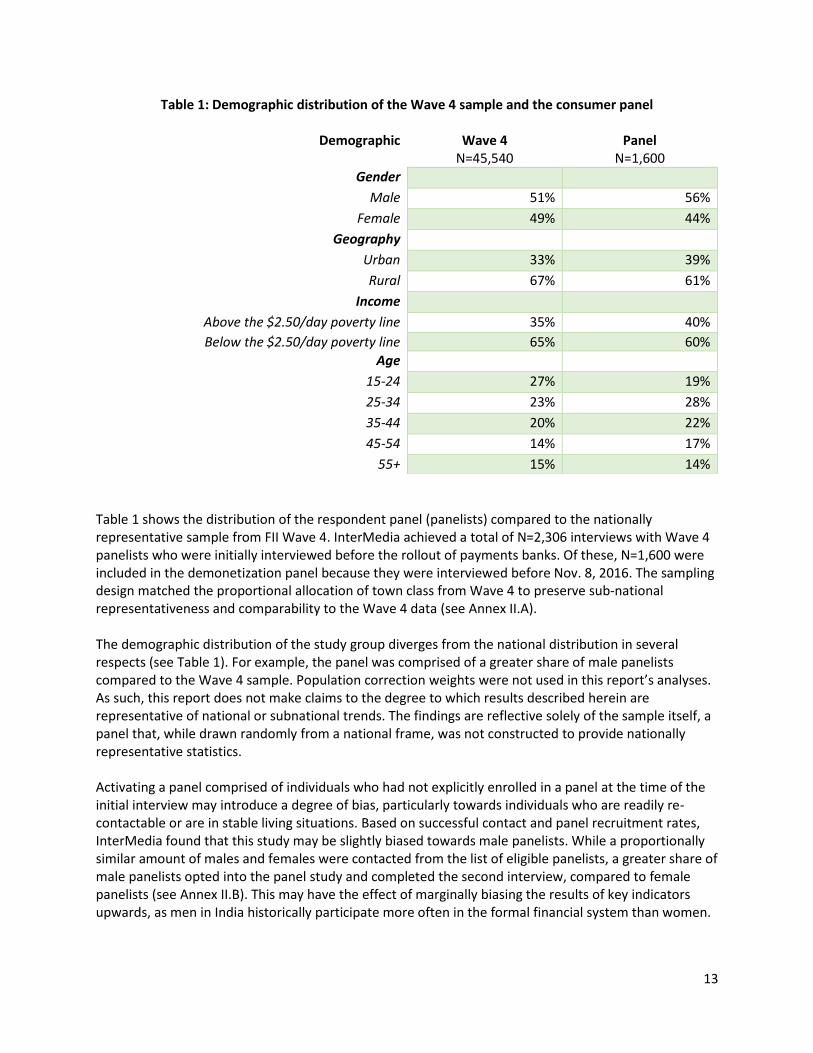
Gender: Women advanced to later stages of the customer journey at rates that exceeded their male counterparts (see Figure 3). This movement reduced the gender gaps among the panelists
6 InterMedia. (2017, June 6). India Wave 4 Report - FII Tracker Survey. Retrieved from http://finclusion.org/uploads/file/reports/India%20Wave%204%20Report_8-Jun-2017.pdf. 7 The FII program uses the Poverty Probability Index (PPI) to calculate the probability that an individual’s income is above or below a specific threshold. The poverty line used in this report is calculated using 2005 purchasing power parity United States dollars. See Annexes I.A.1, I.A.6, I.A.11, and I.A.16 for detailed tables of findings. Documentation on the India PPI is accessible at https://www.povertyindex.org/country/india.
75
50
53
53
Advancedactive use
Active use
Registration
Access andtrial
Figure 2: Change in the size of customer journey
segments after demonetization
(Shown: Percent change in group membership)
7
at each stage of the journey. However, the increases were not large enough to eliminate the gap entirely at any stage; more men are still financially included than women.
Locality: Rural residents advanced to the access and registration stages of the customer journey faster than their urban counterparts, which eliminated the locality gaps at the access and registration stages. While rural panelists advanced on the journey to active use more frequently than urbanites, these gains were not sufficient to eliminate the urban vs. rural gaps at these later stages of the customer journey.
Poverty status – Unlike gender and locality, the gap between panelists living above and below the poverty line widened after demonetization at each stage of the customer journey. The gap widened because the rate of advancement was greater among panelists living above the poverty line than among those below the line.
The requirement to exchange demonetized notes was a strong impetus for financial engagement that overrode tendencies towards non-engagement. The 2017 annual FII tracking survey will provide new data to evaluate whether these phenomena also occurred at a national level and were sustained into the latter half of 2017. Demonetization led to increases in registered users of all financial institutions. This study examined change in the use of four types of financial institutions or service providers: banks, mobile money, nonbank financial institutions (NBFIs), and payments banks. Post-demonetization, institutions in each of these categories played a different part in the customer journey:
Banks, the dominant financial service provider in India, drove the growth in financial inclusion post-demonetization. Over 95 percent of panelists who reported owning an account at a formal financial institution reported owning a bank account.
Mobile money was used by a greater number of panelists after demonetization, although mobile money users remained a small proportion of the study group. 8 Men, urban residents and those above the poverty line drove the increase in uptake.
8 The definition of mobile money does not include certain digital products that offer minimal services (e.g., prepaid cards or wallet services only) and do not stand alone, but require a link to an account provided by a different service. Services such as PayTM and MobiWik did not fit the definition of mobile money at the time of the FII Wave 4 survey and are therefore not counted here. Due to an expansion of its service offerings, PayTM will be classified as mobile money in FII India Wave 5.
43
5357
4755
4439
27
5 3
1721
8379 80
76
5448
7 6
Male Female Male Female Male Female Male Female Male Female
Non-User Access and trial Registration Active use Advanced active use
Figure 3: Customer journey for all financial institutions, by gender (Shown: Percentage of panelists, N=1600, by gender, Male n=896, Female n=704)
Pre-demonetization Post-demonetization
8
Nonbank financial institution (NBFI) account holders increased as a proportion of the study group. This increase was driven by the role of Post Office Banks as exchange points for demonetized notes.
Payments banks did not meaningfully impact financial inclusion over the study period. Less than one percent of panelists reported using a payments bank account.
Panelists most often registered new bank accounts and Post Office Bank accounts. Mobile money showed a much smaller increase in users. The increase in the number of Post Office Bank users may not be a lasting change now that all demonetized notes have been exchanged. The cash shortage did contribute to increased mobile money use, but not to the degree approaching the envisioned “cashless society.” More effort is required to spur mobile money adoption, particularly among less well-off consumer segments.
Consumers reported that demonetization was disruptive but necessary. In the immediate aftermath of the announcement of demonetization, the ensuing cash shortage spurred widespread reports of economic disruption and, for certain segments and industries (for example, trucking and logistics), complete paralysis.9 The study found that while panelists confirmed that the cash shortage was indeed disruptive, it may not have been as disruptive as some news accounts may have suggested. Panelists reported the following overall perceptions of demonetization:
Demonetization was most problematic for certain types of transactions, such as transportation and daily food expenses.
A limited number of panelists – 7 percent – adopted cashless payments to facilitate transactions during the cash shortage.
Despite difficulties, a majority of panelists agreed demonetization was a necessary step to combat “black money.” Majorities also agreed that the effects of demonetization were more beneficial than disruptive, the demonetization policy was successfully implemented, and cash will be used less often in the future for routine purposes.10
Overall, the panelists perceived demonetization as a necessary and beneficial policy, despite the economic disruption it caused. These perceptions may be affected by high levels of support for Prime Minister Modi’s party, the Bharatiya Janata Party (BJP), in the three states where the panel survey was implemented. Nationally representative statistics on demonetization will be gathered by the FII India 2017 Wave 5 survey. Nearly all merchants remain cash-dependent. When asked about which groups benefited from demonetization, consumers perceived the least benefit for merchants. These perceptions were supported by data from the survey of merchants:
Over 90 percent of merchants only accepted cash during demonetization. Sixty-five percent of these merchants reported their businesses suffered due to the shortage of cash.
Of the merchants who reported only accepting cash during demonetization, less than half reported that accepting cashless payments would have helped their businesses.
9 Daily News & Analysis India. (2016, November 14). Demonetization: With no cash on hand, 4 lakh trucks stranded on highways. Retrieved from http://www.dnaindia.com/india/report-demonetization-with-no-cash-on-hand-4-lakh-trucks-stranded-on-highways-2273414. 10 This study does not control for or attempt to measure the impact of a respondent’s political affiliation on their opinions of demonetization. Therefore, it is unclear the extent to which political affiliation influenced perceptions of demonetization.
9
Merchants reported that less than 3 percent of their customers use cashless payments, and a primary reason for not accepting cashless payments was a lack of perceived demand from customers.
Demonetization had little immediate effect on the prevalence of cashless payments. Merchants generally do not see a need to adopt electronic payment products in the face of low consumer demand. However, the few merchants who did adopt these products and services found them valuable, which indicates that barriers to uptake are not product-specific but related to limited utility in the current context of early adoption.
10
Introduction
Over the past four years, India has experienced a rapid expansion in the availability and utilization of formal financial services, particularly banking, across all segments of society. Between 2013 and 2015, individual ownership of an account at a formal financial institution increased from 47 percent to 65 percent of the adult population (ages 15 and over).11 This change corresponds to a 34 percent increase in financial inclusion, or more than 250 million individuals.12 The Government of India’s policies for increasing financial inclusion are a key driver of the growth of the banked population. The government, through the Financial Inclusion Department at the Ministry of Financial Services, has introduced multiple national-scale and integrated policies aimed at increasing both inclusion, generally, and utilization of digital financial services, specifically. Most notable among these policies is Pradhan Mantri Jan-Dhan Yojana, or PMJDY.13 PMJDY is responsible for the financial inclusion of nearly 300 million Indian adults (as a measure of accounts created, according to the PMJDY office).14 Through PMJDY, the Government of India demonstrated that a comprehensive financial inclusion program, backed by focused and enforced policies, can successfully drive population-wide financial inclusion. The rate of individual account ownership among India’s adult population was little changed between 2015 and 2016 according to the nationally representative surveys implemented annually by the FII program.15 The demonetization policy enacted by Prime Minister Narendra Modi on Nov. 8, 2016, provided a powerful impetus to resume the upward trend towards greater financial inclusion and engagement. Demonetization started when Prime Minister Modi announced that at midnight, Nov. 9, the government would no longer recognize existing 500 (~$7.50) and 1,000 (~$15.00) rupee notes as valid forms of legal tender. This action invalidated approximately 85 percent of the currency notes in circulation. The Reserve Bank of India reported that between Nov. 4, 2016, and Dec. 23, 2016, “the amount of cash in circulation fell by nearly half.”16 The lack of cash caused significant economic and social disruption. Banks were overwhelmed by the volume of notes that needed to be exchanged. Despite imposing
11 InterMedia. (2017, June 6). India Wave 4 Report - FII Tracker Survey. Slide 10. Retrieved from http://finclusion.org/uploads/file/reports/India%20Wave%204%20Report_8-Jun-2017.pdf. 12 Ministry of Home Affairs (n.d.). Census of India. Retrieved from http://www.censusindia.gov.in/Meta-Data/metadata.htm#/tab1. 13 Department of Financial Services. (n.d.). Pradhan Mantri Jan Dhan Yojana - Scheme Details. Retrieved from https://pmjdy.gov.in/scheme. 14 Department of Financial Services. (n.d.). Pradhan Mantri Jan Dhan Yojana – Progress-Report. Retrieved from https://pmjdy.gov.in/account. 15 InterMedia. (2017, June 6). India Wave 4 Report - FII Tracker Survey. Slide 10. Retrieved from http://finclusion.org/uploads/file/reports/India%20Wave%204%20Report_8-Jun-2017.pdf. 16 New York Times Editorial Board. (2017, January 9). The Cost of India’s Man-Made Currency Crisis. Retrieved from https://www.nytimes.com/2017/01/09/opinion/the-cost-of-indias-man-made-currency-crisis.html
11
withdraw limits, banks and ATMs were not prepared to meet the demand for new notes.17 The result was a cash shortage where, months after demonetization was announced, cash was still scarce in many localities. Withdrawal limits were imposed until February and some areas reported via local news sources that ATMs were still facing supply issues in March 2017.18 While demonetization was mainly intended to curb the prevalence of black, or untaxed, money, it has also been considered as a mechanism to drive financial inclusion and the use of digital financial services (DFS).19 Demonetization required virtually all adult Indians to engage, directly or indirectly, with a formal financial institution since demonetized notes could only officially be exchanged for valid notes at a bank or Post Office Bank. Within the month following demonetization, financial service providers reported that the absence of cash was driving digitization among DFS-ready segments of society. For example, the CEO of PayTM claimed that it was adding 500,000 users per day in the month following demonetization.20 Soon after the enactment of demonetization, pilot tests (i.e., limited rollout to test implementation and operational capacity) and, eventually, full launches of payments banks took place in Gujarat, Madhya Pradesh and Rajasthan. Payments banks are a new category of banks that target unbanked or otherwise marginalized segments of the population. Specifically, the regulations for licensing payments banks include a requirement that 25 percent of providers’ locations are in areas noted as being “unbanked and rural.” Airtel is currently leading the rollout of payments banks, pledging to introduce over 100,000 locations to its merchant network in Rajasthan alone.21 These events provided a unique opportunity to investigate the effects of policy changes on financial inclusion and DFS uptake. The exchange of demonetized notes compelled individuals to interact with formal financial institutions, which would lead to an increase in financial inclusion if more individuals opened accounts. Coping with the cash shortage may have promoted the adoption of cashless payments, albeit starting from very low levels. To test whether demonetization led to increases in financial inclusion and DFS uptake, InterMedia identified a panel of individuals who were surveyed in the month prior to the announcement of demonetization, and administered follow-up interviews with these panelists roughly six months later.
Study Objectives This study was designed to determine the impact of demonetization, as well as the impact of the introduction of payments bank services on financial inclusion. The key objectives are as follows:
Quantify changes in levels of financial inclusion and utilization of digital financial services following demonetization, compared to the period prior to demonetization.
17 Chaturvedi, N. (2017, January 9). “I spent 98 minutes in an ATM queue in India. This is what I saw.” Retrieved from https://www.cnbc.com/2016/12/04/demonetization-news-modis-cash-curbs-in-india-spark-long-lines.html 18 Gulte. (2017, March 3). http://www.gulte.com/news/56275/Currency-Crisis-In-Hyd-Again-No-Cash-In-ATMs. Retrieved from https://www.cnbc.com/2016/12/04/demonetization-news-modis-cash-curbs-in-india-spark-long-lines.html 19 Accion. (2017, March 16). Demonetization; Behavioral Economics Working Towards Financial Inclusion in India. Retrieved from https://medium.com/accion/demonetization-behavioral-economics-working-towards-financial-inclusion-in-india-152d8a04a7ec 20 PayTM is a leading digital financial service in India. Purnell, N. (2016, November 23). Indian Online Payments Firm Paytm Says Cash Crunch Has Boosted Business. Retrieved from https://blogs.wsj.com/indiarealtime/2016/11/23/mobile-payment-firm-paytm-says-cash-crunch-has-boosted-business/ 21 Ibid.
12
Develop an understanding of the impact of demonetization and the concomitant cash shortage on small business activity and well-being, including any actions taken by businesses to alleviate potential negative effects of the cash shortage by adopting cashless payments.
Produce knowledge of how consumers coped with any negative effects of demonetization.
This study provides the financial inclusion community of practice with insights that can serve as the foundation of evidence-based policy making. This study resulted in measurements of demonetization’s role in driving financial inclusion, including inclusion through digital financial services. It facilitated the quantification of changing demand for and utilization of digital payment streams by both consumers and merchants as a result of demonetization. It provided preliminary evaluations of the impact of the rollout of payments banks which will be expanded upon in future reporting. Ultimately, the study serves as an in-depth examination of the ensuing changes in demand-side financial behaviors as a result of an unprecedented policy intervention.
Methodology
This study encompassed two distinct research stages – a consumer portion comprised of a panel of randomly selected individuals who had previously participated in the Financial Inclusion Insights (FII) India Wave 4 Tracker survey, and a merchant portion comprised of randomly selected decision makers at their place of business. The panel was activated after the completion of FII India Wave 4 in order to capture changes in financial behavior before and after demonetization. This paper is an output from the FII program and. Therefore. the baseline or pre-demonetization stage of the panel utilizes the methodology established by this program.22
Sampling
Consumer Component All Financial Inclusion Insights annual surveys use multi-stage nationally representative cluster sampling to select adults aged 15 years and older for face-to-face interviews. The panelists who were re-interviewed for this targeted study were selected from those who were initially interviewed before Nov. 9, 2016, (the date that demonetization came into effect) in Gujarat, Rajasthan and Madhya Pradesh states only. These states were chosen using several criteria: Fieldwork in these states for the FII India Wave 4 survey generally occurred within a month prior to demonetization. The states are geographically clustered, facilitating logistics for the second round of the study. Crucially, they also were the sites of the first rollout of payments banks,23 allowing for the data collection effort to capture the initial impacts of payments banks on financial inclusion. This report, however, does not address findings on payments banks. These findings will be addressed in a separate report.
22 Detailed methodology documentation (i.e., technical reports for the FII India Wave 4 survey and the demonetization panel study) are available upon request through the Financial Inclusion Insights program website, www.finclusion.org. 23 Payments banks are a new financial institution introduced in India on Nov. 24, 2017. Payments banks use existing mobile network operator or financial service provider agent networks to extend a range of advanced financial services to underbanked areas of the country. The Government of India expects payments banks to increase the country’s number of financial access points substantially, in turn increasing financial inclusion among the more difficult to reach members of society.
13
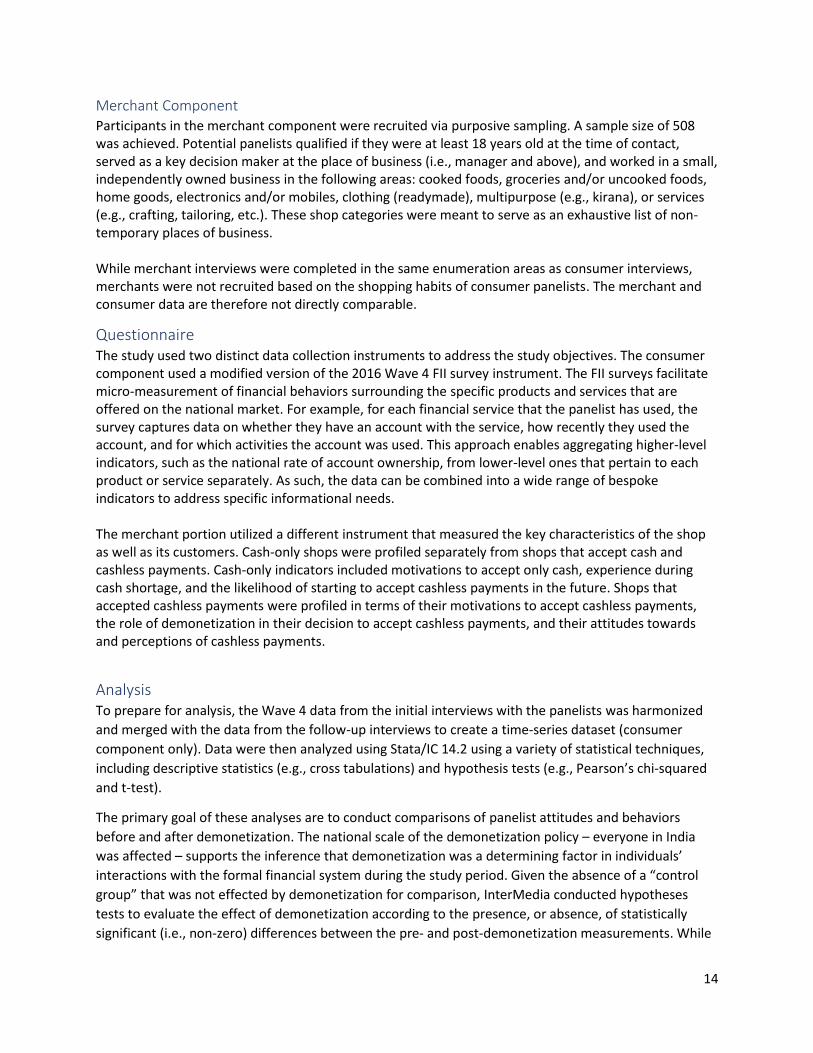
Table 1: Demographic distribution of the Wave 4 sample and the consumer panel
Table 1 shows the distribution of the respondent panel (panelists) compared to the nationally representative sample from FII Wave 4. InterMedia achieved a total of N=2,306 interviews with Wave 4 panelists who were initially interviewed before the rollout of payments banks. Of these, N=1,600 were included in the demonetization panel because they were interviewed before Nov. 8, 2016. The sampling design matched the proportional allocation of town class from Wave 4 to preserve sub-national representativeness and comparability to the Wave 4 data (see Annex II.A). The demographic distribution of the study group diverges from the national distribution in several respects (see Table 1). For example, the panel was comprised of a greater share of male panelists compared to the Wave 4 sample. Population correction weights were not used in this report’s analyses. As such, this report does not make claims to the degree to which results described herein are representative of national or subnational trends. The findings are reflective solely of the sample itself, a panel that, while drawn randomly from a national frame, was not constructed to provide nationally representative statistics. Activating a panel comprised of individuals who had not explicitly enrolled in a panel at the time of the initial interview may introduce a degree of bias, particularly towards individuals who are readily re-contactable or are in stable living situations. Based on successful contact and panel recruitment rates, InterMedia found that this study may be slightly biased towards male panelists. While a proportionally similar amount of males and females were contacted from the list of eligible panelists, a greater share of male panelists opted into the panel study and completed the second interview, compared to female panelists (see Annex II.B). This may have the effect of marginally biasing the results of key indicators upwards, as men in India historically participate more often in the formal financial system than women.
Demographic Wave 4 N=45,540
Panel N=1,600
Gender
Male 51% 56%
Female 49% 44%
Geography
Urban 33% 39%
Rural 67% 61%
Income
Above the $2.50/day poverty line 35% 40%
Below the $2.50/day poverty line 65% 60%
Age
15-24 27% 19%
25-34 23% 28%
35-44 20% 22%
45-54 14% 17%
55+ 15% 14%
14
Merchant Component Participants in the merchant component were recruited via purposive sampling. A sample size of 508 was achieved. Potential panelists qualified if they were at least 18 years old at the time of contact, served as a key decision maker at the place of business (i.e., manager and above), and worked in a small, independently owned business in the following areas: cooked foods, groceries and/or uncooked foods, home goods, electronics and/or mobiles, clothing (readymade), multipurpose (e.g., kirana), or services (e.g., crafting, tailoring, etc.). These shop categories were meant to serve as an exhaustive list of non-temporary places of business. While merchant interviews were completed in the same enumeration areas as consumer interviews, merchants were not recruited based on the shopping habits of consumer panelists. The merchant and consumer data are therefore not directly comparable.
Questionnaire The study used two distinct data collection instruments to address the study objectives. The consumer component used a modified version of the 2016 Wave 4 FII survey instrument. The FII surveys facilitate micro-measurement of financial behaviors surrounding the specific products and services that are offered on the national market. For example, for each financial service that the panelist has used, the survey captures data on whether they have an account with the service, how recently they used the account, and for which activities the account was used. This approach enables aggregating higher-level indicators, such as the national rate of account ownership, from lower-level ones that pertain to each product or service separately. As such, the data can be combined into a wide range of bespoke indicators to address specific informational needs. The merchant portion utilized a different instrument that measured the key characteristics of the shop as well as its customers. Cash-only shops were profiled separately from shops that accept cash and cashless payments. Cash-only indicators included motivations to accept only cash, experience during cash shortage, and the likelihood of starting to accept cashless payments in the future. Shops that accepted cashless payments were profiled in terms of their motivations to accept cashless payments, the role of demonetization in their decision to accept cashless payments, and their attitudes towards and perceptions of cashless payments.
Analysis To prepare for analysis, the Wave 4 data from the initial interviews with the panelists was harmonized
and merged with the data from the follow-up interviews to create a time-series dataset (consumer
component only). Data were then analyzed using Stata/IC 14.2 using a variety of statistical techniques,
including descriptive statistics (e.g., cross tabulations) and hypothesis tests (e.g., Pearson’s chi-squared
and t-test).
The primary goal of these analyses are to conduct comparisons of panelist attitudes and behaviors
before and after demonetization. The national scale of the demonetization policy – everyone in India
was affected – supports the inference that demonetization was a determining factor in individuals’
interactions with the formal financial system during the study period. Given the absence of a “control
group” that was not effected by demonetization for comparison, InterMedia conducted hypotheses
tests to evaluate the effect of demonetization according to the presence, or absence, of statistically
significant (i.e., non-zero) differences between the pre- and post-demonetization measurements. While
15
the analysis relies on the inference that demonetization shaped financial behavior during the study
period, the analysis cannot quantify the extent to which demonetization caused changes in financial
behavior relative to other potential causes.
Findings and Discussion
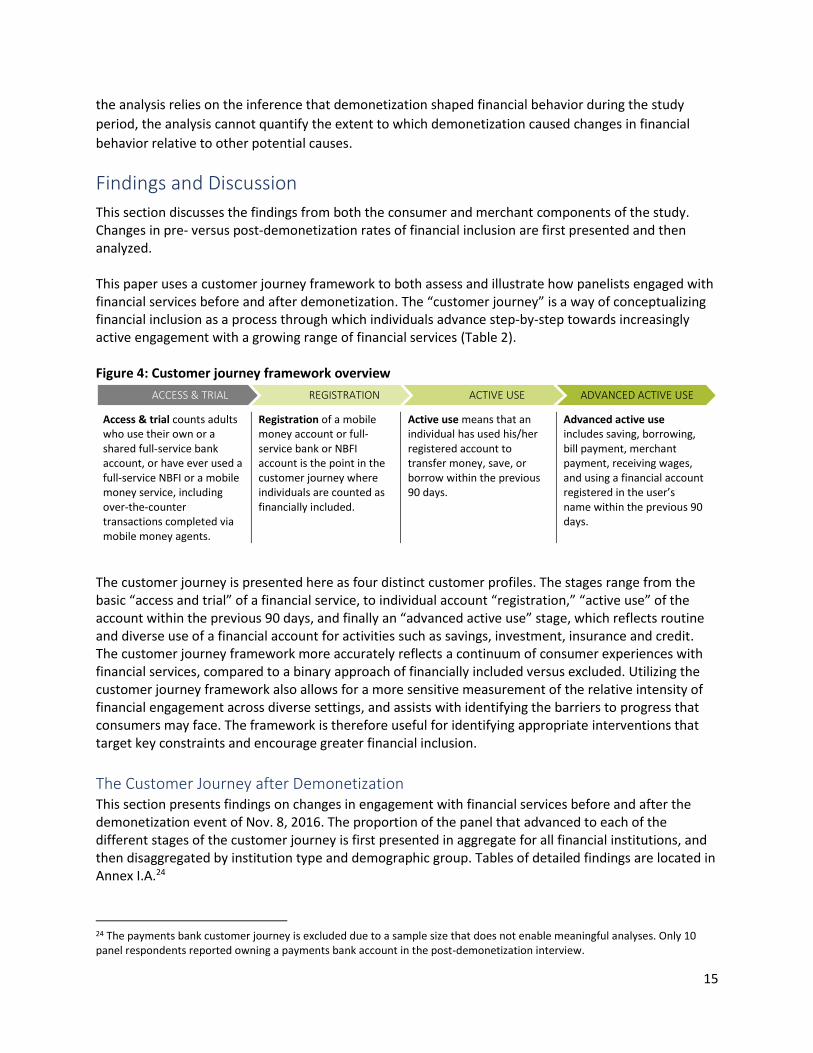
This section discusses the findings from both the consumer and merchant components of the study. Changes in pre- versus post-demonetization rates of financial inclusion are first presented and then analyzed. This paper uses a customer journey framework to both assess and illustrate how panelists engaged with financial services before and after demonetization. The “customer journey” is a way of conceptualizing financial inclusion as a process through which individuals advance step-by-step towards increasingly active engagement with a growing range of financial services (Table 2). Figure 4: Customer journey framework overview
Access & trial counts adults who use their own or a shared full-service bank account, or have ever used a full-service NBFI or a mobile money service, including over-the-counter transactions completed via mobile money agents.
Registration of a mobile money account or full-service bank or NBFI account is the point in the customer journey where individuals are counted as financially included.
Active use means that an individual has used his/her registered account to transfer money, save, or borrow within the previous 90 days.
Advanced active use includes saving, borrowing, bill payment, merchant payment, receiving wages, and using a financial account registered in the user’s name within the previous 90 days.
The customer journey is presented here as four distinct customer profiles. The stages range from the basic “access and trial” of a financial service, to individual account “registration,” “active use” of the account within the previous 90 days, and finally an “advanced active use” stage, which reflects routine and diverse use of a financial account for activities such as savings, investment, insurance and credit. The customer journey framework more accurately reflects a continuum of consumer experiences with financial services, compared to a binary approach of financially included versus excluded. Utilizing the customer journey framework also allows for a more sensitive measurement of the relative intensity of financial engagement across diverse settings, and assists with identifying the barriers to progress that consumers may face. The framework is therefore useful for identifying appropriate interventions that target key constraints and encourage greater financial inclusion.
The Customer Journey after Demonetization This section presents findings on changes in engagement with financial services before and after the demonetization event of Nov. 8, 2016. The proportion of the panel that advanced to each of the different stages of the customer journey is first presented in aggregate for all financial institutions, and then disaggregated by institution type and demographic group. Tables of detailed findings are located in Annex I.A.24
24 The payments bank customer journey is excluded due to a sample size that does not enable meaningful analyses. Only 10 panel respondents reported owning a payments bank account in the post-demonetization interview.
ACCESS & TRIAL REGISTRATION ACTIVE USE ADVANCED ACTIVE USE
16
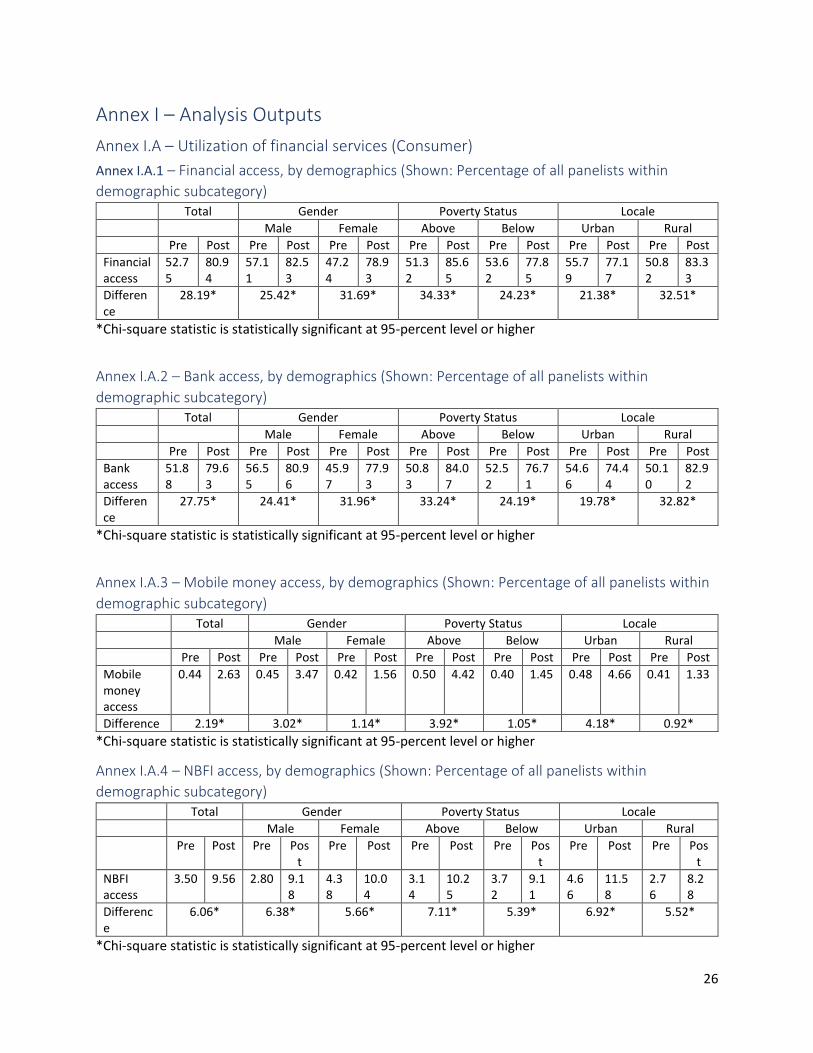
All Financial Institutions Prior to the announcement of demonetization, slightly more than half of the panel of Indian adults – in Gujarat, Madhya Pradesh and Rajasthan – had access to a full-service financial institution, such as a bank, deposit-taking microfinance institution, Post Office Bank, or a mobile money service. Only 51 percent of panelists held a registered account (Figure 1). While nearly everyone who had access to an account also had an account registered in their name, less than half of registered account holders had used their accounts actively in the last 90 days. Moreover, only 4 percent of the panelists had reached the final, advanced active use stage of the customer journey before demonetization. Advancement from Nonuser to Access and Trial Customer engagement with financial services expanded dramatically from the first interviews (before Nov. 9, 2016) to the follow-up interviews in April-May, 2017. By the time of the post-demonetization interview, 81 percent of all panelists reported having engaged with formal financial services on some level – the “access and trial” stage of the customer journey. This is a 28-percentage- point increase over the 53 percent of the study group at the “access and trial” stage pre-demonetization (Figure 4). This increase was statistically significant and cut across demographics, including women and those living in rural areas. The gender gap decreased after demonetization; 79 percent of female panelists held registered accounts post-demonetization compared to 47 percent during the pre-demonetization period (Annex I.A.1). This 32-percentage-point increase is greater than the 25-point increase observed for men after demonetization. Overall, a greater proportion of men (83 percent) than women (79 percent) still reported having access to financial services following demonetization. The locality gap also decreased after demonetization. Thirty-three percent of rural residents advanced from nonuser to later stages in the customer journey after demonetization, compared to 21 percent of urban panelists. While demonetization also spurred greater financial engagement among adults living below the poverty line, they continued to lag behind their richer counterparts. After demonetization, those living below the poverty line converted from “nonuser” to “access and trial” at a lower rate (78 percent) than those living above the line (86 percent). At the access and trial stage, the post-demonetization increase in the size of the below-poverty group (24 percentage points) was also lower than the above-poverty group (34 percentage points). These finding reveal the durability of the barrier that poverty creates to financial inclusion. Advancement to the Registration Stage Given the dominance of banks in India’s financial landscape, nearly all panelists converted from “access and trial” to “registration” because a registered account is typically required to access bank services. Ninety-six percent of individuals who had accessed a financial institution after demonetization also held a registered account. All demographic groups reported statistically significant increases in account holders, with women and rural residents advancing to the registration stage at higher rates than their male and urban counterparts (see Annex I.A.6). An additional 23 percent of panelists living below the poverty line advanced to the registration stage, compared with 35 percent living above it. As a result, fewer panelists living below the poverty line advanced to the registration stage compared to their richer counterparts (75 percent and 84 percent, respectively). Consequently, and unlike the other demographic divisions under examination here, the poverty gap for registration actually widened after demonetization.
17
Advancement to the Active Use Stage Comparatively fewer panelists advanced to the latter two stages of the customer journey compared with the first two stages. A majority, or 51 percent, of panelists reported using an account at a formal financial institution within the 90 days preceding the post-demonetization interviews (Figure 4) – an increase of 17 percentage points compared to before demonetization. This finding suggests that demonetization may have spurred individuals to open new accounts to exchange demonetized notes for new ones, but many of these newly registered users may not have used their accounts since completing the exchange. Nevertheless, all demographic groups advanced to the active use stage of the customer journey at statistically significant rates. Women and those living in rural areas advanced to this stage at levels exceeding their male and urban counterparts (Annex I.A.11). The poverty gap widened again at this stage in the customer journey; 11 percent of adults living below the poverty line converted from registration to active use, versus 26 percent of their richer counterparts. Advancement to the Active Advanced Use Stage Not surprisingly, the number of panelists who reached the final stage of the customer journey – the use of an active account for advanced services (i.e., services other than cash-in, cash-out and peer-to-peer transfers) – increased the least among panelists, compared to the earlier stages. The proportion of advanced active users nevertheless grew by 3 percentage points, from 4 percent before, to 7 percent after, demonetization. With the exception of those living below the poverty line, there was a statistically significant increase in the proportion of each demographic group at the advanced active user stage (see Annex I.A.16). The comparatively smaller, yet still substantial increases in advancement to the later stages of the customer journey suggest that demonetization was most effective at motivating the registration of new financial accounts, rather than driving greater active and advanced use. Importantly, demonetization appears to have encouraged the enrollment of typically underserved groups (those living in rural areas and women) into formal financial services, with the notable exception of the poorest adults.
18
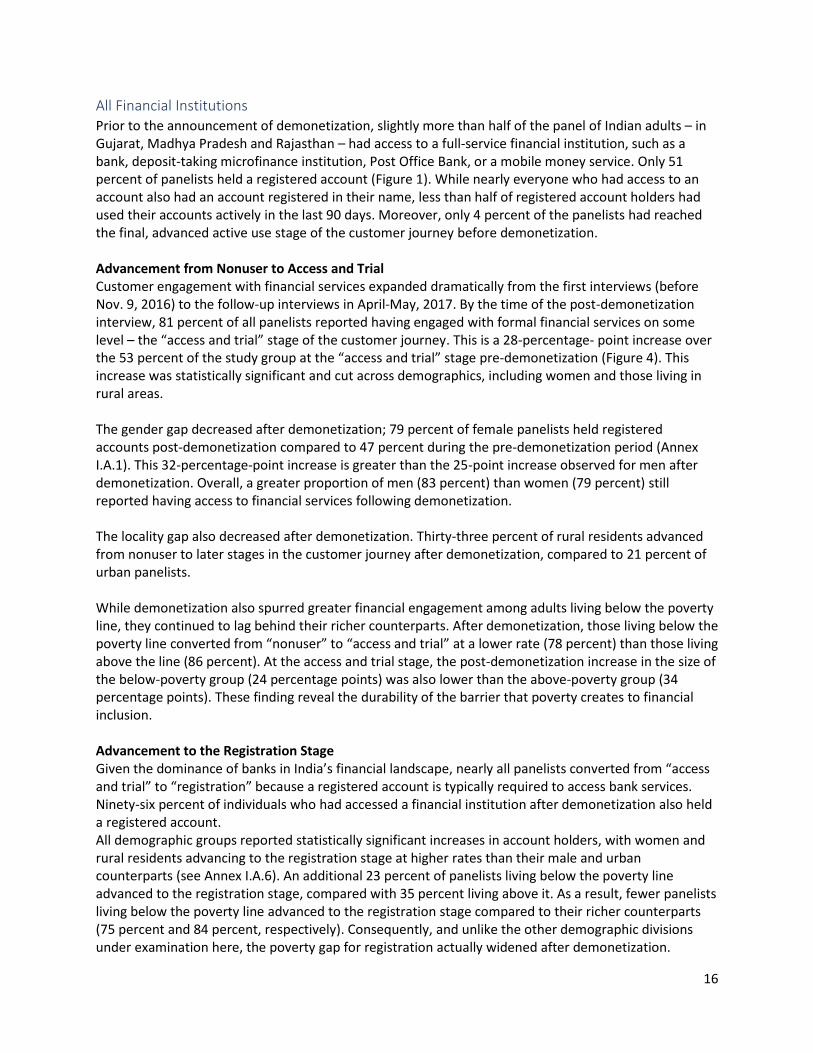
The Bank Customer Journey Banks are the most widely used formal financial institutions in India.25 Banks are also central to the Government of India’s strategy to increase financial inclusion, as evidenced by the introduction of Pradhan Mantri Jan-Dhan Yojana (PMJDY) and the United Payments Interface (UPI) – a mobile platform that facilitates interoperability between banks. Consequently, in 2016, 97 percent of adults in India, who reported owning an account at a formal financial institution, reported owning a bank account.26 Therefore, levels of access to, and utilization of, bank accounts are largely synonymous with the overall levels of access to and utilization of formal financial accounts. All demographic groups saw statistically significant increases in the number who reached the access and trial stage of the customer journey. These increases closed the locality (urban/rural) gap for this stage of the bank customer journey. At the same time the gender gap narrowed to 2 percentage points. The poverty gap, however, widened after demonetization, as an additional 33 percent of individuals living above the poverty line reached the access and trial stage of the bank customer journey, compared with only 24 percent of panelists living below the poverty line (see Annex I.A.2). After demonetization, 77 percent of panelists reported owning a registered bank account; an increase of 28 percentage points after demonetization (see Figure 5). All demographic groups reported statistically significant increases in ownership of bank accounts post-demonetization. Rural residents and women reported the largest increases in advancement to the registration stage, at 33 percentage points and 32 percentage points, respectively. The poor increased their bank account ownership as well, though the poverty gap nevertheless grew after demonetization, as panelists living above the poverty line increased their account ownership by 34 percentage points, compared with an increase of 23 percentage points among panelists living below the poverty level (see Annex I.A.7). Progression to the active use (90 day) stage of the customer journey increased substantially after demonetization. During the pre-demonetization period, 33 percent of panelists reported advancing to this stage, compared with 49 percent during the post-demonetization period (Figure 5). Prior to the announcement of demonetization, few panelists (4 percent) had advanced to the final, advanced active use stage of the banking customer journey. After demonetization, the proportion of panelists at the final stage of the bank customer journey did not increase significantly (Annex I.A.17).
25 InterMedia. (2017, June 6). India Wave 4 Report – FII Tracker Survey. Retreived from http://finclusion.org/uploads/file/reports/India%20Wave%204%20Report_8-Jun-2017.pdf 26 Ibid.
4
49
77
80
20
4
33
49
52
48
Advanced activeuse
Active use
Registration
Access and trial
Nonuser
Figure 5: The bank customer journey
(Shown: Percentage of all panelists, N=1,600)
Pre-demonetization
Post-demonetization
19
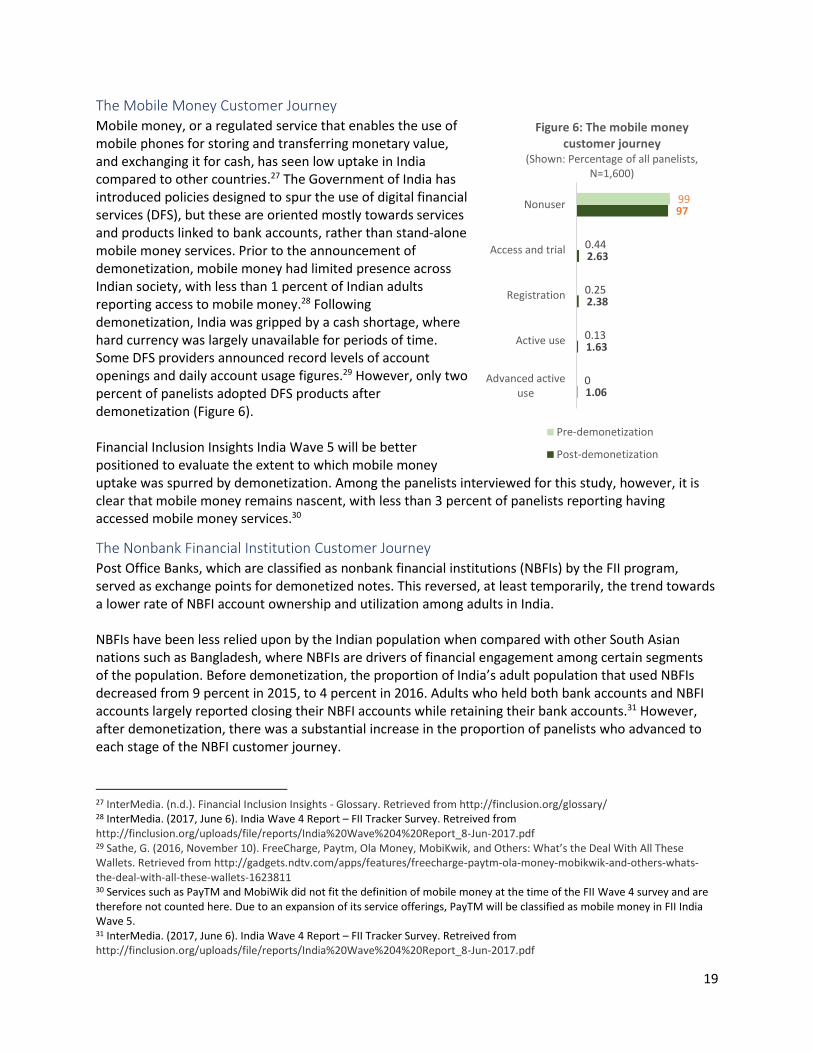
The Mobile Money Customer Journey Mobile money, or a regulated service that enables the use of mobile phones for storing and transferring monetary value, and exchanging it for cash, has seen low uptake in India compared to other countries.27 The Government of India has introduced policies designed to spur the use of digital financial services (DFS), but these are oriented mostly towards services and products linked to bank accounts, rather than stand-alone mobile money services. Prior to the announcement of demonetization, mobile money had limited presence across Indian society, with less than 1 percent of Indian adults reporting access to mobile money.28 Following demonetization, India was gripped by a cash shortage, where hard currency was largely unavailable for periods of time. Some DFS providers announced record levels of account openings and daily account usage figures.29 However, only two percent of panelists adopted DFS products after demonetization (Figure 6). Financial Inclusion Insights India Wave 5 will be better positioned to evaluate the extent to which mobile money uptake was spurred by demonetization. Among the panelists interviewed for this study, however, it is clear that mobile money remains nascent, with less than 3 percent of panelists reporting having accessed mobile money services.30
The Nonbank Financial Institution Customer Journey Post Office Banks, which are classified as nonbank financial institutions (NBFIs) by the FII program, served as exchange points for demonetized notes. This reversed, at least temporarily, the trend towards a lower rate of NBFI account ownership and utilization among adults in India. NBFIs have been less relied upon by the Indian population when compared with other South Asian nations such as Bangladesh, where NBFIs are drivers of financial engagement among certain segments of the population. Before demonetization, the proportion of India’s adult population that used NBFIs decreased from 9 percent in 2015, to 4 percent in 2016. Adults who held both bank accounts and NBFI accounts largely reported closing their NBFI accounts while retaining their bank accounts.31 However, after demonetization, there was a substantial increase in the proportion of panelists who advanced to each stage of the NBFI customer journey.
27 InterMedia. (n.d.). Financial Inclusion Insights - Glossary. Retrieved from http://finclusion.org/glossary/ 28 InterMedia. (2017, June 6). India Wave 4 Report – FII Tracker Survey. Retreived from http://finclusion.org/uploads/file/reports/India%20Wave%204%20Report_8-Jun-2017.pdf 29 Sathe, G. (2016, November 10). FreeCharge, Paytm, Ola Money, MobiKwik, and Others: What’s the Deal With All These Wallets. Retrieved from http://gadgets.ndtv.com/apps/features/freecharge-paytm-ola-money-mobikwik-and-others-whats-the-deal-with-all-these-wallets-1623811 30 Services such as PayTM and MobiWik did not fit the definition of mobile money at the time of the FII Wave 4 survey and are therefore not counted here. Due to an expansion of its service offerings, PayTM will be classified as mobile money in FII India Wave 5. 31 InterMedia. (2017, June 6). India Wave 4 Report – FII Tracker Survey. Retreived from http://finclusion.org/uploads/file/reports/India%20Wave%204%20Report_8-Jun-2017.pdf
1.06
1.63
2.38
2.63
97
0
0.13
0.25
0.44
99
Advanced activeuse
Active use
Registration
Access and trial
Nonuser
Figure 6: The mobile money customer journey
(Shown: Percentage of all panelists, N=1,600)
Pre-demonetization
Post-demonetization
20
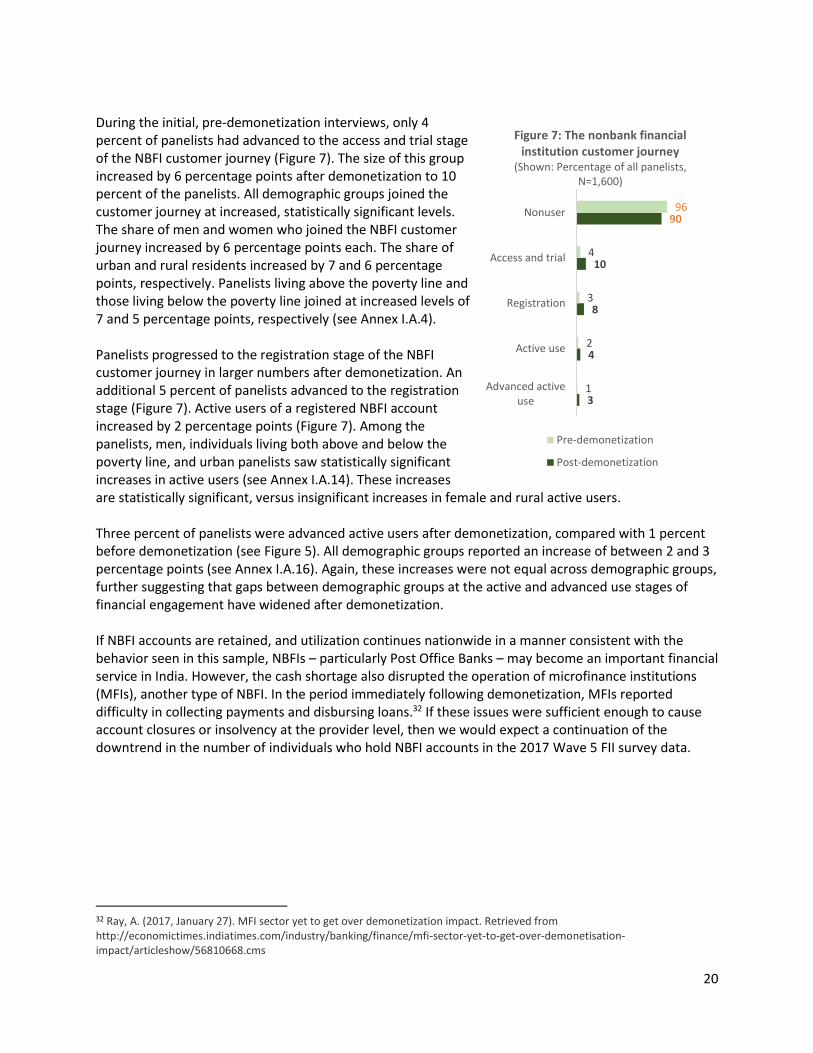
During the initial, pre-demonetization interviews, only 4 percent of panelists had advanced to the access and trial stage of the NBFI customer journey (Figure 7). The size of this group increased by 6 percentage points after demonetization to 10 percent of the panelists. All demographic groups joined the customer journey at increased, statistically significant levels. The share of men and women who joined the NBFI customer journey increased by 6 percentage points each. The share of urban and rural residents increased by 7 and 6 percentage points, respectively. Panelists living above the poverty line and those living below the poverty line joined at increased levels of 7 and 5 percentage points, respectively (see Annex I.A.4). Panelists progressed to the registration stage of the NBFI customer journey in larger numbers after demonetization. An additional 5 percent of panelists advanced to the registration stage (Figure 7). Active users of a registered NBFI account increased by 2 percentage points (Figure 7). Among the panelists, men, individuals living both above and below the poverty line, and urban panelists saw statistically significant increases in active users (see Annex I.A.14). These increases are statistically significant, versus insignificant increases in female and rural active users. Three percent of panelists were advanced active users after demonetization, compared with 1 percent before demonetization (see Figure 5). All demographic groups reported an increase of between 2 and 3 percentage points (see Annex I.A.16). Again, these increases were not equal across demographic groups, further suggesting that gaps between demographic groups at the active and advanced use stages of financial engagement have widened after demonetization. If NBFI accounts are retained, and utilization continues nationwide in a manner consistent with the behavior seen in this sample, NBFIs – particularly Post Office Banks – may become an important financial service in India. However, the cash shortage also disrupted the operation of microfinance institutions (MFIs), another type of NBFI. In the period immediately following demonetization, MFIs reported difficulty in collecting payments and disbursing loans.32 If these issues were sufficient enough to cause account closures or insolvency at the provider level, then we would expect a continuation of the downtrend in the number of individuals who hold NBFI accounts in the 2017 Wave 5 FII survey data.
32 Ray, A. (2017, January 27). MFI sector yet to get over demonetization impact. Retrieved from http://economictimes.indiatimes.com/industry/banking/finance/mfi-sector-yet-to-get-over-demonetisation-impact/articleshow/56810668.cms
3
4
8
10
90
1
2
3
4
96
Advanced activeuse
Active use
Registration
Access and trial
Nonuser
Figure 7: The nonbank financial institution customer journey
(Shown: Percentage of all panelists, N=1,600)
Pre-demonetization
Post-demonetization
21
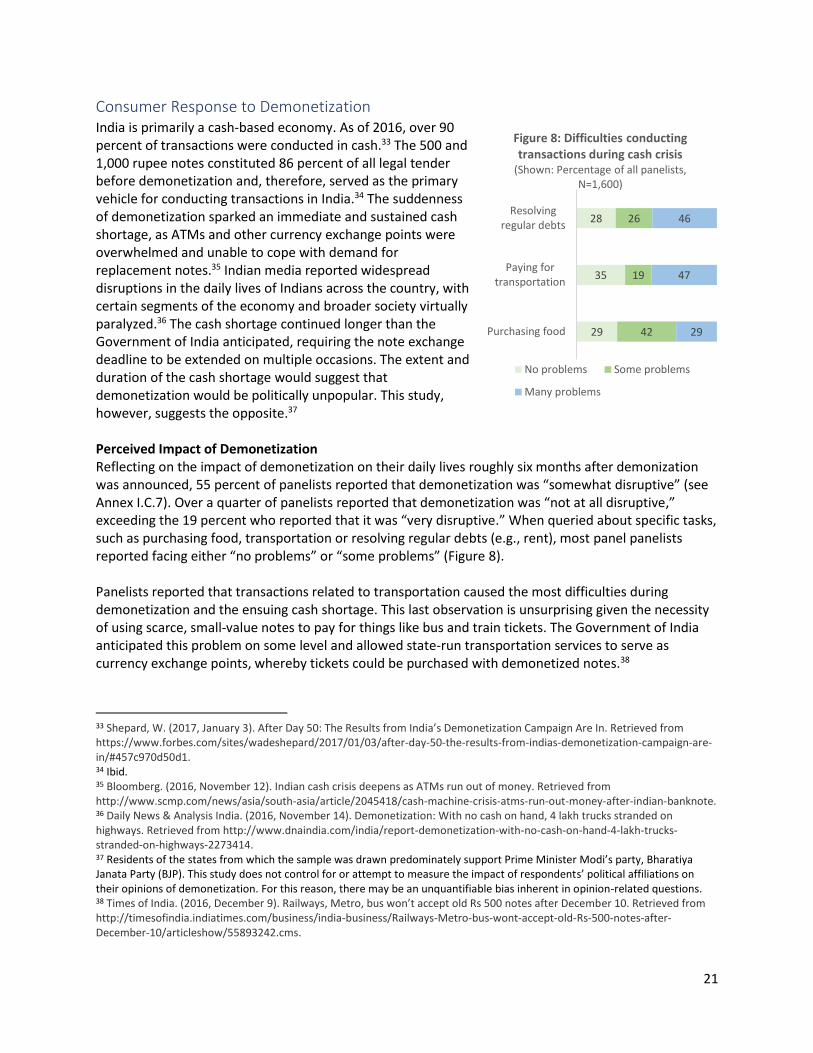
Consumer Response to Demonetization India is primarily a cash-based economy. As of 2016, over 90 percent of transactions were conducted in cash.33 The 500 and 1,000 rupee notes constituted 86 percent of all legal tender before demonetization and, therefore, served as the primary vehicle for conducting transactions in India.34 The suddenness of demonetization sparked an immediate and sustained cash shortage, as ATMs and other currency exchange points were overwhelmed and unable to cope with demand for replacement notes.35 Indian media reported widespread disruptions in the daily lives of Indians across the country, with certain segments of the economy and broader society virtually paralyzed.36 The cash shortage continued longer than the Government of India anticipated, requiring the note exchange deadline to be extended on multiple occasions. The extent and duration of the cash shortage would suggest that demonetization would be politically unpopular. This study, however, suggests the opposite.37 Perceived Impact of Demonetization Reflecting on the impact of demonetization on their daily lives roughly six months after demonization was announced, 55 percent of panelists reported that demonetization was “somewhat disruptive” (see Annex I.C.7). Over a quarter of panelists reported that demonetization was “not at all disruptive,” exceeding the 19 percent who reported that it was “very disruptive.” When queried about specific tasks, such as purchasing food, transportation or resolving regular debts (e.g., rent), most panel panelists reported facing either “no problems” or “some problems” (Figure 8). Panelists reported that transactions related to transportation caused the most difficulties during demonetization and the ensuing cash shortage. This last observation is unsurprising given the necessity of using scarce, small-value notes to pay for things like bus and train tickets. The Government of India anticipated this problem on some level and allowed state-run transportation services to serve as currency exchange points, whereby tickets could be purchased with demonetized notes.38
33 Shepard, W. (2017, January 3). After Day 50: The Results from India’s Demonetization Campaign Are In. Retrieved from https://www.forbes.com/sites/wadeshepard/2017/01/03/after-day-50-the-results-from-indias-demonetization-campaign-are-in/#457c970d50d1. 34 Ibid. 35 Bloomberg. (2016, November 12). Indian cash crisis deepens as ATMs run out of money. Retrieved from http://www.scmp.com/news/asia/south-asia/article/2045418/cash-machine-crisis-atms-run-out-money-after-indian-banknote. 36 Daily News & Analysis India. (2016, November 14). Demonetization: With no cash on hand, 4 lakh trucks stranded on highways. Retrieved from http://www.dnaindia.com/india/report-demonetization-with-no-cash-on-hand-4-lakh-trucks-stranded-on-highways-2273414. 37 Residents of the states from which the sample was drawn predominately support Prime Minister Modi’s party, Bharatiya Janata Party (BJP). This study does not control for or attempt to measure the impact of respondents’ political affiliations on their opinions of demonetization. For this reason, there may be an unquantifiable bias inherent in opinion-related questions. 38 Times of India. (2016, December 9). Railways, Metro, bus won’t accept old Rs 500 notes after December 10. Retrieved from http://timesofindia.indiatimes.com/business/india-business/Railways-Metro-bus-wont-accept-old-Rs-500-notes-after-December-10/articleshow/55893242.cms.
29
35
28
42
19
26
29
47
46
Purchasing food
Paying fortransportation
Resolvingregular debts
Figure 8: Difficulties conducting transactions during cash crisis
(Shown: Percentage of all panelists, N=1,600)
No problems Some problems
Many problems
22
Overall, panelists reported that conducting transactions during the cash shortage was moderately difficult, but not overwhelmingly so. Difficulties were also reported equally across the demographic groups. There were no statistically significant differences present between gender and locality. There was a statistically significant difference between the difficulty reported by those above versus below the poverty line, but the substantive difference was marginal (Annex I.C.1). Adoption of DFS as a Response to the Cash Shortage During the demonetization-induced cash shortage, the Government of India and private sector actors promoted cashless payments as a means to avoid the most disruptive aspects of demonetization. Roughly two weeks after the announcement of demonetization, Prime Minister Modi directed his ministers to begin promoting digital financial services (DFS) internally and among constituents. Prime Minister Modi also explicitly called for a cashless society.39 Within 24 hours of the demonetization announcement, the mobile financial service, PayTM, undertook a nationwide advertisement campaign.40 The realities of the cash shortage, paired with the promotion of DFS, drove individuals to adopt cashless payments for the first time. Seven percent of panelists reported they used a digital payment method for the first time because of demonetization (see Annex I.C.2). While there was no statistically significant gender gap, there were gaps in the rate of DFS adoption between income and locality groups. Eight percent of panelists living above the poverty line reported using DFS payments for the first time, compared with 2 percent of panelists living below the poverty line. Seven percent of urban residents reported using DFS payments for the first time, compared with 3 percent of rural panelists. Panelists who adopted DFS payments were broadly satisfied with the service. The average panelist reported being “somewhat likely” to continue using DFS payment products in the future (see Annex I.C.3), with no statistically significant differences reported between demographic groups. Perceived Outcomes of Demonetization Despite a popular perception that demonetization caused disruptions to daily life, panelists generally perceived demonetization as a necessary policy that was effectively implemented and which resulted in meaningful change. These results, it is worth acknowledging, may be influenced by the political affiliation of the typical resident in the sample states. When asked to respond to a series of statements regarding demonetization’s implementation, effects and impact, the average panelist reported that they “somewhat agreed” that results were positive in these regards (see Annex I.C.4). There are no statistically significant differences in average levels of agreement between male and female panelists, nor between panelists living above or below the poverty line. Urban residents agreed that results were positive more often than did rural dwellers.
39 Financial Express. (2016, November 28). PM Modi directs ministers to promote cashless payment across nation. Retrieved from http://www.financialexpress.com/economy/pm-modi-directs-ministers-to-promote-cashless-payment-across-nation/458485/. 40 News Nation. (2016, November 10). New Paytm ad in newspapers thanking PM Modi for demonetisation move draws flak
from opposition. Retrieved from http://www.newsnation.in/article/150581-new-paytm-ad-in-newspapers-thanks-pm-modi-for-
currency-ban-bjp-rivals-smell-rat.html.
23
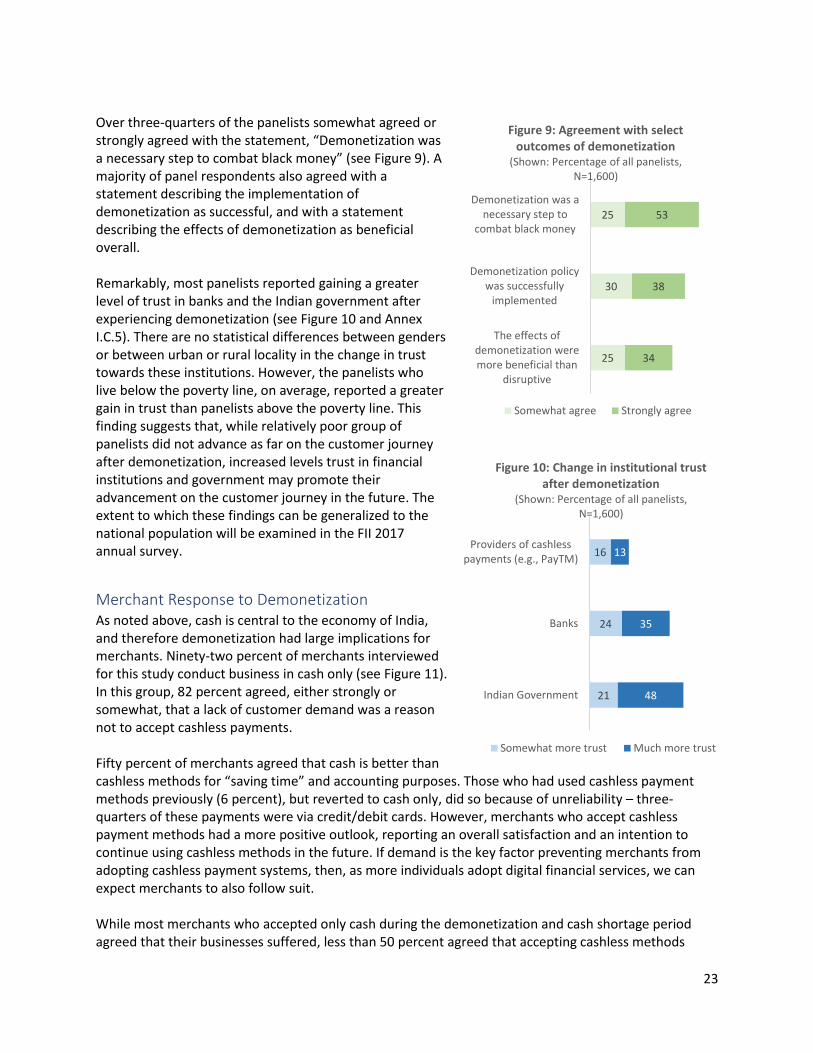
Over three-quarters of the panelists somewhat agreed or strongly agreed with the statement, “Demonetization was a necessary step to combat black money” (see Figure 9). A majority of panel respondents also agreed with a statement describing the implementation of demonetization as successful, and with a statement describing the effects of demonetization as beneficial overall. Remarkably, most panelists reported gaining a greater level of trust in banks and the Indian government after experiencing demonetization (see Figure 10 and Annex I.C.5). There are no statistical differences between genders or between urban or rural locality in the change in trust towards these institutions. However, the panelists who live below the poverty line, on average, reported a greater gain in trust than panelists above the poverty line. This finding suggests that, while relatively poor group of panelists did not advance as far on the customer journey after demonetization, increased levels trust in financial institutions and government may promote their advancement on the customer journey in the future. The extent to which these findings can be generalized to the national population will be examined in the FII 2017 annual survey.
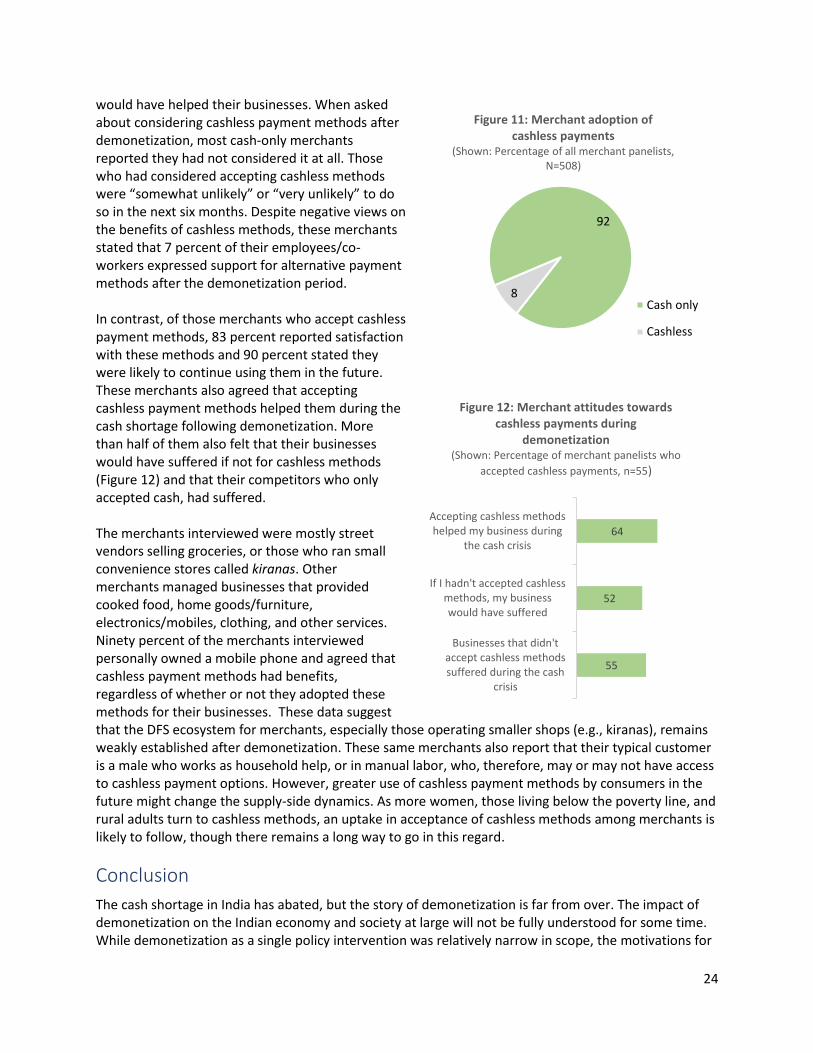
Merchant Response to Demonetization As noted above, cash is central to the economy of India, and therefore demonetization had large implications for merchants. Ninety-two percent of merchants interviewed for this study conduct business in cash only (see Figure 11). In this group, 82 percent agreed, either strongly or somewhat, that a lack of customer demand was a reason not to accept cashless payments. Fifty percent of merchants agreed that cash is better than cashless methods for “saving time” and accounting purposes. Those who had used cashless payment methods previously (6 percent), but reverted to cash only, did so because of unreliability – three-quarters of these payments were via credit/debit cards. However, merchants who accept cashless payment methods had a more positive outlook, reporting an overall satisfaction and an intention to continue using cashless methods in the future. If demand is the key factor preventing merchants from adopting cashless payment systems, then, as more individuals adopt digital financial services, we can expect merchants to also follow suit. While most merchants who accepted only cash during the demonetization and cash shortage period agreed that their businesses suffered, less than 50 percent agreed that accepting cashless methods
25
30
25
34
38
53
The effects ofdemonetization weremore beneficial than
disruptive
Demonetization policywas successfully
implemented
Demonetization was anecessary step to
combat black money
Figure 9: Agreement with select outcomes of demonetization
(Shown: Percentage of all panelists, N=1,600)
Somewhat agree Strongly agree
21
24
16
48
35
13
Indian Government
Banks
Providers of cashlesspayments (e.g., PayTM)
Figure 10: Change in institutional trust after demonetization
(Shown: Percentage of all panelists, N=1,600)
Somewhat more trust Much more trust
24
would have helped their businesses. When asked about considering cashless payment methods after demonetization, most cash-only merchants reported they had not considered it at all. Those who had considered accepting cashless methods were “somewhat unlikely” or “very unlikely” to do so in the next six months. Despite negative views on the benefits of cashless methods, these merchants stated that 7 percent of their employees/co-workers expressed support for alternative payment methods after the demonetization period. In contrast, of those merchants who accept cashless payment methods, 83 percent reported satisfaction with these methods and 90 percent stated they were likely to continue using them in the future. These merchants also agreed that accepting cashless payment methods helped them during the cash shortage following demonetization. More than half of them also felt that their businesses would have suffered if not for cashless methods (Figure 12) and that their competitors who only accepted cash, had suffered. The merchants interviewed were mostly street vendors selling groceries, or those who ran small convenience stores called kiranas. Other merchants managed businesses that provided cooked food, home goods/furniture, electronics/mobiles, clothing, and other services. Ninety percent of the merchants interviewed personally owned a mobile phone and agreed that cashless payment methods had benefits, regardless of whether or not they adopted these methods for their businesses. These data suggest that the DFS ecosystem for merchants, especially those operating smaller shops (e.g., kiranas), remains weakly established after demonetization. These same merchants also report that their typical customer is a male who works as household help, or in manual labor, who, therefore, may or may not have access to cashless payment options. However, greater use of cashless payment methods by consumers in the future might change the supply-side dynamics. As more women, those living below the poverty line, and rural adults turn to cashless methods, an uptake in acceptance of cashless methods among merchants is likely to follow, though there remains a long way to go in this regard.
Conclusion
The cash shortage in India has abated, but the story of demonetization is far from over. The impact of demonetization on the Indian economy and society at large will not be fully understood for some time. While demonetization as a single policy intervention was relatively narrow in scope, the motivations for
55
52
64
Businesses that didn'taccept cashless methodssuffered during the cash
crisis
If I hadn't accepted cashlessmethods, my businesswould have suffered
Accepting cashless methodshelped my business during
the cash crisis
Figure 12: Merchant attitudes towards cashless payments during
demonetization (Shown: Percentage of merchant panelists who
accepted cashless payments, n=55)
92
8
Figure 11: Merchant adoption of cashless payments
(Shown: Percentage of all merchant panelists, N=508)
Cash only
Cashless
25
its implementation are part of a broader set of initiatives intended to increase financial inclusion and transform the economy of India. This study understands demonetization as but one part of a much wider Government of India initiative to increase financial inclusion among the population. Panelists generally reported that the policy was necessary and beneficial, despite being moderately disruptive. From this perspective, results from this study suggest that the policy was broadly successful at building public support while increasing financial inclusion. As a portion of the study group, the growth in new users of financial accounts exceeded any single annual increase observed by the Financial Inclusion Insights (FII) program, including the period in which PMJDY was introduced. Moreover, this study observes deepening engagement with financial services, as more panelists progressed to the active and advanced active use stages of the customer journey. Demonetization also drove increases in the utilization of financial services that overcame longstanding demographic barriers, with some exceptions. Over the pre- and post-demonetization period, women and rural residents advanced on the customer journey at higher rates than did their male and urban counterparts, reducing the gender gap and eliminating the locality gap. The income gap widened, however, suggesting that poverty will remain a strong barrier to financial inclusion. Compared to its effects on financial inclusion, demonetization was less successful at promoting a transition to a cashless society. New adopters of mobile money services were rare – less than 3 percent of the panelists. India remains in the early stages of DFS adoption after demonetization. While all demographic groups advanced on the mobile money customer journey, male panelists, those living above the poverty line and urban panelists saw greater gains than their female, rural, and poorer counterparts. Further, despite the challenges faced by merchants during the cash shortage, few turned to adopting DFS payment methods. The uptake of DFS in India, including mobile money, remains, for the time being, confined to early adopters. Since his dramatic demonetization declaration, Prime Minister Modi has announced additional policies aimed at restructuring the Indian financial system and promoting a cashless economy. These include, for example, linking biometric identifications (Aadhaar) to tax returns and subsidizing digital payments for government services. The Government of India has also introduced a new, smaller value note (200 rupee).41 As the repercussions of these developments take shape, InterMedia is well placed to capture the changing attitudes and behaviors towards financial services, on a national scale, through its upcoming Wave 5 survey, as well as through future targeted studies.
41Times of India. (2017, August 26). RBI to issue Rs 200 note on Friday. Retrieved from
http://timesofindia.indiatimes.com/business/india-business/rbi-to-issue-rs-200-note-on-friday/articleshow/60205670.cms
26
Annex I – Analysis Outputs
Annex I.A – Utilization of financial services (Consumer)
Annex I.A.1 – Financial access, by demographics (Shown: Percentage of all panelists within
demographic subcategory) Total Gender Poverty Status Locale
Male Female Above Below Urban Rural
Pre Post Pre Post Pre Post Pre Post Pre Post Pre Post Pre Post
Financial access
52.75
80.94
57.11
82.53
47.24
78.93
51.32
85.65
53.62
77.85
55.79
77.17
50.82
83.33
Difference
28.19* 25.42* 31.69* 34.33* 24.23* 21.38* 32.51*
*Chi-square statistic is statistically significant at 95-percent level or higher
Annex I.A.2 – Bank access, by demographics (Shown: Percentage of all panelists within
demographic subcategory) Total Gender Poverty Status Locale
Male Female Above Below Urban Rural
Pre Post Pre Post Pre Post Pre Post Pre Post Pre Post Pre Post
Bank access
51.88
79.63
56.55
80.96
45.97
77.93
50.83
84.07
52.52
76.71
54.66
74.44
50.10
82.92
Difference
27.75* 24.41* 31.96* 33.24* 24.19* 19.78* 32.82*
*Chi-square statistic is statistically significant at 95-percent level or higher
Annex I.A.3 – Mobile money access, by demographics (Shown: Percentage of all panelists within
demographic subcategory) Total Gender Poverty Status Locale
Male Female Above Below Urban Rural
Pre Post Pre Post Pre Post Pre Post Pre Post Pre Post Pre Post
Mobile money access
0.44 2.63 0.45 3.47 0.42 1.56 0.50 4.42 0.40 1.45 0.48 4.66 0.41 1.33
Difference 2.19* 3.02* 1.14* 3.92* 1.05* 4.18* 0.92*
*Chi-square statistic is statistically significant at 95-percent level or higher
Annex I.A.4 – NBFI access, by demographics (Shown: Percentage of all panelists within
demographic subcategory) Total Gender Poverty Status Locale
Male Female Above Below Urban Rural
Pre Post Pre Post
Pre Post Pre Post Pre Post
Pre Post Pre Post
NBFI access
3.50 9.56 2.80 9.18
4.38
10.04
3.14
10.25
3.72
9.11
4.66
11.58
2.76
8.28
Difference
6.06* 6.38* 5.66* 7.11* 5.39* 6.92* 5.52*
*Chi-square statistic is statistically significant at 95-percent level or higher
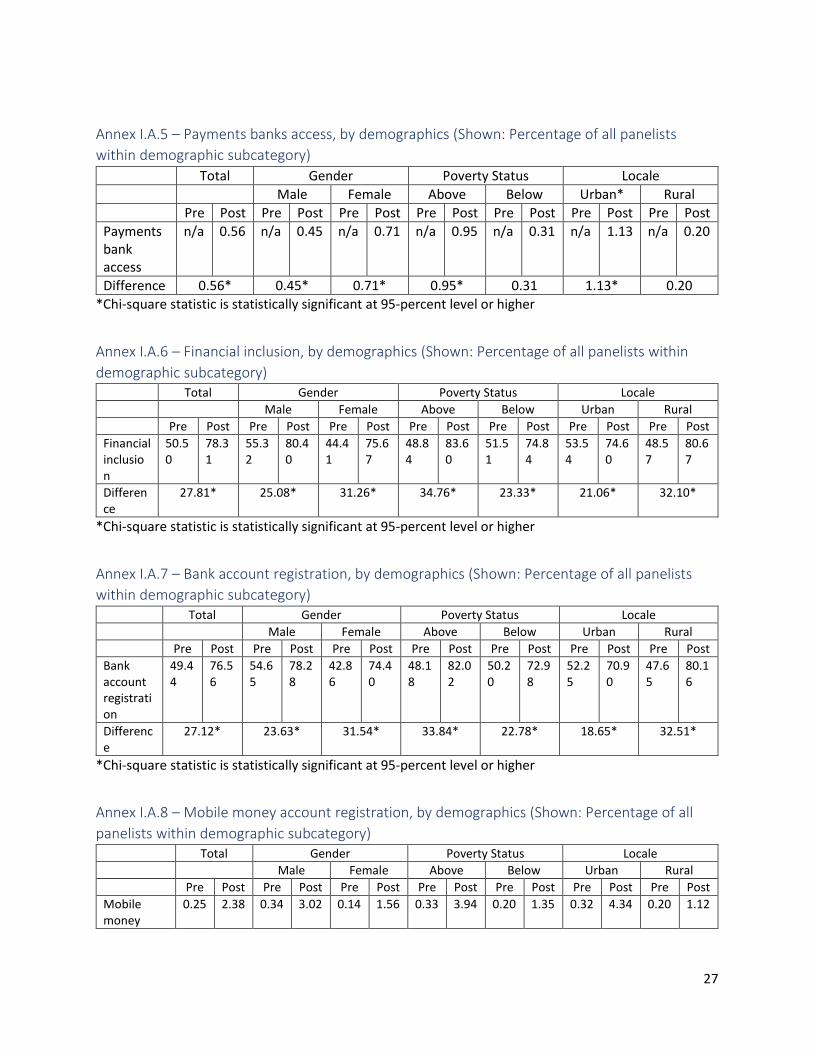
27
Annex I.A.5 – Payments banks access, by demographics (Shown: Percentage of all panelists
within demographic subcategory)
Total Gender Poverty Status Locale
Male Female Above Below Urban* Rural
Pre Post Pre Post Pre Post Pre Post Pre Post Pre Post Pre Post
Payments bank access
n/a 0.56 n/a 0.45 n/a 0.71 n/a 0.95 n/a 0.31 n/a 1.13 n/a 0.20
Difference 0.56* 0.45* 0.71* 0.95* 0.31 1.13* 0.20
*Chi-square statistic is statistically significant at 95-percent level or higher
Annex I.A.6 – Financial inclusion, by demographics (Shown: Percentage of all panelists within
demographic subcategory) Total Gender Poverty Status Locale
Male Female Above Below Urban Rural
Pre Post Pre Post Pre Post Pre Post Pre Post Pre Post Pre Post
Financial inclusion
50.50
78.31
55.32
80.40
44.41
75.67
48.84
83.60
51.51
74.84
53.54
74.60
48.57
80.67
Difference
27.81* 25.08* 31.26* 34.76* 23.33* 21.06* 32.10*
*Chi-square statistic is statistically significant at 95-percent level or higher
Annex I.A.7 – Bank account registration, by demographics (Shown: Percentage of all panelists
within demographic subcategory) Total Gender Poverty Status Locale
Male Female Above Below Urban Rural
Pre Post Pre Post Pre Post Pre Post Pre Post Pre Post Pre Post
Bank account registration
49.44
76.56
54.65
78.28
42.86
74.40
48.18
82.02
50.20
72.98
52.25
70.90
47.65
80.16
Difference
27.12* 23.63* 31.54* 33.84* 22.78* 18.65* 32.51*
*Chi-square statistic is statistically significant at 95-percent level or higher
Annex I.A.8 – Mobile money account registration, by demographics (Shown: Percentage of all
panelists within demographic subcategory) Total Gender Poverty Status Locale
Male Female Above Below Urban Rural
Pre Post Pre Post Pre Post Pre Post Pre Post Pre Post Pre Post
Mobile money
0.25 2.38 0.34 3.02 0.14 1.56 0.33 3.94 0.20 1.35 0.32 4.34 0.20 1.12
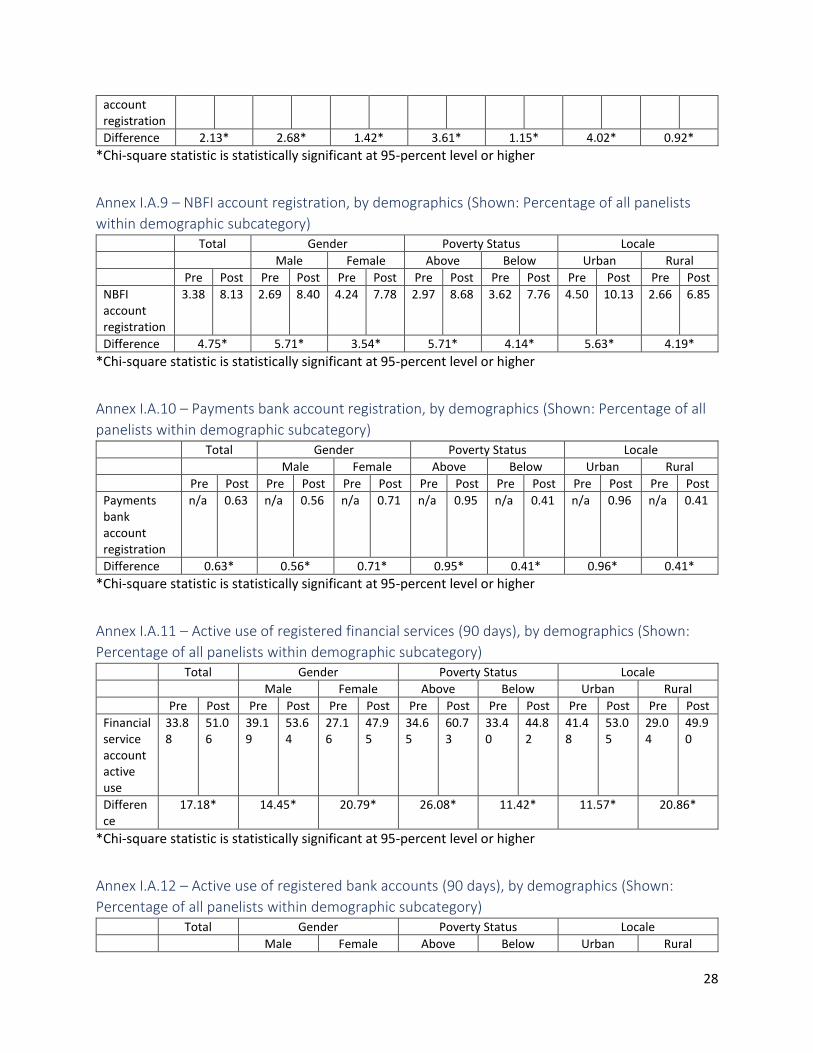
28
account registration
Difference 2.13* 2.68* 1.42* 3.61* 1.15* 4.02* 0.92*
*Chi-square statistic is statistically significant at 95-percent level or higher
Annex I.A.9 – NBFI account registration, by demographics (Shown: Percentage of all panelists
within demographic subcategory) Total Gender Poverty Status Locale
Male Female Above Below Urban Rural
Pre Post Pre Post Pre Post Pre Post Pre Post Pre Post Pre Post
NBFI account registration
3.38 8.13 2.69 8.40 4.24 7.78 2.97 8.68 3.62 7.76 4.50 10.13 2.66 6.85
Difference 4.75* 5.71* 3.54* 5.71* 4.14* 5.63* 4.19*
*Chi-square statistic is statistically significant at 95-percent level or higher
Annex I.A.10 – Payments bank account registration, by demographics (Shown: Percentage of all
panelists within demographic subcategory) Total Gender Poverty Status Locale
Male Female Above Below Urban Rural
Pre Post Pre Post Pre Post Pre Post Pre Post Pre Post Pre Post
Payments bank account registration
n/a 0.63 n/a 0.56 n/a 0.71 n/a 0.95 n/a 0.41 n/a 0.96 n/a 0.41
Difference 0.63* 0.56* 0.71* 0.95* 0.41* 0.96* 0.41*
*Chi-square statistic is statistically significant at 95-percent level or higher
Annex I.A.11 – Active use of registered financial services (90 days), by demographics (Shown:
Percentage of all panelists within demographic subcategory) Total Gender Poverty Status Locale
Male Female Above Below Urban Rural
Pre Post Pre Post Pre Post Pre Post Pre Post Pre Post Pre Post
Financial service account active use
33.88
51.06
39.19
53.64
27.16
47.95
34.65
60.73
33.40
44.82
41.48
53.05
29.04
49.90
Difference
17.18* 14.45* 20.79* 26.08* 11.42* 11.57* 20.86*
*Chi-square statistic is statistically significant at 95-percent level or higher
Annex I.A.12 – Active use of registered bank accounts (90 days), by demographics (Shown:
Percentage of all panelists within demographic subcategory) Total Gender Poverty Status Locale
Male Female Above Below Urban Rural
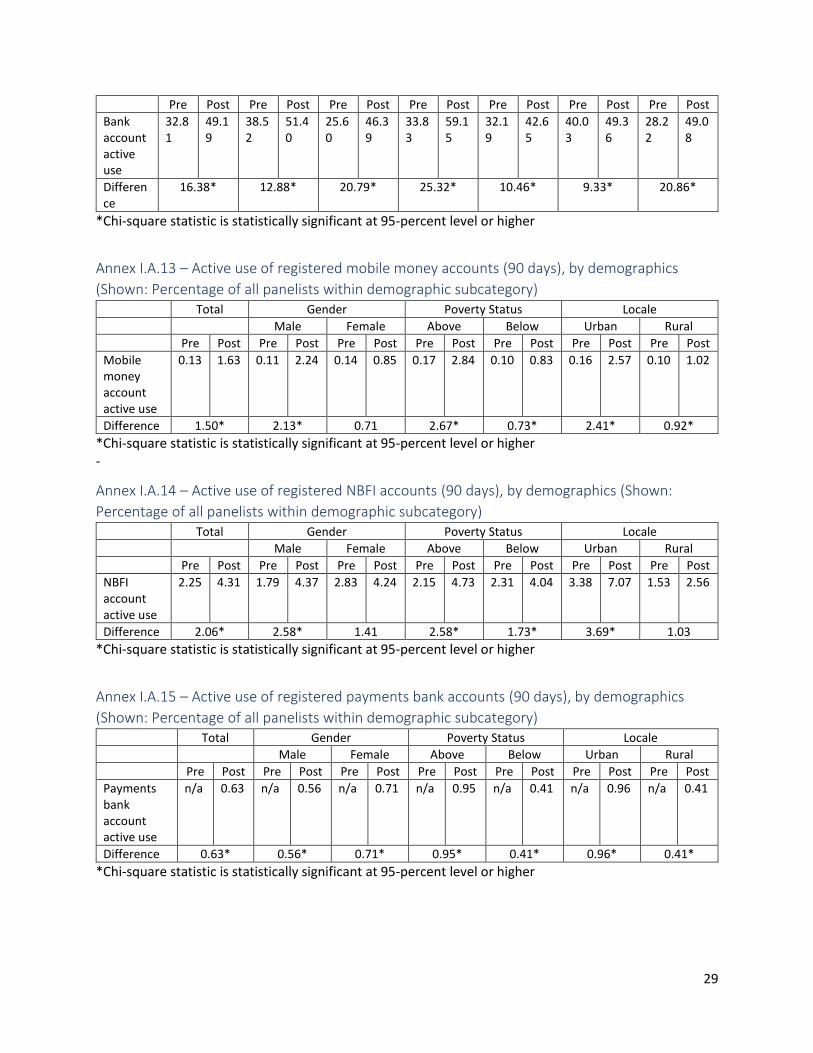
29
Pre Post Pre Post Pre Post Pre Post Pre Post Pre Post Pre Post
Bank account active use
32.81
49.19
38.52
51.40
25.60
46.39
33.83
59.15
32.19
42.65
40.03
49.36
28.22
49.08
Difference
16.38* 12.88* 20.79* 25.32* 10.46* 9.33* 20.86*
*Chi-square statistic is statistically significant at 95-percent level or higher
Annex I.A.13 – Active use of registered mobile money accounts (90 days), by demographics
(Shown: Percentage of all panelists within demographic subcategory) Total Gender Poverty Status Locale
Male Female Above Below Urban Rural
Pre Post Pre Post Pre Post Pre Post Pre Post Pre Post Pre Post
Mobile money account active use
0.13 1.63 0.11 2.24 0.14 0.85 0.17 2.84 0.10 0.83 0.16 2.57 0.10 1.02
Difference 1.50* 2.13* 0.71 2.67* 0.73* 2.41* 0.92*
*Chi-square statistic is statistically significant at 95-percent level or higher -
Annex I.A.14 – Active use of registered NBFI accounts (90 days), by demographics (Shown:
Percentage of all panelists within demographic subcategory) Total Gender Poverty Status Locale
Male Female Above Below Urban Rural
Pre Post Pre Post Pre Post Pre Post Pre Post Pre Post Pre Post
NBFI account active use
2.25 4.31 1.79 4.37 2.83 4.24 2.15 4.73 2.31 4.04 3.38 7.07 1.53 2.56
Difference 2.06* 2.58* 1.41 2.58* 1.73* 3.69* 1.03
*Chi-square statistic is statistically significant at 95-percent level or higher
Annex I.A.15 – Active use of registered payments bank accounts (90 days), by demographics
(Shown: Percentage of all panelists within demographic subcategory) Total Gender Poverty Status Locale
Male Female Above Below Urban Rural
Pre Post Pre Post Pre Post Pre Post Pre Post Pre Post Pre Post
Payments bank account active use
n/a 0.63 n/a 0.56 n/a 0.71 n/a 0.95 n/a 0.41 n/a 0.96 n/a 0.41
Difference 0.63* 0.56* 0.71* 0.95* 0.41* 0.96* 0.41*
*Chi-square statistic is statistically significant at 95-percent level or higher
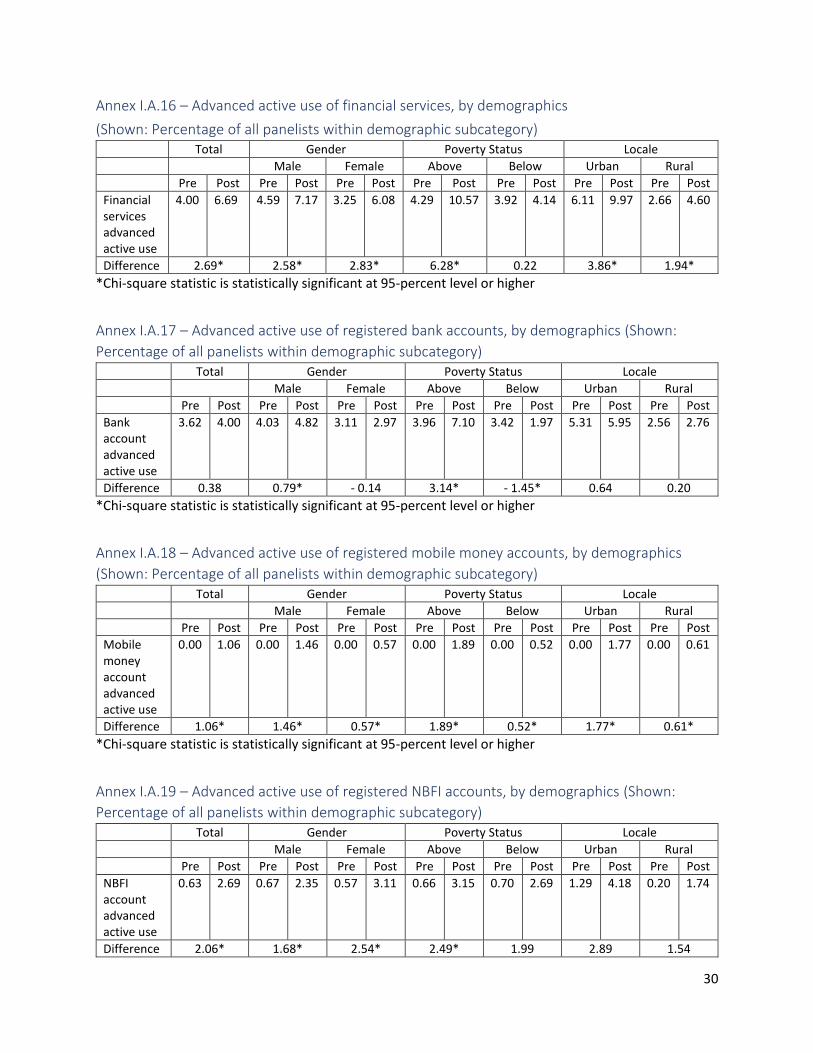
30
Annex I.A.16 – Advanced active use of financial services, by demographics
(Shown: Percentage of all panelists within demographic subcategory) Total Gender Poverty Status Locale
Male Female Above Below Urban Rural
Pre Post Pre Post Pre Post Pre Post Pre Post Pre Post Pre Post
Financial services advanced active use
4.00 6.69 4.59 7.17 3.25 6.08 4.29 10.57 3.92 4.14 6.11 9.97 2.66 4.60
Difference 2.69* 2.58* 2.83* 6.28* 0.22 3.86* 1.94*
*Chi-square statistic is statistically significant at 95-percent level or higher
Annex I.A.17 – Advanced active use of registered bank accounts, by demographics (Shown:
Percentage of all panelists within demographic subcategory) Total Gender Poverty Status Locale
Male Female Above Below Urban Rural
Pre Post Pre Post Pre Post Pre Post Pre Post Pre Post Pre Post
Bank account advanced active use
3.62 4.00 4.03 4.82 3.11 2.97 3.96 7.10 3.42 1.97 5.31 5.95 2.56 2.76
Difference 0.38 0.79* - 0.14 3.14* - 1.45* 0.64 0.20
*Chi-square statistic is statistically significant at 95-percent level or higher
Annex I.A.18 – Advanced active use of registered mobile money accounts, by demographics
(Shown: Percentage of all panelists within demographic subcategory) Total Gender Poverty Status Locale
Male Female Above Below Urban Rural
Pre Post Pre Post Pre Post Pre Post Pre Post Pre Post Pre Post
Mobile money account advanced active use
0.00 1.06 0.00 1.46 0.00 0.57 0.00 1.89 0.00 0.52 0.00 1.77 0.00 0.61
Difference 1.06* 1.46* 0.57* 1.89* 0.52* 1.77* 0.61*
*Chi-square statistic is statistically significant at 95-percent level or higher
Annex I.A.19 – Advanced active use of registered NBFI accounts, by demographics (Shown:
Percentage of all panelists within demographic subcategory) Total Gender Poverty Status Locale
Male Female Above Below Urban Rural
Pre Post Pre Post Pre Post Pre Post Pre Post Pre Post Pre Post
NBFI account advanced active use
0.63 2.69 0.67 2.35 0.57 3.11 0.66 3.15 0.70 2.69 1.29 4.18 0.20 1.74
Difference 2.06* 1.68* 2.54* 2.49* 1.99 2.89 1.54
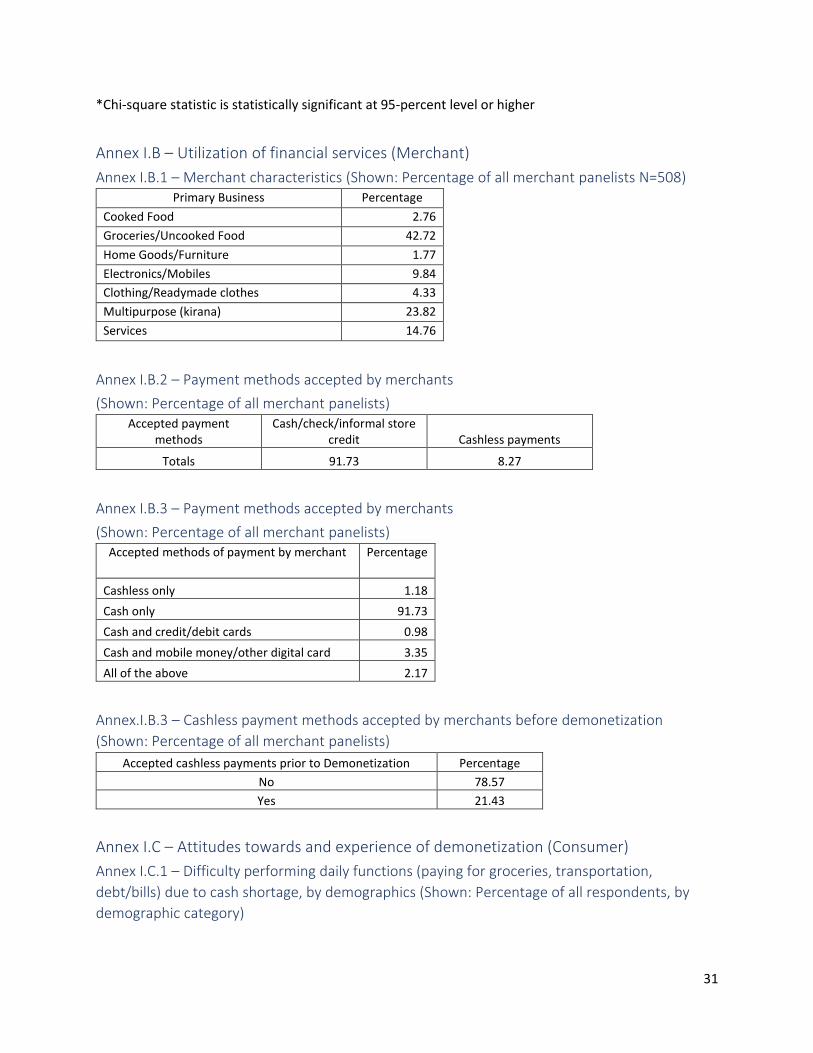
31
*Chi-square statistic is statistically significant at 95-percent level or higher
Annex I.B – Utilization of financial services (Merchant)
Annex I.B.1 – Merchant characteristics (Shown: Percentage of all merchant panelists N=508) Primary Business Percentage
Cooked Food 2.76
Groceries/Uncooked Food 42.72
Home Goods/Furniture 1.77
Electronics/Mobiles 9.84
Clothing/Readymade clothes 4.33
Multipurpose (kirana) 23.82
Services 14.76
Annex I.B.2 – Payment methods accepted by merchants
(Shown: Percentage of all merchant panelists) Accepted payment
methods Cash/check/informal store
credit Cashless payments
Totals 91.73 8.27
Annex I.B.3 – Payment methods accepted by merchants
(Shown: Percentage of all merchant panelists) Accepted methods of payment by merchant Percentage
Cashless only 1.18
Cash only 91.73
Cash and credit/debit cards 0.98
Cash and mobile money/other digital card 3.35
All of the above 2.17
Annex.I.B.3 – Cashless payment methods accepted by merchants before demonetization
(Shown: Percentage of all merchant panelists)
Accepted cashless payments prior to Demonetization Percentage
No 78.57
Yes 21.43
Annex I.C – Attitudes towards and experience of demonetization (Consumer)
Annex I.C.1 – Difficulty performing daily functions (paying for groceries, transportation,
debt/bills) due to cash shortage, by demographics (Shown: Percentage of all respondents, by
demographic category)
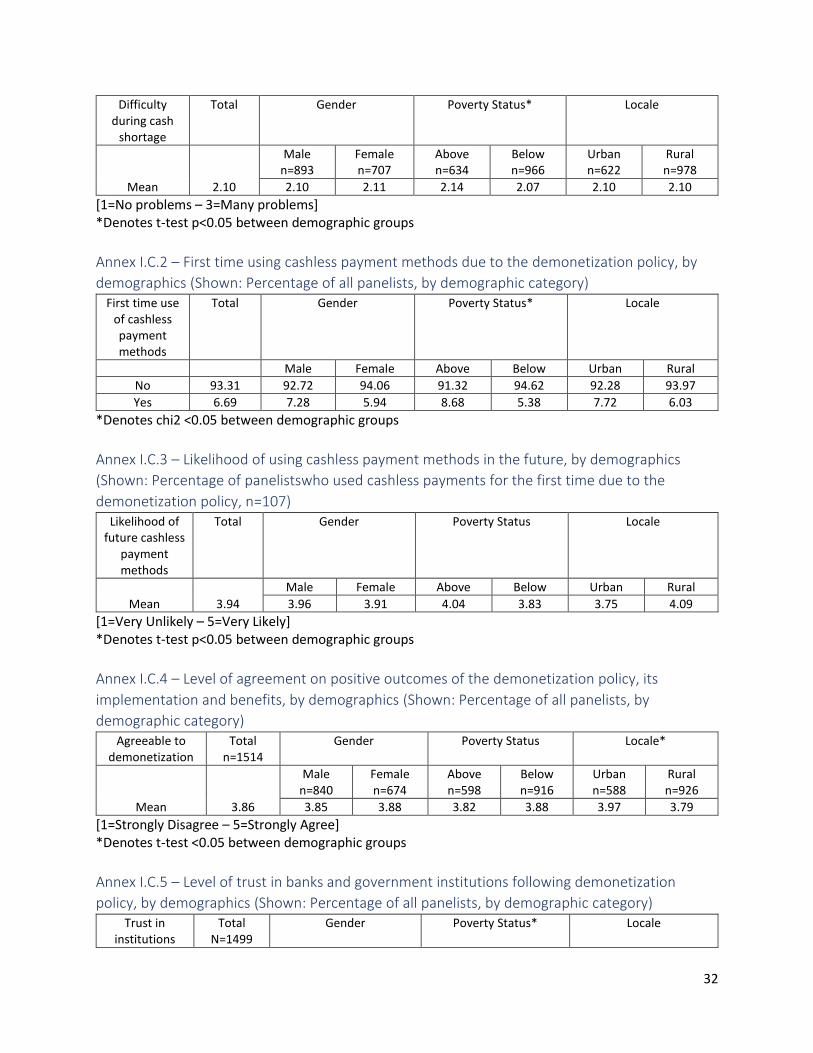
32
Difficulty during cash
shortage
Total Gender Poverty Status* Locale
Mean 2.10
Male n=893
Female n=707
Above n=634
Below n=966
Urban n=622
Rural n=978
2.10 2.11 2.14 2.07 2.10 2.10
[1=No problems – 3=Many problems] *Denotes t-test p<0.05 between demographic groups
Annex I.C.2 – First time using cashless payment methods due to the demonetization policy, by
demographics (Shown: Percentage of all panelists, by demographic category) First time use
of cashless payment methods
Total Gender Poverty Status* Locale
Male Female Above Below Urban Rural
No 93.31 92.72 94.06 91.32 94.62 92.28 93.97
Yes 6.69 7.28 5.94 8.68 5.38 7.72 6.03
*Denotes chi2 <0.05 between demographic groups
Annex I.C.3 – Likelihood of using cashless payment methods in the future, by demographics
(Shown: Percentage of panelistswho used cashless payments for the first time due to the
demonetization policy, n=107) Likelihood of
future cashless payment methods
Total Gender Poverty Status Locale
Mean 3.94
Male Female Above Below Urban Rural
3.96 3.91 4.04 3.83 3.75 4.09
[1=Very Unlikely – 5=Very Likely] *Denotes t-test p<0.05 between demographic groups
Annex I.C.4 – Level of agreement on positive outcomes of the demonetization policy, its
implementation and benefits, by demographics (Shown: Percentage of all panelists, by
demographic category) Agreeable to
demonetization Total
n=1514 Gender Poverty Status Locale*
Mean 3.86
Male n=840
Female n=674
Above n=598
Below n=916
Urban n=588
Rural n=926
3.85 3.88 3.82 3.88 3.97 3.79
[1=Strongly Disagree – 5=Strongly Agree] *Denotes t-test <0.05 between demographic groups
Annex I.C.5 – Level of trust in banks and government institutions following demonetization
policy, by demographics (Shown: Percentage of all panelists, by demographic category) Trust in
institutions Total
N=1499 Gender Poverty Status* Locale
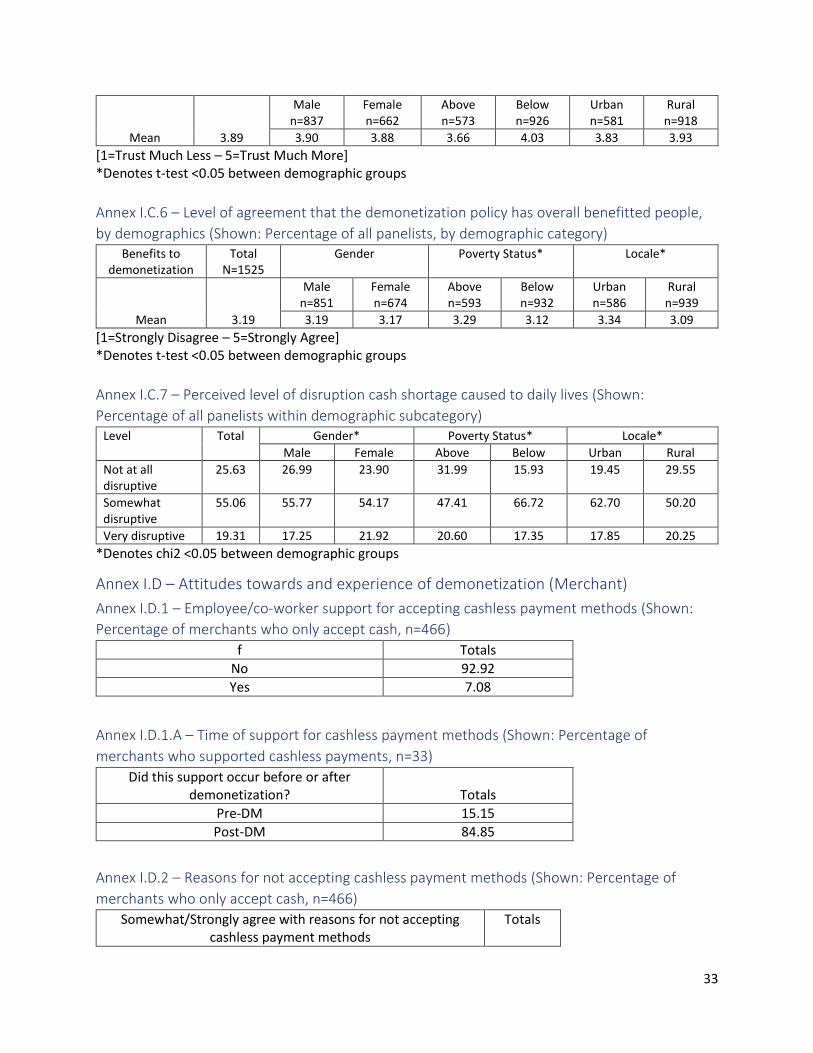
33
Mean 3.89
Male n=837
Female n=662
Above n=573
Below n=926
Urban n=581
Rural n=918
3.90 3.88 3.66 4.03 3.83 3.93
[1=Trust Much Less – 5=Trust Much More] *Denotes t-test <0.05 between demographic groups
Annex I.C.6 – Level of agreement that the demonetization policy has overall benefitted people,
by demographics (Shown: Percentage of all panelists, by demographic category) Benefits to
demonetization Total
N=1525 Gender Poverty Status* Locale*
Mean 3.19
Male n=851
Female n=674
Above n=593
Below n=932
Urban n=586
Rural n=939
3.19 3.17 3.29 3.12 3.34 3.09
[1=Strongly Disagree – 5=Strongly Agree] *Denotes t-test <0.05 between demographic groups
Annex I.C.7 – Perceived level of disruption cash shortage caused to daily lives (Shown:
Percentage of all panelists within demographic subcategory) Level Total Gender* Poverty Status* Locale*
Male Female Above Below Urban Rural
Not at all disruptive
25.63 26.99 23.90 31.99 15.93 19.45 29.55
Somewhat disruptive
55.06 55.77 54.17 47.41 66.72 62.70 50.20
Very disruptive 19.31 17.25 21.92 20.60 17.35 17.85 20.25
*Denotes chi2 <0.05 between demographic groups
Annex I.D – Attitudes towards and experience of demonetization (Merchant)
Annex I.D.1 – Employee/co-worker support for accepting cashless payment methods (Shown:
Percentage of merchants who only accept cash, n=466)
f Totals
No 92.92
Yes 7.08
Annex I.D.1.A – Time of support for cashless payment methods (Shown: Percentage of
merchants who supported cashless payments, n=33)
Did this support occur before or after demonetization? Totals
Pre-DM 15.15
Post-DM 84.85
Annex I.D.2 – Reasons for not accepting cashless payment methods (Shown: Percentage of
merchants who only accept cash, n=466)
Somewhat/Strongly agree with reasons for not accepting cashless payment methods
Totals
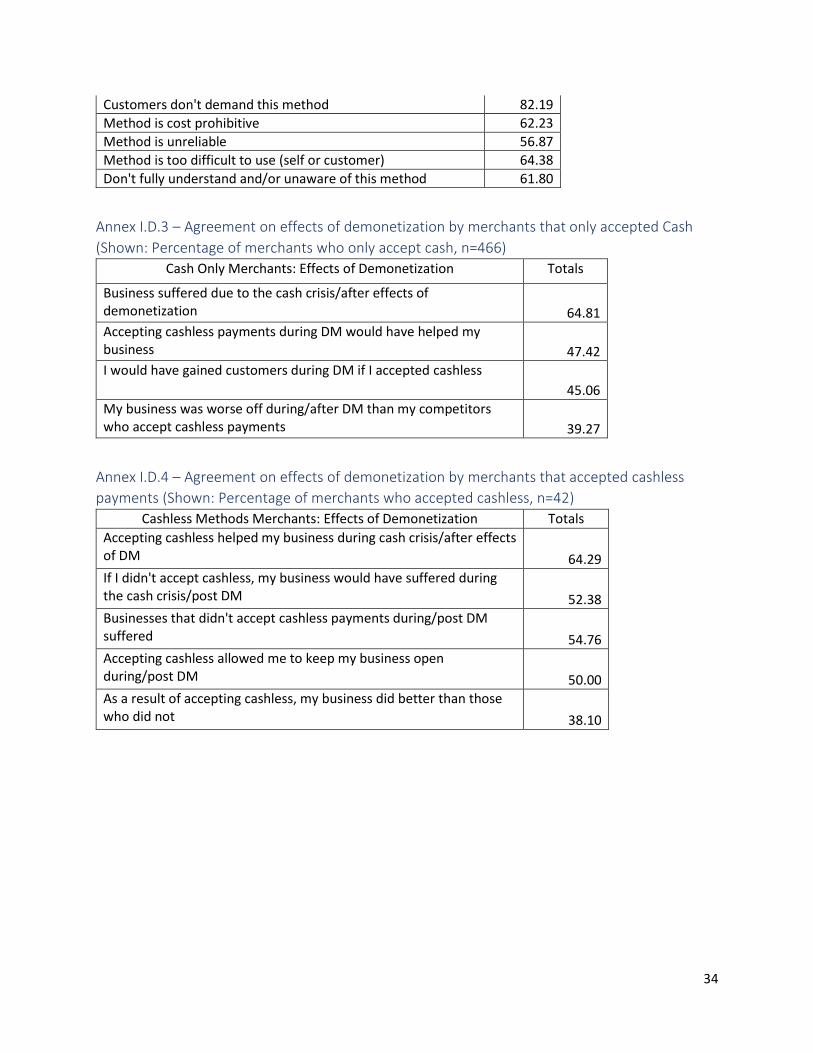
34
Customers don't demand this method 82.19
Method is cost prohibitive 62.23
Method is unreliable 56.87
Method is too difficult to use (self or customer) 64.38
Don't fully understand and/or unaware of this method 61.80
Annex I.D.3 – Agreement on effects of demonetization by merchants that only accepted Cash
(Shown: Percentage of merchants who only accept cash, n=466)
Cash Only Merchants: Effects of Demonetization Totals
Business suffered due to the cash crisis/after effects of demonetization 64.81
Accepting cashless payments during DM would have helped my business 47.42
I would have gained customers during DM if I accepted cashless
45.06
My business was worse off during/after DM than my competitors who accept cashless payments 39.27
Annex I.D.4 – Agreement on effects of demonetization by merchants that accepted cashless
payments (Shown: Percentage of merchants who accepted cashless, n=42)
Cashless Methods Merchants: Effects of Demonetization Totals
Accepting cashless helped my business during cash crisis/after effects of DM 64.29
If I didn't accept cashless, my business would have suffered during the cash crisis/post DM 52.38
Businesses that didn't accept cashless payments during/post DM suffered 54.76
Accepting cashless allowed me to keep my business open during/post DM 50.00
As a result of accepting cashless, my business did better than those who did not 38.10
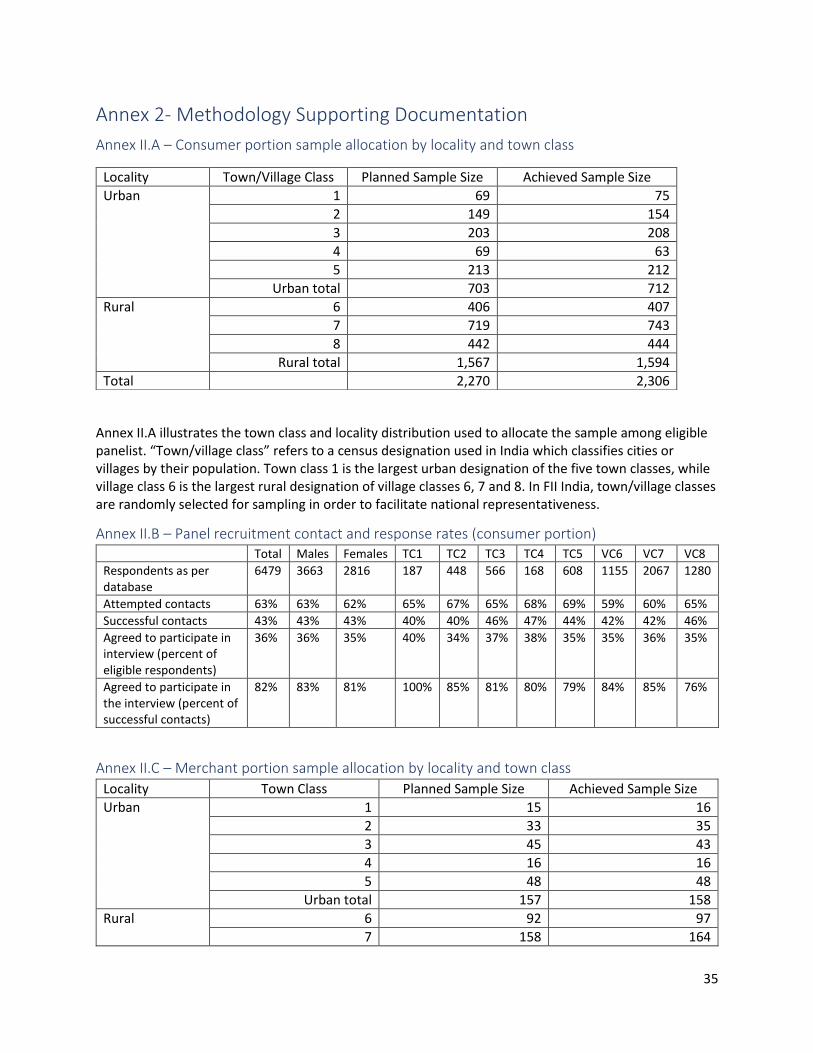
35
Annex 2- Methodology Supporting Documentation
Annex II.A – Consumer portion sample allocation by locality and town class
Annex II.A illustrates the town class and locality distribution used to allocate the sample among eligible panelist. “Town/village class” refers to a census designation used in India which classifies cities or villages by their population. Town class 1 is the largest urban designation of the five town classes, while village class 6 is the largest rural designation of village classes 6, 7 and 8. In FII India, town/village classes are randomly selected for sampling in order to facilitate national representativeness.
Annex II.B – Panel recruitment contact and response rates (consumer portion) Total Males Females TC1 TC2 TC3 TC4 TC5 VC6 VC7 VC8
Respondents as per database
6479 3663 2816 187 448 566 168 608 1155 2067 1280
Attempted contacts 63% 63% 62% 65% 67% 65% 68% 69% 59% 60% 65%
Successful contacts 43% 43% 43% 40% 40% 46% 47% 44% 42% 42% 46%
Agreed to participate in interview (percent of eligible respondents)
36% 36% 35% 40% 34% 37% 38% 35% 35% 36% 35%
Agreed to participate in the interview (percent of successful contacts)
82% 83% 81% 100% 85% 81% 80% 79% 84% 85% 76%
Annex II.C – Merchant portion sample allocation by locality and town class
Locality Town Class Planned Sample Size Achieved Sample Size
Urban 1 15 16
2 33 35
3 45 43
4 16 16
5 48 48
Urban total 157 158
Rural 6 92 97
7 158 164
Locality Town/Village Class Planned Sample Size Achieved Sample Size
Urban 1 69 75
2 149 154
3 203 208
4 69 63
5 213 212
Urban total 703 712
Rural 6 406 407
7 719 743
8 442 444
Rural total 1,567 1,594
Total 2,270 2,306

36
8 94 89
Rural total 344 350
Total 501 508