Embed Size (px)
Citation preview
University of Mississippi University of Mississippi
eGrove eGrove
Electronic Theses and Dissertations Graduate School
2015
The Effects Of Departmentalized And Self-Contained Structures The Effects Of Departmentalized And Self-Contained Structures
On Student Achievement On Student Achievement
Carrie Renee Skelton University of Mississippi
Follow this and additional works at: https://egrove.olemiss.edu/etd
Part of the Education Commons
Recommended Citation Recommended Citation Skelton, Carrie Renee, "The Effects Of Departmentalized And Self-Contained Structures On Student Achievement" (2015). Electronic Theses and Dissertations. 499. https://egrove.olemiss.edu/etd/499
This Dissertation is brought to you for free and open access by the Graduate School at eGrove. It has been accepted for inclusion in Electronic Theses and Dissertations by an authorized administrator of eGrove. For more information, please contact [email protected].

THE EFFECTS OF DEPARTMENTALIZED AND SELF-CONTAINED STRUCTURES ON
STUDENT ACHIEVEMENT
A Dissertation
Presented for the
Doctor of Philosophy
Degree
The University of Mississippi
by
CARRIE R. SKELTON
May 2015

Copyright © 2015 by Carrie R. Skelton
ALL RIGHTS RESERVED

! !
! ii!
ABSTRACT
The present study investigated the effects of departmentalized and self-contained classroom
structures on student achievement of fourth, fifth, and sixth grade students in Mississippi
schools. Historical MCT2 proficiency level percentages were collected from the Mississippi
Department of Education website for the following school years: 2009-2010, 2010-2011, 2011-
2012, and 2012-2013. This data was used to calculate a revised Quality of Distribution Index
(QDI-R) for each school included in the study. Using the QDI-R, differences were generated
between school year (SY) 2009-2010 and SY 2010-2011; between SY 2010-2011 and SY 2011-
2012; and between SY 2011-2012 and SY 2012-2013. This yielded three data points for
measuring student achievement in the study.
An email questionnaire was distributed to schools in order to determine which structure was
being utilized in each school for each grade level. Follow up phone calls were made to those
failing to respond to the email request. Once this information was collected, the population of
the study included 247 schools serving fourth grade, 242 schools serving fifth grade, and 207
schools serving sixth grade.
A one-way Multivariate Analysis of Variance (MANOVA) was conducted for determining if
a difference existed between the two structures for each grade level. Findings revealed no
significant difference between structures in language arts for grades four, five, or six. There was
also no evidence of a significant difference between structures for grade four and five
mathematics. A significant difference was found between the two structures for grade six
mathematics.
! !
! iii!
DEDICATION
For my grandmother, Mrs. Cassie Skelton
For my mother, Ms. Janet Skelton
For my dearest friend, Ms. Summer Pannell

! !
! iv!
ACKNOWLEDGEMENTS
I would like to extend a special thank you to Dr. Dennis Bunch for his assistance and
guidance in the preparation and completion of this dissertation. I would also like to thank my
committee members: Dr. Doug Davis, Dr. Ryan Niemeyer, and Dr. Kerry Holmes. I appreciate
each of them for taking time to serve on my committee.
Additionally, I would like to thank my superintendent, Mr. Jerry Moore, for being so
supportive and understanding during this process. I would also like to thank Jill Tomlinson,
Sabrina Holley, Felicia Sharp, Summer Pannell, Dana Walker, Keosha Seldon, Shelby Dyer, and
Lottie Sanderson for assisting with making phone calls for collecting the data. I offer my
sincerest thanks to Mr. Sam Gorgi for teaching me how to calculate the data.
I would also like to offer my sincerest gratitude to my family for being so thoughtful,
understanding, and encouraging throughout this journey. I lost a great deal of time with them
while working towards this milestone in my life, but they encouraged me throughout by
reminding me it would all be worth it in the end.
Finally, I would like to acknowledge and offer my greatest appreciation for Ms. Summer
Pannell and Ms. Demeka Smith. The three of us began this journey together, and I am thankful
we finished it together. Without Demeka’s encouragement and prayers, I wonder if I’d made it
through this process. Without Summer, I’d never started this process because I was terrified of
! !
! v!
the intimidating thought of writing and defending a dissertation. Summer believed in me when I
did not believe in myself. She was there for those days when I felt like quitting, encouraging me
to keep going. She will never know the amount of gratitude, appreciation, and admiration I feel
for her.
! !
! vi!
TABLE OF CONTENTS
PAGE
ABSTRACT………………………………………………………………………………… ii
DEDICATION……………………………………………………………………………… iii
ACKNOWLEDGEMENTS………………………………………………………………… iv
LIST OF TABLES………………………………………………………………………….. viii
I. INTRODUCTION………………………………………………………………………. 1
Statement of the Problem…………………………………………………………… 4
Significance of the Study…………………………………………………………… 5
Research Question………………………………………………………………….. 6
Research Hypotheses……………………………………………………………….. 7
Limitations of the Study……………………………………………………………. 8
Definition of Terms………………………………………………………………… 9
II. REVIEW OF THE LITERATURE…………………………………………………….. 12
History of School Organizational Structures………………………………………. 12
Public School Accountability……………………………………………………… 16
Previous Research on Departmentalized and Self-Contained Structures………….. 20
Conclusion…………………………………………………………………………. 34
III. METHODOLOGY……………………………………………………………………. 35
Introduction………………………………………………………………………… 35
! !
! vii!
Design ……………………………………………………………………………… 36
Population and Participants………………………………………………………… 38
Hypotheses…………………………………………………………………………. 39
Instruments…………………………………………………………………………. 39
Statistical Tests and Data Analyses………………………………………………… 40
IV. RESULTS………………………………………………………………………………. 41
Introduction…………………………………………………………………………. 41
Fourth Grade Analysis………………………………………………………………. 42
Fifth Grade Analysis………………………………………………………………… 52
Sixth Grade Analysis………………………………………………………………... 59
Summary of Findings……………………………………………………………….. 66
V. SUMMARY AND DISCUSSION……………………………………………………… 68
Introduction………………………………………………………………………….. 68
Summary of the Study………………………………………………………………. 68
Summary of the Findings…………………………………………………………… 70
Discussion of Findings and Limitations…………………………………………….. 71
Implications for Application and Future Research………………………………….. 72
Conclusions………………………………………………………………………….. 74
VI. BIBLIOGRAPHY……………………………………………………………………….. 76
VII. LIST OF APPENDICES……………………………………………………………….. 84
VIII. VITA……………………………………………………………..………………….... 118
! !
! viii!
LIST OF TABLES
PAGE
1. Summary of Grade 4 Univariate Outliers Determined by Boxplot Analysis…………….... 44
2. Shapiro-Wilk Grade 4 Violations of Normality…………………………………………… 45
3. Descriptive Statistics for Grade 4 Language Arts…………………………………………. 48
4. Descriptive Statistics for Grade 4 Mathematics…………………………………………… 50
5. Summary of Grade 5 Univariate Outliers Determined by Boxplot Analysis……………… 53
6. Shapiro-Wilk Grade 5 Violations of Normality…………………………………………… 54
7. Descriptive Statistics for Grade 5 Language Arts…………………………………………. 57
8. Descriptive Statistics for Grade 5 Mathematics…………………………………………… 58
9. Summary of Grade 6 Univariate Outliers Determined by Boxplot Analysis……………… 61
10. Shapiro-Wilk Grade 4 Violations of Normality………………………………………….. 62
11. Descriptive Statistics for Grade 6 Language Arts………………………………………... 64
12. Descriptive Statistics for Grade 6 Mathematics………………………………………….. 65
13. Summary of Findings…………………………………………………………………….. 67
! !
! 1!
CHAPTER ONE
Introduction
The following study compares the percentage differences of departmentalized classroom
structures and self-contained classroom structures on student academic performance in grades
four, five, and six. The goal is to help understand the relationship between classroom
instructional structure and improved student achievement. Because standardized testing results
have become the focal point in determining a school’s success or failure since the inception of
No Child Left Behind (NCLB), investigating the impact of the two instructional structures on
student achievement yields beneficial information for school leaders.
Due to sanctions imposed on school districts by the federal and state governments, school
leaders are constantly evaluating operational systems and organizational structures to determine
the most effective means of helping students meet required standards. The classroom
organizational structure is an issue facing school administrators each year (Rogers, 2012). In a
self-contained classroom, a group of students are instructed by a single teacher for the majority,
if not the entirety, of the instructional day. From this single teacher, students receive instruction
in reading, grammar, math, science, and social studies. In this setting, non-core courses such as
physical education and fine arts are often, but not always departmentalized. These non-core
subjects are taught by teachers specializing in this content area (Welbourne, 2005).
Departmentalization came about in the early twentieth century, typically in grades seven
through twelve (Liu, 2011). In a departmentalized setting, the core subjects (reading,
mathematics, language arts, science, and social studies) are typically taught by different teachers.
! !
! 2!
Departmentalization may consist of a different teacher for each subject, or students transitioning
to different teachers who provide instruction in multiple subjects (Rogers, 2012). Although there
has been experimentation with departmentalization in lower grades, the self-contained structure
is most utilized in elementary classrooms.
Education has been a topic of emphasis in the United States since colonial times.
According to the United States Department of Education (2012), states and communities, public
and private organizations, have the responsibility of establishing schools and colleges,
developing curricula, and determining requirements for enrollment and graduation. In 1867,
Andrew Johnson signed legislation creating the first U.S. Department of Education for collecting
information on schools and teaching to help states establish effective school systems. Because of
fears the Department of Education would exercise too much control over local schools, the
department was demoted to the Office of Education in 1868 (Murphy, 1997). In October 1979,
President Jimmy Carter signed into law the Department of Education Organization Act of 1979.
The purpose of this law was to strengthen the federal commitment to ensuring equal educational
opportunities for every individual (Department of Education Organization Act of 1979).
Measuring the effectiveness of school systems eventually led to the idea of national
assessments. From this idea, the National Assessment of Educational Progress (NAEP) was
derived. The first national assessments were administered in 1969 to states electing to
participate (National Assessment of Educational Progress, 2012b). Prior to 2001, state
participation in NAEP testing was voluntary. However, in 2001, reauthorization of the
Elementary and Secondary Education Act of 1965 (ESEA), also known as NCLB, required states
receiving Title I funding to participate in NAEP in reading and mathematics at grades four and
eight every two years (National Association of Educational Progress, 2012a). According to

! !
! 3!
NAEP (2012a), results are reported about subject-matter achievement, instructional experiences,
and school environment for specified populations of students. Educators can then compare the
knowledge and skills of their students with students in other states and across the nation.
In an effort to increase student achievement and meet federal guidelines set with each
reauthorization of ESEA, the Mississippi performance-based accreditation system has received
numerous overhauls; however, these attempts have done little to bolster relative student
achievement. According to 2013 NAEP results, Mississippi ranks 51st of 51 in K-12 student
achievement, dropping one notch lower from 2012 (Amy, 2014).
In 2001, the ESEA was reauthorized as the No Child Left Behind Act (NCLB).
According to Rosenberg, Westling, and McLeskey (2012), NCLB mandates compliance to high
achievement standards and sanctions states and schools failing to meet standards. The legislation
also mandates students be assessed on state standards with the goal of reaching one hundred
percent proficiency in reading and mathematics by 2014 (Dee & Jacob, 2011).
In response to the federal mandates set forth in NCLB, Mississippi began revising the
language arts and mathematics state frameworks and began creating new assessments
corresponding with the standards (MDE, 2012). The Mississippi Curriculum Test, Second
Edition (MCT2) is based on the revised language arts frameworks of 2006 and the revised
mathematics frameworks of 2007. According to the Mississippi Department of Education Office
of Student Assessment (2014), the MCT2 is a measure of student achievement in language arts
and mathematics in grades 3-8, serving as the basis for the state accountability model in these
grades. The MCT2 was first administered to Mississippi students during the 2007-2008 school
year.
The MDE Office of Student Assessment (2014) explains Performance Level Descriptors
! !
! 4!
(PLDs) provide information about expected level of student performance on the assessment. The
PLDs are divided into four levels of increasing difficulty and complexity: Advanced, Proficient,
Basic, and Minimal. The MDE Office of Student Assessment (2014) describes students labeled
advanced as those who dependably perform beyond expectations required to be successful in the
next grade level. Students ranging within the proficient category demonstrate expected mastery
of knowledge and skills required for the next grade level. MDE contends students performing at
the basic level exhibit limited grasp of knowledge and skills in the course and may experience
lack of success at the next grade level. Students falling into the minimal category inconsistently
accomplish mastery of knowledge or skills. Students scoring minimal need remediation in
lacking knowledge and skills necessary for success at the next grade level (MDE, 2014).
Statement of the Problem
The purpose of this quasi-experimental design quantitative study is to compare student
academic performance, measured by comparing Mississippi schools with self-contained
classroom structures to those with departmentalized classroom structures. The study focuses on
changes in percentage of MCT2 performance level in grades four, five, and six between school
years (SY) 2009-2010 and 2010-2011, between SY 2010-2011 and 2011-2012, and between
2011-2012 and 2012-2013. Recent studies conducted on this topic focus on small sample sizes
and/or one subject. Bingham (2011) conducted a study comparing the effect of the two
structures on student achievement in mathematics using third grade test data from two similar
Title I schools, one self-contained and one departmentalized. Results of Bingham’s study
revealed self-contained students showed a higher percentage of meeting and exceeding standards
than departmentalized students. Moore (2008) conducted a study using sixty-seven schools in
Northeast Tennessee comparing the effect of school structure on student achievement in all
! !
! 5!
subjects. Findings in this study indicate no significant difference in self-contained and
departmentalized students for fourth or fifth grade students in language arts, science, and social
studies and no significant difference in fourth grade mathematics. There was a significant
difference in scores for fifth grade mathematics indicating departmentalized is more effective at
this grade level for this subject. Moore recommends conducting a similar study with a larger
sample size, which may yield more generalizable results. This study adds to the current research
because this study is comprehensive, incorporating all public fourth, fifth, and sixth grade
classrooms in the state of Mississippi through a four-year longitudinal examination. This study
and resulting comparison will aid school leaders in determining the most effective instructional
structure for student achievement in Mississippi schools.
This study identifies the achievement differences among MCT2 performance levels for
individual schools between SY 2009-2010 and SY 2010-2011. The differences were calculated
for the following three school years, resulting in two additional data points for comparison. The
measure of change was calculated by attaining the percentage of students scoring in each of the
four performance levels according to the Mississippi Department of Education’s website. The
performance differences, both positive and negative, were imported into a spreadsheet using
SPSS, version 22. The differences were aggregated for each instructional model throughout the
public schools of Mississippi. The population consists of 574 Mississippi public schools serving
fourth, fifth, and/or sixth grade students. This amounts to all schools in Mississippi with
achievement data for grades four, five, and six for all four school years of the study.
Significance of the Study
The Mississippi Department of Education has mandated and executed many changes in
the education system since the passage of the Education Reform Act of 1982, including multiple
! !
! 6!
overhauls of the state accountability system, rewriting curriculum frameworks for language arts
and mathematics, developing the more rigorous MCT2 student assessments, and placing more
accountability on schools and districts for increasing student achievement. Although MDE has
taken measures to increase student achievement, NAEP scores provide evidence Mississippi
students continue to struggle academically. According to Amy (2014), Mississippi’s overall
score in K-12 achievement was an F and the state ranked 51st of 51 in this category.
In an effort to increase student proficiency in reading and mathematics, school leaders are
constantly searching for methods to improve student achievement. A number of researchers
contend teachers will be more effective if they specialize in the subject areas they most enjoy
(Chan & Jarman, 2004; Strohl, 2014). A small number of studies have revealed higher student
achievement in the self-contained setting (Lamme, 1976; Harris, 1996). Other studies have
shown no major differences in achievement of students in a departmentalized or self-contained
classroom setting (Findley, 1966; Andrews, 2006; Taylor-Buckner, 2014).
The proposed study advances existing research by utilizing a unique context. This
measure is the MCT2, a measure exclusive to Mississippi. Results of this study may assist
school leaders in determining the most effective organizational classroom structure for
maximizing student achievement in their school.
Research Question
For this study, the researcher sought to answer the following question: Is there a
statistically significant difference when comparing student performance in self-contained
classroom structures to students in departmentalized classroom structures in Mississippi schools
measured by the aggregated differences in percentage of MCT2 performance levels in grades
! !
! 7!
four, five, and six between SY 2009-2010 and 2010-2011, between SY 2010-2011 and 2011-
2012, and between 2011-2012 and 2012-2013?
Research Hypotheses
The potential numeric outcomes are numerous, but the primary research hypotheses are:
Ho1: There is no significant difference in fourth grade student performance in language arts when
comparing students in self-contained classroom structures to students in departmentalized
structures.
Ho2: There is no significant difference in fourth grade student performance in mathematics when
comparing students in self-contained classroom structures to students in departmentalized
structures.
Ho3: There is no significant difference in fifth grade student performance in language arts when
comparing students in self-contained classroom structures to students in departmentalized
structures.
Ho4: There is no significant difference in fifth grade student performance in mathematics when
comparing students in self-contained classroom structures against students in departmentalized
structures.
Ho5: There is no significant difference in sixth grade student performance in language arts when
comparing students in self-contained classroom structures against students in departmentalized
structures.
Ho6: There is no significant difference in sixth grade student performance in mathematics when
comparing students in self-contained classroom structures against students in departmentalized
structures.
! !
! 8!
Limitations of the Study
The major limitation of the study is the longitudinal data being utilized in determining
effect of classroom organizational structure on student performance. Although the data spans a
four year period, student growth residuals for fourth, fifth, and sixth grade classes throughout the
population would be more applicable data for measuring impact of organizational structure on
student achievement; however, MDE does not report student growth residuals by teacher. A
second limitation of the study is when considering student achievement, teacher quality is not
taken into consideration as a factor for an increase or lack of increase in student achievement.
The study does not include data on teachers’ highly qualified status, years experience, regular
attendance, or other attributes relevant to student achievement. With the exception of highly
qualified status, this information is not publicly accessible data.
Another key limitation is the study lacks internal validity checks because it is limited to
the classroom structures’ effect on student academic performance. The study fails to consider
other variables such as student enrollment, average teacher salary, student population
demographics, socioeconomic status, or school district millage rates; however, any of these
variables may be contributing factors in the results of this study.
A fourth limitation is the study focuses only on the two main classroom organizational
structures, departmentalized and self-contained. Structures such as team teaching or co-teaching,
for the sake of this study, are to be classified under the departmentalized structure.
The fifth limitation of the study resides in the fact the data is limited to only fourth, fifth,
and sixth grades. Because the researcher is including the entire population of schools in the state
of Mississippi, along with four years of data for both language arts and mathematics, the sheer
volume of data can lead to the data becoming unmanageable.
! !
! 9!
Another limitation of this study is the lack of inclusion of Mississippi’s recently adopted
Common Core State Standards (CCSS). There is no emphasis placed on the new standards in
this study because all data resulted from assessments prior to full implementation of CCSS in
Mississippi schools.
Definition of Terms
Adequate Yearly Progress (AYP): Adequate yearly progress (AYP) is the measure by
which schools, districts, and states are held accountable for student performance under Title I of
the No Child Left Behind Act of 2001 (NCLB), the current version of the Elementary and
Secondary Education Act. AYP, however, is not a new concept; it was introduced into federal
law in the ESEA's 1994 reauthorization (Editorial Projects in Education Research Center, 2011).
Criterion-referenced assessments: An approach to testing in which an individual’s score
on a test is interpreted by comparing it to a pre-specified standard of performance (Gall, Gall, &
Borg, 2007).
Education Reform Act of 1982: The Education Reform Act of 1982 was a landmark piece
of legislation passed by Mississippi Governor William Winter. The law mandated statewide
public kindergarten, compulsory school attendance, higher standards for teacher and student
performance, and the creation of a lay state board of education (JFK Library, 2008).
Framework: Competencies (required learning standards for all students) and objectives
(learning outcomes indicating how the competencies can be fulfilled) approved by the State
Department of Education (MDE, 2012).
National Assessment of Educational Progress (NAEP): NAEP is a congressionally
mandated project under the U.S. Department of Education’s National Center for Education
Statistics which collects and reports student performance in the United States. Commonly

! !
! 10!
referred to as the Nation’s Report Card, NAEP results includes representative samples of
students at grades four, eight, and twelve on reading, mathematics, science, history, writing, and
geography for elementary and secondary school students who attend both public and private
school (Education.com, n.d.).
No Child Left Behind (NCLB): NCLB is a 2001 education reform law signed into act by
President George W. Bush. This law is designed to hold schools accountable for the
performance of students who are struggling to learn. It is a reauthorization of the Elementary
and Secondary Education Act of 1965 (Education.com, n.d.).
Norming group: A large sample (ideally one that is representative of a well-defined
population) whose scores on a test provide a set of standards against which the scores of
subsequent individuals who take the test can be referenced (Gall, Gall, & Borg, 2007).
Norm-referenced assessments: An approach to testing in which an individual’s score on a
test is interpreted by comparing it to the scores earned by norming a group (Gall, Gall, & Borg,
2007).
Platooning: Also known as departmentalization, platooning is divvying up instruction
according to subject area, with students rotating to different teachers for different subjects
(Hood, 2009).
Proficiency: The National Assessment Governing Board has established a general
definition of proficiency: “Students reaching this level have demonstrated competency over
challenging subject matter, including subject-matter knowledge, application of such knowledge
to real world situations, and analytical skills appropriate to the subject matter (Fuller, Wright,
Gesicki, & Kang, 2007).
! !
! 11!
Scaled Scores: Conversion of a student’s raw score on a test or version of a test to a
common scale allowing for numerical comparison between students. Scale scores are useful for
comparing test scores over time (Education.com, n.d.).
Title I: Title I of the Elementary and Secondary Education Act, as amended (ESEA)
provides financial assistance to local educational agencies (LEAs) and schools with high
numbers or high percentages of children from low-income families to help ensure that all
children meet challenging state academic standards. Federal funds are currently allocated
through four statutory formulas that are based primarily on census poverty estimates and the cost
of education in each state (USDOE, 2014).
Quality of Distribution Index (QDI): Measures the distribution of student performance on
state assessments around the cut points for basic, proficient, and advanced performance. The
formula for the QDI is (%Basic) + (2 x %Proficient) + (3 x %Advanced) (MDE, 2012).
Quasi-experiment: Experimental situations in which the researcher assigns, but not
randomly, participants to groups because the experimenter cannot artificially create groups for
the experiment (Creswell, 2012).
! !
! 12!
CHAPTER TWO
Review of the Literature
This chapter presents a review of literature related to student achievement in
departmentalized and self-contained elementary school structures. In the era of accountability
and high stakes testing, school leaders are challenged to meet the growing demands for increased
levels of academic achievement for all students (Brinkman & Twiford, 2012).
This literature review presents the following information: the history of school
organizational structures, public school accountability, and previous research related to
departmentalized and self-contained education structures.
History of School Organizational Structures
The idea of education in America dates back to the colonial era. Reviewing the historical
context of education is important for providing a glimpse into how education began and how far
the system has advanced. Education in the American colonies began as a religious endeavor
(Brackemyre, 2012). The English Puritans who settled Boston in 1630 believed that children's
welfare, on earth and in the afterlife, depended in large part on their ability to read and
understand the Bible. They also believed the success of the colony rested on citizens being able
to read and understand the laws governing them. These beliefs led to the establishment of
schools (Mass Moments, 2005).
The nation’s oldest public school, the Boston Latin School, opened in 1635. Soon after,
Charlestown, Salem, and Dorchester followed. These grammar schools were paid for with
public funds, and aimed to educate boys preparing to enter the ministry (Mass Moments, 2005).
! !
! 13!
The responsibility for teaching all other children to read and write was left to parents or masters.
In order to enforce this rule, in 1642 Puritan leaders passed the Massachusetts Bay Law of
School. This law required parents and masters to teach dependents to read and write. Later, the
Puritan community questioned the effectiveness of this law and passed the Old Deluder Act of
1647 (Brackemyre, 2012). This Massachusetts law was the first to require towns to provide
schools, shifting the responsibility for educating children from home to the town. From this law,
all towns with fifty or more families were required to employ a schoolmaster to teach children
reading, writing, and arithmetic in common schools. Towns with one hundred or more families
were required to hire a schoolmaster to teach children reading, writing, arithmetic, and Latin in
grammar schools. In reality, many Massachusetts towns failed to establish such schools. The
schools which were established concentrated on producing an elite class of educated future
business and political leaders instead of the general public (Brackemyre, 2012).
The years following America’s independence from Britain did little to change the
American public education system (Brackemyre, 2012). In 1789 Massachusetts was the first
state in the American nation to pass a comprehensive education law. This legislation required all
teachers in grammar schools to provide proof they received a formal education in a college or
university and, equally important, were of good moral character. Even women who taught
neighborhood dame schools were to be certified by the selectmen (Mass Moments, 2005).
Thomas Jefferson’s Plan for Education. Thomas Jefferson, elected governor of
Virginia in 1779, was an early advocate for a public education system in America. According to
Tozer, Senese, and Violas (2009), in the Bill for the More General Diffusion of Knowledge,
Jefferson proposed four stages in his plan for Virginia’s education structure: elementary schools,
grammar schools, the university, and lifelong learning. Jefferson believed education was
! !
! 14!
necessary because voting citizens need to understand issues and be able to make informed
decisions (Brackemyre, 2012). He also believed happiness was perceived through knowledge
(Tozer et al., 2009). Jefferson’s plan was defeated in Congress multiple times.
The Common School Era. Elementary schooling was accessible for most children in
Massachusetts by the 1830s. The schools were locally controlled and attendance was voluntary.
The schools were normally poorly constructed rooms with poor lighting and primitive furniture.
One teacher typically instructed a large number of students ranging in age from two to twenty-
five (Tozer et al., 2009).
One of America’s most influential education activists was Horace Mann, a Massachusetts
native. While serving as senator, Mann successfully lobbied for Massachusetts to create a state
board of education and resigned from his senate seat in order to become Secretary of the
Massachusetts State Board of Education (Brackemeyer, 2012). While secretary, Mann focused
on multiple education issues such as school buildings, moral values, discipline, teachers, and the
economic value of education (Tozer et al., 2009).
In the 1840s, Mann traveled to Europe to view the Prussian system of education. He was
greatly influenced by their idea of the common school movement. Based on ideas from the
Prussian system, Mann worked to create a standardized, compulsory education system with
professionally trained teachers for all Massachusetts children (Brackemeyer, 2012).
Based on the Prussian system, Mann also introduced the system of separating students
into groups based on age and ability. The system was a success as it allowed students to learn
with children their own age (Brackemeyer, 2012).
The concept of a public system of education began to spread to other states in America.
Some states expressed concern over state systems of education, believing education should

! !
! 15!
remain a local decision (Tozer et al., 2009). However, a new democratic system, increased
immigration, advancements in industrialization, and stronger urbanization led favoring free
education at public expense (Bowersock, 1970).
Types of Schools. By the 1830s, subjects normally taught in early schools included
reading, spelling, writing, arithmetic, geography, manners and morals, and history. Sewing was
part of the curriculum for girls. One of the earliest of these schools was the dame school. Dame
schools were often found in households or empty buildings and held a few weeks at a time when
convenient for all involved. There were generally not more than thirty students at a time, with
boys ranging in age from four to seven and girls ranging from four and up (Bowersock, 1970).
Another type of school was the primary school. It was similar to the dame schools except
they were divided into four classes. In the highest class were the students who read in the
Testament. The second highest class consisted of students capable of easy reading. In order to be
eligible for the third group, students must be capable of spelling with at least two syllables.
Students in the lowest group received instruction in letters and monosyllables (Bowersock,
1970).
Near the end of the eighteenth century, the departmental school became prominent,
especially in New England states. According to Bowerstock, to be admitted to the departmental
school, students must have received instruction in a dame or primary school. In the departmental
school, courses were divided into separate departments and students received instruction in each
course from a different teacher in a different room.
Another early school structure was a graded school known as the Quincy Grammar
School. The original structure of this school was a four-story building with twelve classrooms.
For each classroom, there was one teacher and individual seats for up to fifty-five students. The
! !
! 16!
curriculum was divided into six different levels and each level was for a specific grade. Students
were to complete the work for the specific grade within a school year or be retained in the grade
for another school year (Bowersock, 1970).
Public School Accountability
In 1994, during the Clinton presidential administration, Congress passed Goals 2000: The
Educate America Act. According to the New York State Education Department (2006), Goals
2000 was a federal grant program supporting state development of standards and assessments
and school district implementation of standards-based reform (Goals 200: Educate America Act).
In October 1994, Clinton signed into law the reauthorization of ESEA, naming it the
Improving America’s Schools Act (IASA). Under IASA, states receiving federal funds were
required to have standards and assessments in place by the 2000-2001 school year. The USDOE
provided a flexibility waiver for Mississippi and a number of other states allowing more time for
meeting standards and assessment requirements (Improving America’s School Act of 1994; Hull,
2002). Mississippi’s deadline for compliance was June 2003. According to the MDE Office of
Research and Statistics (2010), the first live administration of the Mississippi Curriculum Test
(MCT) and the new Subject Area Tests in Algebra I, Biology I, English II, and U.S. History
occurred during the 2000-2001 school year.
On January 8, 2002, President George W. Bush signed into law the No Child Left Behind
Act (NCLB) of 2001 (No Child Left Behind Act of 2001). This education legislation set the
standards for assessing public schools’ success in maximizing student achievement. Lamb
(2007) explains NCLB is built on four common-sense pillars: accountability for results, an
emphasis on doing what works based on scientific research, expanded parental options, and
expanded local control and flexibility. An element of the accountability for results component
! !
! 17!
requires all public school teachers be highly qualified. Highly qualified indicates the teacher has
a college degree, possesses full state certification, and has passed subject-specific tests to ensure
competency. According to Rose (2004), NCLB requires public school districts and schools
demonstrate adequate yearly progress (AYP) toward a particular goal: universal student
attainment of academic achievement standards established by each state. All students, regardless
of their ethnicity, socioeconomic status, need for exceptional education services, native
language, or other limitations, must meet AYP (Brinkman & Twiford, 2012). Rose (2004)
emphasizes public schools not meeting AYP for two consecutive years could suffer loss of
federal funding, termination of staff, and dissolution of school districts.
Mississippi Performance Based Accountability System. The issue of education has
historically been challenging for Mississippi. A number of changes occurred from early 1900s to
1970 in the Mississippi Accrediting System. According to MDE (2012), the Accreditation Law
of 1970 gave the State Board of Education power to set standards and procedures and placed
responsibility on the MDE to enforce standards and procedures. During the late seventies and
early eighties, focus of accreditation standards began shifting from quantity-based measures such
as adequate personnel and resources to the quality of the education students receive.
In 1982, Mississippi Governor William Winter signed into law the Education Reform
Act. According to MDE (2012), this landmark legislation proposed a plan to establish guidelines
and criteria for a performance based school accreditation system for all public elementary and
high schools. The Commission on School Accreditation was formed to create performance-
based standards for measuring student mastery of defined content and objectives. The law
required more focus be placed on student achievement outcomes and changed the accreditation
process from voluntary to mandatory. The first assessments based on these standards were

! !
! 18!
administered in 1987.
This accountability system, the Mississippi Performance-Based Accountability System,
was the first for Mississippi and one of the first in the country. Mississippi’s first accountability
system was used from 1988 to 1994 (Mississippi Department of Education Office of Research
and Statistics, 2010). Mississippi revised the Mississippi Performance-Based Accountability
System in 1994 to include more rigorous curriculum guidelines and assessments. The revised
accountability model classified districts according to five accreditation levels one through five.
School districts were assigned a performance index from 1.0 to 5.0 (Mississippi Department of
Education Office of Research and Statistics, 2010). According to the MDE (2012), the
Mississippi Student Achievement Act of 1999 was passed requiring the State Board of Education
to create a school evaluation and improvement system. This new accreditation system set
standards for both individual schools and school districts (Mississippi Student Achievement
Improvement Act of 1999). Annual performance standards were created which measured a
school’s performance against itself using student performance and growth measures. Legislation
in 2000 emphasized making accreditation levels reflective of student performance at the school
level. The accreditation level was determined based on annual growth expectations and the
percentage of students scoring basic and proficient.
In 2007, the Accountability Task Force, established by MDE, began developing a new
accountability system. The fourth accountability system consists of three components:
achievement, growth, and high school completion (Thompson, 2011). This system required
revisions of the state language and mathematics curriculum frameworks. These frameworks
were implemented in 2007, and new state assessments were developed. The assessments were
the Mississippi Curriculum Test, Second Edition (MCT2) for grades three through eight and the

! !
! 19!
Algebra I, English II, Biology, and U.S. History subject area tests (SATP2) for high school
students. These assessments were designed to meet NCLB testing requirements. MCT2
assessments provide a numeric scale score and proficiency level for each student in language arts
and mathematics.
For the achievement component of the model, student proficiency levels are compiled to
calculate the Quality of Distribution Index (QDI). According to Thompson (2011), the QDI
formula is the (% Basic) + (2 x %Proficient) + (3 x %Advanced). The QDI is reported for
schools and districts. QDI values range from zero to 300.
According to MDE (2010), the growth component of the Mississippi accountability
model measures the degree to which a school or district met expected performance expectations
during the previous school year. Thompson (2011) explains Growth residuals of zero or positive
residuals indicate schools and/or districts “Met” expectations. If public schools and/or districts
fail to meet growth goals they are labeled “Did not meet growth.”
Based on results from the Achievement Model and Growth Model, schools are assigned a
School Performance Classification (SPC). Schools with a grade 9-12 configuration also include
the High School Completion Index (HSCI) in the SPC (MDE, 2012). According to MDE (2012),
districts are assigned an Annual Performance Classification (APC) based on achievement,
growth, and graduation/dropout rate. The classifications include Star School/Star District, High
Performing School/District, Successful School/District, Academic Watch School/District, At
Risk of Failing School/District, Low Performing School/District, or Failing School/District.
These classifications were renamed in 2011 to A School/District, B School/District, C
School/District, D School/District, and F School/District.
! !
! 20!
Previous Research on Departmentalized and Self-Contained Structures
Elementary schools are structured as self-contained or departmentalized. Welbourn
(2005) defines the self-contained classroom as one in which the same group of students receive
instruction from the same teacher for core subjects such as language arts, mathematics, social
studies, and science. Elaborating on the self-contained setting, Welbourn contends the only
classes students typically have different teachers for are special subjects such as physical
education, music, or art.
Rogers (2012) defines a departmentalized classroom as one in which students have
various teachers for separate subject areas. Students may have a different teacher for each
subject or separate teachers responsible for multiple subjects. In Mississippi, teachers must be
highly qualified, meaning a licensed endorsement, in subject areas in order to meet NCLB
requirements. Teachers certified in kindergarten through sixth grade are considered qualified to
teach all core subjects. In order to be considered highly qualified in special subjects or core
subjects in grades seven through twelve, teachers must have a licensed endorsement in the
subject the teaching assignment. Numerous studies have been conducted in order to determine
which practice in elementary education is better: departmentalization or self-contained. While
results vary as to which structure is better, researchers have found advantages and disadvantages
of both practices. Moore (2008) contends understanding how children learn and the impact of
learning environments, including qualified teachers, may be factors in obtaining AYP and
improving student achievement.
Advantages of Departmentalization. According to Dropsey (2004), the underlying
reason for departmentalization in many schools is the demand to meet standards, indicators, and
benchmarks of the state curriculum. While experimentation with departmentalization in

! !
! 21!
elementary grades has occurred over the past century, departmentalization grew in popularity
after the 2001 NCLB Act increased pressure on schools to raise test scores (Gewertz, 2014).
Anderson argues (as cited by Findley, 1966), the major advantage of the departmentalized school
is teachers’ ability to provide instruction in the subject they have the greatest understanding.
Although this is an advantage of departmentalization, teachers are not always assigned to
subjects based on their competency in the subject. Teachers are often assigned a course because
they have an endorsement in the subject, even if they are not competent or comfortable with the
content of the subject.
Research has indicated elementary school subjects require much more rigid, specialized
training than many people believe (Liu, 2011). Departmentalization allows targeted professional
development, allowing teachers to become experts in the field they are teaching. Increasing
teacher capacity and pedagogy will assist in providing meaningful instruction for increasing
student achievement (Chan & Jarman, 2004; Hood, 2009; Bingham, 2011).
In addition to increased pedagogy, teacher effectiveness increases when the teacher is
providing instruction in the subject they enjoy (Chan & Jarman, 2004). Teachers’ interest and
understanding of a subject drives them to delve deeper into the curriculum and maximize
resources and preparation time in order for students to meet the standards set forth in state
curriculums (Chan & Jarman, 2004; Dropsey, 2004; Liu, 2011). There have been numerous
studies conducted citing departmentalization as a positive structure for teacher morale (Strohl,
2014).
In an elementary school in Lincoln, Nebraska administrators made the decision to
departmentalize the Unit Studies curriculum (Science, Social Studies, and Health) in an effort to
reduce the preparation load for fifth grade teachers. Subjects were divided into ninety-minute

! !
! 22!
blocks amongst three fifth grade teachers. The blocks were mathematics and social studies;
reading and health; and writing and science. Andrews, one of the fifth grade teachers in the
school, conducted an action research project seeking to discover if student performance in
mathematics improved by departmentalizing the fifth grade curriculum (Andrews, 2006). During
the study, Andrews was seeking to evaluate teacher perceptions of departmentalization.
According to Andrews (2006), student performance in mathematics was measured
comparing current fifth grade student scores on Metropolitan Achievement Test (MAT) to fifth
grade MAT scores from the previous year’s fifth grade students. Teacher perceptions were
gauged using a survey administered at onset of the first year of departmentalization and again at
the end of the experimental year. With data collected from pre and post surveys, Andrews (2006)
was comparing differences in teacher perceptions regarding stress levels, quality of lesson
planning, and ability to assess student work regarding self-contained structure and
departmentalized structure.
According to Andrews (2006), when analyzing test scores she found class composite
scores for Total Math and all Math subtests were generally maintained. Upon closer inspection
of the data rankings in terms of national data, Andrews discovered fourteen percent of previous
year fifth graders ranked in the bottom quartile and only nine percent of current year students fell
into the bottom quartile. She notes the top two quartiles were maintained from previous year’s
scores.
Comparison results from pre and post surveys for teacher perceptions reveal teachers
favored the departmentalized structure, noting they enjoyed planning for fewer subjects because
they had more time for locating resources necessary for creating meaningful lessons. Teachers
reported feeling less overwhelmed with the amount of work and being stronger teachers in the
! !
! 23!
subjects they were required to teach. Teachers also reported enjoying developing relationships
with all fifth grade students instead of those only assigned to their homeroom (Andrews, 2006).
Strohl (2014) conducted a case study comparing levels of perceived stress and morale in
relation to job satisfaction between the departmentalized teachers and self-contained teachers
within the same rural Title I elementary Georgia school. Administrators in the school asked
twelve of the twenty-nine first through third grade teachers to implement departmentalization for
one school year. Four teachers from each grade, first through third, participated in the
departmentalized experiment. The remaining seventeen teachers remained in the self-contained
structure (Strohl, 2014).
Data for the study was collected from a survey completed by all twenty-nine teachers
before and after the experimental year of departmentalized instruction. According to Strohl, this
survey provided information allowing the researcher to compare departmentalization’s impact on
certain aspects of teacher morale and perceptions of work environment. Other data included
information collected from focus groups and individual interviews with the twelve
departmentalized teachers.
Strohl’s findings revealed departmentalized teachers experienced higher morale, lighter
workload, and increased overall job satisfaction in comparison to self-contained teachers in the
same school. In comparison to their prior self-contained learning experiences, departmentalized
teachers preferred the new structure. Post-survey findings also indicate remaining self-contained
teachers expressed interest in participating in the departmentalized structure.
Strohl contends because of additional pressure being placed on educational systems,
teacher workload continually increases, and administrators should make an effort to alleviate as
much teacher stress as possible in attempt to decrease burnout and job dissatisfaction. Findings

! !
! 24!
in Strohl’s study report departmentalized teachers reported increased morale, as they felt more
confident in their abilities because they were able to complete tasks with more focus on fewer
subjects. Strohl also pointed out relieving teachers’ stress improved their personal health, well-
being, and family relationships, leading to an increase in job satisfaction as they were not
attributing the negative effects of stress to their job and work environment.
Researchers have also noted in a self-contained setting, non-tested core subjects such as
social studies and science are often given minimal attention, but the departmentalized setting
schedules dedicated time for each subject, making time management more efficient. (Dropsey,
2004; Liu, 2011).
The advantages discussed thus far focus more on benefits for teachers because these
benefits have a direct impact on quality of instruction and student achievement. According to
Hood (2009), an advantage of departmentalization for students is it breaks the monotony of
students spending all day with the same teacher in the same classroom. Students are provided an
opportunity to be challenged by different teachers and different classroom environments.
Students are able to move more frequently during the day which helps increase attention
(Dropsey, 2004).
Chan and Jarman (2004) argue departmentalization in elementary schools aligns with
middle school organization, better preparing students for transition. Departmentalization affords
students the opportunity to develop survival skills as they transition from the egocentrism of
childhood to a group-centered way of life (Perlstein, 2003).
According to Chan, Terry, and Bessette (2009), findings from a number of studies
suggest student achievement losses frequently result when transitioning from self-contained to a
departmentalized structure. The authors explain elementary schools are typically organized into
! !
! 25!
self-contained classrooms while intermediate and middle schools are largely departmentalized,
and the difference in structure often lead to obstacles in learning during the transitional period.
The most significant obstacles seem social in nature as research indicates transition from self-
contained to departmentalized structure negatively affects students’ self-concept of ability and
value in academic disciplines. Research suggests there is need for concern in meeting pre-
adolescents’ psychological needs such as the need to feel secure, accepted, safe, connected, and
validated. Many educators and parents are opposed to departmentalization in elementary schools
because they see the advantage of keeping the classrooms self-contained to maintain the
uniqueness of a home-like environment and the teacher’s parental image (Chan et al., 2009).
Chan et al. (2009) recognize the concerns associated with departmentalization at the
elementary level. They agree the self-contained classroom structure is good for transitioning
students from home to school, but the authors contend departmentalization should not be
categorically rejected for fourth and fifth grade students. Departmentalization in fourth and fifth
grades, according to Chan et al. (2009), offers academic specialization in which self-contained
classrooms are deficient. The authors contend departmentalization takes full advantage of the
best teacher resources and facilitates instructional planning. They argue elementary students need
to be exposed to the opportunity to develop survival skills as they transition from the
egocentrism of childhood to a group-centered way of school life.
In the report, Daniel Terry, one of the authors, explains departmentalized fourth and fifth
grade students in his elementary school adapted better to the departmentalized setting than peers
attending fourth and fifth grade self-contained classrooms. Results were based upon faculty
reports and scores from state competency tests (Chan et al., 2009). Significance levels of this
! !
! 26!
study were not reported, but the authors recommend educators contest the traditional self-
contained structure of elementary schools in an effort to negate transitional
challenges and give students more chance of success in middle school and beyond.
Advantages of Self-Contained Structure. The self-contained structure has a number of
advantages leading it to be the chosen setting for many years (Ediger, 2002). Chan et al. (2009)
contend the self-contained classroom structure is good for transitioning students from home to
school. Many educators and parents are opposed to departmentalization in elementary schools
because they see the advantage of keeping the classrooms self-contained to maintain the
uniqueness of a home-like environment and the teacher’s parental image (Chan et al., 2009).
In the self-contained configuration, there is time for a relationship to form between the
teacher and the student. Some research suggests the self-contained structure allows teachers to
get to know students in terms of past achievement as well as developmentally. With this
knowledge, teachers can customize lessons according to student needs (Ediger, 2002; Welbourn,
2005; Moore, 2008; Liu, 2011).
Chang (2008) conducted a study examining the relationship between different levels of
departmentalization and students’ connectedness to school in eight elementary schools. Chang
contends the connectedness students feel with school directly relates to academic success, and
self-contained structures allow teachers more time to interact and learn the needs of students.
The author explains students who feel closer to their teachers have fewer behavior problems and
higher academic gains as compared to students feeling conflict with teachers.
Chang’s study was a causal comparative research design. Departmentalized students were
matched with non-departmentalized students from eight elementary schools in the Jefferson
County Public School district in Louisville, Kentucky. A power analysis determined at least 394
! !
! 27!
participants were needed but the study included 702 departmentalized students and 1100 non-
departmentalized students. Data was collected in the form of student surveys and three sets of
analyses were conducted (Chang, 2008). Chang describes the first set of data measured
differences in student survey results between departmentalized and non-departmentalized
students. Findings revealed significant differences (4.43, p < .001) in departmentalized students
and non-departmentalized students. These results were divided into two subscales: classroom
supportiveness and trust/respect for teacher. According to Chang, non-departmentalized students
rated both categories significantly higher than departmentalized students.
The second analyses examined the degree of departmentalization, specifically, how many
teachers were included in the departmentalized instructional team. Chang found significant
differences in self-contained students, students with two teachers, and students who had three or
more teachers. Further analysis determined the major differences resulted from students with
three or more teachers. According to Chang, there were no significant differences between
students with two teachers and self-contained students on the surveys.
The final set of data measured the previous analyses by grade level (3rd, 4th, and 5th)
investigating whether departmentalization relates to students’ connectedness to school depending
on their grade level (Chang, 2008). A MANCOVA analysis was conducted and results indicate
age significantly affects departmentalization interaction (3.35, p <.001) with younger students
relating lower ratings of classroom supportiveness and trust/respect for teachers (Chang, 2008).
The implications of Chang’s study are important when determining the most effective
elementary school structure because if school connectedness has a direct impact on student
achievement, as this study suggests, departmentalization could hinder positive student
achievement. Chang (2008) also discusses past research findings suggesting positive

! !
! 28!
relationships between teachers and students are vital for economically disadvantaged students.
The reason for this, she suggested, is because many of these students come from single parent
homes with fewer positive role models, leading school adults a primary source of adult
interactions. Forming positive adult relationships often becomes a motivation for student
achievement (Chang, 2008).
Lobdell and Van Ness (1963) contend content integration is more efficient in self-
contained classroom settings. According to the authors, reinforcement of learning often occurs
when concepts are applied to areas outside the subject in which they are initially taught. The
authors argue this type of reinforcement, mutual enrichment, and integrative process is difficult
and likely ineffective outside the self-contained setting.
Previous Studies Related to Student Achievement. Multiple studies have been
conducted in an attempt to determine the better organizational structure for educating elementary
students.
In a Chicago public school in 1996, Harris conducted a study testing the effect of
departmentalization on the reading achievement of sixth grade students in a Chicago public
school. According to Harris (1996), the population of the area is mostly lower socioeconomic,
with a large number of single parent families, many of which are on government assistance. A
random sample of thirty students was selected as the experimental group from a total of fifty-
three sixth grade students receiving instruction in a departmentalized setting. A second random
sample of thirty students was selected as the control group from a total of fifty-four students
receiving instruction in a self-contained setting (Harris, 1996). Reading achievement was
measured using fifth grade results from the Iowa Test of Basic Skills as the pretest and sixth
grade results from the Iowa Tests of Basic Skills as the posttest. Pretest scores indicated no
! !
! 29!
significant difference in reading achievement of the two groups when the study began. T-tests
were conducted for pre and post test comparisons of student results on the Iowa Test of Basic
Skills. Findings revealed a significant difference in the effect of organizational structure on
reading achievement. The results of this study indicate self-contained classroom instruction is
more successful for reading achievement of sixth grade students than departmentalized
instruction. According to Harris, most students in the experimental group only showed a few
months of progress. However, some students within the experimental group excelled, gaining
two to two and a half years growth. Others in the group remained the same level, and three
students regressed by two or three months. Students in the control group showed a higher and
more consistent growth pattern with no student regressions. Harris explains the results of this
study differ from results of previous literature and assumes results were a result of the
transitional year from self-contained to departmentalized instruction.
Lamme (1976) conducted a three-year longitudinal study in a village elementary school
in Central New York in order to determine which educational structure, self-contained or
departmentalized, had more influence on the reading habits of elementary students. The study
began with ninety fourth grade students who moved from self-contained fourth grade classes to
departmentalized fifth grade classes and then forward to sixth grade departmentalized classes.
Students were asked to complete reading records for each book they read. These records were
collected every two weeks to measure student reading habits.
Lamme notes differences within teachers in the self-contained environment from the
study. He found one teacher (Class 3) strongly encouraged reading by providing time during the
day for reading and book discussions leading these students to read three times as many books as
students in Class 2. Another teacher did not allow children to read or discuss books throughout

! !
! 30!
the day so they reported reading far fewer books than students in other classes. Two other fourth
grade classes fell somewhere between these two classes (Lamme, 1976). The mean for books
read during students’ fourth grade year was 22 books. Students entered into a departmentalized
structure for fifth grade and the mean number of books read fell slightly to 20.1. The mean
number of books read was reported at 20.6 during the sixth grade school year (Lamme, 1976).
Findings reveal departmentalized classroom environments had less influence on the
amount of reading done than self-contained classrooms. The results of Lamme’s study, while
not at a significant level, suggested self-contained organization structure offered more influence
on the amount of student reading than departmentalization. Lamme suggested this was because
students were in each class for a shorter period of time, and teachers in a self-contained setting
had more opportunity to exert their influences on the reading habits of students.
In another study in an elementary school in Lincoln Nebraska, administrators made the
decision to departmentalize the Unit Studies curriculum (science, social studies, and health) in an
effort to reduce the preparation load for fifth grade teachers. Subjects were divided into ninety-
minute blocks amongst three fifth grade teachers. The blocks were mathematics and social
studies; reading and health; and writing and science. Andrews, one of the fifth grade teachers in
the school, conducted an action research project seeking to discover if student performance in
mathematics improved by departmentalizing the fifth grade curriculum (Andrews, 2006). The
author was also seeking to determine teacher perceptions of the newly departmentalized classes.
Andrews explains student performance in mathematics was measured comparing current
fifth grade student scores on Metropolitan Achievement Test (MAT) to fifth grade MAT scores
from the previous year’s fifth grade students. Teacher perceptions were gauged using a survey
administered at onset of the first year of departmentalization and again at the end of the
! !
! 31!
experimental year. With data collected from pre and post surveys, Andrews (2006) was
comparing differences in teacher perceptions regarding stress levels, quality of lesson planning,
and ability to assess student work regarding self-contained structure and departmentalized
structure.
According to Andrews (2006), when analyzing test scores she found class composite
scores for Total Math and All Math subtests were generally maintained. Upon closer inspection
of the data rankings in terms of national data, Andrews discovered fourteen percent of previous
year fifth graders ranked in the bottom quartile and only nine percent of current year students fell
into the bottom quartile. She notes the top two quartiles maintained from previous year’s scores.
Comparison results from pre and post surveys for teacher perceptions reveal teachers
favored the departmentalized structure, noting they enjoyed planning for fewer subjects because
they had more time for locating resources necessary for creating meaningful lessons. Teachers
reported feeling less overwhelmed with the amount of work and being stronger teachers in the
subjects they were required to teach. Teachers also reported enjoying developing relationships
with all fifth grade students instead of those only assigned to their homeroom (Andrews, 2006).
Taylor-Buckner (2014) conducted a quantitative study examining the effects of
elementary departmentalization on student math proficiency. According to Taylor-Buckner, this
was done by exploring and comparing the background and educational characteristics, teaching
practices, assessment methods, beliefs, and influence of departmentalized elementary
mathematics teachers. She explained the study also sought the circumstances for significant
differences in mathematics proficiency between departmentalized and non-departmentalized
elementary students, and examined whether or not these differences continued into students’
eighth grade years. The study also investigated if there was a relationship between elementary

! !
! 32!
departmentalization and mathematics proficiency and to identify additional factors possibly
leading to mathematics proficiency (Taylor-Buckner, 2014).
Data for Taylor-Buckner’s study was collected from the U.S. Department of Education’s
Early Childhood Longitudinal Study, Kindergarten Class of 1998-1999 data set. This data set is a
national data set following the same students from kindergarten to eighth grade (Taylor-Buckner,
2014).
According to Taylor-Buckner, when comparing all third grade students there is not a
significant difference in mathematical proficiency between self-contained and departmentalized
students; however, a significant difference in mathematical proficiency was determined between
third grade self contained and departmentalized students of teachers with below-average
mathematics backgrounds. Third grade students receiving instruction from departmentalized
mathematics teachers with below-average mathematics backgrounds improved substantially
more than students of mathematically below-average teachers in a self-contained setting.
Taylor-Buckner also points out when the third graders reached fifth grade, the significant
difference of the departmentalized group gained more in mathematics proficiency than the self-
contained group. Results for fifth grade students were found to be very similar to third grade
results.
McGrath and Rust (2002) conducted a study examining the relationship between
classroom organizational structure and standardized achievement scores, transition times
between classes, and instruction time. The population included 103 fifth grade students and 94
sixth grade students from two kindergarten through sixth grade schools in rural Tennessee. The
authors explain there were 109 students in school A and 88 students in school B. All students
from both schools attended self-contained fourth grade classes. School A transitioned to
! !
! 33!
departmentalization for fifth and sixth grades and school B remained self-contained through the
sixth grade. Student achievement was measured using the Tennessee Comprehensive Assessment
Program (TCAP) and transition time was recording by students being directly observed for two
full inconsecutive days (McGrath & Rust, 2002). The results of this study indicated students in
self-contained classrooms outperformed in the areas of Total Battery, Language, and Science.
The results revealed no significant difference between the groups in reading, mathematics, or
social studies. According to McGrath and Rust, transition time was significantly more effective
in the self-contained classroom structure (average 3.27 minutes) than the departmentalized
structure (average 4.55 minutes); however, the authors contend there was no significant
difference in actual instructional time.
Moore (2008) conducted a study seeking to identify associations between classroom
organizational structures and student achievement scores. The population consisted of fourth
and fifth grade classes in six East Tennessee school systems. Student TCAP scores were used
for determining student achievement in language arts, mathematics, science, and social studies.
According to Moore, descriptive and inferential analysis was used. The author explained
findings reveal no significant difference in student TCAP scores for fourth and fifth grade
students in language arts, science, and social studies when comparing students in
departmentalized and self-contained structures; however, fifth grade students had significant
differences in achievement mathematics scores between those students in self-contained and
departmentalized classrooms, slightly favoring departmentalized classrooms.
Gewertz (2014) explains during the 2009-2010 school year the Palm Beach County,
Florida school system required departmentalization in all 109 elementary schools for grades
three through five. According to the Palm Beach County School District's website, the
! !
! 34!
percentage of all grade 3-5 students scoring at or above achievement level in reading on the 2010
Florida Comprehensive Assessment Test (FCAT) was 71%, as compared to 72% in 2009. For
mathematics, the percentage of all grade 3-5 students scoring at or above achievement level on
the FCAT was 72% for 2009 and 2010.
Conclusion
From the historical overview included in the chapter, it is evident education has been an
important concept in America since colonial times. Although the methods for teaching children
has evolved and subjects being taught in schools have become more complex over the years, the
number one goal of education is still to teach students responsible citizenship and provide them
with skills needed to lead a productive life.
The question of whether departmentalized or self-contained classroom structures are
more effective for student achievement has been a question for many years. The articles cited in
the chapter discuss advantages and disadvantages for both structures, and discuss findings from
previous research.
! !
! 35!
CHAPTER THREE
Methodology
Introduction
Chapter three provides a description of the population, sample, assessment instrument,
and data analysis. In this study, the researcher sought to answer the following question: Is there a
statistically significant difference when comparing student performance in self-contained
classroom structures to students in departmentalized classroom structures in Mississippi schools
measured by the aggregated differences in percentage of MCT2 performance levels in grades
four, five, and six between SY 2009-2010 and 2010-2011, between SY 2010-2011 and 2011-
2012, and between 2011-2012 and 2012-2013?
The independent variable is classroom structure, divided into two levels: self-contained
and departmentalized. Grades four, five, and six were included in this study because each grade
is assessed using the MCT2 and all three grades are considered elementary according to MDE
licensure. Although third grade meets the same criteria, this grade was excluded from the study
because this is the initial grade level for students to begin sitting for the MCT2. The dependent
variables are the aggregated differences in percentage of MCT2 performance level in grades
four, five, and six between school years (SY) 2009-2010 and 2010-2011, between SY 2010-2011
and 2011-2012, and between 2011-2012 and 2012-2013.
Self-contained classrooms are identified as classrooms wherein one teacher is responsible
for teaching all core subjects (reading, language arts, mathematics, science, social studies) to a
group of students. In a departmentalized setting, the core subjects (reading, mathematics,
! !
! 36!
language arts, science, and social studies) are typically taught by different teachers.
Departmentalization may consist of a different teacher for each subject, or students transitioning
to different teachers who provide instruction in multiple subjects (Rogers, 2012).
Design
In order to answer the research question of this quasi-experimental study, the researcher
received approval of the dissertation committee. After the dissertation committee approved the
study, the researcher requested approval from The University of Mississippi’s Internal Review
Board (IRB). The IRB deemed the study exempt from the need for IRB approval. The
researcher collected historical MCT2 assessment data for school years 2009-2010, 2010-2011,
2011-2012, and 2012-2013 from the MDE website. This data served as the foundation for
comparative purposes between classroom structure types.
After historical MCT2 data was collected for each year of the study was collected, the
researcher organized data within an Excel spreadsheet and determined the initial target
population was 574 Mississippi schools serving grades four, five, and/or six. From this
collection of data, the researcher was able to eliminate schools with missing MCT2 data and
schools assigned a new school code by the MDE. When analysis was complete, 72 schools had
been eliminated from the initial population, leaving a target population of 502 Mississippi
schools.
Using MCT2 data, the researcher calculated performance differences between MCT2
performance levels for each school year included in the study. A research purpose value was
generated for SY 2009-2010 based on the percent minimal value, percent basic value, percent
proficient value, and the percent advanced value, resulting in a value termed the Quality of
Distribution Index-Revised (QDI-R). This developmental value was calculated for each school

! !
! 37!
during each of the school years in the study and the aggregate difference, whether positive or
negative, between school years serve as the value utilized for comparison in the study.
MDE assigns points for MCT2 performance levels in order to calculate Quality of
Distribution Index (QDI). Points within the QDI formula are assigned to performance levels as
follows: Advanced performance earns three points, Proficient performance earns two points,
basic performance scores one point, and students scoring minimal earn no points toward the QDI
value of the school. For the purpose of this study, the researcher altered the values assigned to
the various performance levels as four (advanced), three (proficient), two (basic), one (minimal),
respectively. The purpose of this revision is to include those students scoring minimal, to
provide a voice and to assess their impact on the study. The updated QDI-R formula serves to
measure an increase or decrease in student achievement. The modified QDI-R was calculated
for fourth, fifth, and sixth grades for each school year included in the study. After calculating the
QDI-R, the differences were calculated for QDI-R values between SY 2009-2010 and SY 2010-
2011, and the difference in QDI-R values between SY 2010-2011 and SY 2011-2012, and the
difference between QDI-R values for SY 2011-2012 and SY 2012-2013.
In determining classification as departmentalized or self-contained organizational
structure, the researcher sent email requests for information to principals of the remaining 502
Mississippi public schools serving fourth, fifth, and/or sixth grade classes. A second email was
sent to principals failing to respond to the first request for information. Follow up phone calls
were conducted for schools failing to respond to the email requests. From the 502 schools, only
84 schools responded to the email requests for information. The remaining 418 schools were
contacted by phone. Some provided information over the phone, while others requested the
email questionnaire be faxed to them for completion. Overall, 134 (27%) of the 502 schools
! !
! 38!
failed to provide structural information by email, phone, or fax. This is a 73% overall response
rate, totaling 368 schools, from the population.
As responses to the classification requests were collected, the researcher categorized each
school included in the study as a departmentalized or a self-contained classroom structure. After
computing the difference in performance value, differences in QDI-R for each fourth, fifth, and
sixth grade in each of the 368 Mississippi public schools between each school year of the study,
three values were aggregated illustrating the variance from one school year to another. Both
positive and negative differences were included in the study.
Population and Participants
The initial population of the study was 574 Mississippi schools serving grades four, five,
and/or six. After removing the 72 schools with missing MCT2 data or new MDE school codes,
the remaining population was 502 schools. There was a 73 percent response rate on the request
for information, leaving 134 schools failing to respond. The collective population for grades
four, five, and six was 368 schools.
Because analysis was being conducted on each grade level individually, the population
was disaggregated to determine total N counts for fourth, fifth, and sixth grades. When
examining the data for fourth grade, of the 368 schools responding to the survey, there were 86
schools reporting they do not serve fourth grade and 35 fourth grade schools reported a change in
structure. Therefore, there were 247 Mississippi schools serving fourth grade included in the
population. For fifth grade, of the 368 schools, 96 reported not serving fifth grade and 30
schools changed structures. This left a total of 242 Mississippi schools serving fifth grade
included in the population. When examining the sixth grade population data, of the 368 schools,
132 reported not serving sixth grade and 29 of the schools changed structures. A total of 207
! !
! 39!
Mississippi schools serving sixth grade was included in the population.
Hypotheses
The primary research hypotheses are:
Ho1: There is no significant difference in fourth grade student performance in language arts when
comparing students in self-contained classroom structures to students in departmentalized
structures.
Ho2: There is no significant difference in fourth grade student performance in mathematics when
comparing students in self-contained classroom structures to students in departmentalized
structures.
Ho3: There is no significant difference in fifth grade student performance in language arts when
comparing students in self-contained classroom structures to students in departmentalized
structures.
Ho4: There is no significant difference in fifth grade student performance in mathematics when
comparing students in self-contained classroom structures against students in departmentalized
structures.
Ho5: There is no significant difference in sixth grade student performance in language arts when
comparing students in self-contained classroom structures against students in departmentalized
structures.
Ho6: There is no significant difference in sixth grade student performance in mathematics when
comparing students in self-contained classroom structures against students in departmentalized
structures.
Instruments
MCT2 assessment data was gathered from the Reports section of the MDE website. This
! !
! 40!
information is readily available so requests for this data are not necessary. The first instrument
used in the study is an Excel spreadsheet listing each Mississippi school serving fourth, fifth,
and/or sixth grade and calculations of positive or negative differences in performance levels and
difference in QDI-R between school years for each school year included in the study. The second
instrument was an email request for information to principals of the 502 Mississippi public
schools for determining departmentalized or self-contained organizational structure of the fourth,
fifth, and sixth grade classes (see Appendix A).
Statistical Tests and Data Analysis
In this study, the researcher sought to answer the following question: Is there a difference
when comparing student performance in self-contained classroom structures to students in
departmentalized classroom structures in Mississippi schools measured by the aggregated
differences in percentage of MCT2 performance levels in grades four, five, and six between SY
2009-2010 and 2010-2011, between SY 2010-2011 and 2011-2012, and between 2011-2012 and
2012-2013?
In order to answer this question, SPSS, version 22 was utilized to conduct a one-way
Multivariate Analysis of Variance (MANOVA). The MANOVA was chosen as the appropriate
test because the researcher wanted to describe the effect of the independent variable (class
structure) on the combined dependent variables (three QDI-R differences). While it would be
acceptable to run multiple one-way ANOVAS, this analysis would not determine the correlation
between the dependent variables. If correlation was too high, the researcher would need to reject
the multivariate outcome and this cannot be done with multiple one-way ANOVAS
(pearsonhighered.com, n.d.).
! !
! 41!
CHAPTER FOUR
Results
Introduction
The purpose of this quasi-experimental, quantitative study was to determine whether
there was a statistically significant difference in the student achievement of Mississippi students
in grades four, five, and six in the subjects of language arts and mathematics based on
departmentalized and self-contained classroom structures. The measure utilized for the study
was differences between MCT2 QDI-R values for the school years 2009-2010 and 2010-2011;
2010-2011 and 2011-2012; 2011-2012 and 2012-2013.
The population of the study included all Mississippi schools serving grades four, five,
and six meeting the following criteria: schools were not missing any MCT2 data from any of the
school years included in the study; schools responded to a questionnaire or follow-up phone calls
or; classroom structure for grade level did not change during school years included in the study;
and schools had no changes in configurations leading to a new Mississippi school code. MDE
assigns a code to each school and district in the state. When districts add schools, the new school
receives a new MDE school code.
The initial N count of schools serving grades four, five, and/or six was 574. The number
was reduced to 502 when schools with missing MCT2 scores or new school codes were
discovered in the data. There were 134 schools failing to respond to the request for structural
information. When analyzed individually, the N counts for fourth, fifth, and sixth grades were
247, 242, and 207, respectively.

! !
! 42!
Assumptions testing and a one-way MANOVA were conducted for each of the three grade levels
included in the study. The following research question guided this study: Is there a difference
when comparing student performance in self-contained classroom structures to students in
departmentalized classroom structures in Mississippi schools measured by the aggregated
differences in percentage of MCT2 performance levels in grades four, five, and six between SY
2009-2010 and 2010-2011, between SY 2010-2011 and 2011-2012, and between 2011-2012 and
2012-2013?
Although some schools included in the population contain data for multiple grades, data
for each grade level were analyzed and reported separately.
Fourth Grade Analysis
A total of 247 Mississippi schools serving fourth grade met the criteria for being included
in the study. Classroom structures were broken into two categories: departmentalized and self-
contained. There were 176 (71%) Mississippi schools structured as departmentalized for fourth
grade and 71 (29%) Mississippi schools structured as self-contained for fourth grade.
Hypotheses. Along with the aforementioned research question, the research hypotheses
for the fourth grade population are as follows:
Ho1: There is no significant difference in fourth grade student performance in language arts when
comparing students in self-contained classroom structures to students in departmentalized
structures.
Ho2: There is no significant difference in fourth grade student performance in mathematics when
comparing students in self-contained classroom structures to students in departmentalized
structures.
! !
! 43!
Assumptions Testing. An assumption is an assertion presumed to be true but not
actually verified (Yearwood, 2011). According to Lund and Lund (2013), seven assumptions
need to be satisfied for valid one-way MANOVA results. The assumptions are: independence of
observations, adequate sample size, lack of univariate or multivariate outliers, multivariate
normality, lack of multicollinearity, linearity, and homogeneity of variance-covariance. Each
assumption was tested prior to conducting the one-way MANOVA. The verifications and
violations for each assumption are reported.
Independence of observations. The measure for determining a significant difference
between class structures is the difference in QDI-R calculations over the four years of data
included in the study. This resulted in three data points for language and three data points for
mathematics. The first observation was the difference in SY 2009-2010 and SY 2010-2011 QDI-
R values. The second observation was the difference in SY 2010-2011 and SY 2011-2012 QDI-
R values. The last observation was the difference in SY 2011-2012 and SY 2012-2013.
Although the QDI-R values overlap, the observations are independent of each other because
none of the differences have any influence on the other two data points.
Adequate sample size. Although larger sample sizes are better for MANOVA, in order to
meet the assumption of adequate sample size there needs to be more cases in each group than the
number of dependent variables being analyzed (Lund & Lund, 2013). The current study has
three dependent variables (QDI-R differences) for each subject. Therefore, the study meets the
assumption because the departmentalized group contains 176 participants and the self-contained
group contains 71 participants.
Lack of univariate outliers. According to Gall, Gall, and Borg (2007), an outlier is a
member of the population whose score differs markedly from the scores obtained by other

! !
! 44!
members of the sample. Using SPSS, version 22, each dependent variable was assessed for
univariate outliers by inspection of boxplots. Hinkle, Wiersma, and Jurs (2003) explain boxplots
are a graphical summary illustrating both the central tendency and the dispersion of scores.
Univariate outliers were found for each structure of each dependent variable. Findings of
boxplot analyses are summarized in Table 1. The dependent variables are named as follows:
grade level (G4), the last two digits of the two school years from which the QDI-R difference
was calculated (1011), and subject. Language arts is identified as LANG. An example of the
variable name will appear as follows G41011LANG. Because it may appear the outliers were
removed in an effort to influence results, the decision was made to keep the outliers as part of the
study.
Table 1
Summary of Univariate Outliers Determined by Boxplot Analysis
DV Departmentalized univariate outliers
Box-lengths beyond edge of
box
Self-contained univariate outliers
Box-lengths beyond edge of
box G41011LANG 5 1.5 2 1.5
G41112LANG 4 1.5 1 1.5
G41213LANG 4 1.5 4 1.5
G41011MATH 5 1.5 4 1.5
G41112MATH 2 1.5 1 1.5
G41213MATH 8 1.5 5 1.5
In SPSS, version 22, a distance of 1.5 box-lengths beyond the edge of the box is notated by a
circular dot and an asterisk notates a distance of three box-lengths beyond the edge of the box
(see Appendix B).
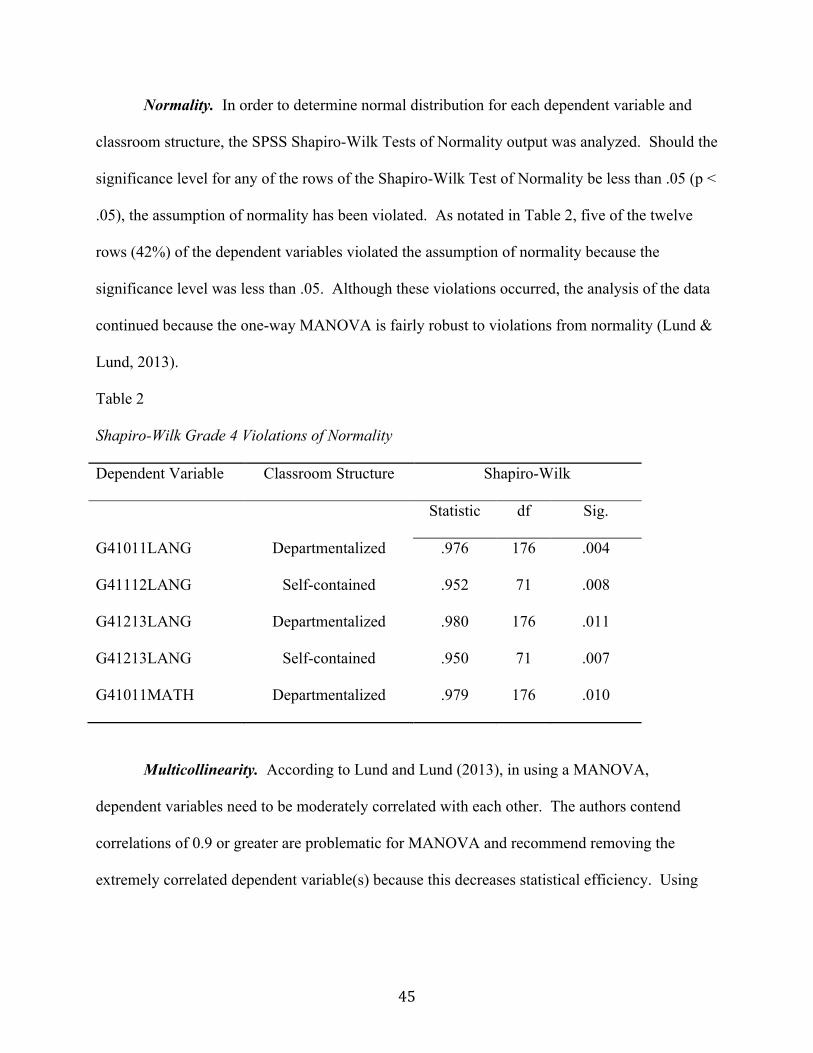
! !
! 45!
Normality. In order to determine normal distribution for each dependent variable and
classroom structure, the SPSS Shapiro-Wilk Tests of Normality output was analyzed. Should the
significance level for any of the rows of the Shapiro-Wilk Test of Normality be less than .05 (p <
.05), the assumption of normality has been violated. As notated in Table 2, five of the twelve
rows (42%) of the dependent variables violated the assumption of normality because the
significance level was less than .05. Although these violations occurred, the analysis of the data
continued because the one-way MANOVA is fairly robust to violations from normality (Lund &
Lund, 2013).
Table 2
Shapiro-Wilk Grade 4 Violations of Normality
Dependent Variable Classroom Structure Shapiro-Wilk
Statistic df Sig.
G41011LANG Departmentalized .976 176 .004
G41112LANG Self-contained .952 71 .008
G41213LANG Departmentalized .980 176 .011
G41213LANG Self-contained .950 71 .007
G41011MATH Departmentalized .979 176 .010
Multicollinearity. According to Lund and Lund (2013), in using a MANOVA,
dependent variables need to be moderately correlated with each other. The authors contend
correlations of 0.9 or greater are problematic for MANOVA and recommend removing the
extremely correlated dependent variable(s) because this decreases statistical efficiency. Using
! !
! 46!
SPSS, version 22, a Pearson (r) correlation test was conducted and found no correlations of 0.9
or greater; therefore, mulitcollinearity is not a problem for this data set.
Linearity. In MANOVA, there needs to be a linear relationship between each pair of
dependent variables for each independent variable. If variables are not linearly related, the
power of the test is reduced (Lund & Lund, 2013). Linearity is tested in SPSS by plotting a
scatterplot matrix for each group of the independent variable. A line of best fit can be included
in the scatterplot matrix for demonstrating the linear relationship. A line rising from the left to
right reveals a positive relationship. A line falling from left to right indicates a negative
relationship. Flatter lines, either positive or negative, reveal a weaker linear relationship between
the variables. The scatterplot matrix for grade 4 language arts (see Appendix D) revealed a
linear relationship between each pair of dependent variables for the departmentalized population.
For the self-contained population, the line of best fit demonstrated a weak linear relationship
between each of the pairs of variables.
When examining the line of best fit in the scatter plot matrix for grade 4 mathematics (see
Appendix E), a linear relationship was found between each pair of the variables in the
departmentalized structure with the exception of G41011MATH and G41213MATH. The line
of best fit for this pair of variables was seemingly flat, indicating a lack of linear relationship.
When the scatterplot for the self-contained structure was examined, a linear relationship was
found to exist between each pair of the variables.
Lack of multivariate outliers. After assuming linearity, a regression procedure called
Mahalanobis Distance was conducted in SPSS in order to determine the presence of multivariate
outliers. Multivariate outliers differ from univariate outliers because they are data points with an
unusual combination of values on the dependent variable (Lund & Lund, 2013). A Mahalanobis
! !
! 47!
Distance was conducted for language arts and mathematics. Results of this test were revealed by
new variables being created in a table labeled MAH within SPSS with values assigned to each
population participant. In order to determine multivariate outliers, the critical value had to be
determined by the number of dependent variables. This study has three independent variables,
making the critical value 16.27. Any number in the MAH column greater than 16.27 is a
multivariate outlier.
Results of the Mahalanobis Distance test for grade four language arts identified four of
the 247 schools as multivariate outliers with MAH values of 19.52, 17.84, 17.35, and 16.91 (see
Appendix F). When examining the Mahalanobis Distance test for grade four mathematics, two
of the 247 schools were multivariate outliers with MAH values of 20.05261 and 17.36721.
Although multivariate outliers violate the MANOVA assumption, the test is adequately robust to
continue with the test without removing the outliers from the data (Lund & Lund, 2013).
MANOVA Results. The final assumption examined is homogeneity of variance-
covariance, and the statistical test for this assumption derives from the MANOVA test. The
MANOVA procedure was conducted and reportedly separately for language arts and
mathematics.
Descriptive statistics. Presented in Table 3 are the means and standard deviations for
each language arts dependent variable. In Table 4, the means and standard deviations for each
mathematics dependent variable are illustrated.
Language arts. As stated in Table 3, for the G41011LANG dependent variable, there
was a difference in means of 4.69 between the departmentalized and self-contained classroom
structures, favoring the self-contained structure. The G41112LANG dependent variable revealed
only a very slight difference in means of 0.8 between the departmentalized and self-contained
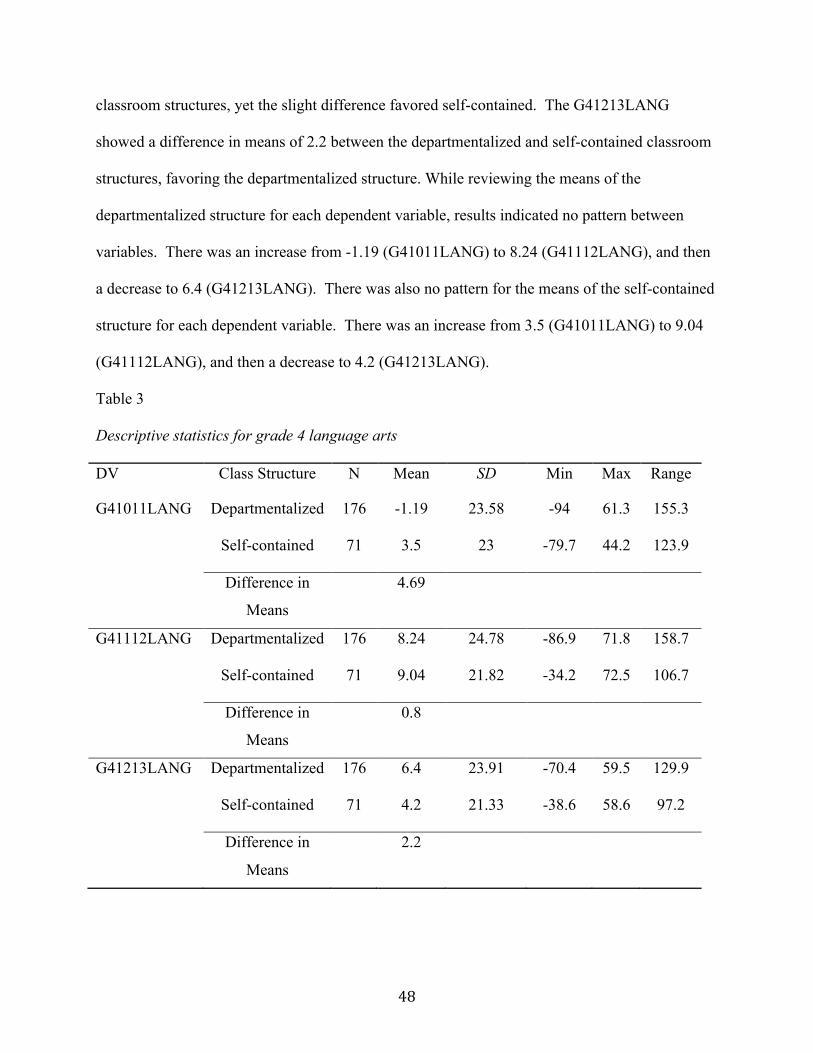
! !
! 48!
classroom structures, yet the slight difference favored self-contained. The G41213LANG
showed a difference in means of 2.2 between the departmentalized and self-contained classroom
structures, favoring the departmentalized structure. While reviewing the means of the
departmentalized structure for each dependent variable, results indicated no pattern between
variables. There was an increase from -1.19 (G41011LANG) to 8.24 (G41112LANG), and then
a decrease to 6.4 (G41213LANG). There was also no pattern for the means of the self-contained
structure for each dependent variable. There was an increase from 3.5 (G41011LANG) to 9.04
(G41112LANG), and then a decrease to 4.2 (G41213LANG).
Table 3
Descriptive statistics for grade 4 language arts
DV Class Structure N Mean SD Min Max Range
G41011LANG Departmentalized 176 -1.19 23.58 -94 61.3 155.3
Self-contained 71 3.5 23 -79.7 44.2 123.9
Difference in
Means
4.69
G41112LANG Departmentalized 176 8.24 24.78 -86.9 71.8 158.7
Self-contained 71 9.04 21.82 -34.2 72.5 106.7
Difference in
Means
0.8
G41213LANG Departmentalized 176 6.4 23.91 -70.4 59.5 129.9
Self-contained 71 4.2 21.33 -38.6 58.6 97.2
Difference in
Means
2.2
! !
! 49!
Mathematics. As illustrated in Table 4, the mean differences between the
departmentalized and self-contained classroom structures for each dependent variable was
calculated and reported. For G41011MATH, the difference in means for the departmentalized
and self-contained classroom structures was 1.71, supporting the self-contained structure. When
exploring the G41112MATH difference in means for the two structures, the difference of 1.85
was found, favoring the departmentalized structure. When comparing the difference in means
for G41213MATH, the difference was 2.14, favoring the self-contained structure. When
comparing the means for the dependent variables of the departmentalized structure, there was an
increase from .447 (G41011MATH) to 11.83 (G41112MATH), and then a decrease to 9.44
(G41213MATH). Based on these results, there is no pattern between variables. For the self-
contained structure, the mean increased from 2.16 (G41011MATH) to 9.98 (G41112MATH) and
increased again to 11.58 (G41213MATH). This indicates a pattern of steady increase over the
years of study.

! !
! 50!
Table 4
Descriptive statistics for grade 4 mathematics
DV Class Structure N Mean SD Min. Max. Range
G41011MATH Departmentalized 176 .447 25.4 -70.6 87.5 158.1
Self-contained 71 2.16 23 -73 63.3 136.3
Difference in
Means
1.71
G41112MATH Departmentalized 176 11.83 26 -69.1 80.2 149.3
Self-contained 71 9.98 21.04 -25.7 72.8 98.5
Difference in
Means
1.85
G41213MATH Departmentalized 176 9.44 23.05 -69 80 149
Self-contained 71 11.58 20.49 -32.7 63.2 95.9
Difference in
Means
2.14
Homogeneity of Variance-Covariance Assumption. In order to determine whether
variables are similar across groups, the Box’s M Test of Equality of Covariance Matrices were
analyzed for language arts and for mathematics. According to Lund and Lund (2013), if the
significance level of the Box’s M test is less than .001 (p < .001) the test is statistically
significant and the assumption of homogeneity of variance-covariance has been violated. The
Box’s M results for grade four language arts and mathematics were .742 and .194, respectively.
Based on the findings, (p > .001) in both subjects, the test was not statistically significant for
either subject and the assumption of homogeneity of variance-covariance was met.

! !
! 51!
Significance between groups. According to Lund and Lund (2013), the main result from
the one-way MANOVA test is contained in the Multivariate Test Table. Four multivariate
statistical values are given for the researcher to determine the one most appropriate for analysis
of the data set. According to pearsonhighered.com (n.d.), Hotelling’s Trace can be used when
there are only two groups but this test is not as powerful as Pillai’s Trace. The source explains
Pillai’s Trace can be used with any number of groups but this test is less viable when sample
sizes within the groups are unequal. Wilk’s Lamda is commonly used when the independent
variable has more than two groups, therefore Wilk’s Lamda is not used.
For the sake of this study, because there are two groups within the independent variable
and the sample sizes are unequal, Hotelling’s Trace was chosen as the statistical test for
determining if a significant difference exists between departmentalized and self-contained
groups. If the significance level is less than .05 (p < .05), there is a statistically significant
difference between structures based on combined dependent variables.
Language arts. Based on the results from the MANOVA, there is no statistically
significant difference between departmentalized and self-contained classroom structures on mean
differences of language arts QDI-R values, F(3, 242) = 1.208 (p = .307). The significance of
.307 (p > .05) prevents rejection of the null hypothesis: there is no significant difference in
fourth grade student performance in language arts when comparing students in self-contained
classroom structures to students in departmentalized structures.
Mathematics. Based on the results from the MANOVA, there is no statistically
significant difference between departmentalized and self-contained classroom structures on mean
differences of mathematics QDI-R values, F(3, 243) = .246, (p = .864). The significance of .864
(p > .05) prevents rejection of the null hypothesis: there is no significant difference in fourth
! !
! 52!
grade student performance in mathematics when comparing students in self-contained classroom
structures to students in departmentalized structures.
Fifth Grade Analysis
A total of 242 Mississippi schools serving fifth grade met the criteria for being included
in the study. There were 213 (88%) Mississippi schools structured as departmentalized for fifth
grade and 29 (12%) Mississippi schools structured as self-contained for fifth grade.
Hypotheses. Along with the aforementioned research question, the research hypotheses
for the fifth grade population are as follows:
Ho3: There is no significant difference in fifth grade student performance in language arts when
comparing students in self-contained classroom structures to students in departmentalized
structures.
Ho4: There is no significant difference in fifth grade student performance in mathematics when
comparing students in self-contained classroom structures against students in departmentalized
structures.
Assumptions Testing. Testing for the seven MANOVA assumptions for fifth grade was
conducted in the same matter as for fourth grade. The verifications and violations for each
assumption are reported.
Independence of observations. As with fourth grade, the measure for determining a
significant difference between structures is the difference in QDI-R calculations over the four
years of data included in the study. This resulted in three data points for language arts and three
data points for mathematics. The observations for fifth grade are independent of each other
because none of the QDI-R differences have any influence on the other two data points.
Adequate sample size. As stated previously, for MANOVA, the sample size requires
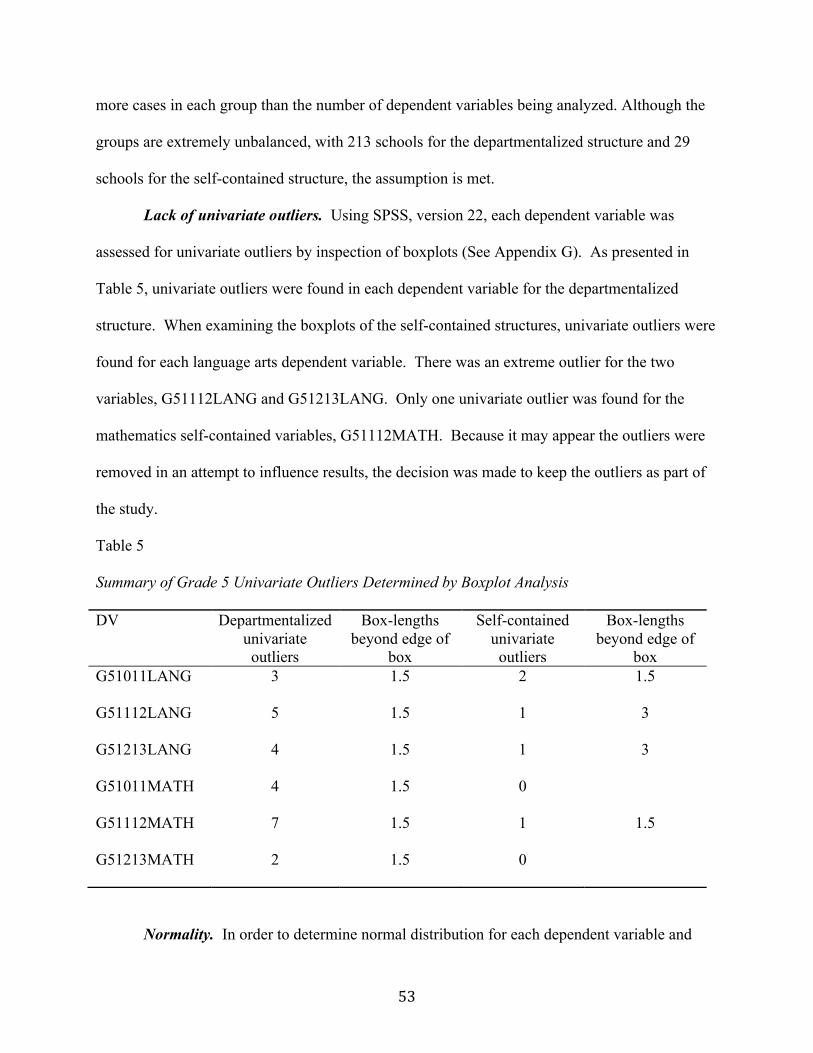
! !
! 53!
more cases in each group than the number of dependent variables being analyzed. Although the
groups are extremely unbalanced, with 213 schools for the departmentalized structure and 29
schools for the self-contained structure, the assumption is met.
Lack of univariate outliers. Using SPSS, version 22, each dependent variable was
assessed for univariate outliers by inspection of boxplots (See Appendix G). As presented in
Table 5, univariate outliers were found in each dependent variable for the departmentalized
structure. When examining the boxplots of the self-contained structures, univariate outliers were
found for each language arts dependent variable. There was an extreme outlier for the two
variables, G51112LANG and G51213LANG. Only one univariate outlier was found for the
mathematics self-contained variables, G51112MATH. Because it may appear the outliers were
removed in an attempt to influence results, the decision was made to keep the outliers as part of
the study.
Table 5
Summary of Grade 5 Univariate Outliers Determined by Boxplot Analysis
DV Departmentalized univariate outliers
Box-lengths beyond edge of
box
Self-contained univariate outliers
Box-lengths beyond edge of
box G51011LANG 3 1.5 2 1.5
G51112LANG 5 1.5 1 3
G51213LANG 4 1.5 1 3
G51011MATH 4 1.5 0
G51112MATH 7 1.5 1 1.5
G51213MATH 2 1.5 0
Normality. In order to determine normal distribution for each dependent variable and

! !
! 54!
classroom structure, the SPSS Shapioro-Wilk Tests of Normality output was inspected for
significance levels less than .05. Findings (p < .05) indicate the assumption of normality has
been violated. As reported in Table 6, three of the twelve (25%) of the dependent variables
violated the assumption of normality because the significance level was less than .05. Although
these violations occurred, the analysis of the data continued because the one-way MANOVA is
fairly robust to violations of normality (Lund & Lund, 2013).
Table 6
Shapiro-Wilk grade 5 violations of normality
Dependent Variable Classroom Structure Shapiro-Wilk
Statistic df Sig.
G51112LANG Self-contained .913 29 .020
G51213LANG Self-contained .857 29 .001
G51112MATH Departmentalized .987 213 .041
Multicollinearity. In order to determine the presence of multicollinearity, Pearson (r)
correlations were examined for each pair of grade five dependent variables for language arts and
mathematics. There were no correlations of 0.9 or greater; therefore, multicollinearity is not
present in this data set (See Appendix H).
Linearity. In order to determine presence of a linear relationship, scatterplot matrices for
each group of the dependent variables for each structure were created using SPSS. A total of
four matrices were created, one for each structure and subject. When examining the scatterplot
matrices for language arts (See Appendix I), there was a linear relationship present between each
pair of departmentalized dependent variables. There were negative linear relationships between

! !
! 55!
G51011LANG, G51112LANG, as well as G51112LANG, G51213LANG. There was a weak
positive linear relationship for the pair G51011LANG, G51213LANG. The matrix for the self-
contained language arts revealed negative linear relationships between the pairs G51011LANG,
G51112LANG and G51112LANG, G51213LANG. A positive linear relationship was found for
G51011LANG, G51213LANG.
When examining the scatterplot matrices for mathematics (See Appendix J), a linear
relationship was found to exist between each pair of departmentalized dependent variables.
There was a negative linear relationship between the following pairs: G51011MATH, G51112
MATH, and G51112MATH, G51213MATH. A weak positive relationship existed between
G51011MATH, G51213MATH. When analyzing the self-contained mathematics matrices,
negative linear relationships were found for the following pairs of dependent variables:
G51011MATH, G51112MATH, and G51112MATH, G51213MATH. A positive linear
relationship was found between G51011MATH, G51213MATH.
Lack of multivariate outliers. After assuming linearity, a test of Mahalanobis Distance
was conducted for language arts and mathematics dependent variables in order to determine
presence or absence of multivariate outliers. When examining the results of the grade five MAH
for language arts and mathematics, no values were greater than the critical value 16.27;
therefore, no outliers were present in the grade five data.
MANOVA Results. As with fourth grade, the final assumption tested is homogeneity of
variance-covariance, and statistical testing for this assumption derives from the MANOVA test.
The MANOVA procedure was conducted and reported separately for language arts and
mathematics.
Descriptive statistics. Presented in Table 7 are the means and standard deviations for
! !
! 56!
each language arts dependent variable. In Table 8, the means and standard deviations for each
mathematics dependent variable are illustrated.
Language arts. As illustrated in Table 7, for the G51011LANG dependent variable, there
was a difference in means of -1.91, favoring departmentalization. There was a difference in
means of 8.22 for G51112LANG, distinctly favoring the self-contained structure. The difference
in means for G51213LANG was 3.4, supporting the self-contained structure. When studying the
means of each language arts dependent variable, both were negative for the G51011LANG
variable, followed by an increase for G51112LANG. The increase for self-contained was notable
with the mean rising from 2.05 to 14.16. The third variable, G51213LANG decreased from the
second measure in both structures.
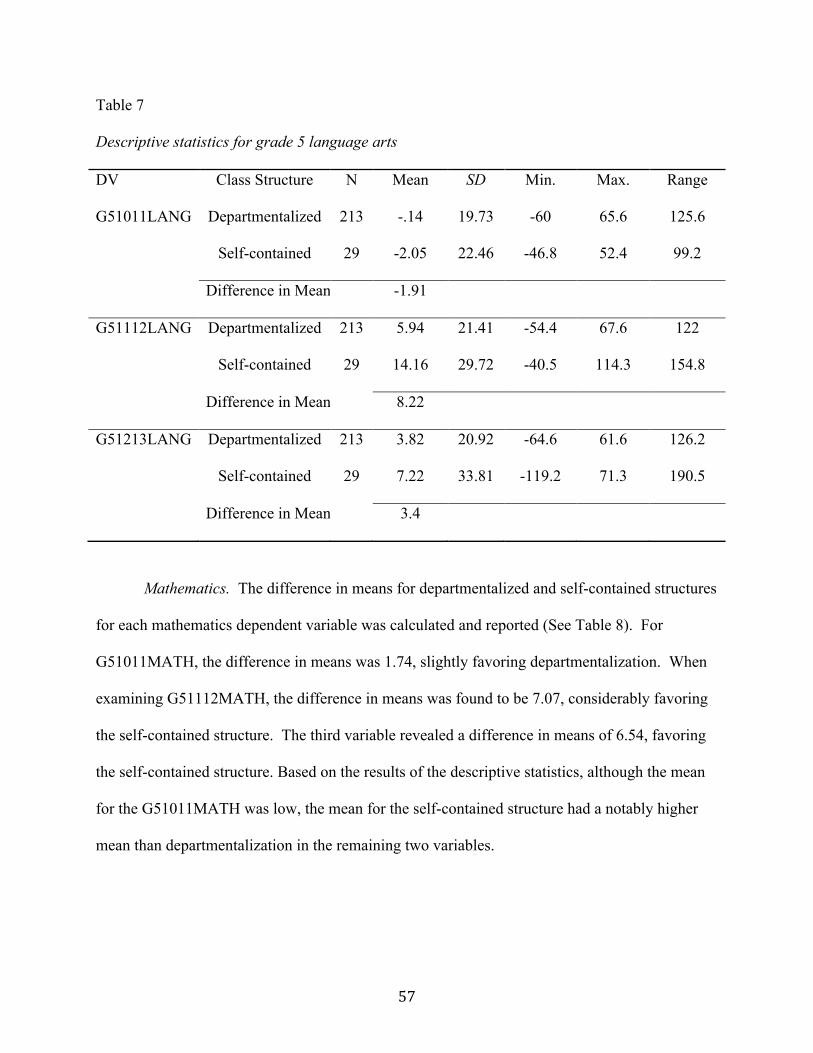
! !
! 57!
Table 7
Descriptive statistics for grade 5 language arts
DV Class Structure N Mean SD Min. Max. Range
G51011LANG Departmentalized 213 -.14 19.73 -60 65.6 125.6
Self-contained 29 -2.05 22.46 -46.8 52.4 99.2
Difference in Mean -1.91
G51112LANG Departmentalized 213 5.94 21.41 -54.4 67.6 122
Self-contained 29 14.16 29.72 -40.5 114.3 154.8
Difference in Mean 8.22
G51213LANG Departmentalized 213 3.82 20.92 -64.6 61.6 126.2
Self-contained 29 7.22 33.81 -119.2 71.3 190.5
Difference in Mean 3.4
Mathematics. The difference in means for departmentalized and self-contained structures
for each mathematics dependent variable was calculated and reported (See Table 8). For
G51011MATH, the difference in means was 1.74, slightly favoring departmentalization. When
examining G51112MATH, the difference in means was found to be 7.07, considerably favoring
the self-contained structure. The third variable revealed a difference in means of 6.54, favoring
the self-contained structure. Based on the results of the descriptive statistics, although the mean
for the G51011MATH was low, the mean for the self-contained structure had a notably higher
mean than departmentalization in the remaining two variables.
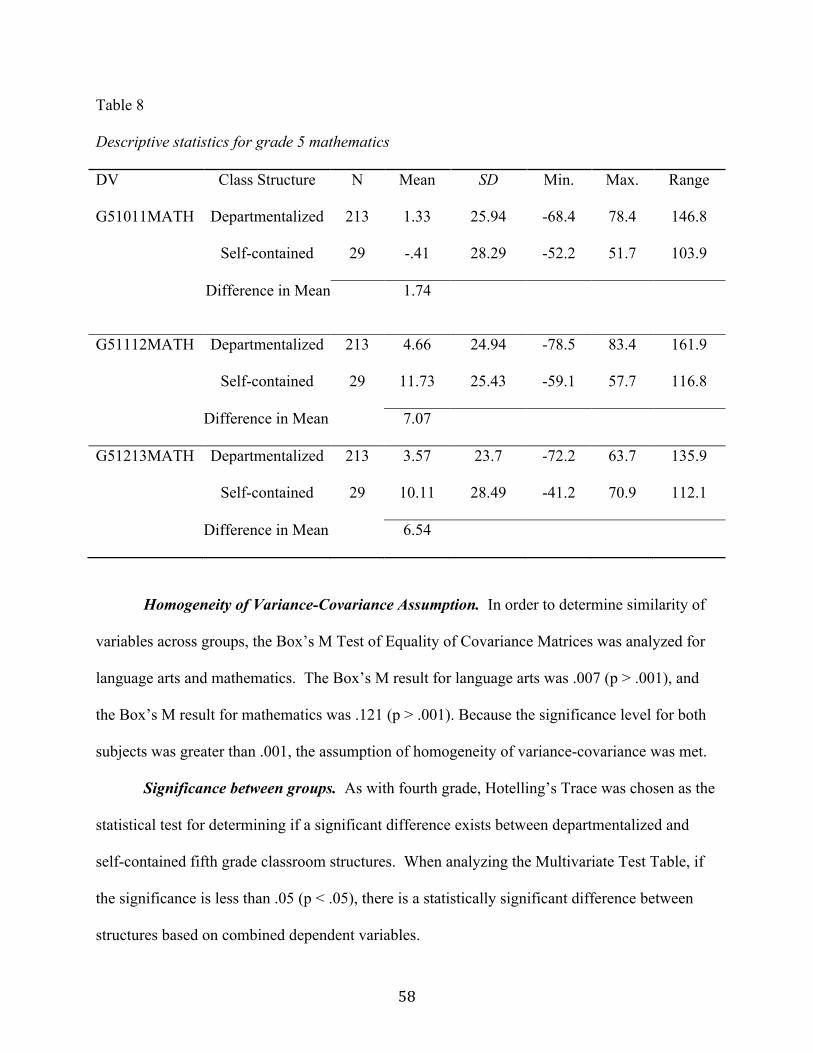
! !
! 58!
Table 8
Descriptive statistics for grade 5 mathematics
DV Class Structure N Mean SD Min. Max. Range
G51011MATH Departmentalized 213 1.33 25.94 -68.4 78.4 146.8
Self-contained 29 -.41 28.29 -52.2 51.7 103.9
Difference in Mean 1.74
G51112MATH Departmentalized 213 4.66 24.94 -78.5 83.4 161.9
Self-contained 29 11.73 25.43 -59.1 57.7 116.8
Difference in Mean 7.07
G51213MATH Departmentalized 213 3.57 23.7 -72.2 63.7 135.9
Self-contained 29 10.11 28.49 -41.2 70.9 112.1
Difference in Mean 6.54
Homogeneity of Variance-Covariance Assumption. In order to determine similarity of
variables across groups, the Box’s M Test of Equality of Covariance Matrices was analyzed for
language arts and mathematics. The Box’s M result for language arts was .007 (p > .001), and
the Box’s M result for mathematics was .121 (p > .001). Because the significance level for both
subjects was greater than .001, the assumption of homogeneity of variance-covariance was met.
Significance between groups. As with fourth grade, Hotelling’s Trace was chosen as the
statistical test for determining if a significant difference exists between departmentalized and
self-contained fifth grade classroom structures. When analyzing the Multivariate Test Table, if
the significance is less than .05 (p < .05), there is a statistically significant difference between
structures based on combined dependent variables.

! !
! 59!
Language arts. Based on the results from the MANOVA, there is no statistically
significant difference between departmentalized and self-contained classroom structures on mean
differences of language arts QDI-R values, F(3, 238) = 2.558 (p = .056). The significance of
.056 (p > .05) prevents rejection of the null hypothesis: there is no significant difference in fifth
grade student performance in language arts when comparing students in self-contained classroom
structures to students in departmentalized structures.
Mathematics. Results of the MANOVA revealed no statistically significant difference
between departmentalized and self-contained classroom structures on mean differences of
mathematics QDI-R values, F(3, 238) = 2.194 (p = .089). The significance of .089 (p > .05)
prevents rejection of the null hypothesis: there is no significant difference in fifth grade student
performance in mathematics when comparing students in self-contained classroom structures to
students in departmentalized classroom structures.
Sixth Grade Analysis
A total of 207 Mississippi schools serving sixth grade met the criteria for being included
in the study. There were 196 (95%) Mississippi schools structured as departmentalized for sixth
grade instruction and 11 (5%) Mississippi schools structured as self-contained for sixth grade.
Hypotheses. Along with the previously stated research question, the research hypotheses
for the sixth grade population are as follows:
Ho5: There is no significant difference in sixth grade student performance in language arts when
comparing students in self-contained classroom structures against students in departmentalized
structures.
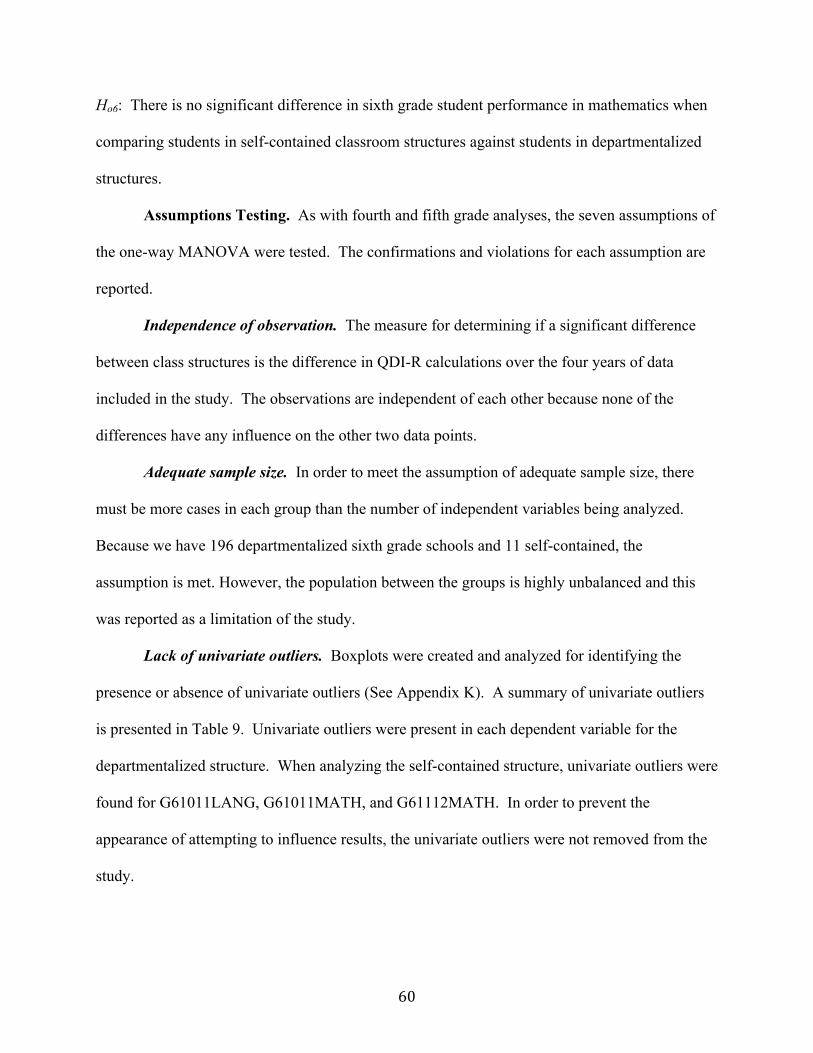
! !
! 60!
Ho6: There is no significant difference in sixth grade student performance in mathematics when
comparing students in self-contained classroom structures against students in departmentalized
structures.
Assumptions Testing. As with fourth and fifth grade analyses, the seven assumptions of
the one-way MANOVA were tested. The confirmations and violations for each assumption are
reported.
Independence of observation. The measure for determining if a significant difference
between class structures is the difference in QDI-R calculations over the four years of data
included in the study. The observations are independent of each other because none of the
differences have any influence on the other two data points.
Adequate sample size. In order to meet the assumption of adequate sample size, there
must be more cases in each group than the number of independent variables being analyzed.
Because we have 196 departmentalized sixth grade schools and 11 self-contained, the
assumption is met. However, the population between the groups is highly unbalanced and this
was reported as a limitation of the study.
Lack of univariate outliers. Boxplots were created and analyzed for identifying the
presence or absence of univariate outliers (See Appendix K). A summary of univariate outliers
is presented in Table 9. Univariate outliers were present in each dependent variable for the
departmentalized structure. When analyzing the self-contained structure, univariate outliers were
found for G61011LANG, G61011MATH, and G61112MATH. In order to prevent the
appearance of attempting to influence results, the univariate outliers were not removed from the
study.
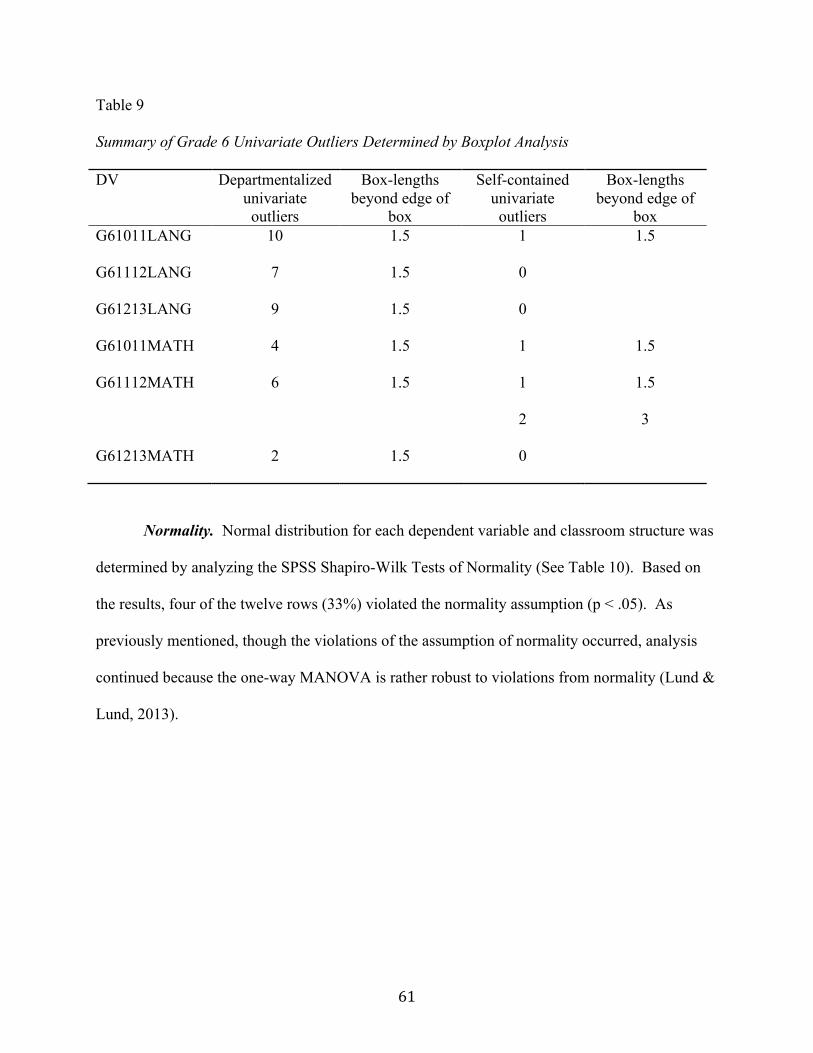
! !
! 61!
Table 9
Summary of Grade 6 Univariate Outliers Determined by Boxplot Analysis
DV Departmentalized univariate outliers
Box-lengths beyond edge of
box
Self-contained univariate outliers
Box-lengths beyond edge of
box G61011LANG 10 1.5 1 1.5
G61112LANG 7 1.5 0
G61213LANG 9 1.5 0
G61011MATH 4 1.5 1 1.5
G61112MATH 6 1.5 1
2
1.5
3
G61213MATH 2 1.5 0
Normality. Normal distribution for each dependent variable and classroom structure was
determined by analyzing the SPSS Shapiro-Wilk Tests of Normality (See Table 10). Based on
the results, four of the twelve rows (33%) violated the normality assumption (p < .05). As
previously mentioned, though the violations of the assumption of normality occurred, analysis
continued because the one-way MANOVA is rather robust to violations from normality (Lund &
Lund, 2013).

! !
! 62!
Table 10
Shapiro-Wilk Grade 4 Violations of Normality
Dependent Variable Classroom Structure Shapiro-Wilk
Statistic df Sig.
G61011LANG Departmentalized .975 196 .001
G61112LANG Departmentalized .977 196 .002
G61112MATH Departmentalized .981 196 .011
G61112MATH Self-contained .713 11 .001
Multicollinearity. In order to test for the presence of multicollinearity, a Pearson (r)
correlation test was conducted using SPSS. Results of the correlation test revealed there is no
multicollinearity (greater than 0.9) for grade six dependent variables (See Appendix L).
Linearity. To test for linearity, a scatterplot matrix with a line of best fit was created in
SPSS for each sixth grade language arts structure (See Appendix M) and another for each
mathematics structure (See Appendix N). When examining the grade six language arts matrix
for the departmentalized structure, a negative linear relationship exists between the following
pairs of dependent variables: G61011LANG, G61112LANG and G61112LANG, G61213LANG.
A lack of linear relationship existed between the pair G61011LANG, G61213LANG. Based on
the matrix, for the language arts self-contained structure, there was a lack of linearity between
each pair of dependent variables. For grade six departmentalized mathematics, there was a
negative linear relationship between the following pairs: G61011MATH, G61112MATH and
G61112MATH, G61213MATH. There appeared to be a lack of linearity between the pair
G61011MATH, G61213MATH. In the mathematics self-contained matrix, there was a lack of

! !
! 63!
linearity between each pair of dependent variables. According to Lund and Lund (2013), a lack
of linearity does not mean there is no relationship between the variables, and the researcher can
accept a reduction in power and carry on with the MANOVA analysis.
Lack of multivariate outliers. As stated earlier, in order to determine multivariate
outliers a Mahalanobis Distance test was conducted for language arts and mathematics (See
Appendix O). Results of the Mahalanobis Distance test for language arts identified four of the
207 schools were multivariate outliers with MAH values of 20.23, 18.94, 18.40, and 18.18. The
Mahalanobis Distance test for mathematics revealed a single multivariate outlier out of the 207
schools with a MAH value of 16.69. Because the MANOVA is robust to violations of the
multivariate normality assumption, the test can continue without removing the outliers from the
data (Lund & Lund, 2013).
MANOVA Results. As mentioned during fourth and fifth grade analysis, the final
assumption tested is homogeneity of variance-covariance, and this assumption is determined
after running the MANOVA statistical tests. The MANOVA procedure was conducted
separately for language arts and mathematics, and results are reported in this manner.
Descriptive statistics. Illustrated in Table 11 are the means and standard deviations for
each language arts dependent variable. In Table 12, the means and standard deviations for each
mathematics dependent variable are presented.
Language arts. The difference in means between structures for G61011LANG was 9.18,
markedly favoring the self-contained structure. However, there was a decrease in the self-
contained mean for G61112LANG, dropping from 12.5 to -6. The difference in means between
structures for the G61112LANG dependent variable was 10.87, favoring departmentalization.
There was an increase in the self-contained structure for G61213LANG, increasing from -6 to -
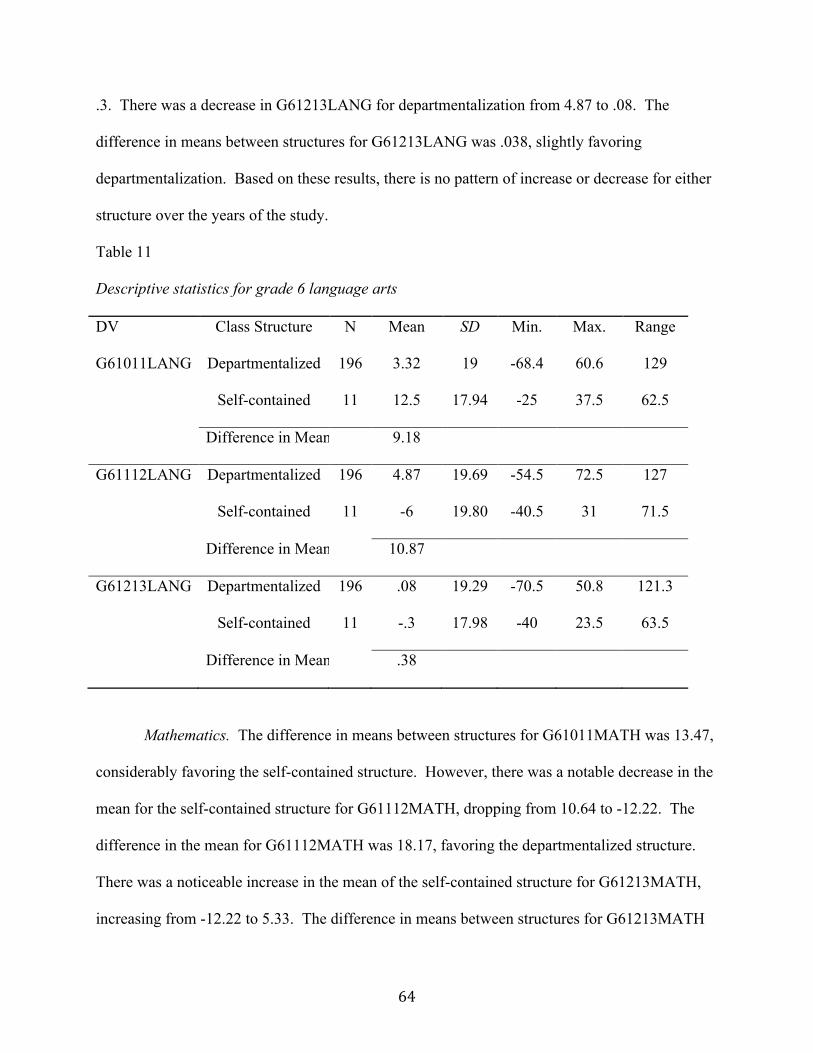
! !
! 64!
.3. There was a decrease in G61213LANG for departmentalization from 4.87 to .08. The
difference in means between structures for G61213LANG was .038, slightly favoring
departmentalization. Based on these results, there is no pattern of increase or decrease for either
structure over the years of the study.
Table 11
Descriptive statistics for grade 6 language arts
DV Class Structure N Mean SD Min. Max. Range
G61011LANG Departmentalized 196 3.32 19 -68.4 60.6 129
Self-contained 11 12.5 17.94 -25 37.5 62.5
Difference in Means 9.18
G61112LANG Departmentalized 196 4.87 19.69 -54.5 72.5 127
Self-contained 11 -6 19.80 -40.5 31 71.5
Difference in Means 10.87
G61213LANG Departmentalized 196 .08 19.29 -70.5 50.8 121.3
Self-contained 11 -.3 17.98 -40 23.5 63.5
Difference in Means .38
Mathematics. The difference in means between structures for G61011MATH was 13.47,
considerably favoring the self-contained structure. However, there was a notable decrease in the
mean for the self-contained structure for G61112MATH, dropping from 10.64 to -12.22. The
difference in the mean for G61112MATH was 18.17, favoring the departmentalized structure.
There was a noticeable increase in the mean of the self-contained structure for G61213MATH,
increasing from -12.22 to 5.33. The difference in means between structures for G61213MATH

! !
! 65!
was 2.62, favoring departmentalization. Based on the results, there was an increase in mean of
the departmentalized structure across the three variables, but there were no patterns of increase
or decrease for the self-contained structure across the variables.
Table 12
Descriptive statistics for grade 6 mathematics
DV Class Structure N Mean SD Min. Max. Range
G61011MATH Departmentalized 196 -2.83 22.6 -68.3 69.9 138.2
Self-contained 11 10.64 24.62 -20.7 70.8 91.5
Difference in Mean 13.47
G61112MATH Departmentalized 196 5.95 23.23 -82.3 89.9 134.1
Self-contained 11 -12.22 31.21 -74 19.7 93.7
Difference in Mean 18.17
G61213MATH Departmentalized 196 7.95 22.59 -66.3 67.8 134.1
Self-contained 11 5.33 18.1 -29 30.4 59.4
Difference in Mean 2.62
Homogeneity of Variance-Covariance Assumption. The Box’s M test was conducted in
SPSS for language arts and mathematics in an effort to determine if the homogeneity of
variance-covariance assumption was met. The significance of Box’s M for language arts was
.853 and the significance for mathematics was .676. In both subjects, (p > .001), therefore, the
assumption was not violated.
Significance between groups. Because there are two groups within the independent
variable and unequal sample sizes, Hotelling’s Trace was chosen as the statistical test for
! !
! 66!
determining if a significant difference exists between sixth grade departmentalized and self-
contained groups. If significance is less than .05 (p < .05), there is a statistically significant
difference between structures based on combined dependent variables.
Language arts. Based on results of the MANOVA, there is no statistically significant
difference between departmentalized and self-contained structures on mean differences of
language arts QDI-R values, F (3, 203) = 1.542 (p = .205). The significance of .205 (p > .05)
prevents rejection of the null hypothesis: there is no significant difference in sixth grade student
performance in language arts when comparing students in self-contained classroom structures to
students in departmentalized structures.
Mathematics. Based on the results of the MANOVA, there is a statistically significant
difference between departmentalized and self-contained structures on mean differences of
mathematics QDI-R values, F (3, 203) = 2.868 (p = .038). The significance of .038 (p < .05)
allows for rejection of the null hypothesis. Based on the results, there is a significant difference
in sixth grade student performance in mathematics when comparing students in self-contained
classroom structures to students in departmentalized structures.
In an effort to determine which dependent variable is contributing to the statistically
significant results, the Tests of Between Subjects Effects was analyzed. Results indicated there
was a statistically significant difference in classroom structures for G61112MATH, F (1, 205)
= 6.128, (p = .014). Because the significance level is less than .05, the G61112MATH
dependent variable is identified as the variable contributing to the difference between the two
classroom structures.
Summary of Findings
In Table 13, a summary of the statistical findings has been provided. Based on the

! !
! 67!
findings, five of the six hypotheses were rejected because there was no statistically significant
difference found between the two class structures. There was a statistically significant finding
for grade six mathematics. Therefore, further analysis was conducted and identified
G61112MATH as the variable contributing to the significant difference.
Table 13
Summary of statistical findings from MANOVA
Hypothesis p-value Decision
Ho1 .307 Rejected
Ho2 .864 Rejected
Ho3 .056 Rejected
Ho4 .089 Rejected
Ho5 .205 Rejected
Ho6 .038 Failed to reject
! !
! 68!
CHAPTER FIVE
Summary and Discussion
Introduction
The purpose of the current quasi-experimental study was to examine whether a
statistically significant difference existed in the student achievement of Mississippi students in
grades four, five, and six in the subjects of language arts and mathematics based on
departmentalized and self-contained classroom structures. The measure utilized for the study
was differences between MCT2 QDI-R values for the school years of 2009-2010 and 2010-2011;
2010-2011 and 2011-2012; and 2011-2012 and 2012-2013.
For the purpose of this study, departmentalized classroom structures are configured for
students to receive instruction in core classes (reading, mathematics, language arts, science, and
social studies) from different teachers. Departmentalization may consist of a different teacher
for each subject, or the structure could be designed so teachers are responsible for multiple
subjects. Self-contained classroom structures are designed for students to receive instruction for
each core subject from a single teacher.
Chapter five provides a brief summary of the study. The chapter includes a discussion of
the findings and limitations of the study, implications for practical and research applications, and
recommendations for future research.
Summary of the Study
The following research question guided this study: is there a difference when comparing
student performance in self-contained classroom structures to students in departmentalized
! !
! 69!
classroom structures in Mississippi schools measured by the aggregated differences in
percentage of MCT2 performance levels in grades four, five, and six between SY 2009-2010 and
2010-2011, between SY 2010-2011 and 2011-2012, and between 2011-2012 and 2012-2013?
The research hypotheses were:
Ho1: There is no significant difference in fourth grade student performance in language arts when
comparing students in self-contained classroom structures to students in departmentalized
structures.
Ho2: There is no significant difference in fourth grade student performance in mathematics when
comparing students in self-contained classroom structures to students in departmentalized
structures.
Ho3: There is no significant difference in fifth grade student performance in language arts when
comparing students in self-contained classroom structures to students in departmentalized
structures.
Ho4: There is no significant difference in fifth grade student performance in mathematics when
comparing students in self-contained classroom structures against students in departmentalized
structures.
Ho5: There is no significant difference in sixth grade student performance in language arts when
comparing students in self-contained classroom structures against students in departmentalized
structures.
Ho6: There is no significant difference in sixth grade student performance in mathematics when
comparing students in self-contained classroom structures against students in departmentalized
structures.
The independent variable of the study was classroom structure, divided into two levels:

! !
! 70!
departmentalized and self-contained. The structure of each school and grade level was
determined through an email questionnaire or by phone call. The dependent variables were the
changes in QDI-R percentages, a value generated specifically for this study. After generating
QDI-R values for each school and grade level, changes in the values were found by subtracting
QDI-R for SY 2009-2010 and 2010-2011; 2010-2011 and 2011-2012; and 2011-2012 and 2012-
2013 for each school included in the study. The three differences were generated for both
language arts and mathematics.
The population of the study included all Mississippi schools serving grades four, five,
and six meeting the following criteria: schools were not missing any MCT2 data from any of the
school years included in the study; schools had no changes in configurations leading to a new
Mississippi school code; schools responded to a questionnaire or follow-up phone calls; and
classroom structure for grade level did not change during the school years included in the study.
The number of schools for fourth grade meeting the criteria was 247, with 176 (71%) structured
as departmentalized and 71 (29%) structured as self-contained. The number of schools for fifth
grade was 242, with 213 (88%) structured as departmentalized and 29 (12%) structured as self-
contained. For sixth grade, there was a total of 207 schools meeting the criteria with 196 (95%)
structured as departmentalized and 11 (5%) structured as self-contained.
A one-way MANOVA was conducted using SPSS, version 22 in order to determine if a
significant difference existed between groups of each grade level for language arts and
mathematics.
Summary of Findings
Results of the analyses found no significant differences between class structures in grade
four language arts (p = .307) or mathematics (p = .246). When examining fifth grade results,

! !
! 71!
while there was no significant difference found, both language arts and mathematics were
approaching a significant difference in both subjects with a p value of .056 and .089,
respectively. There was no significant difference found between class structures when analyzing
grade six language arts (p = .205). For sixth grade mathematics, there was a significant
difference of .038 found between class structures on mean differences of QDI-R values. Because
of the statistical findings, rejection of the null hypotheses was prevented for Ho1 through Ho5.
Significant statistical findings for grade six mathematics led to rejection of the null hypothesis
Ho6.
Discussion of Findings and Limitations
When undertaking this study, the researcher wanted to conduct an analysis of all
Mississippi schools meeting the aforementioned criteria for being included in the population.
With this being said, there were unexpected trends discovered during data collection and
analysis.
With each grade level, the number of self-contained schools decreased, from 71 in fourth
grade, to 29 in fifth grade, and to 11 in sixth grade. While the assumption of adequate sample
size was met for each grade level, such unbalanced groups may influence statistical findings.
Therefore, this is considered a limitation of the study.
There were outliers found within the data when conducting boxplot analyses. For
example, in grade four language arts outlier 214 was labeled as 1.5 box-lengths from the edge of
the box for the variable G41011LANG. Further investigation identified East Sunflower in
Sunflower County as outlier 214. East Sunflower is considered an outlier for this dependent
variable because the school’s QDI-R decreased 82.2 (-82.2) points from SY 2009-2010 to SY
2010-2011. While this is an outlier, it is an accurate depiction of the range of increases and

! !
! 72!
decreases in QDI-R for each dependent variable in each grade level. The researcher opted to
keep the outliers as part of the study because these ranges of differences are the reality facing
Mississippi educators. However, keeping the outliers may have influenced the findings of the
MANOVA analysis, especially in grade six mathematics where a significant difference was
found between structures, favoring departmentalization. The dependent variable causing the
significant difference was G61112MATH. This variable had two extreme outliers, both of which
were self-contained classrooms. This most likely had an effect on the results because there are
only 11 total participants in this group. This may be a Type I error because the null hypothesis
was rejected, when it could actually be true.
The inclusion of outliers in the study most likely led to the notable increases and
decreases in the differences in means over the three data points for each structure. Therefore, the
inclusion of outliers in the study is another limitation of the study.
Implications for Application and Future Research
This research provides limited evidence of an effect of classroom structure on student
learning. Although this study found results similar to previous research (McGrath & Rust, 2002;
Moore, 2008; Taylor-Buckner, 2014), it has led to more questions than answers related to student
achievement in Mississippi schools.
Choice of School Structure. Based on the fact previous research suggests no real
differences in student achievement based on structure, how do school leaders determine
organizational structure for each grade level of their school? From this study, it is evident the
number of self-contained schools decrease as grade levels increase. Based on results of the
population of this study, there are 29 fifth grade self-contained Mississippi schools and 11 sixth
grade self-contained Mississippi schools remaining in the state. Further research is needed to
! !
! 73!
determine why school leaders have chosen the organizational structure of their school.
Enrollment data for each school can be collected from MDE in order to determine whether total
enrollment is a factor in structure school leaders choose. Qualitative and quantitative data can be
collected from schools within the population of this study seeking to determine which structure is
more beneficial for teacher morale.
Teacher Quality. Teacher quality was not factored into the outcome of the current
study, although it is one of the most critical components of student achievement. Mississippi has
developed and implemented the Mississippi Teacher Evaluation System (MTES), providing a
rubric for the evaluation and scoring of teachers based on certain criteria. The overall MTES
score is reported to MDE at the end of the school year. Further research could be conducted by
attaining teacher level MCT2 data from each school and MTES scores. From this data, the
researcher may be able to determine if there is a relationship between QDI-R differences, the
organizational structure, and teacher quality based on the MTES scores. Supplemental findings
from this research include being able to determine the effect of average teacher salary on teacher
quality, and regions of the state employing the lowest quality teachers based on MTES. This
information may be beneficial for state, district, and school leaders when making decisions
concerning teacher pay, focused locations for incentive pay, and targeted professional
development.
Another addition to this study may be to determine the relationship between teacher years
of service, QDI-R differences, and MTES scores. A researcher may also wish to compare MTES
scores based on teacher preparation programs, whether they be traditional or alternate route.
Such comparisons can lead to teachers being more thoroughly prepared for the classroom when
they enter the profession.
! !
! 74!
When considering teacher quality, future research could also investigate teachers’ level of
preparedness for teaching in a departmentalized setting. Teachers may or may not be provided
with opportunities for collaboration with other teachers. Schools providing and requiring
collaboration amongst teachers may demonstrate higher student achievement than those schools
who do not provide and require this time. This collaboration time may prevent teaching in
isolation, and may assist teachers with preparing more quality lessons for the students.
School Leader Quality. The quality of the school leader was not taken into
consideration for the sake of this study. However, a school leader’s effectiveness is vital to
increases in student achievement. Along with the MTES, Mississippi has also implemented the
Mississippi Principal Evaluation Instrument (MPES). District leaders evaluate and assign a
score to principals and assistant principals. A researcher may further this study by seeking to
determine if there is a relationship between school leaders’ MPES scores and QDI-R differences.
Early Learning Programs. Based on considerable increases and decreases in QDI-R
differences for many schools included in this study, the researcher began to question if early
learning programs such as pre-kindergarten or Head Start programs had an effect on student
achievement. This study could be extended by comparing the effect of school structure on QDI-
R values when controlling for schools with early learning programs.
Conclusions
The current study found no significant differences in grades four, five, and six language
arts, and no significant difference was found between grades four and five mathematics. There
was a significant difference in grade six mathematics, favoring departmentalization; however,
the results may be a Type I error due to the small number of grade six self-contained schools and
outliers included in the study. Although there are many factors determining the success of

! !
! 75!
Mississippi schools in increasing student achievement, research is vital in deciding which of
these factors are most effective.

! !
! 76!
BIBLIOGRAPHY
! !
! 77!
Amy, J. (2014, January 9). Mississippi schools get lowest achievement ranking in US. The
Dispatch. Retrieved from http://www.cdispatch.com/news/article.asp?aid=30227
Andrews, D. (2006). Departmentalization in the 5th grade classroom: Rethinking the
elementary school model. Retrieved from http://digitalcommons.unl.edu
/cgi/viewcontent.cgi?article=1005&context=mathmidactionresearch
Bingham, L. (2011). The affect of school structure on student achievement in mathematics.
(Unpublished master’s thesis). Lagrange College, Georgia.
Bowersock, C. (1970). A study of departmentalization at the elementary level. Retrieved from
http://digitalcommons.iwu.edu/cgi/viewcontent.cgi?article=1006&context=
education_honproj
Brackemyre, T. (2012). Education to the masses: The rise of public education in early America.
Retrieved from http://www.ushistoryscene.com/uncategorized/riseofpubliceducation
Brinkmann, J., & Twiford, T. (2012). Voices from the field: Skill sets needed for effective
collaboration and co-teaching. International Journal of Educational Leadership
Preparation, 7(3). Retrieved from http://files.eric.ed.gov/fulltext/EJ997467.pdf
Chan, T.C., & Jarman, D. (2004). Departmentalize elementary schools. Principal, 84(1), 70-72.
Chan, T. C., Terry, D., & Bessette, H. (2009). Fourth and fifth grade departmentalization: A
transition to middle school. Journal for the Liberal Arts and Sciences, 13(2), 5-13.
Chang, F. (2008). Evaluating the impact of departmentalization on elementary school students.
Planning and Changing, 39(3/4), 131-145. Retrieved from http://sfx.wisconsin.edu
/wisc?url_ver=Z39.88-2004&ctx_ve
Creswell, J.W. (2012). Educational research: Planning, conducting, and evaluating quantitative
and qualitative research (4th ed.). Boston, MA: Pearson Education.
! !
! 78!
Dee, T., & Jacobs, B. (2011). The impact of No Child Left Behind on student achievement.
Journal of Policy Analysis and Management. 30(3). 418-446. doi: 10.1002/pam.20586
Department of Education Organization Act, Public Law 96-88. (1979). Retrieved from
https://www.congress.gov/bill/96th-congress/senate-bill/210/all-info
Dropsey, M. (2004). Departmentalization in elementary schools. Retrieved from
http://personal.ashland.edu/dkommer/Inq%20Papers%20Fall%2004/
Dropsey%20Final.p
Ediger, M. (2002). Grouping and organizing for instruction in reading. Retrieved from
http://files.eric.ed.gov/fulltext/ED471842.pdf
Education Projects in Education Research Center (2011). Adequate yearly progress.
Education Week. Retrieved from http://www.edweek.org/ew/issues/adequate-yearly-
progress
Findley, W.G. (1966). Departmentalization vs graded classroom organization in the
elementary school (grades 1-7). Retrieved from
http://www.eric.ed.gov/contentdelivery/servlet/ERICServlet?accno=ED017050
Fuller, B., Wright, J., Gesicki, K. & Kang, E. (2007). Gauging growth: How to judge No Child
Left Behind? Educational Researcher, 36(5). 268-278. doi:10.3102/0013189X07306556
Gall, M.D., Gall, J.P., & Borg, W.R. (2007). Educational research: An introduction (8th ed.).
Boston, MA: Pearson Education.
Gewertz, C. (2014). Platooning on the rise in early grades. Education Week. 33(21). 1,16-17.
Retrieved from http://www.edweek.org/ew/articles/2014/ 02/19/21department.h33.html
Goals 2000: Educate America Act, H.R. 1804 (2000). Retrieved from www2.ed.gov
/legislation/GOALS2000/TheAct/index.html

! !
! 79!
Harris, M.B. (1996). The effect of departmentalization on the reading achievement of sixth-
grade students. Retrieved from http://www.eric.ed.gov/PDFS/ED395298.pdf
Hinkle, D.E., Wiersma, W., & Jurs, S.G. (2003). Applied statistics for the behavioral
sciences (5th ed.). Boston, MA: Houghton Mifflin Co.
Hood, L. (2009). Platooning instruction: Districts weigh pros and cons of departmentalizing
elementary schools. Harvard Education Letter, 25(6). Retrieved from
http://www.nctq.org/docs/Platooning_instruction_-_Harvard_Education_Letter.pdf
Hull, J.W. (2002). The No Child Left Behind Act of 2001: Leaving states behind? Retrieved
from https://www.slcatlanta.org/Publications/Education/NoChildLeftBehind.PDF
Improving America’s Schools Act of 1994, H.R. 6 (1994). Retrieved from
https://www2.ed.gov/legislation/ESEA/toc.html
John F. Kennedy Presidential Library and Museum. (2008). William Winter. Retrieved from
http://www.jfklibrary.org/Events-and-Awards/ProfileinCourageAward/AwardRecipients/
William-Winter-2008.aspx
Lamb, J.H. (2007). The testing culture in one rural Mississippi school. The High School
Journal, 90(4), 32-43. doi: 10.1353/hsj.2007.0017
Lamme, L. L. (1976). Self-contained to departmentalized: How reading habits changed.
Elementary School Journal, 76(4), 208-218.
Lobdell, L.O. & Van Ness, W.J. (1963). The self-contained classroom in the elementary school.
The Elementary School Journal, 63(4), 212-217. Retrieved from http://www.jstor.org
/stable/999836
Liu, F. (2011). Pre-service teachers’ perceptions of departmentalization of elementary
schools. International Journal of Whole Schooling, 7(1), 41-52. Retrieved from

! !
! 80!
http://www.eric.ed. gov/PDFS/EJ939059.pdf
Lund, A., & Lund, M. (2013). One way MANOVA is SPSS. Available from
https://statistics.laerd.com/premium/owm/one-way-manova-in-spss.php
Mass Moments. (2005). April 14, 1642: Massachusetts passes first education law. Retrieved
from http://www.massmoments.org/print_moment.cfm?mid=113
McGrath, C., & Rust, J. (2002). Academic achievement and between-class transition time for
self-contained and departmental upper elementary classes. Journal of Instructional
Psychology, 29(1), 40-43.
Mississippi Department of Education (2012). Public school accountability standards.
Retrieved from http://www.mde.k12.ms.us/docs/accreditation-library/2012-standards-
8-8-13.pdf?sfvrsn=2
Mississippi Department of Education Office of Research and Statistics (2010). Understanding
the Mississippi statewide accountability system. Jackson, MS.
Mississippi Department of Education Office of Student Assessment. (2014). MCT2
interpretive guide for teachers and administrators. Retrieved from
https://districtaccess.mde.k12.ms.us/studentassessment/Public%20Access/Statewide_
Assssment_Programs/Ancillaries/MCT2/MCT2_2014_Interpretive_Guide.pdf
Mississippi Student Achievement Improvement Act of 1999, S.B. 2156. (1999). Retrieved
from billstatus.ls.state.ms.us/documents/1999/html/SB/2100-2199/SB156SG.htm
Moore, D.W. (2008). Classroom organizational structures as related to student achievement
in upper elementary grades in northeast Tennessee public schools. Retrieved from
http://dc.etsu.edu/cgi/viewcontent.cgi?article=3320&context=etd
Murphy, R. (1997). U.S. Department of Education. Retrieved from
! !
! 81!
http://www.cis.drexel.edu/faculty/shelfer/public_html/busrefpapers/edu.htm
National Assessment of Educational Progress. (n.d.). In Education.com Glossary of Education.
Retrieved from http://www.education.com/definition/national-assessment-of-educational-
progress
National Assessment of Educational Progress (2012a). About state NAEP. Retrieved from
http://nces.ed.gov/nationsreportcard/about/state.asp
National Assessment of Educational Progress (2012b). NAEP: Measuring student progress since
1964. Retrieved from http://nces.ed.gov/nationsreportcard/about/naephistory.asp
New York State Education Department. (2006). Federal education policy and the states, 1945-
2009: A brief synopsis. Retrieved from
http://www.archives.nysed.gov/edpolicy/altformats/ed_background_overview_essay.pdf
No Child Left Behind. (n.d.). In Education.com Glossary of Education. Retrieved from
http://www.education.com/definition/no-child-left-behind-nclb
No Child Left Behind Act of 2001, P.L. 107-110. (2001). Retrieved from
www2.ed.gov/policy/elsec/leg/esea02/107-110.pdf
Pearson Education. (n.d.). Multivariate analyses (14). Retrieved from
http://www.pearsonhighered.com/assets/hip/gb/uploads/Mayers_IntroStatsSPSS_Ch1 4.pdf
Perlstein, L. (2003). Not much just chillin: The hidden lives of middle schoolers. New York,
NY: Farrar, Straus, & Griroux.
Rogers, R. (2012). Principals’ perceptions of departmentalization and self-contained
classrooms at the elementary school level. Retrieved from http://atlanta.k12.ga.us/
cms/lib/GA01000924/Centricity/Domain/1540/rogers-richard-h_principals-
perceptions_education_dissertation_2012.pdf
! !
! 82!
Rose, L.C. (2004). No Child Left Behind: The mathematics of guaranteed failure. Educational
Horizons, 82(2), 121-130. Retrieved from http://www.eric.ed.gov/PDFS/EJ684642.pdf
Rosenberg, M.S., Westling, D.L., & McLeskey, J. (2012). No Child Left Behind. Retrieved
from http://www.education.com/print/no-child-left-behind-NCLB
Scaled Score. (n.d.). In Education.com Glossary of Education. Retrieved from
http://www.education.com/definition/scale-score
Strohl, A. (2014). Comparison of self-contained and departmentalized elementary teachers’
perceptions of classroom structure and job satisfaction. Journal of Studies in Education.
4(1). doi: 10.5296/jse.v4i1.4802
Taylor-Buckner, N. (2014). The effects of elementary departmentalization on mathematics
proficiency. Retrieved from http://dx.doi.org/10.7916/D8D50K49
Thompson, K. (2011). Understanding the Mississippi growth model [PowerPoint Slides].
Retrieved from www.mde.k12.ms.us/docs/.../growth-training-boardmeetingv2.ppt?sfvrsn
Tozer, S., Senese, G., & Violas, P. (2009). School and society: Historical and contemporary
perspectives. (6th ed.). New York, NY: McGraw Hill.
United States Department of Education (2012). The federal role in education. Retrieved from
http://www2.ed.gov/about/overview/fed/role.html
United States Department of Education (2014). Improving basic programs operated by local
education agencies (Title I, Part A). Retrieved from
http://www2.ed.gov/programs/titleiparta/index.html
Welbourn, J. (2005). Research vs. practice: How are our schools setup? Retrieved from
http://cardinalscholar.bsu.edu/bitstream/handle/handle/193059/W45_2005WelbournJ
onnie.pdf?sequence=1
! !
! 83!
Yearwood, C. (2011). Effects of departmentalization versus traditional settings on fifth
graders’ math and reading achievement. Retrieved from http://digitalcommons.liberty.edu
/cgi/viewcontent.cgi?article=1475&context=doctoral

! !
! 84!
LIST OF APPENDECES

! !
! 85!
APPENDIX A
Email Questionnaire
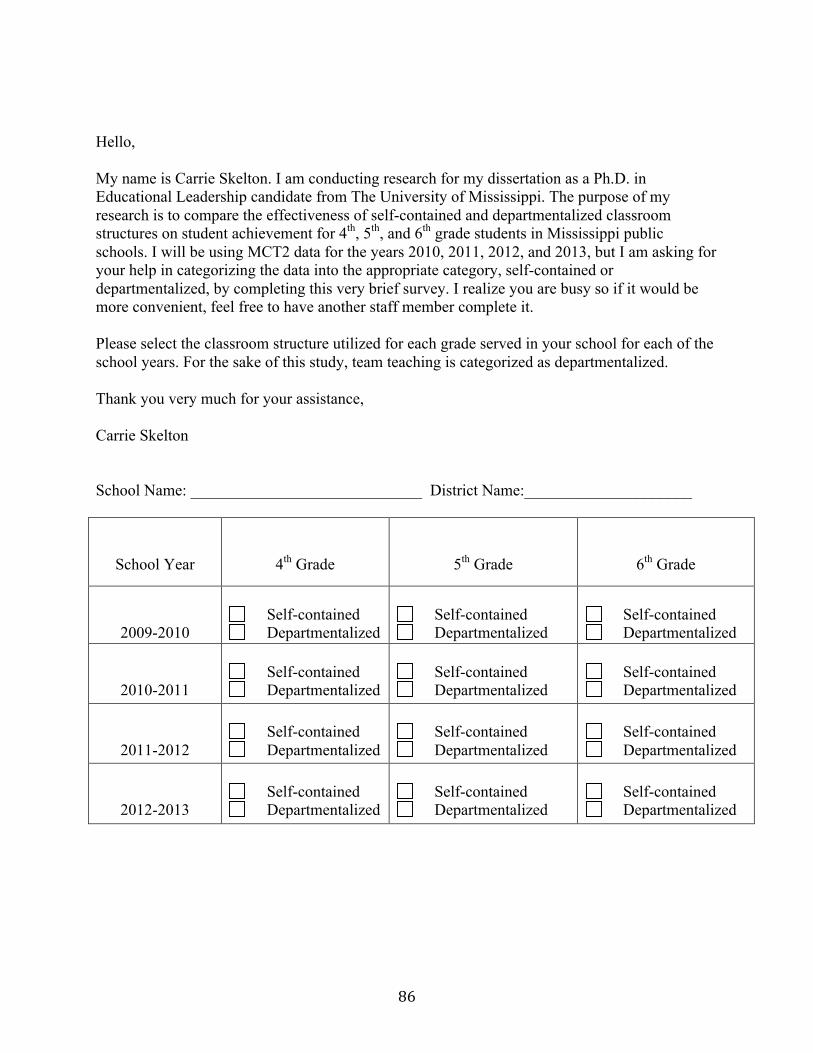
! !
! 86!
Hello, My name is Carrie Skelton. I am conducting research for my dissertation as a Ph.D. in Educational Leadership candidate from The University of Mississippi. The purpose of my research is to compare the effectiveness of self-contained and departmentalized classroom structures on student achievement for 4th, 5th, and 6th grade students in Mississippi public schools. I will be using MCT2 data for the years 2010, 2011, 2012, and 2013, but I am asking for your help in categorizing the data into the appropriate category, self-contained or departmentalized, by completing this very brief survey. I realize you are busy so if it would be more convenient, feel free to have another staff member complete it. Please select the classroom structure utilized for each grade served in your school for each of the school years. For the sake of this study, team teaching is categorized as departmentalized. Thank you very much for your assistance, Carrie Skelton School Name: _____________________________ District Name:_____________________
School Year
4th Grade
5th Grade
6th Grade
2009-2010
Self-contained Departmentalized
Self-contained Departmentalized
Self-contained Departmentalized
2010-2011
Self-contained Departmentalized
Self-contained Departmentalized
Self-contained Departmentalized
2011-2012
Self-contained Departmentalized
Self-contained Departmentalized
Self-contained Departmentalized
2012-2013
Self-contained Departmentalized
Self-contained Departmentalized
Self-contained Departmentalized
! !
! 87!
APPENDIX B
Grade Four SPSS Boxplots

! !
! 88!
!
!
!o Represents univariate outliers 1.5 boxlengths from edge of box.
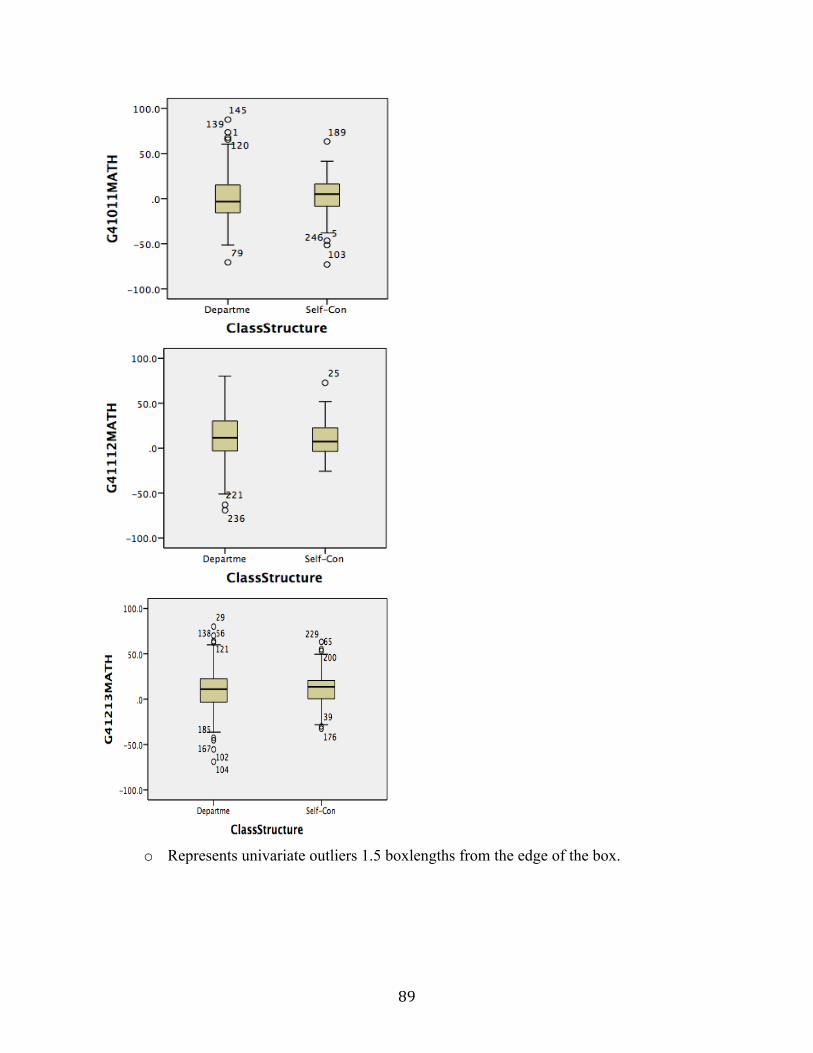
! !
! 89!
!
!
!o Represents univariate outliers 1.5 boxlengths from the edge of the box.
! !
! 90!
APPENDIX C
Grade Four Pearson (r) Correlation Tables
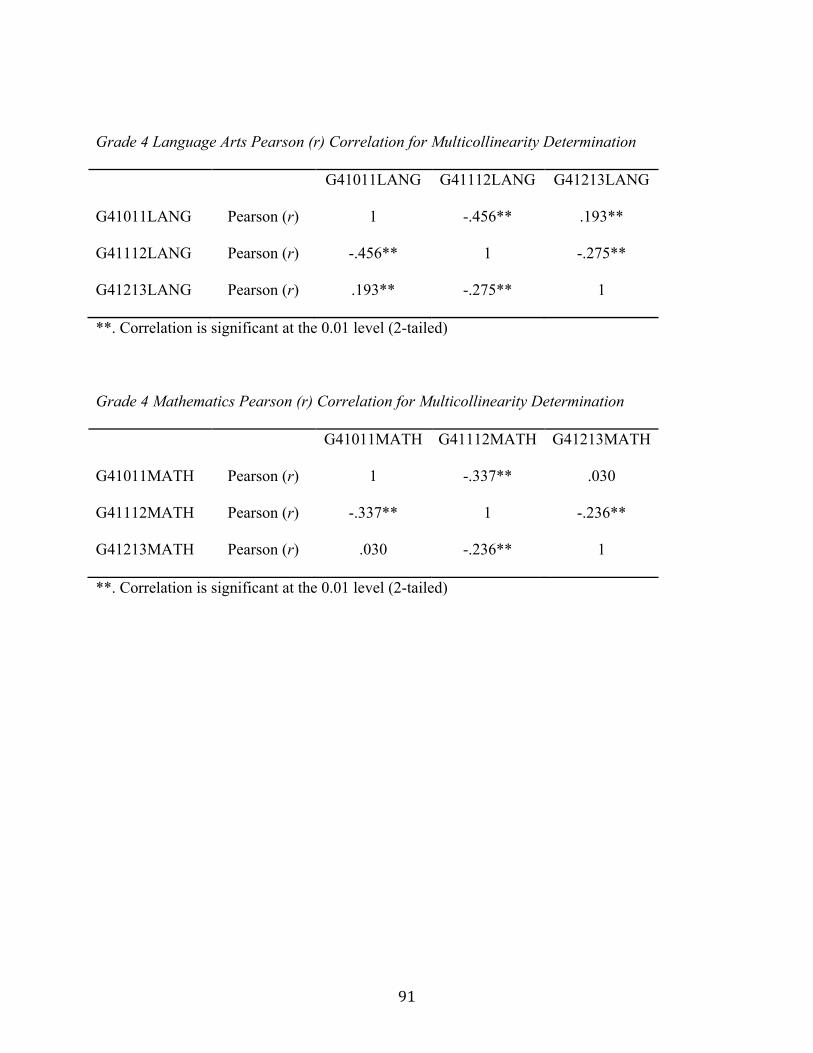
! !
! 91!
Grade 4 Language Arts Pearson (r) Correlation for Multicollinearity Determination
G41011LANG G41112LANG G41213LANG
G41011LANG Pearson (r) 1 -.456** .193**
G41112LANG Pearson (r) -.456** 1 -.275**
G41213LANG Pearson (r) .193** -.275** 1
**. Correlation is significant at the 0.01 level (2-tailed)
Grade 4 Mathematics Pearson (r) Correlation for Multicollinearity Determination
G41011MATH G41112MATH G41213MATH
G41011MATH Pearson (r) 1 -.337** .030
G41112MATH Pearson (r) -.337** 1 -.236**
G41213MATH Pearson (r) .030 -.236** 1
**. Correlation is significant at the 0.01 level (2-tailed)
! !
! 92!
APPENDIX D
Scatterplot Matrices for Grade 4 Language Arts

! !
! 93!
!!!!!!!!!!!!!!!!!!!!!!!!!!!!!!!!!!!!!!!!

! !
! 94!
APPENDIX E
Scatterplot Matrices for Grade 4 Mathematics
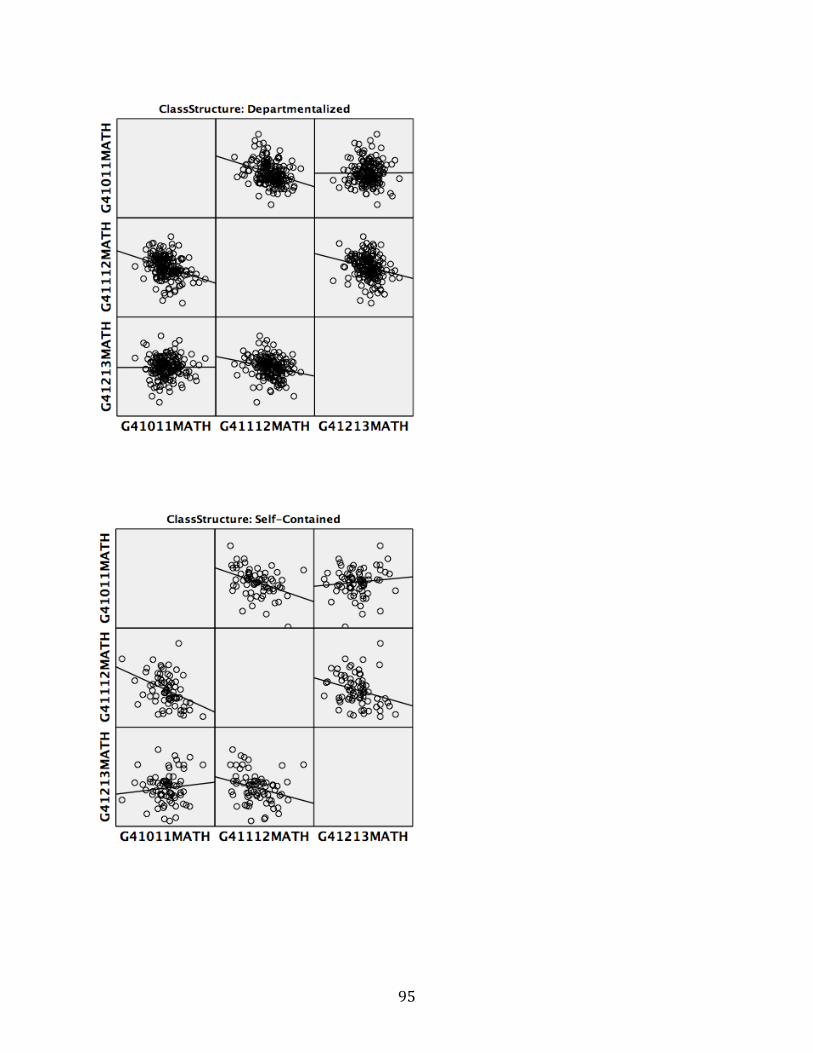
! !
! 95!
!!!!!!!!!!!!!!!!!
!!
!!!!!!!!!!!!!!!!!!!!
!
! !
! 96!
APPENDIX F
Grade Four Mahalanobis Distance Results

! !
! 97!
Mahalanobis Distance results for grade 4 language arts
School Name Class Structure MAH_1
Pineville Elem D 19.51529*
French Elem D 17.83854*
Heidelberg School S 17.34576*
Brown Elem S 16.91066*
*Value greater than 16.27 is a multivariate outlier.
Mahalanobis Distance results for grade 4 mathematics
School Name Class Structure MAH_2
Heidelberg School S 20.05261*
French Elem D 17.83854*
*Value greater than 16.27 is a multivariate outlier.
! !
! 98!
APPENDIX G
Grade 5 SPSS Boxplots
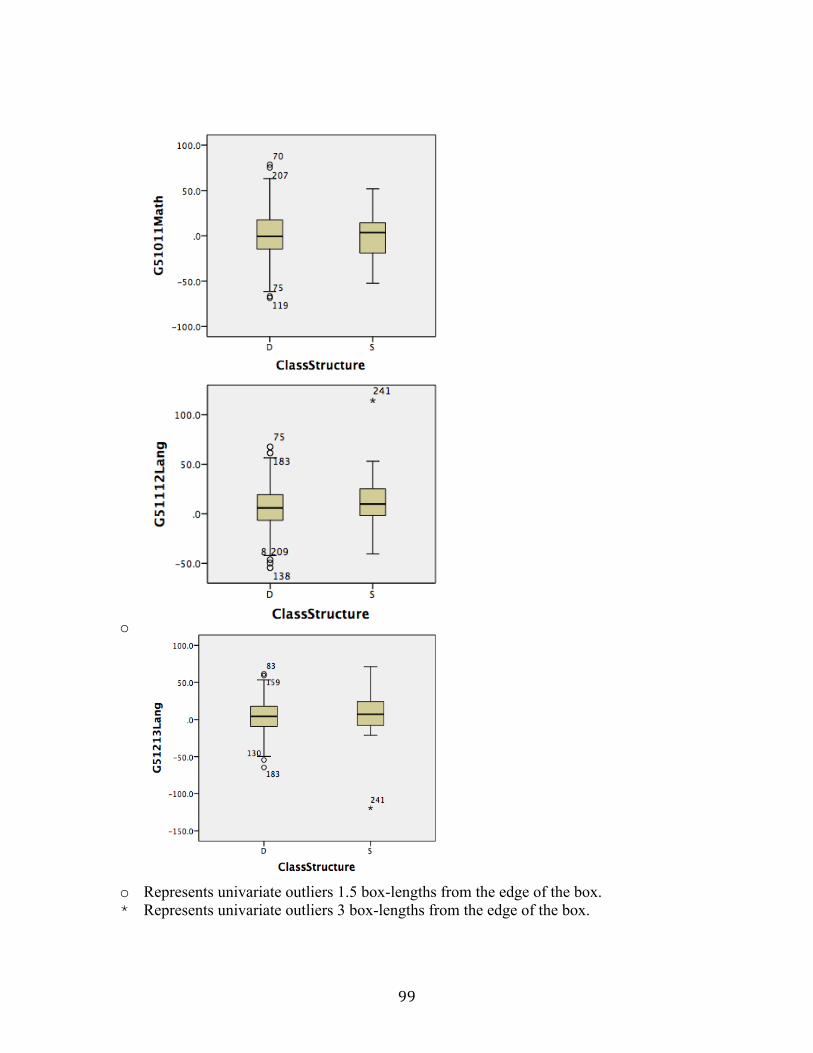
! !
! 99!
o
o Represents univariate outliers 1.5 box-lengths from the edge of the box. * Represents univariate outliers 3 box-lengths from the edge of the box.
! !

! !
! 100!
!!!!!!!!!!!!!!!!!!!!!!!!!!!!
!!!!!!!!!!!!!!!
!o Represents univariate outliers 1.5 box-lengths from the edge of the box. * Represents univariate outliers 3 box-lengths from the edge of the box.
! !
! 101!
* APPENDIX H Grade 5 Pearson (r) Correlation Tables
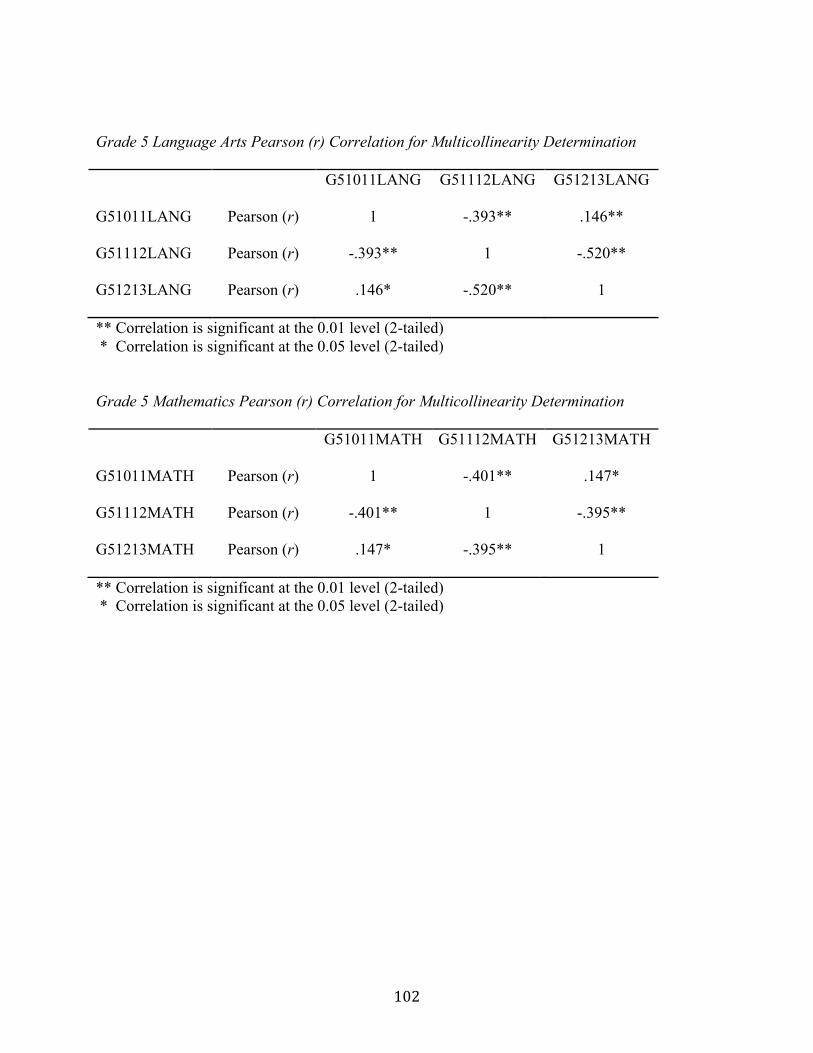
! !
! 102!
Grade 5 Language Arts Pearson (r) Correlation for Multicollinearity Determination
G51011LANG G51112LANG G51213LANG
G51011LANG Pearson (r) 1 -.393** .146**
G51112LANG Pearson (r) -.393** 1 -.520**
G51213LANG Pearson (r) .146* -.520** 1
** Correlation is significant at the 0.01 level (2-tailed) * Correlation is significant at the 0.05 level (2-tailed) Grade 5 Mathematics Pearson (r) Correlation for Multicollinearity Determination
G51011MATH G51112MATH G51213MATH
G51011MATH Pearson (r) 1 -.401** .147*
G51112MATH Pearson (r) -.401** 1 -.395**
G51213MATH Pearson (r) .147* -.395** 1
** Correlation is significant at the 0.01 level (2-tailed) * Correlation is significant at the 0.05 level (2-tailed)
! !
! 103!
APPENDIX I
Scatterplot Matrices for Grade 5 Language Arts

! !
! 104!
!!!!!!!!!!!!!!!!!!!!!!!!!!!!!!!!!!!!
!!
! !
! 105!
APPENDIX J
Scatterplot Matrices for Grade 5 Mathematics
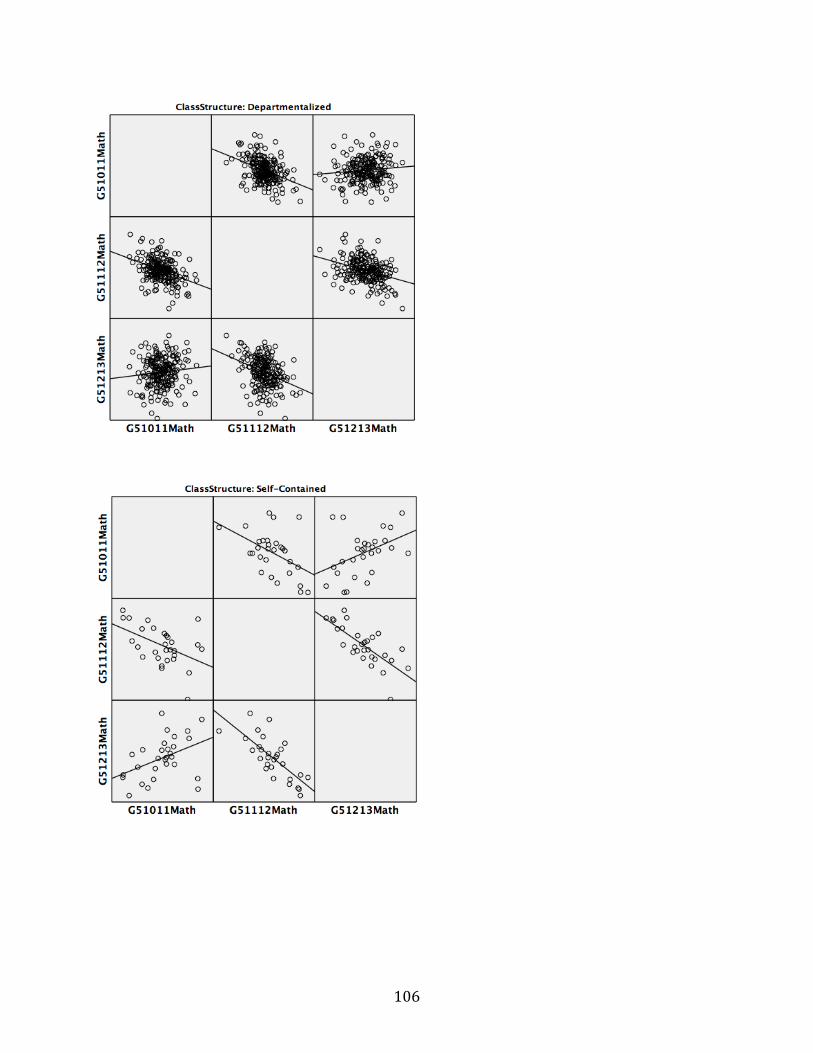
! !
! 106!
!!!!!!!!!!!!!!!!!
!!!!!!!!!!!!!!!!!!!!
!!
! !
! 107!
APPENDIX K
Grade 6 SPSS Boxplots

! !
! 108!
!!
!!
!Represents univariate outliers 1.5 box-lengths from the edge of the box.
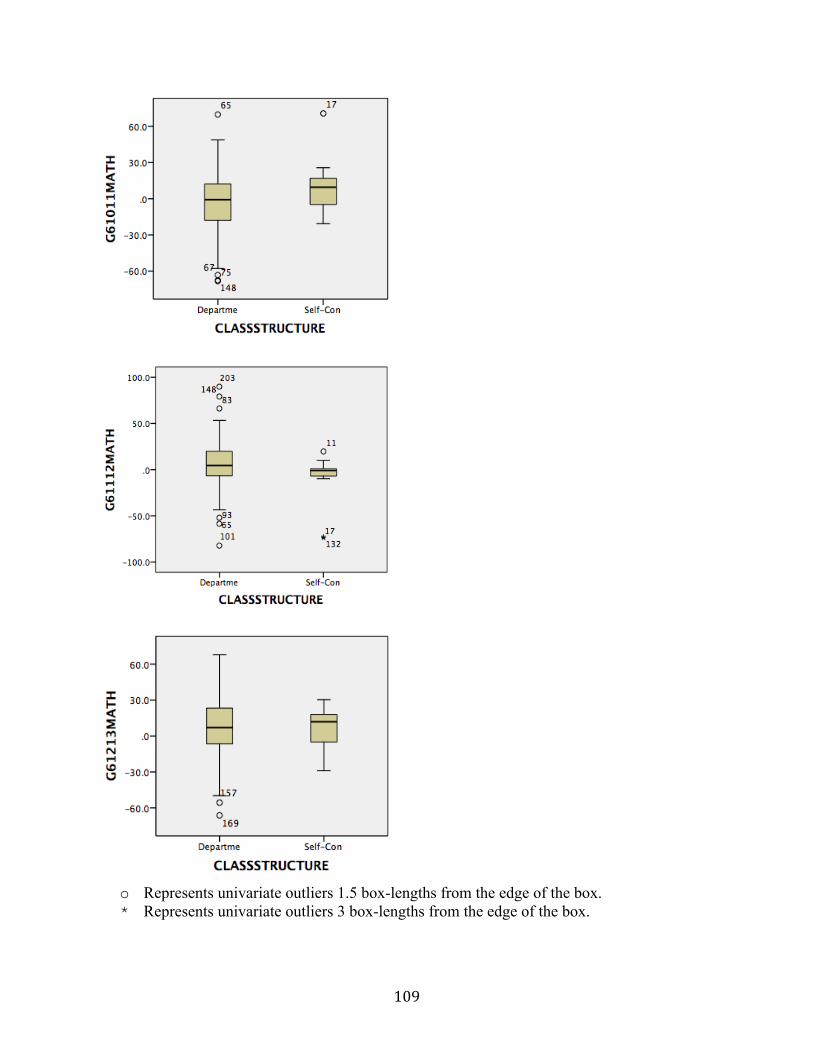
! !
! 109!
!!
!!
!o Represents univariate outliers 1.5 box-lengths from the edge of the box. * Represents univariate outliers 3 box-lengths from the edge of the box.

! !
! 110!
APPENDIX L
Grade 6 Pearson (r) Correlation Tables

! !
! 111!
Grade 6 Language Arts Pearson (r) Correlation for Multicollinearity Determination
G61011LANG G61112LANG G61213LANG
G61011LANG Pearson (r) 1 -.386** .070
G61112LANG Pearson (r) -.386** 1 -.396**
G61213LANG Pearson (r) .070 -.396** 1
** Correlation is significant at the 0.01 level (2-tailed) Grade 6 Mathematics Pearson (r) Correlation for Multicollinearity Determination
G61011MATH G61112MATH G61213MATH
G61011MATH Pearson (r) 1 -.358** .055
G61112MATH Pearson (r) -.358** 1 -.295**
G61213MATH Pearson (r) .055 -.295** 1
** Correlation is significant at the 0.01 level (2-tailed)
! !
! 112!
APPENDIX M
Scatterplot Matrices for Grade 6 Language Arts
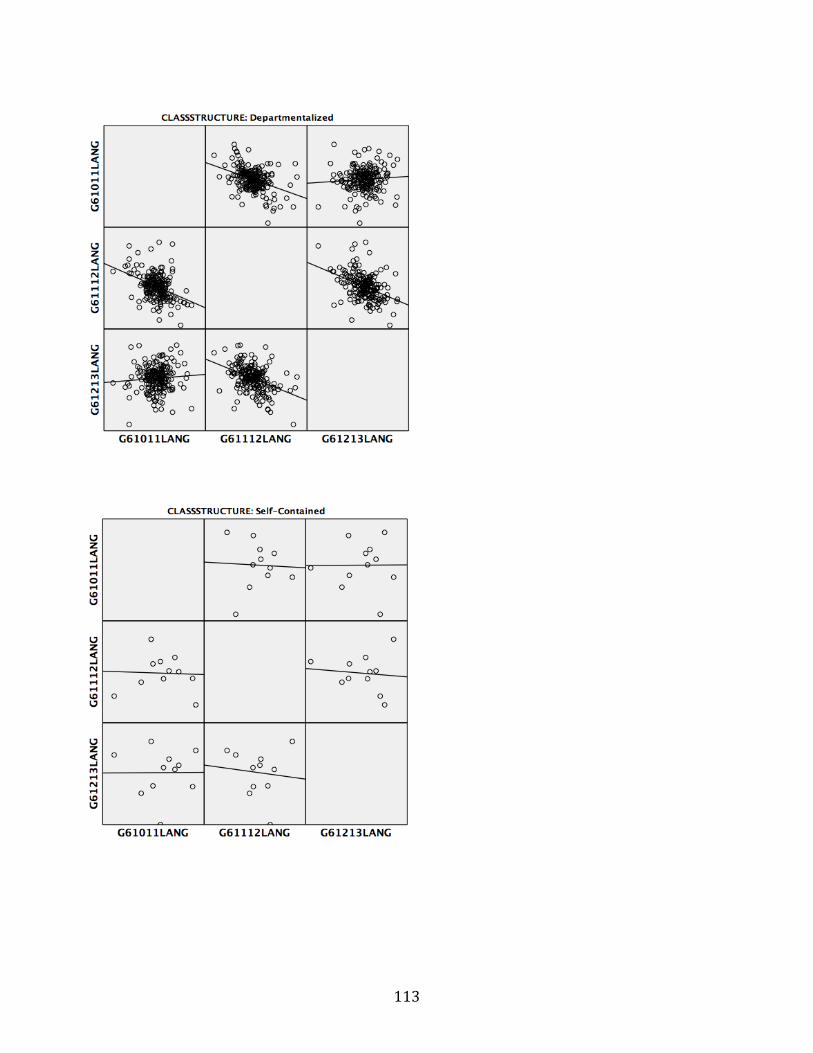
! !
! 113!
!!!!!!!!!!!!!!!!!
!!
!!!!!!!!!!!!!!!!!!!!
! !
! 114!
APPENDIX N
Scatterplot Matrices for Grade 6 Mathematics

! !
! 115!
!!!!!!!!!!!!!!!!!!!
!!!!!!!!!!!!!!!!!!!!
!!
! !
! 116!
APPENDIX O
Grade 6 Mahalanobis Distance Results
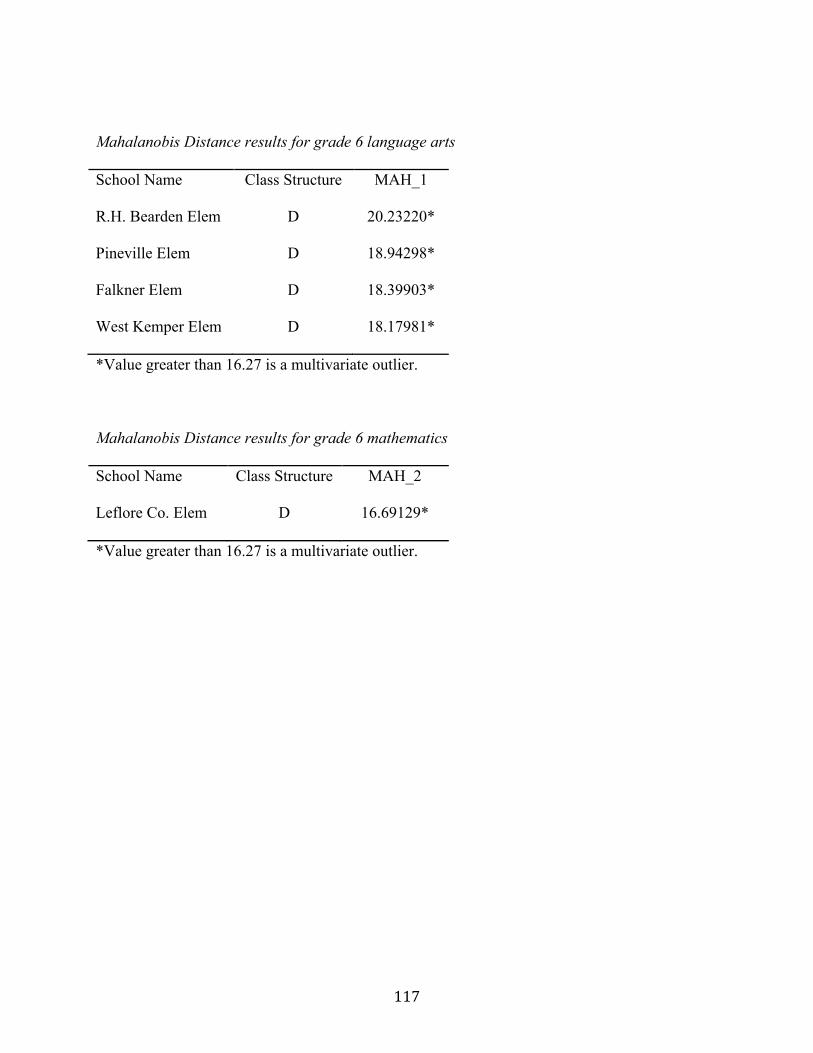
! !
! 117!
Mahalanobis Distance results for grade 6 language arts
School Name Class Structure MAH_1
R.H. Bearden Elem D 20.23220*
Pineville Elem D 18.94298*
Falkner Elem D 18.39903*
West Kemper Elem D 18.17981*
*Value greater than 16.27 is a multivariate outlier.
Mahalanobis Distance results for grade 6 mathematics
School Name Class Structure MAH_2
Leflore Co. Elem D 16.69129*
*Value greater than 16.27 is a multivariate outlier.
!

! !
! 118!
VITA
Carrie R. Skelton
Education June 2008 Union University M.Ed. Major: Curriculum & Instruction May 2002 Delta State University B.S.E. Major: Social Science Education
Professional Experience
Marshall County School District; Holly Springs, MS Curriculum Director—June 2014 --Present
o Monitor and improve Response to Intervention process and effectiveness at each school o Evaluate, purchase, and monitor usage and effectiveness of educational programs at each
school o Provide professional development for teachers and administrative teams o Monitor and provide feedback for principals on the Mississippi Teacher Evaluation
System o Perform drop-in observations at school sites for monitoring and improvement of
instruction o Provide support for administrators and staff o Coordinate dual enrollment—recruit qualified students, assist with application process,
work with counselors’ on monitoring student progress throughout courses o Textbook Coordinator—Assist principals with keeping textbook inventories current in
Mississippi’s Textbook Inventory Management System (TIMS), work with principals and school staff in choosing new purchases based on budget, textbook adoption, and school needs; attend textbook caravans and evaluate samples
District Test Coordinator—February 2014 – Present
o Develop and disseminate District Test Security Plan o Develop policies and procedures ensuring maximum test security in coordination with
Mississippi Department of Education and testing publishers o Implement and enforce effective security measures for test materials and testing practices o Provide guidance for School Test Coordinators in understanding duties and
responsibilities o Disseminate and collect test materials
! !
! 119!
o Conduct audits to ensure district policies and procedures are implemented correctly o Investigate and report test irregularities to the Superintendent and the Office of Student
Assessment o Communicate with Technology Coordinator ensuring all equipment is ready for online
assessment o Assist School Test Coordinators with validating student rosters, training and
troubleshooting for online assessment sites such as PearsonAccess.com or PearsonAccessNext.com
o Ensure all students requiring accommodations receive those accommodations and monitor all documentation ensuring those accommodations are not given illegally
o Monitor and assist with intervention programs for students failing a required state assessment
Assistant Principal/Instructional Facilitator—August 2009 – June 2014
o Monitor and assess the instructional program o Implement data-driven best practices in lesson planning; model effective lessons;
Conduct professional development sessions; Evaluate and critique teachers; Continuously evaluate and adjust school instructional program; Develop incentive programs for students;
o Supervise the student body o Implement and utilize Positive Behavior Intervention System; Assign
consequences according to district handbook; Conduct parent conferences; Develop behavior plans; Mentor students
o Response-to-Intervention o Devise and implement safety nets for struggling learners; Monitor student
progress and revise learning program as needed; o Maintenance/Custodial Staff Supervisor
o Monitor cleanliness of classrooms and facilities; Assign repairs for maintenance staff and ensure repairs are completed; Assist custodians/maintenance staff with monthly orders; oversee summer work projects at school level
o Campus Transportation Supervisor o Resolve complaints from parents, drivers, and students o Monitor bus cleanliness and maintenance upkeep
School Test Coordinator—August 2009 – February 2014
o Developed and disseminated School Test Security Plan in accordance with District Test Security Plan
o Worked in conjunction with District Test Coordinator ensuring maximum test security with district policy, Mississippi Department of Education, and testing publishers
o Provided guidance and training for test administrators and proctors o Issued and collected test materials o Monitored testing practices and procedures
School Level Federal Programs Coordinator—August 2009 – August 2013
o Develop budgets and monitor expenditures of local budgets and funds associated with federal grants
! !
! 120!
o Wrote grants to secure federal funds o Correspond with committee of stakeholders seeking input for expenditures of funds
Yearbook Coordinator—August 2008 – June 2009; August 2012 – Present
o Take photographs of students o Recruit and supervise yearbook committee o Schedule school picture dates o Conduct fundraisers o Supervise creation of yearbook o Sell and deliver yearbooks
Teacher—August 2002 – July 2009
o Taught the following Language Arts classes: - Learning Strategies - English I
o Taught the following Social Science classes: - Middle School World History - Middle School U.S. History - Mississippi Studies - Introduction to World Geography - Advanced World Geography - Psychology - Sociology - Introduction to Law
o Mentor Teacher Coach—August 2003 – July 2009
o Head Volleyball Coach o During first year of program, team advanced to North Half of Mississippi
tournament o Assistant Girls’ Basketball Coach
o During 05-06 season, girl’s team was first to advance to state tournament (Final Four)
o Assistant Girls’ Softball Coach
Certifications
National Institute for School Leadership (NISL) Mississippi Educator Licensure Endorsements: Career Level Administrator; English (7-12); Social Sciences (7-12) License Number: 176798 Tennessee Educator Licensure Endorsement: Beginning Administrator (Pre K-12) License Number: 000270232

! !
! 121!
Texas Educator Licensure Endorsement: Principal (EC-12); Superintendent (EC-12) !Arkansas Educator Licensure Endorsement: English (7-12); Building Level Administrator (P-12)
Research, Publications
Pannell, S., Skelton, C., Bailey, J., & Lewis, L. (2007). Implementing nutritional strategies in the secondary classroom. (Master’s Action Research Project). Union University, Tennessee.
Grants Mississippi Department of Education, 1003A School Improvement Grant, Byhalia Middle School, 2009 – 2010. $144, 728.80 Mississippi Department of Education, 1003A School Improvement Grant, Byhalia Middle School, 2010 – 2011. $57,461.48 Mississippi Department of Education, 1003A School Improvement Grant, Byhalia Middle School, 2011 – 2012. $20,709.83 Mississippi Department of Education, 1003A School Improvement Grant, Byhalia Elementary School, 2012-2013. 46,905.59
Professional Organizations
Association for Supervision and Curriculum Development (ASCD) Mississippi Professional Educators (MPE)
!