Embed Size (px)
Citation preview
Ple
ase
note
tha
t th
is is a
n a
uth
or-
pro
du
ce
d P
DF
of
an
art
icle
acce
pte
d fo
r p
ub
lica
tio
n fo
llow
ing
pee
r re
vie
w. T
he
de
fin
itiv
e p
ublis
he
r-au
then
tica
ted
ve
rsio
n is a
va
ilab
le o
n t
he
pu
blis
her
We
b s
ite
1
Aquaculture February 2014, Volumes 422-423, Pages 47-53 http://dx.doi.org/10.1016/j.aquaculture.2013.11.011 © 2013 Elsevier B.V. All rights reserved.
Archimer http://archimer.ifremer.fr
The effects of dietary carbohydrate sources and forms on metabolic response and intestinal microbiota in sea bass juveniles, Dicentrarchus
labrax
François-Joël Gatesoupe
a, *, Christine Huelvan
b, Nicolas Le Bayon
b, Armelle Sévère
b,
Inga Marie Aasenc, Kristin F. Degnes
c, David Mazurais
b, Stéphane Panserat
a,
José L. Zambonino-Infanteb, Sadasivam J. Kaushik
a
a INRA, UR 1067, Nutrition, Métabolisme, Aquaculture, 64310 Saint-Pée-sur-Nivelle, France
b Ifremer, Unité de Physiologie Fonctionnelle des Organismes Marins, LEMAR UMR 6539, Ifremer, Centre de
Brest, Laboratoire PFOM/ARN, BP 70, 29280 Plouzané, France c SINTEF Materials and Chemistry, NO-7465 Trondheim, Norway
*: Corresponding author : François-Joël Gatesoupe, Tel.: + 33 2 98 22 43 89 ; fax: + 33 2 98 22 43 66 ; email address : [email protected] [email protected] ; [email protected] ; [email protected] ; [email protected] ; [email protected] ; [email protected] ; [email protected] ; [email protected] ; [email protected]
Abstract: The aim of this work was to investigate the catabolic process of three kinds of dietary carbohydrates in the gut of sea bass juveniles, with the possible contribution of the intestinal microbiota to the nutrition of the host, and the subsequent effects on intermediary metabolism. A first diet contained waxy maize (99% amylopectin), a highly digestible form of starch. A second diet was less quickly digestible due to its high amylose content of resistant starch. Two other diets contained fibre instead of starch, either only cellulose as control, or also other non-starch polysaccharides brought by lupin meal. The effect of the diets on the host confirmed previous results, with the stimulation of glucose storage in the liver in sea bass fed the starchy diets, which caused a significant increase in liver weight, while lupin meal caused an increase in visceral mass. Glycaemia was higher 7 ± 1 h after the last meal in the group fed resistant starch, compared to the other dietary groups, while the fast digestion of waxy maize resulted already in hypertriglyceridemia, possibly due to hepatic neolipogenesis. At the same sampling time, the activity of free amylase was reduced in the intestine of sea bass fed resistant starch, but maltase activity was stimulated in the brush border membranes of enterocytes in the same group, confirming thus the timely digestion of resistant starch. Hepatic mRNA transcripts indicated that glucose metabolism was oriented towards neoglucogenesis by the high-fibre diets, and towards glucose storage by the starchy diets, especially with waxy maize. The diet influenced both faecal and mucosal microbiota, though in a different way, likely due to the interaction with the host. Lupin meal seemed potentially interesting as a source of prebiotic polysaccharides, by modifying the balance between Vibrio spp. and Clostridium sp. Both forms of starch were also partly metabolized by microbiota, resulting in an increased concentration of acetate in the faeces.
Ple
ase
note
tha
t th
is is a
n a
uth
or-
pro
du
ce
d P
DF
of
an
art
icle
acce
pte
d fo
r p
ub
lica
tio
n fo
llow
ing
pee
r re
vie
w. T
he
de
fin
itiv
e p
ublis
he
r-au
then
tica
ted
ve
rsio
n is a
va
ilab
le o
n t
he
pu
blis
her
We
b s
ite
2
Highlights
► The diet of sea bass juveniles can contain at least 25% starch ► The metabolic response to dietary carbohydrates is flexible ► More than 30% lupin meal can be introduced, with possible prebiotic effect ► Intestinal microbiota is influenced by the diet ► Microbes contribute to starch digestion, as showed by acetate production in faeces
Abbreviations ANOSIM, ANalysis Of Similarities; GK, GlucoKinase; GLUT2, Glucose Transporter 2; HPLC, High-Performance Liquid Chromatography; LC-MS, Liquid Chromatography-Mass Spectrometry; OTU, Operational Taxonomic Unit; PEPCK, PhosphoEnolPyruvate CarboxyKinase; RT-PCR-DGGE, Denaturing Gradient Gel Electrophoresis of products obtained after Polymerase Chain Reaction of RNA templates transformed in complementary DNA by Reverse Transcription; SCFA, Short Chain Fatty Acids; SGR, Specific Growth Rate; SIMPER, SIMilarity PERcentage Keywords : Digestive enzymes ; glucose metabolism ; intestinal microbiota ; viscerosomatic index ; gene expression ; metabolite analyses ; vegetable feedstuffs
1. Introduction
One of the main challenges for sustainably developing aquaculture is to increase feed supply without jeopardizing natural resources. Fish can adapt to feed changes with specific limitations, particularly due to glucose metabolism in carnivorous fishes (Polakof et al., 2012a). European sea bass can regulate relatively high levels of plasmatic glucose within 24 h (Peres et al., 1999), and the species may use efficiently up to 20% digestible carbohydrates (Enes et al., 2011). Vegetal sources contain digestible
ACC
EPTE
D M
ANU
SCR
IPT
ACCEPTED MANUSCRIPT4
polysaccharides mainly in the form of starches with variable proportions of amylopectin
and amylose. Amylopectin is a highly branched polymer, which is quickly digested and
increases glycaemia (Hu et al., 2004). In sea bass, Enes et al. (2006) showed a higher
digestibility of waxy maize starch (99% amylopectin) compared to normal starch (72%
amylopectin). However, growth performance and feed efficiency were not affected in
this experiment. The digestion kinetics of starch depend on the proportion of amylose –
a relatively linear polymer, besides other functional properties, such as swelling,
viscosity, and pasting parameters (Blazek and Copeland, 2010). A positive effect of
starch with high amylose content (70%) was demonstrated on the glycaemic regulation
in sunshine bass by Rawles and Lochman (2003). Such resistant starch has not been
tested yet in sea bass, but the partial substitution of fish meal and gelatinized corn starch
by amylose-rich pea seed meal improved protein utilization efficiency and
hepatosomatic index, when the diet included 20-30% of this ingredient (dry matter
basis, Gouveia and Davies, 2000). Other pea seeds were tested as alternative starch
sources in the diet of sea bass, with positive effects on digestion and glycaemia
(Adamidou et al., 2009). Resistant starch affects faecal microbiota in human, by
decreasing generally the relative abundance of Firmicutes, while increasing the
proportion of Actinobacteria, Bifidobacteriaceae in particular (Martinez et al., 2010).
Sugita et al. (1997) suggested that the production of amylase by intestinal bacteria
contributed to starch digestion in freshwater fish, and likely also in species living in
coastal water (Sugita et al., 1996). The intestinal fermentation of carbohydrates was
demonstrated in several species, including sea bass (Leenhouwers et al., 2008). The
implication of intestinal microbiota on carbohydrate utilization in fish has been scarcely
considered so far, in spite of the numerous studies reviewed by Stone (2003). Such host-
ACC
EPTE
D M
ANU
SCR
IPT
ACCEPTED MANUSCRIPT5
microbes interaction could help to solve unanswered questions. For example, Enes et al.
(2006) noted the protein-sparing effect of carbohydrates that was obtained with starch,
either rich in amylose or not, though the starchy diets caused little apparent effect on
glucose metabolism in the liver of sea bass. These authors hypothesized alternative
muscular or excretory pathways, but possible interaction with intestinal bacteria should
also be considered. The present work attempted to reconsider the effects of the form of
dietary starch (1) on starch digestion in sea bass and the consequences on postprandial
glycaemia and hepatic glycogen storage, and (2) on the concomitant changes in
intestinal microbiota. Vegetable protein sources contain also non-starch polysaccharides
that are not directly digestible by fish, but that may benefit the host through bacterial
interactions (Sinha et al., 2011). For example, lupin meal, affected intestinal microbiota
in gilthead sea bream (Silva et al., 2011). In the present experiment, the effects of the
starchy diets were compared to those of two other diets containing either cellulose as the
only carbohydrate source (control group), or also the other non-starch polysaccharides
brought by lupin meal.
2. Material and methods
2.1 Experimental design, rearing conditions and diets
A total of 370 sea bass juveniles were tagged and distributed evenly in twenty-four 100-
L tanks in a flow-through system. The initial mean weight was 40.6 ± 0.3g, without
significant difference between tanks. The water temperature was maintained at 23°C,
and the experiment lasted 2 months.
The experiment was designed based on the results obtained by Enes et al. (2006). Four
diets were prepared with similar supply of protein (420-430 g kg-1
; Table 1). The effects
ACC
EPTE
D M
ANU
SCR
IPT
ACCEPTED MANUSCRIPT6
of three different carbohydrate sources were studied in comparison with a control diet
containing fish meal and fish hydrolysate as only protein sources, and cellulose as single
carbohydrate additive (FM). Two forms of starch were compared (250 g kg-1
), either
highly digestible (waxy maize WM, containing 99% amylopectin), or slowly digestible
(amylomaize AM, resistant starch containing 70% amylose and 30% amylopectin). The
two starchy diets were compared to diet FM, and to a fourth diet with lupin meal that is
rich in non-starch polysaccharides (LPM). The four diets were allotted to 6 replicates
each (24 tanks in total). The diets were pelletised at mild temperature with a twin screw
extruder (BC 45, Clextral, France) to avoid starch degradation (Liu et al., 2010;
extrusion temperatures: 67°C, 58°C, 56°C, and 74°C for diets FM, WM, AM, and LPM,
respectively). The fish were fed 12h a day under artificial daylight exposure with
automatic continuous feeders. Before starting the experiment, the fish were adapted to
the rearing conditions for two months, during which they were fed a commercial diet
(Neo Grower Extra Marin; 43% protein, 20% fat; Le Gouessant Aquaculture, Lamballe,
France).
2.2 Sampling and analytical methods
Eight individuals were sampled per tank at the start of the experiment, after feeding the
commercial diet. In the morning of the sampling day, six hours before sampling, the fish
were hand-fed to satiation. Then in the afternoon, under anaesthesia, faeces were gently
harvested by abdominal stripping, and immediately frozen for metabolite analyses. Fish
were sampled during two consecutive afternoons, six hours after hand-feeding, which
corresponded to the optimal time for postprandial faecal production. After these two
sampling days, the commercial feed was replaced by the experimental diets. By the end
of the experiment, 56 days after the first sampling, faeces were collected again from
ACC
EPTE
D M
ANU
SCR
IPT
ACCEPTED MANUSCRIPT7
four of the eight individuals initially sampled per tank. The faeces were collected in the
same conditions as those used at the beginning of the experiment, but after feeding the
experimental diets. The individual faecal samples were divided in two collection tubes.
One tube was immediately frozen, as intended to analyse short-chain fatty acids (SCFA)
by gas chromatography (Jouany, 1982; Zhao et al., 2006) and other metabolites by
liquid chromatography-mass spectrometry (LC-MS; Hansen et al., 2013; Supplementary
Material S4). The second tube contained Extract-All (Eurobio) for RNA extraction and
RT-PCR-DGGE with the method of Lamari et al. (2013). The fish were fed the
experimental diets until the day of final sampling. At the end of the experiment, the
same four individuals per tank were euthanized. This final sampling lasted 3 days, in a
way to collect the blood samples for glycaemia and triglyceridemia measurement 7 ± 1
hours after the last meal in the eight tanks that were treated on each of the three days (2
tanks diet-1
day-1
; Ducasse-Cabanot et al., 2007). At the same time, the fish were
dissected, and the samples were chilled on ice. The intestine was washed out to empty
the remaining contents before sampling. The proximal intestine was reserved for
activity assays of digestive enzymes: free α-amylase (Metais and Bieth, 1968) and
maltase in the brush border membrane of enterocytes (Ducasse-Cabanot et al., 2007).
The liver was separated for RNA extraction to compare the expression of functional
genomic markers: GK, PEPCK, and GLUT2 (Polakof et al., 2012b). Gut mucosa and
associated microbiota were squeezed out from the distal intestine with metallic spatula,
and collected with sterile tweezers for RNA extraction and RT-PCR-DGGE. The
method allowed to discriminate the bacterial phyloptypes after the partial sequences of
16S ribosomal RNA, but these sequences could not be systematically read. When
ACC
EPTE
D M
ANU
SCR
IPT
ACCEPTED MANUSCRIPT8
feasible, some bands were extracted from the DGGE gels for bacterial sequencing
(Lamari et al., 2013).
2.3 Statistics
Body analyses and faecal SCFA production were compared by ANOVA or Kruskal-
Wallis test, depending on normality and homoscedasticity. Post-hoc tests were used for
multiple comparisons between dietary groups: Tukey after ANOVA for growth, somatic
indices, and acetate production; Student-Newman-Keuls after ANOVA for plasmatic
and enzymatic analyses, and after Kruskal-Wallis. The transcript levels of marker genes,
and the bacterial community profiles were analysed with REST and PAST softwares,
respectively (Ducasse-Cabanot et al., 2007; Lamari et al., 2013). The dissimilarities
between the bacterial profiles of the dietary groups were evaluated with Bray-Curtis
indices compared by ANOSIM and SIMPER (Clarke, 1993).
3. Results
3.1 Growth and somatic indices
There was no significant difference between the final mean weights and mean
individual specific growth rates (SGR) of the dietary groups (Table 2). However, the
non-significantly higher mean weights in Groups LPM and AM were explained by
higher viscerosomatic indices in both groups compared to WM and FM. The increase in
visceral mass observed in the three experimental diets compared to the control FM was
not distributed in the same way. The diet with resistant starch (AM) caused the highest
increase in liver mass, followed by the amylopectin-rich diet (WM), and both groups
were significantly different from Groups LPM and FM, whose hepathosomatic indices
ACC
EPTE
D M
ANU
SCR
IPT
ACCEPTED MANUSCRIPT9
were similar. The significant difference observed between the viscerosomatic indices of
these last two groups was likely due to an increase of perivisceral fat tissue with the diet
containing lupin meal (LPM).
3.2 Postprandial glycaemia, triglyceridemia, and enzyme activities in the
intestine
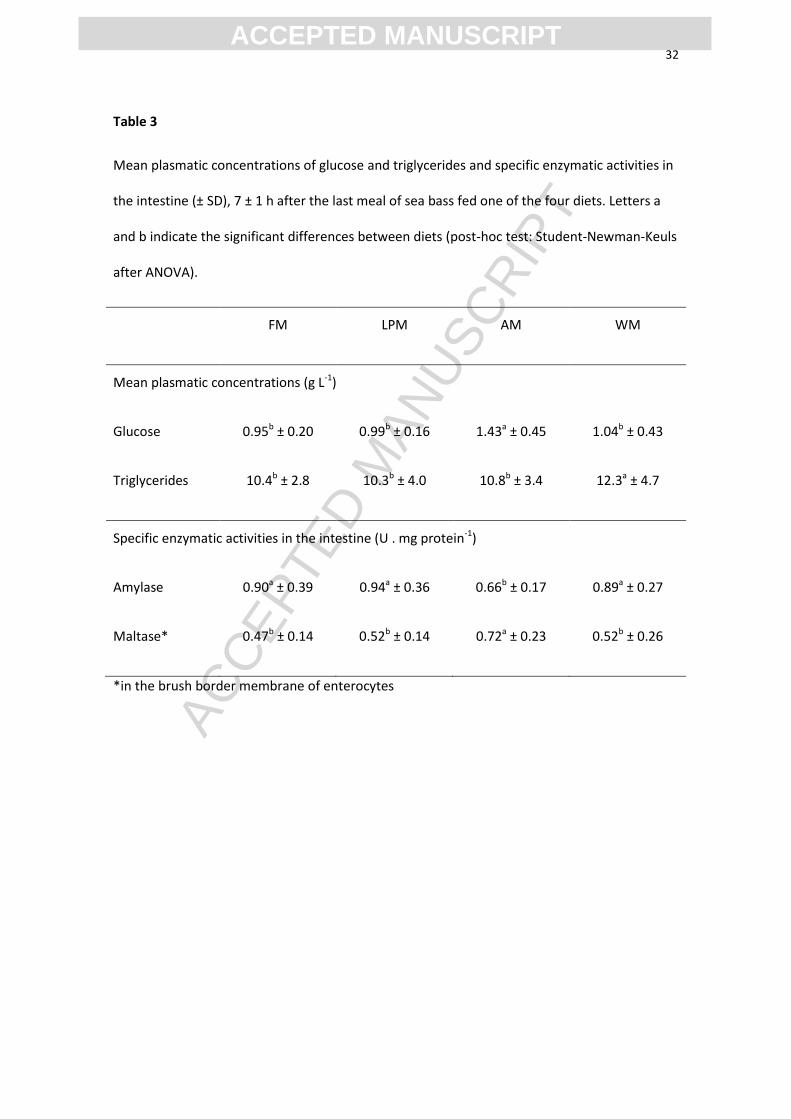
Glycaemia was higher 7 ± 1 h after the last meal in the group fed resistant starch (AM)
compared to the other dietary groups (Table 3). This postprandial timing for sampling
was likely too late to observe hyperglycaemia in Group WM, which was characterized
however by a higher triglyceridemia.
At the same time, the activity of amylase was lower in the intestine of fish fed resistant
starch (AM) compared to the other dietary groups, while higher activity of maltase was
observed in the brush border membrane of the enterocytes in the same group compared
to the others (Table 3).
3.3 Hepatic gene expressions for key markers of glucose metabolism and
transport
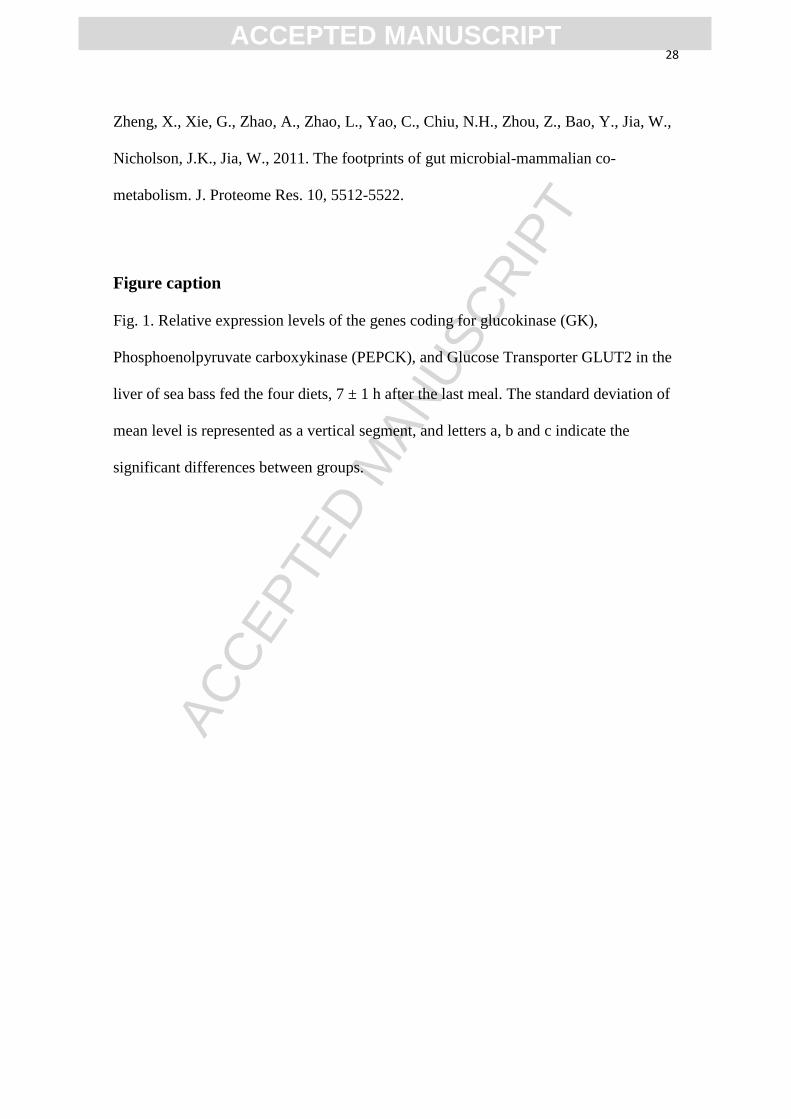
Glucokinase (GK) is the enzyme that phosphorylates glucose to glucose-6-phosphate,
the first limiting step of glucose storage in the liver. The amylopectin-rich diet WM
increased significantly the level of expression of the corresponding gene, compared to
the control group FM (Fig. 1). This stimulation was less marked with the group fed
resistant starch, which was significantly different only from Group LPM in this regard.
Conversely, the gene coding for phosphoenolpyruvate carboxykinase (PEPCK) was
repressed in the two groups fed starchy diets, which were both significantly different
ACC
EPTE
D M
ANU
SCR
IPT
ACCEPTED MANUSCRIPT10
from the control with this marker. This enzyme converts oxaloacetate into
phosphoenolpyruvate, the first step of gluconeogenesis in the liver, and decreases when
the animals are fed carbohydrates. GLUT2 is a bidirectional glucose transporter that is
required in liver cells to uptake or to secrete glucose for storage or production,
respectively. The expression of the corresponding gene was not significantly different
between diets.
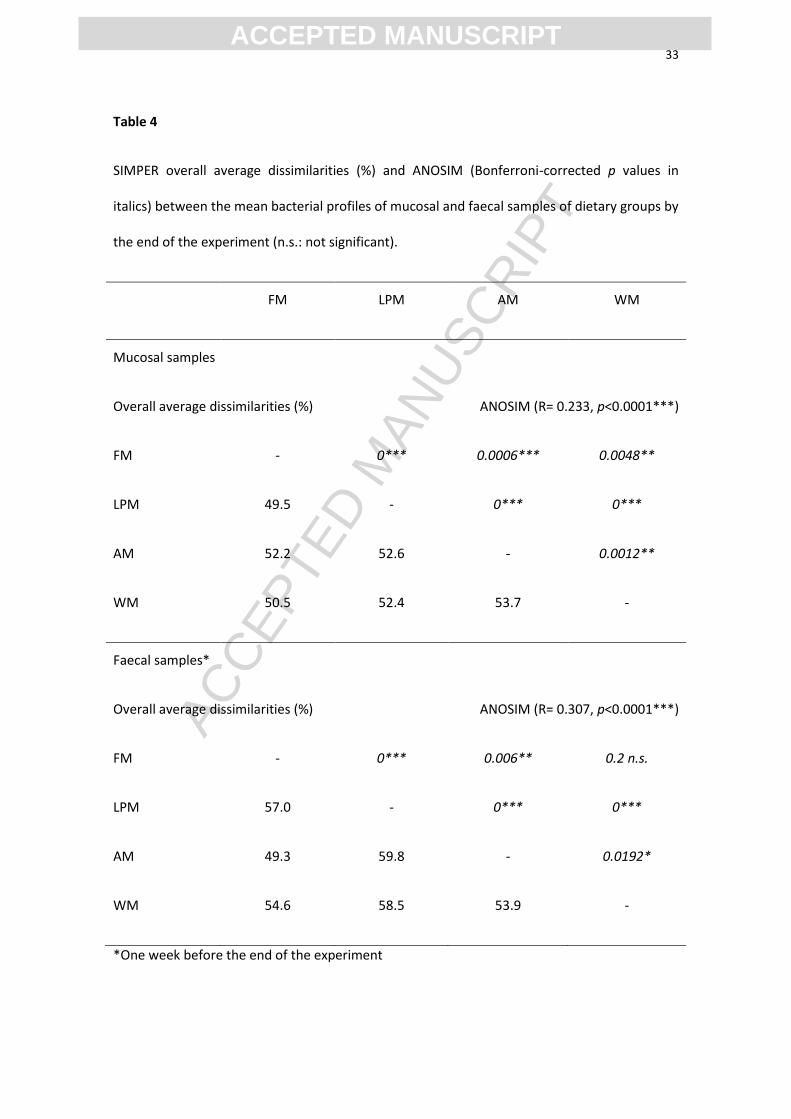
3.4 Microbial communities at the end of the experiment
By the end of the two months of feeding the experimental diets, the mucosal and faecal
communities were significantly affected by the diet. The comparison of Bray-Curtis
similarity by ANOSIM indicated that the bacterial profiles were dissimilar between the
samples from every dietary group, except between the faeces of Groups WM and FM
(Table 4). In the faecal samples, the SIMPER overall average dissimilarity between all
the diets was higher than in the mucosal samples (55.9 and 51.8%, respectively). This
was due to the faecal samples of Group LPM that appeared as the most dissimilar from
the others.
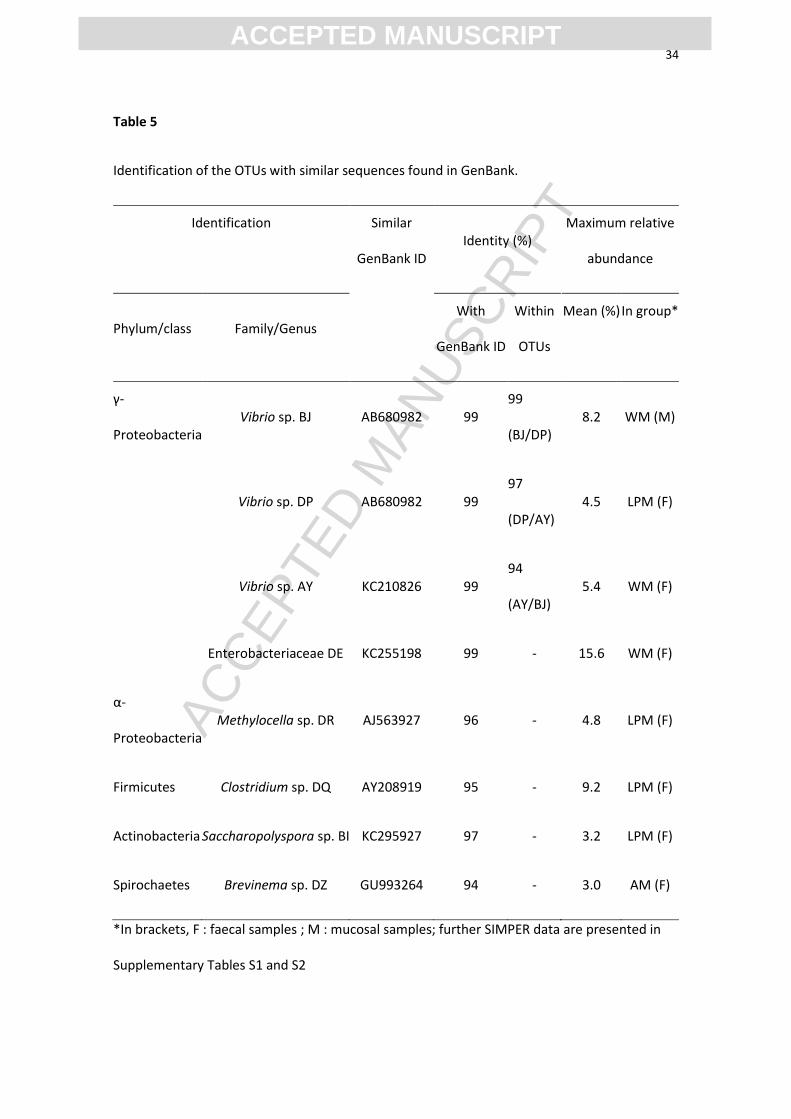
The main OTU contributing to dissimilarity between dietary groups among mucosal
samples was identified as Vibrio sp. BJ (Table 5), which was abundant with the starchy
diets, and particularly less abundant with diet LPM, while an unidentified OTU was
abundant with the non-starch diets (8%, Supplementary Table S1). Clostridium sp. DQ
was abundant with diets AM and LPM (8%), and the most abundant OTU corresponded
to Enterobacteriaceae DE, particularly with LPM (11%).
In the faecal samples, the main OTUs contributing to dissimilarity between dietary
groups were distributed quite differently from what was observed in the mucosal
ACC
EPTE
D M
ANU
SCR
IPT
ACCEPTED MANUSCRIPT11
samples. the most abundant faecal OTU corresponded still to Enterobacteriaceae DE,
which was present at the same relative level as in mucus in Group LPM (11%), while
the abundance of this OTU was higher in the other dietary groups, compared to the
mucosal data, especially with the starchy diets (Supplementary Table S2). The other
dominant OTUs in Groups AM and FM were not identified. Clostridium sp. DQ was
much less abundant in the faeces from Group AM, compared to the mucosal samples,
while this OTU was abundant in both compartments with diet LPM. Another difference
between Groups AM and LPM was about the abundance of Methylocella sp. DR, which
was relatively high in the faecal samples from Group LPM, and low in those from
Group AM, whereas the reverse trend was observed in mucus. In faeces, there was no
detection of Vibrio sp. BJ, which was especially abundant in the mucosal samples with
the starchy diets. A closely related OTU, Vibrio sp. DP, was detected instead, and
particularly abundant in Group LPM, whereas another OTU, Vibrio sp. AY, was more
abundant in the starchy diets. Two other OTUs were also identified: Brevinema sp. DZ
(3% with diet AM), and Saccharopolyspora sp. BI (3 % with diet LPM). In Group FM,
the OTU distribution of the faecal samples was evener and more equitable than in the
groups fed the starchy diets (Supplementary Table S3).
3.5 Short chain fatty acids and other faecal metabolites
SCFA were determined in faecal samples collected from all diet groups one week
before the end of the experiment. Acetic acid was the only SCFA detected with the
method applied. The highest concentrations were detected in AM and WM, indicating
higher fermentation activities in these groups (Table 6). In Group AM, the untargeted
metabolite analysis by LC-MS revealed a high diversity of faecal metabolites, which
ACC
EPTE
D M
ANU
SCR
IPT
ACCEPTED MANUSCRIPT12
differed from those of Groups FM and LPM (Supplementary material S4). The
annotation of metabolites revealed that Group LPM contained peptides that did not
appear in the other groups.
4. Discussion
Pereira and Oliva-Teles (2004) did not find any influence of dietary lupin meal on
somatic indices of gilthead sea bream, at variance with the present study on sea bass. In
another experiment, lupin meal depressed maltase activity in gilthead sea bream
enterocytes (Silva et al., 2010), contrary to what was presently observed in sea bass.
That may suggest some discrepancy between the dietary influences of lupin meal on the
two species, which differed in their response to the inclusion of other plant raw
materials (Nikolopoulou, 2009). The evacuation rate from stomach is slower in sea bass
compared to sea bream, with higher hydratation level, and lower pH (Nikolopoulou et
al., 2011). That may result in further hydrolysis of the digestible polysaccharides
brought by lupin meal in sea bass compared to sea bream, and then in higher maltase
activity in the enterocytes. This better digestive efficiency of lupin meal in sea bass did
not benefit to growth, or to hepatic neoglycogenesis, but it increased likely the
perivisceral mass. Another vegetable diet with mixed protein sources caused an increase
of mesenteric fat in rainbow trout (de Francesco et al., 2004), which may corroborate
the effect of lupin meal that was deduced from the viscerosomatic index of sea bass.
The reason for such fat deposition is not clear, but possibly related to endocrinal
regulation.
Enes et al. (2006) noted that diets with normal or waxy maize starch did not affect
growth in sea bass. The viscerosomatic index was not significantly affected by the diets
ACC
EPTE
D M
ANU
SCR
IPT
ACCEPTED MANUSCRIPT13
in the experiment of Enes et al. (2006), but starch was incorporated at 10-20% in the
diet, instead of 25% in the present experiment. In the experiment of Enes et al. (2006),
the significant differences between the hepatosomatic indices of the dietary groups did
not comply with the form and amount of starch supplied, but the highest index
corresponded to the group fed 20% normal starch (72% amylopectin, 28% amylose). In
the present experiment, the 25% of starch supply increased the liver mass, especially
with resistant starch. Surprisingly, the hepatic reserve storage seemed particularly
stimulated with a high amount of amylose in sea bass, whereas the hepatosomatic index
increased in sunshine bass with the digestibility of dietary carbohydrates (Rawles and
Lochman, 2003). Other experiments on European sea bass indicated that somatic
indices correlated generally with the amount of gelatinized starch (Peres and Oliva-
Teles, 2002; Moreira et al., 2008; Enes et al., 2010), unlike with raw starch (Dias et al.,
1998; Peres and Oliva-Teles, 2002). However, such indices are too rough to reflect
accurately the utilization of carbohydrates.
The postprandial glycaemia kinetics seemed to differ between sea bass and sunshine
bass, in which blood glucose clearance was slower with amylopectin than with amylose
(Rawles and Lochman, 2003). Enes et al. (2006) did not detect significant differences in
glycaemia 6h after the last meal, whether sea bass were fed diets containing 10 or 20%
of either waxy maize or normal starch. In the present experiment with 25% starch in the
diet, blood glucose was more elevated at 7 h with resistant starch compared to the group
fed waxy maize, suggesting some delay in the peak of postprandial glycaemia with high
supply of slow sugar. Peres et al. (1999) argued an important role of plasmatic
triacylglycerides in glucose regulation. It is likely that the high postprandial
ACC
EPTE
D M
ANU
SCR
IPT
ACCEPTED MANUSCRIPT14
triglyceridemia observed at 7h with waxy maize corresponded to subsequent lipogenesis
in the liver after early plasmatic glucose clearance.
The postprandial activities of digestive enzymes in the intestine, and the concomitant
level of plasmatic glucose, confirmed the difference in hydrolysis velocity between the
two forms of dietary starch. Amylolysis requires the adsorption of amylase in the
crystalline structure of amylopectin (Warren et al., 2013). Hamid et al. (2011) noted that
the specific activity of amylase was higher with A-type starch than with C-type, which
is intermediary between A-type and B-type starches. Waxy maize is classified as type
A, whereas amylopectin is of type B in amylomaize (Jane, 2004). It seems that the
adsorption of amylase was slower on amylomaize that was harder to hydrolyse than the
almost pure matrix of A-type amylopectin in waxy maize. That resulted in a lower level
of free amylase 7h after the last meal in the intestine of fish fed resistant starch,
compared to the other diets. This slow release of maltose stimulated a higher activity of
maltase in the enterocytes, resulting in a higher level of glucose in the plasma. In the
meanwhile, the easy hydrolysis of waxy maize seemed already completed in Group
WM, and the enzymatic activities and glycaemia rejoined the baseline levels observed
with the two groups fed without starch.
The GK mRNA level is a highly specific marker of hepatic glucose phosphorylation in
fish (Enes et al., 2009). The up-regulation of gene GK confirmed the glycaemic surge in
the group fed waxy maize, compared to the control without starch. A stimulation of
hepatic glucokinase activity was already observed by Enes et al. (2006), whether sea
bass were fed way maize or normal starch. Interestingly, the trend of GK gene
overexpression was not significant in the group fed resistant starch, suggesting further a
self-regulation of glucose release due to slow digestion of amylomaize. In fish, PEPCK
ACC
EPTE
D M
ANU
SCR
IPT
ACCEPTED MANUSCRIPT15
activity is highly specific to gluconeogenic tissues. The nutritional regulation of this
activity was generally not evidenced in fish liver, due to the prevalence of the
mitochondrial activity that is not dependent on the nutritional status, unlike the cytosolic
activity (Enes et al., 2009). In sea bass however, PEPCK gene expression was down-
regulated in the two groups fed starchy diets compared to the control, confirming thus
an efficient response to dietary carbohydrates at a metabolic level. GLUT2 is involved
in glucose homeostasis by facilitating the transport across the membrane of hepatocytes,
and the gene needs to be highly expressed irrespective of the nutritional status. In
agreement with Enes et al. (2009), there was no significant difference between the
expression levels of GLUT2 gene in the present experiment.
The intestinal microbial community may also be involved in the differences observed in
the host, since it was significantly modulated by feed composition. It should be kept in
mind that RT-PCR-DGGE was used in this experiment to focus on the active part of
microbiota by comparing the abundances of 16S ribosomal RNA. The difference
observed between DNA- and RNA-based analyses has been documented in fish
microbiota (Navarrete et al., 2012; Lamari et al., 2013). In spite of a core intestinal
microbiota that may resist dietary change in rainbow trout (Wong et al., 2013), there is
growing evidence that another fraction of the bacterial community does depend on feed
components in the intestine of trout (Heikkinen et al., 2006; Merrifield et al., 2009;
Mansfield et al., 2010; Desai et al., 2012; Navarrete et al., 2012) and other fish (Ringø
et al., 2006; Silva et al., 2011). In the faecal samples of the present experiment, the lupin
meal caused the maximum dissimilarity in bacterial profiles, compared to the control
group. This dissimilarity was already noted in the intestinal contents of gilthead sea
bream by Silva et al. (2011). Lupin is generally rich in α-galactosides, which can
ACC
EPTE
D M
ANU
SCR
IPT
ACCEPTED MANUSCRIPT16
influence faecal microbiota, possibly repressing some Vibrionaceae in gilthead sea
bream (Silva et al., 2011). In the present experiment the dominant Vibrio sp. was
different in the faeces of sea bass fed the different diets, while Clostridium sp. was
promoted with lupin. Faecal microbiota are quite different in sea bass and man, and they
seem differently affected by lupin fibre. Smith et al. (2006) noted the bifidogenic effect
of lupin kernel fibre in human stools, whereas one group of Clostridium sp. was
repressed. The mucus-associated bacteria were affected by the diet, but likely also in
interaction with the host. The dominant Vibrio sp. in mucus was different from those
observed in faeces, and particularly repressed in the group fed lupin. This meal seems
an interesting feed component, as a source of non-starch polysaccharides, possibly
limiting opportunistic bacteria such as Vibrionaceae. Starch, particularly amylopectin,
should be added carefully in view of the possible stimulation of opportunists. However
in the present experiment, the faecal community of the group fed waxy maize was not
significantly dissimilar from that of the control group, whereas resistant starch and lupin
meal affected clearly the bacterial profiles. The four groups showed dissimilar mucosal
communities, and the fast digestion of waxy maize by sea bass may indirectly influence
the bacterial profile at the mucosal interface. Many intestinal bacteria that produce
amylase may interfere on starch digestion, including Enterobacteriaceae and
Vibrionaceae isolated in marine fish (Sugita et al., 1996), Clostridium sp. in freshwater
fish (Sugita et al., 1997), and Saccharopolyspora sp. A9 in marine sediment
(Chakraborty et al., 2011).
Acetate is by far the most abundant short chain fatty acid that is produced in the
intestine of mammals fed resistant starch and non-starch polysaccharides (Topping and
Clifton, 2001). Acetate is also the predominant SCFA produced in fish intestine (Smith
ACC
EPTE
D M
ANU
SCR
IPT
ACCEPTED MANUSCRIPT17
et al., 1996; Clements, 1997). It should be kept in mind that butyrate and other SCFA
are quickly metabolised by enterocytes as energy source, and that such beneficial
compounds may be efficient, even remaining below the detection threshold. The starchy
diets gave the highest concentration of acetate in sea bass faeces, suggesting that not
only amylomaize, but also waxy maize, were partly metabolized by microbiota in fish
intestine. Clements et al. (1994) stressed that plasmatic acetate can be produced either
from intestinal fermentation, or from endogenous hydrolysis of acetyl CoA. However,
the intestinal excretion of endogenous acetate is unlikely, and a fermentative origin can
be assumed for the greatest part of faecal acetate. A decrease of the intestinal pH due to
SCFA production in herbivorous fish was hypothetized by Clements (1997), but such
effect was likely negligible in sea bass, due to the low concentration of faecal acetate.
It is clear that the diet influenced intestinal microbiota, but the impact of these changes
on the host remains to be evaluated. Untargeted metabolite analysis is a new approach
that may contribute to the understanding of the function of the intestinal microbiota and
the interactions with the host (Zheng et al., 2011; Matsumoto et al., 2012). Analyses of
faecal metabolites by LC-MS with "time-of-flight" (TOF) detection confirmed the
differences observed between dietary groups (Supplementary material S4). Resistant
starch produced the highest diversity of metabolites, possibly due to the wide
distribution of amylases among bacteria (Pandey et al., 2000). The metabolite profile
obtained with lupin meal appeared less dissimilar from that of the control group, but the
influence of the vegetable source protein on the bacterial profile in faeces suggests that
competent bacteria were selectively stimulated to produce a limited number of digestion
products. In particular, lupin meal induced the production of peptides that were not
ACC
EPTE
D M
ANU
SCR
IPT
ACCEPTED MANUSCRIPT18
found in the other groups, likely due to the difference in dietary proteins, but the
possible interaction with intestinal microbiota remained unclear.
5. Conclusion
Though sea bass is strictly carnivorous in the wild, this experiment confirmed that the
species can be fed large amount of plant carbohydrates. Its diet can contain at least 25%
starch without detrimental effect, and the faecal production of acetate suggested a
bacterial contribution to the digestion process. As proposed by Karasov et al. (2011), the
functional flexibility of the microbiome play likely an important role in the digestive
adaptability of fish, but that remains to be further investigated.
Acknowledgements
This work was carried out with financial support from the Commission of the European
Communities, specific RTD programme of Framework Programme 7, PROMICROBE
(GA 227197).
References
Adamidou, S., Nengas, I., Alexis, M., Foundoulaki, E., Nikolopoulou, D., Campbell, P.,
Karacostas, I., Rigos, G., Bell, G.J., Jauncey, K., 2009. Apparent nutrient digestibility
and gastrointestinal evacuation time in European seabass (Dicentrarchus labrax) fed
diets containing different levels of legumes. Aquaculture 289, 106-112.
Blazek, J., Copeland, L., 2010. Amylolysis of wheat starches. I. Digestion kinetics of
starches with varying functional properties. J. Cereal Sci. 51, 265-270.
ACC
EPTE
D M
ANU
SCR
IPT
ACCEPTED MANUSCRIPT19
Chakraborty, S., Khopade, A., Biao, R., Jian, W., Liu, X.Y., Mahadik, K., Chopade, B.,
Zhang, L.X., Kokare, C., 2011. Characterization and stability studies on surfactant,
detergent and oxidant stable α-amylase from marine haloalkaliphilic Saccharopolyspora
sp. A9. J. Mol. Catal. 68B, 52-58.
Clarke, K.R., 1993. Non-parametric multivariate analysis of changes in community
structure. Aust. J. Ecol. 18, 117-143.
Clements, K.D., 1997. Fermentation and gastrointestinal microorganisms in fishes, in:
Mackie, R.I., White, B.A. (Eds.), Gastrointestinal Microbiology, Vol. 1, Gastrointestinal
Ecosystems and Fermentations, Chapman & Hall, New York, pp. 156-198.
Clements, K.D., Gleeson, V.P., Slaytor, M., 1994. Short-chain fatty acid metabolism in
temperate marine herbivorous fish. J. Comp. Physiol. 164B, 372-377.
de Francesco, M., Parisi, G., Medale, F., Lupi, P., Kaushik, S.J., Poli, B.M., 2004.
Effect of long-term feeding with a plant protein mixture based diet on growth and
body/fillet quality traits of large rainbow trout (Oncorhynchus mykiss). Aquaculture
236, 413-429.
Desai, A.R., Links, M.G., Collins, S.A., Mansfield, G.S., Drew, M.D., Van Kessel,
A.G., Hill, J.E., 2012. Effects of plant-based diets on the distal gut microbiome of
rainbow trout (Oncorhynchus mykiss). Aquaculture 350, 134-142.
ACC
EPTE
D M
ANU
SCR
IPT
ACCEPTED MANUSCRIPT20
Dias, J., Alvarez, M.J., Diez, A., Arzel, J., Corraze, G., Bautista, J.M., Kaushik, S.J.,
1998. Regulation of hepatic lipogenesis by dietary protein/energy in juvenile European
seabass (Dicentrarchus labrax). Aquaculture 161, 169-186.
Ducasse-Cabanot, S., Zambonino-Infante, J., Richard, N., Medale, F., Corraze, G.,
Mambrini, M., Robin, J., Cahu, C., Kaushik, S., Panserat, S., 2007. Reduced lipid intake
leads to changes in digestive enzymes in the intestine but has minor effects on key
enzymes of hepatic intermediary metabolism in rainbow trout (Oncorhynchus mykiss).
Animal 1, 1272-1282.
Enes, P., Panserat, S., Kaushik, S., Oliva-Teles, A., 2006. Effect of normal and waxy
maize starch on growth, food utilization and hepatic glucose metabolism in European
sea bass (Dicentrarchus labrax) juveniles. Comp. Biochem. Physiol. 143A, 89-96.
Enes, P., Panserat, S., Kaushik, S., Oliva-Teles, A., 2009. Nutritional regulation of
hepatic glucose metabolism in fish. Fish Physiol. Biochem. 35, 519-539.
Enes, P., Sanchez-Gurmaches, J., Navarro, I., Gutiérrez, J., Oliva-Teles, A., 2010. Role
of insulin and IGF-I on the regulation of glucose metabolism in European sea bass
(Dicentrarchus labrax) fed with different dietary carbohydrate levels. Comp. Biochem.
Physiol. 157A, 346-353.
ACC
EPTE
D M
ANU
SCR
IPT
ACCEPTED MANUSCRIPT21
Enes, P., Panserat, S., Kaushik, S., Oliva-Teles, A., 2011. Dietary Carbohydrate
Utilization by European Sea Bass (Dicentrarchus labrax L.) and Gilthead Sea Bream
(Sparus aurata L.) Juveniles. Rev. Fish. Sci. 19, 201-215.
Gouveia, A., Davies, S.J., 2000. Inclusion of an extruded dehulled pea seed meal in
diets for juvenile European sea bass (Dicentrarchus labrax). Aquaculture 182, 183-193.
Hamid, N.K.A., Mahayat, M., Hashim, R., 2011. Utilization of different carbohydrate
sources and starch forms by bagrid catfish (Mystus nemurus) (Cuv & Val). Aquacult.
Nutr. 17, e10-e18.
Hansen, B.H., Degnes, K., Øverjordet, I.B., Altin, D., Størseth, T.R., 2013. Metabolic
fingerprinting of arctic copepods Calanus finmarchicus, Calanus glacialis and Calanus
hyperboreus. Polar Biol. 36, 1577-1586.
Heikkinen, J., Vielma, J., Kemilainen, O., Tiirola, M., Eskelinen, P., Kiuru, T., Navia-
Paldanius, D., von Wright, A., 2006. Effects of soybean meal based diet on growth
performance, gut histopathology and intestinal microbiota of juvenile rainbow trout
(Oncorhynchus mykiss). Aquaculture 261, 259-268.
Hu, P., Zhao, H., Duan, Z., Linlin, Z., Wu, D., 2004. Starch digestibility and the
estimated glycemic score of different types of rice differing in amylose contents. J.
Cereal Sci. 40, 231-237.
ACC
EPTE
D M
ANU
SCR
IPT
ACCEPTED MANUSCRIPT22
Jane, J., 2004. Starch: structure and properties, in: Tomasik, P. (Ed.), Chemical and
Functional Properties of Food Saccharides. CRC Press LLC, Boca Raton, Florida, pp.
90-110.
Jouany, J.P., 1982. Volatile fatty acid and alcohol determination in digestive contents,
silage juices, bacterial cultures and anaerobic fermentor contents. Sci. Aliment. 2, 131-
144.
Karasov, W.H., del Rio, C.M., Caviedes-Vidal, E., 2011. Ecological physiology of diet
and digestive systems. Ann. Rev. of Physiol. 73, 69-93.
Lamari, F., Castex, M., Larcher, T., Ledevin, M., Mazurais, D., Bakhrouf, A.,
Gatesoupe, F.J., 2013. Comparison of the effects of the dietary addition of two lactic
acid bacteria on the development and conformation of sea bass larvae, Dicentrarchus
labrax, and the influence on associated microbiota. Aquaculture 376, 137-145.
Leenhouwers, J.I., Pellikaan, W.F., Huizing, H.F.A., Coolen, R.O.M., Verreth, J.A.J.,
Schrama, J.W., 2008. Fermentability of carbohydrates in an in vitro batch culture
method using inocula from Nile tilapia (Oreochromis niloticus) and European sea bass
(Dicentrarchus labrax). Aquacult. Nutr. 14, 523-532.
Liu, W.C., Halley, P.J., Gilbert, R.G., 2010. Mechanism of degradation of starch, a
highly branched polymer, during extrusion. Macromolecules 43, 2855-2864
ACC
EPTE
D M
ANU
SCR
IPT
ACCEPTED MANUSCRIPT23
Mansfield, G.S., Desai, A.R., Nilson, S.A., Van Kessel, A.G., Drew, M.D., Hill, J.E.,
2010. Characterization of rainbow trout (Oncorhynchus mykiss) intestinal microbiota
and inflammatory marker gene expression in a recirculating aquaculture system.
Aquaculture 307, 95-104.
Martinez, I., Kim, J., Duffy, P.R., Schlegel, V.L., Walter, J., 2010. Resistant starches
types 2 and 4 have differential effects on the composition of the fecal microbiota in
human subjects. PLoS ONE 5, 11pp., doi:10.1371/journal.pone.0015046.
Matsumoto, M., Kibe, R., Ooga, T., Aiba, Y., Kurihara, S., Sawaki, E., Koga, Y.,
Benno, Y., 2012. Impact of intestinal microbiota on intestinal luminal metabolome. Sci.
Rep. 2, 10 pp., doi:10.1038/srep00233.
Merrifield, D.L., Dimitroglou, A., Bradley, G., Baker, R.T.M., Davies, S.J., 2009.
Soybean meal alters autochthonous microbial populations, microvilli morphology and
compromises intestinal enterocyte integrity of rainbow trout, Oncorhynchus mykiss
(Walbaum). J. Fish Dis. 32, 755-766.
Metais, P., Bieth, J., 1968. Détermination de l'α-amylase par une microtechnique. Ann.
Biol. Clin. 26, 133-142.
Moreira, I.S., Peres, H., Couto, A., Enes, P., Oliva-Teles, A., 2008. Temperature and
dietary carbohydrate level effects on performance and metabolic utilisation of diets in
European sea bass (Dicentrarchus labrax) juveniles. Aquaculture 274, 153-160.
ACC
EPTE
D M
ANU
SCR
IPT
ACCEPTED MANUSCRIPT24
Navarrete, P., Magne, F., Araneda, C., Fuentes, P., Barros, L.,Opazo, R., Espejo, R.,
Romero, J., 2012. PCR-TTGE Analysis of 16S rRNA from rainbow trout
(Oncorhynchus mykiss) gut microbiota reveals host-specific communities of active
bacteria. PloS ONE 7, 10 pp., doi:10.1371/journal.pone.0031335.
Nikolopoulou, D., 2009. Studies on the composition of legumes and carob seed germ
meal and their effect on physiology and biochemistry of digestion of Mediterranean fish
species. PhD thesis, University of Thessaly, Department of Biochemistry and
Biotechnology, Larissa, Greece, 197 pp.
Nikolopoulou, D., Moutou, K.A., Fountoulaki, E., Venou, B., Adamidou, S., Alexis,
M.N., 2011. Patterns of gastric evacuation, digesta characteristics and pH changes along
the gastrointestinal tract of gilthead sea bream (Sparus aurata L.) and European sea bass
(Dicentrarchus labrax L.). Comp. Biochem. Physiol. 158A, 406-414.
Pandey, A., Nigam, P., Soccol, C.R., Soccol, V.T., Singh, D., Mohan, R., 2000.
Advances in microbial amylases. Biotechnol. Appl. Biochem. 31, 135-152.
Pereira, T.G., Oliva-Teles, A., 2004. Evaluation of micronized lupin seed meal as an
alternative protein source in diets for gilthead sea bream Sparus aurata L. juveniles.
Aquacult. Res. 35, 828-835.
ACC
EPTE
D M
ANU
SCR
IPT
ACCEPTED MANUSCRIPT25
Peres, H., Oliva-Teles, A., 2002. Utilization of raw and gelatinized starch by European
sea bass (Dicentrarchus labrax) juveniles. Aquaculture 205, 287-299.
Peres, H., Gonçalves, P., Oliva-Teles, A., 1999. Glucose tolerance in gilthead seabream
(Sparus aurata) and European seabass (Dicentrarchus labrax). Aquaculture 179, 415-
423.
Polakof, S., Panserat, S., Soengas, J.L., Moon, T.W., 2012a. Glucose metabolism in
fish: a review. J. Comp. Physiol. 182B, 1015-1045.
Polakof, S., Skiba-Cassy, S., Kaushik, S., Seiliez, I., Soengas, J.L., Panserat, S., 2012b.
Glucose and lipid metabolism in the pancreas of rainbow trout is regulated at the
molecular level by nutritional status and carbohydrate intake. J. Comp. Physiol. 182B,
507-516.
Rawles, S., Lochmann, R., 2003. Effects of amylopectin/amylose starch ratio on
growth, body composition and glycemic response of sunshine bass Morone chrysops ♀
× M. saxatilis ♂. J. World Aquacult. Soc. 34, 278-288.
Ringø, E., Sperstad, S., Myklebust, R., Refstie, S., Krogdahl, Å., 2006. Characterisation
of the microbiota associated with intestine of Atlantic cod (Gadus morhua L.): The
effect of fish meal, standard soybean meal and a bioprocessed soybean meal.
Aquaculture 261, 829-841.
ACC
EPTE
D M
ANU
SCR
IPT
ACCEPTED MANUSCRIPT26
Silva, F.C.P., Nicoli, J.R., Zambonino-Infante, J.L., Le Gall, M.M., Kaushik, S.,
Gatesoupe, F.J., 2010. Influence of partial substitution of dietary fish meal on the
activity of digestive enzymes in the intestinal brush border membrane of gilthead sea
bream, Sparus aurata and goldfish, Carassius auratus. Aquaculture 306, 233-237.
Silva, F.C.P., Nicoli, J.R., Zambonino, J.L., Kaushik, S., Gatesoupe, F.J., 2011.
Influence of the diet on microbial diversity of faecal and gastrointestinal contents in
gilthead sea bream (Sparus aurata) and intestinal contents in goldfish (Carassius
auratus). FEMS Microbiol. Ecol. 78, 285–296.
Sinha, A.K., Kumar, V., Makkar, H.P.S., De Boeck, G., Becker, K., 2011. Non-starch
polysaccharides and their role in fish nutrition - A review. Food Chem. 127, 1409-1426.
Smith, T.B., Wahl, D.H., Mackie, R.I., 1996. Volatile fatty acids and anaerobic
fermentation in temperate piscivorous and omnivorous freshwater fish. J. Fish Biol. 48,
829-841.
Smith, S.C., Choy, R., Johnson, S.K., Hall, R.S., Wildeboer-Veloo, A.C.M., Welling,
G.W., 2006. Lupin kernel fiber consumption modifies fecal microbiota in healthy men
as determined by rRNA gene fluorescent in situ hybridization. Eur. J. Nutr. 45, 335-341.
Stone, D.A.J., 2003. Dietary carbohydrate utilization by fish. Rev. Fish. Sci. 11, 337-
369.
ACC
EPTE
D M
ANU
SCR
IPT
ACCEPTED MANUSCRIPT27
Sugita, H., Kawasaki, J., Kumazawa, J., Deguchi, Y., 1996. Production of amylase by
the intestinal bacteria of Japanese coastal animals. Lett. Appl. Microbiol. 23, 174-178.
Sugita, H., Kawasaki, J., Deguchi, Y., 1997. Production of amylase by the intestinal
microflora in cultured freshwater fish. Lett. Appl. Microbiol. 24, 105-106.
Topping, D.L., Clifton, P.M., 2001. Short-chain fatty acids and human colonic function:
Roles of resistant starch and nonstarch polysaccharides. Physiol. Rev. 81, 1031-1064.
Warren, F.J., Butterworth, P.J., Ellis, P.R., 2013. The surface structure of a complex
substrate revealed by enzyme kinetics and Freundlich constants for α-amylase
interaction with the surface of starch. BBA – Gen. Subjects 1830, 3095-3101.
Wong, S., Waldrop, T., Summerfelt, S., Davidson, J., Barrows, F., Kenney, P.B.,
Welch, T., Wiens, G.D., Snekvik, K., Rawls, J.F., Good, C., 2013. Aquacultured
rainbow trout (Oncorhynchus mykiss) possess a large core intestinal microbiota that is
resistant to variation in diet and rearing density. Appl. Environ. Microbiol. 79, 4974-
4984.
Zhao, G.H., Nyman, M., Jonsson, J.A., 2006. Rapid determination of short-chain fatty
acids in colonic contents and faeces of humans and rats by acidified water-extraction
and direct-injection gas chromatography. Biomed. Chromatogr. 20, 674-682.
ACC
EPTE
D M
ANU
SCR
IPT
ACCEPTED MANUSCRIPT28
Zheng, X., Xie, G., Zhao, A., Zhao, L., Yao, C., Chiu, N.H., Zhou, Z., Bao, Y., Jia, W.,
Nicholson, J.K., Jia, W., 2011. The footprints of gut microbial-mammalian co-
metabolism. J. Proteome Res. 10, 5512-5522.
Figure caption
Fig. 1. Relative expression levels of the genes coding for glucokinase (GK),
Phosphoenolpyruvate carboxykinase (PEPCK), and Glucose Transporter GLUT2 in the
liver of sea bass fed the four diets, 7 ± 1 h after the last meal. The standard deviation of
mean level is represented as a vertical segment, and letters a, b and c indicate the
significant differences between groups.
ACC
EPTE
D M
ANU
SCR
IPT
ACCEPTED MANUSCRIPT29
Figure 1
ACC
EPTE
D M
ANU
SCR
IPT
ACCEPTED MANUSCRIPT30
Table 1
Composition of the experimental diets.
FM LPM AM WM
Ingredients (g kg-1)
Fish meal 539.3 350.0 539.3 539.3
Fish soluble 80.0 80.0 80.0 80.0
Soft white lupin 0.0 308.4 0.0 0.0
Fish oil 110.7 116.1 110.7 110.7
Cellulose 250.0 125.5 0.0 0.0
Amylomaize 0.0 0.0 250.0 0.0
Waxy maize 0.0 0.0 0.0 250.0
Mineral premix 10.0 10.0 10.0 10.0
Vitamin premix 10.0 10.0 10.0 10.0
ACC
EPTE
D M
ANU
SCR
IPT
ACCEPTED MANUSCRIPT31
Table 2
Growth and somatic indices of the four dietary groups at the end of the experiment ( standard
error). Superscripts a, b and c indicate the significant differences between diets (post-hoc test:
Tukey after ANOVA; Student-Newman-Keuls after KW: Kruskal-Wallis; n.s.: not significant).
FM LPM AM WM Comparison
Initial mean weight (g) 40.5 ± 0.7 40.3 ± 0.6 40.8 ± 0.8 41.0 ± 0.7 KW (n.s.)
Final mean weight (g) 90.4 ± 3.3 97.9 ± 2.6 96.2 ± 3.4 93.3 ± 2.8 ANOVA (n.s.)
Individual SGR 0.55 ± 0.03 0.61 ± 0.02 0.61 ± 0.02 0.58 ± 0.02 KW (n.s.)
Viscerosomatic index 9.3c ± 0.3 11.1a ± 0.4 11.3a ± 0.3 10.4b ± 0.4 KW (p<0.001)
Hepathosomatic index 1.20c ± 0.07 1.36c ± 0.07 3.34a ± 0.11 2.34b ± 0.10 ANOVA (p<0.001)
ACC
EPTE
D M
ANU
SCR
IPT
ACCEPTED MANUSCRIPT32
Table 3
Mean plasmatic concentrations of glucose and triglycerides and specific enzymatic activities in
the intestine (± SD), 7 ± 1 h after the last meal of sea bass fed one of the four diets. Letters a
and b indicate the significant differences between diets (post-hoc test: Student-Newman-Keuls
after ANOVA).
FM LPM AM WM
Mean plasmatic concentrations (g L-1)
Glucose 0.95b ± 0.20 0.99b ± 0.16 1.43a ± 0.45 1.04b ± 0.43
Triglycerides 10.4b ± 2.8 10.3b ± 4.0 10.8b ± 3.4 12.3a ± 4.7
Specific enzymatic activities in the intestine (U . mg protein-1)
Amylase 0.90a ± 0.39 0.94a ± 0.36 0.66b ± 0.17 0.89a ± 0.27
Maltase* 0.47b ± 0.14 0.52b ± 0.14 0.72a ± 0.23 0.52b ± 0.26
*in the brush border membrane of enterocytes
ACC
EPTE
D M
ANU
SCR
IPT
ACCEPTED MANUSCRIPT33
Table 4
SIMPER overall average dissimilarities (%) and ANOSIM (Bonferroni-corrected p values in
italics) between the mean bacterial profiles of mucosal and faecal samples of dietary groups by
the end of the experiment (n.s.: not significant).
FM LPM AM WM
Mucosal samples
Overall average dissimilarities (%) ANOSIM (R= 0.233, p<0.0001***)
FM - 0*** 0.0006*** 0.0048**
LPM 49.5 - 0*** 0***
AM 52.2 52.6 - 0.0012**
WM 50.5 52.4 53.7 -
Faecal samples*
Overall average dissimilarities (%) ANOSIM (R= 0.307, p<0.0001***)
FM - 0*** 0.006** 0.2 n.s.
LPM 57.0 - 0*** 0***
AM 49.3 59.8 - 0.0192*
WM 54.6 58.5 53.9 -
*One week before the end of the experiment
ACC
EPTE
D M
ANU
SCR
IPT
ACCEPTED MANUSCRIPT34
Table 5
Identification of the OTUs with similar sequences found in GenBank.
Identification Similar
GenBank ID Identity (%)
Maximum relative
abundance
Phylum/class Family/Genus With
GenBank ID
Within
OTUs
Mean (%) In group*
γ-
Proteobacteria Vibrio sp. BJ AB680982 99
99
(BJ/DP)
8.2 WM (M)
Vibrio sp. DP AB680982 99
97
(DP/AY)
4.5 LPM (F)
Vibrio sp. AY KC210826 99
94
(AY/BJ)
5.4 WM (F)
Enterobacteriaceae DE KC255198 99 - 15.6 WM (F)
α-
Proteobacteria Methylocella sp. DR AJ563927 96 -
4.8 LPM (F)
Firmicutes Clostridium sp. DQ AY208919 95 - 9.2 LPM (F)
Actinobacteria Saccharopolyspora sp. BI KC295927 97 - 3.2 LPM (F)
Spirochaetes Brevinema sp. DZ GU993264 94 - 3.0 AM (F)
*In brackets, F : faecal samples ; M : mucosal samples; further SIMPER data are presented in
Supplementary Tables S1 and S2

ACC
EPTE
D M
ANU
SCR
IPT
ACCEPTED MANUSCRIPT35
Table 6
Acetate production in the faecal samples of dietary groups one week before the end of the
experiment (mM ± SE; post-hoc test: Tukey after ANOVA; p<0.001).
FM LPM AM WM
1.3b ± 0.2 1.9b ± 0.3 3.7a ± 0.3 3.3a ± 0.4