Embed Size (px)
Citation preview
1
The Effects of Different Faucet Aerators on
Bacterial Growth and Water Quality
تأثير اجهزة ترشيد المياه على نمو البكتيريا والتي ممكن ان تؤثر على جودة المياه
By
Mahmoud Fathi Bader
Student Id # 90041
Dissertation Submitted in Partial Fulfillment of
M Sc Sustainable Design of the Built Environment.
Faculty of Engineering & IT
Dissertation Supervisor
Prof. Bassam Abu Hijleh
April-2011
2
DISSERTATION RELEASE FORM
Student Name
Mahmoud Fathi Bader
Student ID
90041
Programme
SDBE
Date
Title:
The Effect of different Faucet Aerators on Bacterial Growth and Water Quality
I warrant that the content of this dissertation is the direct result of my own work and
that any use made in it of published or unpublished copyright material falls within the
limits permitted by international copyright conventions.
I understand that one copy of my dissertation will be deposited in the University
Library for permanent retention.
I hereby agree that the material mentioned above for which I am author and copyright
holder may be copied and distributed by The British University in Dubai for the
purposes of research, private study or education and that The British University in
Dubai may recover from purchasers the costs incurred in such copying and
distribution, where appropriate.
I understand that The British University in Dubai may make that copy available in
digital format if appropriate.
I understand that I may apply to the University to retain the right to withhold or to
restrict access to my dissertation for a period which shall not normally exceed four
calendar years from the congregation at which the degree is conferred, the length of
the period to be specified in the application, together with the precise reasons for
making that application.
Signature
3
Abstract
Sustainable innovations aimed at protecting future generations from the
effects of the global warming in addition to preserving precious natural
resources such as water. Water conservation is one of the green building
features, which may be achieved by using appropriate water saving
plumbing fixtures like faucet aerators. Although benefit may be achieved
by using such fixtures, there are also negative side effects to their use.
This study was conducted in Dubai International Academic City (DIAC),
to investigate the consequences of using different faucet aerators on
bacterial re-growth which may compromise the quality of the water; and
to check the deterioration of the efficiency of the aerators over the time.
The study is based on experimental method. Four types of faucet aerators
were used, and monitored every four weeks over a six month period.
120 water samples were collected from 16 faucet aerators, and there were
also 3 control points which were under three different water pressures.
The water tank was also tested. A Heterotrophic Plate count was used
since it is a common indicator for the monitoring of microbiological
water quality in distribution systems. The samples were tested in Dubai
Municipality Central Laboratory. The water flow rates, pH and
temperatures were measured in the field.
The results revealed that, from cycle one to cycle four, the HPC bacteria
concentration in the water tank exceeded the threshold level of 500
cfu/ml. Although the HPC concentration in the water tank dropped to a
4
level below 500 cfu/ml due to treatment from the main source, the HPC
concentrations in the faucet aerators remained high.
The study concluded that, water pressure less than 2.5 water bar has
potential to enhance the growth of bacteria in the aerators. Furthermore,
the aerators saved 20% to 80% of the water and that depended on the
aerator types as well as the water pressure. Finally the research
recommends that, a three month periodic maintenance for the aerators
might avoid the accumulation of sediments, which were the main
contributor to bacterial growth.
5
ملخص:
االبتكارات المستدامة تهدف إلى حماية األجيال المقبلة من آثار ظاهرة االحتباس الحراري ، باإلضافة إلى
ة من ميزات المباني الخضراء ، الحفاظ على الموارد الطبيعية الثمينة مثل الماء. المحافظة على المياه هي واحد
ايجابيات من على الرغم من تحقق. )ايريتور( اجهزة ترشيد المياه وهو ما يمكن تحقيقه عن طريق استخدام
اال انه قد تنتج جوانب سلبية على الصعيد االخر وهذا ما تحاول هذه الدراسة استخدام مثل هذه االجهزة
استكشافه.
نمو المياه على ترشيدعواقب استخدام أجهزة لمعرفة نة دبي األكاديمية العالمية في مدي اجريت هذه الدراسة
.مع مرور الوقت هذه االدوات كفاءة تناقص، وأيضا للتحقق من وبالتالي التاثير على جودة المياهالجراثيم
ابير ياه من الصنعينة م 021تم جمع وستة أشهر تمرت الدراسة لمدة سا التجربة حيث وتعتمد الدراسة على
مع االخذ بعين االعتبار تنوع الرئيسي مياهالوخزان نقاط مراقبةك صنابير 3 و ايريتور 01 المثبت عليها عدد
حيث في نظام التوزي تركيز البكتيريا لرصد مؤشرك تم استخدام فحص هيترو تروفيك كاونت. ضغط المياه
امل حموضة باالضافة لمعتم قياس معدالت تدفق المياه كما دبي المركزي. بلدية عينات في مختبرالتم اختبار
. الموقعفي المياه ودرجة حرارة المياه والهواء
في خزان لية عا كانتتركيز البكتيريا ه ان أربع رقملدورة واحدرقم من دورة ه في الفترة وكشفت النتائج أن
ان هذا مل. وعلى الرغم من في كل بكتيرة مستعمرة 011 ت الحد المسموح به وهو تجاوز وانها المياه
قد انخفض بعد الدورة الخامسة اال انه لم ينخفض داخل شبكة المياه الداخليه للمبنى بما فيه االيريتور تركيز ال
. االيريتور لتعزيز نمو البكتيريا في يةلديه امكان بار 2.0من اقلراسة إلى أن ضغط الماء وخلصت الد
% وذلك حسب نوع االيريتور وضغط المياه.01% الى 21توفير المياه تراوح ما بين نفا ،وعالوة على ذلك
جنب تراكم الترسبات التي كانت تؤدي الى ت قدثالثة أشهر كلالصيانة الدورية ان وأخيرا أوصت الدراسة
العامل الرئيسي لنمو البكتيريا.

6
Dedication
This research is dedicated to my beloved parents (Fathi, and Ghalia ),
wife Refqa and children ( Sara and Ahmed.)

7
Acknowledgment
First and foremost, I wish to thank my supervisor Prof. Bassam Abu
Hijleh for encouraging and inspiring me to complete my dissertation on
time. Furthermore, I would like to thank The British University in Dubai
for their partial financial support for this research.
Secondly this dissertation would not have been possible without DIAC
management’s support especially George Varghese and Mahmoud Nasr.
I would like aslo to thank Iyad Sabbagh and Babu Chancheri from
EDAMA. Many thanks should also go to Rachid Lasfer from DEWA for
his help in providing part of aerators which were used in the
experiment.
I am grateful too for the advice of Dubai Municipality central laboratory
epically Aisha Ibrahim, for cooperation during the tests.
Many thanks for Ms Mary Mayall for here assistance in reviewing the
language of the text.
This thesis would not have been possible without my wife’s support; She
has shared my many challenges during this dissertation work. Finally, I
am grateful to my many of friends for supporting me to achieve my goal
particularly Ziad Alasad and Farah Yaseen.
8
Table of Contents
Abstract……………………………………………………………………….…………........…
….i
Dedication
……………………………………..……………………..…………………..……….iv
Acknowledgements
..…………………..……………………………………………….……..…..v
List of
Tables………………………………………………………………...………..…………..ix
List of Figures
……………………………………………………………………………….……xi
Nomenclatures…………………………………………………………..………………….…
…xiv
1. Introduction
1.1 worldwide water scarcity and climate
change…………………………..…….…1
1.2 Domestic water quantity and
health..………..……………………….….………..3
1.3 The development of water resources in Dubai
…………………………….…….4
1.4 Water consumption in the
buildings…………………………………..………….6
1.5 Sustainability in U.A.E
……………………….……………………….….….….8
1.6 Side effects of using aerators
…..………………………..…………..….…...….10
1.7 Test for water quality
evaluation…………………………..……………………12
1.8 Rational for the research
……………………………………………………….12
9
1.9 Structure of Dissertation
………………………..………………………….…...13
2. Literature Review
2.1 Needs for water conservation
………….…..……….……………..………...….14
2.2 Techniques of Indoor Water Saving
…………………………….….….………15
2.2.1 Alarming Visual Display Monitors
……………………………………...…16
2.2.2 Low Flow
Fixtures………………………………………………………….17
A. High Efficiency
Toilets…………………………………………………….……17
B. Showerheads………………………………………………………….………..
..18
C. Dry
Urinals…………………………………………………………....………...18
D. Faucets
………………………………………………………………………....19
2.2.3 On site Gray Water Recycling
……………………………………………..21
2.3 Principle Function of the Faucets Aerator
……………………………..….…...21
2.4 The Health Issue related to Potable
Water………………………………..……..22
2.5 Heterotrophic bacteria
…..…………………………………..….…...……….….24
2.6 Pathogens in Drinking
Water………………………………………………...….27
2-7 Factors Enhance the Growth of Microbiological in the Water Distribution
System..28
2.7.1 Water Temperature
……………………………………………...….……..28
2.7.2 Plumbing
Materials…………………………………………...……...……29
11
2.7.3 Water flow Velocity
……………………………………...……….……….31
2.7.4 Biodegradable Organic Material
…………………………………….…....32
2.7.5
pH……………………………………………………………..…………...32
2.7. 6 Existence of Disinfectant Residual
……………………...………...………32
2-8 Aims and Objectives of the
study…………………………………….…………..….33
3. Methodology
3.1 Previous Methods ….
………….…..……..….….…………...…………………36
3.2 Selection of the Research Method
…………….…….………………….……..42
3.3 Aerators used In the current Experiment
…………….…………………………43
3.3.1 RST Long Life Aerator
(R)………………………….……………………..43
3.3.2 Neoperl
(N)…………………………………………………………………44
3.3.3 Kistenmacher
(K)……………………………………...……………………45
3.3.4 PCA spray
(P)………………………………………………..……………..46
3.4 Description of DIAC Washrooms
……………………………………………..47
3.5 Experiment Procedures
…………………………………………………………48
3.6 Ethical issues
………………………………………….………………………..53
3.7 Limitations of the study
………………………………………………………...54

11
4. Results
4.1 Introduction
………….…..……….……………...……………………………56
4.2 HPC concentration in different types of aerators
………………………….….56
4.3 HPC in faucets under different water
pressures…………………………………62
4.3.1 HPC concentrations in Faucets under 2 Bar water pressure
……………….62
4.3.2 HPC concentrations in Faucets under 2.5 bar water
pressure………….….63
4.3.3 HPC concentrations in Faucets under 1.5 water pressure
…………………65
4.4 Percentage of HPC of aerators under different water pressure relative to HPC
in DIAC tank
...........................................................................................................68
4.5 Water parameters from Faucets under different water
pressure………………..73
4.6 Water Flow rates from faucets under different water pressure
...........................75
5. Discussion........................................................................................................................
..84
6. Conclusion and Recommendation
6.1 Conclusion ……...
.………..……….……………...………………………..…..89
6.2 Recommendation
.................................................................................................92
References........................................................................................................................
..94
Appendix A Photos of DIAC plumbing Material in
DIAC…………………………105
Appendix B Sample of Dubai Municipality laboratory test report
…………………108
12
List of Tables
Page
Table 1.1 Possible effect of climate change on water resources. (Mihelcic and
Zimmerman
2010)..............................................................................................................2
Table 1.2 Typical water uses in the U.K(Sustainable building Design Manual
2004). .7
Table 2.1 Energy consumed for water production (Harvey
2006)……………..…..15
Table 2.2 Water Flow Rate for Different Fixtures according to DEWA (DEWA
2010)…………………………………………………………………………………….
.16
Table 2.3 HPC bacterial in Potable Water (Allen
2004)…………………….……..24
Table 2.4 Sources of water contamination (Gray 2008)
…………………………...27
13
Table 4.1 HPC concentration in aerators type
P…………………………………….57
Table 4.2 HPC concentration in aerators type
N…………………………..…..……58
Table 4.3 HPC concentration in aerators type
R…………………………….….…..59
Table 4.4 HPC concentration in aerators type
K………………………………...….61
Table 4.5 HPC concentration in aerators under 2 bar water
pressure…………….....63
Table 4.6 HPC concentration in faucets under 2.5 bar water pressure
…………..…64
Table 4.7 HPC concentration in faucets under 1.5 bar water
pressure……………..65
Table 4.8 HPC concentration in the control points and water
tank…………………67
Table 4.9 Percentage of HPC in aerators under 2 bar respect to HPC
concentration in the
tank………………………………………………………………….…………..……68
Table 4.10 Percentage of HPC in aerators under 2.5 bar respect to HPC
concentration in the
tank…………………………………………………….…………………………..70
Table 4.11 Percentage of HPC in aerators under 1.5 bar respect to HPC
concentration in the tank
………………………………………………………………………………..71
14
Table 4.12 HPC difference between the aerators under different water pressure and
the tank
…………………………………………………………………………..…………..73
Table 4.13 Parameters for water in different water pressure and water tank
…….…74
Table 4.14 Water flow rate (L/min) from different type of aerators under 2 bar
water pressure
……………………………………………………………………………...…..75
Table 4.15 Percentage of water flow rate relative to control point under 2 bar water
pressure…………………………………………………………………………..……
…77
Table 4.16 Water flow rate (L/min) from different type of aerators under 2.5 bar
water pressure
……………………………………………………………………….…………78
Table 4.17 Percentage of water flow rate relative to control point under 2.5 bar
water
pressure……………………………………………………………………….…………
.79
Table 4.18 Water flow rate (L/min) from different type of aerators under 1.5 bar
water pressure
………………………………………………………………………………….81
Table 4.19 Percentage of water flow rate relative to control point under 1.5 bar
water pressure
…………………………………………………………………………………82
15
List of Figures
Page
Figure 1.1 Water consumption in different sectors in Dubai (DEWA) 2009……..
5
Figure 2.1 Shower Monitor. (waiTEK
2009)……………………………………...….16
Figure 2.2 Showerhead (EPA
2010)……………………………………………….…18
Figure 2.3 Trap with floating sealing liquid (Demirize
2006)…………….…….……19
Figure 2.4 Mechanical Working Traps. (Demirize
2006)……………………………19
Figure 2.5 Self closing taps (Prestomat2000 2011)
...…………………………...…..20
Figure 2.6 Faucet Aerator (Environment Agency Abu-Dhabi
2011)………….…….21
Figure 2.7 Aerator parts (Neoperl
2010)…………………………………………….22
Figure 3.1 Aerator type
R……………………………………………………………44
Figure 3.2 Aerator type
N……………………………………………………………45
Figure 3.3 Aerator type
K……………………………………………………………46
Figure 3.4 Aerator type
P………………………………………………...…………..47
16
Figure 3.5 Pressure Compensating Aerator
…………………………………………47
Figure 3.6 Tools used in Field
Measurements……………………………………….50
Figure 3.7 Suitable working environment in D.M lab for HPC
test………...……….52
Figure 3.8 Colony
Counter…………………………………………………….…….53
Figure 4.1 HPC concentrations in aerators type
P……………………………….…..57
Figure 4.2 HPC concentration in aerator type
N…………………………….………59
Figure 4.3 HPC concentrations in aerators type
R………………………………..…60
Figure 4.4 HPC concentrations in aerators type
K………………………….……….61
Figure 4.5 Average HPC concentrations in aerators, control point under 2 Bar
water pressure and the water
tank………………………………….…….……………………..63
Figure 4.6 Average HPC concentration in aerators and control point under 2.5
Bar water pressure and the water
tank…………………………………………………..……64
Figure 4.7 Average HPC concentrations in aerators, control point under 1.5 Bar
water pressure and the water
tank………………………………………..………………66
Fig 4.8 HPC concentrations in the control points and the water
tank………..….67
17
Figure 4.9 Percentage of HPC in aerators under 2 bar respect to HPC
concentration in the
tank……………………………………………………………………………...…69
Figure 4.10 Percentage of HPC in aerators under 2.5 bar respect to HPC
concentration in the
tank…………………………………………………………………………..…….70
Figure 4.11 Percentage of HPC in aerators under 1.5 bar respect to HPC
concentration in the
tank……………………………………………………………………...…………71
Figure 4.12 Average HPC concentrations in aerators under different water pressure
and water
tank……………………………………………………………………………72
Figure 4.13 Differences in HPC between aerators and control
point………………...73
Figure 4.14 pH records over the cycles in the water tank and the
faucets……...…….75
Figure 4.15 Water flow rate from different type of aerators and control point under
2 bar water
pressure…………………………………………………….………………….76
Figure 4.16 Percentage of the water flow rate from faucet aerators relative to
control point under 2 bar water
pressure……………………………………...………………….77
Figure 4.17 Water flow rate from different type of aerators and control point under
2.5 bar water
pressure………………………………………………………………………..79
Figure 4.18 Percentage of water flow rate from faucet aerators relative to control
point under 2.5 water
bar………………………………………………………………………80
18
Figure 4.19 Water flow rate from different type of aerators and control point under
1.5 bar water
pressure…………………………………………………………….………….81
Figure 4.20 The percentage of water flow rate from faucet aerators relative to
control point all under 1.5 water
bar………………………………………………..……………82
Figure A.1 Water Supply Material
…………………………………………………106
Figure A.2 Water supply plumbing material in DIAC
……………………………..106
Figure A.3 Washroom in DIAC
……………………………………………………107
Figure A.4 Sediment accumulation on the faucet aerator
…………………………..107
19
Nomenclature:
At Air Temperature
CFU Colony Forming Units
C° Celsius
C Control point
CIA Central Intelligent Agency
DEWA Dubai Electricity and Water Authority
DIAC Dubai International Academic City
DM Dubai Municipality
EPA Environment Protection Agency
ICU Intensive care units
HPC Heterotrophic Plate Count
K Aerator type K
Lpcd Liter per capita per day
L/ min. Liter per minute
LEED Leadership in Energy and Environment Design
MF Membrane Filter
NFGNB Non-fermenting gram-negative bacteria
N Aerator Type N
P Aerator Type P
PP Pour Plate Method
21
PVC Polyvinyl chloride
R Aerator Type R
SP Spread Plate method
U.A.E United Arab Emirates
UPS Urban planning council
U.S.G.B.C United States Green Building Council
U.S.A United States of America
Wt Water temperature
W.H.O World Health Organization
∆ Difference in HPC concentrations
21
Chapter 1- Introduction
1.1 Worldwide water scarcity and climate change
Fresh water is one of the most valuable renewable resources on the
planet, since it compromises 2.5% of the worldwide water, and only
0.77% of it is accessible (Write and Boorse 2011). Moreover in 2000 the
World Health Organization (WHO) anticipated that one billion people
lacked access to drinking water. Although the population is increasing
worldwide, this number decreased to 884 Million in 2010 (UNESCO
2010).
Scarcity of the water is predicted to increase rapidly in near future due to
population increase and climate change. As population increase,
urbanization also increase, which means more water demand will be
needed for industrial, agriculture and domestic use. According to the
United Nation (U.N) population division 2008, the current number of the
population in the world is six billion and this figure is expected to rise to
about eight billion in 2025 (Wright and Boorse 2011). The Millennium
Ecosystem Assessment stated that ''A changing climate can modify all
elements of the water cycle, including precipitation, evapotranspiration,
soil moisture, groundwater recharge, and runoff. It can also change both
the timing and intensity of precipitation, snowmelt, and runoff '' (Wright
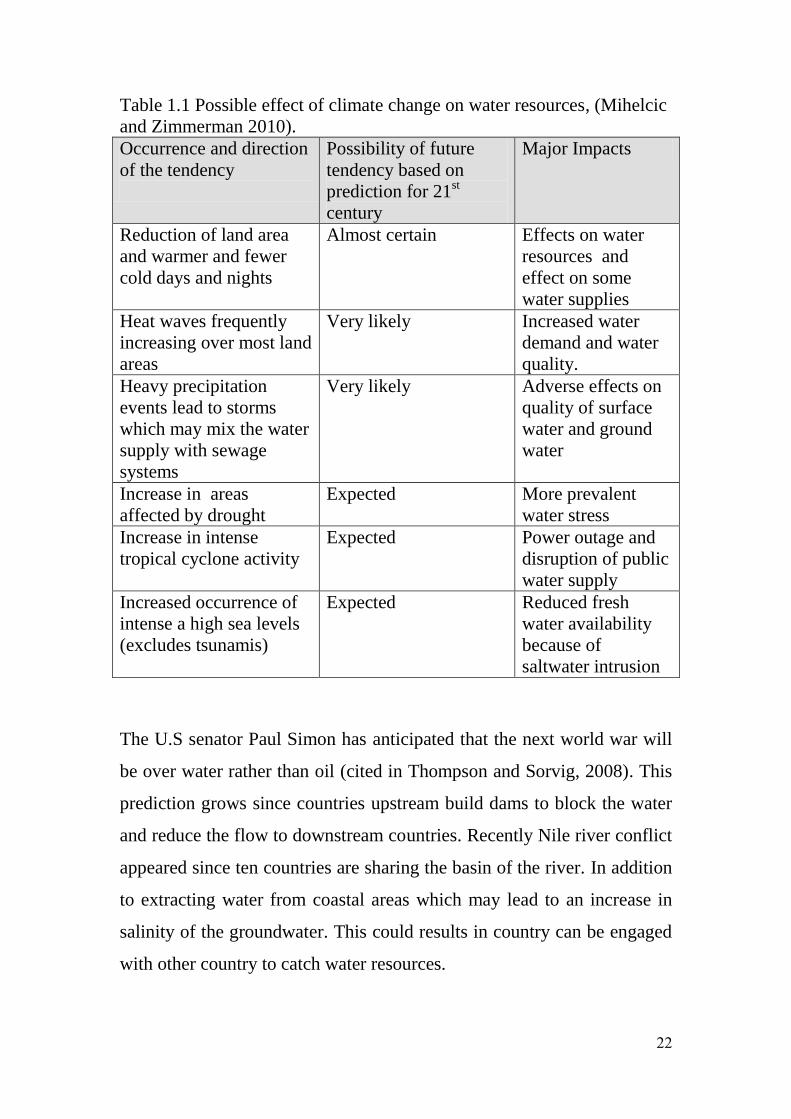
and Broose 2011, P254). Table 1.1 presents possible effects of climate
change on water resources.
22
Table 1.1 Possible effect of climate change on water resources, (Mihelcic
and Zimmerman 2010).
Occurrence and direction
of the tendency
Possibility of future
tendency based on
prediction for 21st
century
Major Impacts
Reduction of land area
and warmer and fewer
cold days and nights
Almost certain Effects on water
resources and
effect on some
water supplies
Heat waves frequently
increasing over most land
areas
Very likely Increased water
demand and water
quality.
Heavy precipitation
events lead to storms
which may mix the water
supply with sewage
systems
Very likely Adverse effects on
quality of surface
water and ground
water
Increase in areas
affected by drought
Expected More prevalent
water stress
Increase in intense
tropical cyclone activity
Expected Power outage and
disruption of public
water supply
Increased occurrence of
intense a high sea levels
(excludes tsunamis)
Expected Reduced fresh
water availability
because of
saltwater intrusion
The U.S senator Paul Simon has anticipated that the next world war will
be over water rather than oil (cited in Thompson and Sorvig, 2008). This
prediction grows since countries upstream build dams to block the water
and reduce the flow to downstream countries. Recently Nile river conflict
appeared since ten countries are sharing the basin of the river. In addition
to extracting water from coastal areas which may lead to an increase in
salinity of the groundwater. This could results in country can be engaged
with other country to catch water resources.
23
The limiting of water resources in addition the increase in demand for
water due to population increase and urbanization, lead to water scarcity
which occurs when water supply is less than 1000m3 per person per year.
According to World Watch 1999, in 1995 the world population was 5.7
Billion and the water sufficiency was 92%, while the prediction for 2050
shows the population will be 9.4 Billion and scarcity might increase to
18% (Stein et al. 2006).
Gulf countries are one of the most areas where the gap between supply
and demand is dramatically increasing. Thus these countries are trying to
bridge the gap by depending on water desalination which has many
consequences will be explained in the following section. Elnashar
reported that up to 2003, more than 65% of the desalination sector in the
world is operating in the gulf countries (Cited in Dawoud 2005).
1.2 Domestic water quantity and health
Providing domestic water is a basic need for human life. The quantity of
water for domestic purpose is a very important feature in domestic water
supplies since, it may affect public health. There is no available data to
international standards specifying the minimum domestic water required
for hygiene and public health, for instance, a declaration of Millennium
goals which mentioned that: By year 2015 the people who have a lack of
access to clean water should be reduced by fifty percent. However the
quantity of water was not mentioned in the goal (WHO 2003).
Adequate water supplies may prevent the human life and protect them
from many diseases. There is also a key relation between poor water
24
supplying and hygiene. According to WHO 2002, about 1.73 million
children die every year due to poor water supply (WHO 2003).
Gleick (1999) advised that 50 liters per capita per day is acceptable as
basic water need for domestic distributed as following: 5 lpcd for
drinking, 20 lpcd for sanitation services, 15 lpcd for bathing and 10 lpcd
for food preparation. Although the figure of 50 lpcd seems small, it was
projected that'' by year 2000, 2175 million people will live in 62 countries
that report average domestic water use below 50 lpcd '' (Gleick 1999, p.
496).
1.3 The Development of Water Resources in Dubai
There are many factors that can increase the water consumption rate such
as the climate, population, urbanization development and the higher
income rate. The dominant climate in Dubai is arid where the average
temperature in summer is 42 C○. The second factor is the population, as
the population in Dubai (including expatriate) has increased dramatically
from 862,387 in 2002 to 1,770,978 in 2009 which means higher demand
for water (Dubai Statistics 2009). The third factor is urbanization
development in recent decades due to the real estate boom. Last, but not
least is the income rate, in 2009 the GDP for U.A.E was 38,900$ per
capita which is one of the highest income in the world according to
Central Intelligent Agency World Factbook (CIA 2010). In light of the
aforementioned factors the water consumption rate in U.A.E was 550
L/C/Day in 2008 (Absel 2010). This is one of the highest rates in the
world compared with the water consumption in the U.S.A which is 575
25
L/C/Day, and 493 L/C/Day, 374 L/C/Day, and 193 L/C/day in Australia
Japan and Germany respectively (Anderson et al 2002).
The main source of water in Dubai is desalinated seawater via Arabian
Gulf which contributes to 89.9 % of the total water supply. In addition to
underground water which contributed 9.1 % of the supply in 2009. The
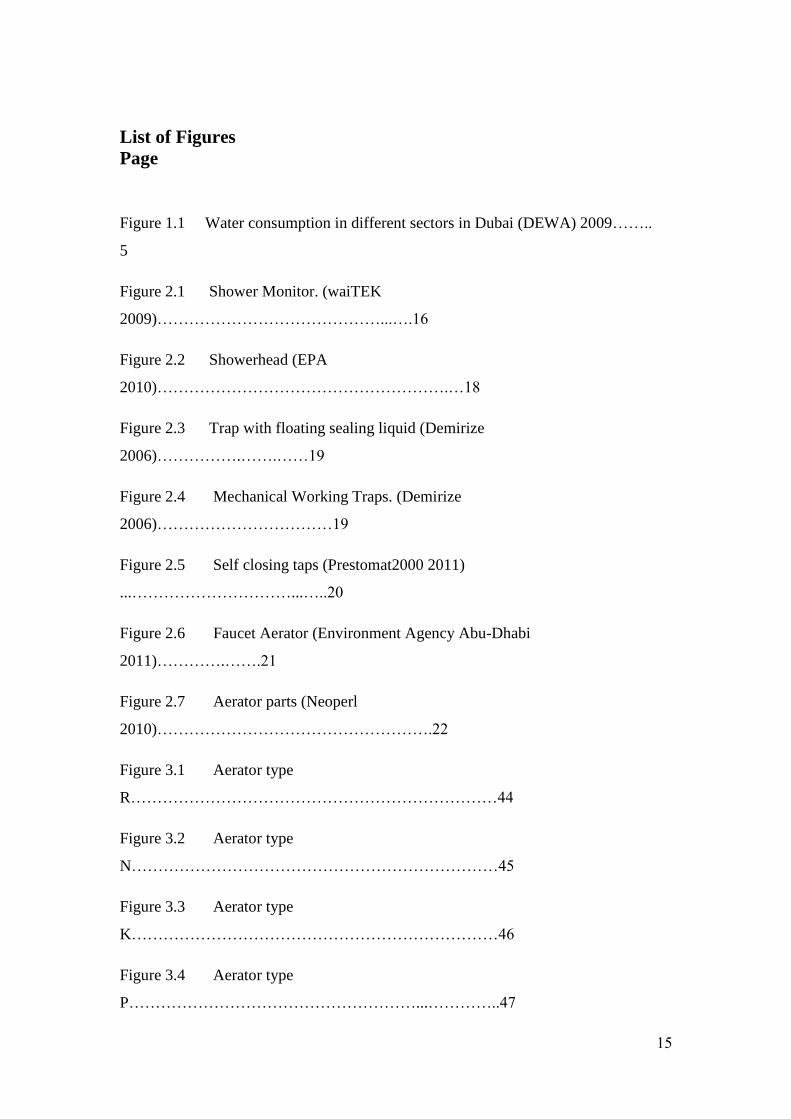
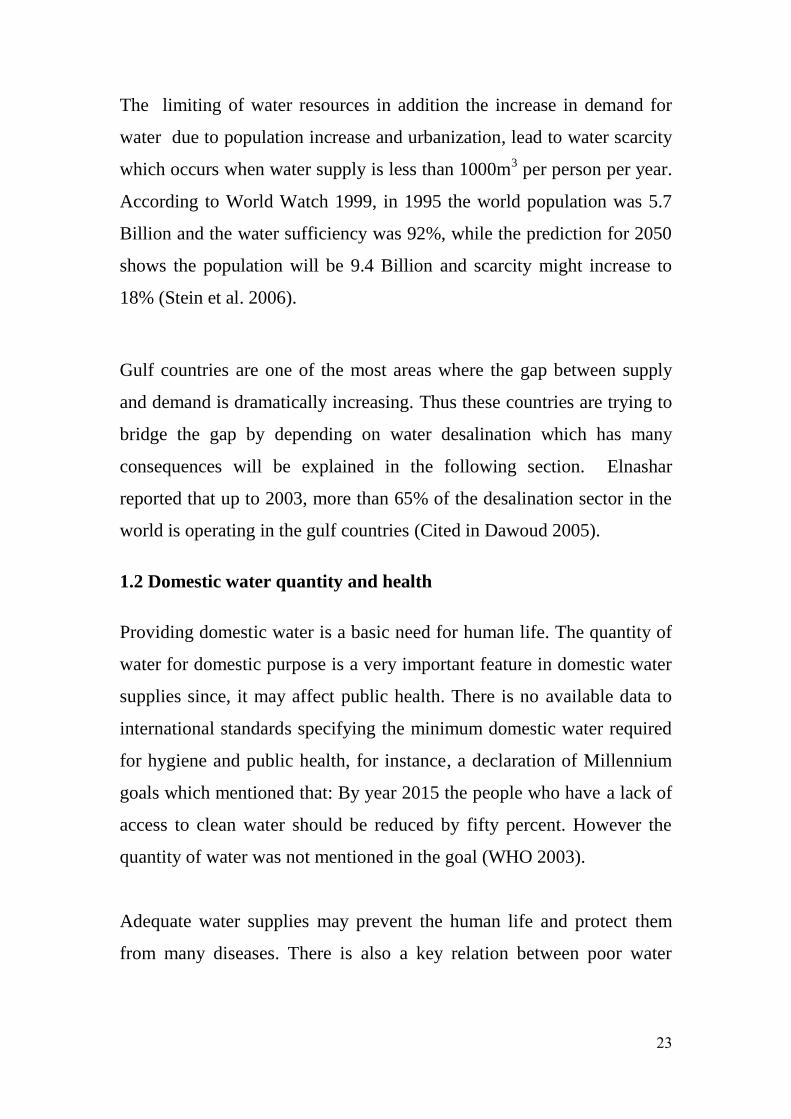
supply is distributed in many sector as illustrated in the Fig 1.1 below, in
2009 the residential sector consumed 60.61 % of the total consumption
followed by commercial sector with 24.9 % then industrial sector which
consumed 3.7 % and others with 3.7 % (DEWA 2009). The irrigation
sector which mainly uses treated wastewater is not included in the above
data.
Residential
, 60.61%
Commerical
, 24.90%
Industrial ,
3.70%
Others ,
10.79%
Figure 1.1: Water consumption in different sectors in Dubai, (DUBAI
Electricity and Water Authority (DEWA) 2009)
26
Al-Mazroui and Al-Mansouri (2010, p.5) provided the following
information:
The amount of evap./ transpiration is more than 75% of the total annual
rainfall, and that about 15% runs off to the sea leaving only 10% to recharge
the aquifers. Abstraction of ground water is more than a thousand cubic meters
a year, 79% of it being non-renewable, resulting in drying or salination of
aquifers.
Worldwide, 26% of seawater desalination capacity is located in U.A.E
(Lattemann & Hopner 2008). According to Dr. Mariam Alshenasi, a
spokesperson for U.A.E ministry of water and environment: '' the costs of
production of desalinated water in U.A.E are estimated at 11.8 billion
Dirham annually, an average 7.16 Dh per cubic meter '' (H2O 2010, p.6).
In addition to the high cost of desalinated water production, there is a
negative impact on the marine environment via the discharge of the
concentrate and chemicals to the water and air pollution resulting form
energy consumed in the process.
In recent years, the reliability of desalinated water resources might be
compromised due to red tide which occurred in the gulf and affected the
water quality and resulted in interrupted to water production from the
plant. Reference to (Kakande 2008) in November 2008 the Ras Al
Khaimah desalination plant was closed for one week due to red tide
consequently desalinated water supply was stopped to the resident.
1.4 Water consumption in the buildings
The Unites States Green Building Council (USGBC) and world watch
institute mentioned that, the building sectors consume 16% of global
freshwater (cited in Foster et al 2007). Using a large quantity of water
27
increases the operation and maintenance cost of the buildings thus,
application of an efficient and complete water management plan could
reduce the utility bills. Another point is that, considering water efficient
fixtures and appliances in the design stage could reduce the size of the
pipe lines, storage size and the pump capacity, all of which have cost
implications (LEED 2009).
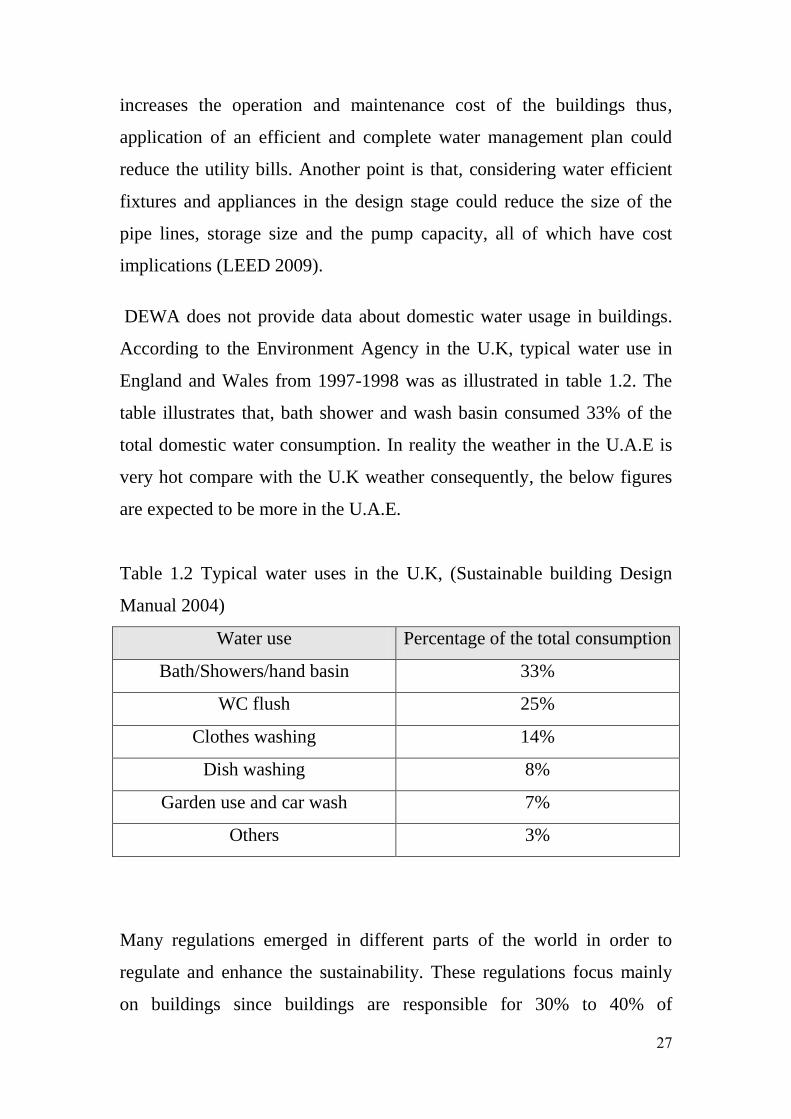
DEWA does not provide data about domestic water usage in buildings.
According to the Environment Agency in the U.K, typical water use in
England and Wales from 1997-1998 was as illustrated in table 1.2. The
table illustrates that, bath shower and wash basin consumed 33% of the
total domestic water consumption. In reality the weather in the U.A.E is
very hot compare with the U.K weather consequently, the below figures
are expected to be more in the U.A.E.
Table 1.2 Typical water uses in the U.K, (Sustainable building Design
Manual 2004)
Water use Percentage of the total consumption
Bath/Showers/hand basin 33%
WC flush 25%
Clothes washing 14%
Dish washing 8%
Garden use and car wash 7%
Others 3%
Many regulations emerged in different parts of the world in order to
regulate and enhance the sustainability. These regulations focus mainly
on buildings since buildings are responsible for 30% to 40% of
28
greenhouse emissions in the U.S.A (Jones 2008), which are the main
reason for global warming and climate change. One of the green building
features is water conservation. As a result many standards such as LEED
and BREEAM specify the water flow rate and provide points according
to their ranking system for the buildings to achieved water saving, so the
buildings can be certified as green.
One of the water main conservation tools for domestic water supply is the
use of water saving plumbing fixtures such as faucet aerators, which are
mounted at the end of the spout and defined as ''the air mixed with the
water and despite a reduced water flow'' (Bokalders and Black 2010, p.
322). Faucet aerators have been invented in 1950's and hence then, many
alterations have been implemented in order to improve its general
appearance and reduce its cost. In the last two decades, changes were
applied to make these aerators comply with green building guides, so that
the maximum water flow rate is now 6 Liters/Minute which contributes to
water saving.
1.5 Sustainability in U.A.E
The United Arab Emirates is located at the south of the Arabian Gulf. It is
located between longitudes 22○ and 26.5
○ North and latitude 51
○ and
56.5○ East. The total area of U.A.E is 83,600 km. It has a tropical desert
climate with averaging 65 mm of annual rain. In summer (June to
September) the daily average temperature exceeds 45C○.
According to the World Commission on Environment and Development
1987, sustainable development is defined as ''development that meets the
29
need of the present generation without compromising the ability of the
future generation to meet their needs '' (Moughtin & Sh. 2005). If the
current practices of water consumption remains without improvement and
without implementing sustainable usage then, future generation will
struggle to put it simply, worldwide freshwater has become precious
resources. According to World Health Organization more than one billion
people lacked access to safe water supply sources within one kilometer of
their houses. (W.H.O 2003)
Based on global footprint network 2010, U.A.E has the highest ecological
footprint thus, needing action to curb the overconsumption. Scarcity of
the water resources in U.A.E led the country to meeting its water demand
mainly from seawater desalination as main sources and brackish water
desalination as a second source (DEWA 2009). The water desalination
process requires a lot of energy which means more CO2 emission which,
in turn is the main cause of greenhouse gas that is the main cause of
global warming.
Al-Mazroui and Al-Mansouri (2010, p.7) provided the following
information:
The harsh arid climate of the U.A.E with low rainfall presents several
difficulties for the sustainable supply of water. The U.A.E has one of the lowest
national renewable water resources capacities, which on a per capita basis
equates to 64 m3 per year, only of the order of 1% of the world average.
The emergence of green building legislation aims to enhance
sustainability. One of the green building features is water saving via
plumbing fixtures since it has the potential to save water as well as
energy. However, a substantial study should be conducted in order to
avoid any negative side effects from using such fixtures.
31
Recently in the U.A.E many campaigns were conducted to encourage
people to use water devices such as faucets aerator. Mr. Rachid from
DEWA stated that: A team from DEWA performed many school visits in
order to enhance the water saving behavior and improve the awareness of
the water scarcity and benefits of water conservation. To do this, they
built a model of two taps, one with water saving aerator and the with
conventional tap aerator, then they allowed water to fill two bottles at the
same time. Two stop watches were used to record the time required to fill
the bottles. The results showed that, the bottled filled by faucet with
aerator consumed more time than the bottle filled by the normal faucet
which meant, the water flow from faucet with aerator is slower than the
normal faucet. This demonstration was used to convince the students of
the importance of the aerators. In addition The Environment Agency-Abu
Dhabi has distributed faucet aerators free of charges to the public to
encourage them to reduce water consumption and they recently
announced that 76,494 water saving aerators have been fitted in 4,563
different buildings in Abu Dhabi.(Environment Agency 2010).
Furthermore Abu Dhabi urban planning council (UPC) Lunched Pearl
rating system for the buildings via Estidama Program, in order to achieve
sustainability in buildings. They claimed that, this system is suitable for
arid weather area such U.A.E (Abu Dhabi Urban Planning Council 2010).
1.6 Side effects of using aerators:
In the middle of the last century Elie P. Aghnides, a Greek inventor noted
that, the water felled from mountains stream is more effectively than the
water flowed from normal water pipe due to aeration of the water during
falling thus, breaking it in to bubbles foam, as a result he provided a set
31
of metal screens in water pipe and he found the water outflow from the
water pipe is bubbly, clean and soft. (Juror 1946)
Since 50's until 80's of the last century many changes had been integrated
to original aerators in order to decrease the cost, improve the appearance
of the aerator and to protect the aerator from becoming damaged
therefore in 1981 the aerator became concealed in the faucet (Elie 1983)
By 1992 many modifications had been adapted to the aerator to comply
with U.S Environmental protection Agency (EPA) and other standards
requirement to achieve the maximum water flow quantity. This is positive
in one way however, it may has unexpected side effect.
According to Heroes of the U.A.E (2011) “When a Water-saver is fitted it
acts as a regulator on the tap, ensuring that the water always flows at a
constant rate. This means that whether the pressure is high or low, you
still enjoy the same flow rate. It also means that an incredible amount of
water and energy – which are both precious and finite resources - are
saved in the process”.
New inventions or innovations may be associated with negative side
effects however; consideration of comprehensive criteria reduces
negative impact of using innovation. In 1940th pesticides were invented in
the U.S.A, and they eliminated the insects dramatically, however
irresponsible use of them led to contamination via the food chain. In
1962, Rachel Carson, one of sustainability's pioneers published her book,
Silent Spring which resulted in the international ban on the use of DDT
(Wright & Broose 2010). The lesson learned from this event was that,
32
immediate benefits may have unforeseen negative effect in the long-term
if all sustainable features are not respected.
Although advantage may achieved via using the water faucet aerators,
many epidemiological studies have been done by Nguyen et al. (2008),
Orenstein et al (2006), Kappstein et al. (2000), Weber at al. (1999) and
Wang et al. (2009) which correlated outbreaks bacterial infections in
health care centers to faucet aerators, and they concluded that the aerators
might work as reservoirs for bacterial growth, thus increasing bacterial
concentration in faucet aerators may lead to water contamination.
1.7 Test for water quality evaluation
Heterotrophic Plate Count (HPC) test in water supply system is very
useful tool in assessing the water quality and the potential of bacteria to
re-growth in the system as well as to evaluate the “microbial growth on
material used in water distribution system”(Carter et al. 2000).
1.8 Rational for the research:
Application of water saving campaign may be associated with negative
impact on human health thus need integrated study to avoid such impact
so, this research attempted to answer the following questions. Would
faucet aerators affect bacterial growth, which may be affect the water
quality? What is the optimum length of time between maintenance of the
aerator to avoid its deterioration?.
33
1.9 Structure of Dissertation
In the following chapters, a comprehensive review of previous studies
related to faucet aerators and factors enhance bacterial growth in the
water system are discussed. In chapter three the method and procedure
used in this research are explained, then in chapter four and five the
results and the outcome are presented and discussed comprehensively.
Finally in chapter six the conclusion and recommendations will be
presented.
34
Chapter 2- Literature Review
2.1 Needs for water conservation
Water is one of the most remarkable resources in the world. Even though
it covers almost 70% of the earth surface; more than 97.5% of this water
is salt and is not suitable to be used as potable water. The remaining 2.5%
is fresh water of which 68.9% is kept in glaciers and 0.9% is in
permafrost. Therefore, the remaining 29.9% is fresh groundwater and
0.3% constitutes freshwater lakes and rivers which are regarded as
renewable (Benggeli 2010).
Water plays vital role in our life. Worldwide, 70% of water is used in
irrigation, 20% for commercial-industrial activities and 10% for
residential uses. Moreover, water is essential for building construction
since the production of one ton of bricks needs 2200 Liters of water. One
ton of steel requires 1.32 million Liters. Furthermore, huge quantities of
water are needed for electricity production in power plants (Stein et al
2006).
There is a significant link between domestic water consumption (which is
used for personal hygiene in addition to washing clothes and dishes) and
energy demand. In winter, water needs to be heated to a certain
temperature before being used for different purposes. Another point is
that, cold water requires energy in order to get pumped from the
underground or desalination plants via pipe lines to reach reservoirs or
end user points. Furthermore, energy is required for the transportation of
35
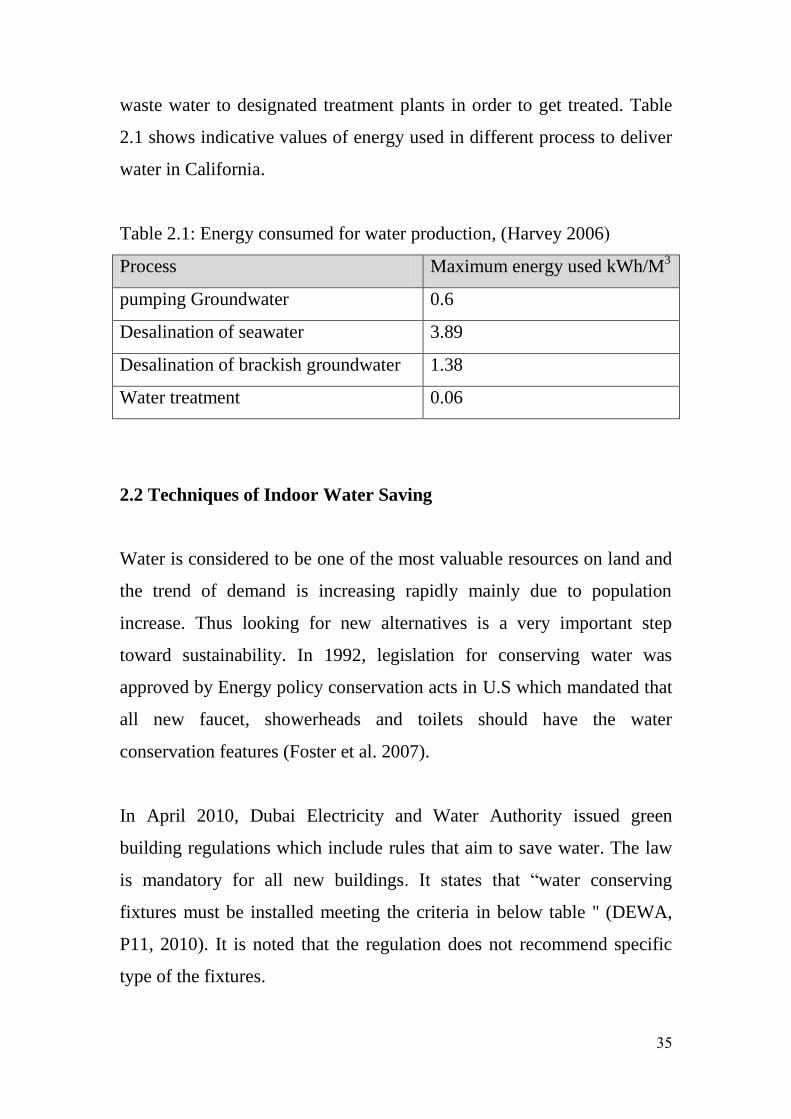
waste water to designated treatment plants in order to get treated. Table
2.1 shows indicative values of energy used in different process to deliver
water in California.
Table 2.1: Energy consumed for water production, (Harvey 2006 (
Maximum energy used kWh/M3 Process
0.6 pumping Groundwater
3.89 Desalination of seawater
1.38 Desalination of brackish groundwater
0.06 Water treatment
2.2 Techniques of Indoor Water Saving
Water is considered to be one of the most valuable resources on land and
the trend of demand is increasing rapidly mainly due to population
increase. Thus looking for new alternatives is a very important step
toward sustainability. In 1992, legislation for conserving water was
approved by Energy policy conservation acts in U.S which mandated that
all new faucet, showerheads and toilets should have the water
conservation features (Foster et al. 2007).
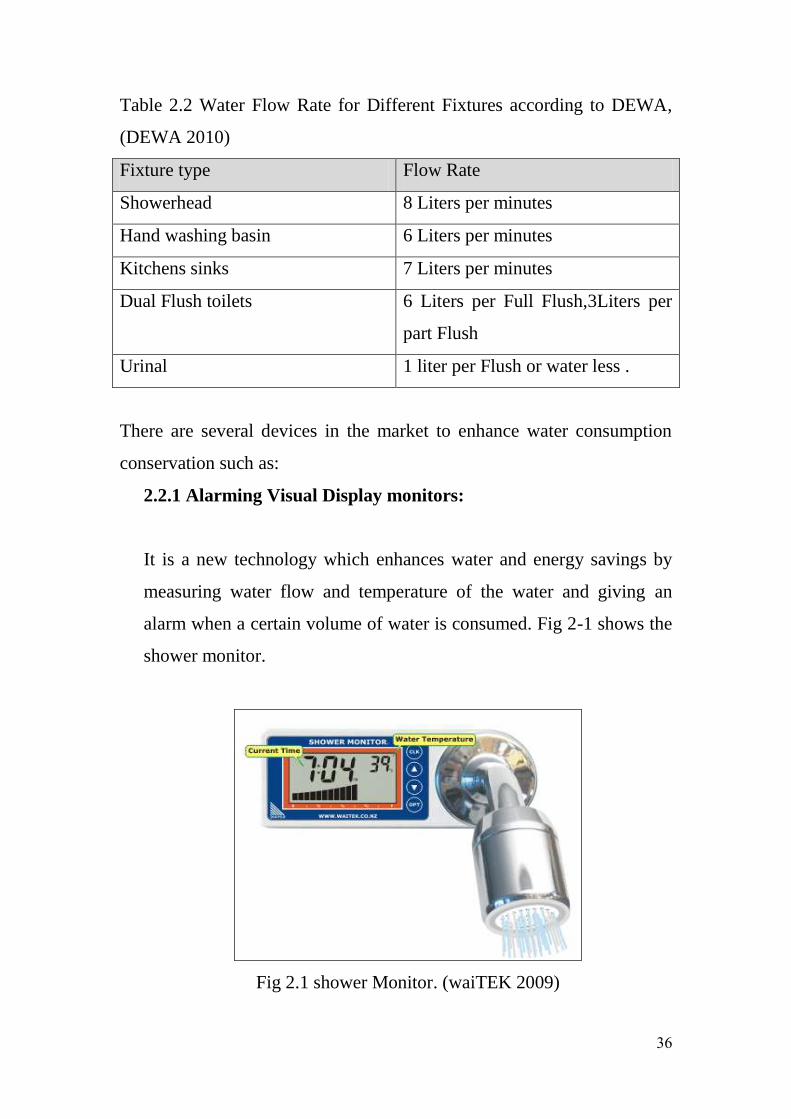
In April 2010, Dubai Electricity and Water Authority issued green
building regulations which include rules that aim to save water. The law
is mandatory for all new buildings. It states that “water conserving
fixtures must be installed meeting the criteria in below table '' (DEWA,
P11, 2010). It is noted that the regulation does not recommend specific
type of the fixtures.
36
Table 2.2 Water Flow Rate for Different Fixtures according to DEWA,
(DEWA 2010)
Flow Rate Fixture type
8 Liters per minutes Showerhead
6 Liters per minutes Hand washing basin
7 Liters per minutes Kitchens sinks
6 Liters per Full Flush,3Liters per
part Flush
Dual Flush toilets
1 liter per Flush or water less . Urinal
There are several devices in the market to enhance water consumption
conservation such as:
2.2.1 Alarming Visual Display monitors:
It is a new technology which enhances water and energy savings by
measuring water flow and temperature of the water and giving an
alarm when a certain volume of water is consumed. Fig 2-1 shows the
shower monitor.
Fig 2.1 shower Monitor. (waiTEK 2009)
37
Willis et al. (2010) conducted a study by installing alarming visual
display monitors to evaluate the effects of the device on shower end
users water and energy saving. The shower device has ability to lock
water consumption at 40 Liters. In addition to display the reading of
the water flow rate, duration and temperature, this enables households
to shower more efficiently. Also at the end of prearranged shower
duration it maintains for one minute time to alarm that, it is the time to
quit the shower. At the end of the study, there was an average of 27%
reduction of water consumption for shower which resulted in
additional saving in energy.
2.2.2 Low Flow Fixtures:
There are various types of low flow fixtures. Several types are listed
below:
A-High efficiency toilets
Which have been defined by EPA in U.S and the pluming industry; as
a toilet that flushes with an average of 20% less water per flush than
the conventional toilet. One of those toilets is dual flush toilets which
are designed for slight and excessive flush with maximum flush
volume 1.28 Gallons per flush (NAHB 2001).
The second type is water saving cisterns which complies with the
regulation 6 L per Flush. The third type is delayed flush cisterns which
stops the cistern from becoming full of water before the flush is
completed (Ideal standard 2005).
38
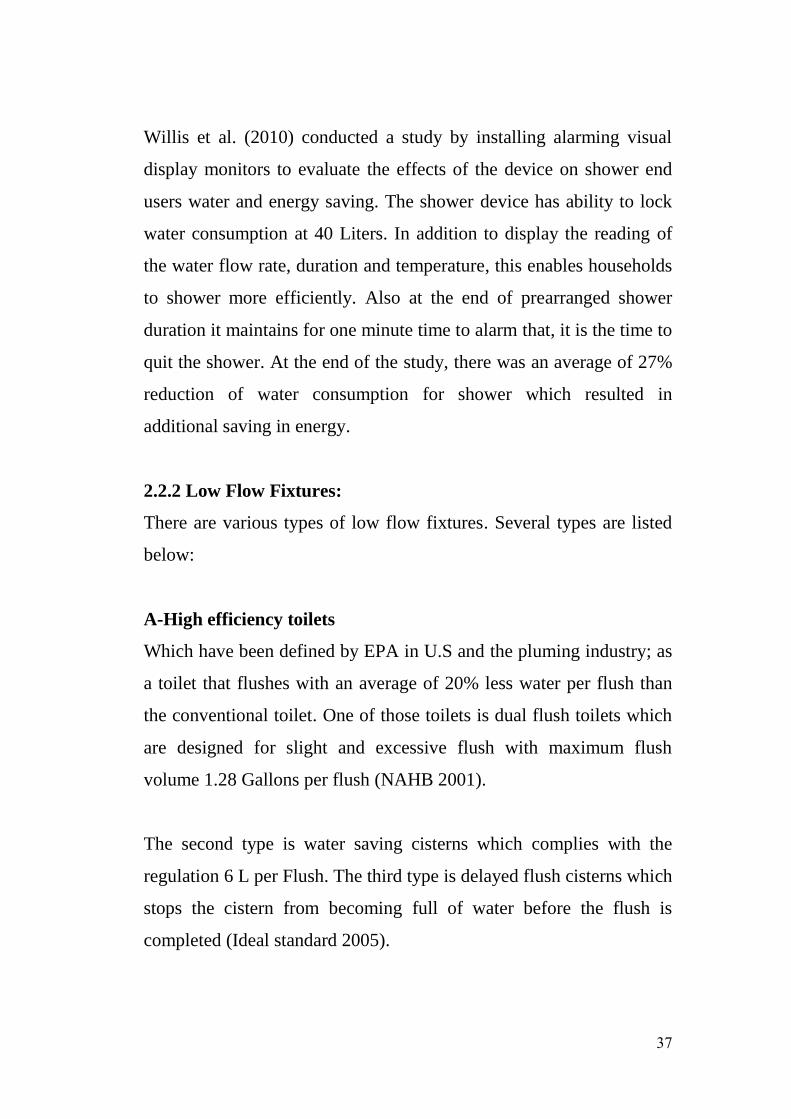
B-Shower Head
The ordinary shower head supplies up to 25 Liters per minute. Thus
installing a water restrictor between the water valve and the shower
hand can reduce the flow up to 9 Liters per minute (Ideal standard
2005).
Fig 2.2 showerhead (EPA 2010)
A study conducted in U.S.A showed that the use of lower flow
showerheads can save up to 27 liters each day per person. It also saves
an equivalent of 444 kWh of energy used for water heating per person
(Roaf 2007).
C- Dry Urinals:
Although dry urinals have been known since many years in Europe,
they were recently effectively used due to rising cost of water and
waste water bills. There are two types of dry urinal. The first type is
the Traps with floating sealing liquid system (see Fig 2.3) where it
traps urinal with higher viscosity floating sealing liquid, and do not
mix it with water so, the urine flows below it which prevents
unpleasant odors from spread out. Thus using such sanitary ware
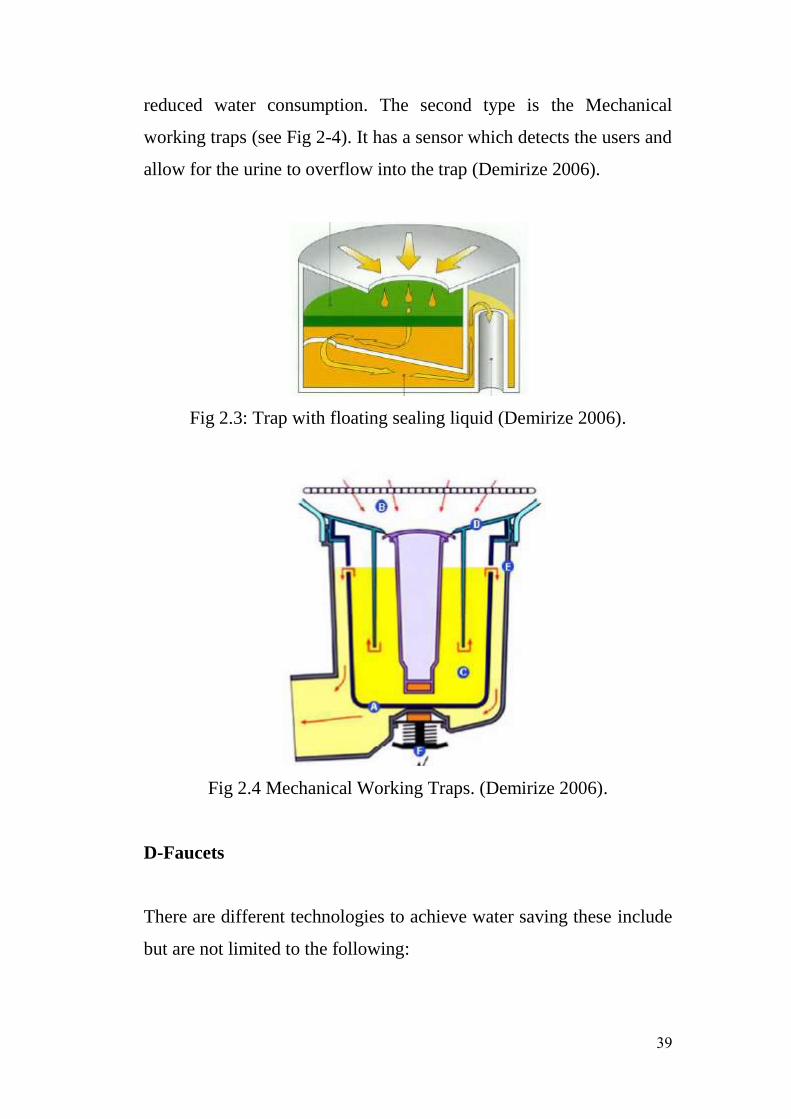
39
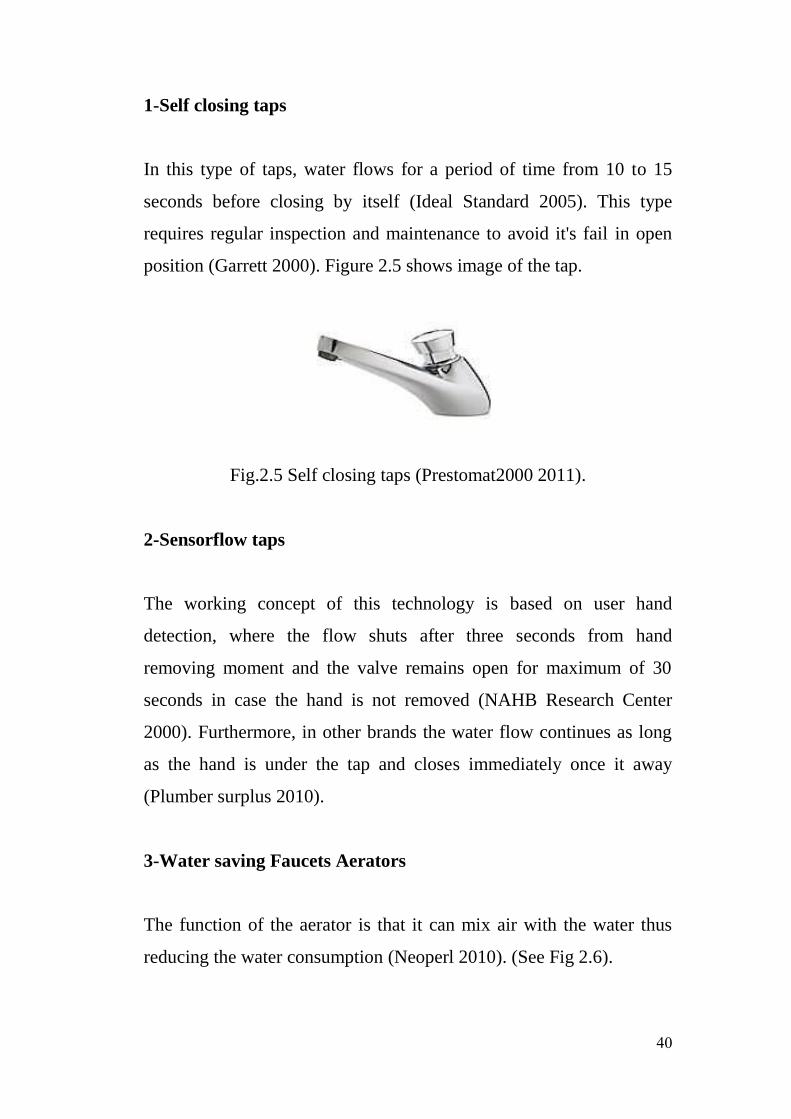
reduced water consumption. The second type is the Mechanical
working traps (see Fig 2-4). It has a sensor which detects the users and
allow for the urine to overflow into the trap (Demirize 2006).
Fig 2.3: Trap with floating sealing liquid (Demirize 2006).
Fig 2.4 Mechanical Working Traps. (Demirize 2006).
D-Faucets
There are different technologies to achieve water saving these include
but are not limited to the following:
41
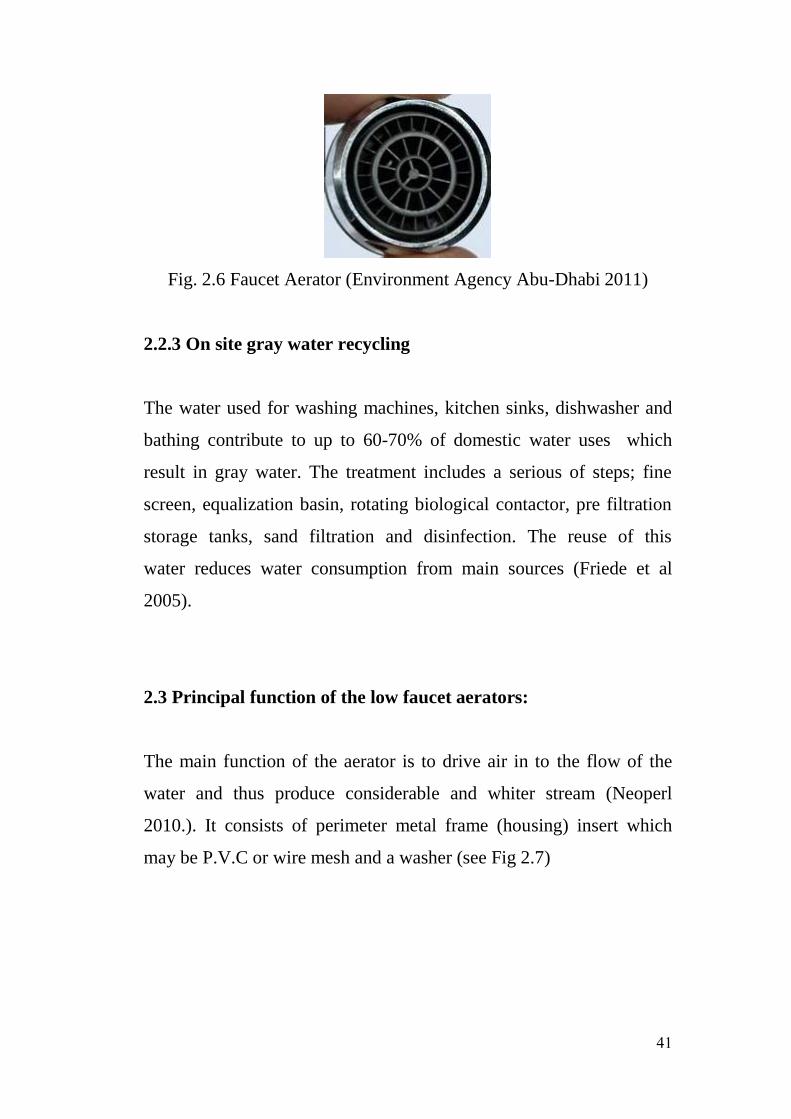
1-Self closing taps
In this type of taps, water flows for a period of time from 10 to 15
seconds before closing by itself (Ideal Standard 2005). This type
requires regular inspection and maintenance to avoid it's fail in open
position (Garrett 2000). Figure 2.5 shows image of the tap.
Fig.2.5 Self closing taps (Prestomat2000 2011).
2-Sensorflow taps
The working concept of this technology is based on user hand
detection, where the flow shuts after three seconds from hand
removing moment and the valve remains open for maximum of 30
seconds in case the hand is not removed (NAHB Research Center
2000). Furthermore, in other brands the water flow continues as long
as the hand is under the tap and closes immediately once it away
(Plumber surplus 2010).
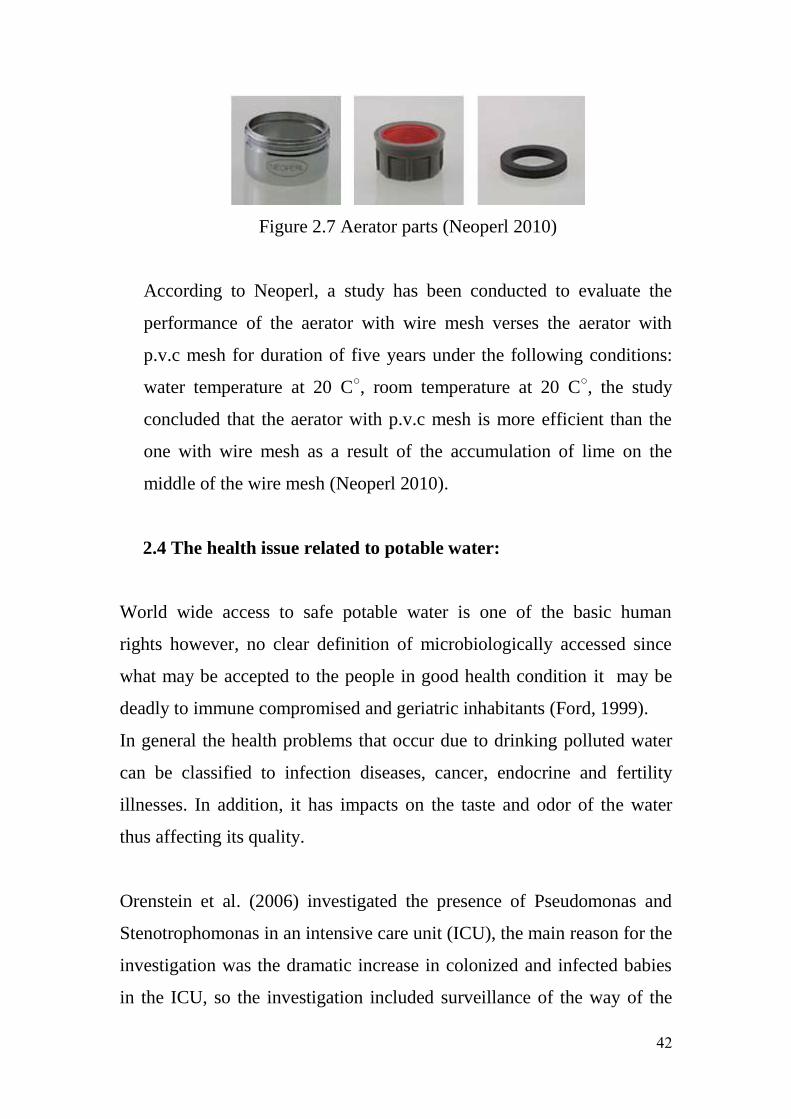
3-Water saving Faucets Aerators
The function of the aerator is that it can mix air with the water thus
reducing the water consumption (Neoperl 2010). (See Fig 2.6).
41
Fig. 2.6 Faucet Aerator (Environment Agency Abu-Dhabi 2011)
2.2.3 On site gray water recycling
The water used for washing machines, kitchen sinks, dishwasher and
bathing contribute to up to 60-70% of domestic water uses which
result in gray water. The treatment includes a serious of steps; fine
screen, equalization basin, rotating biological contactor, pre filtration
storage tanks, sand filtration and disinfection. The reuse of this
water reduces water consumption from main sources (Friede et al
2005).
2.3 Principal function of the low faucet aerators:
The main function of the aerator is to drive air in to the flow of the
water and thus produce considerable and whiter stream (Neoperl
2010.). It consists of perimeter metal frame (housing) insert which
may be P.V.C or wire mesh and a washer (see Fig 2.7)
42
Figure 2.7 Aerator parts (Neoperl 2010)
According to Neoperl, a study has been conducted to evaluate the
performance of the aerator with wire mesh verses the aerator with
p.v.c mesh for duration of five years under the following conditions:
water temperature at 20 C○, room temperature at 20 C
○, the study
concluded that the aerator with p.v.c mesh is more efficient than the
one with wire mesh as a result of the accumulation of lime on the
middle of the wire mesh (Neoperl 2010).
2.4 The health issue related to potable water:
World wide access to safe potable water is one of the basic human
rights however, no clear definition of microbiologically accessed since
what may be accepted to the people in good health condition it may be
deadly to immune compromised and geriatric inhabitants (Ford, 1999).
In general the health problems that occur due to drinking polluted water
can be classified to infection diseases, cancer, endocrine and fertility
illnesses. In addition, it has impacts on the taste and odor of the water
thus affecting its quality.
Orenstein et al. (2006) investigated the presence of Pseudomonas and
Stenotrophomonas in an intensive care unit (ICU), the main reason for the
investigation was the dramatic increase in colonized and infected babies
in the ICU, so the investigation included surveillance of the way of the
43
baby’s life, sampling of the environment of ICU, examination of
disinfection steps of all equipment and assessment of hand cleaning way.
The pathogens were not discovered except from the water aerators where
the revision of the maintenance procedures of the plumbing system
proved periodical cleaning of the aerators. Although the aerators had been
installed since 1992, they have never been replaced thus caked minerals
was accumulated on them. The aerators were changed and the number of
infected babies has dramatically decreased. The researchers concluded
that water aerators contamination plays a crucial role in ICU outbreak
with gram-negative organisms.
Kappstein et al. (2000) investigated outbreak of bacterial in pediatric
patients which resulted from Acientobacter Junii, the investigation
included many environment of water and air cultures from the rooms in
the affected area. All samples were negative except one from faucets
aerators in staff rooms, the aerators were made from wire mesh which
allows the sediments from the water pipe to accumulate and enhance the
growth of bacteria.
Weber et al. (1999) pointed out a trace of an outbreak disease with
Stenotrophomonas maltophilia by the contamination of faucets aerators in
hospital, the aerators were made from stainless steel wire mesh.
They concluded that low contamination of potable water in the hospital
led to bacterial magnification on the aerators thus the pollution of the
faucets aerators may act for nosocomial hazard in hospitals.
Wang et al. (2009) conducted a study to evaluate the relationship between
the outbreak of infection caused by non-fermenting gram-negative
bacteria (NFGNB) and the contamination of faucets in intensive care
44
units in Taiwan. They remarked that 30% of the checked faucet aerators
were contaminated with some species of NFGNB while other species of
NFGNB cultured from the patients could not be traced to faucet aerators.
On the other hand Huang and Lin (2007) conducted a study for 27 weeks
to evaluate the effect of faucets aerators and laminar devices in promoting
the growth of Legionella species in a hospital in Taiwan. Even though the
water system in the hospital was contaminated with Legionella, they
could not find significant difference in the concentration of Legionella in
the faucets with or without aerators. At the end of their study they were
not able to confirm the previous studies which showed that the aerators
installation may promote the Legionella growth in it.
2.5 Heterotrophic bacteria
Heterotrophic Bacteria Counts (HPCs) which are also known as standard
plate count or total bacterial compromise aerobic and anaerobic bacteria
that extract their carbon and energy from organic nutrients for their
growth. They can be found in air, soil, food and water (Allen, M. 2004).
Table 2.3 illustrates HPC bacteria represent in drinking water.
Table 2.3 HPC bacterial in Potable Water, (Mrlechavallier et al. 1980,
Herson and Victoreen 1980, and Wacker 1995 cited in Allen 2004)
HPC “genera “ survive in potable water
Acinetobacter Klebsiella pneumonia
Acinomycetes Methylomonas
Alcaligenes Micrococcus
Aeromonas Mycobacterium
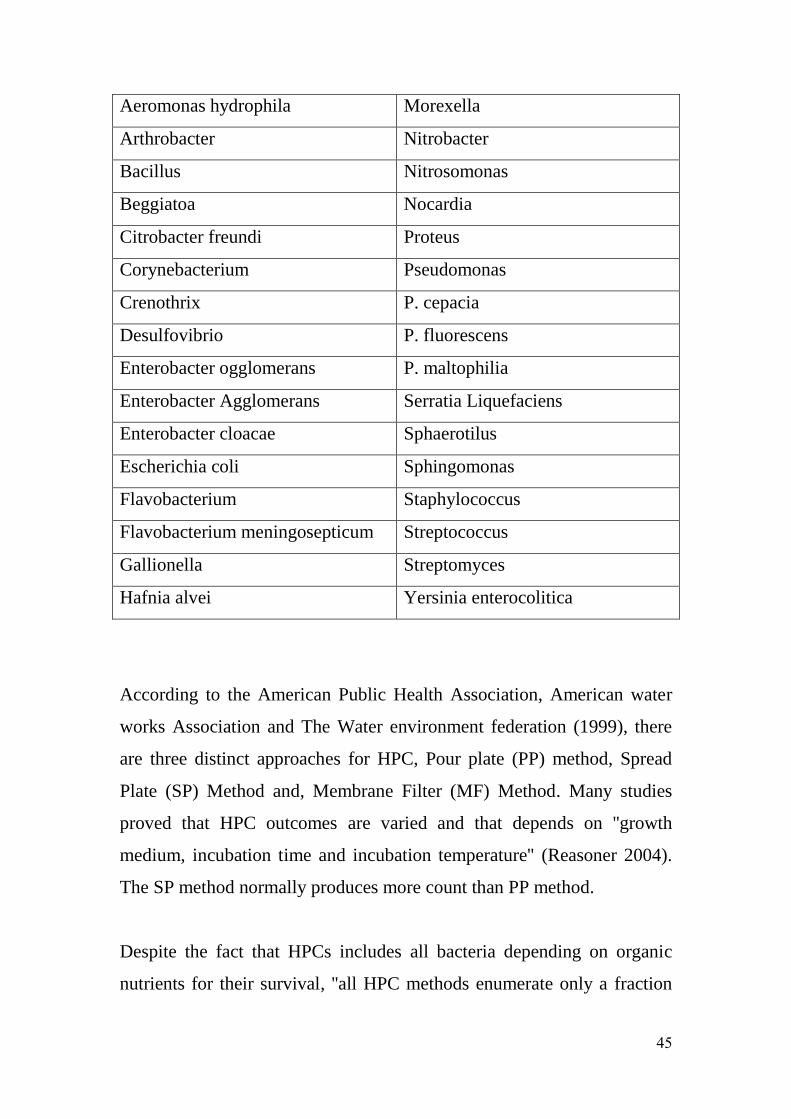
45
Aeromonas hydrophila Morexella
Arthrobacter Nitrobacter
Bacillus Nitrosomonas
Beggiatoa Nocardia
Citrobacter freundi Proteus
Corynebacterium Pseudomonas
Crenothrix P. cepacia
Desulfovibrio P. fluorescens
Enterobacter ogglomerans P. maltophilia
Enterobacter Agglomerans Serratia Liquefaciens
Enterobacter cloacae Sphaerotilus
Escherichia coli Sphingomonas
Flavobacterium Staphylococcus
Flavobacterium meningosepticum Streptococcus
Gallionella Streptomyces
Hafnia alvei Yersinia enterocolitica
According to the American Public Health Association, American water
works Association and The Water environment federation (1999), there
are three distinct approaches for HPC, Pour plate (PP) method, Spread
Plate (SP) Method and, Membrane Filter (MF) Method. Many studies
proved that HPC outcomes are varied and that depends on ''growth
medium, incubation time and incubation temperature'' (Reasoner 2004).
The SP method normally produces more count than PP method.
Despite the fact that HPCs includes all bacteria depending on organic
nutrients for their survival, ''all HPC methods enumerate only a fraction
46
or subpopulation of heterotrophic bacteria''. Also it is impractical to
specify the ratio of each subpopulation (Allen 2004). Moreover, some
bacteria such as Legionella and Myco-bacterium avian complex use
organic nutrients for their survival however, they are not growing on HPC
media accordingly, in order to investigate the presence of Legionella in
potable water, other standard methods should be followed (Allen 2004).
The HPC Methods are useful in supervising the microbiological water
quality in distribution system (Grabow 1996, Edberg, Allen 2004 and
Pavlov et al 2004 cited in Francisque at al 2009). Furthermore, according
to Reasoner (1990), HPCs methods are very important in the evaluation
of bacterial growth on elements utilized in the distribution system, and
bacterial re-growth in treated potable water (cited in Allen et al. 2004).
Many studies concluded that there is no relationship between medical
problem and high concentration of HPC genera in drinking water and,
there is insufficient clinical evidence to substantiate specification of
maximum level of HPC concentration in potable water. According to
Pavlov et al 2004, in Japan and Germany the maximum level of HPC
bacteria is 100 cfu/ml. Furthermore, in North America the upper limit is
500 cfu/ml (cited in Francisque et al. 2009). In Dubai, a threshold of 500
cfu/ml is set as a standard for surveillance of the drinking water quality.
According to the U.S Safe Drinking Water Act, the national primary
drinking water regulation, the maximum level of HPC is 500 cfu/ml.
''There is no consistent correlation between results from PP method and
any other approved HPC method; therefore another HPC method cannot
be substituted for the purpose of the U.S drinking water regulations''(

47
Reasoner 2004, p.313). In this study HPC test will be used as tool to
evaluate the bacterial growth and re-growth in the faucet aerators.
2.6 Pathogens in drinking water:
There are many types of bacteria but; it is only the pathogens that might
harm the human health. Pathogens that may produces disease through
potable water can be classified based on their size in to Helminths
(>100µ), protozoa (5-100µm), Bacteria (0.5-1µm) and viruses (0.01-
0.1µm). Therefore it is essential to treat the water prior it reaches to
consumers; however there are many source of contamination during the
stages of the water supply cycle illustrated in the following table.
Table 2.4 Sources of water contamination, (Gray 2008)
Major sources of Potable water Contamination Natural , land use , pollution Resource Unit process effectiveness ,
chemicals add to purify the water Treatment
Plumbing and fixtures material,
organism, pollution Distribution
Pluming and fixtures material,
pollution deficient fittings Home plumbing
48
2.7 Factors enhancing the growth of microbiological organism in
the water distribution system:
Many studies pointed out that bacteria have a potential for re-growth
in the distribution system. This growth is influenced by many factors
which create an ideal environment for bacterial growth. These factors
are presented below:
2.7.1 Temperature of the water
Temperature plays a central role in bacterial growth since the main
structure of the bacteria is the three-dimensional protein which acts as
membrane transport mechanism and as an enzyme in addition to
acting as a structural component. The three dimensional proteins of
the bacteria is due to its hydrogen bonds which are weak. Thus
increasing the temperature may result in breaking the bonds
consequently affecting the bacterial function (Strelkauskas, J. et al.
2010).
Bacteria may be classified based on the temperature of the media
where it can survive in. Some kinds of bacteria can live between 0 C○
to 15 C○ which are called Psychrophiles bacterial, while
Psychrotrophs can survive in Temperature from 20 C○ to 30 C
○.
Mesophiles can exist in temperatures between 25 C○ to 40 C
○ which is
moderate degrees and include pathogen bacterial to the human. Finally
Thermophiles bacterial can grow at Temperature above 45 C○
(Strelkauskas, J. et al. 2010)
49
In general, the presence of coliform has been noted when the water tap
temperature was more than 15 C○ (Bartram et al 2003). Beside that
many studies showed that the hot water system plays a key role in
promoting the existence of Legionella which normally develop in
temperatures between 20 C○ and 45 C
○. Moreover, it can survive in
higher temperature up to 60 C○.
Furthermore, the United Kingdom Department of health and social
security code of practice prefers the storage of cold water below 20 C○
and the hot water should be stored at 60 C○ to 65 C
○ (Bartram et al.
2003).
Francisque et al. (2009) noticed that HPC bacterial level was not
discovered in 75% of water samples collected from water distribution
system when water temperature was less than 4 C○. When water
temperature raised to more than 18 C○ a significant increase in HPC
level was identified.
2.7.2 Plumbing Materials
Rogers et al. (1994) conducted a study to investigate the effects of the
plumbing materials on the biofilm formation and Legionella
Pnumopila. They concluded that plastic pipes enhance the
concentration of the biofilm in contrast to the copper pipes which limit
the colonization of the water system by Legionella. Moritz et al.
(2010) noted in their experiment that biofilms presence in copper
materials were less in comparison with plastic and elastomeric
materials.
51
On the other hand Camper (2003) concluded that iron pipes have more
potential of enhancing bacterial growth than P.V.C pipes (Shane
2008). Corrosion also influences the roughness of the pipe and
accordingly, promotes the bacterial re-growth in the distribution
system (Niqutte 2000 in Shane 2008, p.32)
According to the manufacturer Neoperl (2010), closing water faucets
in hospitals leads water drops to be trapped inside the aerator and in
presence of warm temperature thus evaporate the water and leave
sediments as source of food for biofilm. Also, as previously
mentioned, the function of the aerator is to mix air with water to
produce an aerated stream of water. In the case of health care
buildings, the air around the faucets mostly contains bacteria, thus
mixing the water with this polluted air can lead to its contamination
(Neoperl 2010).
Hargreaves et al. (2001) investigated the water contamination in a
hospital following a flood in Grand Forks. The water samples entering
the hospital from the water supply system comply with water quality
standard however, the water from faucets was contaminated. Water
samples were collected randomly and HPC test was performed.
Statistical data was analyzed via Epi Info. Version 6. A comparison
was performed between the HPC results from 110 manual faucets
verses two brands of electronic faucets, 34 number of brand A
faucets and 25 number of brand B faucets. The results showed that
HPC exceeded the limit in 22% of the electronic faucets where as 11%
of the manual faucets exceeded the limit. Furthermore, there was a
51
significant different in HPC levels from electronic faucet type A and
B.
A hyper chlorination treatment for the water supply was performed
then after 2 months, similar tests were conducted. The results revealed
that brand A faucets promoted the HPC growth. Also samples from
spigot (plumbing fixtures) which were recently fixed in the water pipe
were tested and the results showed that HPC level is below the
threshold level.
All brands A electronic Faucets were replaced with manual faucets.
Water samples from those faucets were tested and the results revealed
that the HPC level is below the threshold level and matches the level
from other faucets. The researchers concluded that a certain brand of
electronic faucets can support microbial re-growth in water.
2.7.3 Water flow velocity
Ollas et al. (2003) in Lehtola et al. (2006) concluded that, increasing
the water flow velocity could prompt the production of bacterial
number in biofilm. Furthermore, Cloete et al. (2003) in Lehotal et al
(2006) noted that the biofilm was separated when the flow velocity
was 3m/sec.
Ciesilski et al. (1984) conducted a study to investigate the role of
stagnation and obstruction of water flow in the isolation of Legionella
pneumophila from hospital plumbing. They suggested that the
elimination of stagnation in hot water tanks may reduce the L
pneumophila concentration.
52
2.7.4 Biodegradable Organic matter
Momba (2000) found that biodegradable organic matter in treated
water or from material in contact with drinking water provides the
foundation for biofilm re-growth (Shane 2008). Additionally,
Francisque et al. (2009) observed that HBC level was very high in
potable water samples because of biodegradable organic matter in
the water.
2.7.5 pH
pH is a value that represents an indication of the alkalinity or acidity of
the water. The pH meter contains values ranging from 1 to 14, where a
value of 1 illustrates the highest level of acidity and value of 14 illustrates
the highest level of alkalinity. Most of bacteria favor the neutral of pH 7
for its growth, while some of them have the ability to grow in acidic
environment such as acidophilus.
Carter et al. (2000) found a correlation between pH and HPC bacterial.
Francisque et al. (2009) tested many water samples for a period of three
years and, found that higher pH level in water increases HPC
concentration, also they observed that HPC level exceeds 100cfu/ml
when pH of the water is beyond 8.5.
53
2.7.6 Existence of disinfectant residual
Mombo (2000) noted that, providing chlorination reduced bacterial
number in water. Furthermore, re-growth of bacteria occurred after the
chlorination residual was decreased (Shane 2008).
Nguyen et al. (2008) conducted an investigation for the reason of water
taste and odor complaints by residents of two new buildings which were
occupied immediately after completion. The Buildings have water saving
aspects. The water distribution system was evaluated by using
heterotrophic plate count (HPC), Aeriginosa and Legionella tests. The
results showed that, water taste and odor was caused due to decay of
chlorination residual in the water distribution system. The Researchers
suggested that minimizing water residence time in the tanks in addition to
limiting nutrient at the water treatment plant might reduce microbial re-
growth.
With reference to a study conducted by Francisque at al. (2009), it
showed that the presence of free residual chlorine in water distribution
system with concentration less than 0.3mg/l enhances the growth of HPC
bacterial. Consequently, the researchers advised to keep free residual
chlorine concentration higher than 0.3 mg/l in order to avoid high level of
HPC bacterial.
2.8 Aims and Objectives of the study:
Currently the movement of sustainable design of the built environment is
attempting to incorporate different solutions to preserve the earth's
54
resources, mainly its energy and water resources. However, sometimes
some unintentional fault occurs during the implementation of sustainable
practice. For example, utilizing faucet aerators in water conservation may
accomplished with negative impact on human health. So the question
may rise; does this usage cover all aspects related to sustainability?
Consequently the aims and objectives of the study will be mentioned
below.
The aims of the study:
Indeed the research has main and minor aims. The main aim is to
investigate the assumption which evokes that bacterial growth may be
augmented by using faucets aerators. The secondary aim is to evaluate the
current maintenance practice of the aerators, which is necessary to avoid
any risk to the human health due to bacterial growth.
The objectives of the study:
There are many objectives to be achieved through this research as
explained below:
In the beginning of the study, an interview with facility management of
the building where the experiment is conducted, in order to know their
current practice for the maintenance of the existing aerators, also to set
different water pressure in different washrooms with 2.5, 2 and 1.5 water
bar consequently it will affect the water flow.
Three different types of the aerators in addition to existing water spray
type are under study and are being monitored is through control points
(faucets without aerator). The study period will be for six months in 4-
55
weeks cycle from October to March, in which water samples from the
faucets will be collected in each cycle.
A bacterial counting approach will be used HPC Pour plate method to test
the water samples in order to monitor potable water quality changes
after treatment. Other parameters which will be tested in each cycle
include water temperature, inside air temperature, water flow rate and pH
of the water. The independent variables will be time, water pressure and
type of the faucets aerators , while the dependent variables will be the
total bacterial count and water flow rate.
The concentration of the bacteria is compared to standard values, taking
into consideration the time consumed by the bacteria to reach to critical
levels. Based on the results recommendation for the best maintenance
schedule will be proposed at the end of the study.
56
Chapter 3-Methodology
3.1 Previous Methods
As discussed in the previous chapter that bacterial re-growth in water
distribution system is influenced by many factors. One of these factors is
the plumbing fixtures such as faucet aerators. As the aerator hindering the
water flow thus accumulates sediment on the internal side of the aerator
which may lead to bacterial growth. In the following paragraphs
presentations of many studies are listed to investigate factors may
enhance different outbreaks in hospitals.
Kappsstein et al. (2000) carried out a study to investigate the source of
Acintobacter Junii in a Pediatrics oncology hospital which caused an
outbreak of bacteraemia consequently; the researchers reviewed the
medical charts of the patients to assess factors and which source of the
bacteria. Two types of samples were also taken from all faucets, the 1st
type were cultured after dismantling the water aerators and immersed in
sterile saline, and the 2nd
sample which was (100Ml) of water from the
faucets after removing the aerators and allowing the water to run for a
few minutes.
It was noted that the aerators had wired mesh which accumulated
sediments from the pipe. Furthermore, environmental sampling of
surfaces and tools in different rooms in addition to air samples were taken
from air-conditioning units from the medication rooms. Finally
57
specimens were cultured from the hands of the staff working in infected
departments in the hospital.
Investigation of Junii bacteria was carried out using automatic laser
fluorescence analysis of randomly amplified polymorphic DNA. The
results showed that the bacterial type found in the patient’s bloods were
identical to the one cultured from the staff room faucets aerators, while
other cultured samples from the environment and the air were negative.
The researchers concluded that the water supply system had become
slightly contaminated and the concentration of the contamination was
greater in the aerators. Finally a new type of aerator without the wire
mesh was proposed and replaced the wire mesh aerator, water samples
were taken and analyzed. The results showed no junii bacteria.
Wang et al. (2009) conducted a study to investigate the relationship
between the colonization of nonfermentatative gram-negative bacilli
(NFGNB) in faucets aerators and the infection of patients in intensive
care units (ICUs). The study continue for four months, samples were
taken from 162 faucet aerators in seven units.
The faucets were located near the patient’s beds; however the water
samples taken from the central water supply were negative. A cotton
swab was applied to swab the internal surface of the aerators, then the
swabs were inoculated onto sheep blood agar plates and incubated at 37
C○ for 3 to 5 days, the samples of colonies were classified according to
standard. The results showed that 33% of the cultured aerators were
contaminated with NFGNB, which correlated to the infection of the
patients in ICU. The investigators concluded that the results supported
58
previous studies that contamination of the water from the faucets
developed at the point of use in hospitals.
Orenstein et al. (2006) reviewed the number of patients infected by
Pseudomonas in 2003, 2004 and 2005 in a neonatal ICU. They noted a
dramatic increase in the total number of infected babies in 2005 during
August and July. Consequently they conducted an investigation to find
out the reason for the outbreak by monitoring the cultures of all the
babies, took many samples of the ICU environment and reviewed the
disinfection procedures of all equipment. The cultures indicated that there
was no Pseudomonas in all samples except for the aerators.
In cooperation with the facility team in the hospital, a review of fitting
and maintenance records for the plumbing fixtures was carried out which
showed that: the faucet aerators had been fitted in 1992. And although
weekly surface cleaning of the aerators had taken place, the aerators had
never been changed since they had been fitted. The aerators were
dismantled and changed then, samples were collected and tested. The
results showed a reduction in infection in patients. They concluded that
the contamination of water, faucets and fixtures played a key role in
neonatal ICU outbreaks.
Ciesielski, et al. (1984) studied the cause of nosocomial Legionnaires
Disease that had taken place in a medical center. Inspection and
observation of the medical center water supply system demonstrated that
Legionella Pneumophila was presented in the system, which included the
tanks, showerheads, faucet without barriers of water flow, and faucets
with “backflow preventers, vacuum breakers and aerators ". Evaluation
of the water supply system showed that stagnation of the water in five
59
tanks supplying hot water to the center led to re-growth of the bacteria.
The study continued from late 1981 until April 1983.
On a monthly basis, 50 ml water samples were taken in sterile containers
from drain valves in the bottom of each tank after flushing the water for
10 seconds. The temperature of the water was recorded immediately after
the sampling. Showerheads were sampled monthly (using swab) from
their inner surfaces. At the end of the study 72 faucets were sampled by
swab and water samples. All samples were incubated onto ager plate at
35 C○.
The collected samples from the tanks during the initial 18 months were
found to have L. pneumophila. Subsequently an action was taken to
minimize the stagnation of the water in the tanks. After that further
samples from the tanks were taken. The results showed that the bacteria
concentrations were under the threshold level. Moreover 50% to 70% of
the samples taken from showerhead were positive although there was low
level of L. Pneumophila in the tanks. In addition three samples out of
twelve taken from the faucets were found to be positive.
Further investigation showed that the 3 positive samples were located in
laboratory area and those faucets have aerators. The aerators obstructing
the water flow caused stagnation to the water and provided a medium,
and surface for L. Pneumophila. The aerators were dismantled and kept in
70% alcohol for sterilization purposes then, further samples were taken.
The results found that after one months of use, the samples were positive
again.
61
Stojek et al. (2008) assessed the level of contamination of water supply
systems in six hospitals in Poland. Sixty seven of water samples were
collected from faucet with aerators and showerheads in the hospitals, 500
ml sterile bottles were used for sampling. A standard test was performed
to identify the presence of Legionella and non fastidious gram-negative
bacteria in the water. Agar plates were incubated for 24 hrs at 37 C○ to
detect the Legionella and non-fastidious Gram-negative respectively.
The data were analyzed using a piro-with-W-test for distribution and
spearman's rank test for correlation coefficient with the use of
STATISTICA for windows v.5.0 package. The researchers confirmed
that the aerators or other attachment on faucets or showerheads enhance
the growth of Legionella.
Weber et al. (1999) conducted a study at the University of North Carolina
Hospital to investigate why patients were infected with
Stenotrophomonas Maltophilia. Patients and environmental isolates were
inspected by pulse-field gel electrophoresis. Furthermore 100 ml water
samples were collected in sterile containers and tested using standard
methods. In addition the aerators which have stainless steel wire mesh
were removed and swab by placing them in 5ml to 10 ml of trypticase
soy broth.
A substantial environmental appraisal was carried out. They found that
faucet aerators have S. Maltophilia and concluded that low levels of
contamination in the water supply system promoted the growth of the
bacteria.
61
On the other hand, Huang and Eason (2007) reported that, faucets
aerators and laminar could not enhance the production and increase the
concentration of Legionella in a hospital in Taiwan. They built a model
that consisted of six faucets: two faucets with aerators, another two
faucets with laminar and the two remaining faucets acted as a control.
The model was sterilized prior to the commencement of the experiment
and the water flowed uniformly through all taps. The duration of the
study continued for twenty seven weeks.
500 ml of water samples were gathered from faucets then concentrated to
5 ml via pore filters of 0.22 µm. The aerators and the laminars were also
removed. Swabs were collected using BBL culture swab: Becton
Dickinson, this was by inserting into the faucets and swiveling it around
the interior surface two times clockwise and two times up and down to
take away sediment from the tap. Then the culture samples were
incubated at 37 C○ in a humidified atmosphere for 3- 7 days.
The total number of samples collected was 102 and the result showed that
the average concentration of Legionella species was 3,529 cfu/L in the
control faucet, 2412 cfu/L in faucets with aerators and 5,912 cfu/L in
faucets with the Laminar. Which indicated that, the faucet aerators has no
significant impact on Legionella growth compared to the control point
and the laminar faucet. Furthermore the Legionella species concentration
on the biofilm samples was 530 cfu/L for the control sample , 515 cfu/L
in the faucets with aerators and 647 cfu/L in faucets with the Laminar
device. The results showed that the aerators have no significant impact on
the Legionella promotion.
62
The average water flow was also checked and found and recorded at 6
L/Min for faucets with aerators, 1.2 L/Min for faucets with Laminar and
11 L/Min for control faucets. At the end Huang and Eason could not
prove the hypothesis that installation of the aerator and laminar water
flow devices may have promoted the growth of Legionella species in
hospitals.
In the light of the above studies it seems that, there is a lack of conducted
studies investigating the effect of the faucet aerators on the bacterial
growth which may compromise water quality. This research intends to
bridge such gab taking in to consideration the U.A.E as a place for the
study beside the effect of water pressure on bacterial growth as well as
the water flow rate from different types of aerators.
3.2 Selection of Research Method
Despite the fact that, there is no absolute substantial method since all
methods have their own advantages and disadvantages. So the topics of
the research and researcher awareness of the methodologies are playing a
major role in choosing the most suitable methodology for a topic which
may be led to minimize the method cons. The researcher plays a key role
in assessment of the relationship between the cause and effect in order to
back up or reject a hypothesis.
The experimental methodology has many pros as it is considered the
appropriate method for quantitative research in order to obtain reliable
data about independent variables. (Walker 2005). Beside it is popular
63
approach in scientific researches as it is distinguished by independent and
dependent variables, using control samples and focusing on finding the
correlations between cause and effect (Groat and Wang 2002).
Another advantage of the experimental method is the role of the control
element since the results are compared to the control element. Next
advantage is collection of suitable random number of samples in order to
reduce bias effect. Beside the previous advantages, using appropriate and
accurate tools in the measurements and ability to use software in
analyzing the results.
Actually it is worthy to mention that in technical research area the
experimental methodology is the most appropriate and trustworthy
method for evaluate the cause and effect. The hypothesis of this
quantitative research is that Faucet aerators might affect the re-growth of
the bacteria and the deterioration of the aerators efficiency. Consequently,
the experimental method is the only method applicable in such topic since
the total bacteria in water and the water flow rates will be measured
which cannot be achieved without experiment. As seen before, previous
studies showed that only one method was applied to such research which
is the experimental method. So in this research an experimental method
was chosen to test the hypothesis.
3.3 Aerators used in the current experiment
In the conducted experiment four types of the aerators were chosen from
the local market in U.A.E are described as below:
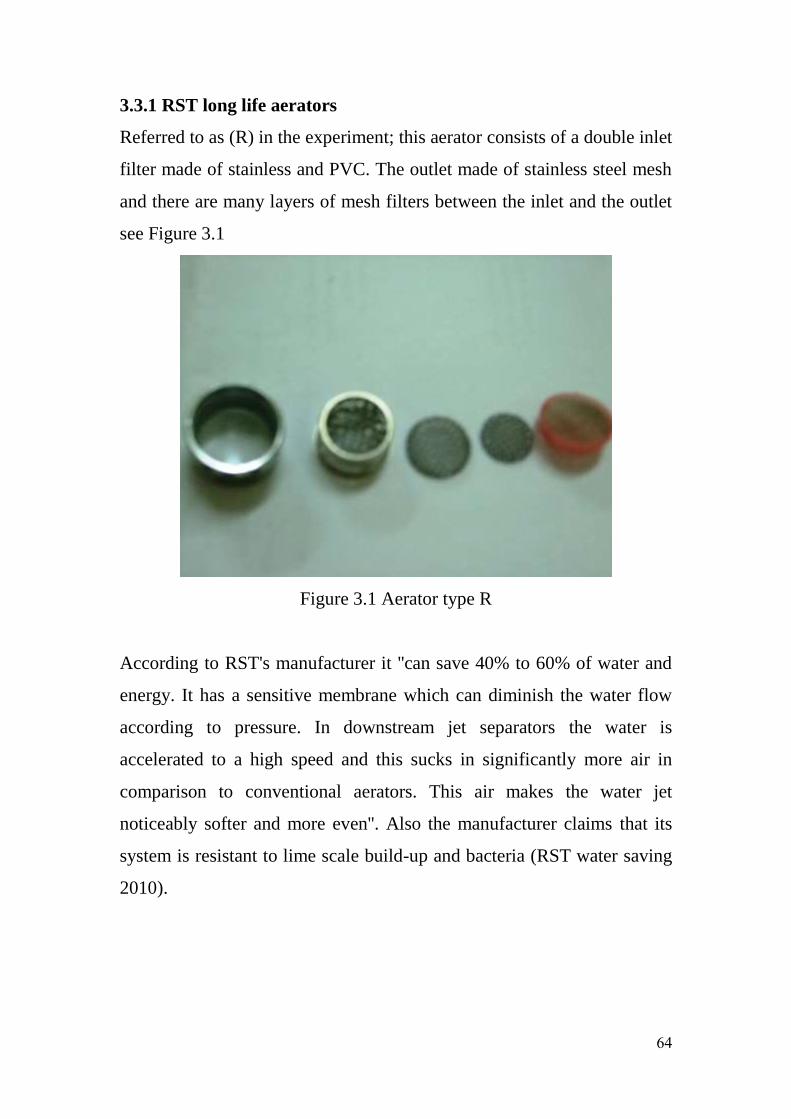
64
3.3.1 RST long life aerators
Referred to as (R) in the experiment; this aerator consists of a double inlet
filter made of stainless and PVC. The outlet made of stainless steel mesh
and there are many layers of mesh filters between the inlet and the outlet
see Figure 3.1
Figure 3.1 Aerator type R
According to RST's manufacturer it ''can save 40% to 60% of water and
energy. It has a sensitive membrane which can diminish the water flow
according to pressure. In downstream jet separators the water is
accelerated to a high speed and this sucks in significantly more air in
comparison to conventional aerators. This air makes the water jet
noticeably softer and more even''. Also the manufacturer claims that its
system is resistant to lime scale build-up and bacteria (RST water saving
2010).
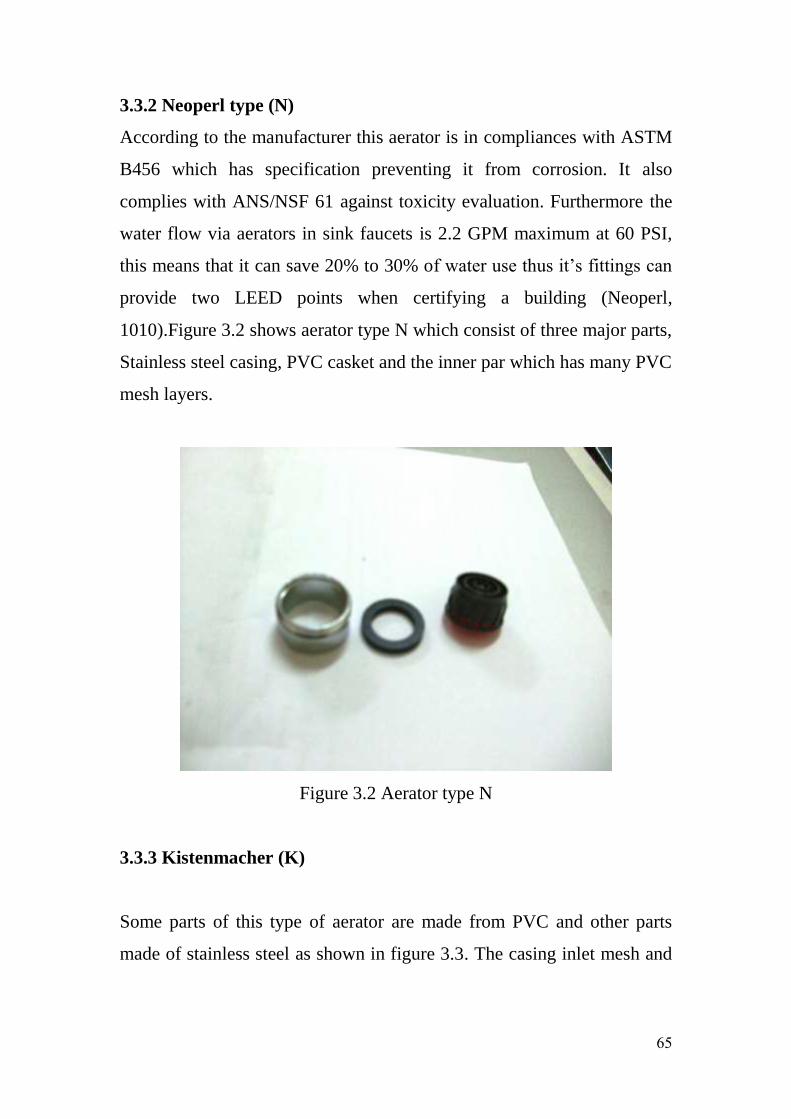
65
3.3.2 Neoperl type (N)
According to the manufacturer this aerator is in compliances with ASTM
B456 which has specification preventing it from corrosion. It also
complies with ANS/NSF 61 against toxicity evaluation. Furthermore the
water flow via aerators in sink faucets is 2.2 GPM maximum at 60 PSI,
this means that it can save 20% to 30% of water use thus it’s fittings can
provide two LEED points when certifying a building (Neoperl,
1010).Figure 3.2 shows aerator type N which consist of three major parts,
Stainless steel casing, PVC casket and the inner par which has many PVC
mesh layers.
Figure 3.2 Aerator type N
3.3.3 Kistenmacher (K)
Some parts of this type of aerator are made from PVC and other parts
made of stainless steel as shown in figure 3.3. The casing inlet mesh and
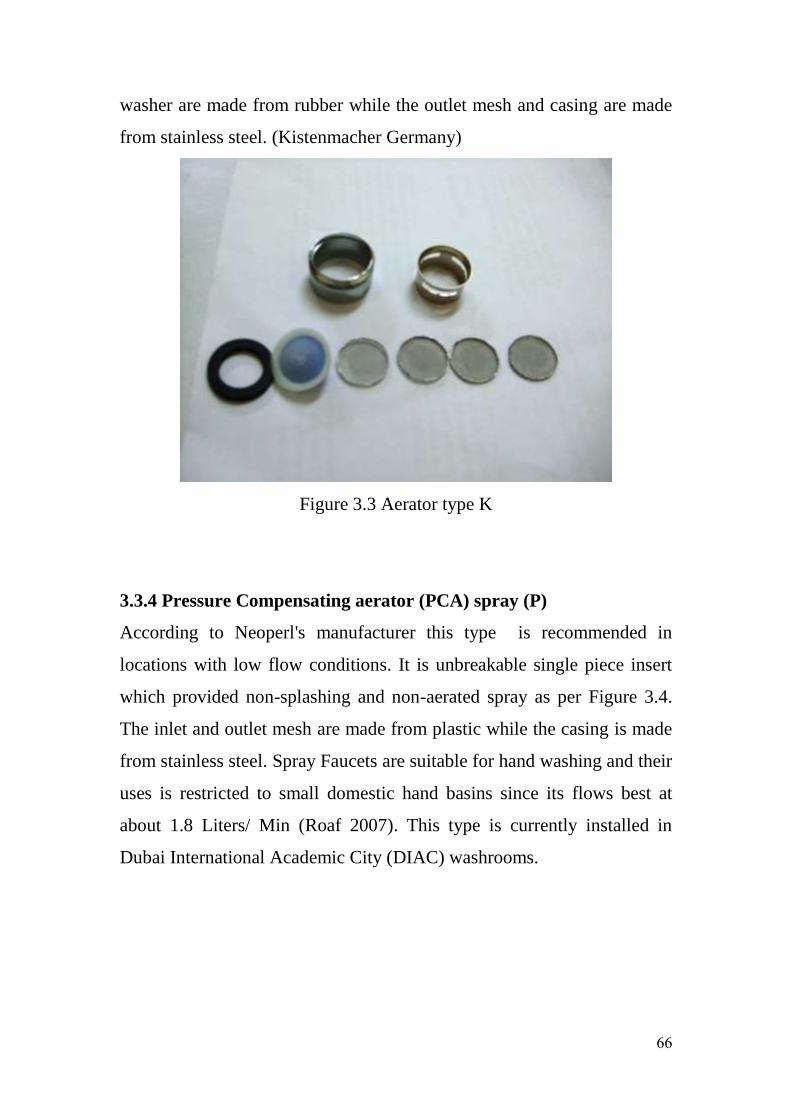
66
washer are made from rubber while the outlet mesh and casing are made
from stainless steel. (Kistenmacher Germany)
Figure 3.3 Aerator type K
3.3.4 Pressure Compensating aerator (PCA) spray (P)
According to Neoperl's manufacturer this type is recommended in
locations with low flow conditions. It is unbreakable single piece insert
which provided non-splashing and non-aerated spray as per Figure 3.4.
The inlet and outlet mesh are made from plastic while the casing is made
from stainless steel. Spray Faucets are suitable for hand washing and their
uses is restricted to small domestic hand basins since its flows best at
about 1.8 Liters/ Min (Roaf 2007). This type is currently installed in
Dubai International Academic City (DIAC) washrooms.
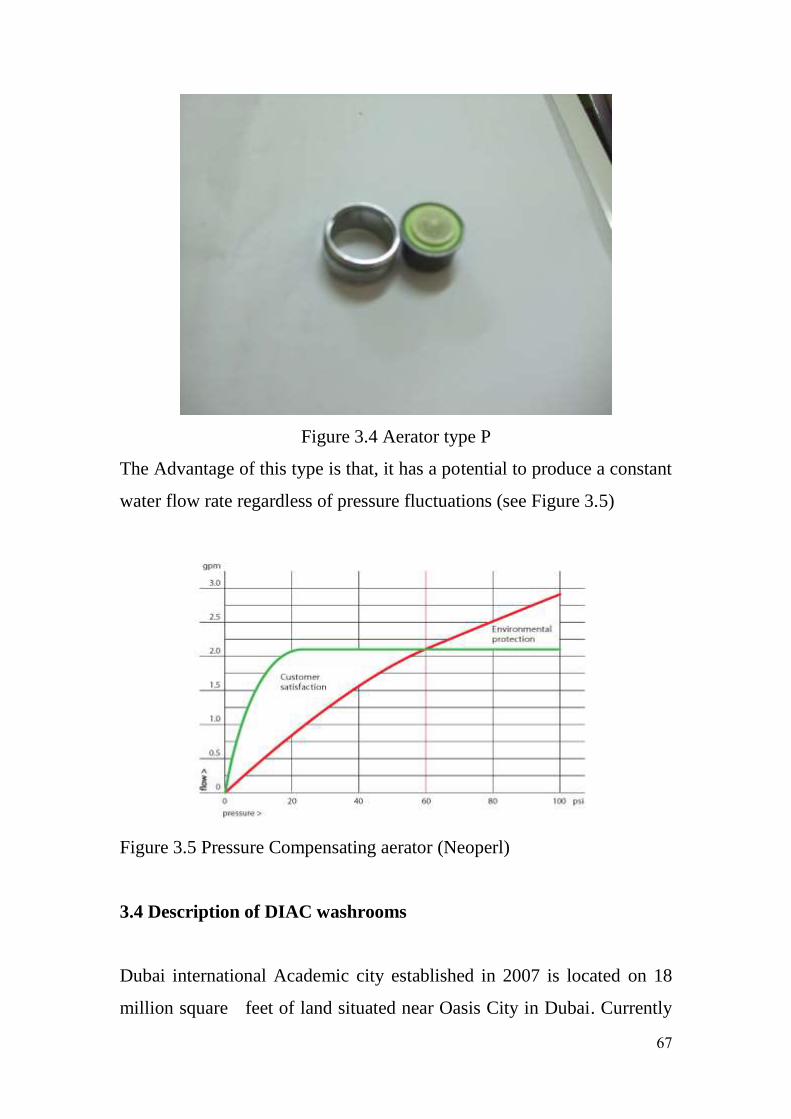
67
Figure 3.4 Aerator type P
The Advantage of this type is that, it has a potential to produce a constant
water flow rate regardless of pressure fluctuations (see Figure 3.5)
Figure 3.5 Pressure Compensating aerator (Neoperl)
3.4 Description of DIAC washrooms
Dubai international Academic city established in 2007 is located on 18
million square feet of land situated near Oasis City in Dubai. Currently
68
it compromises three phases; each phase contains four academic
buildings. Phase three which compromises buildings 9, 10, 11 and 12 was
certified as LEED silver (Al Mashni 2009).
The water supply system consists of reinforced underground water tanks
which receive water from Dubai Electricity and Water Authority
(DEWA). The water is pumped from the tank through 150 mm PVC pipe
into 100 mm PR. PVC pipes are located inside shafts then the pipes
branched in to the washrooms. The branch Pipes made from PR. PVC
pipe of 16 mm to 25 mm for cold water and 20 mm PRP pipe for hot
water (see figure A.1, A.2 in the appendix A). The washrooms are
located on each floor between the buildings. Some washrooms have five
washbasins and other have seven. (See the photo A.3 in the appendix A).
According to Dubai Municipality (D.M) regulations, all medical health
care and commercial centers should periodically carryout water sampling.
Tests and be reported to them. If the result exceeds the threshold level set
by D.M then water treatment should be done next retested. According to
DIAC facility management, this practice is not applied in DIAC. This
condition made DIAC proper choice to conduct the experiment without
any interference beside it is easy to access it in any time.
3.5 Experimental procedures
The most important feature of the experimental method, is finding the
relationship between independent and dependent variables in order to
prove the hypothesis. In this study water pressure and aerator types are
considered as independent variables while bacterial concentration and
water flow are considered to be dependent variables. Beside parameters
69
such as water temperature and pH levels along with the air temperature
inside the washrooms were recorded.
A request through British University in Dubai was sent to DIAC
management to get permission to conduct the experiment. A meeting with
the facility management department was conducted to understand their
practice in the maintenance of the water supply systems during the
meeting they revealed that; usually every six month there is maintenance
for the existing aerators. Accordingly the next maintenance will be
conducted after six months thus the experiment results would not be
compromised. In addition they mentioned that no treatment could be
carried out on DIAC campus. Furthermore, water tank location and water
supply pipe type and size were obtained.
The wash rooms under study were chosen on a condition that they should
be on a regular basis used by most consumers in order to avoid bias
which could resulted from stagnation of the water in the aerators.
Consequently washrooms on the ground floor between buildings 9-10,
10-11 and 11-12. In addition to, washroom on fifth floor between
buildings 9-10 were chosen. The old plumbing fixtures of the washbasins
were dismantled and four different types of the aerators (total 16 no.)
were labeled and sterilized using Alcohol and installed.
Three different water pressure were set; 2.5 water bar on 5th
floor
between buildings 9-10, 2 bar on ground floor between buildings 9-10
and 11-12 and 1.5 bar on ground floor between buildings 10-11. Indeed it
was impossible to set water pressure for more than 2.5 bar due to the
facility management recommendations.
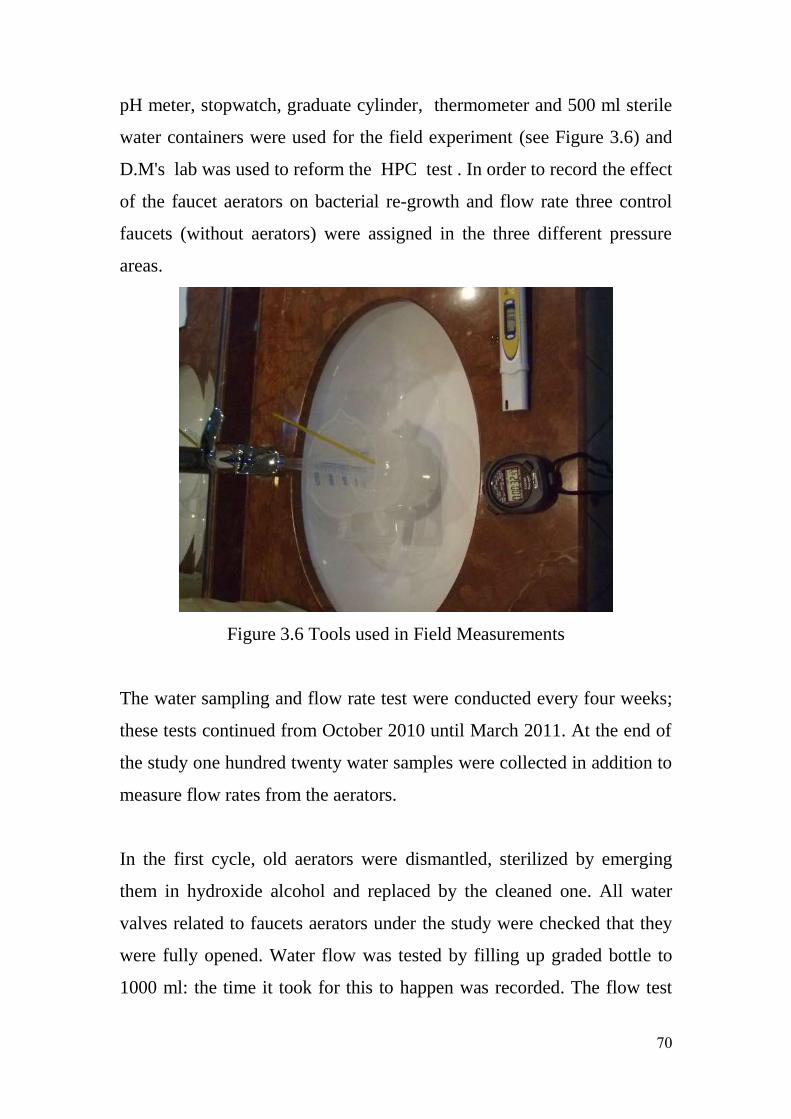
71
pH meter, stopwatch, graduate cylinder, thermometer and 500 ml sterile
water containers were used for the field experiment (see Figure 3.6) and
D.M's lab was used to reform the HPC test . In order to record the effect
of the faucet aerators on bacterial re-growth and flow rate three control
faucets (without aerators) were assigned in the three different pressure
areas.
Figure 3.6 Tools used in Field Measurements
The water sampling and flow rate test were conducted every four weeks;
these tests continued from October 2010 until March 2011. At the end of
the study one hundred twenty water samples were collected in addition to
measure flow rates from the aerators.
In the first cycle, old aerators were dismantled, sterilized by emerging
them in hydroxide alcohol and replaced by the cleaned one. All water
valves related to faucets aerators under the study were checked that they
were fully opened. Water flow was tested by filling up graded bottle to
1000 ml: the time it took for this to happen was recorded. The flow test
71
was repeated three times for each faucet then, the average was computed.
500 ml of water samples were labeled and collected from the faucet
aerators, control points and water tank.
The Temperature of the water from the faucet aerator and water tank were
measured using a thermometer. Air temperature inside the washrooms
and pH of the water from the tank as well as the aerators were also
recorded. The aforementioned steps were repeated for all cycles.
Failure to follow proper techniques for collection and handling the
samples may lead to the results becoming compromised, so all samples
and tests were performed early morning at 5:30 a m. At such time no
consumers were in the campus that means that the water pressure was
stable on all faucets thus accurate results may be recorded. All samples
were transferred to D.M lab before 7:30 am in order to avoid time delays
between collection and analysis of the samples.
D.M laboratory followed standard methods for the examination of water
and waste water. They followed the Pour plate method for the HPC test
which included sample preparation, media and incubation. All equipment
used in the test which included the oven, the incubator and the colony
counter were calibrated according to the standard. In this method, the
techniques are very simple since it is suitable for any volume of samples
or diluted samples. In D.M’s lab, the work area was disinfected and well
lighted with a suitable working environment for staff to handle the
equipment and the samples properly (see Fig 3.7).
The samples were marked and information which including time, date
sample reference number and dilution percentage of one to ten was
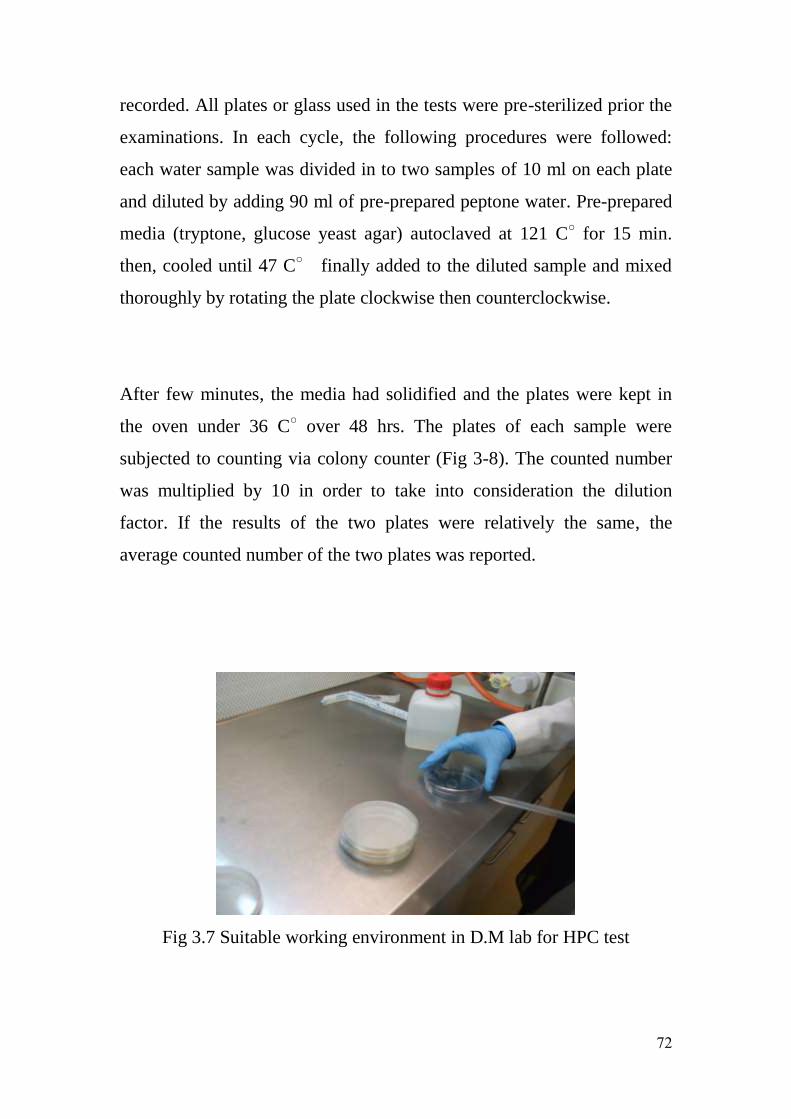
72
recorded. All plates or glass used in the tests were pre-sterilized prior the
examinations. In each cycle, the following procedures were followed:
each water sample was divided in to two samples of 10 ml on each plate
and diluted by adding 90 ml of pre-prepared peptone water. Pre-prepared
media (tryptone, glucose yeast agar) autoclaved at 121 C○ for 15 min.
then, cooled until 47 C○ finally added to the diluted sample and mixed
thoroughly by rotating the plate clockwise then counterclockwise.
After few minutes, the media had solidified and the plates were kept in
the oven under 36 C○ over 48 hrs. The plates of each sample were
subjected to counting via colony counter (Fig 3-8). The counted number
was multiplied by 10 in order to take into consideration the dilution
factor. If the results of the two plates were relatively the same, the
average counted number of the two plates was reported.
Fig 3.7 Suitable working environment in D.M lab for HPC test
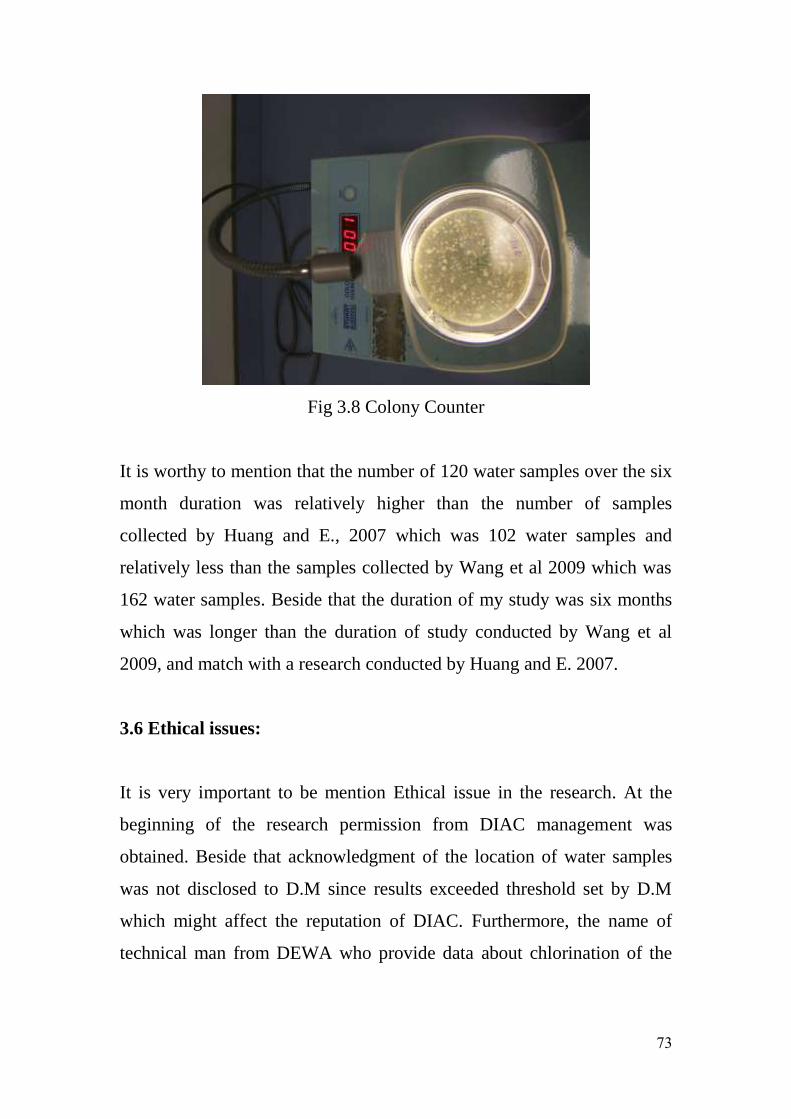
73
Fig 3.8 Colony Counter
It is worthy to mention that the number of 120 water samples over the six
month duration was relatively higher than the number of samples
collected by Huang and E., 2007 which was 102 water samples and
relatively less than the samples collected by Wang et al 2009 which was
162 water samples. Beside that the duration of my study was six months
which was longer than the duration of study conducted by Wang et al
2009, and match with a research conducted by Huang and E. 2007.
3.6 Ethical issues:
It is very important to be mention Ethical issue in the research. At the
beginning of the research permission from DIAC management was
obtained. Beside that acknowledgment of the location of water samples
was not disclosed to D.M since results exceeded threshold set by D.M
which might affect the reputation of DIAC. Furthermore, the name of
technical man from DEWA who provide data about chlorination of the
74
water was kept as anonymous based on his request. Finally all results
were reported to DIAC management for their action.
3.7 limitations of the study:
Generally speaking, although the experimental method was the most
reliable approach for the research, there were many weak points related to
it. For instance; its effectiveness may not reflected the actual real
condition incase of small population samples. Another weakness point is
some biases which may affects the results as will be explained below
(Groat and Wang 2002).
It is essential to indicate and analyze limitations and problems faced
during the study which may affect the results of the research and they are
illustrated as below:
3.7.1 Limitation
1-The location of the conducted study was in Dubai International
Academic city (DIAC). Despite the fact that water was supplied by
DEWA, the water quality may vary from place to place since there are
many different reservoirs.
2-Due to time constraints, duration of water sampling was 24 weeks only
from October to March which meant that the effect of hot weather
condition was almost excluded.
3-Due to Financial restriction the number of faucet aerators were sixteen.
Accordingly, the water samples number was 120 which limited the
conclusion that could be drawn. Beside the water test was limited to HPC
test only.

75
4-Bias in the experiment may be resulted in counting of the HPC bacteria
since, the counting process depends on the person who is counting the
bacteria which may be affected by human error.
76
Chapter 4 -Results
4.1 Introduction
During the twenty seven weeks, 120 water samples were collected from
the faucets and the water tank in DIAC, in order to investigate the effect
of the faucets aerators on bacterial growth which may affect the water
quality. Water flow rate from the faucets with different types of aerators
and control points (all in which under different of water pressure) were
measured in the field. Parameters such as pH, water Temperature and air
temperature inside the washrooms were recorded over the study period.
The HPC concentration was measured in the lab. Excel software was used
in the statistical analysis. The results are illustrated in the following
sections.
4.2 HPC concentration in different types of aerators
Table 4-1 illustrates the variation of HPC concentration in the aerators
type P. In cycle two, it declined for type P2, P3 and P4 while increased
for type P1. In cycle three the concentration increased sharply from
11,940 cfu/ml to 211,100 cfu/ml for aerator type P3 and slightly
decreased for the rest. In cycle four the concentration decreased sharply
for all types. In cycle five there was a drop in the concentration for all
types. For instantce the HPC decreased from 11,830 cfu/ml to 1615
cfu/ml for aerator P1. In cycle six the HPC concentration increased
noticeably in all types. Considering the average values for each type, the
concentration decreased from 18,773 cfu/ml in cycle one to 14,623 cfu/ml
in cycle two then increased to 16,843 cfu/ml in cycle three. Next it
continued to decrease dramatically in cycle four and five to 1561 cfu/ml.
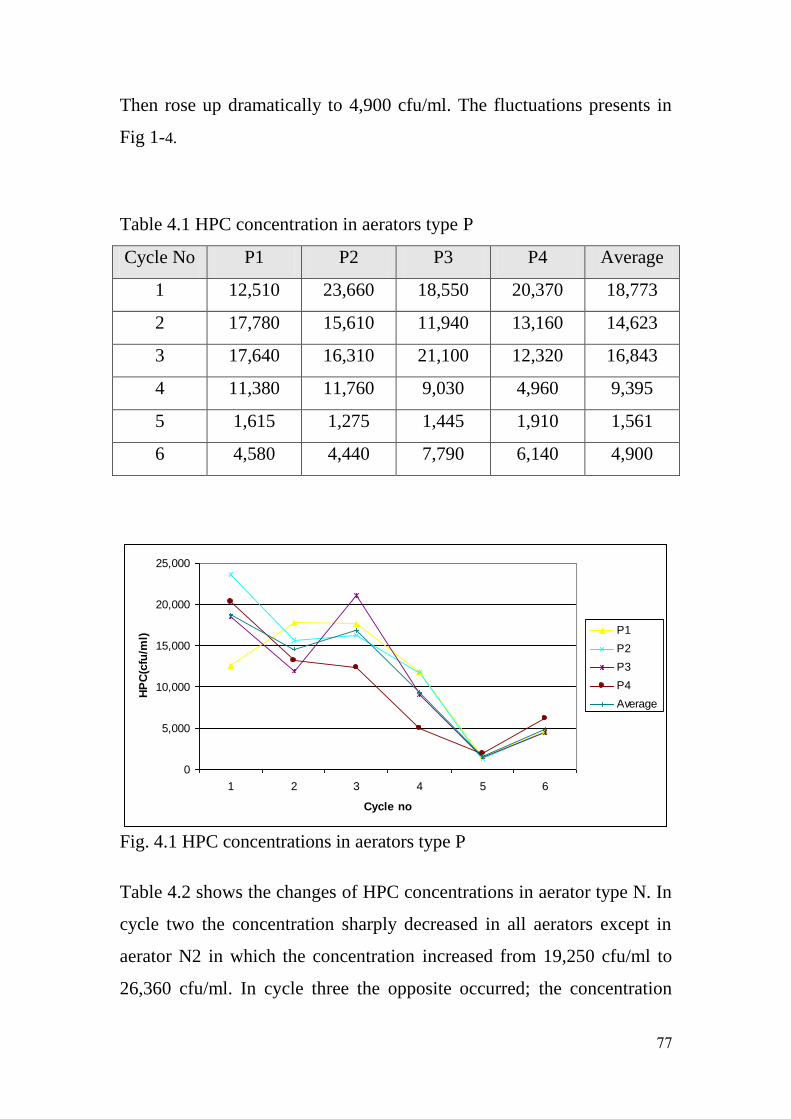
77
Then rose up dramatically to 4,900 cfu/ml. The fluctuations presents in
Fig 1-4.
Table 4.1 HPC concentration in aerators type P
Average P4 P3 P2 P1 Cycle No
18,773 20,370 18,550 23,660 12,510 1
14,623 13,160 11,940 15,610 17,780 2
16,843 12,320 21,100 16,310 17,640 3
9,395 4,960 9,030 11,760 11,380 4
1,561 1,910 1,445 1,275 1,615 5
4,900 6,140 7,790 4,440 4,580 6
0
5,000
10,000
15,000
20,000
25,000
1 2 3 4 5 6
Cycle no
HP
C(c
fu/m
l)
P1
P2
P3
P4
Average
Fig. 4.1 HPC concentrations in aerators type P
Table 4.2 shows the changes of HPC concentrations in aerator type N. In
cycle two the concentration sharply decreased in all aerators except in
aerator N2 in which the concentration increased from 19,250 cfu/ml to
26,360 cfu/ml. In cycle three the opposite occurred; the concentration
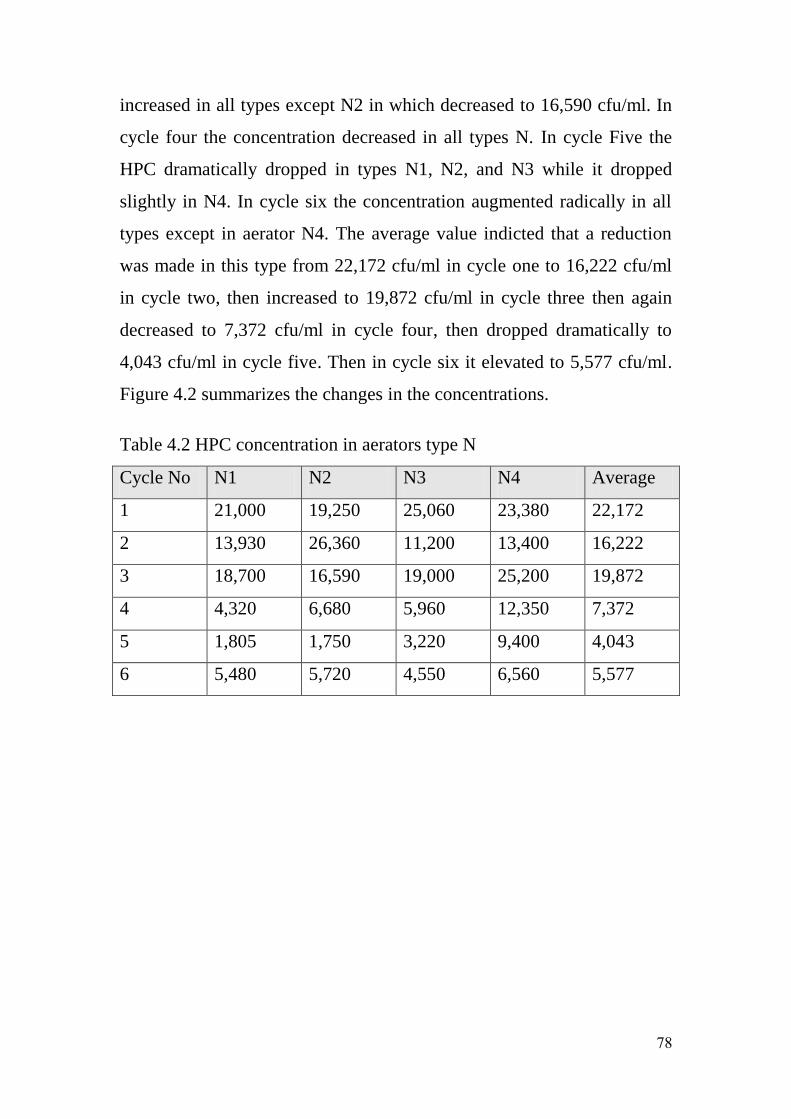
78
increased in all types except N2 in which decreased to 16,590 cfu/ml. In
cycle four the concentration decreased in all types N. In cycle Five the
HPC dramatically dropped in types N1, N2, and N3 while it dropped
slightly in N4. In cycle six the concentration augmented radically in all
types except in aerator N4. The average value indicted that a reduction
was made in this type from 22,172 cfu/ml in cycle one to 16,222 cfu/ml
in cycle two, then increased to 19,872 cfu/ml in cycle three then again
decreased to 7,372 cfu/ml in cycle four, then dropped dramatically to
4,043 cfu/ml in cycle five. Then in cycle six it elevated to 5,577 cfu/ml.
Figure 4.2 summarizes the changes in the concentrations.
Table 4.2 HPC concentration in aerators type N
Average N4 N3 N2 N1 Cycle No
22,172 23,380 25,060 19,250 21,000 1
16,222 13,400 11,200 26,360 13,930 2
19,872 25,200 19,000 16,590 18,700 3
7,372 12,350 5,960 6,680 4,320 4
4,043 9,400 3,220 1,750 1,805 5
5,577 6,560 4,550 5,720 5,480 6
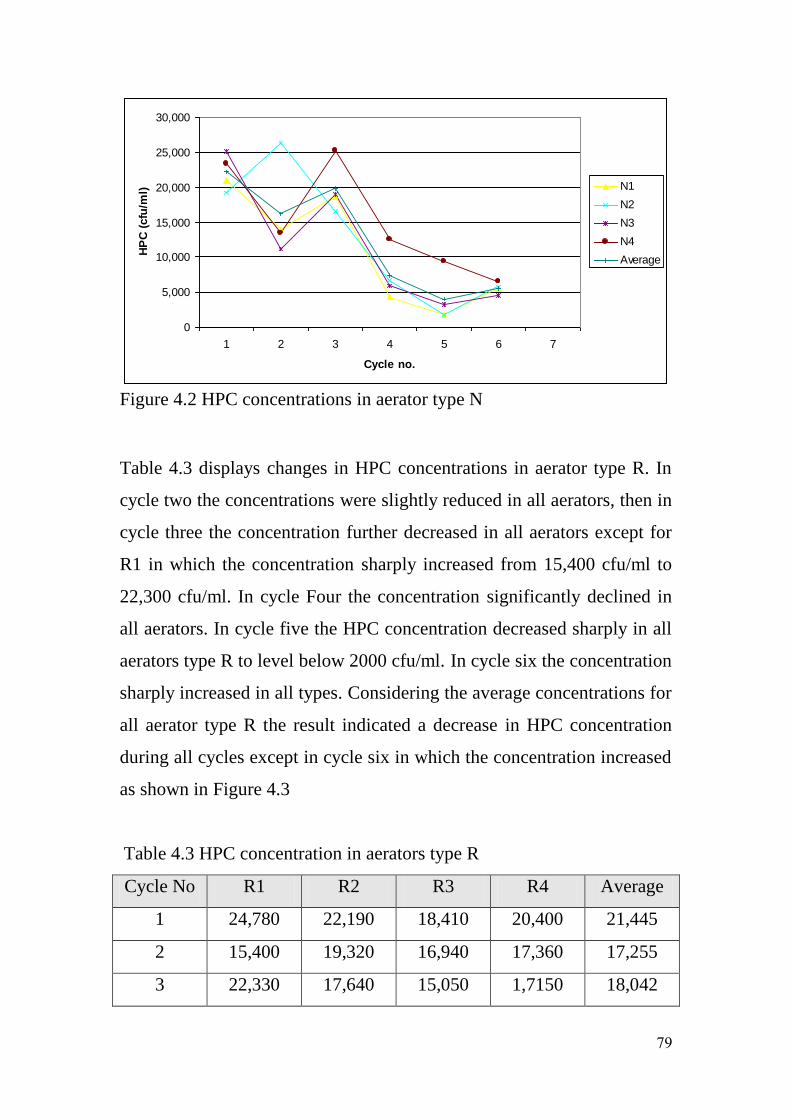
79
0
5,000
10,000
15,000
20,000
25,000
30,000
1 2 3 4 5 6 7
Cycle no.
HP
C (
cfu
/ml) N1
N2
N3
N4
Average
Figure 4.2 HPC concentrations in aerator type N
Table 4.3 displays changes in HPC concentrations in aerator type R. In
cycle two the concentrations were slightly reduced in all aerators, then in
cycle three the concentration further decreased in all aerators except for
R1 in which the concentration sharply increased from 15,400 cfu/ml to
22,300 cfu/ml. In cycle Four the concentration significantly declined in
all aerators. In cycle five the HPC concentration decreased sharply in all
aerators type R to level below 2000 cfu/ml. In cycle six the concentration
sharply increased in all types. Considering the average concentrations for
all aerator type R the result indicated a decrease in HPC concentration
during all cycles except in cycle six in which the concentration increased
as shown in Figure 4.3
Table 4.3 HPC concentration in aerators type R
Average R4 R3 R2 R1 Cycle No
21,445 20,400 18,410 22,190 24,780 1
17,255 17,360 16,940 19,320 15,400 2
18,042 1,7150 15,050 17,640 22,330 3
81
7,912 6,280 7,630 7,030 10,710 4
1,677 1,620 1,460 1,745 1,585 5
6,175 5,300 4,960 9,400 5,040 6
0
5,000
10,000
15,000
20,000
25,000
30,000
1 2 3 4 5 6
Cycle no
HP
C (
cfu
/ml) R1
R2
R3
R4
Average
Fig 4.3 HPC concentrations in aerators type R
Table 4.4 illustrates HPC concentrations in aerators type K. In cycle two
the concentrations decreased in all aerators type K. In cycle three the
concentration decreased in all aerators except in K1 in which the
concentration extremely increased from 9,170 cfu/ml to 24,000 cfu/ml. In
cycle four the concentrations greatly declined in all aerators. In cycle five
a further reduction occurred in all aerators type K and reached to level
below 2000 cfu/ml. In cycle six the HPC concentration notably increased
in all types. Considering the average value of the concentrations the
results showed that the concentration decreased in cycle two then
increased in cycle three and again sharply decreased in cycle four and
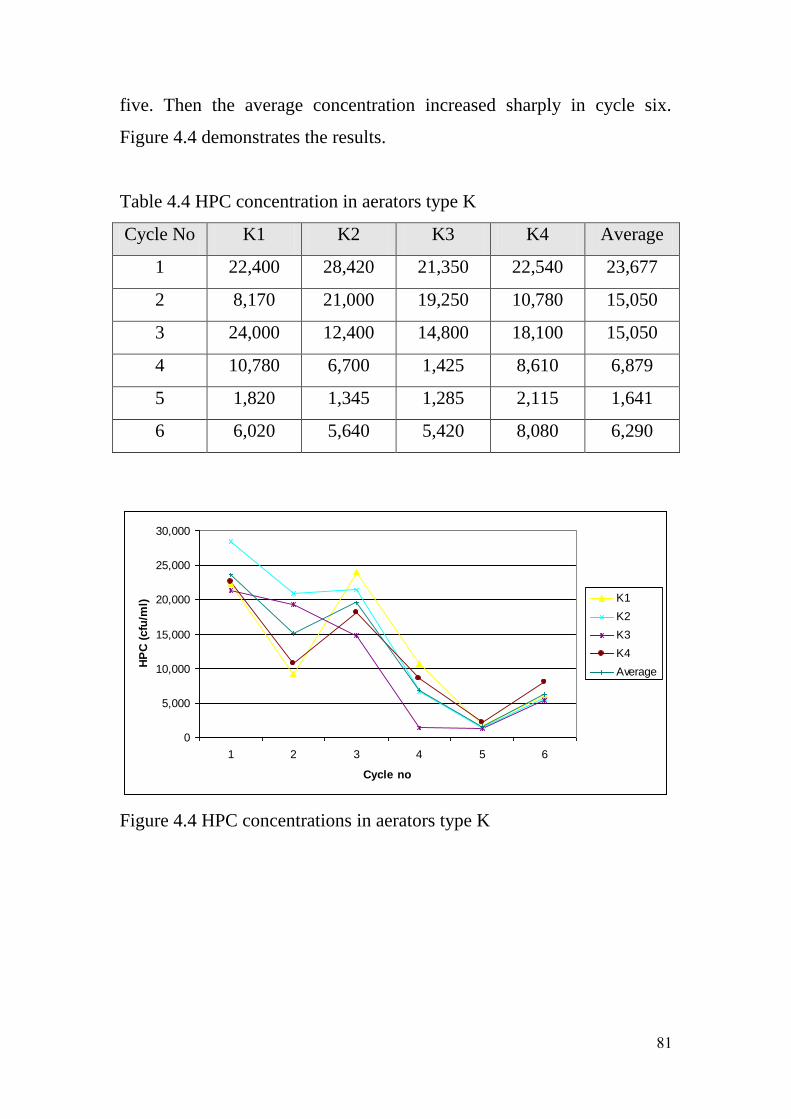
81
five. Then the average concentration increased sharply in cycle six.
Figure 4.4 demonstrates the results.
Table 4.4 HPC concentration in aerators type K
Average K4 K3 K2 K1 Cycle No
23,677 22,540 21,350 28,420 22,400 1
15,050 10,780 19,250 21,000 8,170 2
15,050 18,100 14,800 12,400 24,000 3
6,879 8,610 1,425 6,700 10,780 4
1,641 2,115 1,285 1,345 1,820 5
6,290 8,080 5,420 5,640 6,020 6
0
5,000
10,000
15,000
20,000
25,000
30,000
1 2 3 4 5 6
Cycle no
HP
C (
cfu
/ml) K1
K2
K3
K4
Average
Figure 4.4 HPC concentrations in aerators type K
82
4.3 HPC concentrations in Faucets under different water pressure
Water pressure has an impact on the water flow which may affect the re-
growth of bacteria in the water. In the following section the HPC
concentrations are illustrated taking into consideration different water
pressure values.
4.3.1 HPC concentrations in Faucets under 2 Bar water pressure
Table 4.5 illustrates the average values of HPC concentrations in the
aerators and control point (Faucet without aerator) under 2 bar water
pressure. For aerators type P the concentrations increased in cycle two
then somewhat decreased in cycle three and sharply decreased in cycle
four then notably decreased from 11,830 cfu/ml in cycle four to 1,615
cfu/ml in cycle five. Then in cycle six the concentration dramatically
increased to 4,580 cfu/ml. In aerators type K and R the concentrations
decreased in cycle two then increased in cycle three and decreased again
in cycle four and five to reach a level below 2000 cfu/ml in cycle five.
Then again increased sharply to 6000cfu/ml in cycle six. For aerator type
N the concentration slightly decreased in cycle two then sharply
decreased in cycles three, four and five. Next in cycle six the HPC
concentration increased. In the control point the concentration decreased
in cycle two then increased in cycle three and decreased again in cycle
four then dropped extremely from 10,780 cfu/ml in cycle four to 1,550
cfu/ml in cycle five. Then the concentration increased to 5520 cfu/ml in
cycle six. Figure 4.5 shows the variations in average concentrations in
aerators, control point under 2 bar water pressure and the water tank.
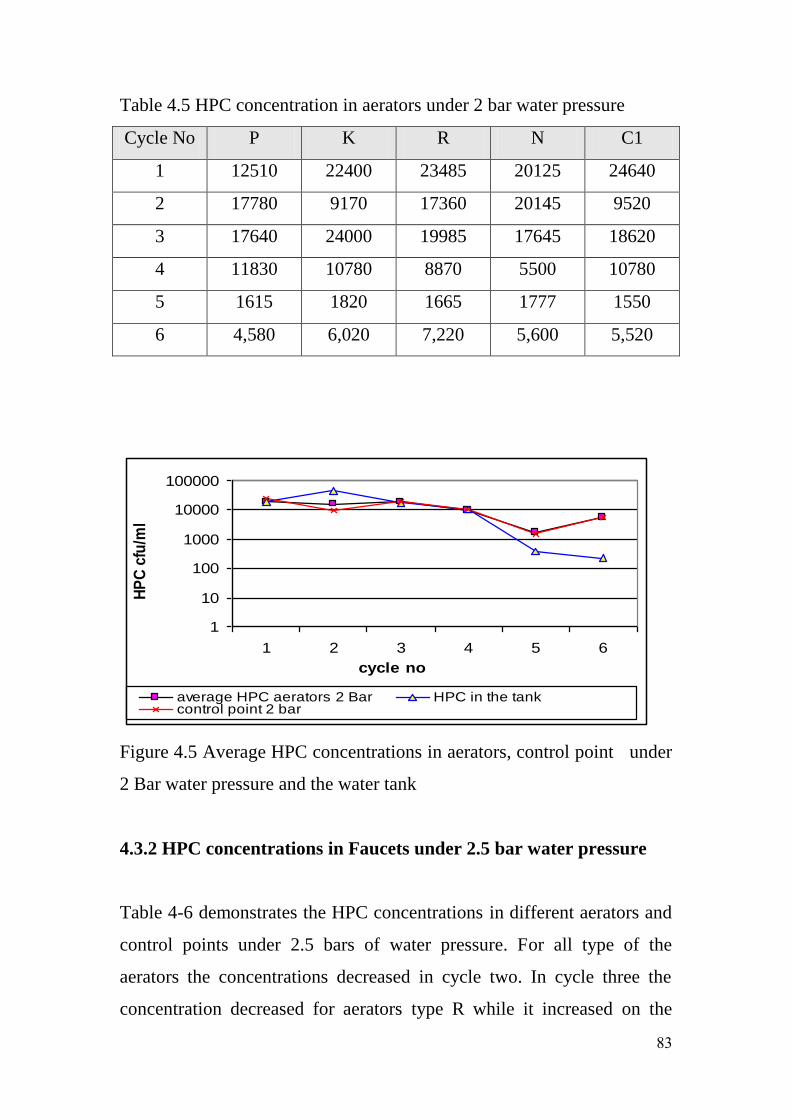
83
Table 4.5 HPC concentration in aerators under 2 bar water pressure
C1 N R K P Cycle No
24640 20125 23485 22400 12510 1
9520 20145 17360 9170 17780 2
18620 17645 19985 24000 17640 3
10780 5500 8870 10780 11830 4
1550 1777 1665 1820 1615 5
5,520 5,600 7,220 6,020 4,580 6
1
10
100
1000
10000
100000
1 2 3 4 5 6
cycle no
HP
C c
fu/m
l
average HPC aerators 2 Bar HPC in the tankcontrol point 2 bar
Figure 4.5 Average HPC concentrations in aerators, control point under
2 Bar water pressure and the water tank
4.3.2 HPC concentrations in Faucets under 2.5 bar water pressure
Table 4-6 demonstrates the HPC concentrations in different aerators and
control points under 2.5 bars of water pressure. For all type of the
aerators the concentrations decreased in cycle two. In cycle three the
concentration decreased for aerators type R while it increased on the
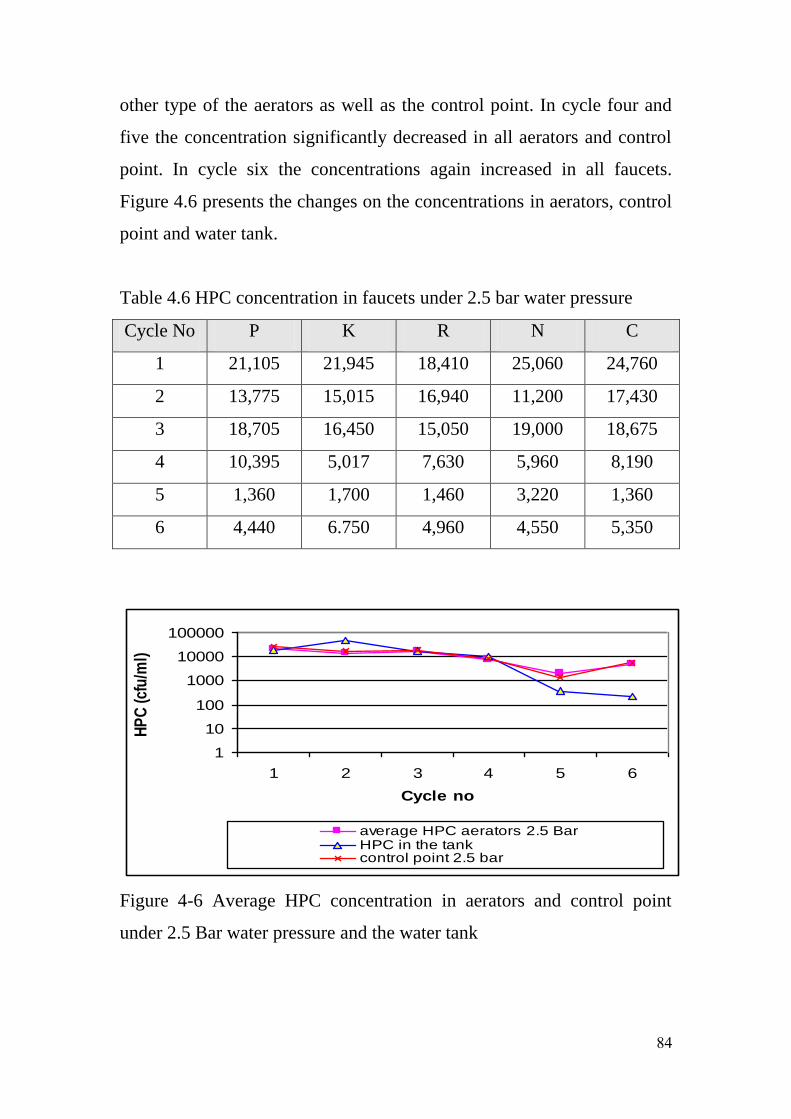
84
other type of the aerators as well as the control point. In cycle four and
five the concentration significantly decreased in all aerators and control
point. In cycle six the concentrations again increased in all faucets.
Figure 4.6 presents the changes on the concentrations in aerators, control
point and water tank.
Table 4.6 HPC concentration in faucets under 2.5 bar water pressure
C N R K P Cycle No
24,760 25,060 18,410 21,945 21,105 1
17,430 11,200 16,940 15,015 13,775 2
18,675 19,000 15,050 16,450 18,705 3
8,190 5,960 7,630 5,017 10,395 4
1,360 3,220 1,460 1,700 1,360 5
5,350 4,550 4,960 6.750 4,440 6
1
10
100
1000
10000
100000
1 2 3 4 5 6
Cycle no
HP
C (
cfu
/ml)
average HPC aerators 2.5 BarHPC in the tankcontrol point 2.5 bar
Figure 4-6 Average HPC concentration in aerators and control point
under 2.5 Bar water pressure and the water tank
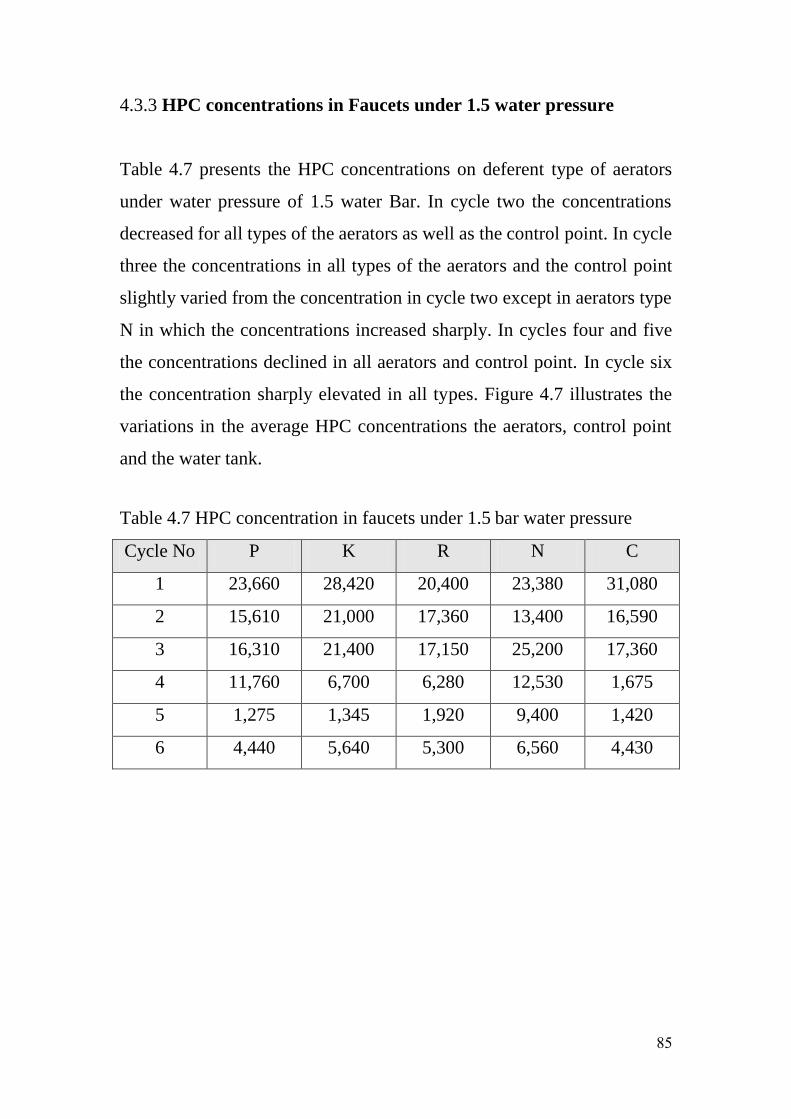
85
4.3.3 HPC concentrations in Faucets under 1.5 water pressure
Table 4.7 presents the HPC concentrations on deferent type of aerators
under water pressure of 1.5 water Bar. In cycle two the concentrations
decreased for all types of the aerators as well as the control point. In cycle
three the concentrations in all types of the aerators and the control point
slightly varied from the concentration in cycle two except in aerators type
N in which the concentrations increased sharply. In cycles four and five
the concentrations declined in all aerators and control point. In cycle six
the concentration sharply elevated in all types. Figure 4.7 illustrates the
variations in the average HPC concentrations the aerators, control point
and the water tank.
Table 4.7 HPC concentration in faucets under 1.5 bar water pressure
C N R K P Cycle No
31,080 23,380 20,400 28,420 23,660 1
16,590 13,400 17,360 21,000 15,610 2
17,360 25,200 17,150 21,400 16,310 3
1,675 12,530 6,280 6,700 11,760 4
1,420 9,400 1,920 1,345 1,275 5
4,430 6,560 5,300 5,640 4,440 6
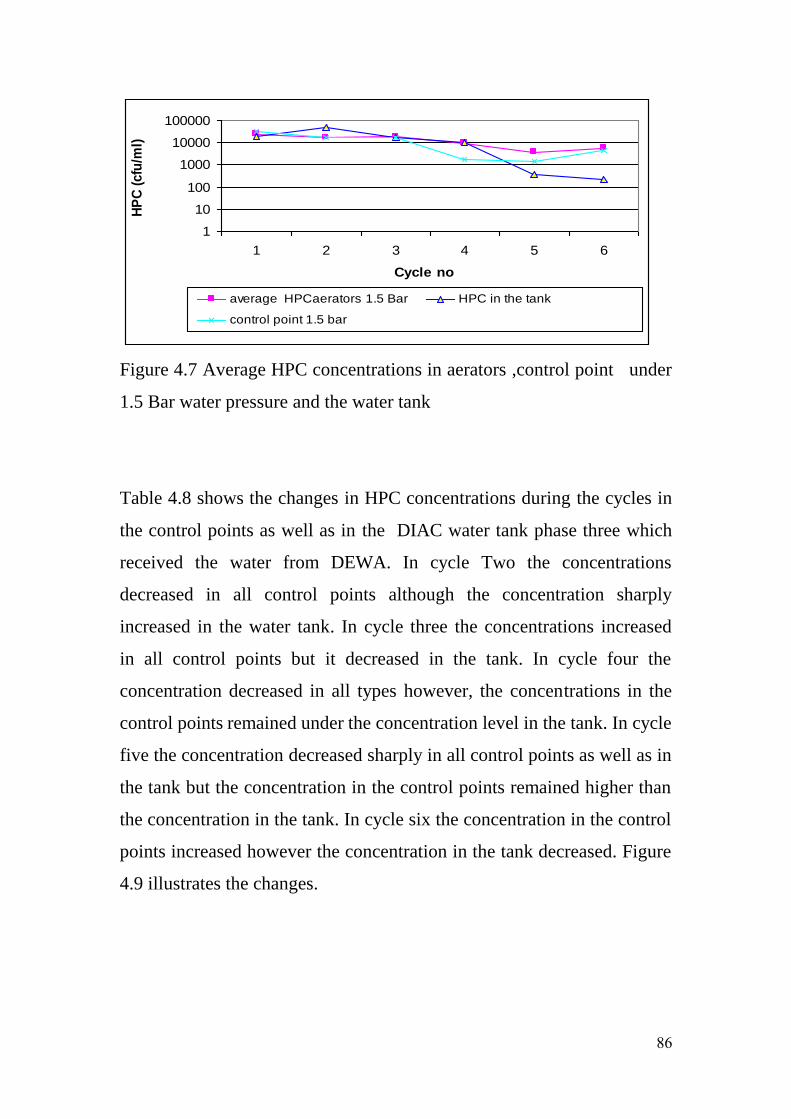
86
1
10
100
1000
10000
100000
1 2 3 4 5 6
Cycle no
HP
C (
cfu
/ml)
average HPCaerators 1.5 Bar HPC in the tank
control point 1.5 bar
Figure 4.7 Average HPC concentrations in aerators ,control point under
1.5 Bar water pressure and the water tank
Table 4.8 shows the changes in HPC concentrations during the cycles in
the control points as well as in the DIAC water tank phase three which
received the water from DEWA. In cycle Two the concentrations
decreased in all control points although the concentration sharply
increased in the water tank. In cycle three the concentrations increased
in all control points but it decreased in the tank. In cycle four the
concentration decreased in all types however, the concentrations in the
control points remained under the concentration level in the tank. In cycle
five the concentration decreased sharply in all control points as well as in
the tank but the concentration in the control points remained higher than
the concentration in the tank. In cycle six the concentration in the control
points increased however the concentration in the tank decreased. Figure
4.9 illustrates the changes.
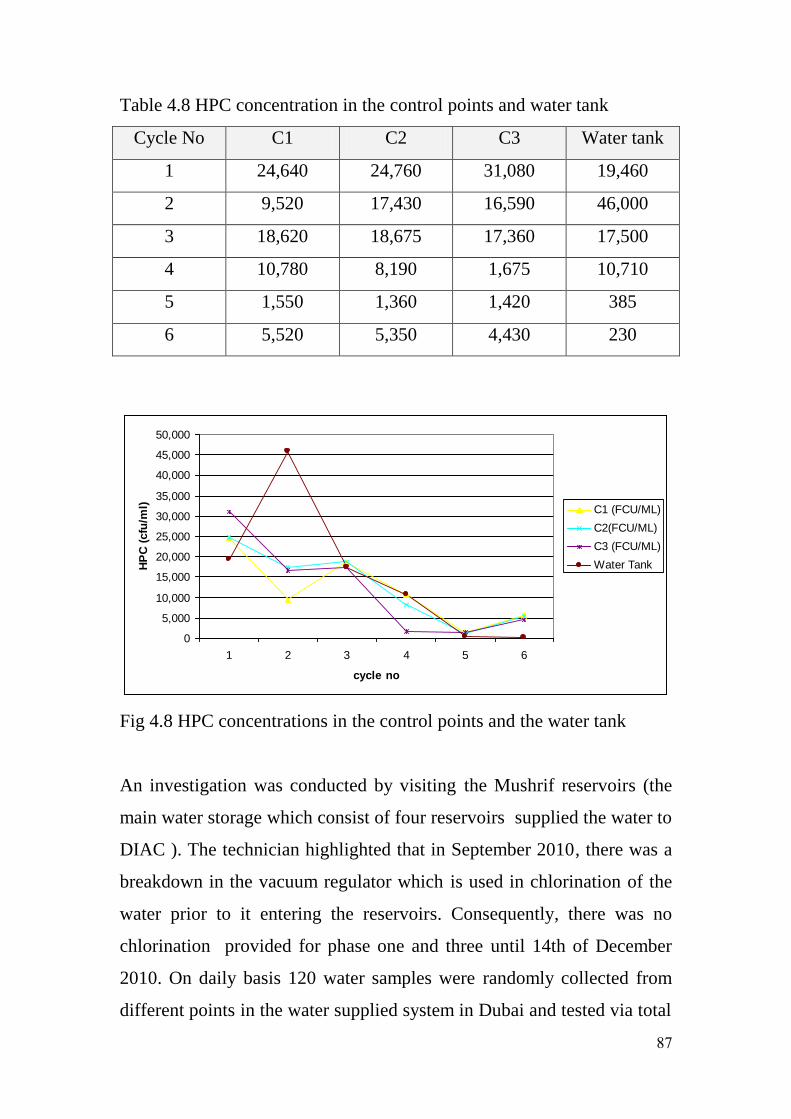
87
Table 4.8 HPC concentration in the control points and water tank
Water tank C3 C2 C1 Cycle No
19,460 31,080 24,760 24,640 1
46,000 16,590 17,430 9,520 2
17,500 17,360 18,675 18,620 3
10,710 1,675 8,190 10,780 4
385 1,420 1,360 1,550 5
230 4,430 5,350 5,520 6
0
5,000
10,000
15,000
20,000
25,000
30,000
35,000
40,000
45,000
50,000
1 2 3 4 5 6
cycle no
HP
C (
cfu
/ml) C1 (FCU/ML)
C2(FCU/ML)
C3 (FCU/ML)
Water Tank
Fig 4.8 HPC concentrations in the control points and the water tank
An investigation was conducted by visiting the Mushrif reservoirs (the
main water storage which consist of four reservoirs supplied the water to
DIAC ). The technician highlighted that in September 2010, there was a
breakdown in the vacuum regulator which is used in chlorination of the
water prior to it entering the reservoirs. Consequently, there was no
chlorination provided for phase one and three until 14th of December
2010. On daily basis 120 water samples were randomly collected from
different points in the water supplied system in Dubai and tested via total
88
coliform and E.coli. Based on the results instructions were given to a
team add chlorination dosage using calcium hypochlorite with 0.1 mg/l to
0.3 mg/L after 3 pm. Due to aforementioned concern the percentage of
the HPC in the aerators under different water pressure values relative to
HPC in the DIAC water tank are highlighted in the following section.
4.4 Percentage of HPC of aerators under different water pressure
relative to HPC in DIAC tank
Table 4.9 shows percentages of HPC concentrations in aerators under 2
bar water pressure. In cycle one HPC percentage in aerator type P did not
exceed the HPC in the water tank while it exceeded the concentration in
aerators type K, R and N. In cycle two the percentages were dropped
significantly in all types then, again drooped further in cycle three. Next
in cycle four the HPC concentration in aerators P and K went beyond the
concentration in the water tank while in aerators type R and N it remained
below the level. In cycle five the concentration in all type jumped
dramatically beyond the tank concentration. In cycle six the percentage of
the concentration inflated in all aerators in respect to water tank
concentration. Figure 4.9 demonstrates the variations in the percentages.
Table 4.9 Percentage of HPC in aerators under 2 bar respect to HPC
concentration in the tank
Cycle no % in ( P) % in (K) % in (R) % in (N)
1 64.29 115.11 121 103
2 37.85 19.52 37 43
3 100.8 137.14 114 101
4 110.46 100.65 83 51.5
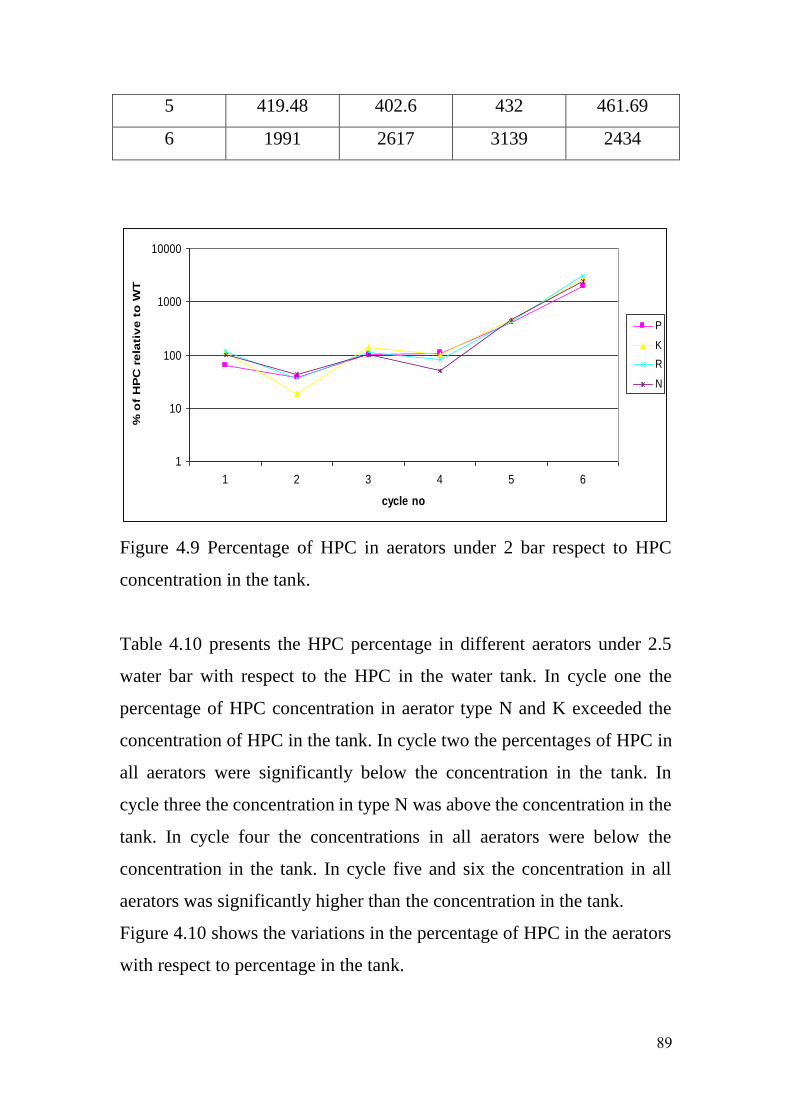
89
5 419.48 402.6 432 461.69
6 1991 2617 3139 2434
1
10
100
1000
10000
1 2 3 4 5 6
cycle no
% o
f H
PC
re
lati
ve
to
WT
P
K
R
N
Figure 4.9 Percentage of HPC in aerators under 2 bar respect to HPC
concentration in the tank.
Table 4.10 presents the HPC percentage in different aerators under 2.5
water bar with respect to the HPC in the water tank. In cycle one the
percentage of HPC concentration in aerator type N and K exceeded the
concentration of HPC in the tank. In cycle two the percentages of HPC in
all aerators were significantly below the concentration in the tank. In
cycle three the concentration in type N was above the concentration in the
tank. In cycle four the concentrations in all aerators were below the
concentration in the tank. In cycle five and six the concentration in all
aerators was significantly higher than the concentration in the tank.
Figure 4.10 shows the variations in the percentage of HPC in the aerators
with respect to percentage in the tank.
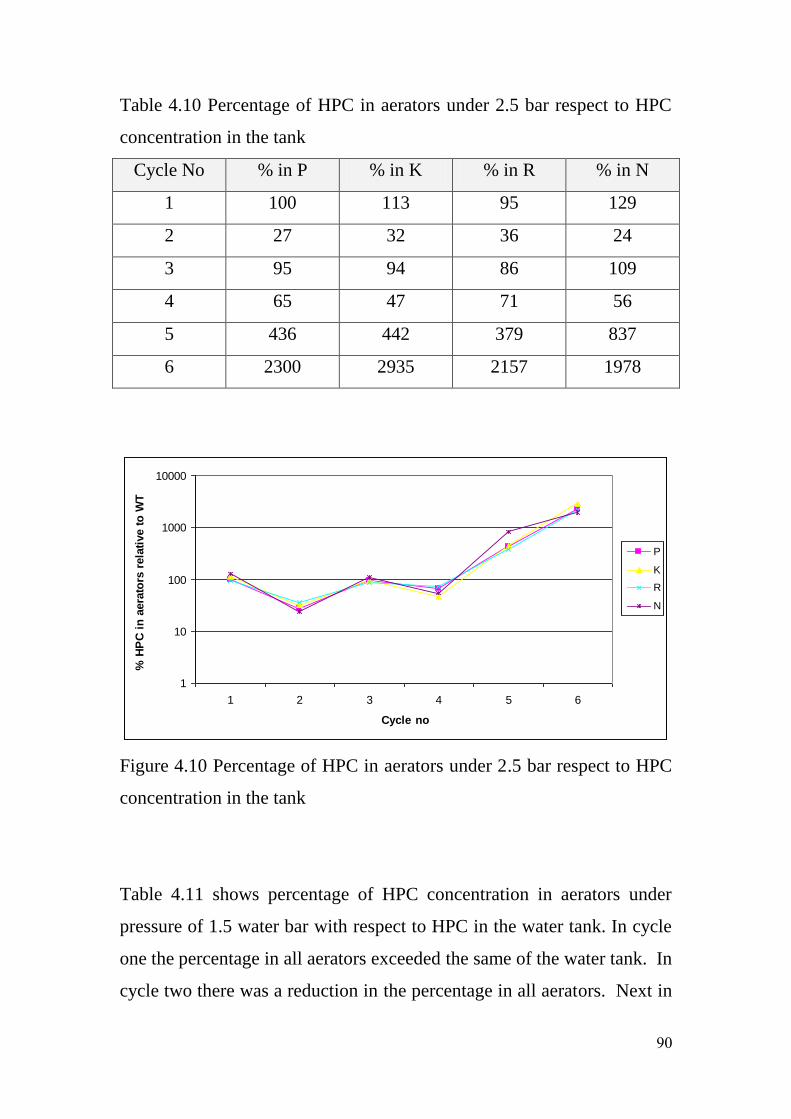
91
Table 4.10 Percentage of HPC in aerators under 2.5 bar respect to HPC
concentration in the tank
Cycle No % in P % in K % in R % in N
1 100 113 95 129
2 27 32 36 24
3 95 94 86 109
4 65 47 71 56
5 436 442 379 837
6 2300 2935 2157 1978
1
10
100
1000
10000
1 2 3 4 5 6
Cycle no
% H
PC
in
aera
tors
rela
tive t
o W
T
P
K
R
N
Figure 4.10 Percentage of HPC in aerators under 2.5 bar respect to HPC
concentration in the tank
Table 4.11 shows percentage of HPC concentration in aerators under
pressure of 1.5 water bar with respect to HPC in the water tank. In cycle
one the percentage in all aerators exceeded the same of the water tank. In
cycle two there was a reduction in the percentage in all aerators. Next in
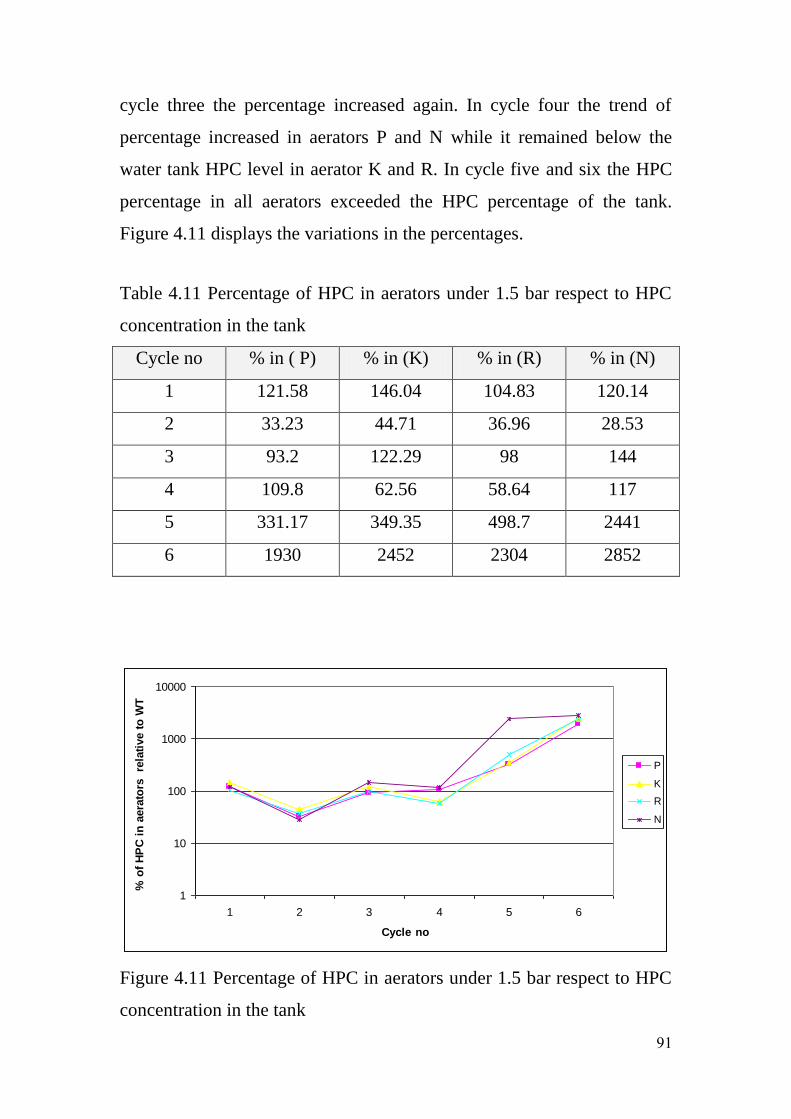
91
cycle three the percentage increased again. In cycle four the trend of
percentage increased in aerators P and N while it remained below the
water tank HPC level in aerator K and R. In cycle five and six the HPC
percentage in all aerators exceeded the HPC percentage of the tank.
Figure 4.11 displays the variations in the percentages.
Table 4.11 Percentage of HPC in aerators under 1.5 bar respect to HPC
concentration in the tank
Cycle no % in ( P) % in (K) % in (R) % in (N)
1 121.58 146.04 104.83 120.14
2 33.23 44.71 36.96 28.53
3 93.2 122.29 98 144
4 109.8 62.56 58.64 117
5 331.17 349.35 498.7 2441
6 1930 2452 2304 2852
1
10
100
1000
10000
1 2 3 4 5 6
Cycle no
% o
f H
PC
in
aera
tors
re
lati
ve t
o W
T
P
K
R
N
Figure 4.11 Percentage of HPC in aerators under 1.5 bar respect to HPC
concentration in the tank
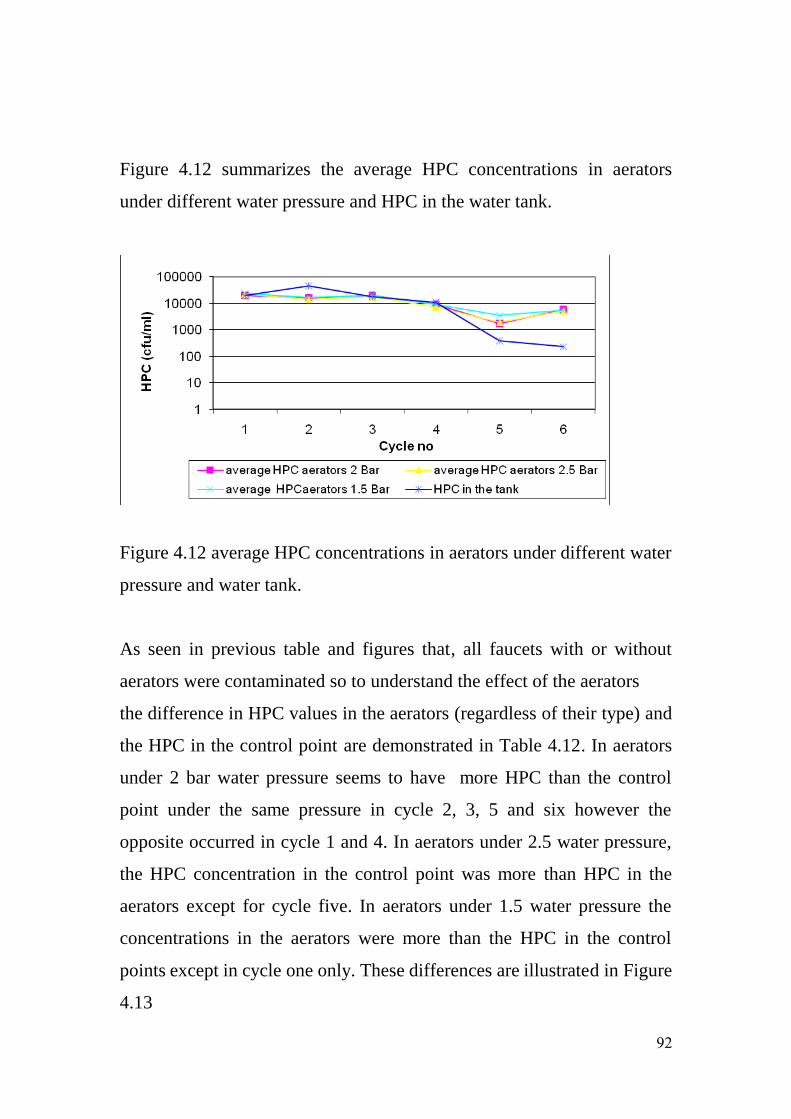
92
Figure 4.12 summarizes the average HPC concentrations in aerators
under different water pressure and HPC in the water tank.
Figure 4.12 average HPC concentrations in aerators under different water
pressure and water tank.
As seen in previous table and figures that, all faucets with or without
aerators were contaminated so to understand the effect of the aerators
the difference in HPC values in the aerators (regardless of their type) and
the HPC in the control point are demonstrated in Table 4.12. In aerators
under 2 bar water pressure seems to have more HPC than the control
point under the same pressure in cycle 2, 3, 5 and six however the
opposite occurred in cycle 1 and 4. In aerators under 2.5 water pressure,
the HPC concentration in the control point was more than HPC in the
aerators except for cycle five. In aerators under 1.5 water pressure the
concentrations in the aerators were more than the HPC in the control
points except in cycle one only. These differences are illustrated in Figure
4.13
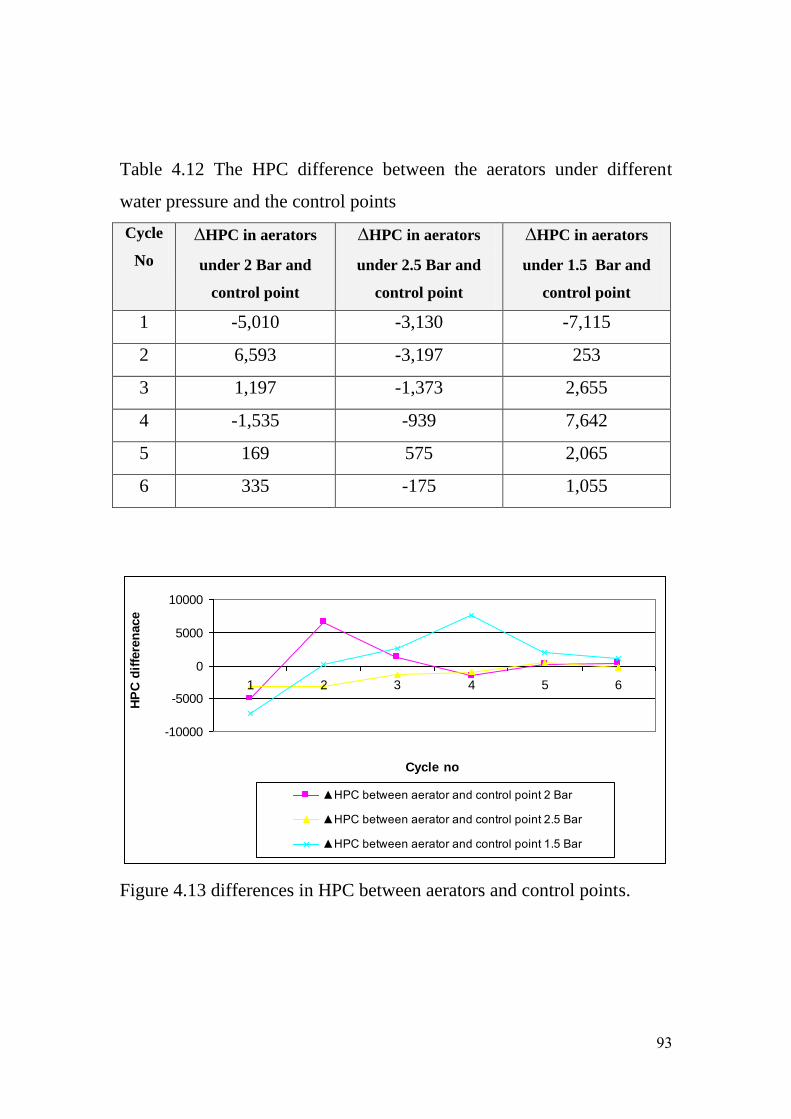
93
Table 4.12 The HPC difference between the aerators under different
water pressure and the control points
Cycle
No
∆HPC in aerators
under 2 Bar and
control point
∆HPC in aerators
under 2.5 Bar and
control point
∆HPC in aerators
under 1.5 Bar and
control point
1 -5,010 -3,130 -7,115
2 6,593 -3,197 253
3 1,197 -1,373 2,655
4 -1,535 -939 7,642
5 169 575 2,065
6 335 -175 1,055
-10000
-5000
0
5000
10000
1 2 3 4 5 6
Cycle no
HP
C d
iffe
ren
ace
▲HPC between aerator and control point 2 Bar
▲HPC between aerator and control point 2.5 Bar
▲HPC between aerator and control point 1.5 Bar
Figure 4.13 differences in HPC between aerators and control points.
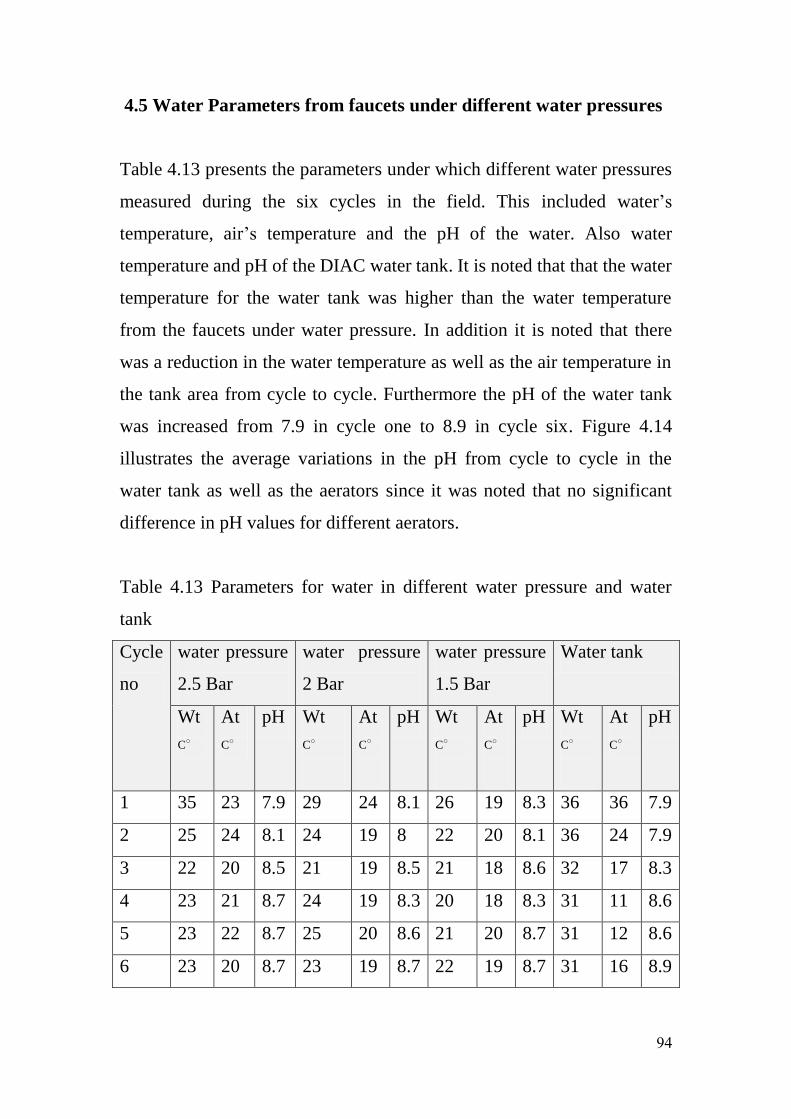
94
4.5 Water Parameters from faucets under different water pressures
Table 4.13 presents the parameters under which different water pressures
measured during the six cycles in the field. This included water’s
temperature, air’s temperature and the pH of the water. Also water
temperature and pH of the DIAC water tank. It is noted that that the water
temperature for the water tank was higher than the water temperature
from the faucets under water pressure. In addition it is noted that there
was a reduction in the water temperature as well as the air temperature in
the tank area from cycle to cycle. Furthermore the pH of the water tank
was increased from 7.9 in cycle one to 8.9 in cycle six. Figure 4.14
illustrates the average variations in the pH from cycle to cycle in the
water tank as well as the aerators since it was noted that no significant
difference in pH values for different aerators.
Table 4.13 Parameters for water in different water pressure and water
tank
Water tank water pressure
1.5 Bar
water pressure
2 Bar
water pressure
2.5 Bar
Cycle
no
pH At
C○
Wt
C○
pH At
C○
Wt
C○
pH At
C○
Wt
C○
pH At
C○
Wt
C○
7.9 36 36 8.3 19 26 8.1 24 29 7.9 23 35 1
7.9 24 36 8.1 20 22 8 19 24 8.1 24 25 2
8.3 17 32 8.6 18 21 8.5 19 21 8.5 20 22 3
8.6 11 31 8.3 18 20 8.3 19 24 8.7 21 23 4
8.6 12 31 8.7 20 21 8.6 20 25 8.7 22 23 5
8.9 16 31 8.7 19 22 8.7 19 23 8.7 20 23 6
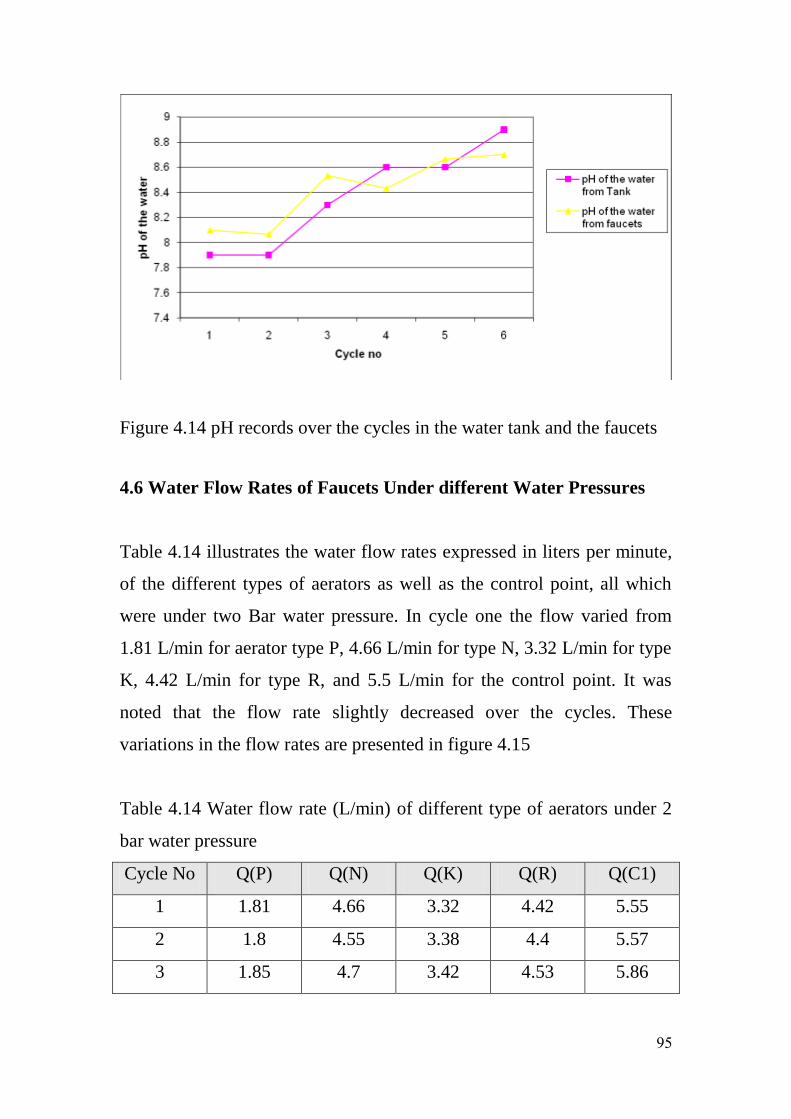
95
Figure 4.14 pH records over the cycles in the water tank and the faucets
4.6 Water Flow Rates of Faucets Under different Water Pressures
Table 4.14 illustrates the water flow rates expressed in liters per minute,
of the different types of aerators as well as the control point, all which
were under two Bar water pressure. In cycle one the flow varied from
1.81 L/min for aerator type P, 4.66 L/min for type N, 3.32 L/min for type
K, 4.42 L/min for type R, and 5.5 L/min for the control point. It was
noted that the flow rate slightly decreased over the cycles. These
variations in the flow rates are presented in figure 4.15
Table 4.14 Water flow rate (L/min) of different type of aerators under 2
bar water pressure
Cycle No Q(P) Q(N) Q(K) Q(R) Q(C1)
1 1.81 4.66 3.32 4.42 5.55
2 1.8 4.55 3.38 4.4 5.57
3 1.85 4.7 3.42 4.53 5.86
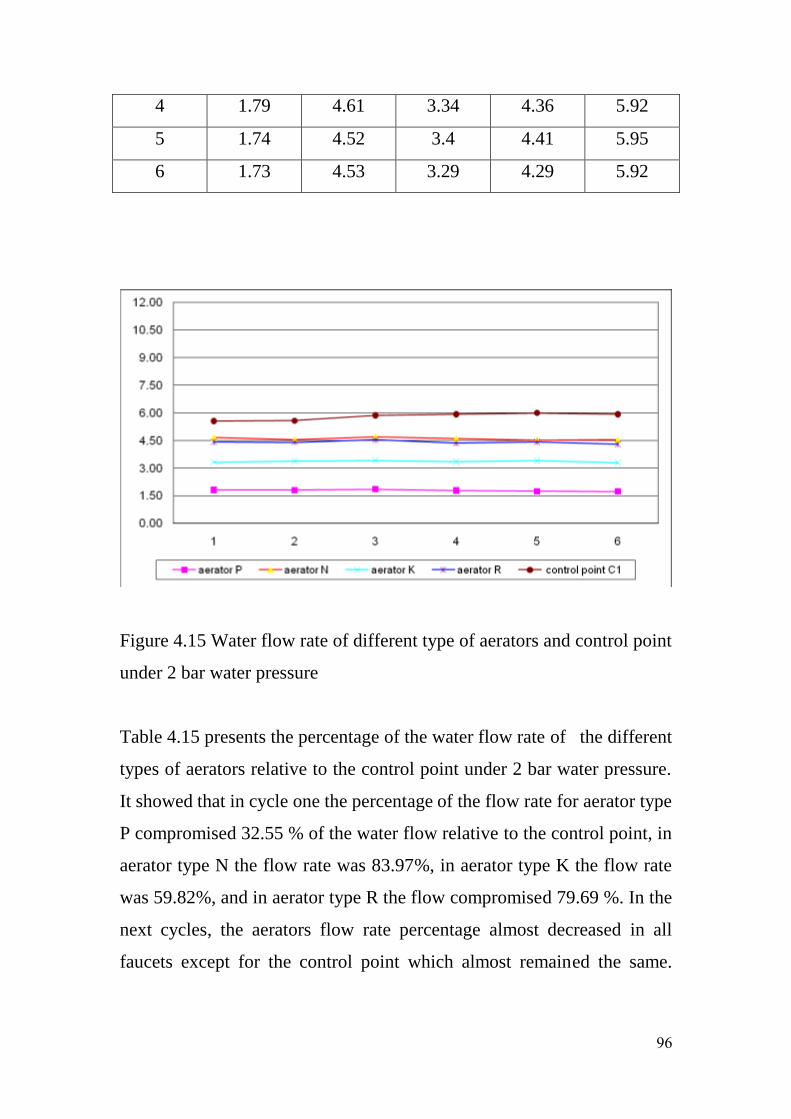
96
4 1.79 4.61 3.34 4.36 5.92
5 1.74 4.52 3.4 4.41 5.95
6 1.73 4.53 3.29 4.29 5.92
Figure 4.15 Water flow rate of different type of aerators and control point
under 2 bar water pressure
Table 4.15 presents the percentage of the water flow rate of the different
types of aerators relative to the control point under 2 bar water pressure.
It showed that in cycle one the percentage of the flow rate for aerator type
P compromised 32.55 % of the water flow relative to the control point, in
aerator type N the flow rate was 83.97%, in aerator type K the flow rate
was 59.82%, and in aerator type R the flow compromised 79.69 %. In the
next cycles, the aerators flow rate percentage almost decreased in all
faucets except for the control point which almost remained the same.
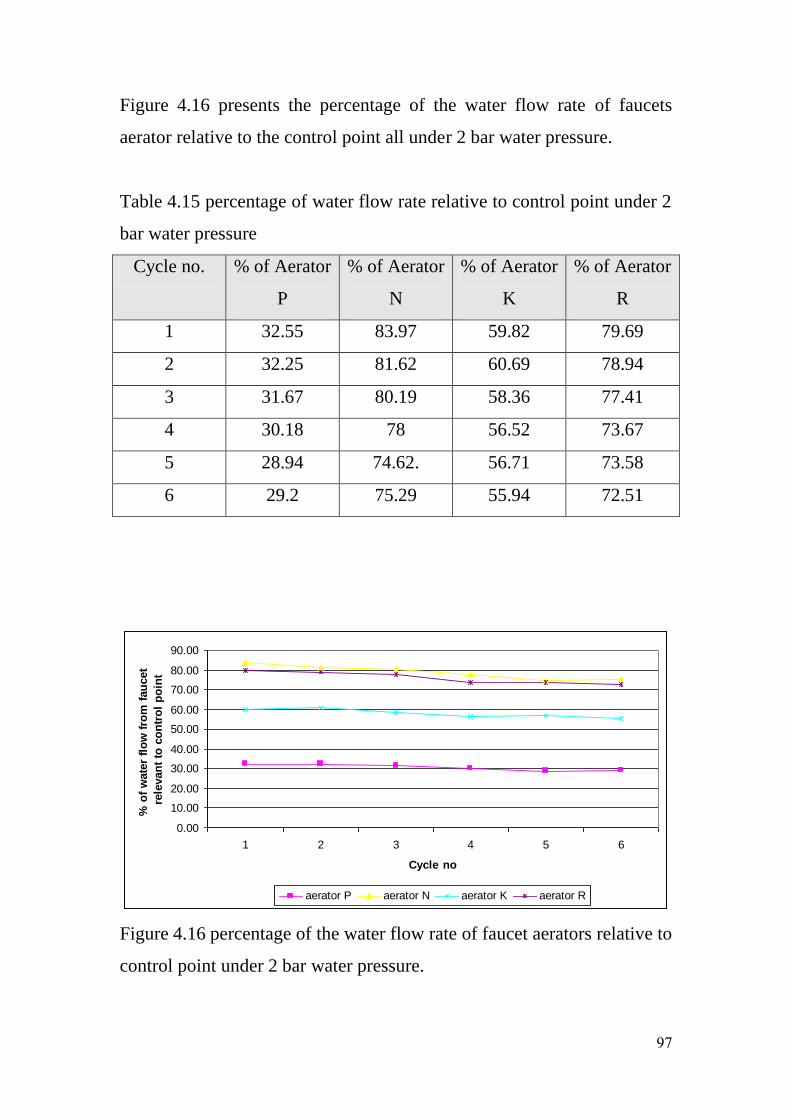
97
Figure 4.16 presents the percentage of the water flow rate of faucets
aerator relative to the control point all under 2 bar water pressure.
Table 4.15 percentage of water flow rate relative to control point under 2
bar water pressure
Cycle no. % of Aerator
P
% of Aerator
N
% of Aerator
K
% of Aerator
R
1 32.55 83.97 59.82 79.69
2 32.25 81.62 60.69 78.94
3 31.67 80.19 58.36 77.41
4 30.18 78 56.52 73.67
5 28.94 74.62. 56.71 73.58
6 29.2 75.29 55.94 72.51
0.00
10.00
20.00
30.00
40.00
50.00
60.00
70.00
80.00
90.00
1 2 3 4 5 6
Cycle no
% o
f w
ate
r fl
ow
fro
m f
au
cet
rele
van
t to
co
ntr
ol
po
int
aerator P aerator N aerator K aerator R
Figure 4.16 percentage of the water flow rate of faucet aerators relative to
control point under 2 bar water pressure.
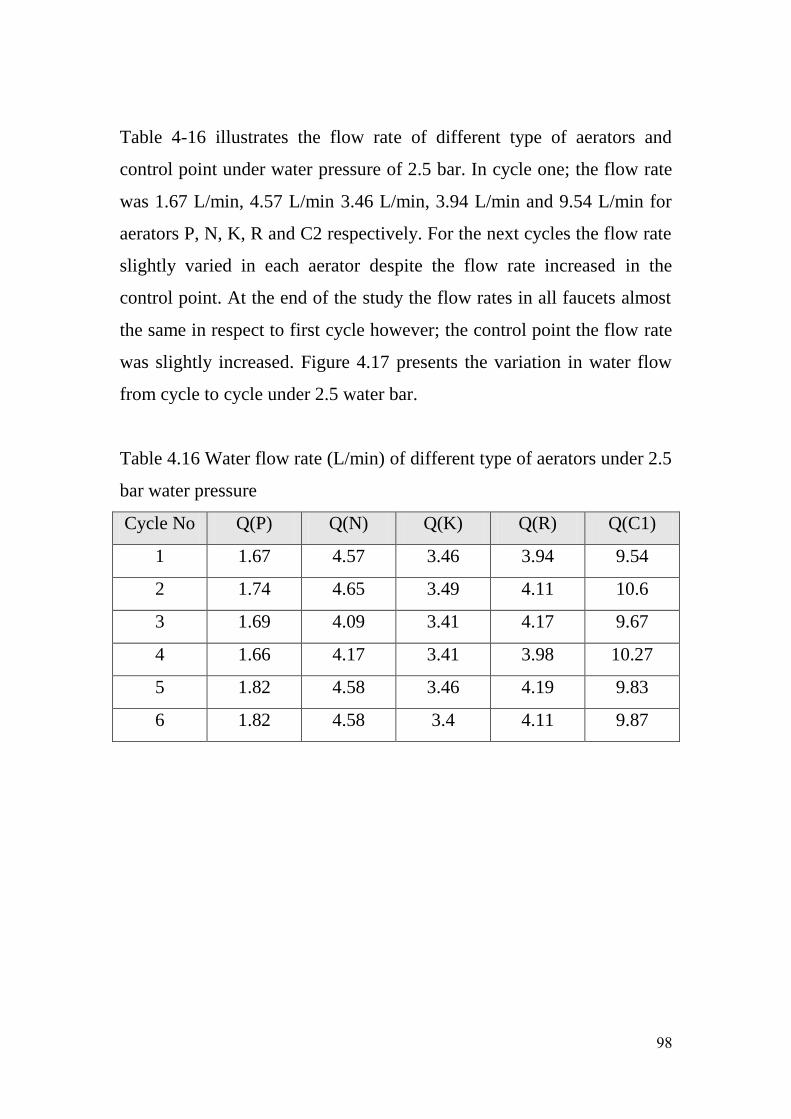
98
Table 4-16 illustrates the flow rate of different type of aerators and
control point under water pressure of 2.5 bar. In cycle one; the flow rate
was 1.67 L/min, 4.57 L/min 3.46 L/min, 3.94 L/min and 9.54 L/min for
aerators P, N, K, R and C2 respectively. For the next cycles the flow rate
slightly varied in each aerator despite the flow rate increased in the
control point. At the end of the study the flow rates in all faucets almost
the same in respect to first cycle however; the control point the flow rate
was slightly increased. Figure 4.17 presents the variation in water flow
from cycle to cycle under 2.5 water bar.
Table 4.16 Water flow rate (L/min) of different type of aerators under 2.5
bar water pressure
Cycle No Q(P) Q(N) Q(K) Q(R) Q(C1)
1 1.67 4.57 3.46 3.94 9.54
2 1.74 4.65 3.49 4.11 10.6
3 1.69 4.09 3.41 4.17 9.67
4 1.66 4.17 3.41 3.98 10.27
5 1.82 4.58 3.46 4.19 9.83
6 1.82 4.58 3.4 4.11 9.87
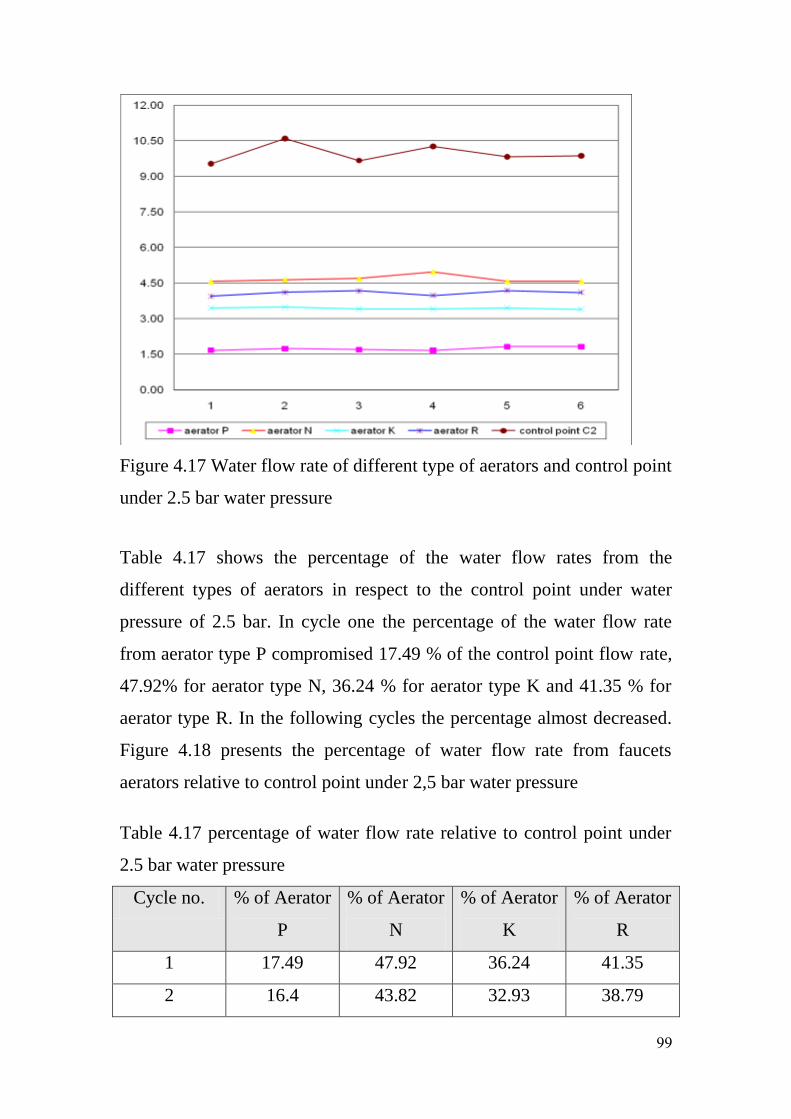
99
Figure 4.17 Water flow rate of different type of aerators and control point
under 2.5 bar water pressure
Table 4.17 shows the percentage of the water flow rates from the
different types of aerators in respect to the control point under water
pressure of 2.5 bar. In cycle one the percentage of the water flow rate
from aerator type P compromised 17.49 % of the control point flow rate,
47.92% for aerator type N, 36.24 % for aerator type K and 41.35 % for
aerator type R. In the following cycles the percentage almost decreased.
Figure 4.18 presents the percentage of water flow rate from faucets
aerators relative to control point under 2,5 bar water pressure
Table 4.17 percentage of water flow rate relative to control point under
2.5 bar water pressure
Cycle no. % of Aerator
P
% of Aerator
N
% of Aerator
K
% of Aerator
R
1 17.49 47.92 36.24 41.35
2 16.4 43.82 32.93 38.79
111
3 17.51 48.56 35.29 43.15
4 16.18 48.52 33.25 38.76
5 18.51 46.57 35.21 42.6
6 18.48 46.4 34.44 41.62
0.00
10.00
20.00
30.00
40.00
50.00
60.00
1 2 3 4 5 6
cycle no.
% o
f w
ate
r fl
ow
rate
fro
m a
era
tors
rela
tive t
o c
on
tro
l p
oin
t
aerator P aerator N aerator K aerator R
Figure 4.18 Percentage of water flow rate of faucet aerators relative to
control point under 2.5 water bar
Table 4.18 displays the water flow rates of the different types of aerators
and control point under water pressure of 1.5 bar. In cycle one the flow
rate was 2.03 L/min, 3.23 L/min, 2.62 L/min and 2.91 L/min for aerators
P, N, K, and R respectively. On the other hand the flow rate of the control
point was 4.33 L/min. Figure 4.19 presents the changes in flow rate of the
aerators over the cycle period. It shows a decrease in the flow rate from
cycle to cycle although the flow rate from the control point is increased.
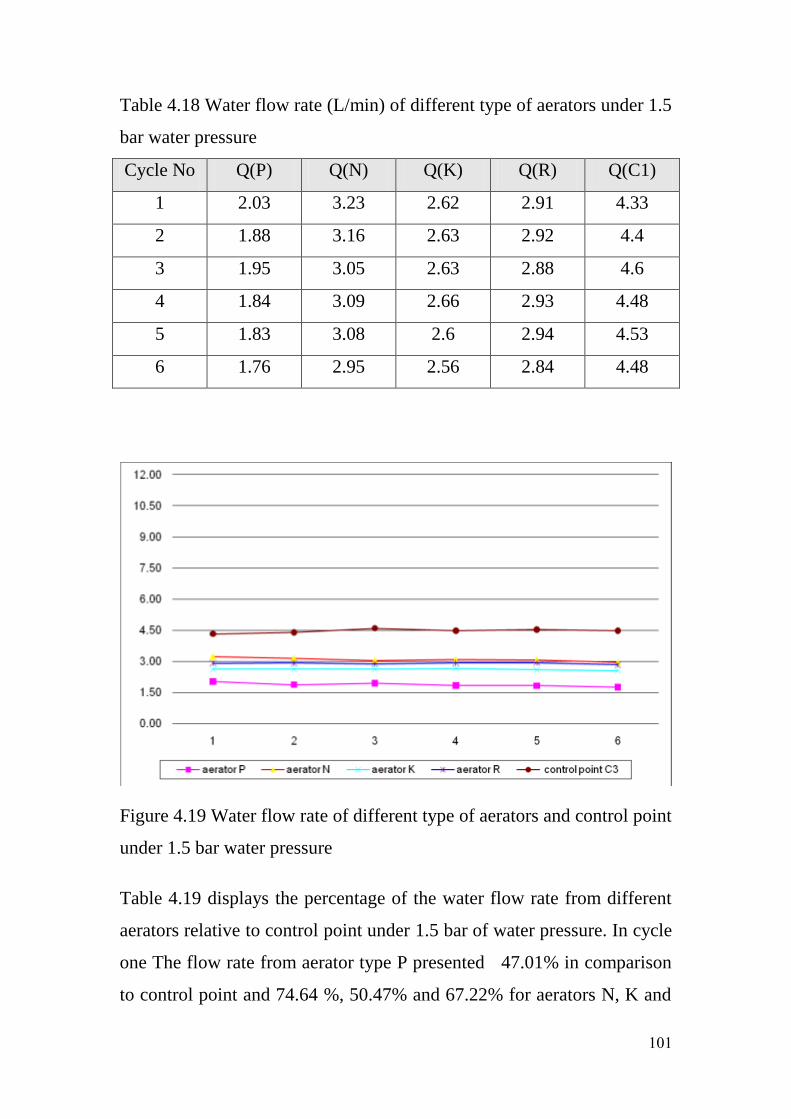
111
Table 4.18 Water flow rate (L/min) of different type of aerators under 1.5
bar water pressure
Cycle No Q(P) Q(N) Q(K) Q(R) Q(C1)
1 2.03 3.23 2.62 2.91 4.33
2 1.88 3.16 2.63 2.92 4.4
3 1.95 3.05 2.63 2.88 4.6
4 1.84 3.09 2.66 2.93 4.48
5 1.83 3.08 2.6 2.94 4.53
6 1.76 2.95 2.56 2.84 4.48
Figure 4.19 Water flow rate of different type of aerators and control point
under 1.5 bar water pressure
Table 4.19 displays the percentage of the water flow rate from different
aerators relative to control point under 1.5 bar of water pressure. In cycle
one The flow rate from aerator type P presented 47.01% in comparison
to control point and 74.64 %, 50.47% and 67.22% for aerators N, K and
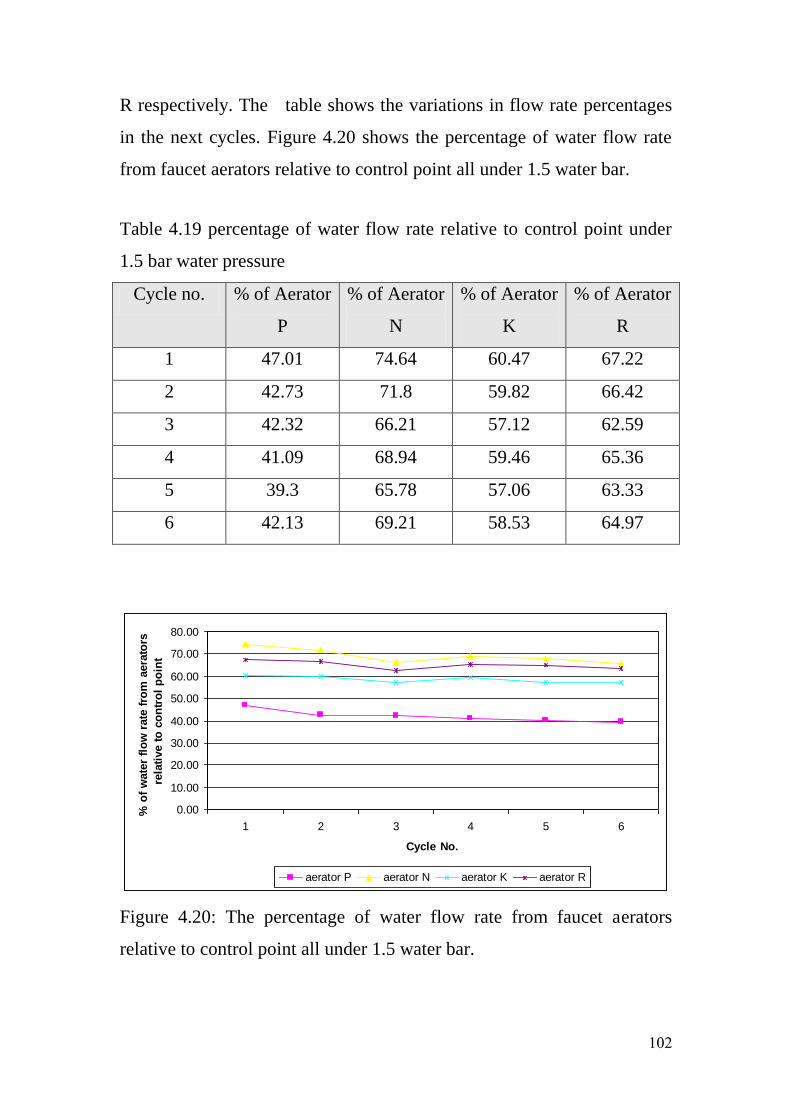
112
R respectively. The table shows the variations in flow rate percentages
in the next cycles. Figure 4.20 shows the percentage of water flow rate
from faucet aerators relative to control point all under 1.5 water bar.
Table 4.19 percentage of water flow rate relative to control point under
1.5 bar water pressure
Cycle no. % of Aerator
P
% of Aerator
N
% of Aerator
K
% of Aerator
R
1 47.01 74.64 60.47 67.22
2 42.73 71.8 59.82 66.42
3 42.32 66.21 57.12 62.59
4 41.09 68.94 59.46 65.36
5 39.3 65.78 57.06 63.33
6 42.13 69.21 58.53 64.97
0.00
10.00
20.00
30.00
40.00
50.00
60.00
70.00
80.00
1 2 3 4 5 6
Cycle No.
% o
f w
ate
r fl
ow
rate
fro
m a
era
tors
rela
tive t
o c
on
tro
l p
oin
t
aerator P aerator N aerator K aerator R
Figure 4.20: The percentage of water flow rate from faucet aerators
relative to control point all under 1.5 water bar.

113
At the end of the study the all aerators were dismantled. It was observed
that sediments clogged part of the aerators. (See Figure A.4 in the
Appendix A). The sediments seemed to be more in aerators under 1.5 bar
and 2 bar. In the next chapter a discussion of the above mentioned results
will be demonstrated.
114
Chapter 5 - Discussion
As shown in Table 4.12, the different values of HPC in the aerators
(regardless of their type) and the control points under the same water
pressure, reflected that under a 2 bar water pressure, the HPC
concentrations exceeded the HPC in the control point (faucet without
aerator) during cycles 2, 3, 5 and 6. Furthermore, under 1.5 water bar, the
HPC concentrations in the aerators exceeded the HPC in the control point
in all cycles except cycle 1. On the other hand, under 2.5 bar water
pressure the HPC concentrations in the aerators was less than the HPC in
the control point during all cycles except cycle 5. This may lead to the
conclusion that high water pressure could increase the flow of the water
and inhibit the accumulation of sediments in the aerators, thus enhancing
bacterial growth. These results confirmed the outcome reached by
Momba (2000) that, sediment promotes bacterial growth in water.
It is worth mentioning that, as shown in Table 4.8 during all cycles except
cycles 5 and 6, the HPC concentration in the phase three water tank in
Dubai International Academic City (DIAC) exceeded the threshold level
of 500 cfu/ml. This threshold is recommended by Dubai Municipality as
well as international standards. This indicated that the level of residual
disinfectant was insufficient in the water system in cycle 1 to cycle 4. It is
also useful to point out that the occurrence of HPC concentration was
relatively high in comparison to results from other studies. For example
Francisque et al. 2009, Huang and E. 2007 and Delahaye et al. 2003.
115
The results indicated that, the monitoring of the water quality in the water
distribution system may be insufficient as, the HPC level in the tank from
cycle 1 to cycle 4 (October-2101 until January-2011) was very high. It
appears DEWA does not conduct a regular test for HPC. An interview
with DEWA staff revealed that, only total coliform and E.coli tests were
conducted on regular basis on the external water supply system. This
practice does not fulfill the recommendations made by Reasoner (2004)
that, HPC tests should be conducted in parallel with total coliform tests
on water distribution samples, because the high HPC content may inhibit
the growth of coliform bacteria (Allen et al. 2004).
Furthermore in cycle two HPC concentration dramatically increased in
DIAC water tank although the water temperature and pH of the water did
not change from cycle one. This indicated that the disinfectant
concentration had decreased in the water supply.
In cycle two there was a dramatic increase in the HPC concentration in
the water tank as seen in Table 4.8, however there was a decrease in HPC
concentration in all types of aerators N, R, K and P as seen in Tables 4.1
to 4.4, this may be due to contamination from the source itself. Since
most of the campuses in DIAC were off on Friday and Saturday which
means water was stored in the tank for two days prior to collection of the
water samples.
By considering the average HPC bacteria concentration in the aerators
regardless of the different water pressure, in cycle 5 and 6, as shown in
Tables 4-1 to 4-5, it was noted that the lowest average concentration was
116
found in aerator type P. As mentioned in chapter three this type is
unbreakable single piece insert which provided non-splashing and non-
aerated spray additionally, it is a pressure compensating aerator which
may has less effect on bacterial growth.
As presented in Table 4.8, it is interesting to note that the HPC
concentration in the water tank at the end of the study was reduced to
levels below 500 cfu/ml which met the standard of water quality in
Dubai. Moreover, the temperature of the water in DIAC tank phase three
was 36 C○ in the first cycle on October then, gradually reduced to 31 C
○
in cycle 6 on March as shown in Table 4.13. The reduction in water
temperature was not very significant in comparison to air temperature
fluctuation over the seasons. This might be because of the source of the
water supply from desalination plants normally produces warm water.
The reduction of HPC level over the cycle confirm previous studies that
there is a positive correlation between the water temperature and HPC
concentration (Carter et al. (2000), Francisque et al. (2009))
Moreover there was significant variations between water temperature in
the water tank and water temperature from the faucets as seen in table
4.13, it is worthy mentioning that the air conditioning in the washroom
area was the main reason for the lower temperature in the washroom.
Furthermore, there was quite a long distance for water to travel between
the water tank in phase three and washrooms. In addition, it is useful to
mention that all samples and measurements were taken in the early
morning except for cycle 1 in which the samples were taken evening
time. This is the reason for the high temperature of the water from the
aerators in cycle 1.
117
Previous studies conducted by Francisque et al. (2009) and Carter et al.
(2000) concluded that alkalinity of the water enhances the HPC growth.
However, as seen in chapter four the result of HPC from water tank
samples revealed the opposite, when the pH of the water tank was 7.9 in
cycle one the HPC concentration was 19,460 cfu/ml and when the pH
increased to 8.9, the HPC dramatically dropped to 230 cfu/ml. I was
unable to find the source of the carbonate in the external distribution
system which enhanced the increase of the pH result because, there was
no data available.
The drop in HPC levels in DIAC water tank after cycle two which was
after DEWA recognize that, there had been a breakdown in the vacuum
regulator for water chlorination in December 2010. This meant that
manual chlorination in Muchrif complex reservoir with calcium hypo-
chloride could have reduced the HPC in cycle two from 4600 cfu/ml to
17,500 cfu/ml. However, the HPC concentrations remained high in all
faucets. The reason for this could be that, the plumbing material in the
DIAC system promoted the re-growth of the bacteria which confirm
previous studied by Moritz et al. (2010), that plastic pipes enhancing the
formation of the bacteria and biofilm.
The aerator works as obstacle for the sediment and inhibit it to flow with
water which could has two effects. The first effect is that, the sediments
may contain biodegradable organic matter which setup foundation for the
forming of biofilm (Momba 2000). The second effect is deterioration of
the efficiency of the aerators by reducing the water flow rate over time;
thus regular maintenance and cleaning is required to avoid deterioration.
118
It was noted that, flow rate from all faucets under 1.5 bar and 2 bar water
pressure both with and without aerators, have a flow rate that complies
with green building features that maximum flow rate is 6 L/min.
Additionally, the water flow rate from aerator type P confirm the
manufacturer claim that it has potential to keep a constant water flow
regardless of the water pressure as seen in tables 4.14 to 4.18.
Additionally it offered higher water saving than the other types with an
average saving of 58% to 83% in comparison to the control point. This
type was closely followed by type K, R and N. with saving 41% to 65%,
24% to 59% and 21% to 53% respectively. Although there is higher water
saving with type P, it may also cause inconvenience to the end user due to
slow rate.
Moreover, as seen in Tables 4.14 and 4.18 a decrease in the flow rates
from aerators under 1.5 bar and 2 bar were noted over the cycles despite
the flow rate in the control points under the same pressure being slightly
increased. This was because of an accumulation of sediments in the
aerators may have compromised their efficiency.
On the other hand, it was noted that all faucets under 2.5 pressure of
water bar excluding the control point (the faucet without aerator)
complied with the green building features proposed by DEWA. The flow
rate in the control point was above 9 L/min and the flow rate in type P
was the least followed by types K, R and N respectively however, a gain
the flow rate in Type P might caused inconvenience to the end users. It
was obvious that type P saved about 83 % of the water relative to the
control point followed by 66% in type K then 65 % in type R and 53% in
type N.
119
Chapter 6 - Conclusion and Recommendations
6.1 Conclusion
In short, water scarcity has forced many regulations to appear to enhance
water conservation. One of the green building features is water saving
using plumbing fixtures such as faucet aerators. The rationale for the
study was to investigate the effect of the water faucet aerators on bacterial
growth which could have affected the quality of the water. An
experimental method was followed consequently, during the six months,
120 water samples were collected from Dubai International Academic
City's (DIAC) plumbing system, mainly from faucet with and without
aerators under different water pressure. Also water samples from the tank
in phase three were tested. HPC test was performed on the samples in
Dubai Municipality Central Laboratory. Additionally, water parameters
included pH, Temperature of the water and air temperature in addition to
water flow rate were measured in the field.
The results revealed that, the supplied water to DIAC campus was
contaminated with HPC bacteria. The concentration of the bacteria
exceeded the threshold level of 500 cfu/ml set by Dubai Municipality. In
addition to contamination of the water supplied from outside DIAC there
were another contributors to enhance the growth of the bacteria inside the
water supply system in DIAC such as, P.V.C pipes and the faucet
aerators. Although the supplied water was treated after cycle four, which
resulted in reducing the HPC concentration in the water tank, the HPC
concentration in the internal water supply system remained high because
of the above mentioned contributors.
111
It was noted that the HPC concentration in water from faucet aerators
under 1.5 and 2 water bar greater than the HPC concentration in water
from faucet control point (Faucet without aerator). This result indicated
that the faucet aerators under and less than 2 bar water pressure enhance
HPC bacterial growth in the water supply system. As the low water
pressure cause accumulation of the sediments on the internal surface of
the aerators. This was not the case with faucets under 2.5 water bar, as
there was no significant different in the HPC level between the aerators
and the control point under 2.5 water bar pressure.
Despite the fact that 2.5 water bar has less impact on the bacterial growth
than 2 and 1.5 water bar pressures, the contamination of the HPC
occurred in the entire internal water supply system including faucet with
or without aerator due to pluming material. This result lead to a
conclusion that, regular maintenance for the internal water supply system
can avoid such contamination. As understood from with the Facility
Management in DIAC that, usually no intervention or treatment by DIAC
to the internal water supply system since the water is supplied by DEWA.
However; as seen in chapter four that the supplied water itself was
contaminated until cycle four.
Furthermore, the current monitoring practice for water quality in external
water supply system is insufficient. As they use only E-coli and Total
coliform tests. The presence of HPC in high concentration may inhibit the
growth of Total coliform and E-coli bacteria which may give a good
indication for the water quality however it is not. So it is recommended to
perform the total coliform and E-coli tests in parallel with the HPC test.
111
It is worthy to mention that, I have been informed by DEWA inspector
that, they are going to implement such practice in their monitoring.
All aerators have the potential to conserve water, however; the water
saving depends on the aerator types and the different water pressure. In
this study the saved water was from 20 % to 80 %. The aerator type P
was the premium saver. Additionally, it confirmed the manufacturer
claimed that aerator type P has a potential to keep constant water flow
rate regardless of the water pressure variations, since this type can
compensate the water pressure. On the other hand, this type has
disadvantage that it may compromise the end users due to its low flow
rate.
It is worthy to mention that, the water flow rate from faucets (under water
pressure less than 2 water bar) whether they have aerator or not met the
green building requirements that the maximum water flow rate is
maximum 6 L/ min. Using the aerator under water pressure less than 2
water bar has two impacts;
The 1st impact which is positive as it reduced the water splash and
produces a fine stream flow. On the other hand it has disadvantage that,
the aerator under water pressure less than 2 bar enhanced the re-growth of
bacteria due to accumulation of sediment on the internal surface of the
aerator. This disadvantage can be avoided by regular maintenance for the
aerators. This period should not exceed three month or, based on the
results of HPC tests which is less.
Additionally, the efficiency of faucet aerators in water saving under 2 bar
and 1.5 bar were reduced due to accumulation of sediments in the internal
surface of the aerators.
112
Furthermore, the water flow rate from faucets under 2.5 water bar
discovered that, using faucets with aerators can save water based on the
aerator types. In this research, aerator type P was the premium saver
followed by type K, R and N respectively.
In conclusion, it is useful to mention that, although there are benefits
from using aerators in reduce the water splash in addition to water and
energy saving, aerator use under low water pressure condition has
disadvantages that it may enhance bacterial growth. This can be
minimized through extensive water monitoring and maintenance of the
plumbing fixtures.
6.2 Recommendation
Finally, the following are highly recommended:
It is suggested that periodic water samples be collected from the internal
water supply system in DIAC for HPC periodically regardless of the
status of water quality supplied by the main source, because the internal
plumbing may compromise the water quality. Particularly, when
retrofitting fixtures are fixed, since these fixtures have the potential to
conserve the water. This means the water will be stored for a longer
period of time than expected in original design of the tank. This might
result in stagnation of the water which could contribute to the re-growth
of bacteria.
113
It is highly recommended that implementation maintenance and cleaning
of the aerators based on the water sample test's results discussed in an
aforementioned point. Otherwise execution of three monthly maintenance
is recommended to eliminate the growth of bacteria be conducted to
eliminate formation of biodegradable organic matter on the internal side
of the aerator also to maintain the efficiency water flow via the aerator.
Future studies should consider the followings:
-To increase the number of aerators under study, also the water
parameters from the external water supply system will be measured in
parallel with measurement from the internal water supply system which
could provide a comprehensive information and date about water
parameters inside and outside the building.
-The time for water sampling should take into consideration month of
July since the temperature in this month at its highest the maximum in
U.A.E during this month.
- The washrooms where the aerators will be fixed should not be air
conditioned since this factor may affect the result.
-The future study should think about the impact of water saving on the
water pipes size and water tank volume, which have cost implication
especially in buildings where retrofitting of plumbing fixtures are
installed.
- The future studies should study the impact of other plumbing fixtures
such as showerhead on the bacterial growth.
114
References:
Absel, R. (2010). Free Water-Saving Devices for UAE Homes. Gulf news
[online] 13 January, [Accessed 15 August 2010]. Available at:
http://gulfnews.com/news/gulf/uae/environment/free-water-saving-devices-for-
uae-homes-1.567149
Abu Dhabi Urban Planning Council (2010). Estidama [Online]. [Accessed 7
March 1011]. Available at:
http://estidama.org/
Al-Mazroui, H. & AL-Mansouri, M. (2010). International Conference on
Agrarian Reform and Rural Development [online]. [Accessed 15 February
2011]. Available at:
http://www.google.ae/search?q=Al-Mazroui+%26+AL-
Mansouri.+International+Conference+on+Agrarian+Reform+and+Rural+D
evelopment&sourceid=navclient&ie=UTF-
8&rlz=1T4ADFA_enAE375AE378&aq=f&aqi=&aql=&oq
Allen, M., Edberg, C. & Reasoner, D. (2004). Heterotrophic Plate Count
Bacteria-What is their Significance in Drinking Water?. International Journal
of Food Microbiology [Online]. Vol.92.PP. 265-274. [Accessed 20 October
2010]. Available at: http://www.sciencedirect.com/
Anderson. J., Sud. S. & Paper. T. (2002). My Data 360 [online]. [Accessed 9
January 2011]. Available at:
www.data360.org
115
Bartram, J., Contruvo, J., Exner, M., Fricker, C. & Glasmacher, A. (2003).
Heterotrophic Plate Counts and Drinking Water Safety .London: IWA
publishing.
Binggeli, C. (2010). Building Systems for Interior Designers. 2nd ed. New
Jersey: John Wiley & Sons.
Bokaders, V. & Block, M. (2010). The whole Building Hand Book. Sterling:
Earthscan.
Carter, T. Rice, E., Buchberger, S. & Lee, Y. (2000). Relationship between
levels of Heterotrophic Bacteria and Water Quality parameter in drinking water
distribution systems. Water Research. [Online]. vol 34(5)PP.1495-1502.
[Accessed 23 October 2010]. Available at: http://www.sciencedirect.com/
Central Intelligence Agency (CIA) (2010). The World Fact book
[online].U.S.A. [Accessed 20 August 2010]. Available at:
https://www.cia.gov/library/publications/the-world-factbook/geos/ae.html
Ciesielski, C., Blaser, M. & Wang, W. (1984). Role of Stagnation and
Obstruction of Water Flow in Isolation of Legionella Pneumophila from
Hospital Plumbing. Applied and Environmental Microbiology [Online]. vol. 84
(5) PP.984-987[Accessed 5 September 2010]. Available at:
http://aem.asm.org/cgi/content/abstract/48/5/984
Dawoud, M. (2005). The Role of Desalination in Augmentation of water
supply in GCC Countries. Desalination [online].vol.186 ,p.p 187-198.
[Accessed 7 October 2010]. Available at: http://www.sciencedirect.com
116
Demriz, M. (2006). Application of Dry Urinals [online]. Germany:
Gelsenkirchen University of Applied Sciences. [Accessed 24 August 2010].
available at:
http://www.allianceforwaterefficiency.org/resource-library/default.aspx
Dubai Electricity and Water Authority (2009). Water Statistics [online]. Dubai:
[Accessed17August2010].Available at:
http://www.dewa.gov.ae/aboutus/waterStats2009.aspx
Dubai Statistical Center (2009). Statistical Yearbook-Emirates of Dubai
Dubai Electricity and Water Authority (2010). Green Building Regulation
[online].[Accessed25August 2010].Available at:
http://www.dewa.gov.ae/images/gb/greenbuilding2010e.pdf
Elie, A. (1992).Concealed Liquid Flow Aerator [online]. [Acceded 4 March
2011]. Available at: w.wipo.int/pctdb/en/wo.jsp?WO=1983001266&IA=US1981001341&http://ww
DISPLAY=STATUS
Environment Agency Abu-Dhabi (2011).Water-savers Campaign [online].
[ Accessed 27 February 2011]. Available at:
http://www.watersavers.ae/en/watersavers.php?p=3
EPA (2010).Water Sense [online]. [Accessed 10 January 2011]
Available at:
http://www.epa.gov/WaterSense/products/showerheads.html
Ford, T. (1999). Microbiological Safety Of Drinking Water: United States and
Global Perspectives [online].107(1) PP.171-206 .[Accessed 5 September
2010]. Available at:
http://www.ncbi.nlm.nih.gov/pmc/articles/PMC1566363/
117
Foster, K. Stelmack, A. and Hindman, D. (2007). Sustainable Residential
Design. New Jersey: John Wiley & Sons.
Friedler, E. Kovalio, R. & Galil, N. (2005). On Site Grey-water treatment and
Reuse in Multi-story Buildings. Water Science Technology. [online].vol.51(10)
pp.187-194.[Accessed 22 August 2010].available at:
http://gwri-ic.technion.ac.il/pdf/Professors/Noah_Galil/3.pdf
Francisque, A., Rodriguez, M., Moreno, L. , Sadiq. R. & Proulx, F. (2009).
Modeling of Heterotrophic Bacteria Counts in a Water Distribution System.
Water Research [on line ] vol.(43)PP. 1075-1087. [Accessed on 25 October
2010]. Available at
http://www.sciencedirect.com
Garrett, R. (2000). Hot and Cold Water Supply. 2nd ed. Oxford: Blackwell.
Gleick, P. (1999). The Human Right to Water. Water Policy [On line]
vol.(1)PP. 487-503.[Accessed on 5 March 2011]. Available at
http://webworld.unesco.org/Water/wwap/pccp/cd/pdf/educational_tools/course
_modules/reference_documents/issues/thehumanrighttowater.pdf
Global Footprint Network (2010). Ecological Footprint and Biocapacity [online].
[Accessed on 15 March 2011]. Available at:
http://www.footprintnetwork.org/images/uploads/2010_NFA_data_tables.xls
Gray, N. (2008). Drinking Water Quality Problems and Solutions. 2nd ed.
Cambridge: Cambridge University Press.
118
Harvey, L. (2006). A Handbook on Low-Energy Buildings and District-Energy
Systems.1 st ed. London: Danny Harvey.
Heroes of the U.A.E (2011). Water-savers [Online]. [accessed 6 February
2011]. Available at:
http://water.heroesoftheuae.ae/en/conservation/water-conservation/how-does-it-
work.html
Huang, W. and Lin, Y. (2007).A controlled Study of Legionella concentration
in Water from Faucets with Aerators or Laminar Water Flow Devices.
Infection Control and Hospital Epidemiology [online]. vol.28(6) pp 765-766.
[Accessed 1 October 2010]. Available at
http://www.specialpathogenslab.com/SPL-
Advantage/Huang%20and%20Lin%20ICHE%202007-Aerators-Laminar-
Flow-Infection-Control.pdf
Hargreaves, J., Shireley, L. Bren., V. Fillipi, G., Lacher, C., Esslinger, V. and
Watne, T. (2001). Bacterial Contamination Associated with Electronic Faucets.
A new Risk for Healthcare Facilities. Infection Control and Hospital
Epidemiology [Online]. vol.22 (4) pp 202-205. [Accessed 5 November 2010].
Available at: http://www.sciencedirect.com
H2O (2010). ‘DESAL COSTS. UAE spends Dh 11.8 billion on desalination’,
September, p. 6.
Ideal Standard (2005). Water Saving Ideal [online]. Kingston Upon Hull:
[Accessed 31 July 2010]. Available at:
http://www.thebluebook.co.uk/pdfs/brochures/Mixed-Watersaving06.pdf
119
Jones, L. (2008). Environmentally Responsible Design. 1st ed. New Jersey:
John Wiley & Sons.
Juror, J. (1946). Life Magazine. Waterfall Faucet [Online]. [Accessed 5 March
2011]. Available at:
http://books.google.ae/books
Kakande, Y. (2008). Desalination plant forced to close by red tide may reopen.
The National.[online] 6 November .[Accessed 26 February 2011]. Available at:
http://www.thenational.ae/news/uae-news/desalination-plant-forced-to-close-
by-red-tide-may-reopen
Kappstein, I., Grundmann, H., Hauer, T., & Niemeyer, C. (2000). Aerators as
Reservoir of Acinetobacter Junii , An Outbreak of Bacteraemia in Paediatric
Ancology Patinas. Journal of Hospital Infection [online] vol. 44 pp. 27-30
[Accessed 10 June 2010]. Available at: http://www.sciencedirect.com/
Lattemann, S. & Hopner, T. (2008) Environmental Impact and Impact
Assessment of Seawater Desalination. Desalination [Online]. vol. 220 pp.1-15.
[Accessed 20 August 2010]. Available at:
http://www.desline.com/articoli/8958.pdf
Lehtola, M. Laxander, M. Miettinen, I. Hirvonen, A. Vartiainen, T. &
Martikainen, P. (2006). The effect of changing Water Flow Velocity on the
formation of biofilms and Water Quality in Pilot Distribution System
Consisting of Copper or Polyethylene Pipes. Water Research [.online]. vol. 40.
PP 2151-2160. [Accessed 5 September 2010].Available at:
http://www.sciencedirect.com
121
LEED (2009). Reference Guide for Green Building Design and Construction.
Washington: Green Building Council.
Mihelcic, J. & Zimmerman, J. (2010). Environmental Engineering:
Fundamentals, Sustainability, Design. Hoboken: John Wiley & Sons.
Moritz, M. Flemming, H. & Wingender, J. (2010). Integration of pseudomonas
aeruginosa and Legionella pneumophila in drinking water biofilms grown on
domestic plumbing materials. International Journal of Hygiene and
Environmental Health [online]. vol.213pp.190-197. [Accessed 12 September
2010]. Available at:
http://www.sciencedirect.com/science
Moughtin, C. & Shirley. P. (2005). Urban Design: Green Dimension.
Amsterdam: Elsevier.
NAHB Research Center (2001). Low Flow Plumbing Fixtures:
[Online].Maryland. [Accessed 31 July 2010].Available at:
http://www.toolbase.org/Building-Systems/Plumbing/low-flow-plumbing-
fixtures
(Neoperl 2010). [online]. [Accessed 15 September 2010].available at
http://www.neoperl.net/en/oem/products/aerators/pressurecompensating.html
Nguyen, C., Edwards, M., DiGiano, F., Elfland, C. & Tech, V. (2008).
Resolving Water Quality Issues in Premise Plumbing Systems with Advance
Water Conservations Features. University of North Carolina at Chapel Hill
[On line]. [Accessed 3 November 2010]. Available
at:www.nzsses.auckland.ac.nz/.../2008/.../Nguyen-Edwards-DiGiano-Elfland.
121
Orenstein, P. Consolacion, N. Amihod, B. Perna, S. & Miller, M.(2006).
Infection Control and Plumber: Neonatal ICU Outbreak OF Pseudomonas and
Stenotrophomonas Traced to Contamination Water Tap Aerator. Infection
Prevention and Control [online]. vol.34(5) PP73-74.[Accessed 1 Oct. 2010].
Available at:
http://www.ajicjournal.org/article/S0196-6553(06)00663-8/abstract
Plumber surplus (2010). Bathroom Faucets.[online].California:[Accessed 23
August 2010]. Available at:
http://www.plumbersurplus.com/Cat/Bathroom-Faucets/99
Prestomat2000 (2011). Self closing taps [online]. [accessed 9 February 2011].
Available at :
http://www.archiexpo.com/prod/presto/commercial-washbasin-self-closing-
taps-211-176263.html
Reasoner, D. (2004).Heterotrophic Plate Count Methodology in the United
States. International journal of Food Microbiology [on line]. vol.(92) PP.307-
315.[Accessed 22 October 2010]. Available at:
http://www.sciencedirect.com/
Rogers, J. Dowsett, A. Deennis, P. Lee, J. & Keevil, C. (1994). Influence of
Temperature and Plumbing Material Selection on Biofilm Formation and
Growth of Legionella Pneumophila in Model Water System Containing
Complex Microbial Flora. Applied And Environmental Microbiology [online].
vol.6(5) pp.1585-1592.[Accessed 2 September 2010]. Available at:
http://www.ncbi.nlm.nih.gov/pmc/articles/PMC201521/pdf/aem00022-
0203.pdf
122
Roaf, S., Fuenes, M. &Thomas, S. (2007). Ecohouse. Oxford: Elsevier.
RST ,Water saving system (2010). [On line]. [Accessed 6 Oct. 2010]
Available at:
http://www.rst.co.za/index.php?option=com_content&view=article&id=47&Ite
mid=54
Shane, W. (2008). Persistence of Spore Forming Bacteria On Drinking Water
Biofilm and evaluation of Decontamination Method. M,sc. Thesis. University
of Cincinnat.[Accessed 7 September 2010]. Available at:
http://etd.ohiolink.edu/send-
pdf.cgi/SHANE%20WILLIAM.pdf?ucin1205164893
Stein, B. Reynolds, J. Grondzik, W. and Kwok, A. (2006).Mechanical and
Electrical Equipment for Buildings.10 th ed. New Jersey: John Wiley & Sons.
Strelkauskas, A. Strelkauskas, J. Strelkauskas, D. (2010). Microbiology a
Clinical Approach. New York: Garland Science.
Sustainable Building Design manual.(2004). Delhi: Multiplex [On line].
[Accessed 25 February 2011]. Available at :
http://books.google.ae/books
Thompson, J and Sorvig, K. (2008). Sustainable Landscape Construction.2nd
ed. Washington: Island Press.
UNESCO (2010). World Water Assessment Program.[on line]. [Accessed 10
January 2011]. Available at: http://www.unesco.org/water/
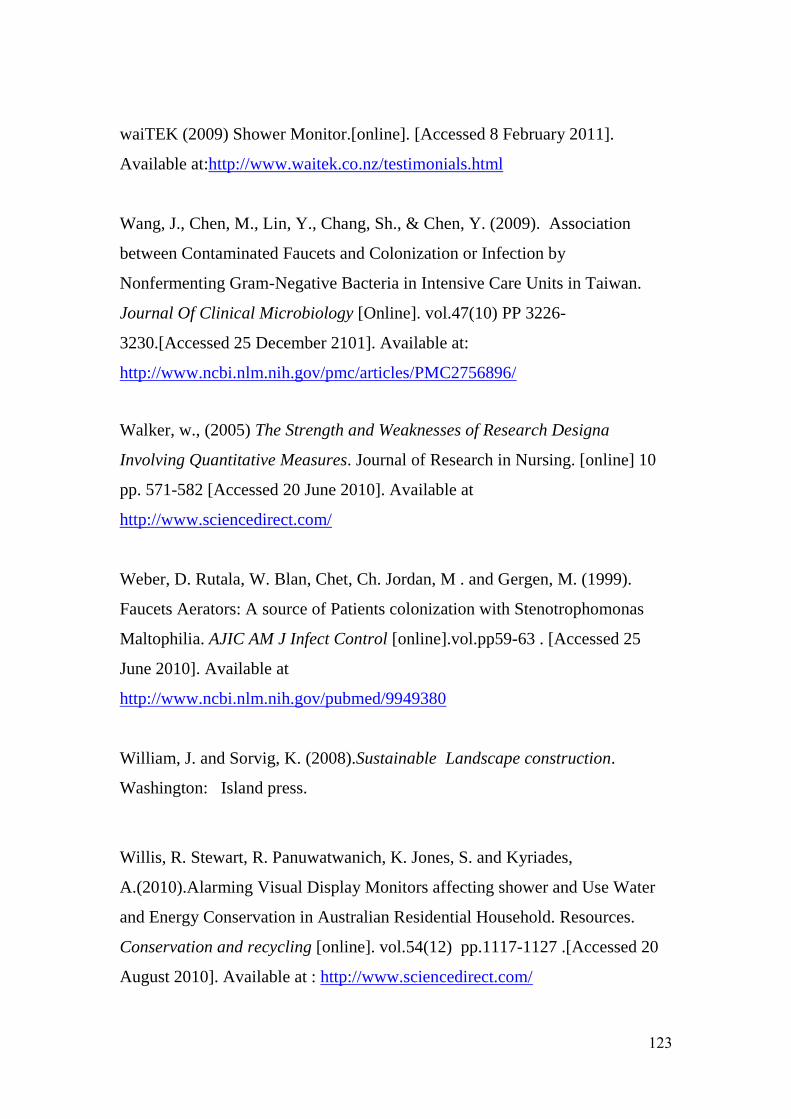
123
waiTEK (2009) Shower Monitor.[online]. [Accessed 8 February 2011].
Available at:http://www.waitek.co.nz/testimonials.html
Wang, J., Chen, M., Lin, Y., Chang, Sh., & Chen, Y. (2009). Association
between Contaminated Faucets and Colonization or Infection by
Nonfermenting Gram-Negative Bacteria in Intensive Care Units in Taiwan.
Journal Of Clinical Microbiology [Online]. vol.47(10) PP 3226-
3230.[Accessed 25 December 2101]. Available at:
http://www.ncbi.nlm.nih.gov/pmc/articles/PMC2756896/
Walker, w., (2005) The Strength and Weaknesses of Research Designa
Involving Quantitative Measures. Journal of Research in Nursing. [online] 10
pp. 571-582 [Accessed 20 June 2010]. Available at
http://www.sciencedirect.com/
Weber, D. Rutala, W. Blan, Chet, Ch. Jordan, M . and Gergen, M. (1999).
Faucets Aerators: A source of Patients colonization with Stenotrophomonas
Maltophilia. AJIC AM J Infect Control [online].vol.pp59-63 . [Accessed 25
June 2010]. Available at
http://www.ncbi.nlm.nih.gov/pubmed/9949380
William, J. and Sorvig, K. (2008).Sustainable Landscape construction.
Washington: Island press.
Willis, R. Stewart, R. Panuwatwanich, K. Jones, S. and Kyriades,
A.(2010).Alarming Visual Display Monitors affecting shower and Use Water
and Energy Conservation in Australian Residential Household. Resources.
Conservation and recycling [online]. vol.54(12) pp.1117-1127 .[Accessed 20
August 2010]. Available at : http://www.sciencedirect.com/

124
World Health Organization (2003). Domestic Water Quantity Services Level
and Health. Switzerland: World Health Organization.
Wright, R. & Boorse, D. (2011). Environmental Science Toward A Sustainable
Future. San Francisco: Pearson.

125
Appendix A
Photos of DIAC plumbing material in DIAC washroom
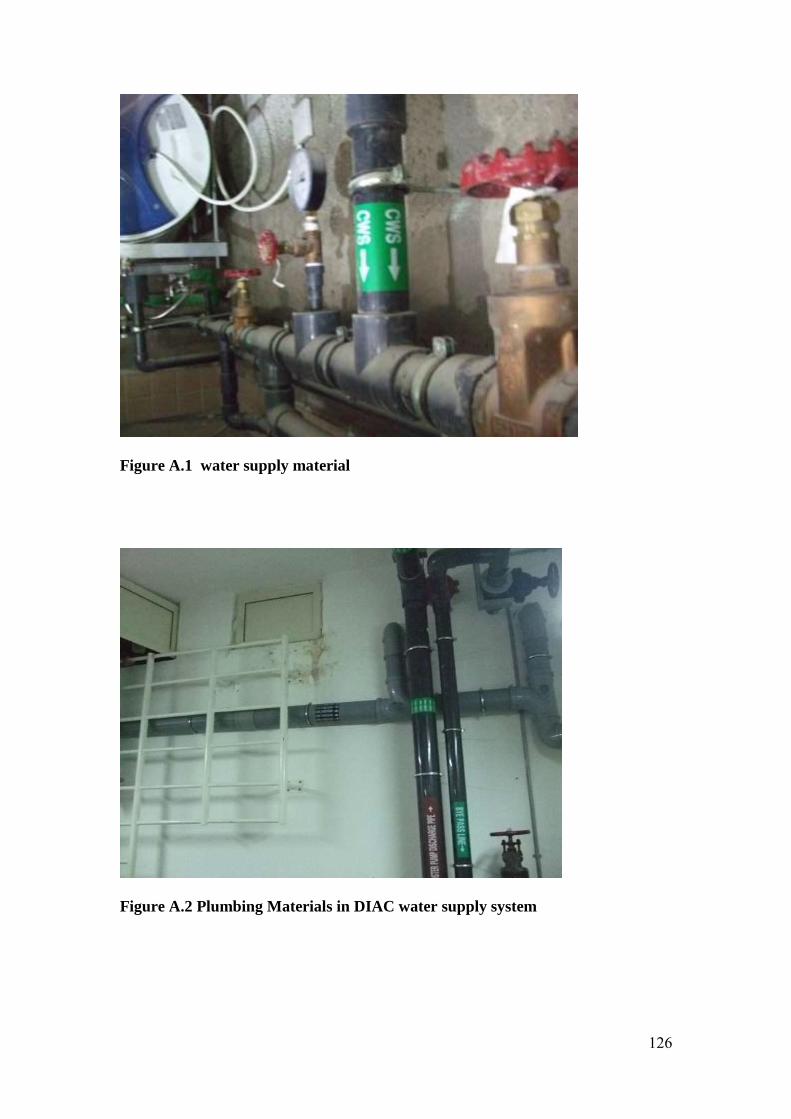
126
Figure A.1 water supply material
Figure A.2 Plumbing Materials in DIAC water supply system
127
Figure A.3 Washroom in DIAC
Figure A.4 Sediments accumulation on the faucet aerator

128
Appendix B
Sample of Dubai Municipality laboratory test report