Embed Size (px)
Citation preview

AD-A272 271
THE EFFECTS OF DISSOLVED OZONE ON THE CORROSION BEHAVIOR
OF 304 STAINLESS STEEL, MONEL 400 AND NAVAL BRASS
IN ARTIFICIAL SEA WATER
B.E. Brown and D.J. DuquetteRensselaer Polytechnic Institute
Materials Engineering DepartmentTroy, New York 12180-3590
OCTOBER 1993
Final Report to the Office of Naval Research
Contract No. N00014-90-J-1439
Reproduction in whole or part for any purpose of the U.S. Government ispermitted. Distribution of this document is unlimited.
DTICQ ELECTENOV 0 9 1993
_ 93-27218
I C -T 17•1 fllk l ., '4IIU

The Effects of Dissolved Ozone on the Corrosion Behavior of
304 Stainless Steel, Monel 400 And Naval Brass
in Artificial Sea Water
B.E. Brown and D.J. DuquetteRensselaer Polytechnic Institute
Materials Engineering DepartmentTroy, New Ycrk 12180-3590
Accesion -:-
NTIS , j
D 1
, •,•;:i~i... .... .. ..... .............
by
I-,i i

CONTENTS
LIST OF TABLES ........................................................................................ iv
LIST OF FIGURES ...................................................................................... v
ACKNOW LEDGM ENT .............................................................................. vii
ABSTRACT ................................................................................................ viii
1. INTRODUCTION ............................................................................... 1
2. HISTORICAL BACKGROUND .......................................................... 3
2.1 Ozone Chem istry .................................................................... 3
2.2 Ozone Production ..................................................................... 3
2.3 Ozone Solubility ..................................................................... 4
2.4 Ozone as a Biocide .................................................................. 5
2.5 Corrosion of M etals in Ozone .................................................. 6
2.5.1 Iron Based Alloys ...................................................... 6
2.5.2 Copper Alloys ............................................................ 8
2.5.3 Other Alloys .............................................................. 9
3. EXPERIM ENTAL PROCEDURE ...................................................... 10
3.1 Specim en Preparation .......................................................... 10
3.2 Solutions ................................................................................ 11
3.3 Electrochem ical Test Procedures ......................................... 12
3.3.1 Linear Polarization Resistance ............................... 13
3.3.2 Crevice Corrosion Testing ....................................... 14
3.3.3 Cyclic Polarization ................................................. 15
4. RESULTS & DISCUSSION .............................................................. 18
4.1 Steady State Corrosion Potential .......................................... 18
4.1.1 304 Stainless Steel .................................................. 18
ii

4.1.2 M onel 400 .................................................................... 19
4.1.3 N aval Brass .............................................................. 19
4.2 Breakdown Potential ............................................................ 22
4.2.1 304 Stainless Steel .................................................. 22
4.2.2 M onel 400 ................................................................. 24
4.3 Repassivation Potential ......................................................... 27
4.3.1 304 Stainless Steel .................................................. 27
4.3.2 M onei 400 ................................................................. 27
4.4 Crevice Corrosion Testing .................................................... 30
4.5 Corrosion Rate M easurem ents .............................................. 34
4.5.1 304 Stainless Steel .................................................. 34
4.5.2 M onel 400 ................................................................. 34
4.5.3 N aval Brass ............................................................. 35
5. CON CLU SION S ................................................................................ 41
6. REFEREN CES .................................................................................. 44
7. APPEND IX ......................................................................................... 46
iiio

LIST OF TABLES
Table I Composition of 304 Stainless Steel .......................... 10
Table II Composition of Monel 400 ....................................... 10
Table III Composition of Naval Brass ..................................... 10
iv

LIST OF FIGURES
Figure 3.1 Cell set-up used for testing naval brass ............. 11
Figure 3.2 Typical electrochemical set-up ............................ 13
Figure 3.3 Crenelated washer ............................................. 15
Figure 3.4 Cyclic polarization curve of 304 stainless steelafter 1 hour of exposure in aerated artificialsea water at 23°C, pH 7.5 ................................... 16
Figure 4.1 The steady state corrosion potential of304 stainless steel as a function of ozoneconcentration in artificial sea waterat 23°C , pH 7.5 .................................................... 21
Figure 4.2 The steady state corrosion potential ofMonel 400 as a function of ozone concentrationin artificial sea water at 23°C, pH 7.5 ............... 21
Figure 4.3 The steady state corrosion potential ofnaval brass as a function of ozone concentrationin artificial sea water at 23°C, pH 7.5 ............... 22
Figure 4.4 The breakdown potential of 304 stainless steelas a function of ozone concentration inartificial sea water at 23°C, pH 7.5 ................... 25
Figure 4.5 Cyclic polarization curves of Monel 400 as afunction of ozone concentration after 1 hour ofexposure in artificial sea water at 23°C,pH 7.5 ................................................................... 26
Figure 4.6 The repassivation potential of304 stainless steel as a function of ozoneconcentration in artificial sea waterat 23°C, pH 7.5 .................................................... 28
Figure 4.7 The potential difference between the repassivationand the steady state corrosion potential of304 stainless steel as a function of ozoneconcentration in artificial sea waterat 23°C, pH 7.5 .................................................... 29
V

Figure 4.8 The repassivation potential of Monel 400 as afunction of ozone concentration in artificialsea water at 23°C, pH 7.5 .................................. 29
Figure 4.9 The potential difference between the repassivationand the steady state corrosion potential ofMonel 400 as a function of ozone concentrationin artificial sea water at 23°C, pH 7.5 ............... 30
Figure 4.10 30 day crevice corrosion test of 304stainless steel exposed to 0.8 mg/L ozone inartificial sea water at 23'C, pH 7.5. 50.4x ...... 33
Figure 4.11 30 day crevice corrosion test of 304stainless steel exposed to aeratedartificial sea water at 23'C, pH 7.5. 50.4x ...... 33
Figure 4.12 The corrosion rate of 304 stainless steel as afunction of ozone concentration in artificialsea water at 23°C, pH 7.5 ................................... 37
Figure 4.13 The corrosion rate of Monel 400 as a function ofozone concentration in artificial sea waterat 231C, pH 7.5 .................................................... 37
Figure 4.14 Linear polarization diagram of naval brassin aerated artificial sea water at 23CC, pH 7.5 ..... 38
Figure 4.15 The corrosion rate determined from the initialLPR slope of naval brass, as a function of ozoneconcentration in artificial sea water at 23°C,pH 7.5. This data is believed to reflect thecorrosion rate of zinc, which controls thecorrosion rate of naval brass in sea water ...... 39
Figure 4.16 The corrosion rate determined from the secondaryLPR slope of naval brass, as a functionof ozone concentration in artificial sea waterat 23°C, pH 7.5. This data is believed toreflect the corrosion rate of copper due todezincification occurring on the surface ............. 40
vi

ABSTRACT
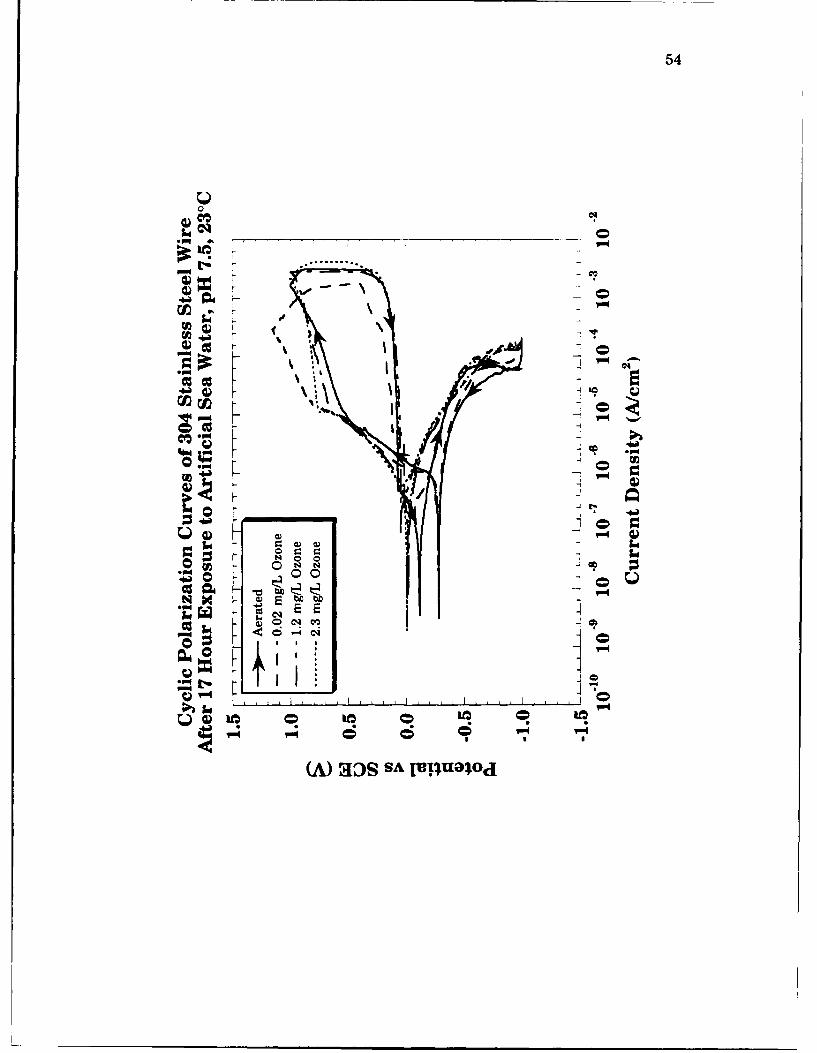
The effects of 0.02, 1.2 and 2.3 mg/L ozone on the corrosion behavior of
304 stainless steel, Monel 400, and naval brass were studied at room temper-
ature in artificial sea water at pH 7.5, and the results were compared with
those obtained for aerated solutions. Corrosion potentials and cyclic polariza-
tion curves were measured after 1 and 17 hour exposure times.
Instantaneous corrosion rates were measured using linear polarization resis-
tance (LPR) techniques. Long term (30 day) crevice corrosion experiments
were also performed on stainless steel and naval brass in aerated and 0.8
mg/L ozonated solutions.
Increasingly noble corrosion potentials were observed in the cases of
stainless steel and Monel with increasing ozone concentration due to the no-
ble redox potential of ozone. Naval brass, on the other hand, maintained a
fairly constant corrosion potential, independent of ozone concentration, due to
the formation of a bulk corrosion product on the metal surface.
LPR measurements on naval brass reflected the corrosion rates of both
zinc and copper due to dezincification occurring on the metal surface. These
corrosion rates were found to be independent of ozone concentration and ex-
posure time, although it appears that exposure to 0.02 mg/L ozone after 17
hours resulted in complete dezincification at the surface. The corrosion rate
of Monel was found to increase at elevated ozone concentrations, indepen-
dent of exposure time. Stainless steel, however, showed a decreasing corro-
sion rate with increasing ozone concentration after one hour due to ozone
quickly stabilizing the passive film. Extended exposure caused the corrosion
viii

rate of stainless steel to decrease, independent of ozone concentration, indi-
cating that the presence of either oxygen or ozone fully stabilizes the passive
film with time.
Cyclic polarization results for stainless steel showed that increasing
ozone concentrations caused the repassivation potential to shift in the active
direction relative to the steady state corrosion potential, indicating that pits
present on the surface may not repassivate, but continue to grow. Increased
ozone concentrations also initially shifted the breakdown potential in the ac-
tive direction compared to the aerated breakdown potential, indicating a
higher susceptibility to crevice corrosion for short exposure times in ozonated
solutions.
Increasing ozone concentrations shifted the breakdown and repassiva-
tion potentials of Monel 400 active to the steady state corrosion potential, in-
dicating that ozone causes pitting to occur spontaneously in this alloy.
Extended exposure caused the repassivation potential to shift noble to the
corrosion potential indicating that, although pits may continue to nucleate
with time due to the breakdown potential remaining active to the corrosion
potential, these pits are likely to repassivate before becoming very large.
Naval brass showed no susceptibility to crmvice corrosion when exposed
to ozonated or aerated solutions for 30 days. Visual inspection showed there
to be only a difference in color of the corrosion product between the aerated
and ozonated conditions. In the case of stainless steel, the presence -)f Ozonp
was found to enhance crevice corrosion. Image analysis showed that the
presence of ozone in solution produced slightly more pits with the same me-
dian pit area as aerated solutions, but also several very large deep pits.
ix

These results indicate the possibility of a large cathode/small anode effect ex-
isting between the highly stabilized passive film formed in the presence of
ozone and any inhomogeneity in the metal surface.
X

1. INTRODUCTION
The strong, oxidizing capability of ozone has been utilized as an alter-
native to chlorination for sterilization of drinking water for over seventy
years. ý Today, as environmental concerns grow about the use of chlorine for
iudustrial oxidizing applications, ozone, with its harmless byproduct of oxy' -
gen, is becoming more widely used. Interest has grown from using ozone as a
disinfectant in the water treatment industry, into fields such as the pulp and
paper industry, which is looking into using ozone as an alternative bleaching
agent. There is also great interest in using ozone as a biocide in equipment.
such as in heat exchangers and cooling towers, where stagnant water can
lead to the proliferation of microbiological corrosion. The corrosion behavior
of engineering alloys in ozonated solutions is of particular interest since
ozone is a strong oxidizer and rapid corrosion may result. At this time, there
exists very little literature on the subject of the corrosion of materials exposed
to ozonated solutions and the data which are available are conflicting.
The purpose of this investigation is to evaluate the effects of ozone in
artificial sea water on three engineering alloys: 304 stainless steel, Monel
400, and naval brass. These alloys are commonly used in heat exchange sys-
tems for naval applications, and represent the spectrum of readily passivat-
ing to non-passivating metals.
Ozone concentrations ranging from 0.02 mg/L to 2.3 mg/L were used.
The lower end of the range represents typical concentrations for continuous
maintenance level biocidal applications. The upper end of the range repre-
sents an extreme upset condition.
• " "--•''"'..., ,,=,,• ,,,,n,,,.~n mm nnun wnlnnmm nnmnm nmunu n1

2
Electrochemical methods were utilized to measure corrosion rates, as
well as breakdown and repassivation potentials of Monel and stainless steel.
Testing was performed after 1 and 17 hour exposures in order to analyze
whether exposure time affects corrosion behavior. In addition to electrochem-
ical testing, a 30 day crevice corrosion experiment was performed on stainless
steel and naval brass. For stainless steel, the crevice corrosion experiments
were correlated to electrochemical results.

2. HISTORiCAL BACKGROUND
2.1 Ozone Chemistry
Ozone is a strong oxidizer, with a standard electrode potential of
2.07 V (vs. standard hydrogen electrode [SHFI). 2 It is an even stronger oxi-
dizer than chlorine which has a standard electrode potential of only 1.36 V
(vs. SHE).3 Depending upon the pH of the solution in which it is dissolved,
molecular ozone will either react directly with components in solution, or de-
compose into hydroxyl radical, oxygen and hydroxide: 4
20 3 + H 20 --> OH* + 5 02 + OH
The hydroxyl free radical is a more powerful oxidizer than ozone, with a po-
tential of 2.80 V (vs. SHE). 4 At pH values above 7.5, much of the ozone will
decompose into hydroxyl radicals which will react rapidly with water contam-
inants. Below this pH, molecular ozone is stabilized and only a small fraction
of the ozone will be converted into hydroxyl free radicals. Care must be taken
when using ozone at elevated pH levels due to the rapid reactions that can
occur between the hydroxyl free radicals and water contaminants, with no
beneficial effects of disinfection or oxidation occurring.
2.2 Ozone Production
Ozone can be produced using two different methods: ultraviolet (ULV)
radiation or corona discharge. Ultraviolet radiation uses UV wavelengths of
either 254 nm or 186 nm to produce ozone. Using air as a source of molecular
3

4
oxygen, these wavelengths produce either 0.01% ozone by weight in air or
0.1%, respectively.4
Corona discharge is by far the most popular method of ozone produc-
tion, but the most inefficient. It utilizes either dry air or oxygen which is sub-
jected to a high voltage between two electrodes. Only about 10% of the en-
ergy supplied is used to make ozone, while the remainder is lost as heat.1
The amount of ozone produced in this system is regulated by the amount of
power supplied to the system, as well as the feed gas used. Using air, 1 to
3.5% ozone by weight in air can be produced, while 6 to 12% can be produced
using oxygen.4
2.3 Ozone Solubility
The solubility of ozone in a solution depends on several factors:
"* The concentration of ozone exiting the gas generator
"* The temperature of the solution
"* The ozone demand in the solution
* The pH of the solution
The theoretical concentration of ozone in solution can be found using
the concentration of ozone exiting the generator and Henry's Law: 4
Y=[H][X]
Y = Concentration of gas in solutionH = Mole fraction of ozone in gas phaseX = Henry's Law constant
Using Henry's law, ozone has a theoretical solubility of 10 times that of oxy-
gen in pure water, but in solutions other than pure water, it has been

5
recorded more on the order of I to 1.5 times that of oxygen. This discrepancy
between theory and practice is due to ozone depleting impurities in real solu-
tions, which are not accounted for in Henry's law, as well as the low partial
pressure of ozone. 1'5
The amount of ozone demanding impurities in the solution affect the
decomposition of ozone, with more impurities greatly decreasing the half-life.
For pure water, the half-life of ozone is on the order of hours, while in normal
water the half life is from 5 to 20 minutes. Impurities which can decrease the
half life include soluble iron, magnesia, and bromide, as well as microorgan-
isms.4
As was mentioned earlier, ozone will decompose into hydroxyl radicals
at pH levels above 7.5. Increasing the pH above this value will cause the
half-life of ozone to decrease significantly. At pH 10 the decomposition of
ozone is so rapid that no residual ozone can be measured.4
2.4 Ozone as a Biocide
Ozone works as a biocide by directly oxidizing the outer shell of mi-
crobes. The amount of ozone required to protect a system from microbiologi-
cal corrosion is relatively small. For systems in which a biofilm layer is al-
ready in existence, a constant concentration of 0.2 to 1.0 mg/L ozone is re-
quired.6 In order to maintain protection, after the biofilm has been removed,
only 0.02-0.05 mg/L ozone is required.1, 4 These values are well below that
considered to be a health hazard by OSHA, of 0.1 ppm by volume in air for 8
hours daily. In order to control biofouling by intermittent exposures to ozone,
6
concentrations of 0.4 to 0.6 mg/L ozone for 2 hours every other day is suffi-
cient for protection.4
2.5 Corrosion of Metals in Ozone
The amount of literature on the corrosion of metals exposed to
ozonated solutions is both limited and conflicting. The main source of conflict
is that the corrosion data is based on cooling tower water environments utiliz-
ing different environmental conditions and few scientific controls.
2.5.1 Iron Based Alloys
For cooling water environments, where temperatures range from 38-
49°C, there have been reports of reduced corrosion rates of mild steels when
exposed to ozone.7'8 In a pilot cooling tower, Meier found that the corrosion
rates of mild steel decreased from 28 mpy, when chlorine was used alone as a
biocide, to 4.6 mpy when ozone alone was used.8 This decrease in corrosion
rate is most likely due to the deposit of scale and corrosion product on the
metal surface which was noted in the presence of ozone.
There have also been reports of ozone increasing corrosion rates in
cooling water environments.9"1 1 Lawson, in an 18 month trial, found that
the addition of 0.1 mg/L ozone caused the corrosion rates of mild steel to
range from 8-10 mpy, a factor of 4 times higher than corrosion rates reported
for a traditional molybdate based water treatment program. 9 Once again, se-
vere fouling and scaling were evident when ozone was used. In laboratory
studies using ozone treated cooling water and flow rates of 0.33 m/s,
7
Strittmatter1° and Yang" found that low ozone concentrations of 0.1 mg/L
had no effect on the corrosion rate of mild steel, while the addition of 1 mg/L
increased the corrosion rates by a factor of five.
There have also been neutral reports on the effect of ozone on corrosion
rates of mild steel in cooling water environments. 10 13 Bird has reported
ozone to be neutral in protection of mild steel for open evaporation cooling
systems, indicating that conventional corrosion inhibitors, such as sodium ni-
trate, are more effective.12 Hettiarachchi, adding 24 ppm Mg 2÷, 195 ppm Cl',
345 ppm S0 42 , and 88 ppm Cu 2 ÷ to water to simulate cooling water, found
that ozone concentrations of 1.5 to 3 mg/L had no effect on mild steel. 13 In
their research, Strittmatter, Yang, and Hettiarachchi have all come to the
conclusion that the corrosion rates of mild steel in cooling waters have little
dependence on ozone, but are dominated by the water chemistry of the sys-
tem. 10,11,13
In deionized and fresh water at 30'C, respectively, both Matsudaira14
and Kaiga15 found that ozone levels between 0.2 and 2.1 mg/L increase the
corrosion rates of mild steels by a factor of 2-3. The work by Kaiga compared
the ratio of the corrosion rates in aerated and 0.3-1.0 mg/L ozonated solutions
at different flow velocities. At velocities below 1 m/s, the presence of ozone
was found to increase the corrosion rate of mild steel, while the corrosion rate
of cast iron was unaffected. 15 At 1 m/s, however, the corrosion rate of mild
steel was found to decrease, possibly due to formation of a passive film.
Matsudaira's results for mild steel at solution velocities of 0.05-0.1 m/s and a
concentration of 2.1 mg/L ozone echoed those of Kaiga, showing an increase in
corrosion rate compared to aerated solutions. 14 At a solution velocity of

8
1.7 m/s, however, ozone had no effect on the corrosion rate of mild steel com-
pared to aerated solutions. In contrast to these studies, Walton found the
corrosion rate of mild steel to decrease when exposed to 2 mg/L of ozone. 16
As with mild steel, there are varying reports with regard to the effect
of ozone on the corrosion of stainless steels. In cooling water environments,
Meier 8 has reported that ozone has no significant effect on the corrosion of
stainless steel, while Kaiga15 reports a significant increase in corrosion rate
in stainless steel when exposed to 0.8 mg/L ozone. In deionized water,
Matsudaira found there to be no effect of ozone or flow rate on the corrosion
rates of 303, 403, and 430 stainless steels.14 In chloride solutions, Lu 17 and
Brown18 have shown that the presence of ozone affects the crevice corrosion
susceptibility of 304 and 304L stainless steels, shifting the breakdown and
corrosion potentials more noble and the repassivation potential more active.
These changes indicate that ozone increases the susceptibility to pitting and
crevice corrosion.
2.5.2 CoDger Alloys
In cooling tower environments, the corrosion rates of copper and brass
were found to be reduced by the presence of ozone at levels of
0.05 mg/L.7' 19' 20 T1is effect was attributed to a thin protective layer forming
on the metal surface. In synthetic cooling water, Strittmatter1° and Yang1"
found there to be little effect cf 0.1 mg/L ozone upon the corrosion rates of
copper, 90 Cu-1ONi, admiralty brass, and 70Cu-3ONi; however these corrosion
rates increased by a factor of 5 to 10 when the concentration was increased to

9
1 mg/L ozone. In contrast, Hettiarachchi found there to be no effect of 1.5 to 3
mg/L ozone on copper in synthetic cooling water. 13
In deionized water environments, the corrosion rates of copper and
brass were found to increase by a factor of 5 to 6 with the addition of 2 mg/L
ozone, regardless of flow rate. 14 In fresh water, Kaiga similarly found that
ozone concentrations of 0.5-0.9 and 3.2-3.5 mg/L increased the corrosion rate
of copper by a factor of 5 at a velocity of 1 m/s. 15 This study also showed,
however, that a lower flow rate of 0.53 m/s decreased the corrosion rate of
copper by a factor of 2 at an ozone concentration of 1.2 mg/L.' 5 In stagnant
solutions containing 0.5N of NaC1, Lu found the corrosion rate of 70Cu-3ONi
to decrease in the presence of 2.0 mg/L ozone. 17
2.5.3 Other Alloys
Only a few alloys, other than those mentioned above, have been stud-
ied in ozonated aqueous solutions. For instance, Walton found that the corro-
sion rate of aluminum was decreased in the presence of 2 mg/L ozone. 16 Also,
it has also been found that the corrosion rates of titanium and Cr-Ni alloys
are unaffected by the presence of ozone, due to the formation of a thin pro-
tective layer. 19,20

3. EXPERIMENTAL PROCEDURE
3.1 Specimen Preparation
Samples of 304 stainless steel, Monel 400 and naval brass were used in
this study. The elemental content of each of these alloys, given by the sup-
plier, is listed in Tables I-III.
Table I. Composition of 304 Stainless Steel
Element C Mn P S Si Cr Ni Mo Cu Co N Fe
WeightPercent 0.05 1.7 0.03 0.02 0.05 18.4 8.1 0.L_ 0.03 0.07 0.05 71.3
Table II. Composition of Monel 400
Element C Mn P S Si Cr Ni FeI A
WeightPercent 0.10 1.0 - 0.02 0.08 32.2 64.7 1.88 0.04
Table III. Composition of Naval Brass
Element Cu Fe Pb Sn Zn
WeightPercent 59-62 0.15 max 0.2 max 0.5-1.0 Rem.
Stainless steel in the form of wire, 0.04 cm in diameter, was utilized
since it was found that sheet samples of this material mounted in epoxy
formed crevices between the sample and mount material which had a large
10

effect on the electrochemical results. The wire was shaped into a hook which
was partially submerged, to only expose the circumference of the wire.
Samples of Monel 400 sheet (1 cm 2 ) were mounted in epoxy (no crevice effect
was noted for these samples). Naval brass samples were cylindrical in shape,
1.86 cm in diameter and 1.27 cm high, and were fixtured as shown in Figure
3.1. All samples were ground to 600 grit SiC, then rinsed in distilled water.
Stainless steel
OzoneGenerator
Buna-N O-ring
Teflon Working electrode
GIO Buna-N O-ring
Figure 3.1 Cell set-up used for testing naval brass.
3.2 Solutions
Solutions of artificial sea water were continuously ozonated during ex-
perimentation with a corona discharge ozone generator using air as the car-

12
rier gas. Ozone concentrations were measured using the standard Diethyl-P-
Phenylenediamir'- (DPD) method prior to experimentation.21 The pH of the
solutions was maintained at a level of 7.5. Experiments were performed at
25°C for conditions of 0.02, 1.2 and 2.3 mg/L of ozone, as well as in aerated so-
lutions. Solutions were renewed after each test.
3.3 Electrochemical Test Procedures
A typical electrochemical set-up was used to obtain data (Figure 3.2).
After immersion in solution, samples of Monel and stainless steel were ca-
thodically polarized at -1.0 V vs. SCE for five minutes in order to remove any
prior surface film. The steady state corrosion potential was measured after
either 1 hour, for short term exposure, or 17 hours for long term exposure.
Linear polarization resistance and cyclic polarization curves were then mea-
sured. Separate samples were used to obtain 1 hour and 17 hour results.

13
Computer
ISPotentistt
String Bridge AuxiliaryElectrode
WorkingElectrode
Figure 3.2 Typical electrochemical set-up.
3.3.1 Linear Polarization Resistance
Linear polarization resistance (LPR) was used to rapidly obtain corro-
sion rate data from a simple polarization scan. A potentiostat was utilized to
polarize the material to approximately 10 mV in the noble direction relative
to the corrosion potential of the metal using a scan rate of 0.3 mV/s. The
slope of the resulting potential versus current plot is called the polarization
resistance, Rp, which has the dimensions of ohms. This value was used to

14
calculate corrosion rates based on the theory that the surface of the metal is a
simple resistor. The equation utilized is the Stern-Geary equation: 22
i CORR =- PIa PC 12.303 ( 0a + Pc3 Rpp
where %a and 0, are the anodic and cathodic Tafel slopes, respectively. Care
must be taken in comparing corrosion rates based on LPR results from two
different studies, as the assumptions made about the values of the anodic and
cathodic Tafel slopes may vary and cause differences up to a factor of 4.8 (see
Appendix).
3.3.2 Crevice Corrosion Testinsr
Although generalized corrosion is a very important measurement to
obtain on materials in corrosive environments, it is also important to evalu-
ate the effects of the environment on localized corrosion. One method to de-
termine susceptibility to crevice corrosion is to form a crevice on the material,
then immerse it in the environment of interest. A fixture called a crenelated
washer is normally used to simulate multiple crevices which might be seen in
an industrial application. This washer is made of a chemically inert material
which has grooves cut into it (Figure 3.3). Creviced washers, such as this,
were affixed to polished samples of naval brass and stainless steel prior to
immersion in aerated and 0.8 mg/L ozonated artificial sea water solutions.
Three samples were tested for each condition for a period of 30 days.

15
Figure 3.3 Crenelated Washer
Image analysis was performed on the stainless steel crevice corrosion
samples by digitizing video images of the sample surface at a magnification of
50x. The software used for the analysis was NIH Image 1.47 which is a pub-TM1
lic domain image processing and analysis program for the Macintosh
Depth measurements of the pits were taken using a diamond stylus pro-
filometer and were compared to metallographic cross sections.
3.3.3 Cyclic Polarization
To rapidly assess the localized corrosion behavior of stainless steel and
Monel, an electrochemical technique called cyclic polarization was used. The
material was polarized into the transpassive region and then the scan was
reversed. For Monel, the cyclic polarization curves were started at the steady
state corrosion potential and then polarized anodically at 10 mV/s to a poten-
tial of +300 mV vs. SCE, where the scan was reversed. Using a scan rate of
1.3 mV/s, stainless steel scans were started at -1.0 V vs. SCE and were polar-
ized anodically to a current of 3 mA before reversing. Figure 3.4 shows a typ-

16
ical cyclic polarization diagram for 304 stainless steel in aerated artificial sea
water obtained in this study.
1.5E Oxygen
1.01~Eb
S0.5 b1
p 0.0 -
0. zero P
• -0.5
-1.0
-1.5 .. . . . .. .i . . .. . . .-9 -8 -7 -6 -5 -4 -3 -2
10 10 10 10 10 10 10 10
Current Density (A/cm2)
Figure 3.4 Cyclic polarization curve of 304 stainless steel after 1 hour of ex-posure in aerated artificial sea water at 23 0C, pH 7.5.
From the diagram, the breakdown potential, Eb, the repassivation po-
tential, Ep, and the zero current corrosion potential, Ezero' can be obtained as
shown. The breakdown potential is the potential at which the passive film
breaks down, while the repassivation potential is the potential below which
existing pits cease growing, nor will any new pits form. The reversible poten-
tial of oxygen, Eoxygen, is also shown in this diagram and corresponds to an-
other change in slope of the polarization curve. At this potential, the produc-
tion of oxygen from water occurs and causes an increase in the corrosion rate

17
of the metal. The value of Eoxygen taken from the cyclic polarization curve
shown here corresponds closely to that calculated in the Appendix from the
Nernst equation for an aerated solution.
Another aspect of the cyclic polarization diagram is the hysteresis ioop
which forms when the potential scan is reversed on a passivating metal
which is susceptible to pitting and crevice corrosion. This phenomenon is in-
dicative of the growth and formation of pits on the surface of the metal, with
the area of the hysteresis loop corresponding to the amount of energy that
has gone into the formation and growth of pits. Although this area can be
measured, there are a number of factors influencing it which cannot be con-
trolled, i.e., the number of pit initiation sites and the uniformity of pit
growth. It is best used as only an indicator as to whether a passive material
is susceptible to pitting or crevice corrosion in a given environment.
Depending upon the scan rate used to obtain cyclic polarization curves,
the values reported from such testing can be affected. If the metal is scanned
too fast, the reactions occurring at the surface may not have had sufficient
time to come to a steady state, affecting the resultant polarization curve. An
excessively rapid scan rate can also cause a material to appear not suscepti-
ble to crevice corrosion by showing no apparent hysteresis loop, when in fact
there is only a very slight one because the material has only had time to ini-
tiate and grow a few pits. This was the case for stainless steel, where a
slower scan rate of 1.3 mV/s was used, as the faster scan rate of 10 m.V/s
failed to produce pitting and the formation of a hysteresis ioop.

4. RESULTS & DISCUSSION
4.1 Steady State Corrosion Potential
4.1.1 304 Stainless Steel
Figure 4.1 shows that, as the ozone concentration was increased, the
corrosion potential of stainless steel became increasingly noble, reaching a
plateau at 200 mV noble to the aerated condition at ozone concentrations of
1.2 and 2.3 mg/L. After 17 hours of exposure all values shifted in the noble
direction compared to those of 1 hour.
The noble increase in corrosion potential of stainless steel with increas-
ing ozone concentration is due to the mixed potential being controlled by the
cathodic reduction of ozone:
03 + 2H' + 2e- -> 02 + H 20
Ozone has a noble redox potential of 2.07 V vs. SHE, therefore, when ozone is
present in sufficient concentrations, a noble shift in potential is observed.
The noble shift in potential for all conditions after 17 hours indicates stabi-
lization of the passive film of the stainless steel with time, with increasing
ozone concentrations having a more significant stabilization effect than the
presence of oxygen alone (aerated condition).
18

19
4.1.2 Monel 400
It was found that the steady state corrosion potential of Monel 400 be-
came increasingly noble with increasing ozone concentration, shifting a total
of 200 mV in the noble direction relative to the aerated condition when 2.3
mg/L of ozone was present (Figure 4.2). Extended exposure caused only a
slight noble increase in corrosion potential for all conditions.
As with stainless steel, the increase in the corrosion potential of Monel
400 with increasing ozone concentration is due to the noble redox potential of
ozone. This is confirmed by the 200 mV shifted which is noted for both alloys
at elevated ozone concentrations. In the case of Monel however, prolonged
exposure indicates that the passive film is only slightly stabilized with time.
4.1.3 Naval Brass
Figure 4.3 shows that the presence of ozone had no effect on the corro-
sion potential of naval brass after one hour of exposure. After 17 hours of ex-
posure, all conditions, with the exception of 2.3 mg/L ozone, showed a slight
noble shift in potential of 20 to 30 mV. A color change was also noted on the
surface of the metal, with a brown tarnish forming under aerated and low
ozone conditions and gold colored corrosion product forming at elevated ozone
concentrations.
The lack of response in the steady state corrosion potential of naval
brass to increasing ozone concentration after one hour indicates that a diffu-
sion barrier of corrosion product exists at the surface of the naval brass. This
corrosion product is most likely a surface oxide, of either Cu 20, CuO, or a

20
combination of both, through which Cu÷÷ must diffuse in order to cause a
shift in the potential.
With increased exposure time, the composition of this surface layer
changes, as indicated by the difference in color of corrosion product. Naval
brass in aerated and low ozone conditions appears to undergo dezincification.
This process can occur by one of two mechanisms. One mechanism involves
the diffusion of zinc to the surface of the alloy where it undergoes preferential
corrosion, leaving a copper rich residue. 23 The other mechanism involves the
corrosion of the alloy and redepositing of copper as a porous layer. 2 3
Dezincification is usually retarded in this alloy due to the addition of 1% Sn,
however, stagnant solutions, as well as inorganic scale formation can cause
an increase susceptibility to this process.23 Preferential corrosion of zinc or
plating of copper at the surface could explain the slight noble shift in poten-
tial of naval brass exposed to aerated and low ozone concentrations, as the
standard redox potential of copper is 0.337 V and the standard redox poten-
tial of zinc is 0.763 V.
The lack of a noble shift in the steady state corrosion potential of naval
brass when exposed to 2.3 mg/L ozone for 17 hours indicates that ozone, ei-
ther by itself or by the oxygen created by its breakdown, has stabilized the ox-
ide which is present after one hour, preventing or retarding the process of
dezincification.

21
400
S1 Hour. ... 17 Hours "
S200US2 0 ........ .. ... ..
•' 0 ".." .......... ..
-200
-4001
0.00 0.01 0.10 1.00 10.00(Aerated)
Ozone Concentration (mg/L)
Figure 4.1 Steady state corrosion potential of 304 stainless steel as a func-tion of ozone concentration in artificial sea water at 23°C, pH7.5.
100S4 1 Hour
S0 . .. *.. 17 Hours .,.
• -100S.2o
-300
0.00 0.01 0.10 1.00 10.00(Aerates,
Ozone Concentration (mgIL)
Figure 4.2 Steady state corrosion potential of Monel 400 as a function ofozone concentration in artificial sea water at 23°C, pH 7.5.

22
-175 . . . " . . .. i . . . .
41 Hour.-200 -45- 17 Hours
-225
............ AL........................" -250
.- 275
300-300 . . ...... 1 &ttS. . ...IM . . . . , ,
0.00 0.01 0.10 1.00 10.00(Aerated)
Ozone Concentration (mg/L)
Figure 4.3 Steady state corrosion potential of naval brass as a function ofozone concentration in artificial sea water at 23TC, pH 7.5.
4.2 Breakdown Potential
4.2.1 304 Stainless Steel
It was found that there was little difference between the breakdown
potentials of stainless steel for either aerated or 0.02 mg/L ozone conditions
at 1 and 17 hour exposure times (Figure 4.4). At increased ozone concentra-
tions and 1 hour of exposure, the breakdown potential was shifted 100 mV in
the active direction relative to the aerated and 0.02 mg/L ozone conditions.
After 17 hours of exposure however, this trend was reversed and the break-

23
down potential for elevated ozone concentrations was shifted 200 mV in the
noble direction relative to the aerated and 0.02 mg/L conditions.
In general, crevice corrosion susceptibility increases as the breakdown
potential shifts active and comes closer to the steady state corrosion poten-
tial. If the corrosion potential is at or near the breakdown potential, the ma-
terial will actively pit. Although the breakdown potential is at least 400 mV
noble to the steady state corrosion potential in all cases, tC.ie results indi-
cate that short term exposure to elevated ozone concentrations increases the
susceptibility of 304 stainless steel to pitting and crevice corrosion due to the
active shift in the breakdown potential relative to the aerated and low ozone
conditions.
This result seems to contradict the hypothesis that increased ozone
concentrations produce a highly stabilized passive film. However, this devia-
tion can be explained if, after an hour, there are ruptures or defects present
in the passive film. Ruptures in the passive film would produce a patchwork
of less stabilized regions within the highly stabilized film. These less stabi-
lized regions would become small anodes surrounded by a large, more passive
cathodic film, producing a galvanic effect which could account for an increase
in crevice corrosion susceptibility. A significant number of defects in the pas-
sive film would also increase the crevice corrosion susceptibility, as they
would create a path by which metal ions could migrate to the surface and un-
dergo reaction. Extended exposure to elevated ozone concentrations provides
sufficient time for the development of a thicker passive film. This thicker
passive film would be likely to have fewer ruptures, as well as a longer diffu-
sion path for any metal ions which might travel through defects in the pas-

24
sive film, resulting in a decrease in crevice corrosion susceptibility. Further,
this decrease in susceptibility with extended exposure, relative to the aerated
condition, is a definite indicator that the passive film formed in the presence
of ozone is more stable than that produced by oxygen alone. This conclusion
is also supported by the noble increase in the steady state corrosion potential
at elevated ozone concentrations discussed earlier.
4.2.2 Monel 400
No difference was found between the breakdown potential of Monel 400
under aerated and low ozone conditions. With extended exposure, these val-
ues were found to shift slightly noble, causing a slight decrease in crevice cor-
rosion susceptibility with time, indicative of a time-enhanced passive film.
At elevated ozone concentrations however, no breakdown potential was
observed, independent of exposure time (Figure 4.5). At these ozone levels,
the corrosion potential shifted noble to the breakdown potential and no pas-
sive region was evident. These results indicate that the material will actively
pit in solutions exposed to increased ozone concentrations. One can conclude
from these results that elevated ozone concentrations increase the crevice
corrosion susceptibility of Monel 400.

25
1000~)..~2L'.~.''''
goo0 1 Hour
800 17Hor
700 00
600 T@So.
'~500 5
S400o 300
2000.00 0.01 0.10 1.00 10.00
Ozone Concentration (mgIL)
Figure 4.4 Breakdown potential of 304 stainless steel as a function of ozoneconcentration in artificial sea water at 2300, pH 7.5.

26
0o
_____________________________________?
~cz
iI+iIC
10
S E
(A) ~BA ~jU eO

27
4.3 Repassivation Potential
4.3.1 304 Stainless Steel
Figure 4.6 shows that the presence of ozone has no significant effect on
the repassivation potential of 304 stainless steel after 1 and 17 hour exposure
times. The difference between the repassivation and steady state corrosion
potential (Figure 4.7) shows that the steady state corrosion potential becomes
equal or noble to the repassivation potential at elevated ozone concentrations
for both 1 and 17 hour exposure times.
The repassivation potential is the potential below which pits on the
surface may repassivate and stop growing depending on the depth of the pit
and the current driving pit corrosion. The difference between the repassiva-
tion and steady state corrosion potential is an indicator of a material's ability
to repassivate surface pits during exposure to a solution. When this differ-
ence is small, or negligible, it is unlikely that the repassivation of pits or
crevices will occur. These results indicate that increased ozone concentra-
tions will cause any crevices or pits present on the surface of stainless steel to
grow since the steady state corrosion potential is noble to the repassivation
potential.
4.3.2 Monel 400
The repassivation potential of Monel was shifted 40 mV in the noble
direction by the presence of ozone (Figure 4.8). Extended exposure caused all

28
conditions to shift further in the noble direction, maintaining the same trend
as at 1 hour of exposure. As in the case of stainless steel, the difference be-
tween the repassivation and steady state corrosion potential of Monel 400
drops to zero at elevated ozone concentrations after 1 hour of exposure
(Figure 4.9). After 17 hours, the difference becomes slightly higher for ele-
vated ozone concentrations as the repassivation potential shifts noble to the
steady state corrosion potential.
Recalling that the breakdown potential was found to be active to the
steady state corrosion potential at elevated ozone concentrations, these re-
sults indicate that Monel will undergo active pitting and continued pit growth
after an hour of exposure. As exposure time is increased, pits will continue to
form, but the shift in the repassivation noble to the steady state corrosion po-
tential indicates that pits or crevices on the surface will begin to repassivate
and stop growing.
400 . I .
Sj 1Hour300 ... 17 Hours
S200 I
S . .. .. ..................
0.00 0.01 0.10 1.00 10.00(Aerated)
Ozone Concentration (mgfL)
Figure 4.6 The repassivation potential of 304 stainless steel as a function ofozone concentration in artificial sea water at 23'C, pH 7.5.

29
8001 Hour
600 ...... 17 Hours
r 400
l• 200
0
S-200-
9 -400 I ........ .0.00 0.01 0.10 1.00 10.00
(Aerated)
Ozone Concentration (mg/L)
Figure 4.7 The potential difference between the repassivation and steadystate corrosion potential of 304 stainless steel as a function ofozone concentration in artificial sea water at 23°C, pH 7.5.
100•4-" 1 Hour"'M..... 17 Hours
5 0
.• -50
.00 - 0 . . . .. . ......I ........... I . . .
0.00 0.01 0.10 1.00 10.00(Aerated)
Ozone Concentration (mg/L)
Figure 4.8 The repassivation potential of Monel 400 as a function of ozoneconcentration in artificial sea water at 230C, pH 7.5.

30
5, 400
S --6 1 Hourp 300 '".".17 Hours
S200 . . .
100
0S- 0 . . . .I . . . ..... I *. .. . ... I . . ... ,
-100-d0.00 0.01 0.10 1.00 10.00
(Aerated)
Ozone Concentration (mg/L)
Figure 4.9 The potential difference between the repassivation and thesteady state corrosion potential of Monel 400 as a function ofozone concentration in artificial sea water at 23°C, pH 7.5.
4.4 Crevice Corrosion Testing
Visual inspection of the 30 day crevice corrosion samples of 304 stain-
less steel showed that samples exposed to 0.8 mg/L ozone produced a few very
large deep pits compared to the aerated condition (Figures 4.10 and 4.11).
Image analysis at 50x showed that there were slightly more pits when the
samples were exposed to ozone. The average pit area was larger in the
ozonated case, however, the median value of th( pit area is less than that of
the aerated condition, indicating that there were only a few extremely large
pits on the samples exposed to ozone. Several measurements of pit depth
were taken on the largest pits for each condition using a profilometer. These
values were found to range from 0.002 to 0.06 mm for the ozonated condition

31
and 0.005 to 0.04 mm for the aerated condition. Metallographic analysis
showed that larger pits were much deeper than observed using profilometry
techniques.
It was expected that stainless steel samples exposed to ozone would
develop larger and more numerous pits than the aerated condition, due to
both the active shift in the breakdown potential in highly ozonated solutions
after 1 hour, and the steady state corrosion potential being equivalent to the
repassivation potential. The presence of very large pits on the ozonated sam-
ples suggests that a large number of pits formed initially and continued to
grow, coalescing into one large pit. It was expected that pits would be larger
in the case of samples exposed to ozone due to the repassivation potential be-
ing equivalent to the steady state corrosion potential under ozonated condi-
tions. Because of this, any pit or crevice present on the surface would un-
dergo active corrosion and would not be likely to repassivate. The driving
force for the enlargement of the pits may be due to the continued stabilization
of the passive film by ozone with time which could have caused a small anode
(pit) - large cathode (passive film) effect.
Although a 30-day crevice corrosion test was not performed on Monel
400, the electrochemical results indicate that this material would be very
susceptible to pitting and crevice corrosion. Future work in this area will in-
clude crevice corrosion testing of this material to confirm electrochemical re-
sults.
It was found that samples of naval brass showed no evidence of crevice
corrosion in either aerated or 0.8 mg/L ozone solutions. However, differences
in the colors of corrosion product were noted visually. Samples exposed to

32
ozone developed a gold colored corrosion product, while aerated solutions de-
veloped a whitish-green corrosion product, indicative of copper.

33
Figure 4.10 30 day crevice corrosion test of 304 stainless steel exposed to0.8 mg/L of ozone in artificial sea water at 23°C, pH 7.5. 6x.
Figure 4.11 30 day crevice corrosion test of 304 stainless steel exposed toaerated artificial sea water at 23°C, pH 7.5. 6x.

34
4.5 Corrosion Rate Measurements
The Tafel slopes, Pa and PC, were assumed to equal 0.12 in order to cal-
culate the corrosion rates of each material from the slopes obtained from the
LPR tests. These values of Tafel slope were used because the values of corro-
sion rate they produce should vary no more than 2x the actual corrosion rate.
See Appendix for equations used in calculations.
4.5.1 304 Stainless Steel
The corrosion rate of stainless steel was shown to decrease at elevated
ozone concentrations, producing a corrosion rate which was half that of the
aerated condition (Figure 4.12). With extended exposure, a decrease in corro-
sion rate occurred for all conditions, with the presence of ozone having no ef-
fect on corrosion rate.
These results show that elevated ozone concentrations initially stabi-
lize the passive film faster than oxygen (aerated condition). However, as time
progresses the passive film formed by oxygen in aerated solutions equals the
stability of that produced by ozone, yielding similar corrosion rates. There
are several literature sources which have also shown ozone to have no effect
on the corrosion rate of stainless steel.8 '14 In these cases, however, corrosion
rates for short exposure times were not measured.
4.5.2 Monel 400
Monel showed increasing corrosion rates with increasing ozone concen-
trations, independent of exposure time (Figure 4.13). The corrosion rate for

35
2.3 mg/L ozone was found to be three times higher than for the aerated condi-
tion.
This result, in conjunction with results which indicate increased
crevice corrosion susceptibility, shows that elevated ozone concentrations are
extremely detrimental to this alloy.
4.5.3 Naval Brass
Linear polarization resistance measurements of naval brass showed
two separate slopes when the potential was shifted in the active direction rel-
ative to the corrosion potential, indicating two distinct corrosion events.
These are believed to correspond to the corrosion rates of zinc and copper, re-
spectively, due to dezincification in stagnant sea water (Figure 4.14).
Large corrosion rates were observed when the sample was initially
polarized, and are believed to reflect the corrosion rate of zinc. These were
found to be independent of ozone concentration after one hour of exposure
(Figure 4.15). Extended exposure caused the corrosion rates to decrease
slightly for all conditions, wi,,h the exception of 0.02 mg/L, where a large de-
crease in corrosion rate was r oted. The second slope, believed to reflect the
corrosion rate of copper, produced much lower corrosion rates which were in-
dependent of ozone concentration and exposure time (Figure 4.16).
Uhlig reports that the corrosion rate of copper in sea water is approxi-
mately 0.03 mm/y, while that of zinc and naval brass range from 0.02-
0.1 mM/y. 23'24 It is likely that the initial slope measured in the LPR scan
represents the corrosion rate of zinc in sea water, as this component of naval
brass appears to control the corrosion rate of the alloy, as seen by the similar

36
corrosion rates for zinc and naval brass in sea water. The results reported
here are somewhat higher than those reported by Uhlig for the corrosion
rates of zinc in sea water. This can be attributed to dezincification being
more rapid for our experiment due to a combination of enhanced dezincifica-
tion by polarization, as well as the fact that most dezincification occurs upon
initial exposure and the results given by Uhlig were for weight loss mea-
surements after several years. The anomalous result in Figure 4.15 for the
condition of 0.02 mg/L ozone after 17 hours of exposure correlates with the
measured corrosion rate of copper, indicating that this condition caused
complete dezincification at the surface.
Elevated ozone concentrations appear to have no significant effects on
the corrosion behavior of naval brass compared to the aerated condition. A
difference was expected to be seen after extended exposure due to the differ-
ence in the appearance of the corrosion product between the two conditions.
It is possible that the oxide which forms on the surface of samples exposed to
the highly ozonated solution becomes unstable when polarized, leading to re-
sults similar to the aerated condition.

37
S2.5. . . . . ' . . . . . . . . . . . . •
2.0 -- HoursS2.0
M.-.. 17 Hours
b 1.5
1.0
0.5 .41 ................ ................ . t
. 0.0
0.00 0.01 0.10 1.00 10.00(Aerated)
Ozone Concentration (mgfL)
Figure 4.12 The corrosion rate of 304 stainless steel as a function of ozoneconcentration in artificial sea water at 231C, pH 7.5.
"0, 200 . . . .. i ' ' ... i . . . . . . . ..
-" - I HouriS150 .46 17 Hours
100
00
-50
50
0.00 0.01 0.10 1.00 10.00(Aerated)
Ozone Concentration (mg/L)
Figure 4.13 The corrosion rate of Monel 400 as a function of ozone concentra-tion in artificial sea water at 23°C, pH 7.5.

38
-240,"COPPER"
-245
-250 i
' -255 i
-260
-80 -60 -40 -20 0 20
Current (uA)
Figure 4.14 Linear polarization diagram of naval brass in aerated artificialsea water at 23°C, pH 7.5.

39
500 .- -' 1Hour
375- ... 17 Hours
4) 250-
.0
0 0 0
125 0010
0 1 1...1
0.00 0.01 0.10 1.00 10.00(Aerated)
Ozone Concentration (mg/L)
Figure 4.15 The corrosion rate determined from the initial LPR slope ofnaval brass, as a function of ozone concentration in artificial seawater at 23°C, pH 7.5. This data is believed to reflect the corro-sion rate of zinc, which controls the corrosion rate of naval brassin sea water.

40
S200
"16150 Hour
.2,b 100-S~I0-
. 5 0 .... .... ... ...-' ' - -.. .
0 0.01 0.10 1.00 10.00(Aeraoted)
Ozone Concentration (mg/L)
Figure 4.16 The corrosion rate determined from the secondary LPR slope ofnaval brass, as a function of ozone concentration in artificial seawater at 23°C, pH 7.5. This data is believed to reflect the corro-sion rate of copper due to dezincification occurring on the sur-face.

5. CONCLUSIONS
1. The steady state corrosion potentials of 304 stainless steel and Monel
400 became increasingly noble with increasing ozone concentration due
to the noble redox potential of ozone. Extended exposure shifted these
values even mort ncZle in the case of stainless steel, indicating that
ozone has a large stabilization effect on the passive film compared to
oxygen.
2. The corrosion potential of naval brass after one hour was unaffected by
the presence of ozone due to the formation of a corrosion product, be-
lieved to be a copper oxide. After 17 hours of exposure, all conditions
except 2.3 mg/L ozone showed a noble shift in potential which was ac-
companied by a tarnished brown corrosion product at the surface, be-
lieved to be due to dezincification. A gold colored corrosion product
was produced on the surface of samples exposed to 2.3 mg/L ozone and
is believed to be the same oxide which was formed for all conditions af-
ter one hour of exposure.
3. Elevated ozone concentrations shifted the repassivation potential of
stainless steel active to the steady state corrosion potential, indepen-
dent of exposure time. Elevated ozone concentrations also caused the
breakdown potential of stainless steel to shift in the active direction
relative to the aerated condition after one hour, with extended expo-
sure reversing this effect. These results indicate that stainless steel
41

42
has an increased susceptibility to crevice corrosion, especially upon ini-
tial exposure to ozone. This effect is believed to be due the presence of
either ruptures or defects in the passive film, which decreases as the
passive film thickens with time.
4. Elevated ozone conmentraLions shifted the breakdown and repassiva-
tion potential of Monel below the steady state corrosion potential, indi-
cating that this alloy will actively undergo crevice corrosion for these
conditions. Extended exposure, however, showed the repassivation po-
tential shifting noble to the steady state corrosion potential, indicating
that although pits may still nucleate, they are likely to repassivate be-
fore becoming very large.
5. The presence of ozone was found to enhance crevice corrosion in the
case of stainless steel, producing slightly more pits than the aerated
case with the same median pit area, as well as a few very large deep
pits. The formation of these large pits supports the theory of a large
cathode/small anode effect existing between the highly stabilized pas-
sive film, which formed in the presence of ozone, and the unprotected
pits. Crevice corrosion testing of naval brass showed that it was not
susceptible to crevice corrosion in either aerated or ozonated solutions.
6. When polarized anodically during LPR testing, naval brass exhibited
two distinct slopes. The initial slope was found to represent the corro-
sion rate of zinc, while the other was found to represent the corrosion

43
rate of copper, indicating that the process of dezincification was occur-
ring at the metal surface. These corrosion rates were found to be inde-
pendent of ozone concentration. The exception to this was the case of
0.02 mg/L ozone after 17 hours for which both slopes exhibited values
in the range of the corrosion rate of copper, indicating that complete
dezincification had occurred on the surface of this alloy before LPR
testing. This result shows that low ozone concentrations might actu-
ally enhance the process of dezincification with time.
7. For short term exposures, increasing ozone concentrations decreased
the corrosion rate of stainless steel compared to the aerated condition
due to ozone stabilizing the passive film more rapidly than oxygen.
The presence of ozone did not affect the corrosion rate of stainless steel
after extended exposure because oxygen stabilized the passive film
with time as strongly as observed with ozone. In the case of Monel
400, increasing ozone concentrations caused the corrosion rate to in-
crease, independent of exposure time. This result, coupled with the in-
crease in crevice corrosion susceptibility, show that elevated ozone con-
centrations are detrimental to this alloy.

6. REFERENCES
1. Ozone in Water and Waste Water Treatment, Editor: F. L. Evans, AnnArbor Science Publishers Inc., Ann Arbor, MI, p. 83.
2. A.J. Bard, L.R. Faulkner, Electrochemical Methods: Fundamentals andApplications (New York, NY: John Wiley & Sons, 1980) p. 700.
3. S. Hettiarachchi, "The Effects of Ozone on Corrosion of Steel andCopper in Cooling Water Systems," Corrosion/91, 1991, #206.
4. R.P. Rice, J.F. Wilkes, "Fundamental Aspects of Ozone Chemistry inRecirculating Cooling Water Systems," Corrosion/91, 1991, #205.
5. A.G. Hill, R.G. Rice, Handbook of Ozone Technology and Applications(Ann Arbor, MI: Ann Arbor Science Publishers, Inc., 1982) pp. 1-37.
6. K. Kaur, T.R. Bott, B.S.C Leadbeater, Ozone in Water QualityManagement (Burgess Hill, Sussex, England: Intl. Ozone Assoc.,British Secretariat, 1988) pp. 147-150.
7. H.B. Edwards, J. Cooling Tower Institute, 8 (1987): p. 10.
8. D.A. Meier, J.D. Lammering, "A Comparative Use of Ozone VersusOther Chemical Treatments of Cooling Water Systems," ASHRAETransactions, Vol. 93 (Part 2), 1987, pp. 1381-1393.
9. T.S. Lawson, A.E. Feltzin, "Ozonation in a Carbon Dioxide PlantCooling System," Corrosion/92, 1992, #393.
10. R.J. Strittmatter, B. Yang, D.A. Johnson, "Application of Ozone inCooling Water Systems," Corrosion/92, 1992, #347.
11. B. Yang, D.A. Johnson, S. H. Shim, "Effect of Ozone on Corrosion ofMetals Used in Cooling Towers," Corrosion, 49 (1993): p. 499.
12. T.L. Bird, "Corrosion of Mild Steel in Ozonated Air-ConditioningCooling Tower Water," Electricity Council Research Center,Capenhurst, Chester, CH1 6ES, U.K. Report No. ECR-C/M-2181(1987), 16 pp. Energy Res. Abstrs. 1988, 13 (7), Abstr. No. 149337.
13. S. Hettiarachchi, "The Effects of Ozone on Corrosion of Steel andCopper in Cooling Water Systems," Corrosion/91, 1991, #206.
44

45
14. M. Matsudaira, M. Suzuki, Y. Sato, "Dissolved Ozone Effect onCorrosion of M -tals in Water," Materials Performance, 29 (1981): p.55.
15. N. Kaiga, T. Seki, K. Iyasu, "Ozone Treatment in Cooling WaterSystems," Proceedings, 8th Ozone World Congress, Vol. 2 (Zurich,Switzerland: Intl. Ozone Association), 1987, pp. G1-G11.
16. J.R. Walton, "The Effect of Ozone on the Corrosion Rate of Metals,"May 1983, Presented at 6th Ozone World Congress, Washington D.C.(Norwalk, CT: Intl. Ozone Assoc.).
17. H.H. Lu, D.J. Duquette, "The Effect of Dissolved Ozone on theCorrosion Behavior of Cu-30Ni and 304L Stainless Steel in 0.5N NaClSolutions", Corrosion, 46 (1990): p.843.
18. B.E. Brown, H.H. Lu, D.J. Duquette, "Effect of Flow Rates on LocalizedCorrosion Behavior of 304 Stainless Steel in Ozonated 0.5N NaCI",Corrosion, 48 (1992): p. 9 7 0 .
19. A. Kyas, R. Wellauer, M. Oldani, "Cooling Water Treatment withOzone," 1989, in Ozone in Wastewater Treatment & IndustrialApplications, Proceedings 9th Ozone World Congress, Vol. 2, L.J.Bollyky, Editor (Norwalk, CT: Intl. Ozone Assoc., 1989), pp. 300-306.
20. R. Wellauer, M. Oldani, "Cooling Water Treatment with Ozone," OzoneScience and Engineering, 12(1990): p. 243.
21. J. W. Oldfield, B. Todd, Desalination, 38 (1981): p. 233.
22. M. Stern, A. Geary, J. Electrochem. Soc., 56 (1957): p. 104.
23. H.H. Uhlig, R.W. Revie, Corrosion and Corrosion Control (New York,NY: John Wiley & Sons, 1985), p. 71.
23. H.H. Uhlig, Corrosion Handbook (New York, NY: John Wiley & Sons,1948), p. 397.

7. APPENDIX
The Effect of Assumed Tafel Values on Corrosion Rates Calculatedfrom Linear Polarization Resistance Measurements:
dE
iCOaR 2.3x Rp A EA xP P .1a + 0 ,)
If . -= Oc = 0.05:
0.0109iCOs R p x AREA
If Concentration Polarization Occurs:
'CORR 2.3 x RP x AREA)
If •aO=012:0.0522
iCORR Rp x AREA
Difference between assuming Pa = c= 0.05 and assuming that concentration
polarization occurs with Pa = 0.12:
0.0522Difference =0.01087 = 4.8
46

47
Determination of Corrosion Rates from Linear PolarizationResistance Measurements:
dERp =dI
{ 1~ ba x biCORR= 2.3 x Rp x AREA) ba + ba
If [• c=0.12:
0.0261iCORR I Rp x AREA
mm = 1.734 (iCORRJy
mm 1734 0.02611.3 Rx AREA
mm 0.0453y Rp xAREA
If .a = Pc = 0.05:1 =0.01087
CORR = Rp x AREA
MM= 1.734 (iCORR)y
1.734 R00108
mm 0.0188
' Rp xAREA

48
Calculation of the Anodic Curve of Stainless Steel:
Concentration Polarization Assumed
iL = DnFC
8t
moles
L
8 =0.05 cm D= 5 x 10.5 cm2
S
n=2
iL = 0.lnC
For 1.2 meJL( mole moles
CL ( -48g )2.5 x 10 L
n=2
iL= 0.1(2)(2.5 x 10⁻⁵)
iL =5 x 10⁻⁶ A2cm 2
For 2.3 mzIL2.3x1x mole 4.8x10 molesC=~2 3 XO~) 4 8 g )4.xiO L
n=2
iL= 0.1(2)(4.8 x 10⁻⁵)

49
iL= 1x 10⁻⁵ A2cm
For Air Saturation:C =7.85 x 10⁻³ mole =2.4 x 10⁴ moles
L )(32g L
n-2
iL = 0.1(2)(2.4 x 10⁴)
ia __ 4.9 x 10⁻⁵ A2cm 2
Reversible Potential of Oxvgen:
O2 + 4H÷ + 4e- -> 2 H20
E=Eo-0.059 (1 gE=0 -n log
n •P02 )
n=4
Eo = 1.229 V vs.. SHE
Find pO 2:
From Uhlig - Aerated solutions contain 7.85 mg/L of oxygen
(7.8 K i032g )(0.0821) (298P2 1 L
pO2 - 6 x 10⁻³ atm
E = 1.229 - 0. 5 log ( 10-
E = 1.229 - 0.033
E = 1.20 V vs.. SHE
E = 0.96 V vs.. SCE

50
Reversible Potential of Ozone:
03 + 6H÷ + 6e-> 3 H2 0
E=E E 0.059 log (aH 20>0 - n a0 3 )
n=6
Eo = 2.07 V vs. SHEaHl20 = 1
Find aO 3:
For 1.2 m"/L
(1.2 x 10⁻³ -)(m1 le J(0"0821) (298)aO 3 = 1L
pO3 = 6.1 x 10⁻⁴ atm
0.059 1)E =2.07 - 6 log (6ýX10-4)
E = 2.07 - 0.032
E = 2.04 V vs.. SHE
E = 1.80 V vs.. SCE
Fo~r 2.3 m"g/
(2.3 x 10⁻³ l(mole4 )(0.0821) (298)aO3 = 1L
pO3 = 1.3 x 10³- atm
6 (1.2 x 10⁻³)
E = 2.07 - 0.029
E = 2.04 V vs.. SHE
E = 1.77 V vs.. SCE

51
Find jc in terms of iL and dE:
AE = -R InnF i'C
(AEnF iexp (-RT ) 1L-C
= i-ic~exp(-RTF)
CLexp ( jRT

52
10"i
C Ac c
PC:
allHS SA 19l•luood

53
_ _ _ _ _ _ _ _ _ _ _ _ _ _
4aq -1
1r 4 A. ) el m.
0 ]q
C) :z -
it) aia SAIalulc
54
-.......
Cd 0
000
A -'lm t t
T w - I-
~~A) 0a
mi Io C i In
SA 11- -JC

55
0C
-P-
~~cu EI EQIq
>11
ST-4~
(A) 00 S SA-BJU9

56
0
00
- C
Uu U
-4a~
(A 3 Al8ua~

57
N L
ýc Nt 't~ c N+
0 N.rk e MC
~ +1 ~-0C-
+1 N ý '- +
m, -nN w1, " l
0 , +1
NM W t N +1~E to O IC I -C,, -
$..
00 CO O -CO
0~ '-4 -- 0 00 N
M M0cNr I
1C-
0 00 0 0 Du 0C.) N-C~ V. CIDI
o m co +-+

58
0 o 0 N a
~ +1 +1
-4-
~cq
+1 CfD wVY +
00
> l 0 0 TI
E CO N M t- Ecq~
0 00
m Lr 0 +
ot'o~ 010 0 +
tII I

59
0 00"I- oo
0 +1
00 CI +0
or 0
v4 p CIIC) CI
m C-4 -4
>- W000+ ot'I+1-
EC -Mt- LO?
Lo 040 -
0 0
00 00".4 - C? +

60
Lo tc m t L +
w 0 +1
C'E ~C', 0- '-, -
0 00(M 00 +1 +1
LO0X . VO
03
00040
N cq 0 > o C q

61
Monel 4001 hour, Aerated
Ecorr mm/yr Ep Eb Eb-Ep Ep- Ep-x 10-3 (mV) (mV) Ecorr Ezero
-208 33 -72 88 160 136 -72-206 19 -62 106 168 144 -62-210 21 -30 130 160 180 -30
-208±2 _ 24±7 1 -55±22 108±21 163±5 f 153±23 -55+_22
Monel 40017 hours, Aerated
Ecorr mm/yr Ep Eb Eb-Ep Ep- Ep-x 10-3 (mV) (mV) Ecorr Ezero
-204 10 -5 143 148 193 -5-198 15 -21 119 140 9 -21-204 22 20 164 144 224 20
-202±3 15±6 -2±2`1 142±231 144±4 1142±1161 -22±1
Monel 4001 hour, 0.02 mg/L
Ecorr mm/yr Ep Eb Eb-Ep Ep- Ep-x 10-3 (mV) (mV) Ecorr Ezero
-212 19 14 120 136 195 -19-211 15 0 112 112 211 0-206 20 -30 104 134 176 -30
-210±3 I 18.1±2.5 -16±12 111+5 127±111 194±14 1-16±12
Monel 40017 hours, 0.02 m /L
Ecorr mm/yr Ep Eb Eb-Ep Ep- Ep-x 10-3 (mV) (mV) Ecorr Ezero
-143 2.0 26 130 104 237 26-211 2.7 31 155 124 231 31-200 2.8 10 138 128 74 10
-185±37 J 2.5±0.5 19±11 j 151±221 106±641 168±68 1 15+13

62
Monel 4001 hour, 1.2 mg/L
Ecorr mm/yr Ep Eb Eb-Ep Ep- Ep-x 10-3 (mV) (mV) Ecorr Ezero
-6 31 -27 93 130 -28 -34-2 16 -34 96 94 12 100 34 -14 110 124 -14 -14
-3±3 • 27.0±9.3 [-25±10 F100±9 [ 125±5 [ -9±22 j-25±10
Monel 40017 hours, 1.2 mg/L
Ecorr mm/yr Ep Eb Eb-Ep Ep- Ep-
x 10 -3 (mV) (mV) Ecorr Ezero
-14 45 12 180 168 68 12-26 11 15 177 162 29 15-8 22 18 210 192 44 18
-16±9 25.8±17.4 15±3 189±18 174±161 47±20 15±3
Monel 4001 hours, 2.3 mg/L
Ecorr mm/yr Ep Eb Eb-Ep Ep- Ep-x 10-3 (mV) (mV) Ecorr Ezero
1 110 -19 95 114 -21 -192 69 -11 100 111 -12 -11
-14 61 -19 147 166 -5 -19-4±9 j80±26 A -16±5 114±291 130±31 -13±8 [ -16±5
Monel 40017 hours, 2.3 mg/L
Ecorr mm/yr Ep Eb Eb-Ep Ep- Ep-x 10-3 (mV) (mV) Ecorr Ezero
-17 85 28 200 100 23 13-10 62 13 224 165 52 35-20 80 35 162 126 35 36
-15±4 76±12 _ 25±11 158±441 130±33 37±15 1 28±13

63
Naval Brass1 hour, Aerated
Ecorr ZINC COPPERmmly x 10-3 mm/y x 10-3
-263 286 62.3-263 293 48.7-269 296 143
-265±3 1 292±5 85±51
Naval Brass17 hours, Aerated
Ecorr ZINC COPPERmm/y x 10-3 mm/y x 10-3
-241 154 66-221 266 28-233 156 31
-246±4 1 192±64 41±21
Naval Brass1 hour, 0.02 m/L
Ecorr ZINC COPPER
mm/IY x 10"3 mm/y x 10"3
-265 226 81-262 228 37-264 289 47
-264±2 1 248±36 55±23
Naval Brass17 hours, 0.02 m
Ecorr ZINC COPPERmm/y x 10-3 mm/y x 10-3
-235 46 17-238 52 9-236 26 13
-236±2 41±14 13±4

64
Naval Brass1 hour, 1.2 g/L
Ecorr ZINC COPPERmm/y x 10-3 mm/y x 10-3
-257 309 30-261 408 16-274 226 54
-264±9 315±91 [ 33±19
Naval Brass17 hours, 1.2 m/L
Ecorr ZINC COPPERmm/yx 10- 3 mm/y x 10-3
-252 415 50-236 202 29-235 113 45
-244±10 246±155 41±11
Naval Brass1 hours, 2.3 mw/L
Ecorr ZINC COPPERmm// x 10"3 mm/y x 10"3
-274 374 86-278 271 47-279 260 71
-277±3 302±63 1 68±19
Naval Brass17 hours, 2.3 mg/L
Ecorr ZINC COPPERmm/y x 10-3 rangy x 10-3
-260 274 83-268 262 57-259 247 43
-262±+5 [ 261_+14 61_+207

Uncl assified3ECURITY CLASSIFICATION OF THIS PAGE
REPORT DOCUMENTATION PAGE f Oor O7Od-ovod
la. REPORT SECURITY CLASSIFICATION 1b RESTRICTIVE MARKINGS 4
Unrestricted None2a. SECURITY CLASSIFICATION AUTHORITY 3. DISTRIBUTION /AVAILABILITY OF REPORT
2b. OECLASSIFICATION /DOWNGRADING SCHEDULE Unrest ri cted
4. PERFORMING ORGANIZATION REPORT NUMBER(S) S. MONITORING ORGANIZATION REPORT NUMBER(S)
64. NAME OF PERFORMING ORGANIZATION 6b. OFFICE SYMBOL 7a. NAME OF MONITORING ORGANIZATION
Rensselaer Polytechnic (If applicabe)
Institute I6c. ADDRESS (City. State, and ZIPCode) 7b. ADDRESS (City, State, and ZIP Code)
Troy, NY 12180-3590
8a. NAME OF FUNDING/SPONSORING 18b. OFFICE SYMBOL 9. PROCUREMENT INSTRUMENT IDENTIFICATION NUMBERORGANIZATION (If applicable)
Office of Naval Research I8c ADDRESS (City, State, and ZIP Code) 10. SOURCE OF FUNDING NUMBERS
800 N. Quincy Street PROGRAM PROJECT TASK WORK UNIT
Arlington, VA 22217-5000 ELEMENT NO. NO. ACCESSION NO
11. TITLE (Include Security Classification)The Effects of Dissolved Ozone on the Corrosion Behavior of 304 Stainless Steel, Monel 400and Naval Brass in Artificial Sea Water12. PERSONAL AUTHOR(S)B.E. Brown and D.J. Duquette13a. TYPE OF REPORT (13b. TIME COVERED 114" DATE OF REPORT (Year'MonthDay) JIS. PAGE COUNT
Final I FROM 1/ 9 0-1 r693 November 1, 1993 716. SUPPLEMENTARY NOTATION
NONE
17. COSATI CODES 18. SUBJECT TERMS (Continue on reverse if necessary and identify by block number)S FIELD GROUP SUB-GROUP
ILDU " Corrosion, Stainless Steel, Copper Nickel Alloy,I Dissolved Ozone, Chloride Solutions
19. ABSTRACT (Continue on reverse if necessary and identify by block number)
The effects of 0.02, 1.2 and 2.3 mg/L ozone on the corrosion behavior of 304 stainlesssteel, Monel 400, and naval brass were studied at room temperature in artificial sea waterat pH 7.5, and the results were compared with those obtained for aerated solutions. Corrosionpotentials and cyclic polarization curves were measured after 1 and 17 hour expsoure times.Instantaneous corrosion rates were measured using linear polarization resistance (LPR)techniques. Long term (30 day) crevice corrosion experiments were also performed on stainlesssteel and naval brass in aerated and 0.8 mg/L ozonated solutions.
Increasingly noble corrosion potentials were observed in the cases of stainless steeland Monel with increasing ozone concentration due to the noble redox potential of ozone. Navebrass, on the other hand, maintained a fairly constant corrosion potential, independent ofozone concentration, due to the formation of a bulk corrosion product on the metal surface.
LPR measurements on naval brass reflected the corrosion rates of both zinc and copperdue to dezincification occurring on the metal surface. These corrosion rates were found to
20. DISTRIBUTION/AVAILABILITY OF ABSTRACT 21. ABSTRACT SECURITY CLASSIFICATION
M UNCLASSIFIED/UNLIMITED C3 SAME AS RPT. 3 OTIC USERS Unrestricted22a. NAME OF RESPONSIBLE INDIVIDUAL 22b. TELEPHONE (include Area Code) I 22c. OFFICE SYMBOL
D.J. Dugeutte 518-276-6459
00 Form 1473, JUN 86 Previous editions are obsolete. SECURITY CLASSiFICATION OF THIS 'AGE


![Evaluation of Diethylene Triamine-pentamethylene ...12)/P05120130142.pdf · the corrosives of the water [1]. In fact; dissolved gases are the primary cause of most corrosion problems](https://img.pdfslide.net/doc/110x75/6015d53c1b30205fe7763c36/evaluation-of-diethylene-triamine-pentamethylene-12-the-corrosives-of-the.jpg)