Embed Size (px)
Citation preview
The Effects of Earthquakes on Infant Mortality Rates in Indonesia
A Working Honors Thesis Submitted
in Partial Fulfillment of the Elon University Honors Program
By Allison M. Stolte
April, 2011
Approved by:
____________________________________
Name of Professor, Thesis Mentor
____________________________________
Name of Professor, Department (Reader)
____________________________________
Name of Professor, Department (Reader)

Acknowledgements
I would like to thank Dr. Steven Bednar for acting as my mentor during this study, whose
assistance was instrumental in the thesis process as well as the completion of the significant
study. I would also like to thank Dr. Steve DeLoach for his help with the IFLS data formatting,
Dr. Ryan Kirk for his help with the GIS component of the study and Dr. Douglas Redington for
his initial help in the thesis process.
Abstract
In recent years, natural disasters have become more prevalent in the global community
making the understanding of their economic effects increasingly important. While some
economists argue that natural disasters spur economic growth, others argue that the destruction
of both human and physical capital hinders growth in the long run. This research tests the
opposing perspectives through the specific study of the effects of earthquakes on infant mortality
rates in Indonesian provinces from 1990-2010, using infant mortality as an economic indicator.
Data on earthquakes was collected from the United States Geological Survey while provincial
specific infant mortality control variables were collected from the Indonesian Family Life
Surveys (IFLS). The study demonstrates a dependence of infant mortality rates on the number of
earthquakes each province experiences.

Table of Contents
Introduction ................................................................................................................................ 1
Indonesia and Earthquakes .......................................................................................................... 7
Data .......................................................................................................................................... 10
Empirical Model ....................................................................................................................... 13
Results ...................................................................................................................................... 15
Conclusion ................................................................................................................................ 17
References ................................................................................................................................ 19
Maps and Tables ....................................................................................................................... 21
Data Appendix .......................................................................................................................... 25
1
Introduction
The average number of natural disasters occurring globally increases each year, with
apparent increases in both the number and severity of earthquakes. From 1970-1990, 11
earthquakes of magnitudes 8.0 or higher occurred, but from 1990-2010, the global community
felt the effects of 21 earthquakes with such a magnitude. The recent earthquakes in Haiti and
Japan have flooded the media, distinguishing their catastrophic and devastating effects. As these
disasters become more prevalent in our society, the understanding of their economic effects
becomes increasingly important (Kliesen 1994).
On January 12, 2010 a 7.0-magnitude earthquake struck the Caribbean nation of Haiti.
Already qualified as the worst earthquake in 200 years, the country was further distressed by 5.9
and 5.5-magnitude aftershocks which quickly followed. 1
Within 12 days, 52 aftershocks were
recorded. The epicenter of the initial quake struck about 10 miles southwest of the capital city,
Port-au-prince. Already one of the poorest countries in the western hemisphere, Haiti was
completely devastated by this natural tragedy. Structures of all kinds were left damaged or
collapsed; government buildings were no longer usable, national landmarks were destroyed, and
millions of Haitians were left homeless. Those whose homes remained intact still kept to the
streets, terrified the next aftershock would bring down their home. Hundreds of volunteers and
aid groups from all over the world rushed in with food, water and first aid. Though their efforts
saved countless lives the earthquake was initially estimated to have killed more than 230,000
people.2
Over a year after the January 12 earthquake, the country has experienced little progress.
Less than 5 percent of the capital city‟s debris is cleared, leaving enough behind to fill dump
1 “Earthquake in Haiti” 2 “Haiti: A year after the quake, waiting to rebuild” 11 January 2011, MSNBC, 28 March 2010.
http://www.msnbc.msn.com/id/41023645/ns/world_news-haiti/
2
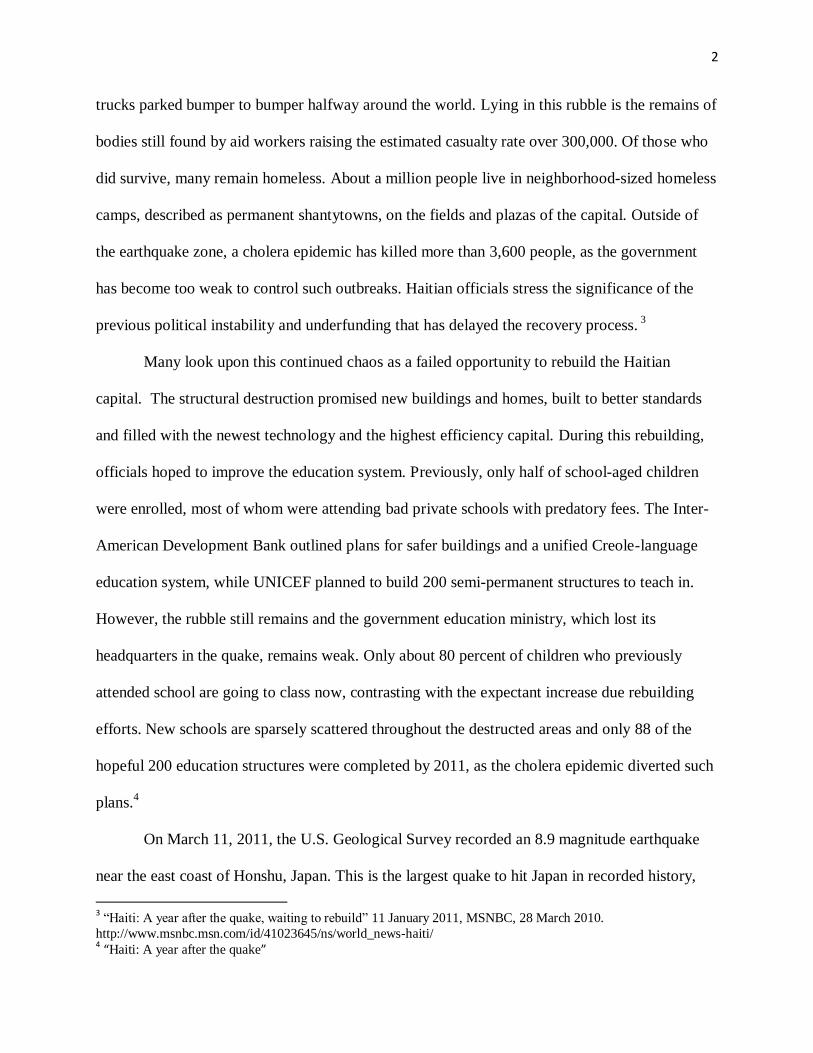
trucks parked bumper to bumper halfway around the world. Lying in this rubble is the remains of
bodies still found by aid workers raising the estimated casualty rate over 300,000. Of those who
did survive, many remain homeless. About a million people live in neighborhood-sized homeless
camps, described as permanent shantytowns, on the fields and plazas of the capital. Outside of
the earthquake zone, a cholera epidemic has killed more than 3,600 people, as the government
has become too weak to control such outbreaks. Haitian officials stress the significance of the
previous political instability and underfunding that has delayed the recovery process. 3
Many look upon this continued chaos as a failed opportunity to rebuild the Haitian
capital. The structural destruction promised new buildings and homes, built to better standards
and filled with the newest technology and the highest efficiency capital. During this rebuilding,
officials hoped to improve the education system. Previously, only half of school-aged children
were enrolled, most of whom were attending bad private schools with predatory fees. The Inter-
American Development Bank outlined plans for safer buildings and a unified Creole-language
education system, while UNICEF planned to build 200 semi-permanent structures to teach in.
However, the rubble still remains and the government education ministry, which lost its
headquarters in the quake, remains weak. Only about 80 percent of children who previously
attended school are going to class now, contrasting with the expectant increase due rebuilding
efforts. New schools are sparsely scattered throughout the destructed areas and only 88 of the
hopeful 200 education structures were completed by 2011, as the cholera epidemic diverted such
plans.4
On March 11, 2011, the U.S. Geological Survey recorded an 8.9 magnitude earthquake
near the east coast of Honshu, Japan. This is the largest quake to hit Japan in recorded history,
3 “Haiti: A year after the quake, waiting to rebuild” 11 January 2011, MSNBC, 28 March 2010.
http://www.msnbc.msn.com/id/41023645/ns/world_news-haiti/ 4 “Haiti: A year after the quake”
3
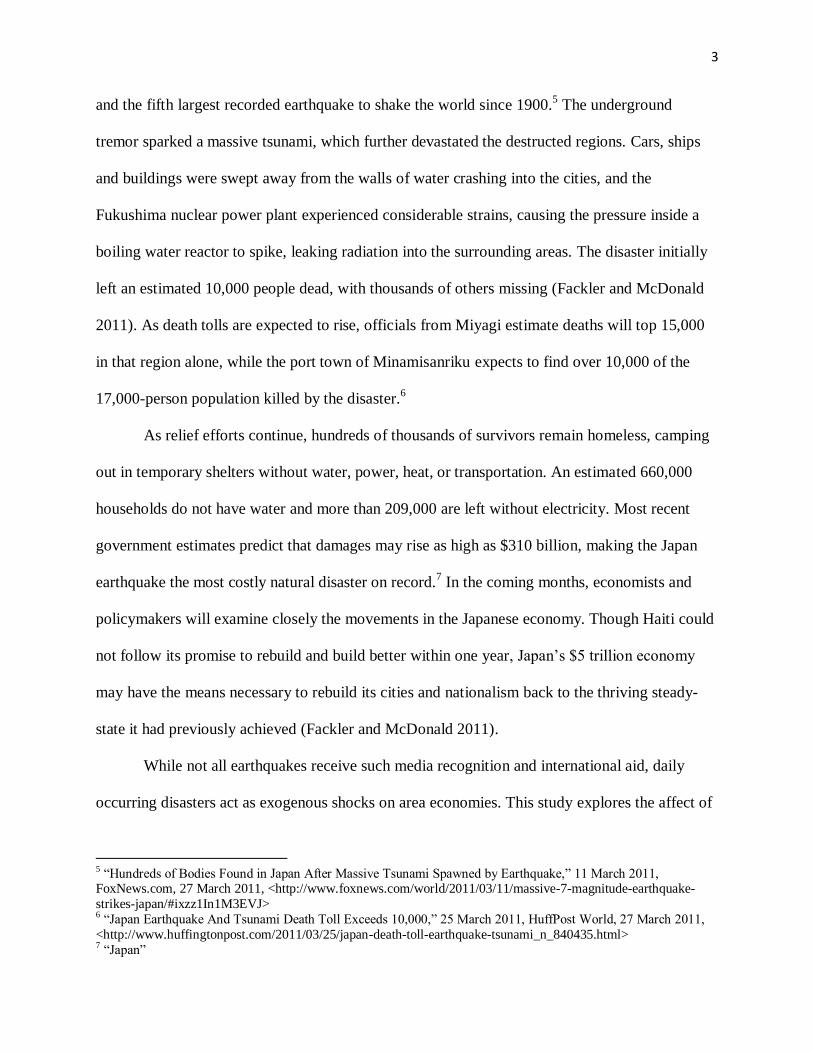
and the fifth largest recorded earthquake to shake the world since 1900.5 The underground
tremor sparked a massive tsunami, which further devastated the destructed regions. Cars, ships
and buildings were swept away from the walls of water crashing into the cities, and the
Fukushima nuclear power plant experienced considerable strains, causing the pressure inside a
boiling water reactor to spike, leaking radiation into the surrounding areas. The disaster initially
left an estimated 10,000 people dead, with thousands of others missing (Fackler and McDonald
2011). As death tolls are expected to rise, officials from Miyagi estimate deaths will top 15,000
in that region alone, while the port town of Minamisanriku expects to find over 10,000 of the
17,000-person population killed by the disaster.6
As relief efforts continue, hundreds of thousands of survivors remain homeless, camping
out in temporary shelters without water, power, heat, or transportation. An estimated 660,000
households do not have water and more than 209,000 are left without electricity. Most recent
government estimates predict that damages may rise as high as $310 billion, making the Japan
earthquake the most costly natural disaster on record.7 In the coming months, economists and
policymakers will examine closely the movements in the Japanese economy. Though Haiti could
not follow its promise to rebuild and build better within one year, Japan‟s $5 trillion economy
may have the means necessary to rebuild its cities and nationalism back to the thriving steady-
state it had previously achieved (Fackler and McDonald 2011).
While not all earthquakes receive such media recognition and international aid, daily
occurring disasters act as exogenous shocks on area economies. This study explores the affect of
5 “Hundreds of Bodies Found in Japan After Massive Tsunami Spawned by Earthquake,” 11 March 2011, FoxNews.com, 27 March 2011, <http://www.foxnews.com/world/2011/03/11/massive-7-magnitude-earthquake-
strikes-japan/#ixzz1In1M3EVJ> 6 “Japan Earthquake And Tsunami Death Toll Exceeds 10,000,” 25 March 2011, HuffPost World, 27 March 2011,
<http://www.huffingtonpost.com/2011/03/25/japan-death-toll-earthquake-tsunami_n_840435.html> 7 “Japan”
4
earthquakes on infant mortality rates in Indonesian provinces to better determine the extent of
which natural disasters strengthen a given economies infrastructure through child health
outcomes. A linear regression model is tested to demonstrate the relationship between the
dependent variable, infant mortality rates, on the independent variable, province number of
earthquakes and maximum earthquake magnitude in a given year. It is hypothesized that an
overall increase in earthquakes per year will decrease infant mortality rate in a given province, as
such regions will have better healthcare services and building and health codes to account for the
increased risk of disaster. If a significant, negative coefficient is demonstrated between the
earthquake variables and infant mortality rate, then increased earthquakes and earthquake sizes
could prove to decrease infant mortality rates in affected areas and demonstrate the stimulation
of an economy with the occurrence of natural disasters.
Earthquakes are geological processes that result in dramatic ground vibration. The global
tectonic process occurs beyond the influence or control of humans;8 scientists can statistically
calculate the probability of future earthquakes in a given area, but they cannot predict a single
earthquake or the effect of such an earthquake.9 The direct effects of earthquakes are often easy
to measure, as they last for merely an instance and their exact epicenter and severity can be
calculated. These unpredictable disasters with precise measurement guidelines are the ideal
disaster type to study correlating effects, as they are completely exogenous and it is relatively
easy to isolate each quake‟s results and the reacting behaviors of the surrounding economies and
people. Further, each affected area varies on their inaction with respect to creation and
enforcement of building codes, emergency response, and medical and reconstructive services, all
8 "FAQs – Earthquakes, Faults, Plate Tectonics, Earth Structure," 27 October 2009, USGS Earthquake Hazard
Programs, 5 November 2010. <http://earthquake.usgs.gov/learn/faq/?categoryID=1>. 9 "FAQs – Earthquake Myths," 27 October 2009, USGS Earthquake Hazard Programs, 5 November 2010.
<http://earthquake.usgs.gov/learn/faq/?categoryID=6>.
5
of which play a part in determining the toll of a given quake. Retrospective examinations of the
extent of earthquake destruction yields information involving each area‟s overall stability and
economic level (Anarci 1907). Studies have found that lower income areas and nations typically
experience higher levels of damage and deaths from earthquakes due to poorly designed
buildings, inferior building codes, and greater population densities.10
As the number of seismograph stations is increasing throughout the world, there has been
an increase in the number of recognized and recorded earthquakes. Research has also
demonstrated an increase in the percent of the population at risk of experiencing an earthquake.
The Pacific island nation of Indonesia holds a considerable amount of individuals
susceptible to earthquakes. Located along the Ring of Fire, Indonesia is geologically placed
among the most violent seismic activity in the Pacific Basin (Fackler and McDonald 2011). The
archipelago is composed of 17,508 islands, 6,000 of which are inhabited, and is structured into
33 provinces (7 of which have been added since 1999). The population densities of the
Indonesian provinces demonstrate large ranges, as provinces of Kalimantan and Irian Jaya have
less than 20 people per square kilometer and the province of Yogyakarta holds over 700 people
per square kilometer (IFLS1 Report). The provinces with greater population densities, on
average, are expected to experience greater destruction with each natural disaster (IFLS1
Report). The Indonesia terrain is composed mostly of coastal lowlands, making the populations
more susceptible to the effects of earthquakes whose epicenters are located off the coast. Over
the past 20 years, Indonesia has experienced an average of 6.8 earthquakes per year qualified as
significant by the United States Geological Survey.
10 "FAQs – Earthquake Effects and Experiences," 27 October 2009, USGS Earthquake Hazard Programs, 5
November 2010. <http://earthquake.usgs.gov/learn/faq/?categoryID=8>.
6
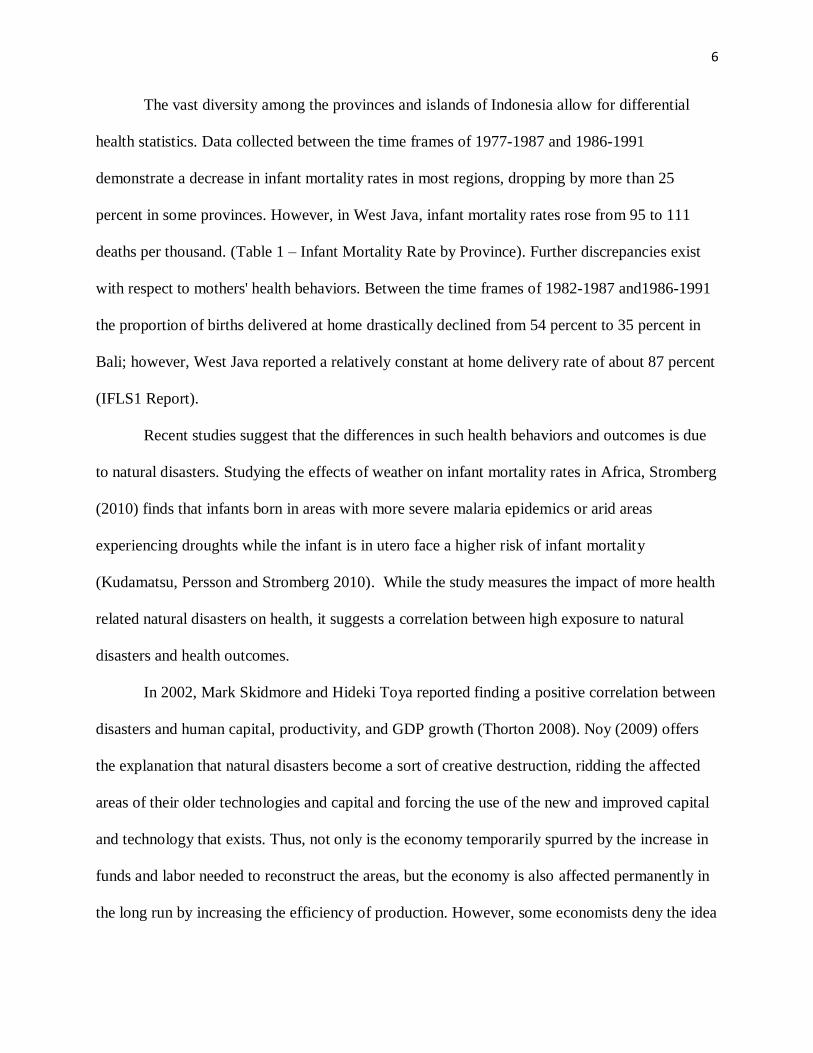
The vast diversity among the provinces and islands of Indonesia allow for differential
health statistics. Data collected between the time frames of 1977-1987 and 1986-1991
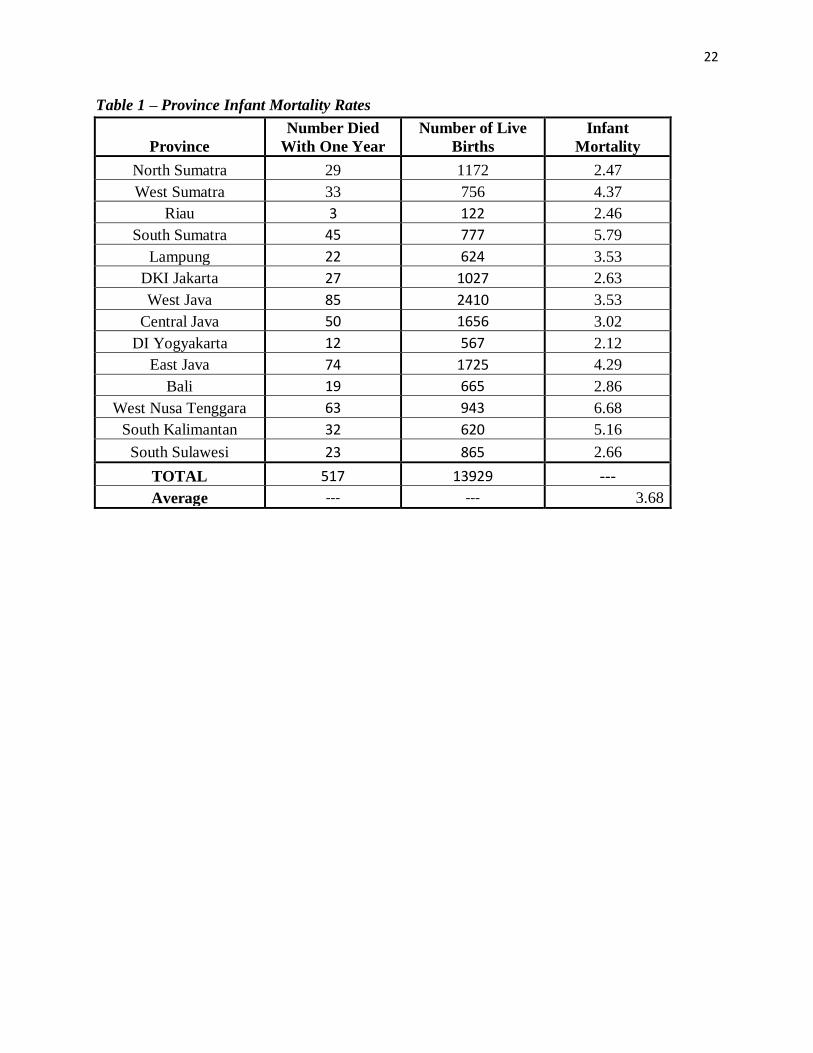
demonstrate a decrease in infant mortality rates in most regions, dropping by more than 25
percent in some provinces. However, in West Java, infant mortality rates rose from 95 to 111
deaths per thousand. (Table 1 – Infant Mortality Rate by Province). Further discrepancies exist
with respect to mothers' health behaviors. Between the time frames of 1982-1987 and1986-1991
the proportion of births delivered at home drastically declined from 54 percent to 35 percent in
Bali; however, West Java reported a relatively constant at home delivery rate of about 87 percent
(IFLS1 Report).
Recent studies suggest that the differences in such health behaviors and outcomes is due
to natural disasters. Studying the effects of weather on infant mortality rates in Africa, Stromberg
(2010) finds that infants born in areas with more severe malaria epidemics or arid areas
experiencing droughts while the infant is in utero face a higher risk of infant mortality
(Kudamatsu, Persson and Stromberg 2010). While the study measures the impact of more health
related natural disasters on health, it suggests a correlation between high exposure to natural
disasters and health outcomes.
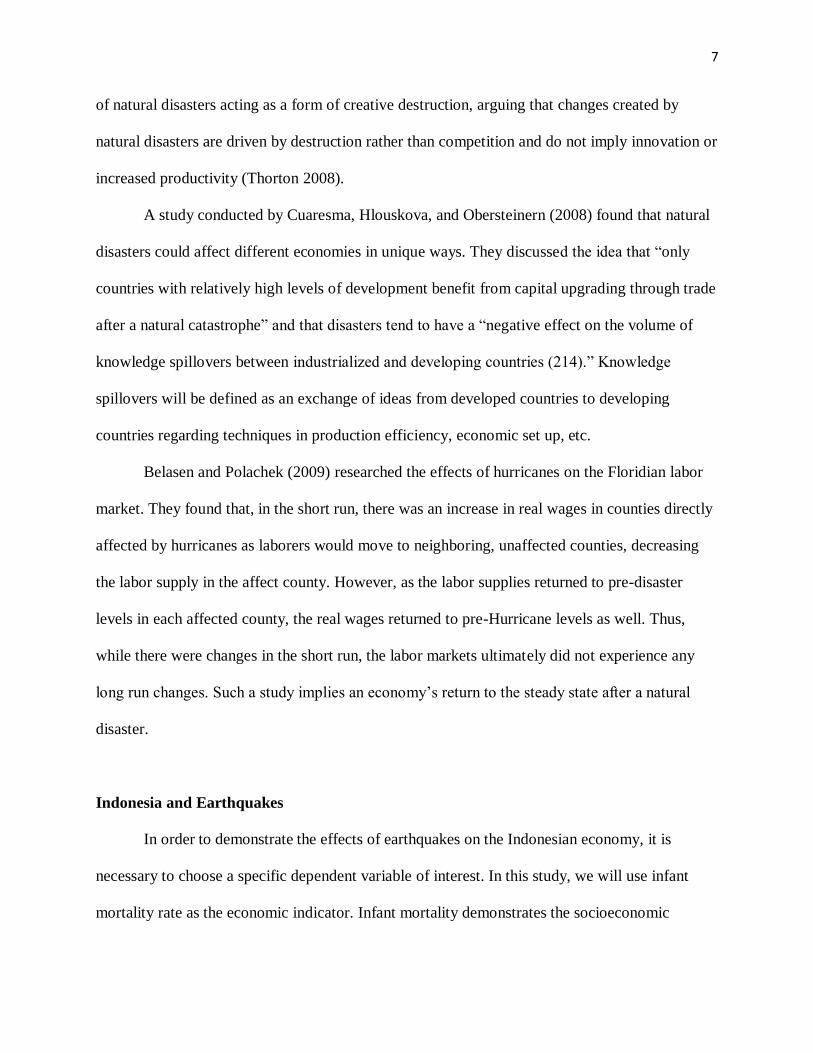
In 2002, Mark Skidmore and Hideki Toya reported finding a positive correlation between
disasters and human capital, productivity, and GDP growth (Thorton 2008). Noy (2009) offers
the explanation that natural disasters become a sort of creative destruction, ridding the affected
areas of their older technologies and capital and forcing the use of the new and improved capital
and technology that exists. Thus, not only is the economy temporarily spurred by the increase in
funds and labor needed to reconstruct the areas, but the economy is also affected permanently in
the long run by increasing the efficiency of production. However, some economists deny the idea
7
of natural disasters acting as a form of creative destruction, arguing that changes created by
natural disasters are driven by destruction rather than competition and do not imply innovation or
increased productivity (Thorton 2008).
A study conducted by Cuaresma, Hlouskova, and Obersteinern (2008) found that natural
disasters could affect different economies in unique ways. They discussed the idea that “only
countries with relatively high levels of development benefit from capital upgrading through trade
after a natural catastrophe” and that disasters tend to have a “negative effect on the volume of
knowledge spillovers between industrialized and developing countries (214).” Knowledge
spillovers will be defined as an exchange of ideas from developed countries to developing
countries regarding techniques in production efficiency, economic set up, etc.
Belasen and Polachek (2009) researched the effects of hurricanes on the Floridian labor
market. They found that, in the short run, there was an increase in real wages in counties directly
affected by hurricanes as laborers would move to neighboring, unaffected counties, decreasing
the labor supply in the affect county. However, as the labor supplies returned to pre-disaster
levels in each affected county, the real wages returned to pre-Hurricane levels as well. Thus,
while there were changes in the short run, the labor markets ultimately did not experience any
long run changes. Such a study implies an economy‟s return to the steady state after a natural
disaster.
Indonesia and Earthquakes
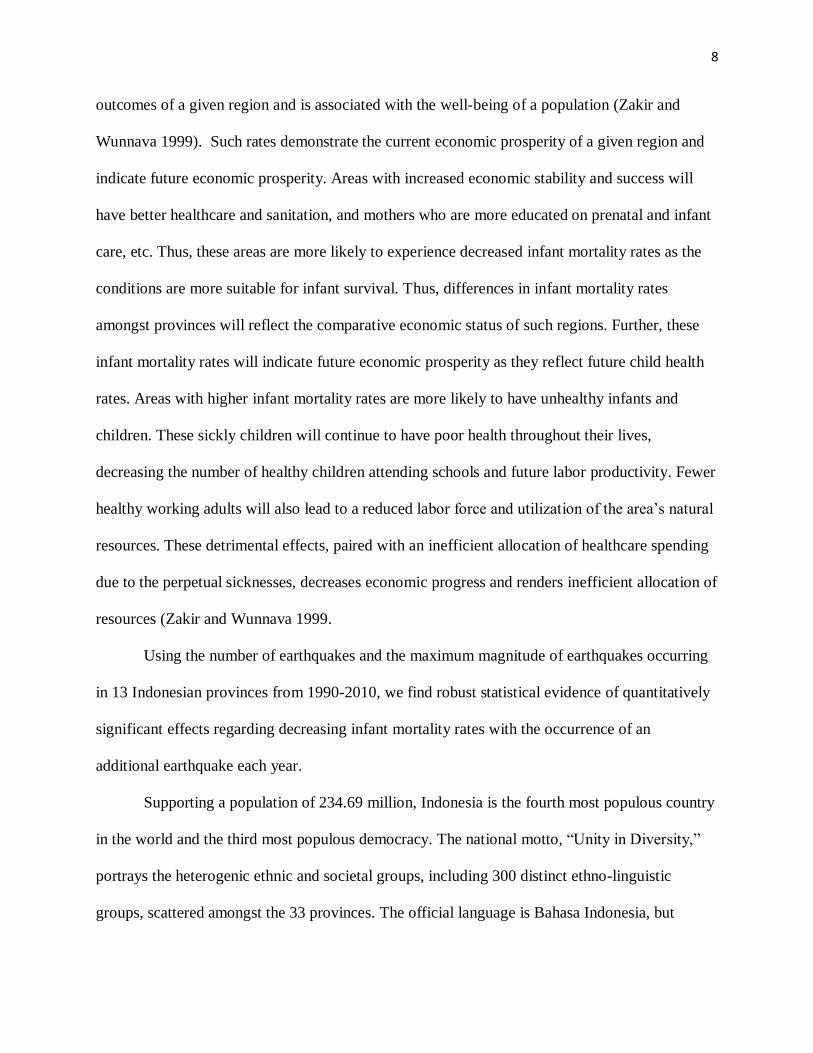
In order to demonstrate the effects of earthquakes on the Indonesian economy, it is
necessary to choose a specific dependent variable of interest. In this study, we will use infant
mortality rate as the economic indicator. Infant mortality demonstrates the socioeconomic
8
outcomes of a given region and is associated with the well-being of a population (Zakir and
Wunnava 1999). Such rates demonstrate the current economic prosperity of a given region and
indicate future economic prosperity. Areas with increased economic stability and success will
have better healthcare and sanitation, and mothers who are more educated on prenatal and infant
care, etc. Thus, these areas are more likely to experience decreased infant mortality rates as the
conditions are more suitable for infant survival. Thus, differences in infant mortality rates
amongst provinces will reflect the comparative economic status of such regions. Further, these
infant mortality rates will indicate future economic prosperity as they reflect future child health
rates. Areas with higher infant mortality rates are more likely to have unhealthy infants and
children. These sickly children will continue to have poor health throughout their lives,
decreasing the number of healthy children attending schools and future labor productivity. Fewer
healthy working adults will also lead to a reduced labor force and utilization of the area‟s natural
resources. These detrimental effects, paired with an inefficient allocation of healthcare spending
due to the perpetual sicknesses, decreases economic progress and renders inefficient allocation of
resources (Zakir and Wunnava 1999.
Using the number of earthquakes and the maximum magnitude of earthquakes occurring
in 13 Indonesian provinces from 1990-2010, we find robust statistical evidence of quantitatively
significant effects regarding decreasing infant mortality rates with the occurrence of an
additional earthquake each year.
Supporting a population of 234.69 million, Indonesia is the fourth most populous country
in the world and the third most populous democracy. The national motto, “Unity in Diversity,”
portrays the heterogenic ethnic and societal groups, including 300 distinct ethno-linguistic
groups, scattered amongst the 33 provinces. The official language is Bahasa Indonesia, but
9
English, Dutch and local dialects are also spoken throughout the archipelago. Indonesia is also
home to the world‟s largest Muslim population. Its diverse background and geographical set up
makes it ideal for intra-comparative studies and better allows for the application of studies to the
outside world.11
After years of being known for its inefficiency, corruption and instability, Indonesia
began a period of vast demographic and economic change starting in the 1970‟s and is now an
economic powerhouse in Asia (Belford 2010). The total population literacy rate has reached
90%, with an 87% female literacy rate, suggesting an improvement in national scholarship and
female education. The country‟s currency, the rupiah, is becoming stronger as 2010 records of
Indonesia‟s GDP purchasing power parity was estimated at $1.033 trillion US dollars, with an
annual growth rate of 6% and a GDP per capita of $4,300.12
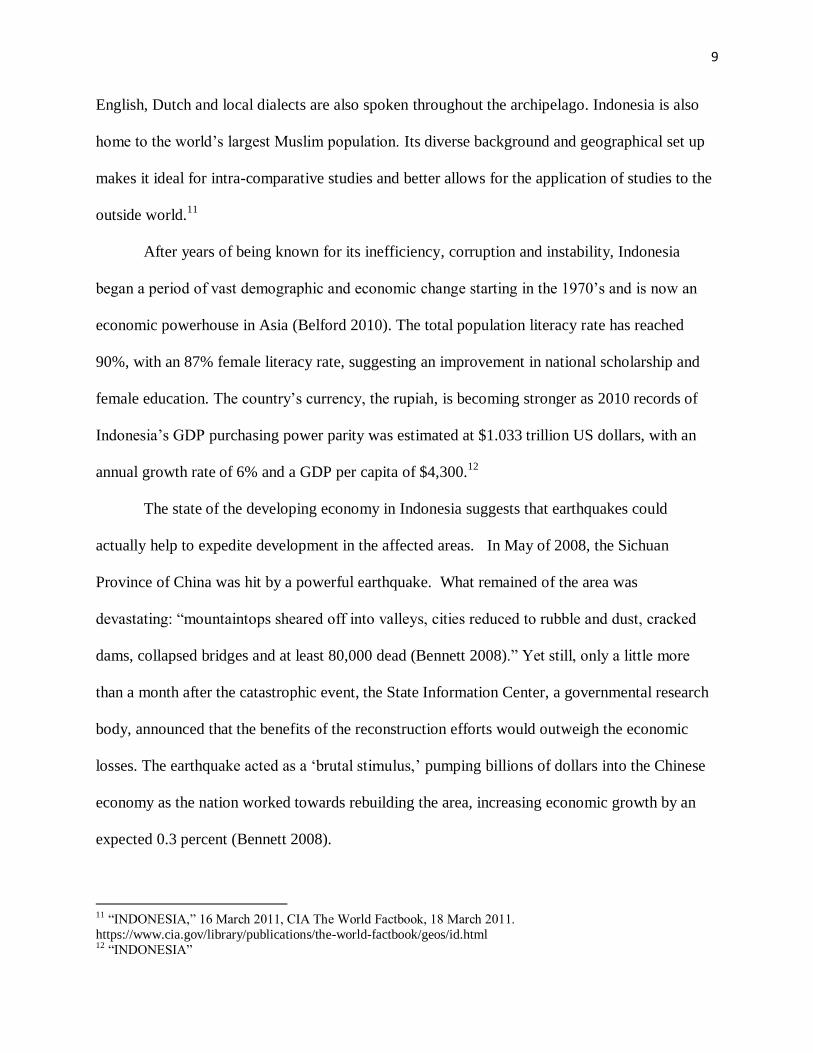
The state of the developing economy in Indonesia suggests that earthquakes could
actually help to expedite development in the affected areas. In May of 2008, the Sichuan
Province of China was hit by a powerful earthquake. What remained of the area was
devastating: “mountaintops sheared off into valleys, cities reduced to rubble and dust, cracked
dams, collapsed bridges and at least 80,000 dead (Bennett 2008).” Yet still, only a little more
than a month after the catastrophic event, the State Information Center, a governmental research
body, announced that the benefits of the reconstruction efforts would outweigh the economic
losses. The earthquake acted as a „brutal stimulus,‟ pumping billions of dollars into the Chinese
economy as the nation worked towards rebuilding the area, increasing economic growth by an
expected 0.3 percent (Bennett 2008).
11 “INDONESIA,” 16 March 2011, CIA The World Factbook, 18 March 2011.
https://www.cia.gov/library/publications/the-world-factbook/geos/id.html 12 “INDONESIA”
10
In general, a natural disaster is considered an exogenous shock, “an unexpected event that
impacts a given market (Belasen and Polachek 2009).” In the case of the Sichuan earthquake, the
disaster affected the area markets by destroying capital and forcing a reorganization of the
production of goods and services in the area in order to accommodate reconstruction efforts,
ultimately leading to a positive growth in the nation‟s economy. What seem to hold true for all
natural disasters are the two areas in which they affect each given economy: capital stock
(homes, roads, factories, etc.) and the ordinary flow of production and consumption (“Disaster
Economics”). Economists are beginning to argue that natural disasters promote economic growth
in the long run, as the rebuilding efforts attract resources to the area, providing short term boosts
and allowing the construction of new and more efficient infrastructure and the utilization of more
recent technology, transitioning the affected areas into a more productive economy in the long
run. The recovery process creates an economy that is more productive than it was before the
destruction and promotes the continued productivity through the permanent changes in building
structure and modern technology (Bennett 2008). The rest of the paper is structured to include a
data section, describing data collection and summary statistics, an empirical section outlining
those empirical models used a results section, detailing the significant correlations found, a
discussion section, and a conclusion. An appendix is provided including a map of Indonesian
earthquakes, summary statistic and result tables and a data appendix describing the merging and
cleaning of the data.
Data
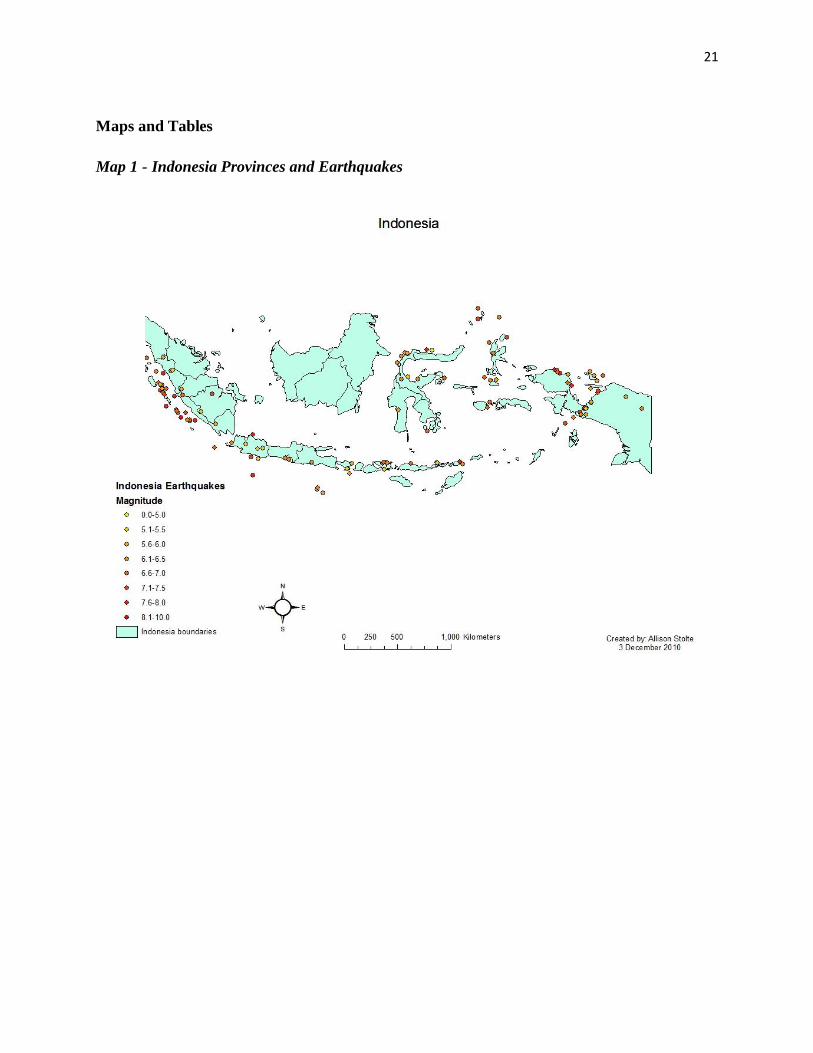
The earthquake data collected for this study was taken from the US Geological Survey
significant earthquake data. The date, location, magnitude, and depth of each earthquake were
11
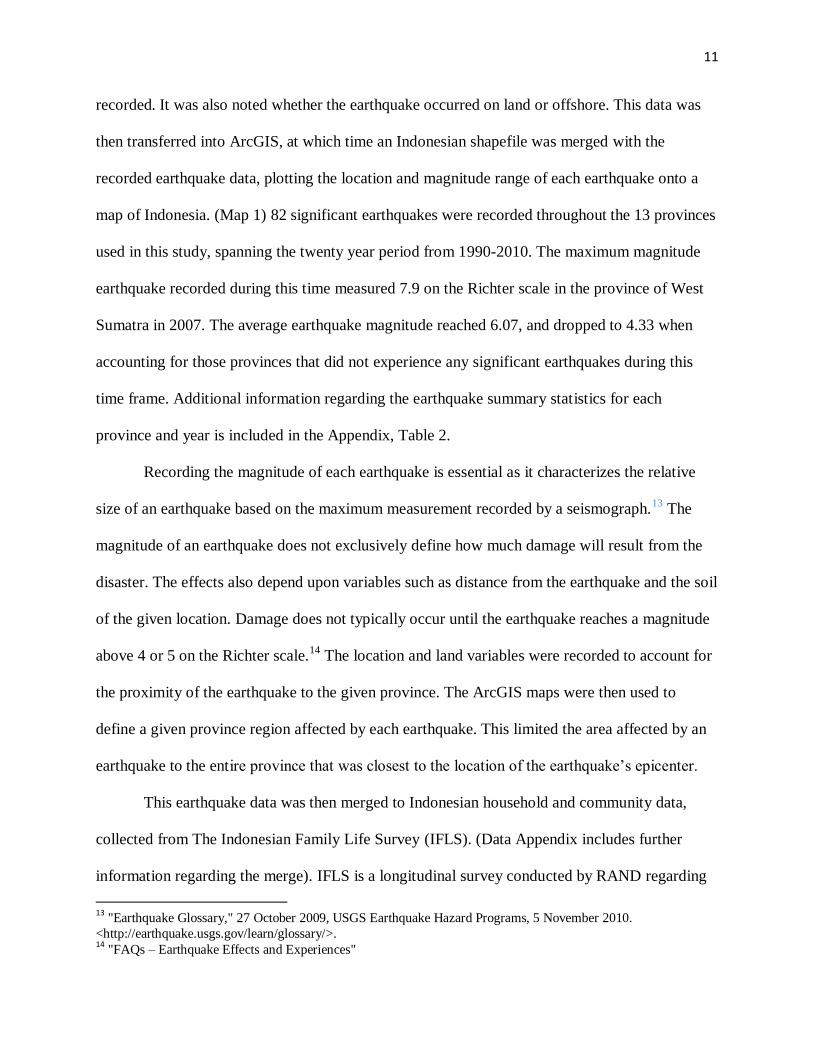
recorded. It was also noted whether the earthquake occurred on land or offshore. This data was
then transferred into ArcGIS, at which time an Indonesian shapefile was merged with the
recorded earthquake data, plotting the location and magnitude range of each earthquake onto a
map of Indonesia. (Map 1) 82 significant earthquakes were recorded throughout the 13 provinces
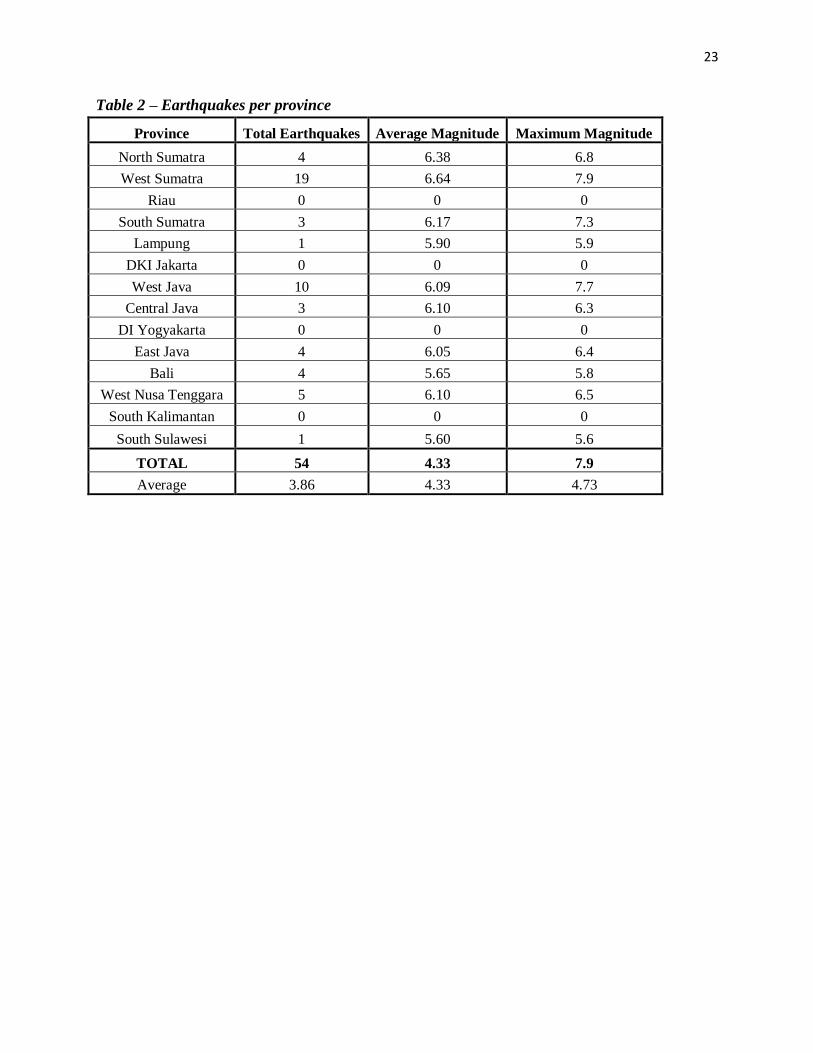
used in this study, spanning the twenty year period from 1990-2010. The maximum magnitude
earthquake recorded during this time measured 7.9 on the Richter scale in the province of West
Sumatra in 2007. The average earthquake magnitude reached 6.07, and dropped to 4.33 when
accounting for those provinces that did not experience any significant earthquakes during this
time frame. Additional information regarding the earthquake summary statistics for each
province and year is included in the Appendix, Table 2.
Recording the magnitude of each earthquake is essential as it characterizes the relative
size of an earthquake based on the maximum measurement recorded by a seismograph.13
The
magnitude of an earthquake does not exclusively define how much damage will result from the
disaster. The effects also depend upon variables such as distance from the earthquake and the soil
of the given location. Damage does not typically occur until the earthquake reaches a magnitude
above 4 or 5 on the Richter scale.14
The location and land variables were recorded to account for
the proximity of the earthquake to the given province. The ArcGIS maps were then used to
define a given province region affected by each earthquake. This limited the area affected by an
earthquake to the entire province that was closest to the location of the earthquake‟s epicenter.
This earthquake data was then merged to Indonesian household and community data,
collected from The Indonesian Family Life Survey (IFLS). (Data Appendix includes further
information regarding the merge). IFLS is a longitudinal survey conducted by RAND regarding
13
"Earthquake Glossary," 27 October 2009, USGS Earthquake Hazard Programs, 5 November 2010.
<http://earthquake.usgs.gov/learn/glossary/>. 14 "FAQs – Earthquake Effects and Experiences"
12
aspects of family and community living in 13 of the Indonesian provinces, accounting for 83
percent of the nation‟s population. Surveys were conducted in 1993, 1997, 2000, and 2007.
Household data on married women‟s pregnancy experiences, with individual pregnancies acting
as a single observation, is used to calculate mortality. Each observation included information
regarding the mother‟s overall pregnancy record at the time of the given pregnancy, pre-
pregnancy health and healthcare, mother and child health, post pregnancy health of the child, etc.
This data was then merged to each household‟s data to included information regarding the
urban/rural location of each household and province.
The IFLS data was taken on an individual level, thus the observations used in this
study have variables that are specific at the individual as well. Fertility rates are thus the fertility
rate of each individual and not of the entire country or community. The data was clustered at the
province level, in order to account for varying province statistics including regional literacy rates
and consumption. Further, the dataset used only covers married woman. Unmarried woman may
have different birthrates. In a developing country such as Indonesia a woman who gives birth out
of wedlock may have fewer funds to support her and her child, as she is less likely to have a job
and the men are the main providers of family units. Thus this study does not fully measure
overall infant mortality rates in Indonesia but more specifically the infant mortality rates of
infants born to married couples. If more married women live in provinces with fewer or more
earthquakes, then the data will further skew the results of this study. Many of the observations
did not include sufficient data on the month and day of the pregnancy birth, creating an
inconsistency in the timeline of the earthquake to the date of birth. Observations with births late
in the year will show the effects of more earthquakes during pregnancy while observations wit
13
births towards the beginning of the year will demonstrate the effects of earthquakes throughout
the first year of birth.
Empirical Model
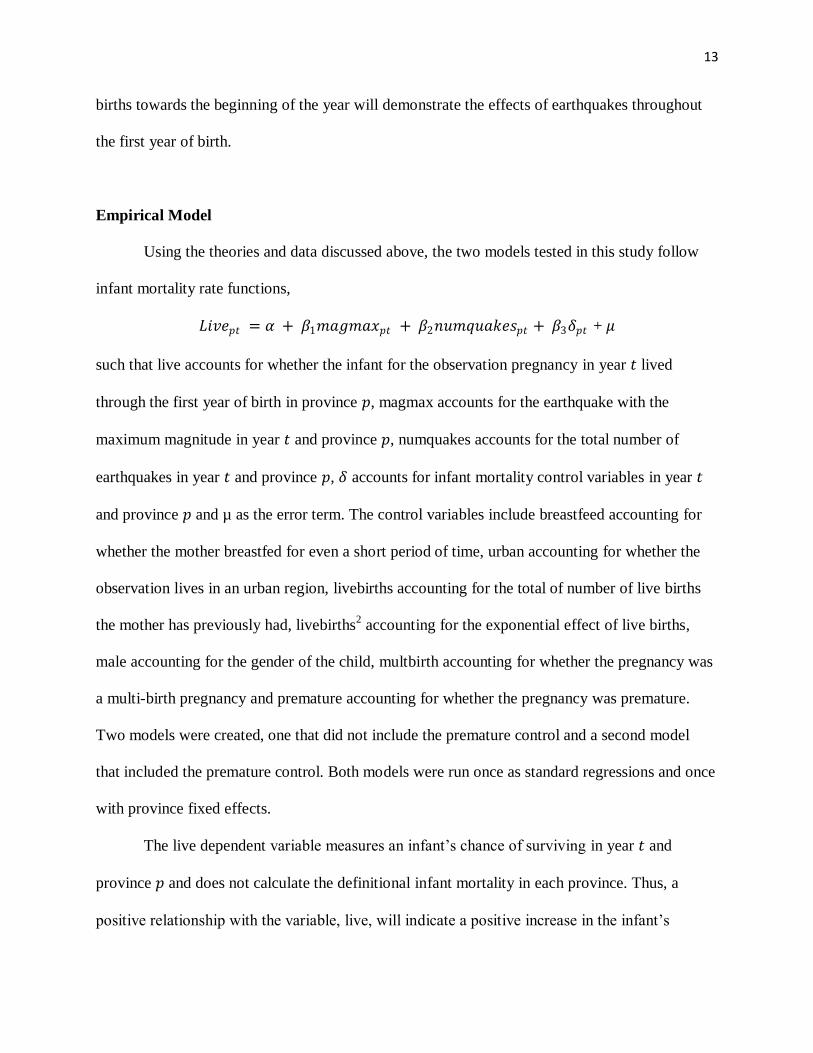
Using the theories and data discussed above, the two models tested in this study follow
infant mortality rate functions,
𝐿𝑖𝑣𝑒𝑝𝑡 = 𝛼 + 𝛽1𝑚𝑎𝑔𝑚𝑎𝑥𝑝𝑡 + 𝛽2𝑛𝑢𝑚𝑞𝑢𝑎𝑘𝑒𝑠𝑝𝑡 + 𝛽3𝛿𝑝𝑡 + 𝜇
such that live accounts for whether the infant for the observation pregnancy in year 𝑡 lived
through the first year of birth in province 𝑝, magmax accounts for the earthquake with the
maximum magnitude in year 𝑡 and province 𝑝, numquakes accounts for the total number of
earthquakes in year 𝑡 and province 𝑝, 𝛿 accounts for infant mortality control variables in year 𝑡
and province 𝑝 and µ as the error term. The control variables include breastfeed accounting for
whether the mother breastfed for even a short period of time, urban accounting for whether the
observation lives in an urban region, livebirths accounting for the total of number of live births
the mother has previously had, livebirths2 accounting for the exponential effect of live births,
male accounting for the gender of the child, multbirth accounting for whether the pregnancy was
a multi-birth pregnancy and premature accounting for whether the pregnancy was premature.
Two models were created, one that did not include the premature control and a second model
that included the premature control. Both models were run once as standard regressions and once
with province fixed effects.
The live dependent variable measures an infant‟s chance of surviving in year 𝑡 and
province 𝑝 and does not calculate the definitional infant mortality in each province. Thus, a
positive relationship with the variable, live, will indicate a positive increase in the infant‟s
14
survival chances, or variable live, and thus a negative relationship with that province‟s infant
mortality rate in year 𝑡.
Breastfeed is thought to positively affect live and increase the likelihood of infant
survival as it is more likely to provide the infants with the nutrients needed compared to other
means of feeding. Urban is thought to have a positive relationship with live as urban regions tend
to have better healthcare facilities and more access to such healthcare, increasing the infant‟s
chance of surviving and recovering from an illness or disabilities. The livebirths variable is used
to account for individual fertility rates. Fertility rate is defined as the number of children born to
a woman. Thus the fertility rate of each observation is determined by the number of live births
the responder has recorded in the dataset for each observation. This variable is predicted to have
a positive correlation with the chance of an infant surviving the first year, as the more live births
a responder has experienced, the more knowledgeable they are regarding pregnancy and infant
care. Further, it establishes the pattern that the responder is able to have a child who survives at
least the first year. However, this variable is considered exponential. Livebirths2 accounts for
those responders who have had numerous births. A high birth rate often results in the poor health
of the mother, decreasing her chances of experiencing a later, healthy pregnancy later and
increasing the chance of malnourished and diseased newborns whose chances of survival are
drastically reduced Zakir 1999). Further, Chowdhury (1988) suggests that mothers who are more
unlikely to birth healthy children will bear more children in hopes that some of the children will
survive and live longer, healthier lives (Zakir 1999). Thus, livebirths2 is expected to have a
negative relationship with live. The correlation between male births and survival is expected to
be positive, as, culturally, males hold more powers than females and thus greater amount of time
and money may go into the health of a male-born newborn opposed to a female. Multbirth is
15
expected to have a negative relationship with live, as multi-births are considering more taxing on
a mother‟s health as well as the infants both in-utero and in the birthing process. Premature is
also expected to have a negative impact on an infant‟s chance of surviving as their bodies are not
as equipped to survive out of the womb. It is predicted that numquakes will have a positive effect
on an infant‟s chance of surviving, as the more earthquakes a region experiences, the better
resources, healthcare and sanitation codes the area is expected to have. Increased number of
earthquakes experienced will continually replenish the region with buildings, technology and
healthcare resources of higher standards, positively affecting regional economic growth in the
long run. Similarly, magmax is predicted to have a positive effect on an infant‟s chance of
surviving, as the higher maximum magnitude earthquake each province experiences, the more
aid and services that will be pumped into that area in the long run.
Results
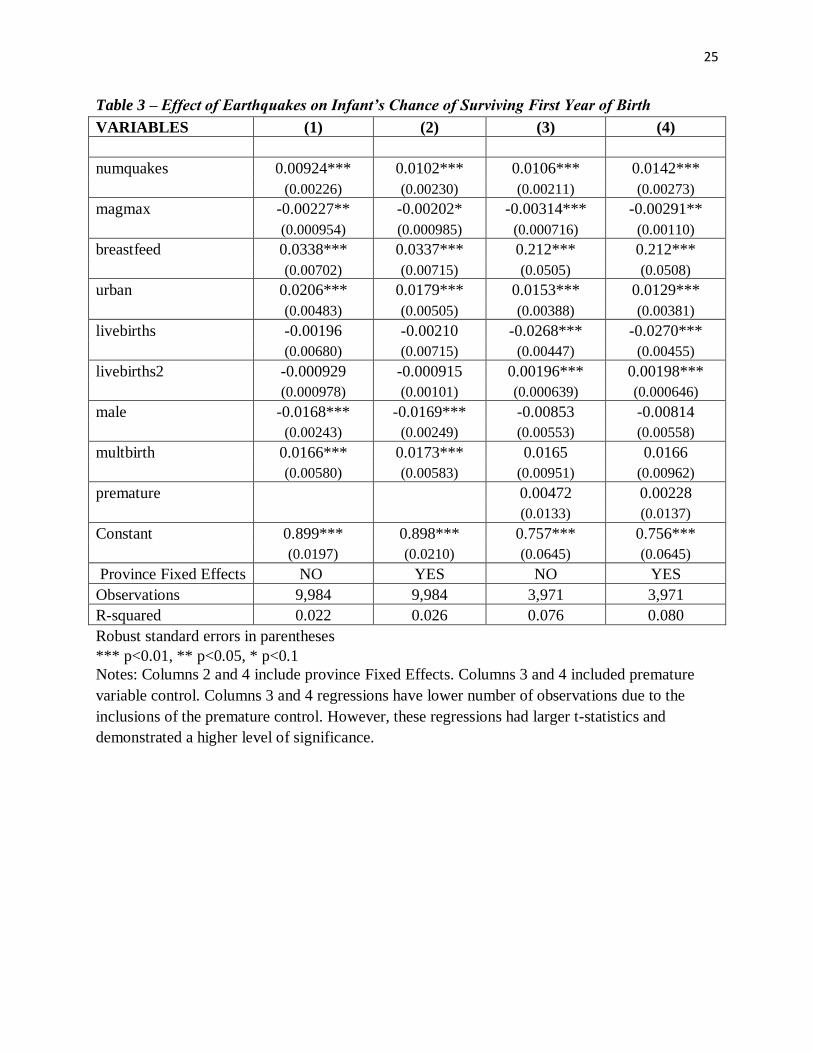
After running the four regressions, it was found that the number of earthquakes a
province experiences has a significant, positive relationship with the probability of infants
surviving past the first year and that increases in the maximum magnitude a province experiences
has a positive, slightly negative relationship with the dependent variable. The function that
proved to have the greatest significance was equation 4 (Table 3 – Effect of Earthquakes on
Infant‟s Chance of Surviving First Year of Birth), which includes the premature control and
province fixed effects.
The regressions with province fixed effects, equations 2 and 4, had more significant
effects than equations 1 and 3. There are characteristics in the IFLS provinces tested beyond
number and maximum magnitude of earthquakes per year that differentiate the regions and effect
16
infant mortality rate. Equations 3 and 4 had greater significances than their counterpart equations
1 and 2. Thus, these fixed effects models are essential as they account for the variations in infant
mortality rates throughout provinces and test the changes in infant mortality rates in individual
provinces throughout the defined time period dependent on number and maximum magnitude of
each earthquake. Though equations 3 and 4 reduced the number of observations used in the study
due to observations with incomplete survey information regarding the premature variable, the
overall equation and earthquake variables had greater significance. The R squared greatly
increased from equations 1 and 2 to equations 3 and 4, demonstrating the importance of the
premature variable in the overall model. The t-statistics for the numquakes variable increased
and the coinciding increase in the magmax variable raised the significance levels of in both
equations 3 and 4.
The magmax and numquakes variables are significant at the .05 level, and are both
significant up to the .01 level in equation 3. The regressions indicate that with an increase of one
earthquake, the chance of an infant surviving the first year of birth in the Indonesian provinces
raises about 1%. An increase of magnitude of 1 for the maximum magnitude earthquake in a
province decreases the chance of an infant surviving the first year of birth by about .25% While
the positive relationship regarding the numquakes variables was predicted, the negative
relationship regarding the maximum magnitude earthquake a province experiences is explained
by the fact that severe earthquakes are more likely to damage a responders house or local
healthcare center, as well as injure the responder or the infant. Thus, an increase in the severity
of an earthquake that the area experiences will slightly increase infant mortality. This statistic
demonstrates that areas that experience more severe earthquakes are more likely to have
increased infant mortality rates that year. However, because the magmax coefficient is relatively
17
low, an increase in earthquake magnitude will have minimal effects on changes in provincial
infant mortality rates. Such increases in magnitude will have the greatest, negative effects on
infant mortality rates when the magnitudes are highest.
While these results are inconsistent with Stromberg‟s results regarding malaria and
drought natural disasters in Africa, the earthquake disasters in this study represented a kind of
creative destruction. Malaria and droughts are disasters that are more long term and directly
affect the health of those affected. However, earthquakes are short exogenous shocks which
stimulate an area‟s economy through higher building and sanitation codes, as well as attracting
more aid and resources to such an area. Though increases in magnitude may decrease these
positive affects, it is at a level less than the increases in the infant mortality rates tested in this
study.
Conclusion
These findings demonstrate that increases in the number of earthquakes that an affected
area experiences increases an infant‟s chance of surviving the first year of birth. However,
increases in the severity of the earthquake experienced slightly decrease those chances of
surviving. Thus, moderate earthquakes help to decrease infant mortality rates, demonstrating the
significance of earthquakes in stimulating an area‟s economic indicators and economy in general.
Those Indonesian provinces that experience constant, moderate earthquakes should demonstrate
increased rates of economic growth and lower infant mortality rates.
Such findings are significant as they highlight the positive effects of moderate natural
disasters. The earthquakes in this study acted as forms of creative destruction, causing the
affected areas to increase their standard of livings in order to better prepare for the next
18
earthquake. More strict building codes, health resources, etc., are typically in these affected areas
in order to decrease the negative impact of such earthquakes on buildings, sanitation, and health
when they do occur. Thus, these areas benefit from the increased standards and codes throughout
the year, despite the random shocks of earthquakes. These results will be best replicated in
developing countries that experience more short-term disasters, such as earthquakes, opposed to
extended disasters such as droughts or health epidemics.
Future research regarding the impact of specific earthquake effects on infant mortality
rates would help to further explore these findings. Independent variables such as government
funded aid for disaster relief, outside aid and number of earthquakes per population size included
in the economic model could better indicate province earthquake specific characteristics that help
to determine infant mortality rates in such areas. Similarly, new independent variables, such as
building codes or healthcare quality indicators, that prove provincial economic status could
demonstrate the effects of earthquakes on an affected economy.
19
References
Belford, Aubrey. “After Years of Inefficiency, Indonesia Emerges as an Economic Model.” 5
August 2010. The New York Times. 8 February 2010.
<http://www.nytimes.com/2010/08/06/business/global/06iht-rupiah.html?ref=indonesia>
Belasen, Ariel R. and Solomon W. Polachek. “How Disasters Affect Local Labor Markets: The
Effects of Hurricanes in Florida.” The Journal of Human Resources. 44.1. (2009): (251-
276).
Bennett, Drake. “Do Natural Disasters Stimulate Economic Growth?” The New York Times. 8
July 2008.
Cuaresma, Jesus Cresp, Jaroslava Hlouskova, and Michael Obersteiner. “Natural Disasters as
Creative Destruction? Evidence from Developing Counties.” Economic Inquiry. 46, 2.
(April 2008): 214-226.
“Disaster Economics.” The Washington Post. 4 September 2005.
"Earthquake Glossary." 27 October 2009. USGS Earthquake Hazard Programs. 5 November
2010. <http://earthquake.usgs.gov/learn/glossary/>.
Fackler, Martin and Mark McDonald. “Death Toll Estimate in Japan Soars as Relief Efforts
Intensify.” 13 March 2011. The New York Times. 27 March 2011.
http://www.nytimes.com/2011/03/14/world/asia/14japan.html
"FAQs – Earthquake Effects and Experiences." 27 October 2009. USGS Earthquake Hazard
Programs. 5 November 2010. <http://earthquake.usgs.gov/learn/faq/?categoryID=8>.
"FAQs – Earthquakes, Faults, Plate Tectonics, Earth Structure." 27 October 2009. USGS
Earthquake Hazard Programs. 5 November 2010.
<http://earthquake.usgs.gov/learn/faq/?categoryID=1>.
"FAQs – Earthquake Myths." 27 October 2009. USGS Earthquake Hazard Programs. 5
November 2010. <http://earthquake.usgs.gov/learn/faq/?categoryID=6>.
Hallegatte, Stephane. “An Adaptive Regional Input-Output Model and its Application to the
Assessment of the Economic Cost of Katrina.” Risk Analysis. 28, 3. (2008): 779-799.
Kliesen, Kevin L. “The Economics of Natural Disasters.” Regional Economist. (April 1994): 1-5.
Kudamatsu, Masayuki, Torsten Persson, and David Stromberg. “Weather and Infant Mortality in
Africa.” September 2010. IIES Stockholm University.
Mohammed Zakir and Phanindra V. Wunnava. “Factors affecting infant mortality rates: evidence
from cross-sectional data.” Applied Economics Letters. 1999: 271-273.
20
Noy, Illan and Tam Bang Vu. “The Economics of Natural Disasters in a Developing Country:
The Case of Vietnam.” University of Hawaii at Manoa, Department of Economics. 09-3.
(May 2009): 1-28.
Stromberg, David. “Natural Disasters, Economic Development, and Humanitarian Aid.” Journal
of Economic Perspectives 21.3. (Summer 2007): (199-222).
Thorton, Mark. “Natural Disasters, It Turns Out, Are Bad.” Ludwig von Mises Institute. 7 May
2008.
Zakir, Mohammed and Phanindra V. Wunnava. “Factors affecting infant mortality rates:
evidence from cross-sectional data.” Applied Economics Letters. 1999: 271.
21
Maps and Tables
Map 1 - Indonesia Provinces and Earthquakes
22
Table 1 – Province Infant Mortality Rates
Province
Number Died
With One Year
Number of Live
Births
Infant
Mortality
North Sumatra 29 1172 2.47
West Sumatra 33 756 4.37
Riau 3 122 2.46
South Sumatra 45 777 5.79
Lampung 22 624 3.53
DKI Jakarta 27 1027 2.63
West Java 85 2410 3.53
Central Java 50 1656 3.02
DI Yogyakarta 12 567 2.12
East Java 74 1725 4.29
Bali 19 665 2.86
West Nusa Tenggara 63 943 6.68
South Kalimantan 32 620 5.16
South Sulawesi 23 865 2.66
TOTAL 517 13929 ---
Average --- --- 3.68
23
Table 2 – Earthquakes per province
Province Total Earthquakes Average Magnitude Maximum Magnitude
North Sumatra 4 6.38 6.8
West Sumatra 19 6.64 7.9
Riau 0 0 0
South Sumatra 3 6.17 7.3
Lampung 1 5.90 5.9
DKI Jakarta 0 0 0
West Java 10 6.09 7.7
Central Java 3 6.10 6.3
DI Yogyakarta 0 0 0
East Java 4 6.05 6.4
Bali 4 5.65 5.8
West Nusa Tenggara 5 6.10 6.5
South Kalimantan 0 0 0
South Sulawesi 1 5.60 5.6
TOTAL 54 4.33 7.9
Average 3.86 4.33 4.73
24
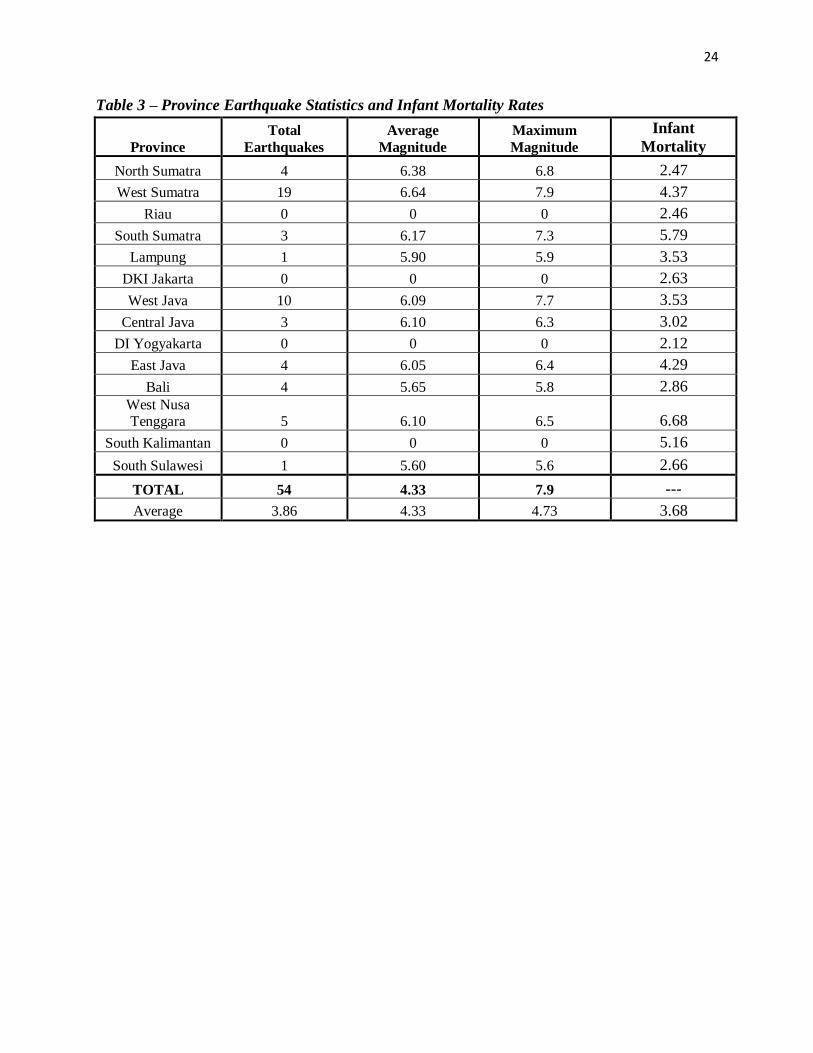
Table 3 – Province Earthquake Statistics and Infant Mortality Rates
Province
Total
Earthquakes
Average
Magnitude
Maximum
Magnitude
Infant
Mortality
North Sumatra 4 6.38 6.8 2.47
West Sumatra 19 6.64 7.9 4.37
Riau 0 0 0 2.46
South Sumatra 3 6.17 7.3 5.79
Lampung 1 5.90 5.9 3.53
DKI Jakarta 0 0 0 2.63
West Java 10 6.09 7.7 3.53
Central Java 3 6.10 6.3 3.02
DI Yogyakarta 0 0 0 2.12
East Java 4 6.05 6.4 4.29
Bali 4 5.65 5.8 2.86 West Nusa Tenggara 5 6.10 6.5 6.68
South Kalimantan 0 0 0 5.16
South Sulawesi 1 5.60 5.6 2.66
TOTAL 54 4.33 7.9 ---
Average 3.86 4.33 4.73 3.68
25
Table 3 – Effect of Earthquakes on Infant’s Chance of Surviving First Year of Birth
VARIABLES (1) (2) (3) (4)
numquakes 0.00924*** 0.0102*** 0.0106*** 0.0142***
(0.00226) (0.00230) (0.00211) (0.00273)
magmax -0.00227** -0.00202* -0.00314*** -0.00291**
(0.000954) (0.000985) (0.000716) (0.00110)
breastfeed 0.0338*** 0.0337*** 0.212*** 0.212***
(0.00702) (0.00715) (0.0505) (0.0508)
urban 0.0206*** 0.0179*** 0.0153*** 0.0129***
(0.00483) (0.00505) (0.00388) (0.00381)
livebirths -0.00196 -0.00210 -0.0268*** -0.0270***
(0.00680) (0.00715) (0.00447) (0.00455)
livebirths2 -0.000929 -0.000915 0.00196*** 0.00198***
(0.000978) (0.00101) (0.000639) (0.000646)
male -0.0168*** -0.0169*** -0.00853 -0.00814
(0.00243) (0.00249) (0.00553) (0.00558)
multbirth 0.0166*** 0.0173*** 0.0165 0.0166
(0.00580) (0.00583) (0.00951) (0.00962)
premature 0.00472 0.00228
(0.0133) (0.0137)
Constant 0.899*** 0.898*** 0.757*** 0.756***
(0.0197) (0.0210) (0.0645) (0.0645)
Province Fixed Effects NO YES NO YES
Observations 9,984 9,984 3,971 3,971
R-squared 0.022 0.026 0.076 0.080
Robust standard errors in parentheses
*** p<0.01, ** p<0.05, * p<0.1
Notes: Columns 2 and 4 include province Fixed Effects. Columns 3 and 4 included premature
variable control. Columns 3 and 4 regressions have lower number of observations due to the
inclusions of the premature control. However, these regressions had larger t-statistics and
demonstrated a higher level of significance.