Embed Size (px)
Citation preview

~ Unned States~ 'J. Department of
Agriculture
NationalAgriculturalStatisticsService
Research Division
SRB Research ReportNumber SRB-95-05
August 1995
The Effects of Editing anda Review of WarningErrors From a CAPI/IEPerspective
Tom Pordugal

THE EFFECTS OF EDITING AND A REVIEW OF WARNING ERRORS FROM ACAPI/IE PERSPECTIVE, by Tom Pordugal, Ohio Applications Research Section, SurveyResearch Branch, Research Division, National Agricultural Statistics Service, United StatesDepartment of Agriculture, Washington, D.C. 20250-2000, July 1995, Report NumberSRB-95-05.
ABSTRACT
In 1994, the Technology Research Section of the National Agricultural Statistics Service(NASS) directed a study involving all June area segments in Indiana. The research focused onevaluating Computer Assisted Personal Interviewing (CAPI) as a data collection method ascompared to the traditional Paper and Pencil Interviewing (PAPI) method. A test wasconducted in Indiana that examined the collection of data from a sub-sample of their areasegments through CAPI. The balance of area segments ran through a Blaise interactive edit(IE) after one statistical/clerical review of the paper questionnaires. All data were editedinteractively by survey statisticians prior to the mainframe Survey Processing System (SPS)edit. This paper addressed two post-survey issues. The first issue involved the differences inthe way that non-critical errors are handled between interactive editing and batch editingsystems (SPS). Large amounts of warning errors cannot be ignored by the interactive editingsystem, and the analyses in this paper identified such warning errors. The second issueaddressed data quality within the CAPI and PAPI data and differences between CAPI andPAPI data collection techniques. The analyses compared the CAPI and PAPI data sets to therespective data in the clean and edited data set.
KEY WORDS
Computer Assisted Personal Interview (CAPI); Interactive Editing (IE); Binomial ProportionTest; Sign Test.
This paper was prepared for limited distribution to the research community outside the U.S.Department of Agriculture.
ACKNOWLEDGEMENTS
The author thanks Roberta Pense and Mark Schleusener for their assistance with analysis andhelpful suggestions. The author also thanks Guy Pense for his assistance with data processing.

II TABLE OF CONTENTS IISUMMARY III
INTRODUCTION 1
WARNING ERRORS AND THE EDITING POLICY 2
EFFECTS OF EDITING 5
REFERENCES 9
APPENDIX A: THE BINOMIAL PROPORTIONS TEST 9
APPENDIX B: THE SIGN TEST FOR MEDIANS 10
11

INTRODUCTION
In 1994, the Technology Research Sectionconducted a study to explore two methodsof improving the quality of survey data.These involved the use of InteractiveEditing (IE) and Computer AssistedPersonal Interviewing (CAPI). Althoughthe Technology Research Sectionconducted the June Area Survey researchproject in Indiana and Pennsylvania, thispaper's study was limited to only Indiana'sJune Area Survey. The purpose of thestudy in Indiana was to pilot test CAPI andIE procedures on a small scale. This paperdeals with two post -survey issues. Thefirst issue focuses on the differences in theway that non-critical errors are handled ininteractive editing and NASS's batchediting systems (SPS). The second issueaddresses data quality within the CAPI andPAPI data and the differences betweenCAPI and PAPI data collection methods.
Granquist (1995) defines editing as theprocedure for detecting and adjustingindividual errors in data records resultingfrom data collection and capture. Thechecks for identifying missing, erroneous,or suspicious values in computer-assistedediting are called edits. Moreover, editingchange refers to the situation where an itemvalue (a question from the survey) isadjusted as a consequence of action takenwhen an error is identified.
NASS's traditional method of collectingand editing data for face-to-face interviewsis through paper-and-pencil interviewing(PAPI) and editing with Survey ProcessingSystem (SPS) batch processing on amainframe. Generally, editing survey datainvolves looking at whether the SPSgenerates critical or non-critical errors.
I
Non-critical errors are called warningerrors (or messages) or soft errors, wherethe data are considered acceptable, butunusual, by the SPS. Critical errors (orhard errors) occur in the data when theupper and lower bounds set by the systemare exceeded or when the data are notrecognized by the system. Non-criticalerrors disappear after the first SPS editunless there is an update to the record.
With batch processing, the errors detectedafter data entry involve many steps:rehandling the questionnaire; writing thecorrections on paper; sending thecorrections back to data entry; and runninganother SPS edit usually overnight.Therefore, the State Statistical Officesspent much time reviewing thequestionnaires before data entry to avoidcorrections after data entry.
The interactive process edits and displaysdata on a computer screen dynamically. Asall data involved in the error are displayedon the screen, the enumerator or data editorcan choose which data values to correct.As the statistician or statistical assistantmakes corrections and/or changes to data,the record is immediately re-edited. Thisgives the editor immediate feedback.Calculations of ratios can be carried out inerror messages, and recalculated at will.Derived values such as yields can becomepart of the display as can historical or listframe data. Unlike the SPS, the interactiveediting process eliminates re-sending formsto data entry or waiting for overnight editruns.
CAPI refers to the data collection method.Instead of using paper and pencil to recordthe information, enumerators use sub-notebook computers loaded with Blaise

programs that contain the questions, routes,and edit checks. Because there are editingchecks during the interview, interactiveediting does occur within CAPI. However,after the data are sent to the State Office,more stringent edits can also be appliedinteractively using the same software. Forpurposes of this analysis, this type ofediting in the State Office is defmed asinteractive editing.
The seven supervisory enumerators inIndiana chose one enumerator from eachgroup of enumerators to do CAPI.Enumerators were selected by theirsupervisor to participate in the project, andtwo enumerators had used CAPI in 1993.Although the enumerators' computerbackgrounds and aptitudes ranged widely,they were not just chosen at random.
Once chosen, the enumerators were tocomplete their whole assignment by meansof CAPI. All other enumerators usedpaper and pencil to collect the data. Theseven enumerators completed a total of 363interviews with CAPI. The interviewsclassified as non-agricultural were screen-out interviews. The agricultural interviewswere those where actual farm data werecollected. Twenty-three percent of allagricultural interviews were collected byCAPI.
WARNING ERRORS AND THEEDITING POLICY
Purpose
The purpose of this analysis was to identifyand examine the warning-type errors thatwere generated in both the unedited PAPIdata and the PAPI portion of the editedfile. This would indicate unnecessary data
2
warnings, i.e., where the data are not beingchanged very often. The unedited PAPIrecords were targeted because they werethe "dirty" records, Le., those records thatpassed through the cursory pre-keyentryreview. Thus, the edits that rarely resultedin changing the data might be eliminatedentirely in the edit by letting the analysispackages or data listings identify theproblems. Moreover, based on thefrequency of edit checks, the edit checkscan be modified so they do not result in adata review as often. In addition, changescould be made to the survey question toavoid recording erroneous data in the firstplace.
It is always important to limit error reviewto those data values most likely to be inneed of correction. Reviewing a largenumber of error messages is tedious.Repetitive and monotonous actions tend tohave editing "mistakes" creep in. Editors'time should be spent efficiently, usuallylooking at "incorrect" data. This is true ofany editing system.
With NASS moving to interactive editing,producing efficient edits is even moreimportant because interactive editinghandles errors differently. Errorsuppression in the Blaise interactive edittakes some work not required in batchediting. If the statistician "does nothing"in SPS, then the warning goes away, Le.,the data are accepted with no corrections.On the other hand, in interactive editing thestatistician has to hit the "s" key to indicatethe warning has been reviewed and the dataaccepted. If there are a large number ofunnecessary warning errors, this canbecome time consuming. However, thisensures that warning errors are reviewed.

Methods
This part of the research looked only atpaper questionnaires (PAPn. The CAPIdata were not examined because theyalready had been through editing checks.With CAPI, edits occurred during eachinterview, so there would be no way ofknowing how many error corrections weremade during each interview.
A minimal amount of editing was done onthe paper questionnaires before the"unedited" data files were processedthrough the computer edit. This editingconsidered the following: checking andverifying the overlap/non-overlap codingon the questionnaires; filling a cell if theenumerator checked the box, but forgot tocode the cell; marking the appropriatecompletion code boxes; entering "-1' s"where the enumerator wrote "don't know";making sure the crops are recorded in theproper cells; entering item codes foroptional land uses codes in the Field Cropstable; reviewing for legible entries; andusing historic data or calling the respondentto obtain and/or verify necessary data.
The data as originally keypunched wereprocessed through the SPS edit.Corrections to administrative-type data,such as strata codes, were processed aswell. This made sure that the commoditydata were routed through the edit correctly.Namely, this ensured that the data wouldbe present when required. However, anyadjustments to the original commodity datawere not processed.
3
The counts of non-critical SPS errors in theunedited data were compared to the errorsin the edited PAPI data to see roughly howoften the warnings resulted in changeddata. However, the unedited data mayhave caused a critical error in the first edit,and the correction may have generated awarning error in the edited file edit. Thus,it would be erroneous to say the following:of the "x" warning errors in the uneditedfile, "y" are still present in the final dataset.
Counts were identified for those errors thatoccurred at least nine times in either theunedited or edited data and did not appearto result in changed data at least 50 percentof the time. If the statistician needed tochange the data, then the interactive editwas much easier. However, if the datawere not changed, then the interactive editrequired more work on the statistician'spart to suppress them. This was the reasonthat "at least 50 percent of the warningerrors" was targeted, i.e., that the datagenerally were changed at least 50 percentof the time.
Analysis
Table 1 shows the counts of the non-criticalSPS errors of the PAPI data. Counts wereidentified for those errors that occurred atleast nine times in either the unedited oredited data and did not appear to becorrected at least 50 percent of the time.However, any further analysis can only betaken lightly, since the edited data does notnecessarily show how many recordsactually got changed.

Table 1: Counts of Non-Critical Errors for Unedited and Edited Data for PAPI
Error Counts Unedited Edited
Winter Wheat Acres Planted for Grain: 17 9Warning 249
Pigs on Hand March Thru May: 33 21Warning 511
Calves Born Since January 1 (Farm): 16 8Warning 605
Cattle on Feed Total (Farm): 35 16Warning 616
Rams and Wethers 1 Year and Older: 9 9Warning 709
Ag Land Values (IC416): 317 284Warning 864
Discussion and Recommendations
Based on the research, agricultural landvalues produced the most warning errors.Based on Table 1, this warning was theonly "bad" one, i.e., where correctionswere hardly ever made to the data.However, this was the first year that theAg Land Values Section was added to theJune Survey.
Thus, the first recommendation,informally made to the Statistical MethodsBranch in early 1995, was to reconsider theedit checks for the warnings listed inTable 1. Steps had already been takenbased on survey evaluations to modifyerrors 864 (ag land values) and 616 (cattleon feed). The other warning errors wereconsidered prior to the 1995 edit.
4
The second recommendation involves pre-testing the editing instrument. Agriculturalland values section was new to the JuneArea Survey in 1994. The questionnairewas pre-tested, but the edits were not.Generally, the focus of edit instrument pre-testing should be the following: how oftencertain warnings types surface, i.e., howoften warnings need to be corrected; theclarity of error messages; and whether, in adata collection environment, an enumeratorcan get a critical error in a situation that ispossible.
Pre-testing editing instruments and datacollection instruments that contain edits andinstructions are particularly important ifthey are used in a distributed environment.If changes get made to the instrument, thenthe instrument has to be re-distributed,which means re-installing in the State
Office. This, in turn, requires more workfor the State Office.
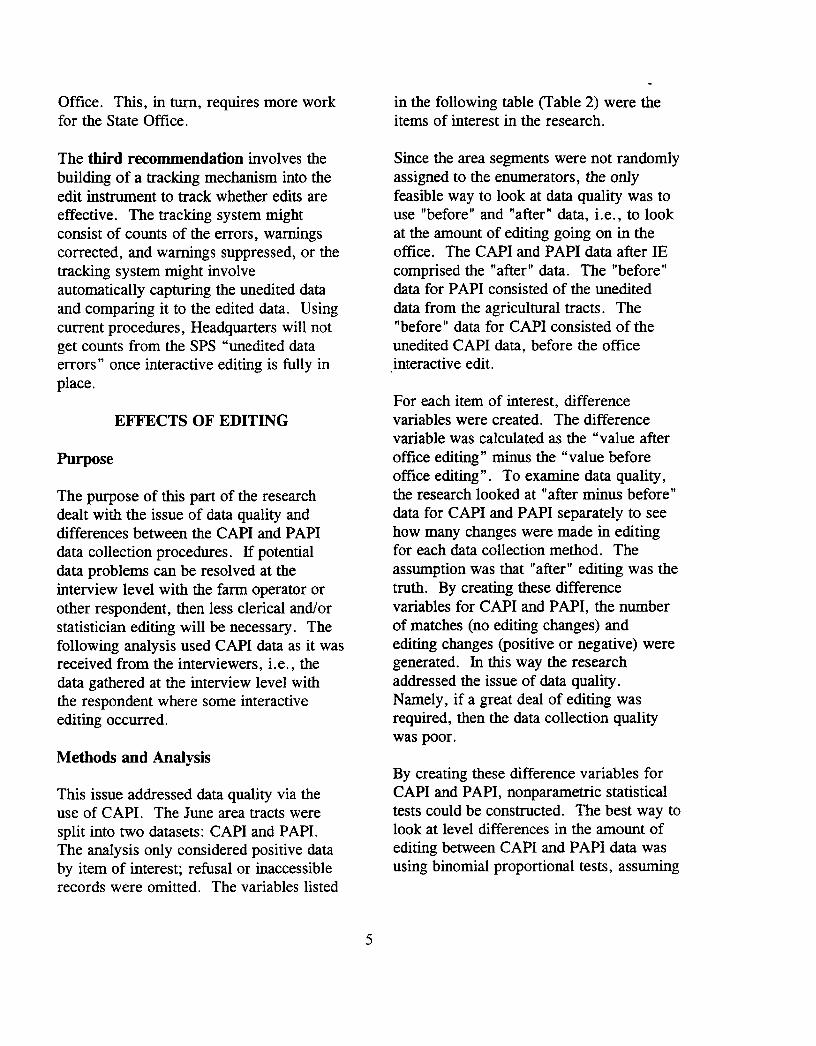
The third recommendation involves thebuilding of a tracking mechanism into theedit instrument to track whether edits areeffective. The tracking system mightconsist of counts of the errors, warningscorrected, and warnings suppressed, or thetracking system might involveautomatically capturing the unedited dataand comparing it to the edited data. Usingcurrent procedures, Headquarters will notget counts from the SPS "unedited dataerrors" once interactive editing is fully inplace.
EFFECTS OF EDITING
Purpose
The purpose of this part of the researchdealt with the issue of data quality anddifferences between the CAPI and PAPIdata collection procedures. If potentialdata problems can be resolved at theinterview level with the farm operator orother respondent, then less clerical and/orstatistician editing will be necessary. Thefollowing analysis used CAPI data as it wasreceived from the interviewers, i.e., thedata gathered at the interview level withthe respondent where some interactiveediting occurred.
Methods and Analysis
This issue addressed data quality via theuse of CAPI. The June area tracts weresplit into two datasets: CAPI and PAPI.The analysis only considered positive databy item of interest; refusal or inaccessiblerecords were omitted. The variables listed
5
in the following table (Table 2) were theitems of interest in the research.
Since the area segments were not randomlyassigned to the enumerators, the onlyfeasible way to look at data quality was touse "before" and "after" data, i.e., to lookat the amount of editing going on in theoffice. The CAPI and PAPI data after IEcomprised the "after" data. The "before"data for PAPI consisted of the unediteddata from the agricultural tracts. The"before" data for CAPI consisted of theunedited CAPI data, before the office,interactive edit.
For each item of interest, differencevariables were created. The differencevariable was calculated as the "value afteroffice editing" minus the "value beforeoffice editing". To examine data quality,the research looked at "after minus before"data for CAPI and PAPI separately to seehow many changes were made in editingfor each data collection method. Theassumption was that "after" editing was thetruth. By creating these differencevariables for CAPI and PAPI, the numberof matches (no editing changes) andediting changes (positive or negative) weregenerated. In this way the researchaddressed the issue of data quality.Namely, if a great deal of editing wasrequired, then the data collection qualitywas poor.
By creating these difference variables forCAPI and PAPI, nonparametric statisticaltests could be constructed. The best way tolook at level differences in the amount ofediting between CAPI and PAPI data wasusing binomial proportional tests, assuming

Table 2: Variables (Items of Interest) From the June Area Survey
Agricultural Tracts Onlv Agricultural Tract<;Non-Overlap for Hogs/Crops
Agricultural TractsNon-Overlap for Cattle/Sheep
Total Tract Acres (1C84O) Total Grain Stocks (1C121 +IC125+IC126) Total Beef Cows (1C351)Total Farm Acres (1C900) Total Tract Hogs (1C200) Total Milk Cows (lC352)Total Waste Acres (1C841) Total Farm Hogs (1C300) Total Cattle/Calves (lC350)
Winter Wheat Planted Acres (1C540) Farrowing Sows (1C326) Cows Expected to Calve (lC361)Winter Wheat Acres Planted for Grain (1C541) Pigs on Hand From Litters (1C327) Total Calf Crop (1C362)
Oats Planted Acres (lC533) Pigs Slaughtered or Moved Off Land (1C328) Total Cattle on Feed (1C652)Oats Acres Planted for Grain (1C534) Slaughter Pigs (lC320) Total Cattle/Calves in Field (lC250)
Corn Planted Acres (lC530) Feeder Pigs Purchased (1C340) Total Sheep on Feed (lC698)Com Planted Acres for Grain (lC531) Total Dead Weaned Pigs (1C355) Total Stock Sheep (1C043)
Soybean Planted Acres (1C600) Total Ewes to Lamb (1C289)Soybeans Following Another Crop (1C602) Total Lambs Born (1C288)
Alfalfa Hay Acres (1C653)Grain Hay Acres (1C656)Other Hay Acres (lC654)
large populations and different variancepopulations. Proportions were constructedfor each item of interest (Table 2) based onthe number of CAPI and PAPI editingchanges. Binomial proportions tests werechosen because the ratio of agriculturaltract interviews collected through PAPI tothose collected through CAPI was roughlythree to one.
The binomial proportions test showed ifthere was any significance in theproportional differences in the amount ofediting between the CAPI and PAPI data.For each item of interest, data qualityreferred to the proportions of edit changesin the CAPI and PAPI data. Thehypothesis tested was the following: CAPIand PAPI approaches to data collectionproduce different quality data, based onproportions. Namely, the test was whetherthe same amount of editing (proportionally)was occurring in the CAPI versus the PAPImode of data collection. The procedure isthoroughly described in Appendix A.
The results of the binomial proportionstests showed the following: Thirty-four
6
variables were tested for significance (fromTable 2), and of those variables, noneshowed significance. Because of the largesample sizes, Z-statistics were constructedat the a =0.05. The total milk cowsvariable (IC352) showed significance buthad a small sample population (n=2) inthe CAPI portion. Thus, the analysesshowed that there were no significantdifferences in the proportional differences,i.e., no significant differences in theproportion of editing changes of the CAPIand PAPI data. Thus, for each of thethirty-four variables, the same amount ofediting was required for both the CAPI andPAPI data collection modes.
Given that the same amount of editing isoccurring in the CAPI and PAPI mode ofdata collection, the research addressedwhether the editing changes were mostlypositive, negative, or both. Specifically,the research focused on whether thestatistician or data editor changed the datarandomly about zero. The sign test formedians was used to test whether themedian of the data was significantlydifferent from zero for each item of interest

and data collection method (CAPIIP API).The sign test does not assume symmetryabout a median.
Distribution-free methods were used in theresearch because the distribution of thedifferences variables were not known.According to Moussa (1991), if theunderlying distribution is unknown, orwhen normal theory assumptions are notmet, nonparametric methods are moreefficient and powerful than their normal-theory counterparts. Moreover, if the truedistribution is normal and one usesnonparametric methods, the loss inefficiency and/or power is usually notsubstantial. The research chosenonparametric methods for these reasons.The sign test procedure is described inAppendix B.
For each variable the editing changes weretested, using the sign test, based upon thenumber of positive or negative departuresfrom zero. The tests were done separatelyfor CAPI and PAPI. Significance wasfound when the editing changes deviatedmore positively than negatively or viceversa. In other words, significance impliedthat the statistician was making someconsistent change.
Table 3 shows the counts andnonparametric statistics of editing changesfor those variables which showedsignificance for either the CAPI or PAPImode of data collection. None of the CAPIvariables were significantly different fromzero, but two of the PAPI variables,namely, total farm acres and soybeansfollowing another crop, showedsignificance at the a =0.010 level. Asshown in the table, the editing changeswere both in the positive and negative
7
direction but not necessarily symmetricwith respect to zero.
Table 4 shows the counts of the magnitudeand direction of the PAPI editing changesin Table 3. The CAPI data are also shown.For PAPI, the total farm acres variable(IC900) was decreased by at least 1()()acresby the statistician in five instances.Similarly, the statistician increased theacreage seven times. Thus, "outliers" (atthe "at least 100 acres" interval) wereevenly distributed. Small changes, i.e.,changes less than or equal to ten acres,were almost always positive. Thestatistician may have increased the farmacreage slightly when the farm operatorlived outside the segment, but the originaldata indicated the tract and farm acres werethe same.
Table 4 also shows no changes in the CAPIdata for soybean acres following anothercrop (IC602), while the PAPI data arereduced by the statistician on everyoccasion. There may have been reportingerrors with double-cropped soybeans in thePAPI mode of data collection. The editingchanges showed that these acres decreasedby at most double to that of soybeanplanted acres (IC600). The enumeratorprobably was adding the double croppedacreage (from IC844) to this item code.
Discussion
CAPI and PAPI data quality were tested bythe number of times the statisticianincreased or decreased the value. Based onthe number of editing changes, both theCAPI and PAPI data collection methodsproved to be reliable data collection tools.
This research supported CAPI data quality

for the 1994 June Agricultural Survey in
Indiana. Since few editing changes weremade to the CAPI data. the analyses
showed that most of the potential dataerrors were eliminated at the face-to-faceinterview level with the respondent.
Table 3: Counts of Editing Changes and Nonparametric Statistics for Those Variables WhichShowed Significance
CAPI Editing Changes PAPI Editing Changes
Counts Total Positive Negative None Total Positive Negative Nonep-Value
Total Farm Acres: 6 5 1 316 32 24 8 1070IC900 0.2188 0.0070'-
Soybeans Following 0 0 0 8 16 0 16 32Another Crop: IC602 ----- 0.0001"
• indicates significance at IX =0.010
Table 4: Counts by Interval of the Magnitude and Direction of the CAPI/ PAPI EditingChanges in Table 3
Counts CAPI PAPI CAPI PAPIby Interval IC900 IC900 IC602 IC602
Acres < -1000 0 3 0 0--500 > Acres > = -1000 0 0 0 0
-100 > Acres> = -500 0 2 0 0
-50 > Acres> = -100 0 2 0 0
-10 > Acres > = -50 0 1 0 14
o > Acres> = - 10 1 0 0 2
o <Acres < = 10 3 13 0 0
10 <Acres < = 50 0 4 0 0
50 <Acres < = 100 0 0 0 0
100 <Acres < = 500 0 5 0 0
500 <Acres < = 1000 2 2 0 0
8

REFERENCES
Ferguson, Dania; Graham, Mitch;Hohenbrink, Rita; Matthews, Wayne;Pierzchala, Mark (organizer); Schuchardt,Rick; Stewart, Roger; and Yost, Mickey(1990), Interactive Editing Research. AReport and Recommendations by theInteractive Editing Working Group, UnitedStates Department of Agriculture, NationalAgricultural Statistics Service.
Granquist, Leopold (1995), Chapter 21 ofBusiness Survey Methods. Improving theTraditional Editing Process, John Wiley &Sons, New York.
Hollander, Myles, and Wolfe, Douglas A.(1973), Nonparametric StatisticalMethods, John Wiley & Sons, New York.
Moussa, Effat A. (1991), ComputerIntegrated Probability and StatisticalMethods for Science and Management: PartII, DePaul University, Chicago.
Mergerson, Jim; Pense, Roberta;Pierzchala, Mark; Romeo, Ann; andSchleusener, Mark (1994), "The 1994June Area Frame Project Experience:Interactive Editing and Computer AssistedPersonal Interviewing" (unpublishedtechnical report), United StatesDepartment of Agriculture, NationalAgricultural Statistics Service.
Federal Committee on StatisticalMethodology and Subcommittee on DataEditing in Federal Statistical Agencies(1990), Data Editing in Federal StatisticalAgencies. Statistical Policy Working Paper18, Statistical Policy Office, Office ofInformation and Regulatory Affairs, Officeof Management and Budget.
9
SAS Institute Inc. (1988), SAS\STATUser's Guide, Release 6.03 Edition.
SAS Institute Inc. (1985), SAS User'sGuide: Basics, Version 5 Edition.
APPENDIX A: THE BINOMIALPROPORTIONS TEST
Suppose that comparisons are made on theproportion of CAPI and PAPI editingchanges. Namely, a random sample of nlitems is drawn from the CAPI populationand YI of them are editing changes.Another random sample of n2 items isdrawn from the PAPI population and Y2ofthem are editing changes. If theassumption is made that the trueproportions of the CAPI and PAPI editingchanges are PI and P2, respectively, then YIand Y2 are binomial distributions withparameters nl and PI and n2 and P2,respectively.
Hypotheses tests are constructed about thevalues of PI and P2 , where PI and P2 aretwo independent proportions of CAPI andPAPI, respectively. Then the nullhypothesis, Ho: PI=P2, is tested against thealternative hypothesis, HI: PI*P2' at a-levelof significance. The best estimators of PIand P2 are Pi' = Yi II1j , for i= 1 and i=2,and each estimator is approximately normalwith parameters Pi and Piq; II1j. Thedifference, PI'-P2', has an approximatenormal distribution with parameters (PI-P2)and (Plql/nl + P2~/nJ. Another way ofwriting the null hypothesis is the following:Ho: PI-P2=0. The variance of (PI'-P2') ispq/nl + pq/n2. To estimate p and q underHo, the two samples are pooled and the teststatistic reduces to the following:

P(p-value) =2:E ( nJ (lJ n is too small,y=o y 2
where y~= min(Y +,YJ. If the sample sizeis large, i.e., n> 10, then the normaldistribution can be used to approximate thenull distribution of the sign test statistic.For the normal distribution, the decisionrule is to reject Ho if the test statistic:
the sample for each item of interest,respectively, and p = P[Xi 2: Me= 0], thenunder He, the distribution of the statisticY+ (or YJ is binomial with parameters nand 1/2• In this research the test statistic isthe smaller of the Y+,s or Y_'s (ormin(Y +,YJ) because there is a two-sidedalternative hypothesis. The decision rule isthen to reject He if the p-value of the teststatistic is too small, i.e., p < 0.05. If thesample size n is small, i.e., the number ofpositive and negative editing changes is lessthan 10, then the binomial distribution canbe used to evaluate the exact p-value of thetest statistic. For the binomial distribution,the decision rule is to reject He if:
y _ no 2
--- is smaller than Za
~
z o
APPENDIX B: THE SIGN TEST FORMEDIANS
and the decision rule is to reject He ifZe > Zl- a/2 or Ze< za/2' The pooled estimatebecomes pi =(Yl + Y2)/(nj +n2).
Given a random sample, Xl' X2, ••• , Xn,
from a distribution, Fx(x), which isunknown but is thought to be continuousand dependent on a location parameter. Inthe research, the hypothesis tests that themedian of the distribution is M =0.Namely, the test is the following: Test thenull hypothesis, He: M=Me=O, against thealternative hypothesis, HI: M*Mo*O, andlet Dj= Xj-Mo=Xj, where i= 1,2, ... n.Under Ho, the distribution of X has medianMo, and hence the differences, Dj, havemedian zero. In other word, if He is true,then the signs of the differences will beequally likely to be positive as negative. Itis expected that the number of positivedifferences should be close to the numberof negative ones.
If Y+ and Y_ represent the positive andnegative differences (positive editingchanges and negative editing changes) in
10