Embed Size (px)
Citation preview
Georgia Southern UniversityDigital Commons@Georgia Southern
University Honors Program Theses
2017
The Effects of Elevated CO2 Levels on Broad Bean,Vicia faba, Growth/Defense TradeoffsHarley B. KitchingGeorgia Southern University
Follow this and additional works at: https://digitalcommons.georgiasouthern.edu/honors-theses
Part of the Biology Commons, and the Plant Biology Commons
This thesis (open access) is brought to you for free and open access by Digital Commons@Georgia Southern. It has been accepted for inclusion inUniversity Honors Program Theses by an authorized administrator of Digital Commons@Georgia Southern. For more information, please [email protected].
Recommended CitationKitching, Harley B., "The Effects of Elevated CO2 Levels on Broad Bean, Vicia faba, Growth/Defense Tradeoffs" (2017). UniversityHonors Program Theses. 227.https://digitalcommons.georgiasouthern.edu/honors-theses/227
The Effects of Elevated CO2 Levels on Broad Bean, Vicia faba,
Growth/Defense Tradeoffs
An Honors Thesis submitted in partial fulfillment of the requirements for Honors in the
Department of Biology.
By
Harley B. Kitching
Under the mentorship of Dr. Edward B. Mondor
ABSTRACT
Atmospheric changes, associated with global climate change, are increasing at an
unprecedented rate. Plants generally display higher rates of growth in response to
elevated CO2 levels, but this response varies among species. In addition, very little is
known about how plant growth/defense tradeoffs will be altered by increasing CO2
levels. By raising Broad bean, Vicia faba L., plants under ambient (400 ppm) and
elevated (900 ppm) levels of CO2, it was shown that atmospheric composition directly
altered plant growth/defense tradeoffs. Plants grown under elevated CO2 had lighter stem
weights but greater numbers of extrafloral nectaries and higher rates of extrafloral nectar
secretion. Thus, plants grown under elevated CO2 invested more in defense (extrafloral
nectaries and extrafloral nectar production) than growth (biomass). These results indicate
that CO2 may act as a stressor for Broad bean plants.
Thesis Mentor:________________________
Dr. Edward B. Mondor
Honors Director:_______________________
Dr. Steven Engel
April 2017
Department of Biology
University Honors Program
Georgia Southern University

2
Acknowledgements
I would like to give a big thank you to Dr. Edward Mondor for helping me
develop and carry out this project. I would also like to thank Spencer Harp for helping
design and build the AtmoSim 2100.
I would like to thank Georgia Southern University Honors Program for the
opportunity to work on this project, and the Honors Program Undergraduate Research
Fund and Department of Biology for funding this project and making my research
possible.
I would also like to thank Georgia Southern University’s Student Government
Association for providing grant opportunities which allowed me to present this research
at multiple conferences and receive some excellent feedback.
Finally, I would like to thank everyone who helped edit and proofread this
document on its way to being published to fulfil my requirements for the Georgia
Southern University Honors Program.
3
Introduction
Climate change has become a hot topic of discussion for journalists and
politicians. Normally, when people reflect on climate change they think of polar bears or
deglaciation (Shakun et al. 2012). There are many other pertinent issues that may come
with climate change that are seldom discussed like floods, droughts, fires, disease
outbreaks, risks to human health, and ecosystem destruction (Singh et al. 2016).
Most scientists believe that climate change is due to an increase of greenhouse
gases like carbon dioxide (CO2) in the atmosphere, due to human industrialization
(Stiling et al. 2013). Since it has been determined that CO2 is a primary greenhouse gas
responsible for climate change, many studies have supported this claim (Konovalov et al.
2016). As CO2 levels have increased by 40% since the industrial revolution (Konovalov
et al. 2016), with 25% of these emissions coming from agricultural practices alone
(Kontopoulou et al. 2014), scientists have started to ask how this greenhouse gas may
alter ecological processes.
There has been widespread support for the concept that plants benefit from
elevated CO2 levels, as evidenced by increased above- and below-ground biomasses as
well increased leaf sizes and numbers (Gray & Brady 2016). As plants flourish in an
elevated CO2 environment, it can be assumed that other species, especially herbivores,
would also benefit due to the increased success of plants. The results may not be all
positive, however. While plants exhibit increased growth in response to elevated CO2
levels, nitrogen concentrations and overall plant quality is often negatively affected
(Stiling et al. 2013). This situation could be even worse for wild plants, that are already
nitrogen-limited (Kontopoulou et al. 2014). Many studies also fail to consider that other
4
factors such as rainfall or extreme heat waves might occur as climates are altered, that
could further harm plant growth (Teixeira et al. 2011).
Plants must rapidly adapt to stressors in a changing environment in order to
survive (Gray & Brady 2016). One plant species that can be used as a model organism
to better understand the effect of changing atmospheric composition on growth is Broad
bean, Vicia faba. Broad beans are nitrogen fixers, used during crop rotations, making
them an interesting subject for biomass studies (Köpke &Nemecek 2009). It has
previously been shown that V. faba seedling emergence and plant growth is altered once
CO2 has permeated the soil (Al-Traboulsi et al. 2012). In addition, V. faba stomata
remain closed for extended periods of time when exposed to high levels of CO2, which
could be a defense mechanism for the plant to maintain homeostasis (Talbott et al. 1996).
Plants must defend themselves to survive and any allocation of resources to
defensive actions usually comes at the expense of plant growth and development, as plant
resources are finite (Huot et al. 2014). Defense in Broad beans is centered around small
glands located near the petiole of leaves called extrafloral nectaries (EFNs). Many plants
have EFNs, though they differ widely in the structures and mechanisms for excreting the
nectar (Avalos et al. 2016). It is believed that EFNs evolved to attract beneficial insects
such as ants that protect the plant from herbivores (Khazaei et al. 2014). Extrafloral
nectary secretions are rich in carbohydrates which contributes to their ability to attract
insects to defend the plant (Lüttge 2013). The sugars in these nectaries are thought to
come from the phloem of the plant making them energetically costly to produce (Lüttge
2013). If a plant experiences a high volume of stress (e.g., increased herbivory), the
amount of nectar produced from EFNs usually increases (Huot et al. 2014).
5
In this study, the effects of elevated CO2 atmospheres on Broad bean, Vicia faba,
growth and defense were assessed. Growth was directly evaluated by measuring traits
such as numbers of leaves and root/shoot weights. Defenses were assessed by counting
the number of EFNs and measuring rates of extrafloral nectar production.
6
Methods
AtmoSim 2100
The AtmoSim 2100 is a modified growth chamber designed and built in
collaboration with Spencer Harp, a laboratory supervisor in Georgia Southern
University’s Mechanical Engineering Department. The AtmoSim 2100 consists of eight,
20-gallon aquaria arranged in two rows using a metal frame to create four upper-level and
four lower-level chambers. Aquaria are accessed through a clear Plexiglas sheet covering
the tops of the chambers. A fuzzy logic, computer-controlled Sentinel Analyzer regulates
the CO2 levels, from a large CO2 tank, that is allowed to flow into each chamber. The
Sentinel Analyzer (Model CHHC-4, Sentinel Global Products Solutions Inc., Santa Rosa,
CA 95403) also monitors other abiotic factors such as temperature and humidity. Above
each group of four chambers are two 125-watt Hydrofarm (Hydrofarm, Medley, FL
33178) grow lights. Before the initial trial, the AtmoSim 2100 was calibrated to ensure
accurate CO2 concentrations in each chamber. The upper-level chambers were set at 400
ppm CO2 (ambient) while the lower-level chambers were set at 900 ppm CO2 (elevated)
(Figure 1). Temperature, humidity, and CO2 levels were all monitored using the Sentinel
Analyzers. The minimum and maximum reading for all three variables were recorded
weekly, throughout the duration of this experiment.
Experimental Design
For each of two trials, two Broad bean, Vicia faba, plants were grown in each
chamber for a total of sixteen plants. One seed was placed in each pot, and one pot was
placed in the front and the other in the back of each chamber. The plants were watered
7
every other day. Plant traits were assessed three times. The first assessment occurred on
the second week of growth for trial one and on the third week of growth for trial two. The
second assessment was conducted three days after the first measurements. The final
assessment was taken after three weeks of growth for trial one and after four weeks of
growth for trial two.
For each assessment, height (cm), numbers of immature leaves, number of fully
developed leaves, number of extrafloral nectaries, and amount of nectar produced (mm)
were recorded. Nectar production was measured using microcapillary tubes (Drummond
Scientific Co, Broomall, PA 19008) and a ruler, and subsequently converted to volumes
(µl). The third, and final, assessment also included a harvest. At harvest, roots and stems
were separated using scissors at the soil line. The roots and stems were dried for at least
72 hours in a 60C drying oven and weighed, in grams, using a scale (Acculab Vicon
Digital Scales, Brooklyn, NY 11234).
Statistical Analysis
Temperature, humidity, and CO2 levels in ambient (control) vs. elevated
(treatment) conditions were evaluated using independent sample t-tests.
Plant height, number of immature leaves, and number of fully developed leaves in
response to differing CO2 levels were independently analyzed with nested repeated
measures analysis of covariance. In each analysis, the independent variables were:
treatment (ambient vs. elevated), chamber nested within treatment, and position in
chamber (front vs. back). Trial (1 vs. 2) was entered as a covariate. The repeated
measure was: time (measurement 1 vs. 2 vs. 3). All first order interactions, with time,
8
were also evaluated in the analysis: time*treatment, time*chamber [treatment],
time*position in chamber, and time*trial.
Extrafloral nectary numbers and extrafloral nectar volumes were independently
analyzed with nested analyses of covariance. In both analyses, the independent variables
were: treatment (ambient vs. elevated), chamber nested within treatment, and position in
chamber (front vs. back). Plant height, number of immature leaves, number of fully
developed leaves, and trial (1 vs. 2) were all entered as covariates.
Finally, stem weights and root weights were independently analyzed with nested
analyses of covariance. In both analyses, the independent variables were: treatment
(ambient vs. elevated), chamber nested within treatment, and position in chamber (front
vs. back). Plant height, number of immature leaves, number of fully developed leaves,
and trial (1 vs. 2) were all entered as covariates.
All analyses were conducted using JMP Pro 12.1.0 (SAS Institute Inc. 2015).
9
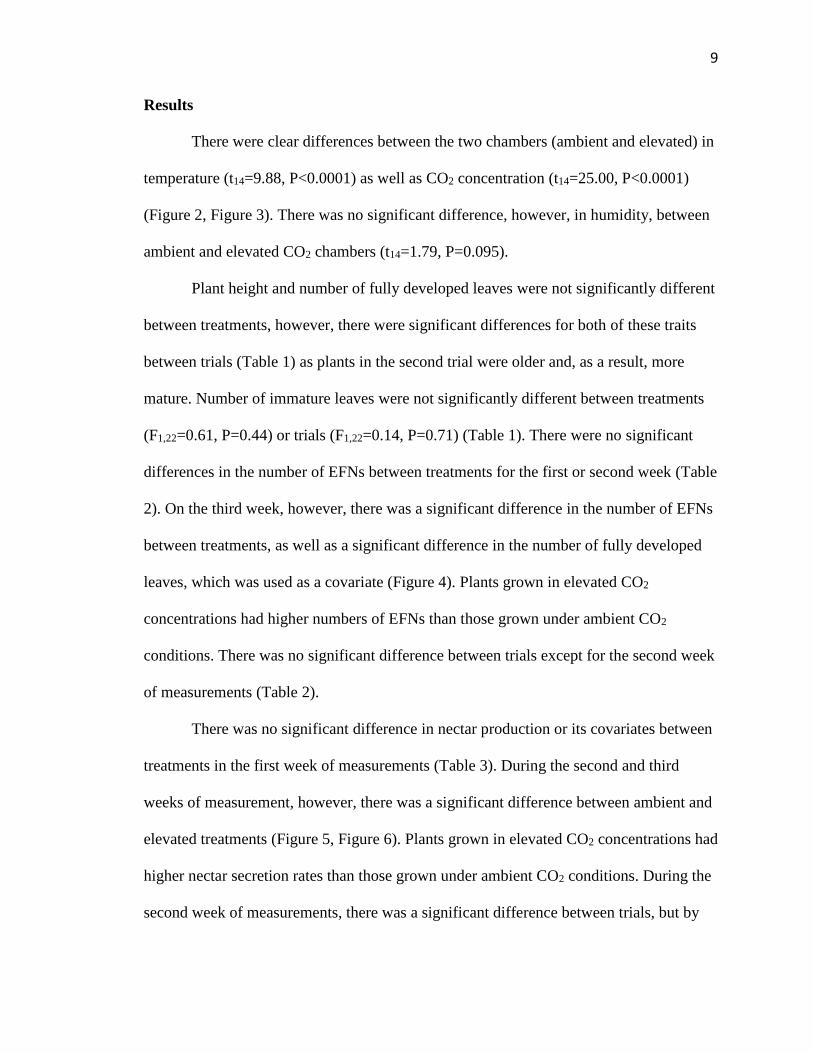
Results
There were clear differences between the two chambers (ambient and elevated) in
temperature (t14=9.88, P<0.0001) as well as CO2 concentration (t14=25.00, P<0.0001)
(Figure 2, Figure 3). There was no significant difference, however, in humidity, between
ambient and elevated CO2 chambers (t14=1.79, P=0.095).
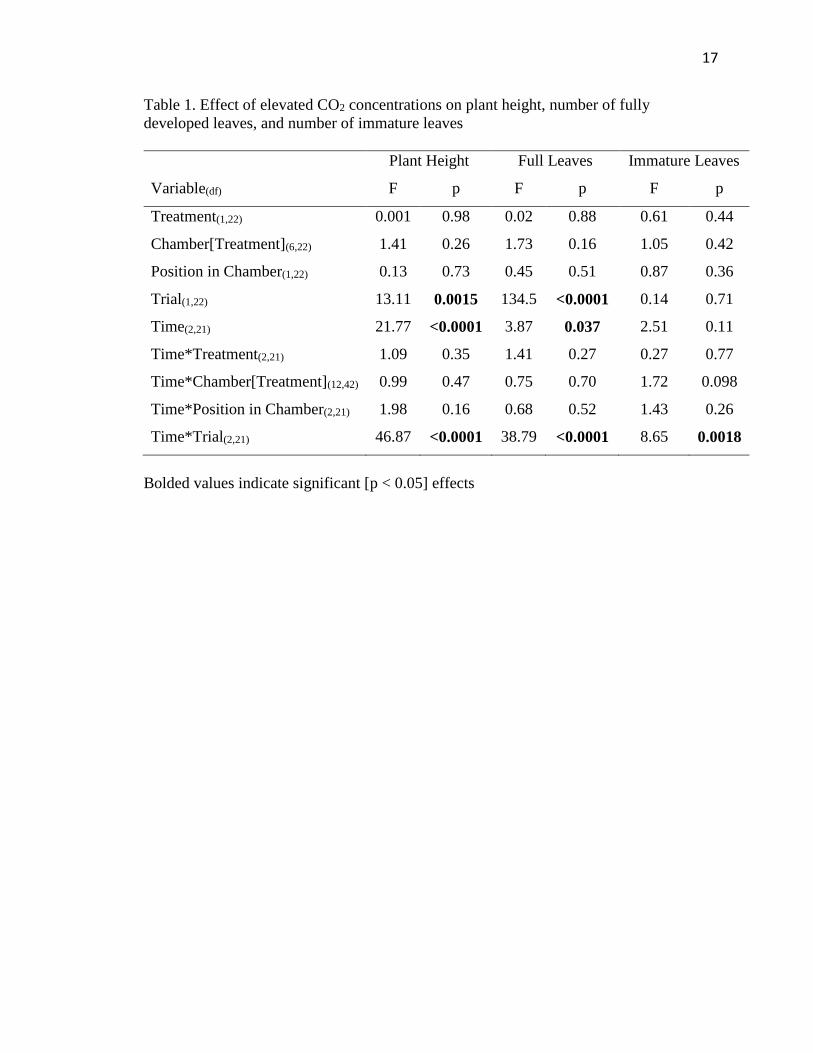
Plant height and number of fully developed leaves were not significantly different
between treatments, however, there were significant differences for both of these traits
between trials (Table 1) as plants in the second trial were older and, as a result, more
mature. Number of immature leaves were not significantly different between treatments
(F1,22=0.61, P=0.44) or trials (F1,22=0.14, P=0.71) (Table 1). There were no significant
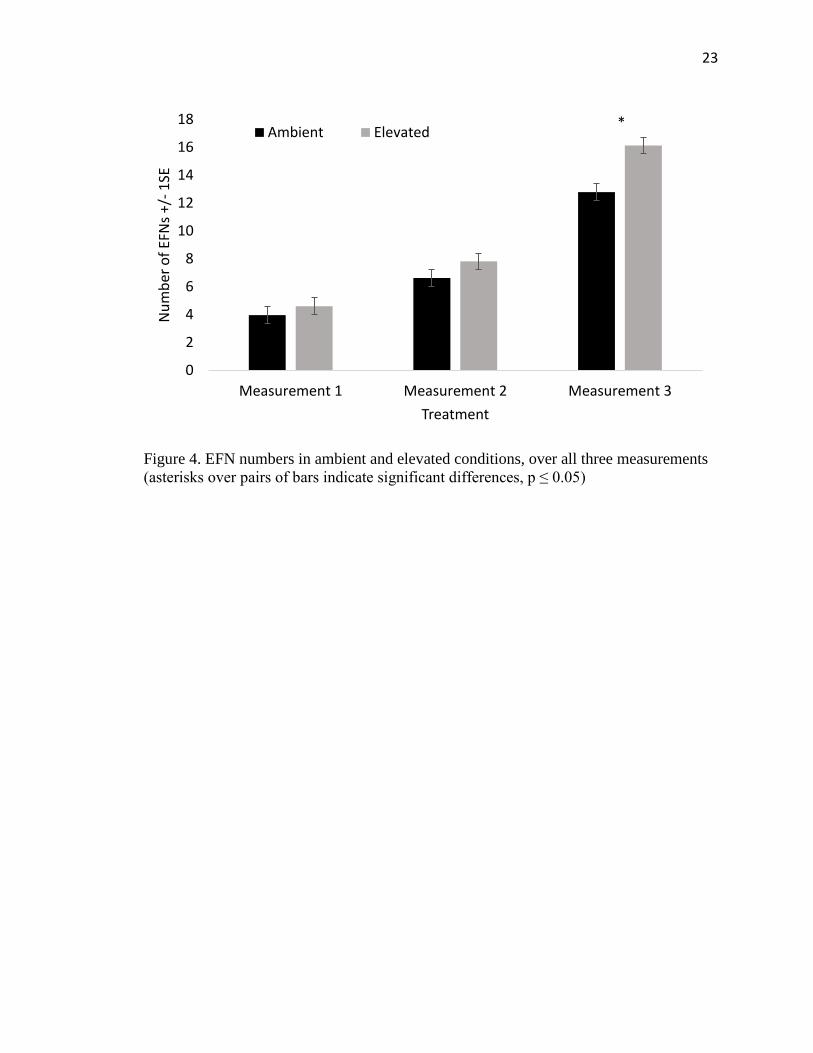
differences in the number of EFNs between treatments for the first or second week (Table
2). On the third week, however, there was a significant difference in the number of EFNs
between treatments, as well as a significant difference in the number of fully developed
leaves, which was used as a covariate (Figure 4). Plants grown in elevated CO2
concentrations had higher numbers of EFNs than those grown under ambient CO2
conditions. There was no significant difference between trials except for the second week
of measurements (Table 2).
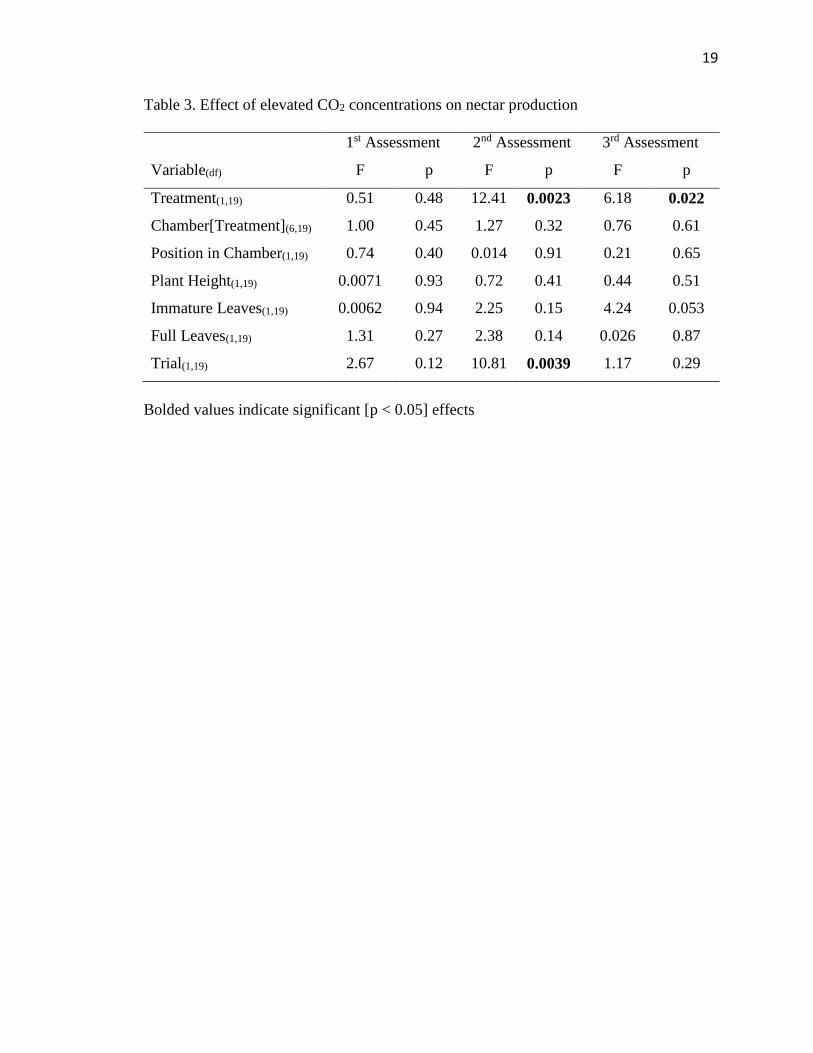
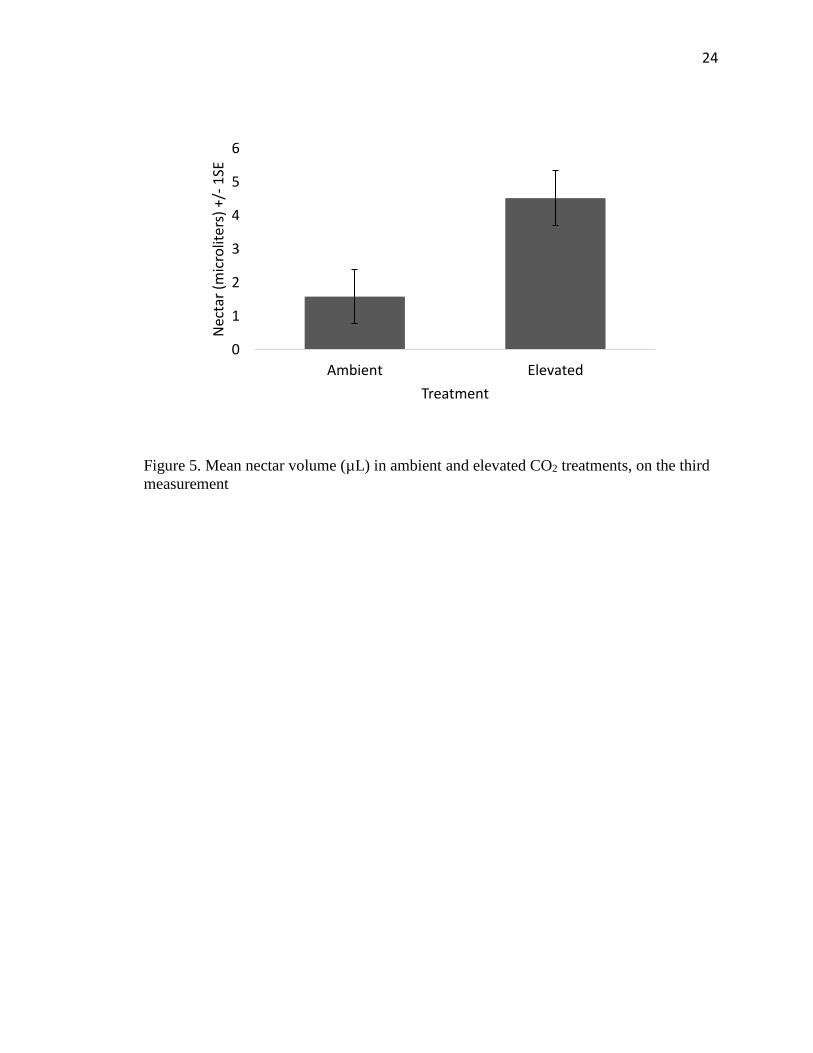
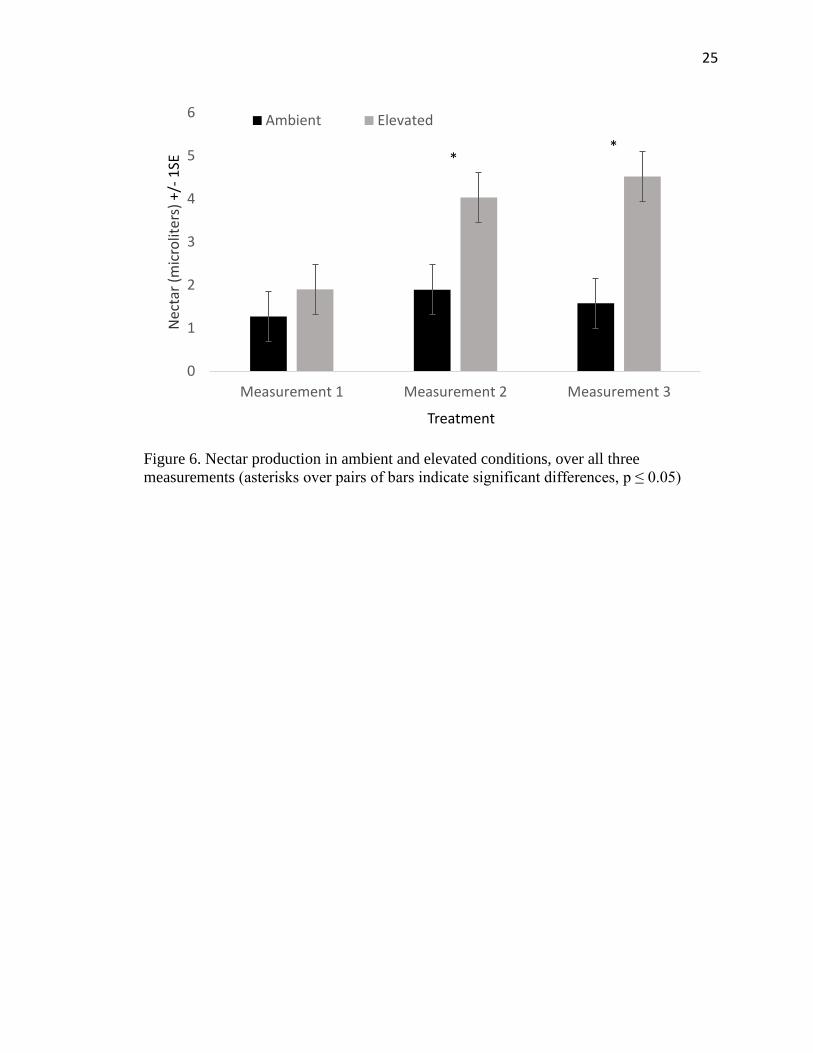
There was no significant difference in nectar production or its covariates between
treatments in the first week of measurements (Table 3). During the second and third
weeks of measurement, however, there was a significant difference between ambient and
elevated treatments (Figure 5, Figure 6). Plants grown in elevated CO2 concentrations had
higher nectar secretion rates than those grown under ambient CO2 conditions. During the
second week of measurements, there was a significant difference between trials, but by
10
the third week of measurements no significant difference between trials was present
(Table 3).
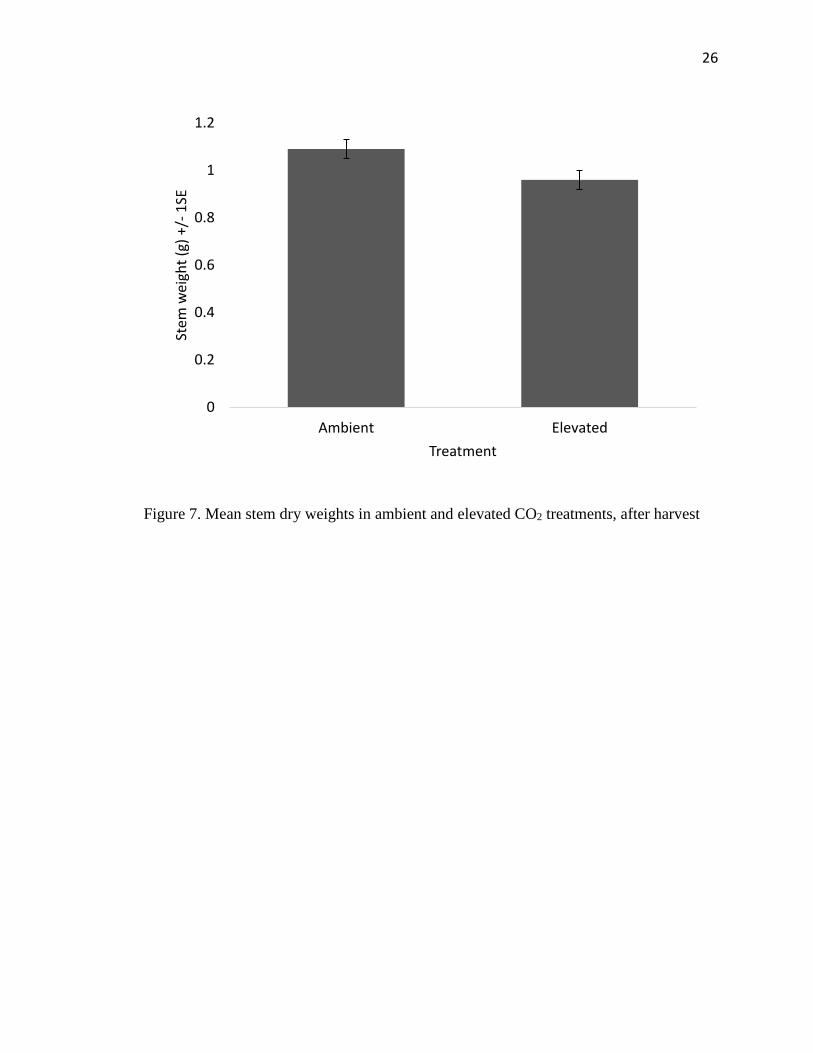
Stems had significantly less biomass in the elevated CO2 chambers than the
ambient chambers (F1,22=4.69, P=0.041) and also differed between trials (F1,22=109.36,
P<0.0001) and chambers (F1,22=4.37, P=0.0047) (Figure 7). When roots were weighed,
they differed significantly between trials (F1,22=13.35, P=0.0014) and between chambers
(F1,22=3.49, P=0.014). There was no significant difference between treatments for root
biomass (F1,22=0.98, P=0.33).
11
Discussion
The objective of this project was to better understand how increasing CO2 levels,
associated with global climate change, alters plant growth/defense tradeoffs. Using
Broad bean plants as a model system, it was discovered that CO2 concentrations, such as
those that are anticipated to occur in the year 2100, directly altered both plant growth and
defense. Plants grown under elevated CO2 had lower biomass (decreased stem weights)
but increased defensive capabilities (more EFNs and higher extrafloral nectar secretion
rates).
There was no difference in plant traits such as plant height, number of immature
leaves, and number of fully developed leaves when plants were grown under ambient or
elevated CO2, suggesting that Broad bean plants grown under elevated CO2 don’t use the
extra CO2 for growth. The stem biomass results further support this conclusion. Previous
studies have shown that plants, such as soybeans, in ambient CO2 produce larger stem
biomass than plants under elevated CO2 conditions (Gray & Brady 2016). If plants grown
under elevated CO2 conditions don’t incorporate additional CO2 into plant tissue, it is
possible that additional resources may be incorporated and expressed through defensive
traits.
Several studies have examined plant-insect interactions in response to elevated
CO2. Increased plant defenses are believed to be due to hormonal cues during
photosynthesis rather than in response to herbivore damage (Zavala et al. 2016).
Herbivores, however, are generally attracted to plants with a higher carbon content
making the plants more susceptible to herbivory (Zavala et al. 2016, Stiling et al. 2013).
12
Poor plant quality, as shown here in Broad bean, may result in slower herbivore growth,
putting herbivores at increased risk of predation and parasitism (Stiling et al. 2013).
A decrease in plant quality could also have large affects on agricultural yields.
Many studies have examined the relationship between elevated CO2 and agricultural
yields, mostly in rice crops. One study revealed that there was no significant difference in
rice yields in response to elevated CO2 alone, but when elevated CO2 was combined with
an increase in temperature, there was a significantly lower yield (Figueiredo et al. 2014).
Even more problematic, it is being discovered in crops like soybean that, when exposed
to elevated levels of CO2, previous genetic modifications to the plants are being rendered
less effective (Ziska 2010). Many soybean cultivars have been genetically modified to be
Roundup ready; as the plants adapt to their changing environment, this modification has
become less effective thereby creating a cultivation problem (Ziska 2010). As CO2 levels
continue to rise, similar unexpected problems are likely to arise thereby creating
challenges for our global food supply.
When looking at trends in the expression of defensive traits, it appears that plants
are putting additional energy into their defensive mechanisms under elevated CO2 (Lüttge
2013). In the experiment presented here, there was a lack of treatment differences during
the first week for both EFNs and nectar. There was also no difference between trials,
further suggesting that early in development plants use the majority of their resources for
growth. As the plants develop, defense mechanisms such as nectar production are up-
regulated. While an increase of EFNs wasn’t seen in the second week, plants were clearly
stressed, based on the up-regulated nectar production from existing nectaries. By the final
13
measure, both EFN numbers and nectar levels had significantly increased under elevated
CO2 conditions.
In conclusion, Broad bean plants grown under elevated CO2 invested more in
defense (EFN numbers and extrafloral nectar production) than growth (biomass). With
ever-increasing levels of CO2 in the atmosphere, associated with global climate change,
this greenhouse gas could have far-reaching effects on ecosystem dynamics. If policies
are not swiftly implemented to ameliorate this global crisis, our food security could be
threatened.
14
References
Al-Traboulsi, M., Sjögersten, S., Colls, J., Steven, M., Black, C. (2012) Potential impact
of CO2 leakage from carbon capture and storage systems on field bean (Vicia
faba). Physiologia Plantarum, 146: 261-271.
Avalos, A. A., Lattar, E. C., Galati, B. G., Ferrucci, M. S. (2016) Nectary structure and
ultrastructure in two floral morphs of Koelreuteria elegans subsp. formosana
(Sapindaceae). Flora, 226: 29-37.
Figueiredo, N., Carranca, C., Trindade, H., Pereira, J., Goufo, P., Coutinho, J., Marques,
P., Maricato, R., Varennes, A. (2014) Elevated carbon dioxide and temperature
effects on rice yield, leaf greenness, and phenological stages duration. Paddy and
Water Environment, 13: 313-324.
Gray, S. B., Brady, S. M. (2016) Plant developmental responses to climate change.
Developmental Biology, 419: 64-77.
Huot, B., Yao, J., Montgomery, B. L., He, S. Y. (2014) Growth-defense tradeoffs in
plants: A balancing act to optimize fitness. Molecular Plant, 7: 1267-1287.
Khazaei, H., O’Sullivan, D. M., Sillanpää, M. J., Stoddard, F. L. (2014) Genetic analysis
reveals a novel locus in Vicia faba decoupling pigmentation in the flower from
that in the extra-floral nectaries. Molecular Breeding, 34: 1507-1513.
15
Konovalov, I. B., Berezin, E. V., Ciais, P., Broquet, G., Zhuravlev, R. V., Janssens-
Maenhout, G. (2016) Estimation of fossil-fuel CO2 emissions using satellite
measurements of “proxy” species. Atmospheric Chemistry and Physics, 16:
13509-13540.
Kontopoulou, C. K., Bilalis, D., Pappa, V. A., Rees, R. M., Savvas, D. (2014) Effects of
organic farming practices and salinity on yield and greenhouse gas emissions
from a common bean crop. Scientia Horticulturae, 183: 48-57.
Köpke, U., Nemecek, T. (2009) Ecological services of faba bean. Field Crops Research,
115: 217-233.
Lüttge, U. (2013) Green nectaries: The role of photosynthesis in secretion. Botanical
Journal of the Linnean Society, 173: 1-11.
SAS Institute Inc. (2015). JMP® Version 12.1.0. SAS Institute Inc., Cary, NC.
Shakun, J. D., Clark, P. U., He, F., Marcott, S. A., Mix, A. C., Liu, Z., Otto-Bliesner, B.,
Schmittner, A., Bard, E. (2012) Global warming preceded by increasing carbon
dioxide concentrations during the last deglaciation. Nature, 484: 49-55.
16
Singh, M., Poonia, M. K., Kumhar, B. L. (2016) Climate change: Impact, adaptation and
mitigation: A review. Agricultural Reviews, 38: 67-71.
Stiling, P., Moon, D., Rossi, A., Forkner, R., Hungate, B.A., Day, F.P., Schroeder, R.E.,
Drake, B. (2013) Direct and legacy effects of long-term elevated CO2 on fine root
growth and plant-insect interactions. New Phytologist, 200: 788-795.
Talbott, L. D., Srivastava, A., Zeiger, E. (1996) Stomata from growth-chamber-grown
Vicia faba have an enhanced sensitivity to CO2. Plant, Cell and Environment, 19:
1188-1194.
Teixeira, E. I., Fischer, G., Velthuizen, H. V., Walter, C., Ewert, F. (2011) Global hot-
spots of heat stress on agricultural crops due to climate change. Agricultural and
Forest Meteorology, 170: 206-215.
Zavala, J. A., Gog, L., Giacometti, R. (2016) Anthropogenic increase in carbon dioxide
modifies plant-insect interactions. Annals of Applied Biology, 170: 68-77.
Ziska, L. H. (2010) Elevated carbon dioxide alters chemical management of Canada
thistle in no-till soybean. Field Crops Research, 119: 299-303.
17
Table 1. Effect of elevated CO2 concentrations on plant height, number of fully
developed leaves, and number of immature leaves
Variable(df)
Plant Height Full Leaves Immature Leaves
F p F p F p
Treatment(1,22) 0.001 0.98 0.02 0.88 0.61 0.44
Chamber[Treatment](6,22) 1.41 0.26 1.73 0.16 1.05 0.42
Position in Chamber(1,22) 0.13 0.73 0.45 0.51 0.87 0.36
Trial(1,22) 13.11 0.0015 134.5 <0.0001 0.14 0.71
Time(2,21) 21.77 <0.0001 3.87 0.037 2.51 0.11
Time*Treatment(2,21) 1.09 0.35 1.41 0.27 0.27 0.77
Time*Chamber[Treatment](12,42) 0.99 0.47 0.75 0.70 1.72 0.098
Time*Position in Chamber(2,21) 1.98 0.16 0.68 0.52 1.43 0.26
Time*Trial(2,21) 46.87 <0.0001 38.79 <0.0001 8.65 0.0018
Bolded values indicate significant [p < 0.05] effects

18
Table 2. Effect of elevated CO2 concentrations on extrafloral nectary numbers
Variable(df)
1st Assessment 2nd Assessment 3rd Assessment
F p F p F p
Treatment(1,19) 0.50 0.49 3.01 0.099 8.40 0.0092
Chamber[Treatment](6,19) 0.51 0.79 1.04 0.43 1.73 0.17
Position in Chamber(1,19) 0.75 0.40 1.05 0.32 0.023 0.88
Plant Height(1,19) 0.50 0.49 2.77 0.11 0.74 0.40
Immature Leaves(1,19) 0.49 0.49 0.026 0.87 0.35 0.56
Full Leaves(1,19) 0.0022 0.96 0.68 0.42 11.09 0.0035
Trial(1,19) 3.26 0.087 5.17 0.035 0.92 0.35
Bolded values indicate significant [p < 0.05] effects
19
Table 3. Effect of elevated CO2 concentrations on nectar production
Variable(df)
1st Assessment 2nd Assessment 3rd Assessment
F p F p F p
Treatment(1,19) 0.51 0.48 12.41 0.0023 6.18 0.022
Chamber[Treatment](6,19) 1.00 0.45 1.27 0.32 0.76 0.61
Position in Chamber(1,19) 0.74 0.40 0.014 0.91 0.21 0.65
Plant Height(1,19) 0.0071 0.93 0.72 0.41 0.44 0.51
Immature Leaves(1,19) 0.0062 0.94 2.25 0.15 4.24 0.053
Full Leaves(1,19) 1.31 0.27 2.38 0.14 0.026 0.87
Trial(1,19) 2.67 0.12 10.81 0.0039 1.17 0.29
Bolded values indicate significant [p < 0.05] effects
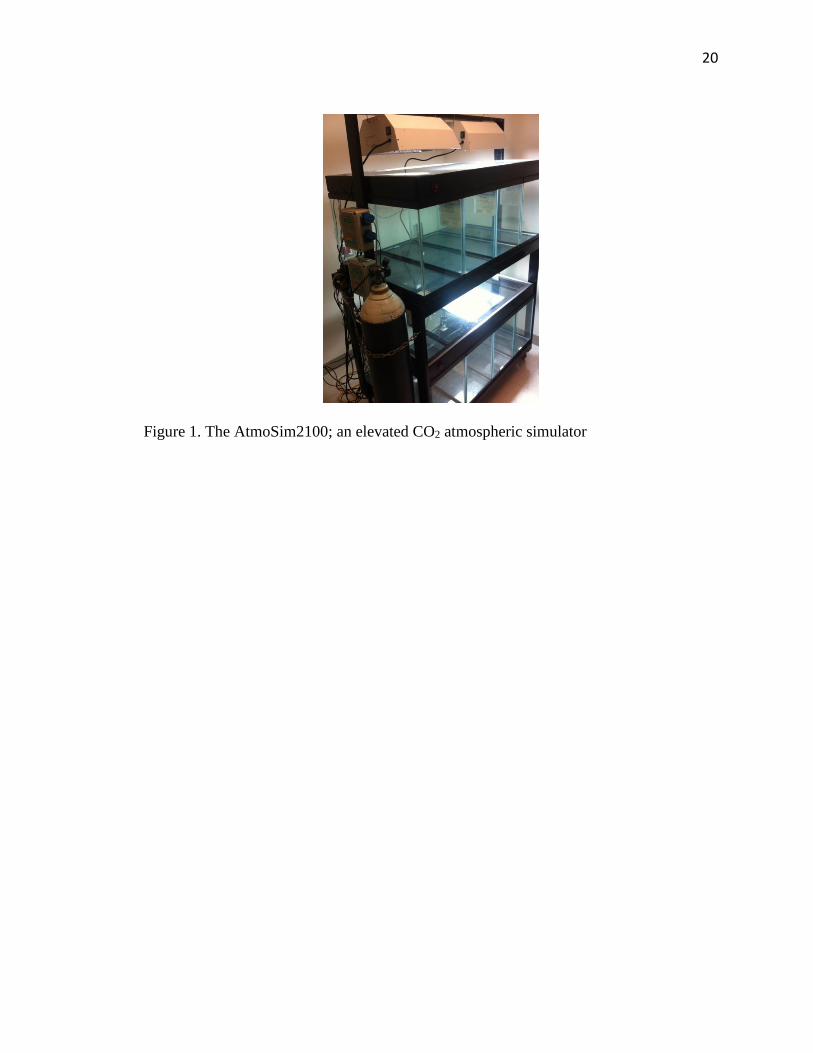
20
Figure 1. The AtmoSim2100; an elevated CO2 atmospheric simulator
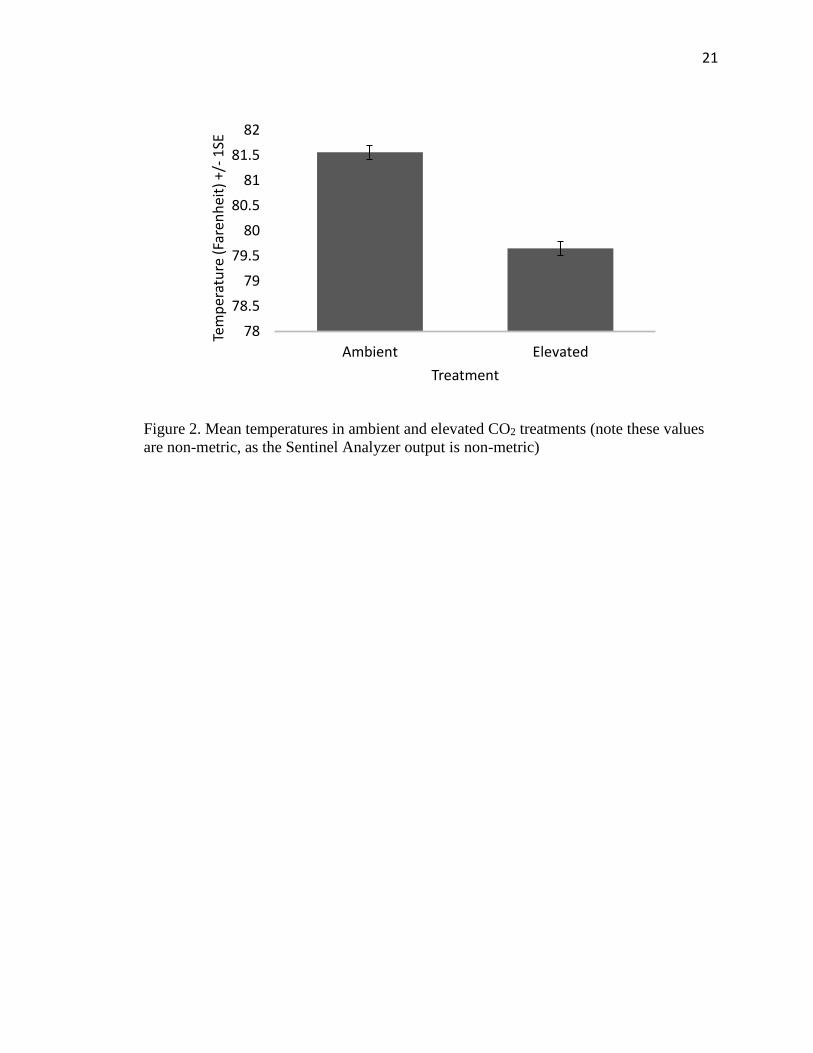
21
Figure 2. Mean temperatures in ambient and elevated CO2 treatments (note these values
are non-metric, as the Sentinel Analyzer output is non-metric)
78
78.5
79
79.5
80
80.5
81
81.5
82
Ambient Elevated
Tem
per
atu
re (
Fare
nh
eit)
+/-
1SE
Treatment
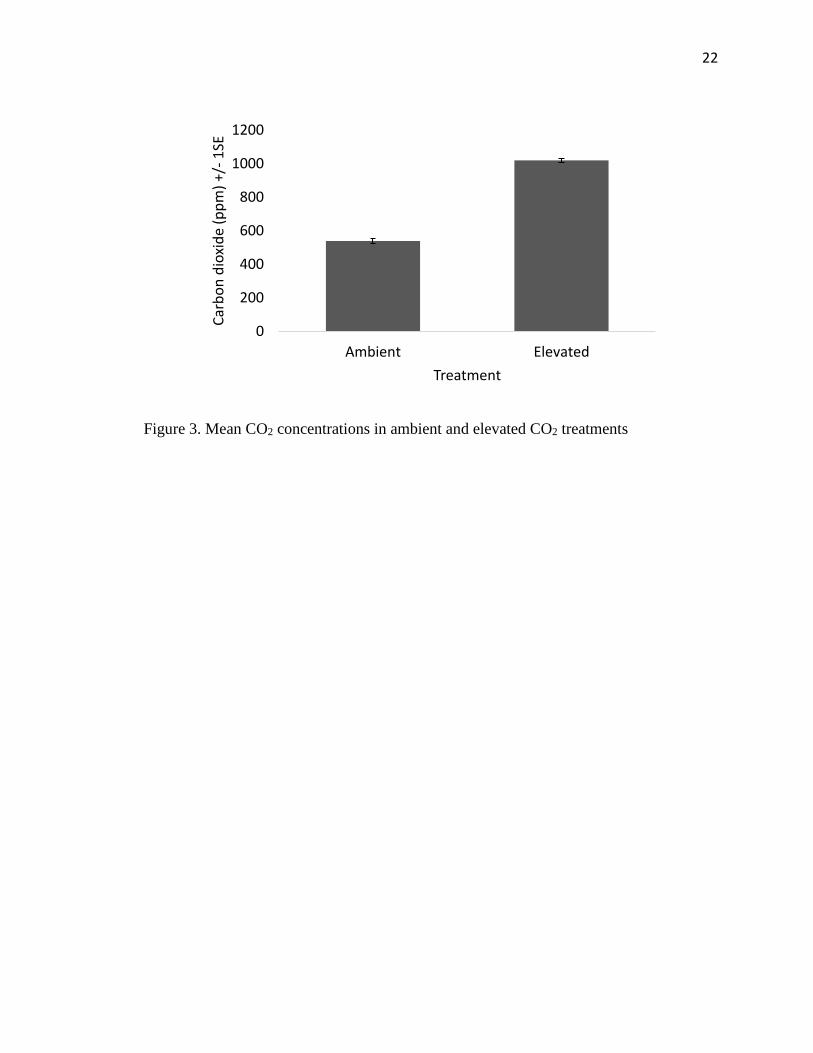
22
Figure 3. Mean CO2 concentrations in ambient and elevated CO2 treatments
0
200
400
600
800
1000
1200
Ambient Elevated
Car
bo
n d
ioxi
de
(pp
m)
+/-
1SE
Treatment
23
Figure 4. EFN numbers in ambient and elevated conditions, over all three measurements
(asterisks over pairs of bars indicate significant differences, p ≤ 0.05)
0
2
4
6
8
10
12
14
16
18
Measurement 1 Measurement 2 Measurement 3
Nu
mb
er o
f EF
Ns
+/-
1SE
Treatment
Ambient Elevated*
24
Figure 5. Mean nectar volume (µL) in ambient and elevated CO2 treatments, on the third
measurement
0
1
2
3
4
5
6
Ambient Elevated
Nec
tar
(mic
rolit
ers)
+/-
1SE
Treatment
25
Figure 6. Nectar production in ambient and elevated conditions, over all three
measurements (asterisks over pairs of bars indicate significant differences, p ≤ 0.05)
0
1
2
3
4
5
6
Measurement 1 Measurement 2 Measurement 3
Nec
tar
(mic
rolit
ers)
+/-
1SE
Treatment
Ambient Elevated
* *
26
Figure 7. Mean stem dry weights in ambient and elevated CO2 treatments, after harvest
0
0.2
0.4
0.6
0.8
1
1.2
Ambient Elevated
Stem
wei
ght
(g)
+/-
1SE
Treatment