Embed Size (px)
Citation preview
TheEffectsofFamilyIncome,ParentalEducationandOtherBackgroundFactorsonAccesstoPost‐SecondaryEducationinCanadaRossFinnieRichardMuellerMESA2008‐2
CanadianEducationProject|Queen’sUniversitySchoolofPolicyStudies|CanadaMillenniumScholarshipFoundationEducationalPolicyInstitute|HigherEducationStrategyAssociates
Toronto,Ontario,Canada‐June2008 www.mesa‐project.org
MESAMEASURINGTHEEFFECTIVENESSOFSTUDENTAID
TheMESAProjectTheMeasuring the Effectiveness of Stu‐
dent Aid Project, or theMESA Project, is afouryearresearcheffortbeingconductedbythe Canadian Education Project and theSchool for Policy Studies atQueen'sUniver‐sity on behalf of the Canada MillenniumScholarshipFoundation.Ithas beendesignedtoanswerthefollowingfourquestions:
• After graduating fromhighschool, teen‐agers coming from low‐income back‐grounds face a choice astoattendcollegeor university, or not. For thosewhodidattend, how do they compare to thosewhodidnot?
• Does providing more funding in a stu‐dent’s firstfewyears offurthereducationattract more low‐income students topost‐secondaryeducation?
• Does providing more funding in a stu‐dent’s firstfewyears offurthereducationmake it more likely for low‐incomestu‐dentstostayinandgraduate?
• Arelow‐incomestudents differentacrossCanada?This paper is partof aseries ofresearch
papers solicited from some of the leadingCanadianresearchersinthefieldofpost‐sec‐ondary education; the researchers wereasked to write about issues of access andpersistence in post‐secondary education inCanada. The requirements for the paperswerethattheresearchersuse oneofseveralcurrently‐existingStatistics Canadadatabasesor another source ofCanadiandata.Eachofthepaperscommissionedduringthisprojectis available for downloading from the MESAProjectwebsiteatwww.mesa‐project.org.
Thefindings andconclusions expressedinthis paper are those of the authors anddonotnecessarily representthoseoftheMESAProjectoritspartners.
ThePartnersTheEducationPolicyInstituteisaninter‐
national, non‐profit think tank dedicated tothe study of educational opportunity. Ourmissionis toprovidehigh‐level researchandanalysisto support policymakers andpracti‐tionersandexpandeducational opportunityto all students. EPI handles overall projectmanagementandco‐ordination,dataprivacy& cleaning, and integration of the final re‐s u l t s a t t h e e nd o f t h e p ro j e c t .www.educationalpolicy.org
TheCanadian EducationProjectprovidesresearch andevaluationexpertise in experi‐mental, quantitative, qualitative and mixedmethodsresearchapproaches.Thecompanyhas experienceworkingwitha broadrange ofstakeholders including governments (at thefederalandprovincial levels), secondary andpost‐secondary educational institutions, ele‐mentary and secondary school boards, stu‐dent g roups , non ‐p ro f i t and non ‐governmental organizations andother stake‐holders in the education and public policyarena in Canada and internationally. Whilemuchofourworktodate dealswithstudentsandyouthatthepost‐secondarylevel,weareincreasingly engaging inresearchat the ele‐mentaryandsecondarylevels as well as look‐ingatstudentmobilitythroughlifelonglearn‐ing and transitions between K‐12 and post‐secondaryeducation.www.canedproject.ca
EffectsofUniversityCharacteristicsandAcademicRegulationsonStudentPersistence,DegreeCompletion, andTimetoDegreeCompletion
TheSchoolof Policy Studiesat Queen'sUniversity(www.queensu.ca/sps)is a leadingcentreforadvancededucation, research,de‐bateand interactionwiththenon‐academicworld in the fields of public administrationandindustrial relations.Continuingthelong‐standing commitment of Queen's Universitytoexcellenceintheseareas,theyare trainingthe next generation of leaders for life in aglobal age.Theirmaster's programs linkthe‐ory with practice to provide students withfundamental knowledge of the economic,political, social and technological changesthatare transformingthewaywe liveandtheway we work. Students enhancetheir com‐municationandresearchskills,andgainnewskills in management, policy analysis, eco‐nomics and quantitative methods. Theirgraduatesare well preparedtocontributetopolicy‐making,humanresourcemanagementandindustrial relations ina varietyofpublic,private and nonprofit organizations. TheSchool for Policy Studies manages the Re‐searchReviewCommittee for theMESAPro‐ject, which is responsible for funding con‐tributory researchprojects thathighlight im‐portantpolicyareasofinterest.
The Canada Millennium ScholarshipFoundation isa private, independentorgani‐zation created by an act of Parliament in1998. It encourages Canadian students tostrive for excellenceand pursue their post‐secondary studies. The Foundation distrib‐utes$325millionintheformofbursariesandscholarships each year throughout Canada.Its objectivesaretoimproveaccess topost‐secondaryeducationforallCanadians,espe‐cially those facing economic or social barri‐ers; to encourage a high level of studentachievement and engagement in Canadian
society; andtobuild a national alliance oforganizations and individuals around asharedpost‐secondary agenda. TheFounda‐tionis fundingtheMESAProjectoverall,andhas negotiatedaccess toits studentadminis‐trative lists witheachoftheprovincesontheproject'sbehalf.
www.millenniumscholarships.ca
iiEffectsofUniversityCharacteristicsandAcademicRegulationsonStudentPersistence,DegreeCompletion,andTimetoDegreeCompletion
AbstractThis paper exploitstheunprecedentedrich information avail‐able intheCanadianYouthinTransitionSurvey,SampleA(YITS‐A) to investigate issues related to access to post‐secondaryeducation(PSE).Thequestionsweaskarebasically two‐fold:i)Whatare thevariousinfluencesonaccess toPSEofanindivid‐ual’s background, includingmoretraditional measures suchasfamily incomeandparental education, as wellas a broadersetofmeasures suchas highschool grades, social/academic “en‐gagement,” and other cognitive and behavioural influences?andii)Howdoesincludingsucha moreextensivesetofvari‐ables thanhas beenpossibleinpreviousstudieschange theestimatedeffects ofthemoreconventionallymeasuredfamily/parental influences(family incomeandparental education)onaccess toPSE,andthus indicatehowmuchofthelatter influ‐encesoperatethrough(or otherwiseproxy)theeffects ofthebroader set ofvariables, thereby isolating the direct – as op‐posedtoindirect–influence ofthesetraditional measures onaccess?Utilizingmultinomial logitmodels tocapture the choiceof level ofPSE(i.e., collegeversus university)we findthat pa‐rental income is positively related to university attendance,whilehavingonly aminoreffect oncollege,but this effect isgreatly diminishedonce parental education is includedintheestimation. Similarly, theimportance ofparental educationtouniversity attendance is somewhat diminished once certainmeasuresofhighschool grades,academic“engagement,”andastandardisedreadingtestscoreareincluded–although,inter‐estingly,theseadditional variables have little furtheraffect onthefamily incomeinfluences.Theseresults thussupportotherrecentworkwhichpointstotheimportanceofaddressingear‐lier cognitiveandbehaviouralinfluences, andfamily “culture”moregenerallyas capturedbyparental education,ineffectingchangein theratesandpatternsofparticipationin PSE – al‐thoughfamily incomedoes remain a significant independentfactor,albeitofsignificantlyreducedinfluence.
Ross Finnie is a professor at the University of Ottawa([email protected])RichardE.Muelleris aprofessorattheUniversityofLethbridge([email protected])
EffectsofUniversityCharacteristicsandAcademicRegulationsonStudentPersistence,DegreeCompletion, andTimetoDegreeCompletion
TableofContents................................................................................................................Introduction 1
..............................................................................................................TheLiterature 3
..............................................................................................................Methodology 4
......................................................................................................................TheData 6
.........................................................................................................................Results 8
............................................................................................TheBaselineModels 8
............................................................AddingHighSchoolGradestotheModel 9
.................................................................................AddingtheScaleVariables 11
...................................................................................OverviewoftheFindings 14
..........................................................................ConclusionsandPolicyImplications 15
................................................................................................................References 18
.....................................................................................................TablesandFigures 20
Pleaseciteas:Finnie,Ross,andMueller,RichardE.(2008).TheEffectsofFam‐ilyIncome,ParentalEducationandOtherBackgroundFactorson Access to Post‐Secondary Education in Canada: Evidencefrom the YITS. Toronto, ON: Canadian Education Project.(www.mesa‐project.org/research.php)
EffectsofUniversityCharacteristicsandAcademicRegulationsonStudentPersistence,DegreeCompletion, andTimetoDegreeCompletion
IntroductionThere now exists a substantial body of
research on the importance of family back‐ground influences, tuition levels, and otherrelatedvariablesonaccess topost‐secondaryeducation (PSE) – in Canada as for othercountries. For economists, this emphasisonfinancial factors makes perfect sense. Thepricemechanismis consideredtobeimpor‐tant in any investment decision – which ishowthechoice ofschoolinglevelis typicallyviewed.Andtheavailability ofthefunds re‐quiredtomake the investment– inthis con‐textoftenproxiedbyorotherwiserelatedtofamilyincome level–is anequallycritical fac‐tor,especially ina contextwherecapitalmar‐kets may limit access to financing becauseprospective students are often unable toprovidesufficientcollateraltobacktheirbor‐rowing (see for example, Barr, 1993, Chap‐man,1997).
Recent scholarly research in thearea ofaccess to PSE (e.g., Cunha, et al., 2006,Heckman, 2007) has, however, shifted theemphasistonon‐financial factorsas a newergeneration of empirical work has indicatedthatfinancial resources arebutoneofmanyimportantdeterminants ofPSEparticipation.This lineofresearchcontends that itis long‐termfactors,suchas familybackground,overshort‐termfactors,suchascreditconstraints,which are of greatest importance in deter‐mining access to PSE. Since many of thesefactorsarecorrelatedwithfamily incomeintheshort‐termperiodwhenPSEdecisionsaremade,itis oftenerroneously statedthatthisshort‐termcreditconstraint is whatprohibitslow‐income individuals from attending PSE.Theimplicationofthis workispowerful:pol‐icyshouldbe moredirectedtowards students
earlier in life if the long‐term goal is to in‐creasePSEparticipation.
This is not to imply that financial re‐sources are not important, only that theymaybecorrelatedwithothervariableswhichare alsosignificantdeterminants ofPSE par‐ticipation, andthus theremay havebeen amisguided assignment of the influence ofthesefinancialvariables.Forpolicypurposes,identifyingthemost importantdeterminantsof access toPSE is obviously important forchoosingthemosteffective policy levers forchanging access rates (and the underlyingopportunities whichdrivethoserates),espe‐cially ifoverall PSEbudgetsaremoreor lessfixedandspendingononeaccess lever (e.g.,loans, grants, or loser tuition) means lessspending on another (e.g., earlier interven‐tions).
Furthermore, if student loans andgrantsand/or decreasedtuitionare not having thedesiredeffect onaccess andretention, thantheseresourcesmaysimplyamountto“rent”accumulating to thosewhosePSE decisionsare notsensitivetothesefinancial variablesand would have been attending anyway.Governmentswouldperhaps likely dobetterat targeting their resources to, say, betterpreparingstudents forgainingadmissionintoPSE institutions or improving individuals’educationalsuccessorwork habitsat lowerlevels, ultimately enhancing the probabilityofPSEparticipation.
Carneiro andHeckman (2002) succinctlysummarize the argument, noting that chil‐drenwhoseparents havehigherincomehavebetter access to quality schools, and thesesameparentsshapethetastesandexpecta‐
1EffectsofUniversityCharacteristicsandAcademicRegulationsonStudent Persistence,DegreeCompletion,andTimetoDegreeCompletion
tionsoftheir children. They are alsoabletobetter nurture the intellect of their childrenby assistinganddirecting their studies.Theyalsonote that cognitiveability – at least asmeasured by IQ on standardized tests – isformedby theageof14 andthat the influ‐encesoffamilyfactors accumulatefrombirthsothatscholasticabilityis determinedby theendofhighschool.Again, theimplicationoftheseargumentsisthatpolicies aimedatin‐fluencingyoungpeopleat thetimeoftransi‐tionfromhighschool toPSE couldbeinap‐propriately targeted.Rather,anyattemptsatinterventionshouldlikelybeconductedmuchearlierwhenthecognitive maturityofyoungpeopleisbeingdeveloped.
With the exception of Carneiro andHeckman(2002),andahandful ofother re‐centstudiesofthis generationwhichaddresstheimportance of family backgroundonac‐cess to PSE (e.g., Cameron and Heckman,1998; ErmischandFrancesconi,2001; KeaneandWolpin,2001; Cunha,etal.,2006;Heck‐man, 2007), relatively little data has beenbroughttobearonthis topic,andwebelieveourdatatohavecertainstrengths thatcanbefoundinnoprevious studies,these beingtheparticularly richset of backgroundvariablesthatcanbeaddedtothemodels.This is es‐pecially truein theCanadiancontext,andtothebest of our knowledge, ours is the firststudyusingCanadiandatawhichattempts toestimatethe importanceofa broader set offamilyandstudentbackgroundinfluences onaccess toPSEinthis fashion.1Inparticular,wefocus onthe backgroundof young adults atthe timewhen they are15‐years old to as‐sesstheimportanceof thesefactors onen‐
teringeithercollegeoruniversity.
Thecontributionof this paper is, there‐fore,toincludea muchricherseriesofback‐groundvariablesintotheanalysis,thus allow‐ingus toanalysetheeffects ofboththe moretraditionally measured determinants of ac‐cess to PSE (e.g., family income) aswell asthe various sets of other background vari‐ables that alsomay be of importance. It isthis lattergroupoffactors thatmaybe corre‐lated with financial variables, and yet maythemselves be important correlates of PSEparticipation amongst young people. Theseinclude various measures of high schoolgrades, a range of “scale” variables whichcaptureacademicandsocial engagementandrelated psychological‐sociological attributes,anda standardizedinternationalreadingtestscore.Weexpectthattheinclusionofthesevariables will attenuate the effectsof tradi‐tional variables (such asparental educationand income).Weanticipatethat somevari‐ables such as high school grades and stan‐dardizedreadingtestresults will haveaposi‐tiveandindependentinfluenceonPSEatten‐dance, but we hold fewer a priori expecta‐tionsaboutthesigns andrelativeimportanceofmanyofthe othervariables,sincetherela‐tionshipsbetweenthesevariablesare likelycomplexandhaveyettobesufficientlystud‐iedintheliterature.Estimatingtheeffectsofthesevariables andmeasuringthechanges inthe estimated effects of the more typicalbackgroundvariables whenthebroadersetsare introduced,arethemainfocus ofthepa‐per.
MESA‐MeasuringtheEffectivenessofStudentAid2
1Frenette(2007)alsoexploitsthesedata,butaddressadifferentquestion:whatfactorsexplainthedifferenceinPSEparticipationratesofindividualsfromdifferentfamilyincomequartiles?HeaddressesthisbyusingastandardOaxacadecompositionapproach.
Utilizingmultinomial logitmodels tocap‐turetheparticular levelofPSE inwhich theindividual participates (i.e., college versusuniversity)generateresultsthataregenerallyconsistentwithwhat is foundintheexistingliteratureinterms ofthesignsof the coeffi‐cients andthe overall size ofeffects. Inpar‐ticular,wefindthat parentalincomeis posi‐tively related to university attendance, buthas amuchsmaller effect oncollegeatten‐dance, sinceit makes itmore likely that anindividual will participateinPSE, whichgen‐eratesapositive effect, but alsomorelikelythat university will be the level of choice,whichhas anegativeinfluence.Thestrengthof the incomeeffect is, however, greatly di‐minishedonceparentaleducationis includedin the estimation, suggesting that when in‐come is included without education it islargely capturing the effect of the latter,whichis the dominanteffect. Inlikefashion,theimportance ofparental education(espe‐ciallyonuniversity attendance)isdiminishedtosomedegree–althoughitremains strong– once certain measures of high schoolgrades, academic “engagement,” and stan‐dardized reading test scores (i.e., PISA re‐sults) areincluded. Interestingly, theseaddi‐tional variables donotfurtherreducethe es‐timated importance of family income, sug‐gesting that an independent income effectremainsafterall thesefactorsare takenintoaccount–evenif it is notnearlyas greatasmight bethought fromestimates generatedwhenaless completesetofexplanatoryvari‐ables is included. These results thereforesupport other recent work which points tothe importance of addressing earlier cogni‐tive and behavioural influences rather thancurrent income in effecting change in theratesandpatternsofparticipationinPSE.
Thepaperis organizedas follows:thefol‐lowingsectioncontains a reviewoftheperti‐nent literature; Section III discusses themethodology employed; the data are dis‐cussed in Section IV; the results of the de‐scriptive and multivariate analysis are thetopic of Section V; and the final sectionsummarizesthe major findings andexploressome of thepolicy implications of thefind‐ings.
TheLiteratureAs notedabove,a goodshareof the lit‐
erature on access to PSE amongst youngpeople has addressedtheimpacts oftuitionlevels andfamily background(thetwoofteninteracted).
CarneiroandHeckman(2002)reviewtheUSliteratureandaddnewevidencesupport‐ing the paramount importanceof long‐termfactors, such as family background, overshort‐termfactors,suchascreditconstraints.Since many ofthese background factorsarecorrelatedwith family income in the short‐termperiodwhenPSEdecisionsaremade,itis oftenerroneouslystatedthatthis indicatorof short‐term credit constraint is what pro‐hibits low‐incomeindividualsfromattendingPSE.
Studies by CameronandHeckman(1998,2001),Keane andWolpin(2001),andCunha,etal.(2006),tonamebuta few,alsosupportthis conclusion. Similarly, Murray (2002)notes that successful (in terms of income)parentstendtohave successfulchildren.Theimplicationof this research is that PSE par‐ticipation is largely determined long beforetheactual pointof entry intohigher educa‐
3EffectsofUniversityCharacteristicsandAcademicRegulationsonStudent Persistence,DegreeCompletion,andTimetoDegreeCompletion
tionandthat relaxingshort‐termcredit con‐straintshaveonly haveaminimaleffect onparticipation.Keane(2002:293),forexample,commentingontheincomedivideincollegeattendanceintheUSnotes thatthisinequal‐ity“appearstobe drivenbyunequalhuman‐capital accumulation prior to the college‐going age.” The policy implication of thesestudies is that trying to relax short‐term fi‐nancial constraints in attending PSE will belargelyineffective.
This bodyofworkrepresentsthepointofdeparture for the current paper. Weutilizethe extensive background information con‐tainedintheYITS‐A database toaddress ac‐cess toPSEinCanada.Specifically,weaddtothe existing literature by including a morecomprehensive set of background variableswhicharedeterminedbefore entry intoPSEto assess the impact of these variablesonaccess tocollegeanduniversity andhowin‐troducing these additional variables affectsestimates of the more conventional meas‐ures,suchas familyincome,as well as paren‐taleducation.
This workalso fits intoa specifically Ca‐nadianliterature.Theaccumulatedevidencesuggests that the demandfor PSE inCanadais price inelastic(JunorandUsher, 2004), al‐though tuition increases may have a largerimpactonindividuals fromlow‐incomefami‐lies(Coelli, 2005). BothChristophides, et al.(2001)andCorak,etal.(2003)includeparen‐tal incomein their models of PSE participa‐tionandfindthat it isimportant for univer‐sityattendance,butnotcollege,while tuitiongenerally had little general effect, but mayhavemore impact on individuals from lowincomefamilies. Frenette (2005) andDrolet
(2005)similarly findthatPSEattendancegapbetween high‐ and low‐income families isnarrowedwhencollegesanduniversities arebothconsidered,butthatstudents fromlow‐incomefamilyarelesslikely toattendeither,especiallyuniversity.
Two recent studies (Frenette, 2005,2007), have also cast doubt on the creditconstraint hypothesis. In the first study,Frenette uses the deregulation of profes‐sional programtuitioninOntarioas a naturalexperiment. Hediscoversthat it is studentsfrommiddleclass familieswhosawtheirpar‐ticipation in these programs decline themost, not thosefromlower‐incomefamilies.In the secondstudy, using the sameYITS‐Adata weemploy, he shows that very littleoftheuniversityparticipationgapbetweenstu‐dentsfromfamilies inthe firstandfourthin‐come quartiles can be explained by creditconstraints. Rather it is differences in stan‐dardized test scores andhigh school marksthat explainthemajority (andalmostall) ofthegap.Thecombinedresultsofthis bodyofworkagainsuggests thatresources aimedatrelaxing credit constraints (e.g., loans andevengrants) may bemisdirectedandmightbebetter utilizedat improving student per‐formance at(orbefore)thehighschoollevelor providing better information to studentsandtheir familiesabout the costsandbene‐fitsofeducation.
MethodologyThis research uses a relatively standard
empiricalmodelforestimatingaccesstoPSE,whereaccess is takentobeafunctionofdif‐ferent sets of influences, working from asmallerset of regressors, includingtheprin‐
MESA‐MeasuringtheEffectivenessofStudentAid4
cipal family background variables conven‐tionallyincludedinsuchmodels,andbuildingto amore comprehensive set of regressorsrepresenting the other kinds of influencesmeasuredintheYITS‐A–thus movingfroma“short” regression to progressively “longer”regressions.
Themodelmaybeexpressedasfollows:
Y=X1β1+X2β2+X3β3+μ
where Y is the access measure of interest(participationincollegeoruniversity), theXiare vectors ofcovariates thatinfluenceY,theβi are the coefficients associatedwitheachsetofX,andμis theclassicalstochasticerrorterm.
X1comprises the mostconventionalfam‐ily background variables such as family in‐come, parental education, family type, etc.whicharetypically taken in theliteraturetobe the important indicators of the advan‐tagesoffamily backgroundinterms ofgoingontoPSE.That is, individuals fromhigherin‐comefamilies or(especially)thosewithmorehighly educated parents (it turns out) aremorelikelytogoontoPSE,particularlyattheuniversity level. Thesesimpler/shortermod‐els will capture thetotal effects ofthese vari‐ables on access, regardless of the path ofthose influences (i.e., direct or indirect),whilepickinguptheinfluences ofotheromit‐tedfactorswithwhichtheyarecorrelated.
X2 includes one element of the widerrange of variables available intheYITS. Thissetis comprisedofvarious(scholastic)“abil‐ity”measures, suchas the individual’s highschool grades(overall and incertainspecific
subjects, such as math and English), andotherrelatedindicators.
Anextsetofregressors,X3,includeotherkinds of influences that havebeen gainingincreasing attention as perhaps constitutingsome ofthemoreimportantdeterminantsofaccess to PSE. These include measures of“engagement” and “inclusion,” suchas howconnectedthestudentfelttohis orher highschool, a student’s self‐appraisal of confi‐dence andcompetence,parental behavioursregarding monitoring and disciplining theirchildren,etc.
It shouldberecognised that theseaddi‐tional influences do not necessarily have anatural, “econometrically‐correct” orderinginterms oftheirinclusion,partlybecause wedonot yet understandtheseprocessesverywell.Furtherworkwill undoubtedlycontinueour advances in this respect. What is mostimportanttothe currentanalysis,however,isthat:(i) they are all determined before theentry intoPSE(whichis whentheyhavebeenmeasured – i.e., during the earlier pre‐PSEcycles of theYITS‐A), (ii) they canaffect ac‐cess toPSE,and(iii)theymightinturnbe re‐latedtofamilybackground.Hence, includingthemwillcomprise anexercise inmovingto‐wards (i)identifyinga fullersetofinfluencesof access toPSE,and(ii)seeinghowadding
5EffectsofUniversityCharacteristicsandAcademicRegulationsonStudent Persistence,DegreeCompletion,andTimetoDegreeCompletion
suchadditional measuresaffectsour under‐standingofthedirectandindirecteffects offamilybackgroundonaccesstoPSE.
Various particular specifications of thismodelareestimated,all ofwhichusea mul‐tinomiallogitset‐uptodifferentiatebetweenaccess tocollegeanduniversity.2 It is impor‐tant here toexplain thedifferencebetweenthesetwokindsofPSEintheCanadiancon‐text. “University” includes what is conven‐tionallyreferredtoas “college”intheAmeri‐can context, and includes all types of pro‐grams thatdeliverbachelorsdegrees.Other‐wiseput, virtually all institutions inCanadathat grant such degrees are referred to as“universities,” even if they only offer pro‐grams at thebachelors level,andregardlessof their size. The classic liberal arts collegethatis foundinthe U.S.wouldthus beauni‐versityinCanada. Incontrast,“colleges”,orwhatare oftenreferredtomorecompletelyas “community colleges”offer shorter,morepractical programs,usually lastingfroma fewmonthstotwoyears (orevenlongerinsomecases) and in many cases include tradeschools. The resultingcredential is a collegediploma –as opposedtothe degreesofferedbyuniversities.
Ourmultinomial setupupthusallowstheregressors in our models to have differenteffects on college and university participa‐tion, while allowing these processes to be related.
Onepotential issue intheestimation ofthesemodelsisthepotential endogeneity ofatleastsomeoftheright‐handsidevariables.Forexample, students whowant toget intouniversity will likely workharder to achievethebettergrades inhighschool required togainadmissiontothis level ofschooling(andtohavemorechoiceamongthosetowhichthey areaccepted).Thus,highschoolgradesare notstrictly exogenous tothe PSEpartici‐pationoutcome.Thereexistavarietyofwaystoovercome(althoughnotnecessarilyelimi‐nate) this endogeneity problem. But in thispaperwesimply takesuchmeasures at facevalue, which is consistent with our goal ofestimating the empirical relationships inquestion and seeing how they change (ornot)as themodelincludes richer sets ofre‐gressors. Adding themorecomplete sets ofexplanatory variables may noteliminate thebias causedby endogeneity, but it shouldatleastattenuatetheproblem.
TheDataTheYouthinTransitionSurvey–Sample A
(or YITS‐A) initially interviewed15‐yearolds,theirparents,andtheir highschool adminis‐trators in2000.Twofollow‐upsurveysoftheyoungpeople(only)were conductedin2002andthenagainin2004.Inthis latterwaveofthesurvey, theyoungpeople were 19‐yearsof age, thepoint at which individualshavemade at least their initialchoices about en‐teringPSE.
MESA‐MeasuringtheEffectivenessofStudentAid6
2Weareawarethattheuseofamultinomiallogitmodelrequirestheassumptionofindependenceofirrelevantalternative,anassump‐tionthatisstronggiventhatthedecisiontogotocollegeoruniversityarenotlikelyindependent.Weestimatedanumberofthespecifi‐cationsoutlinedbelowusingamultinomialprobitmodel(whichdoesnotrequirethisstrongassumption).Innoneofthecasesdidthe
resultschangemarkedlyfromthosepresentedbelowinTables2and3.
Thedependent variables in our study –representingentry intoeithercollegeor uni‐versity – thus differentiate those whohavedecided to enter PSE at this point in theirlives versus all others – includingthosewhohavedecidednot toattendaswellas thosewhomay golater.While itwouldalsobe in‐teresting– andinsomeways moreinterest‐ing– to lookataccess whenindividuals areolder and would therefore have had moretimetoreturnto their studies after not en‐tering PSE directly from high school, otherwork has found that the relationship be‐tween participation inPSE andfamily back‐ground (as well as most other influences)does notdifferverymuchwiththeageoftheindividualsincluded inthe samples(at leastamongyoungpeoplegenerally).Ouranalysisis inanyeventconstrainedbythedataavail‐able, and we consider our estimates to atminimum provide an initial set of resultswhichatleastbegintogetattheissues beingaddressed, perhaps tobe returned to afterthereleaseofthe2006surveyYITS‐Adata.
Whileour study is national inscope, theexceptiontothisgeneral coverage is thatthesamples excludethoseliving inQuebec.Be‐cause Quebechas a specialsystemofPSE –Collège d'enseignement général et profes‐sionnel,orCEGEPas itis commonlyknown–students in Quebec only attend secondaryeducationuptotheequivalent of grade11,andthenattendCEGEPtoeither prepare foruniversity (two yearsof CEGEP) or to com‐plete a technical program (usually two orthreeyearsofCEGEP).WedropQuebecfromour analysis since there is no way in thesedata to disaggregate the two streams, andthis couldpotentially confoundour analysis,since university‐bound students would be
classified as college students if included interms of their CEGEP attendance, and the differentiation of college‐ and university‐boundstudents is fundamental toouranaly‐sis.Observations fromthe territories are alsoeliminatedduetosmallsamplesizes.
PSEparticipationis definedinour analy‐sis as the first program that a student en‐tered,ratherthanthehighestlevel attended.This isprincipallyowingtothefactthatmoreinformationisavailableonthefirstprogramthanonsubsequent programs aswell asthefact thatweare concernedwiththespecifictransitionfromhighschool toPSE inthis re‐search.This said, giventherelativeyouthofour samples, for most studentsthe level ofthefirst program is the sameas the level ofthehighestprogram–at leastsofar intheirlives.(Withfuturewaves ofthe YITSdata,thedynamicsrelating tofirst versussubsequentprograms could be addressed, includingswitches from one level of PSE to another(i.e.,betweencollegeanduniversity).
Since individuals who have studiedout‐side of Canada might have quite differentbackgrounds and experiences, we eliminatethemfromthe sample.For thesamereason,non‐Canadian citizens and those with un‐known immigration status are dropped. Fi‐nally, we drop those individuals for whichtherearemissingdata aswell as thosewhoare continuinginhighschool, sinceweobvi‐
7EffectsofUniversityCharacteristicsandAcademicRegulationsonStudent Persistence,DegreeCompletion,andTimetoDegreeCompletion
ouslydonotobserveanypotential transitionintoPSEforthislattergroup.3
The final sample contains 7,852 malesand 8,211 females. At times, however, thisnumber is reduced slightly due to missingvalues of someof the variables included inthedifferentmodels.Afull accountingoftheobservations dropped from the sample iscontainedinAppendixTableA‐1.
Results
TheBaselineModelsThe initial estimation results are pre‐
sented in Table 1, for males and females.Theserepresent aset ofbaseline estimatesthat are interesting on their own, and thatprovidea pointofdeparture for theanalysisthatfollowsas additional variables are addedtothemodel.The major resulttocomefromthis exercise and one that is increasinglyprominentintheliterature (e.g.,ErmischandFrancesconi,2001)is thattheeffectofparen‐tal income–especially inthelate‐teenyearswhenPSEdecisionsaremade –is diminishedgreatly once we control for parentaleducation.4
Forexample, theresultswithcontrols formales thatdonotinclude parental educationshow that a parental income level of$100,000 andover is associatedwitha 19.1percentage point increase intheprobabilityofattendinguniversitycomparedtothe con‐trolgroupof $50,000 to$75,000.Whenpa‐
rental education level is included, however,this figure drops to about six percentagepoints. For females, the corresponding esti‐mates are19.8 and10.3 percentagepoints.For collegeaccess, there areno statisticallysignificant incomeeffects except inthefinalmodel for females, where those from thepoorestfamilieshavesignificantly lower par‐ticipationrates.
What is alsointeresting is that althoughdirect comparisonof theincomeandeduca‐tioneffectsis notpossible because ofthedif‐ferentnature(andmetrics)ofthetwosets ofmeasures(dollarsversus years),theparentalincomeeffects appeartobemuchsmallerinmagnitude thanthoseofparentaleducation,at least with respect touniversity entrance.For example,having a parent witha bache‐lor’s degreeincreases the probabilityofgoingto university by 31.2 percentage points formales, comparedtosomeonefrom afamilywith highschool as the highest levelof pa‐rental education. Contrast this with theaforementioned six percentage point in‐crease formales from families withincomesover $100,000 compared to incomes in the$50,000‐75,000range.
Inaddition,wenotethatparental educa‐tion effects both college and university at‐tendance –these influences runninginoppo‐sitedirections.Thus,forexample,males witha parent with a graduate (or professional)degree are (ceteris paribus) 45.1 percentmorelikelytogotouniversity thanthecom‐
MESA‐MeasuringtheEffectivenessofStudentAid8
3Anotherissueweignoreistheeffectofworkingduringschoolandtheeffectofemployment,numberofhoursworked,etc.onthepost‐secondaryeducationchoice.Itisouropinionthisisanimportantandcomplexissueandonethatisbetterleftforaseparateanalysisus‐ingtheseorotherdata.
4Inthecaseoftwo‐parentfamilies,parentaleducationrepresentsthehighestlevelofthetwoparents.Usingothermeasures(suchastheaveragelevelorthedifferentlevelsofthetwoparents)yieldssimilarfindings.
parisongroup(parents havecompletedhighschool), but thiscomespartly at thecost of9.2 percent lower rates of college atten‐dance. This makes sense: parental educationchanges notonlyhowmany individuals goontoPSE(thenetincreaseof35.9percentrep‐resentedby thetwoeffects takentogetherintheexamplejustgiven),butalsothedistribu‐tionof thekindofschooling they engagein(increasinguniversity level schoolingandde‐creasingcollege level participation).Themul‐tinomial logit model used here capturesthese effects in the econometrically appro‐priate manner,andalsoin amannerwhichisexpositionallyconvenient.
OurresultsarealsoconsistentwiththoseprovidedbySacerdote(2002),whoalsofindsthat father’s income (as proxied by occupa‐tion) and father’s education are importantdeterminants of entrance to PSE. He com‐pares childrenrandomlyassignedtoadoptivefamilies with children who live with theirbirth parents (the control group). He findsthat bothgroupsaresimilarly influencedbyincome, but education is an important de‐terminantof PSE participationonly for non‐adoptees–whichofcourse has meaningforthe interpretationof the two kindsof influ‐ences. This finding is echoed by Plug andVijverberg(2003)whomodel parental abilityas havingbotha direct effect ontheir chil‐dren’s educational attainment as wellas anindirect effect through income. They arguethat higher ability parents earn higher in‐comes andthese incomesarealsoimportantinputs intoa child’s education.They findthatthe effects of parental ability are reducedfromabout70‐75percentofthe total abilitytransfer to some55‐60 per cent when the indirect effects of ability on incomeare in‐
cluded in themodel. Restuccia andUrrutia(2004) show that most of the intergenera‐tional persistence in educational attainmentcan be accounted for by innate ability, butthat the quality of early education can en‐large these exogenous differences in abilityovertime.
AddingHighSchoolGradestotheModelNext we turntoanalysing the influence
onaccess toPSEofthe grades that studentsreceivedinhighschool atthetimeofthefirstwave of the survey in 2000 when theseyoungpeople were15‐years old.Theresultsof theseestimations arepresentedinacon‐densedforminTables2a and2b(malesandfemales, respectively). The baseline resultsfromthe full model estimatedinTable 1arealso includedtofacilitate the relevant com‐parisons.
The overall high school average grade(numerical score) has a negative effect oncollegeparticipationandapositiveeffectonuniversity participation. The estimates sug‐gestthata ten‐percentagepointhighergradeaverage will result in about a three‐percentage point decrease in collegeatten‐dance, but about a21 percentagepoint in‐crease in university participation. Thus,higher grades shift the distribution of PSEparticipationfromcollegetouniversity,witha strong net increase in PSE participation.
9EffectsofUniversityCharacteristicsandAcademicRegulationsonStudent Persistence,DegreeCompletion,andTimetoDegreeCompletion
These results are almost identical for bothfemalesandmales.5
Highschool grades ineachofmath, lan‐guage, and science (also numerical scores),also yield coefficients of the same sign, al‐though of smaller magnitudes, suggestingthatit is overall grades,ratherthananyindi‐vidual grade,thatis importantindeterminingparticipationinuniversityor college.Indeed,whenthemodelis estimatedwithallgradesincluded (column5), it is the overall gradethatis ofparamountimportanceindetermin‐inguniversityattendance.
Aninterestingparticularresult is thatthemathgradeisnumericallythe leastimportantin determining university attendance,whether thevariableentersthemodelindi‐vidually or jointly withtheother gradevari‐ables.Thelackofnumeracyskills (atleastasreflectedbythemathgrade)does notappeartobe asimportant as thelanguagegradeinany of the specifications for either sex. Ofcoursethis resultcouldchangeifwewere tolook at specific area of study, with mathgrades likely toberelated toentry into thesciences, engineering, and other disciplineswhichdependmoreontherelatedskillsets.
Another interesting result isthat the ef‐fects of parental income remain relativelyunchangedwhen highschool grades arein‐cluded,whereastheeffectofparental educa‐tionisattenuated,insomecases significantlyso, inboth the casesofmales and females.For example, the effect of having parents
whoare auniversitygraduateonmales’uni‐versity attendance declines from 45.1 per‐centage points in themodelwithno gradevariables (the “Baseline” results), to 24.2percentwhenthey are all included(column5).Forwomen,thechange is from37.2per‐cent to 19.9 percent. These results suggestthat the influence of parental educationworks, at least inpart, throughhighschoolgrades, whereas income is capturing some‐thing other than this – indeed, perhaps a“pure” incomeeffect (an inference which isstrengthenedbytheresultswhichfollow).
This finding is interesting to compare towhat is reported in Carneiro and Heckman,2002 (and in other work by Heckman andvarious co‐authors). They find that the sig‐nificant effectsof family incomeonU.S. col‐lege attendance (“university” for us) arelargely eliminatedonce anIQ test score ob‐tainedwhenthepersonwasinhis orhermidteens is included in the model. Their inter‐pretation– in acontext wherethey donotincludeparentaleducationintheirmodels –is thatfamilyincomeis,intheabsenceofthetest score, proxying a family’s inputs to thechild’s schooling andother such influences.Our findingofa reducedparental educationeffect ashigh school gradesareaddedpre‐sumably stemsfroma similar setofrelation‐ships,except thatit is theeffects ofparentaleducationonachild’s highschooloutcomeswhich is being captured when grades areomittedfromthe model, rather thantheef‐fectsof family incomeonthese.Meanwhile,ourfindingofanenduringincomeeffectsug‐
MESA‐MeasuringtheEffectivenessofStudentAid10
5Categoricalgradeswerealsotriedinplaceofthecontinuousnumericalgradesinthesetwotables(e.g.,50‐60%,60‐70%,etc.).There‐sultswereessentialthesameasthosepresentedhere;thosewithhighergradeswerelesslikelytoparticipateincollegebutmorelikelytoparticipateinuniversity.Thenumericalgradesusedhereweresetatthemeansofthesecategoricalvariables(e.g.,60‐70percentequals
65percent,etc.).AppendixTableA‐2containsdetailsofthegradedistributions.Gradeswerealsoenteredasaquadraticinthemodel.Again,therewerenoimportantdifferenceswiththeresultspresentedhere.
gests moneymightbematteringat thepointofentry intoPSEinawayHeckmanandCar‐neirodidnotfind.
AddingtheScaleVariablesThe YITS also includes a set of “scale”
variables,whichareindices derivedfrombat‐teries ofquestions designedtomeasurevari‐ous aspects ofa person’s engagementinhighschool,self‐esteem,parentalbehaviours,etc.A full description of these variables, whichare basedondata collectedinthe firstsurveywhentheindividuals inthesamplewereage‐15, canbe foundinAppendixTable A‐3. Ac‐companyingsummarystatistics arecontainedinTableA‐4.
These variables, with the exception ofreadingability (seebelow),arenormalizedatmeanzeroanda standarddeviationofone.This isimportanttokeepinmindwheninter‐preting theresultsbelow.6 Theinfluence ofthesescale variables oncollegeanduniver‐sity attendanceisreportedinTables 3a and3b for males and females. These are againenteredintothebasicmodelindividuallyandthen jointly in the final column of thesetables.7
Each of the three high school engage‐mentvariables(aswell asthetwosubcatego‐ries thatcomprisethe academicengagementvariable – academic identification and aca‐demic participation) is positively related touniversityattendance,buthas littleinfluenceoncollegeattendance.
Themost importantoftheseis academicparticipation(ameasureofattendingschool,doinghomework,etc.)whichisimportantonits ownand also as comprising one‐half oftheacademicengagementvariable, which isa simple average of academic participationandacademic identification, the latter beingbasicallya measure ofvaluingandbelongingat school. For females, being one standarddeviationabove themeanonthis academicparticipationscale increases universityatten‐danceby about 13.9 percentagepoints,andformalesthe figureis about10.6percentagepoints.Thus,studentswhoattendclass regu‐larly, complete assignments on time, andspendmore time studying, are muchmorelikely toattenduniversity thanthose whodonothavethese habits.Theacademicidentifi‐cation effects are significant, but a littleweaker,inthe6‐7percenteffectrange.
In addition, the influence of parentaleducation declines in importance onceaca‐demic participation is included, suggestingthat the two variables are positively corre‐lated, presumably because parents withmoreeducation tendtoteachtheir childrentohavegoodworkhabits andsoon–orbe‐cause they otherwise purchase the inputs(extracurricular activities, clubs, etc.) thatbuildthesebehaviours,orbecausetheyoth‐erwise transfer or generate the attributesthatbuildacademicparticipation.
Socialengagementreflects the degreetowhichanindividual feels accepted,respected
11 Effects ofUniversityCharacteristics and Academic Regulations on Student Persistence,DegreeCompletion, andTimetoDegreeCompletion
6Thevariablesalsotendtohavesubstantialdistributions(AppendixTableA‐4),indicatingthattheyareindeedcapturingsomething,whichisofcoursereflectedinthesignificanteffectstheyseemtocarryasseenintheresultswhichfollow.
7Tocheckfornon‐linearities,separateestimateswereconductedusingbothaquadraticspecificationofthescalevariablesaswellascategoricaldummyvariables.Aswiththecaseofhighschoolgrades,therearenoimportantdifferencesbetweentheseresultsandtheresultsreportedhere.
andincludedinthehighschool environment,andalthoughitis positivelyrelatedtouniver‐sityparticipationforbothmales andfemales,the effects are relatively weak. Those whoare onestandarddeviationabove themeanonthismeasure,forexample,are abouttwopercentage points morelikely toattenduni‐versity.Themeasure hasnosignificanteffectoncollegeattendance.
Self‐perceptionwouldalsoseemtobeanimportant determinant of PSE participation.Self‐perceptioniscapturedbythreeseparatevariables: self‐esteem is a measure of self‐worthandself‐acceptance,self‐efficacyisthestudent’s ownperceptionofhis or hercom‐petence and confidence inperforming classwork,andself‐mastery is a measureofbeingincontrol ofone’sowndestiny.Studentswhoscoredhighonany or all of thesemeasuresmight be more prepared to enter PSE, andthe results in fact show that all three arepositively and significantly correlated withuniversity – butnotcollege–attendance,atleastwhenenteredindividually.Self‐efficacy,however, has the largest effect for bothmales andfemales,abouttwicetheimpactoftheothertwomeasures.
Socialsupportis statisticallyimportantformales,butthecoefficientestimates are rela‐tivelysmall,andthevariableis notsignificantfor females. Theseresults thussuggest thatthosewholooktoimprovingthese elementsof ayoungperson’s situationasa meansofcausingmoreofthemtoenrol inPSEwould,therefore, appear tohave theoddsstackedagainst them in terms of getting significantresultswithanysuchstrategies.
Parental behaviour is divided into threesubcategories: “monitoring behaviour” ad‐dresses howwell parents feel informedabouttheactivitiesoftheirchildren,while “nurtur‐ancebehaviour”and“inconsistentdiscipline”are bothself‐explanatory.Ofthese,monitor‐ingbehaviour is positively relatedtouniver‐sity attendancefor bothmales andfemales,whilenurturing is important only formales.Neitherhas any influenceoncollege partici‐pation.Finally,inconsistentdiscipline isnega‐tivelyrelatedtoparticipationinuniversityforbothsexes butagainis notrelatedtocollegeparticipation.Themagnitudes oftheseinflu‐ences lay in the2‐3 percentage range (uni‐versity attendance) where significant, lesswherenot(notsurprisingly).
Reading ability is an extraordinarily im‐portant correlate of PSE participation. Thisvariable has a meanof 500 anda standarddeviation of 100 andwas created from thecross‐national Programme for InternationalStudent Assessment (PISA) reading test re‐sults. Thepointestimates showthatfemaleswhowere one‐standarddeviationabovethemean were, on average, 23‐percentagepoints more likely of attending university(andjustslightlyless likelytoattendcollege).For males, the corresponding figure is 18‐percentagepoints.
Ofnotehereis thefactthatthe effects ofparental educationdonotchangeverymuchwhenthescalevariablesareadded, implyingthatthesevariablesare nothighlyrelatedintheir effects. Theexceptions tothisareaca‐demicparticipation,self‐efficacy,andreadingability inthecaseofuniversityparticipation.Inthefirsttwoinstancestheeffects ofparen‐tal educationdeclines toa moderatedegree,
MESA‐MeasuringtheEffectivenessofStudentAid12
whiletheinclusionofthereadingscorede‐creases the value of parental education atthebachelor’s andgraduatelevels (forexam‐ple) by approximately one‐third for bothmales andfemales (comparecolumns 1and13 in Tables 3a and 3b). The PISA readingscoreis astandardizedtestandtheseresultsare again comparable to thoseobtained byCarneiro andHeckman (2002)whoalso usestandardized test scores to explain differ‐ences in college attendance in the UnitedStates.
It is important to note that the PISAscores arebasedonactual tests,whereasthehighschoolgrades(such as thoseshown inTables 2a and 2b) are self‐reported. Finnieand Meng (2005) have shown that thesetypes of test scoremeasures ofskill performbetter thanself‐assessmentsof skill. In par‐ticular,theyuseliteracyas anexampleusingbothtypes ofmeasures(i.e., testscoresandself‐reportedability), and find that theself‐assessedmeasure tendsto leadtoa signifi‐cantunderestimationofthe effectofliteracyonemploymentcomparedtothetestmeas‐ure. Inthepresent work, this bias may alsobepresent, as indicatedby thegreater esti‐matedeffect andassociateddecreaseinthemagnitude oftheparental educationvariable(mainlyatthe BAandgraduateschoollevels)whenthestandardizedtestscoreis included(Tables 3) versus when the self‐assessedmeasureofabilityareincludedinthe models(Tables2).8
When all these scale variables are con‐sidered together (column 15 in the tables),theresults continuetosuggestrelativelylittleinfluence on college participation – hardlysurprising given the general lack of impactwhenenteredindividually.
For university attendance, however, anddespite the large number of regressors in‐cluded,someofwhichwouldbeexpectedtobecorrelatedandhave somewhatsimilaref‐fects,certainstronginfluences continuetobeseen. In particular, academic participation,self‐efficacy and reading ability all remainimportant, althoughtherelative magnitudesof these variables continuetodiffer. Aone‐standarddeviation increase from the meanof academic participationraises female uni‐versity participationrates by about 8.8 per‐centage points on average. For males, thecorresponding figure is 6.8 percentagepoints. One standard deviation above themeanontheself‐efficacyscale meansalmosta five‐percentagepoint increase inuniversityattendanceforbothfemalesandmales.
Readingability clearlyhas thelargestef‐fect.Forfemales,a score one‐standarddevia‐tionabove the meanisassociatedwith thewoman being 19 percentage points morelikely toattenduniversity,andformalesthecorrespondingfigure is 15percentagepoints.Withthemeanuniversity participationratesfor males and females in our sample being30.9 and44.7per cent, respectively,readingability isclearly a majordeterminant ofwhogoes andwhodoesnot.Since readingability
13 Effects ofUniversityCharacteristics and Academic Regulations on Student Persistence,DegreeCompletion, andTimetoDegreeCompletion
8OneonlyneedstocomparethedeclineintheBAandgraduateschoolcoefficientvaluesinTables2andTables3whenmeasuresofreadingabilityareincluded.Intheformercase(column3ofTables2aand2b),itisthemainlanguagegradeofthelastyearinhighschool(self‐reported)whichisincludedwhereasinthelattercase(column13ofTables3aand3b)itistheadministrativePISAreadingtestscore
whichisused.Inclusionoftheself‐reportedmeasureresultsinamodestdeclineintheinfluencesofparentaleducation,whereasinthelattercasethesedropsarequitedramatic.
is a skill derivedover aperiodof time, thisresultis alsoconsistentwiththeearlierworkon this subject by Cameron and Heckman(1998, 2001) and Carneiro and Heckman(2002),all ofwhichpoint totheimportanceof long‐term family factors in determiningsuccess in PSEthroughtheinvestments fami‐liesmake in their children’s early cognitiveandbehaviouraldevelopment.
Other variables that continue to showsomesignificance,althoughina moremixedfashion (menversus women) and indicatinggenerally smaller effects, includesocial sup‐port, which continues to have the curious effect of slightly decreasing university par‐ticipation(men andwomen) and increasingcollegeparticipation in the case ofwomen;parental monitoring,whichhas asmall posi‐tive effect on university attendance for fe‐males; and inconsistent parental discipline,whichhasa small negativeeffectonuniver‐sityparticipationformalesandfemalesalike.
Thegeneral resultspresentedabovearealsoconsistent withthesparseCanadianlit‐eraturewhichattempts toinclude additionalbackground factors in models of access toPSE. In particular, Finnie, Lascelles andSweetman (2005) also find that including avarietyofhighschool gradesandotherback‐groundvariables reducestheinfluenceofpa‐rental educationonaccess(theydonothavea family incomevariable).Theyalsofindthatparental educationisstill animportant influ‐enceafterthesegrades andbackgroundvari‐ables aretakenintoconsideration,especiallyattheuniversitylevel.Ourresultsaresimilar.
OverviewoftheFindingsWhatcanwemake oftheseresultstaken
together? The fact that academic participa‐tionatthehighschoollevel andhigherPISAreadingability results are importantdetermi‐nantsofuniversityeducationseemsobvious.Thelessonhereis that talent,workinghardandbeingresponsible about one’sstudies isimportant. These effects arealsoclearly re‐lated to parental education (especially par‐ents withaBAor above) as thecoefficientsonthesevariables indicatethattheyare lessimportant(direct)determinants ofuniversityparticipationwhen these other backgroundvariablesareaddedtothemodel.
Thetransmissionmechanismfromparentto child, however, cannot be ascertainedfromour estimates.Dohighlyeducatedpar‐ents pushtheirchildrenharder,providethemwith more and/or better developmental in‐puts, or are reading ability and academicwork habits transmitted by some othermechanism?Indeed,isthere a pure(genetic)heritability component to these relation‐ships?Understandingtheserelationships andmechanisms would, of course, be a usefulline for further research,usingthe YITSdataorotherkindsofanalysis.
The generally small and often insignifi‐cant coefficients on theparental behaviourvariables seem to provide some supportingevidence forthekindsofexplanationthatlaybeyondparents simplypushingtheirchildrento do better or providing them with richerdevelopmentalexperiences. Inanycase, ourresults dounderlinetheimportance offamilybackgroundandnaturalskill endowmentsasemphasized by Cameron and Heckman(2001), KeaneandWolpin (2001), andCar‐
MESA‐MeasuringtheEffectivenessofStudentAid14
neiro and Heckman (2002), to name butthreeoftherelevantrecentstudies.
Finally, the models all point toa smaller,butrobust,direct/independenteffectoffam‐ily income on access to PSE, regardless ofwhat other explanatory variables areaddedtothemodel –after theestimatedinfluencedeclinesharplywiththeadditionofthepa‐rental educationvariables. Family income isnot, it seems, just capturing inputs to achild’sdevelopmentor the otherkinds ofin‐fluences whichour fullermodels areabletocontrol for. Again, the precise manner inwhichfamilyincomedirectlyaffectsaccesstoPSEremainsbeyondthescopeofthispaper.
ConclusionsandPolicyImplicationsThis researchhasaddressedhowvarious
backgroundfactors are relatedtocollegeanduniversity inCanada,anda numberofinter‐estingresults have beenfound.Mostimpor‐tant,probably,is thatthatour findings agreewiththeincreasinglycommonresultfoundintheliterature that the impactofparental in‐comeis greatly reducedonce a broader setof explanatory variables are added to themodel. Inour case, thegreatestpart of thedecline occurs when parental education is included.Inotherwords, parental education–andthevarious influencestowhichparen‐tal educationappears toberelated(suchas achild’s reading ability in high school) – andnot parental income is what largely drivesyoung peopletoattendPSE ingeneral, anduniversity in particular. That being said, asmallish “pure” (direct) income effect re‐mains. Our other major findings are as fol‐lows.
First, amajor determinant of universityparticipationistheindividual’s scoreon thereadingportionofthecross‐countryPISAtest– probably our best measure of overall/general “ability,” while also representing aparticularskillset(i.e.,literacy).
Second, overall high school grades, aswell as the threesubject gradesunder con‐sideration, also tend to be positively corre‐lated with university attendance, andmoreweakly, negatively correlated with college attendance (as students with higher gradesevidently shift their PSE participation fromcollegetouniversity). Furthermore, it is theoverall high school grade, rather than anyindividual subjectgrade,whichhas thelarg‐est influence. This is an interesting resultsinceit is oftenassumedthat languageartsandmathematics grades arethe mostimpor‐tantdeterminants ofacademicsuccess. Still,our result makes sense in light of the factthat most students take a general studiesprogramuponenteringuniversity,soitis notsurprisingthata comparablygeneral creden‐tial is themostimportantdeterminantofPSEparticipationatthat level.Theseresults alsomakesensegiventhestructure oftheuniver‐sity and college systemsinCanada; thefor‐mer is moreexclusive,withadmissionbeingbasedonhighschool grades,whilethe latteris generally characterisedby moreopenad‐missionpolicies.
Third, engagement at high school, espe‐cially academic participation, which essen‐tially relatestoanindividual’sworkhabits, isalso a significant determinant of university(but not college) participation. In fact, it isthe most important of all the engagementvariables, althoughself‐efficacy (or afeeling
15 Effects ofUniversityCharacteristics and Academic Regulations on Student Persistence,DegreeCompletion, andTimetoDegreeCompletion
of competenceandconfidenceat school) isalsosignificant.
Fourth, when high school grades, aca‐demicparticipation, or thereadingscoreonthePISAareaddedtothe basicmodel, thedirect effect ofparental education is dimin‐ished,butis farfromeliminated,andremainsan important (independent) determinant ofaccess toPSE,especiallyuniversity.The larg‐est drop in the parental education effectcomes fromtheinclusionofthePISAreadingability score,probablythemostreliableindi‐cator of ability among the backgroundvari‐ables includedinthemodel (many ofwhichareself‐reported).
In other words, parental education ap‐pears to work through these other sets ofvariables (readingability, coursegrades,stu‐dent behaviours, etc.) toinfluence accesstoPSE.We cannot,however,identifyfromtheseestimatesthe precise paththatthisinfluencetakes. It could be the result of highly edu‐cated parents expectingmore of their chil‐dren, teaching their children better workhabits,providingthemwithmore andbetterdevelopmental inputs, shaping their prefer‐ences for PSE and the sorts of careers andlifestyles itentails,oritcouldbedue tosomeotherinputsorothercharacteristicpassedonfrom parent to child which are correlatedwith parental education, but not observednor controlled for in the estimates. Furtherdisentangling these relationships wouldclearly an important avenue for future re‐search.
The policy implications of this researchare notstraightforward.Parentaleducationiscorrelated with other background variablesthat arethemselves importantdeterminantsofPSEparticipation.Itis unrealistictoexpectpolicy tochange theexigentlevelofparentaleducation,althoughpolicycouldinfluenceitslevel fortoday’s youngpeopleforwhentheythemselves areparents.Therefore,theshort‐termpolicy focusmustbeonthefactors towhichparental education isrelated, as wellas theother direct influences on access toPSEidentifiedinourmodels,suchasreadingability, academic participation, and highschoolgrades.
Still, this may not be as simple as itseems.Currentresearchinthis area (Cunha,et al., 2006;CunhaandHeckman, 2007)re‐jects theideathat economicoutcomessuchas access to higher education can be ade‐quately explained usingan additive nature/nurturedichotomy.Rather the acquisitionofskillsis complex andinvolvestheinteractionbetween cognitive, non‐cognitive and envi‐ronmental influences. Furthermore, invest‐ment inskill formationfeeds onpast invest‐ments inthesame.Yetalthoughit is invest‐ments early in life which have the highestrateofreturn, thelackoftheseinvestmentscan(at least inpart)beovercomeby invest‐mentslaterinlife.9
According to Heckman (2000) cognitiveabilities (as measuredby IQ)maypeakearlyinlifeandremainstable after aboutage10,but other abilities such as motivation, self‐
MESA‐MeasuringtheEffectivenessofStudentAid16
9HeckmanandMasterov(2007:6)note:”Gapsincollegeattendanceacrosssocioeconomicgroupsarelargelyshapedbyabilitiesformedintheearlyyears.Gapsinchildabilityacrossfamiliesofdifferentincomelevelsareassociatedwithparentalenvironmentsandparentingpractices.Earlyinterventionscanpartiallyremediatethesedeficits.Laterinterventionsaremuchlesseffective.”Heckman(2007)alsoextensivelydiscussesthisfactorsassociatedwiththisparticipationgapbetweensocioeconomicgroups.
discipline, and social skills canbe enhancedatlaterages.Theseare factors whichmoreorlesscorrespondtothevariables included inthepresentresearchwhicharepositively re‐lated touniversity access. This implies thateventhoseindividualswitha lowprobabilityof PSE participation based on family back‐groundmaybeabletoovercomethisobsta‐cle withthedevelopmentofcomplementaryskills as they move through childhood andintoadolescence.Itis theprocesses bywhichthesecomplementaryskills areacquiredaftertenyears ofage,butbeforethe PSEdecisionis made, that would provide a most usefulavenueof research in the medium‐term, aspolicy makersponder thequestionofbring‐ingtoday’spost‐primaryschoolstudents intoPSE.
And it is perhaps here where new re‐sources need to be principally targeted ifaccess patterns are to be significantlychanged, rather than – for example – con‐tinuing to focus on student financial aid.Adequate student aid is certainly a criticalelement of any access policy, but it is onlyone ofmany,andstudents needtoi)bepre‐paredfor PSE, and ii)wanttogotoPSE be‐fore anyaidpolicy canfacilitate theresultingchoices forenteringthesystem.Anditseemslikely from this research and what othershavebeenreportingoflatethatany gains inthis respectwillhave tofocusonmorefun‐damentalissues,anddevelopments earlierina person’s life, rather than simply provideenoughfinancialsupport at the point aper‐sonmaychoosetoenterthesystem.
17 Effects ofUniversityCharacteristics and Academic Regulations on Student Persistence,DegreeCompletion, andTimetoDegreeCompletion
ReferencesBarr,Nicholas.1993.“Alternative FundingResources forHigherEducation,”1993.TheEconomicJournal
103(418),718‐728.
Cameron,StephenV., andJamesJ.Heckman.1998.“LifeCycle SchoolingandDynamicSelectionBias:Models andEvidenceforFiveCohorts ofAmericanMales,”JournalofPoliticalEconomy 106(2),262‐333.
Cameron,StephenV.,andJames J.Heckman.2001.“TheDynamicsofEducationalAttainmentforBlack,Hispanic,andWhiteMales,JournalofPoliticalEconomy109(3),455‐99.
Carneiro, Pablo, andJamesJ.Heckman. 2002.“TheEvidenceonCredit ConstraintsinPost‐SecondarySchooling,”TheEconomicJournal112(482),705‐34.
Chapman, Bruce. 1997. “Conceptual Issues and the AustralianExperience with IncomeContingentChargesforHigherEducation,”TheEconomicJournal107(442),738‐51.
Christophides,LouisN.,JimCirello,andMichael Hoy.2001.“FamilyIncome andPost‐SecondaryEduca‐tioninCanada,”CanadianJournalofHigherEducation,31(1),177‐208.
Coelli,Michael.2005.“Tuition,RationingandInequality in Post‐SecondaryEducationAttendance,”Uni‐versityofBritishColumbiaWorkingPaper.
Corak,Miles,GarthLipps, andJohnZhao.2003. “Family IncomeandParticipationinPost‐SecondaryEducation,”StatisticsCanada,AnalyticalStudies,ResearchPaperNo.210.
Cunha,Flavio,James J.Heckman,LanceLochner,andDimitriyV.Masterov.2006.“InterpretingEvidenceofLife Cycle Skill Formation,”inHandbookoftheEconomics ofEducation,Vol.1.Ed.EricA.Ha‐nushekandFinisWelch.NewYork:Elsevier,697‐812.
Cunha,Flavio,andJames J.Heckman.2007.“TheTechnology ofSkill Formation,”AmericanEconomicReview,PapersandProceedings97(2),31‐47.
Drolet,Marie.2005.“ParticipationinPost‐secondaryEducationinCanada:HastheRoleofParental In‐comeandEducationChangedoverthe1990s?”Statistics Canada,Analytical StudiesBranchRe‐searchPaperSeriesNo.243.
Ermisch,John,andMarcoFrancesconi.2001.“FamilyMatters:Impacts ofFamilyBackgroundonEduca‐tionalAttainments,”Economica68(270),137‐56.
Finnie,Ross,EricLascelles,andArthurSweetman.2005.“WhoGoes?TheDirectandIndirectEffects ofFamily BackgroundonAccess toPostsecondary Education,” in Higher Education in Canada.Ed.Beach,CharlesM.,RobinW. Boadway, andR.Marvin McInnis.Montreal andKingston:McGill‐Queen’sUniversityPress,295‐338.
Finnie,Ross,andRonaldMeng.2005.“LiteracyandLabourMarketOutcomes:Self‐assessmentversusTestScoreMeasures,”AppliedEconomics37(17),1935‐51.
Frenette,Marc.2005. “TheImpactofTuitionFees onUniversityAccess:Evidencefroma Large‐scalePriceDeregulationinProfessional Programs,”StatisticsCanada,Analytical Studies ResearchPaperSeriesNo.263.
MESA‐MeasuringtheEffectivenessofStudentAid18
Frenette,Marc. 2007. “Why areYouthfromLower‐incomeFamilies LessLikely toAttendUniversity?EvidencefromAcademic Abilities,Parental Influences, andFinancial Constraints”Statistics Can‐ada,AnalyticalStudiesResearchPaperSeriesNo.295.
Heckman,JamesJ.2000.“PoliciestoFosterHumanCapital,”ResearchinEconomics54(1),3‐56.
Heckman,JamesJ.2007.“TheEconomics,TechnologyandNeuroscience ofHumanCapability Forma‐tion,”NBERWorkingPaperNo.13195.
Heckman,JamesJ.,andDimitryV.Masterov.2007.“TheProductivityArgument forInvestinginYoungChildren,”NBERWorkingPaperNo.13016.
Junor,Sean,andAlexUsher.2004.ThePriceofKnowledge2004:Access andStudentFinanceinCan‐ada.Montreal:TheCanadianMillenniumScholarshipFoundation.
Keane,Michael P.2002.“Financial Aid,BorrowingConstraints,andCollege Attendance:EvidencefromStructuralEstimates,”AmericanEconomicReview,PapersandProceedings92(2),293‐7.
Keane,Michael P.,andKennethI.Wolpin.2001.“The EffectofParentalTransfers andBorrowingCon‐straintsonEducationAttainment,”InternationalEconomicReview42(4),1051‐1103.
Murray,Charles.2002.“IQandIncomeInequalityinaSampleofSiblingPairs fromAdvantagedFamilyBackgrounds,”AmericanEconomicReview,PapersandProceedings92(2),339‐43.
Plug,Erik,andWimVijverberg.2003.“Schooling,FamilyBackground,andAdoption:IsitNatureorisitNurture?”JournalofPoliticalEconomy111(3),611‐41.
Restuccia,Diego,andCarlosUrrutia.2004.“Intergenerational PersistenceinEarnings:TheRoleofEarlyandCollegeEducation,”AmericanEconomicReview94(5),1354‐78.
Sacerdote,Bruce.2002.“TheNatureandNurtureofEconomicOutcomes,”AmericanEconomicReview,PapersandProceedings92(2),344‐48.
19 Effects ofUniversityCharacteristics and Academic Regulations on Student Persistence,DegreeCompletion, andTimetoDegreeCompletion
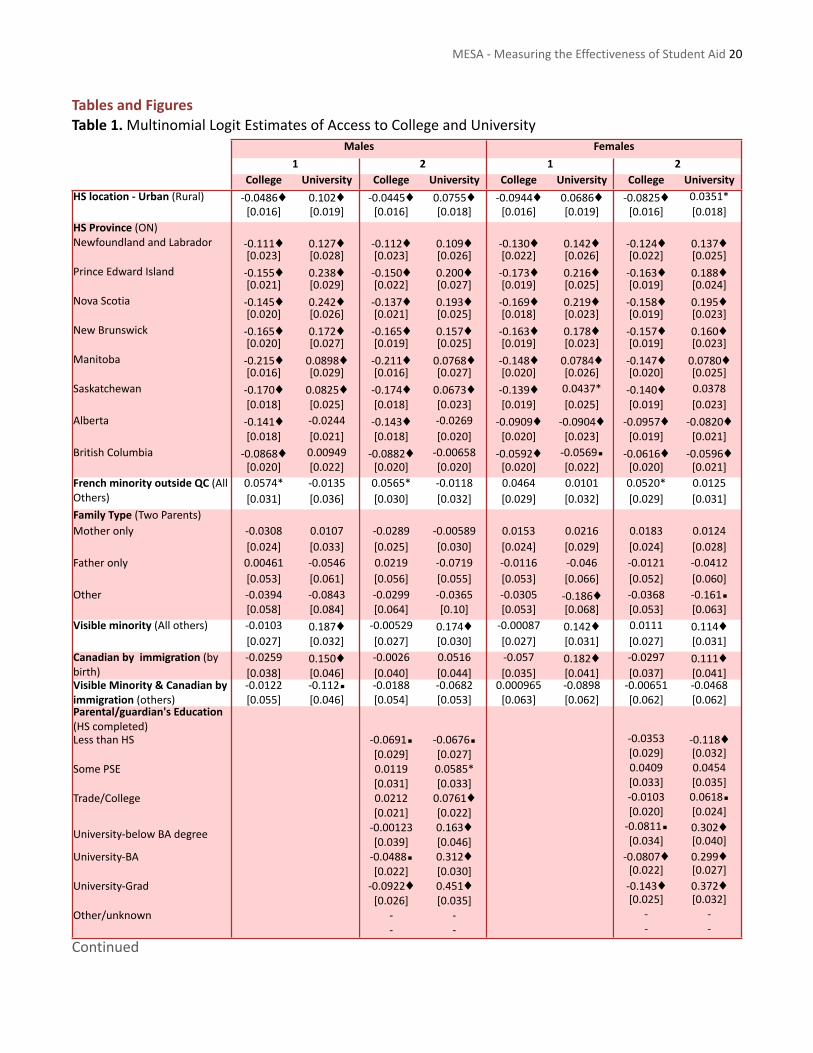
TablesandFiguresTable1.MultinomialLogitEstimatesofAccesstoCollegeandUniversity
Males Females
1 2 1 2 College University College University College University College UniversityHSlocation‐Urban(Rural) ‐0.0486♦ 0.102♦ ‐0.0445♦ 0.0755♦ ‐0.0944♦ 0.0686♦ ‐0.0825♦ 0.0351*
[0.016] [0.019] [0.016] [0.018] [0.016] [0.019] [0.016] [0.018]HSProvince(ON)NewfoundlandandLabrador ‐0.111♦ 0.127♦ ‐0.112♦ 0.109♦ ‐0.130♦ 0.142♦ ‐0.124♦ 0.137♦
[0.023] [0.028] [0.023] [0.026] [0.022] [0.026] [0.022] [0.025]PrinceEdwardIsland ‐0.155♦ 0.238♦ ‐0.150♦ 0.200♦ ‐0.173♦ 0.216♦ ‐0.163♦ 0.188♦
[0.021] [0.029] [0.022] [0.027] [0.019] [0.025] [0.019] [0.024]NovaScotia ‐0.145♦ 0.242♦ ‐0.137♦ 0.193♦ ‐0.169♦ 0.219♦ ‐0.158♦ 0.195♦
[0.020] [0.026] [0.021] [0.025] [0.018] [0.023] [0.019] [0.023]NewBrunswick ‐0.165♦ 0.172♦ ‐0.165♦ 0.157♦ ‐0.163♦ 0.178♦ ‐0.157♦ 0.160♦
[0.020] [0.027] [0.019] [0.025] [0.019] [0.023] [0.019] [0.023]Manitoba ‐0.215♦ 0.0898♦ ‐0.211♦ 0.0768♦ ‐0.148♦ 0.0784♦ ‐0.147♦ 0.0780♦
[0.016] [0.029] [0.016] [0.027] [0.020] [0.026] [0.020] [0.025]Saskatchewan ‐0.170♦ 0.0825♦ ‐0.174♦ 0.0673♦ ‐0.139♦ 0.0437* ‐0.140♦ 0.0378
[0.018] [0.025] [0.018] [0.023] [0.019] [0.025] [0.019] [0.023]Alberta ‐0.141♦ ‐0.0244 ‐0.143♦ ‐0.0269 ‐0.0909♦ ‐0.0904♦ ‐0.0957♦ ‐0.0820♦
[0.018] [0.021] [0.018] [0.020] [0.020] [0.023] [0.019] [0.021]BritishColumbia ‐0.0868♦ 0.00949 ‐0.0882♦ ‐0.00658 ‐0.0592♦ ‐0.0569◾ ‐0.0616♦ ‐0.0596♦
[0.020] [0.022] [0.020] [0.020] [0.020] [0.022] [0.020] [0.021]FrenchminorityoutsideQC(AllOthers)
0.0574* ‐0.0135 0.0565* ‐0.0118 0.0464 0.0101 0.0520* 0.0125[0.031] [0.036] [0.030] [0.032] [0.029] [0.032] [0.029] [0.031]
FamilyType(TwoParents)Motheronly ‐0.0308 0.0107 ‐0.0289 ‐0.00589 0.0153 0.0216 0.0183 0.0124
[0.024] [0.033] [0.025] [0.030] [0.024] [0.029] [0.024] [0.028]Fatheronly 0.00461 ‐0.0546 0.0219 ‐0.0719 ‐0.0116 ‐0.046 ‐0.0121 ‐0.0412
[0.053] [0.061] [0.056] [0.055] [0.053] [0.066] [0.052] [0.060]Other ‐0.0394 ‐0.0843 ‐0.0299 ‐0.0365 ‐0.0305 ‐0.186♦ ‐0.0368 ‐0.161◾
[0.058] [0.084] [0.064] [0.10] [0.053] [0.068] [0.053] [0.063]Visibleminority(Allothers) ‐0.0103 0.187♦ ‐0.00529 0.174♦ ‐0.00087 0.142♦ 0.0111 0.114♦
[0.027] [0.032] [0.027] [0.030] [0.027] [0.031] [0.027] [0.031]Canadianbyimmigration(bybirth)
‐0.0259 0.150♦ ‐0.0026 0.0516 ‐0.057 0.182♦ ‐0.0297 0.111♦[0.038] [0.046] [0.040] [0.044] [0.035] [0.041] [0.037] [0.041]
VisibleMinority&Canadianbyimmigration(others)
‐0.0122 ‐0.112◾ ‐0.0188 ‐0.0682 0.000965 ‐0.0898 ‐0.00651 ‐0.0468[0.055] [0.046] [0.054] [0.053] [0.063] [0.062] [0.062] [0.062]
Parental/guardian'sEducation(HScompleted)LessthanHS ‐0.0691◾ ‐0.0676◾ ‐0.0353 ‐0.118♦
[0.029] [0.027] [0.029] [0.032]SomePSE 0.0119 0.0585* 0.0409 0.0454
[0.031] [0.033] [0.033] [0.035]Trade/College 0.0212 0.0761♦ ‐0.0103 0.0618◾
[0.021] [0.022] [0.020] [0.024]
University‐belowBAdegree ‐0.00123 0.163♦ ‐0.0811◾ 0.302♦[0.039] [0.046] [0.034] [0.040]
University‐BA ‐0.0488◾ 0.312♦ ‐0.0807♦ 0.299♦[0.022] [0.030] [0.022] [0.027]
University‐Grad ‐0.0922♦ 0.451♦ ‐0.143♦ 0.372♦[0.026] [0.035] [0.025] [0.032]
Other/unknown ‐ ‐ ‐ ‐‐ ‐ ‐ ‐
Continued
MESA‐MeasuringtheEffectivenessofStudentAid20
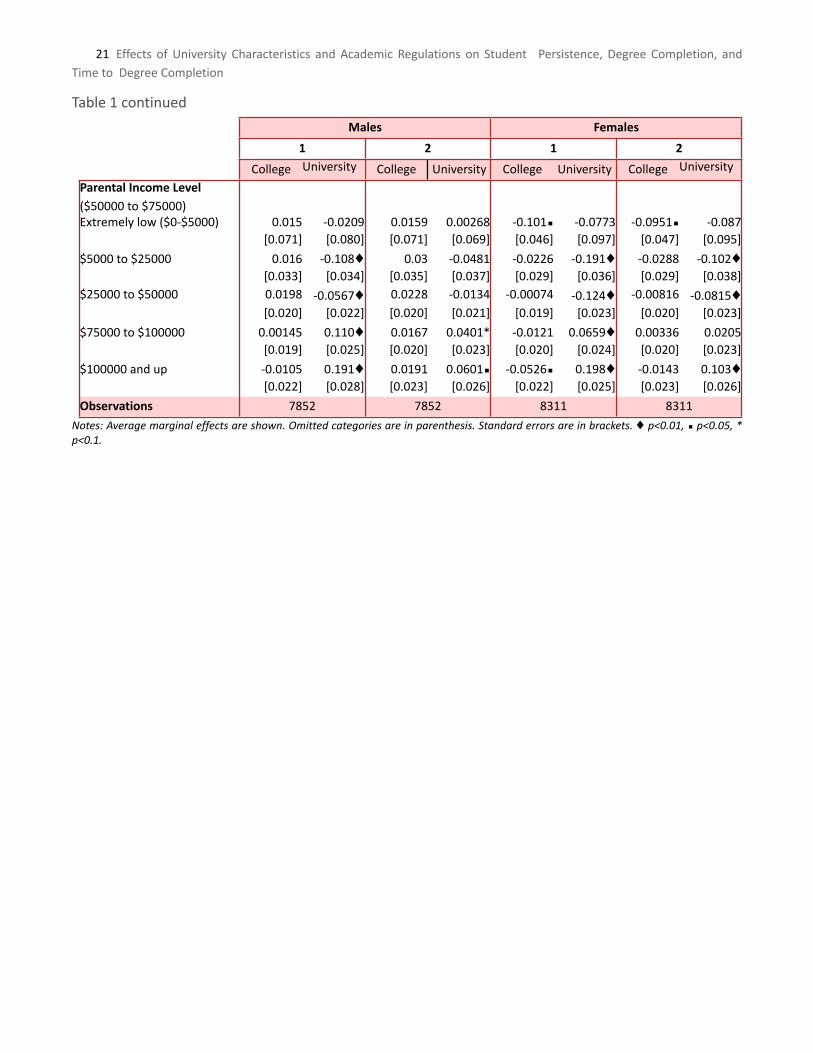
Table1continued
Males Females
1 2 1 2
College University College University College University College University
ParentalIncomeLevel($50000to$75000)Extremelylow($0‐$5000) 0.015 ‐0.0209 0.0159 0.00268 ‐0.101◾ ‐0.0773 ‐0.0951◾ ‐0.087
[0.071] [0.080] [0.071] [0.069] [0.046] [0.097] [0.047] [0.095]
$5000to$25000 0.016 ‐0.108♦ 0.03 ‐0.0481 ‐0.0226 ‐0.191♦ ‐0.0288 ‐0.102♦[0.033] [0.034] [0.035] [0.037] [0.029] [0.036] [0.029] [0.038]
$25000to$50000 0.0198 ‐0.0567♦ 0.0228 ‐0.0134 ‐0.00074 ‐0.124♦ ‐0.00816 ‐0.0815♦[0.020] [0.022] [0.020] [0.021] [0.019] [0.023] [0.020] [0.023]
$75000to$100000 0.00145 0.110♦ 0.0167 0.0401* ‐0.0121 0.0659♦ 0.00336 0.0205[0.019] [0.025] [0.020] [0.023] [0.020] [0.024] [0.020] [0.023]
$100000andup ‐0.0105 0.191♦ 0.0191 0.0601◾ ‐0.0526◾ 0.198♦ ‐0.0143 0.103♦[0.022] [0.028] [0.023] [0.026] [0.022] [0.025] [0.023] [0.026]
Observations 7852 7852 8311 8311
Notes:Averagemarginaleffectsareshown.Omittedcategoriesareinparenthesis.Standarderrorsareinbrackets.♦p<0.01,◾p<0.05,*p<0.1.
21 Effects ofUniversityCharacteristics and Academic Regulations on Student Persistence,DegreeCompletion, andTimetoDegreeCompletion
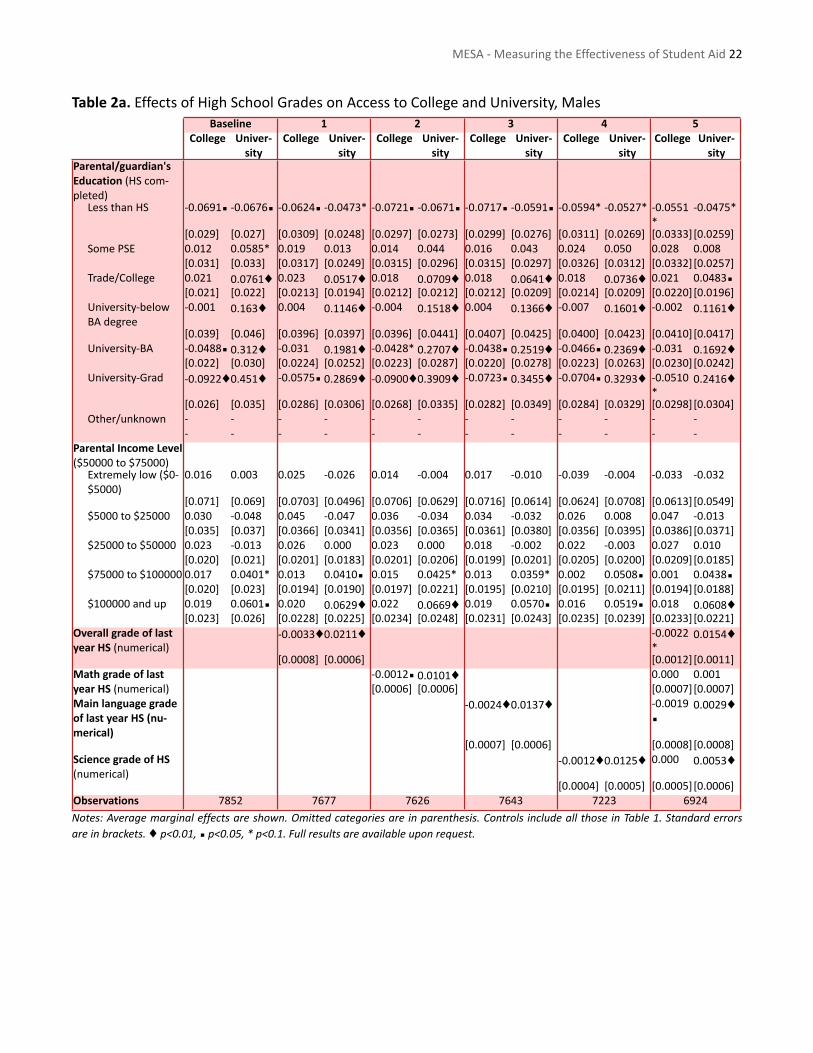
Table2a.EffectsofHighSchoolGradesonAccesstoCollegeandUniversity,MalesBaseline 1 2 3 4 5
College Univer‐sity
College Univer‐sity
College Univer‐sity
College Univer‐sity
College Univer‐sity
College Univer‐sity
Parental/guardian'sEducation(HScom‐pleted)
LessthanHS ‐0.0691◾ ‐0.0676◾ ‐0.0624◾ ‐0.0473* ‐0.0721◾ ‐0.0671◾ ‐0.0717◾ ‐0.0591◾ ‐0.0594* ‐0.0527* ‐0.0551*
‐0.0475*
[0.029] [0.027] [0.0309] [0.0248] [0.0297] [0.0273] [0.0299] [0.0276] [0.0311] [0.0269] [0.0333][0.0259]SomePSE 0.012 0.0585* 0.019 0.013 0.014 0.044 0.016 0.043 0.024 0.050 0.028 0.008
[0.031] [0.033] [0.0317] [0.0249] [0.0315] [0.0296] [0.0315] [0.0297] [0.0326] [0.0312] [0.0332][0.0257]Trade/College 0.021 0.0761♦ 0.023 0.0517♦ 0.018 0.0709♦ 0.018 0.0641♦ 0.018 0.0736♦ 0.021 0.0483◾
[0.021] [0.022] [0.0213] [0.0194] [0.0212] [0.0212] [0.0212] [0.0209] [0.0214] [0.0209] [0.0220][0.0196]University‐belowBAdegree
‐0.001 0.163♦ 0.004 0.1146♦ ‐0.004 0.1518♦ 0.004 0.1366♦ ‐0.007 0.1601♦ ‐0.002 0.1161♦
[0.039] [0.046] [0.0396] [0.0397] [0.0396] [0.0441] [0.0407] [0.0425] [0.0400] [0.0423] [0.0410][0.0417]University‐BA ‐0.0488◾ 0.312♦ ‐0.031 0.1981♦ ‐0.0428* 0.2707♦ ‐0.0438◾ 0.2519♦ ‐0.0466◾ 0.2369♦ ‐0.031 0.1692♦
[0.022] [0.030] [0.0224] [0.0252] [0.0223] [0.0287] [0.0220] [0.0278] [0.0223] [0.0263] [0.0230][0.0242]University‐Grad ‐0.0922♦0.451♦ ‐0.0575◾ 0.2869♦ ‐0.0900♦0.3909♦ ‐0.0723◾ 0.3455♦ ‐0.0704◾ 0.3293♦ ‐0.0510
*0.2416♦
[0.026] [0.035] [0.0286] [0.0306] [0.0268] [0.0335] [0.0282] [0.0349] [0.0284] [0.0329] [0.0298][0.0304]Other/unknown ‐ ‐ ‐ ‐ ‐ ‐ ‐ ‐ ‐ ‐ ‐ ‐
‐ ‐ ‐ ‐ ‐ ‐ ‐ ‐ ‐ ‐ ‐ ‐ParentalIncomeLevel($50000to$75000)
Extremelylow($0‐$5000)
0.016 0.003 0.025 ‐0.026 0.014 ‐0.004 0.017 ‐0.010 ‐0.039 ‐0.004 ‐0.033 ‐0.032
[0.071] [0.069] [0.0703] [0.0496] [0.0706] [0.0629] [0.0716] [0.0614] [0.0624] [0.0708] [0.0613][0.0549]$5000to$25000 0.030 ‐0.048 0.045 ‐0.047 0.036 ‐0.034 0.034 ‐0.032 0.026 0.008 0.047 ‐0.013
[0.035] [0.037] [0.0366] [0.0341] [0.0356] [0.0365] [0.0361] [0.0380] [0.0356] [0.0395] [0.0386][0.0371]$25000to$50000 0.023 ‐0.013 0.026 0.000 0.023 0.000 0.018 ‐0.002 0.022 ‐0.003 0.027 0.010
[0.020] [0.021] [0.0201] [0.0183] [0.0201] [0.0206] [0.0199] [0.0201] [0.0205] [0.0200] [0.0209][0.0185]$75000to$100000 0.017 0.0401* 0.013 0.0410◾ 0.015 0.0425* 0.013 0.0359* 0.002 0.0508◾ 0.001 0.0438◾
[0.020] [0.023] [0.0194] [0.0190] [0.0197] [0.0221] [0.0195] [0.0210] [0.0195] [0.0211] [0.0194][0.0188]$100000andup 0.019 0.0601◾ 0.020 0.0629♦ 0.022 0.0669♦ 0.019 0.0570◾ 0.016 0.0519◾ 0.018 0.0608♦
[0.023] [0.026] [0.0228] [0.0225] [0.0234] [0.0248] [0.0231] [0.0243] [0.0235] [0.0239] [0.0233][0.0221]OverallgradeoflastyearHS(numerical)
‐0.0033♦0.0211♦ ‐0.0022*
0.0154♦
[0.0008] [0.0006] [0.0012][0.0011]MathgradeoflastyearHS(numerical)
‐0.0012◾ 0.0101♦ 0.000 0.001[0.0006] [0.0006] [0.0007][0.0007]
MainlanguagegradeoflastyearHS(nu‐merical)
‐0.0024♦0.0137♦ ‐0.0019◾
0.0029♦
[0.0007] [0.0006] [0.0008][0.0008]SciencegradeofHS(numerical)
‐0.0012♦0.0125♦ 0.000 0.0053♦
[0.0004] [0.0005] [0.0005][0.0006]Observations 7852 7677 7626 7643 7223 6924
Notes: Averagemarginaleffectsare shown.Omittedcategoriesareinparenthesis. Controlsincludeallthose inTable1. Standarderrorsareinbrackets.♦p<0.01,◾p<0.05,*p<0.1.Fullresultsareavailableuponrequest.
MESA‐MeasuringtheEffectivenessofStudentAid22
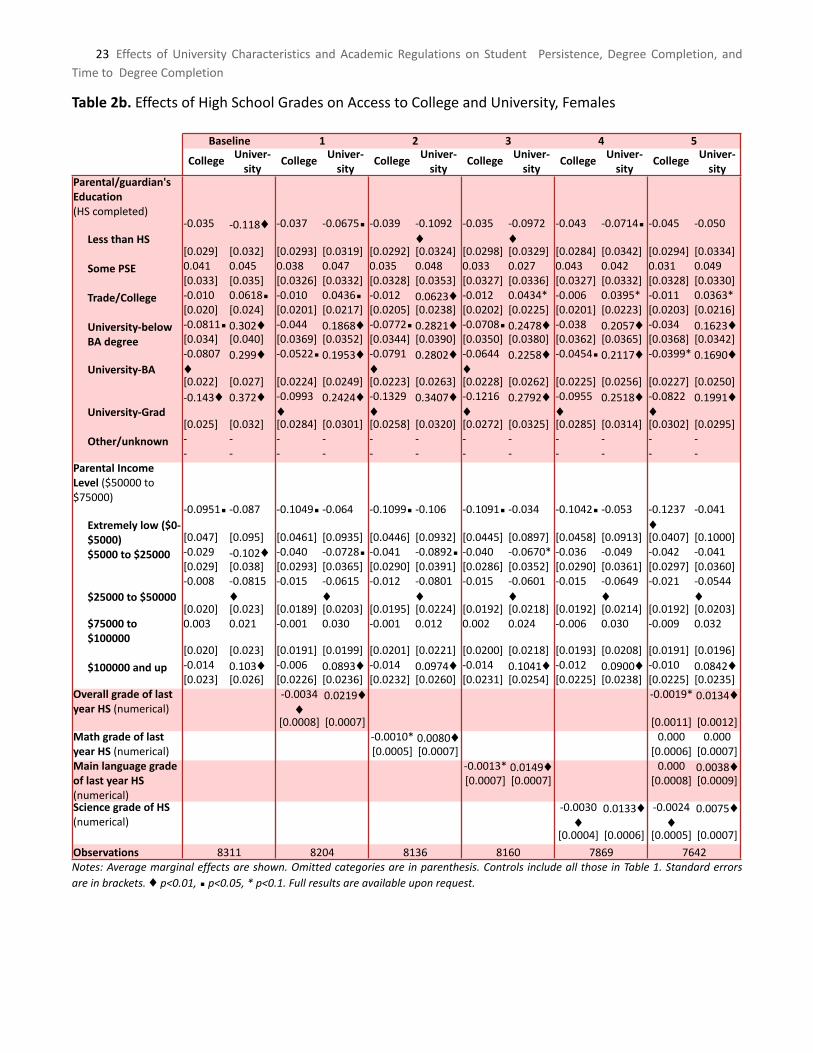
Table2b.EffectsofHighSchoolGradesonAccesstoCollegeandUniversity,Females
Baseline 1 2 3 4 5
College Univer‐sity
College Univer‐sity
College Univer‐sity
College Univer‐sity
College Univer‐sity
College Univer‐sity
Parental/guardian'sEducation(HScompleted)
LessthanHS‐0.035 ‐0.118♦ ‐0.037 ‐0.0675◾ ‐0.039 ‐0.1092
♦
‐0.035 ‐0.0972♦
‐0.043 ‐0.0714◾ ‐0.045 ‐0.050
[0.029] [0.032] [0.0293] [0.0319] [0.0292] [0.0324] [0.0298] [0.0329] [0.0284] [0.0342] [0.0294] [0.0334]
SomePSE 0.041 0.045 0.038 0.047 0.035 0.048 0.033 0.027 0.043 0.042 0.031 0.049[0.033] [0.035] [0.0326] [0.0332] [0.0328] [0.0353] [0.0327] [0.0336] [0.0327] [0.0332] [0.0328] [0.0330]
Trade/College ‐0.010 0.0618◾ ‐0.010 0.0436◾ ‐0.012 0.0623♦ ‐0.012 0.0434* ‐0.006 0.0395* ‐0.011 0.0363*[0.020] [0.024] [0.0201] [0.0217] [0.0205] [0.0238] [0.0202] [0.0225] [0.0201] [0.0223] [0.0203] [0.0216]
University‐belowBAdegree
‐0.0811◾ 0.302♦ ‐0.044 0.1868♦ ‐0.0772◾ 0.2821♦ ‐0.0708◾ 0.2478♦ ‐0.038 0.2057♦ ‐0.034 0.1623♦[0.034] [0.040] [0.0369] [0.0352] [0.0344] [0.0390] [0.0350] [0.0380] [0.0362] [0.0365] [0.0368] [0.0342]
University‐BA‐0.0807♦
0.299♦ ‐0.0522◾ 0.1953♦ ‐0.0791♦
0.2802♦ ‐0.0644♦
0.2258♦ ‐0.0454◾ 0.2117♦ ‐0.0399* 0.1690♦
[0.022] [0.027] [0.0224] [0.0249] [0.0223] [0.0263] [0.0228] [0.0262] [0.0225] [0.0256] [0.0227] [0.0250]
University‐Grad‐0.143♦ 0.372♦ ‐0.0993
♦0.2424♦ ‐0.1329
♦0.3407♦ ‐0.1216
♦0.2792♦ ‐0.0955
♦0.2518♦ ‐0.0822
♦0.1991♦
[0.025] [0.032] [0.0284] [0.0301] [0.0258] [0.0320] [0.0272] [0.0325] [0.0285] [0.0314] [0.0302] [0.0295]
Other/unknown ‐ ‐ ‐ ‐ ‐ ‐ ‐ ‐ ‐ ‐ ‐ ‐‐ ‐ ‐ ‐ ‐ ‐ ‐ ‐ ‐ ‐ ‐ ‐
ParentalIncomeLevel($50000to$75000)
Extremelylow($0‐$5000)
‐0.0951◾ ‐0.087 ‐0.1049◾ ‐0.064 ‐0.1099◾ ‐0.106 ‐0.1091◾ ‐0.034 ‐0.1042◾ ‐0.053 ‐0.1237♦
‐0.041
[0.047] [0.095] [0.0461] [0.0935] [0.0446] [0.0932] [0.0445] [0.0897] [0.0458] [0.0913] [0.0407] [0.1000]
$5000to$25000 ‐0.029 ‐0.102♦ ‐0.040 ‐0.0728◾ ‐0.041 ‐0.0892◾ ‐0.040 ‐0.0670* ‐0.036 ‐0.049 ‐0.042 ‐0.041[0.029] [0.038] [0.0293] [0.0365] [0.0290] [0.0391] [0.0286] [0.0352] [0.0290] [0.0361] [0.0297] [0.0360]
$25000to$50000‐0.008 ‐0.0815
♦
‐0.015 ‐0.0615♦
‐0.012 ‐0.0801♦
‐0.015 ‐0.0601♦
‐0.015 ‐0.0649♦
‐0.021 ‐0.0544♦
[0.020] [0.023] [0.0189] [0.0203] [0.0195] [0.0224] [0.0192] [0.0218] [0.0192] [0.0214] [0.0192] [0.0203]$75000to$100000
0.003 0.021 ‐0.001 0.030 ‐0.001 0.012 0.002 0.024 ‐0.006 0.030 ‐0.009 0.032
[0.020] [0.023] [0.0191] [0.0199] [0.0201] [0.0221] [0.0200] [0.0218] [0.0193] [0.0208] [0.0191] [0.0196]
$100000andup ‐0.014 0.103♦ ‐0.006 0.0893♦ ‐0.014 0.0974♦ ‐0.014 0.1041♦ ‐0.012 0.0900♦ ‐0.010 0.0842♦[0.023] [0.026] [0.0226] [0.0236] [0.0232] [0.0260] [0.0231] [0.0254] [0.0225] [0.0238] [0.0225] [0.0235]
OverallgradeoflastyearHS(numerical)
‐0.0034♦
0.0219♦ ‐0.0019* 0.0134♦
[0.0008] [0.0007] [0.0011] [0.0012]MathgradeoflastyearHS(numerical)
‐0.0010* 0.0080♦ 0.000 0.000[0.0005] [0.0007] [0.0006] [0.0007]
MainlanguagegradeoflastyearHS(numerical)
‐0.0013* 0.0149♦ 0.000 0.0038♦[0.0007] [0.0007] [0.0008] [0.0009]
SciencegradeofHS(numerical)
‐0.0030♦
0.0133♦ ‐0.0024♦
0.0075♦
[0.0004] [0.0006] [0.0005] [0.0007]
Observations 8311 8204 8136 8160 7869 7642Notes: Averagemarginaleffectsare shown.Omittedcategoriesareinparenthesis. Controlsincludeallthose inTable1. Standarderrorsareinbrackets.♦p<0.01,◾p<0.05,*p<0.1.Fullresultsareavailableuponrequest.
23 Effects ofUniversityCharacteristics and Academic Regulations on Student Persistence,DegreeCompletion, andTimetoDegreeCompletion
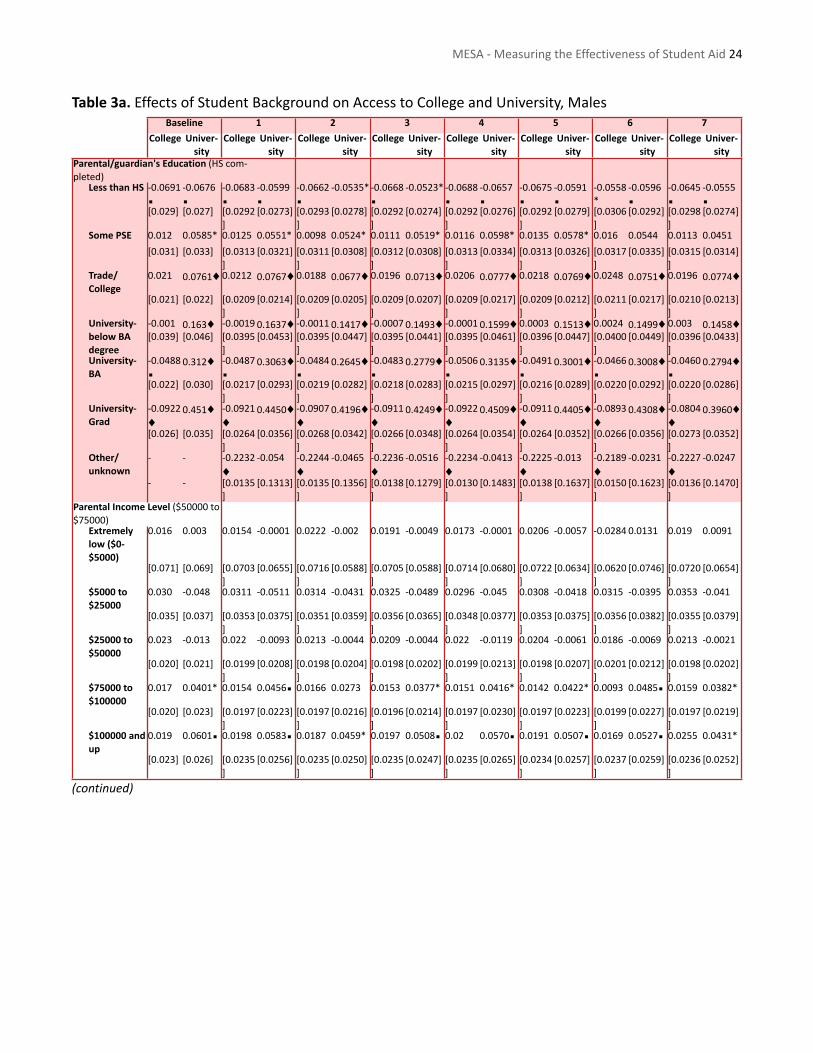
Table3a.EffectsofStudentBackgroundonAccesstoCollegeandUniversity,MalesBaseline 1 2 3 4 5 6 7
College Univer‐sity
College Univer‐sity
College Univer‐sity
College Univer‐sity
College Univer‐sity
College Univer‐sity
College Univer‐sity
College Univer‐sity
Parental/guardian'sEducation(HScom‐pleted)
LessthanHS ‐0.0691◾
‐0.0676◾
‐0.0683◾
‐0.0599◾
‐0.0662◾
‐0.0535* ‐0.0668◾
‐0.0523* ‐0.0688◾
‐0.0657◾
‐0.0675◾
‐0.0591◾
‐0.0558*
‐0.0596◾
‐0.0645◾
‐0.0555◾
[0.029] [0.027] [0.0292]
[0.0273] [0.0293]
[0.0278] [0.0292]
[0.0274] [0.0292]
[0.0276] [0.0292]
[0.0279] [0.0306]
[0.0292] [0.0298]
[0.0274]
SomePSE 0.012 0.0585* 0.0125 0.0551* 0.0098 0.0524* 0.0111 0.0519* 0.0116 0.0598* 0.0135 0.0578* 0.016 0.0544 0.0113 0.0451
[0.031] [0.033] [0.0313]
[0.0321] [0.0311]
[0.0308] [0.0312]
[0.0308] [0.0313]
[0.0334] [0.0313]
[0.0326] [0.0317]
[0.0335] [0.0315]
[0.0314]
Trade/College
0.021 0.0761♦ 0.0212 0.0767♦ 0.0188 0.0677♦ 0.0196 0.0713♦ 0.0206 0.0777♦ 0.0218 0.0769♦ 0.0248 0.0751♦ 0.0196 0.0774♦
[0.021] [0.022] [0.0209]
[0.0214] [0.0209]
[0.0205] [0.0209]
[0.0207] [0.0209]
[0.0217] [0.0209]
[0.0212] [0.0211]
[0.0217] [0.0210]
[0.0213]
University‐belowBAdegree
‐0.001 0.163♦ ‐0.0019 0.1637♦ ‐0.0011 0.1417♦ ‐0.0007 0.1493♦ ‐0.0001 0.1599♦ 0.0003 0.1513♦ 0.0024 0.1499♦ 0.003 0.1458♦[0.039] [0.046] [0.0395
][0.0453] [0.0395
][0.0447] [0.0395
][0.0441] [0.0395
][0.0461] [0.0396
][0.0447] [0.0400
][0.0449] [0.0396
][0.0433]
University‐BA
‐0.0488◾
0.312♦ ‐0.0487◾
0.3063♦ ‐0.0484◾
0.2645♦ ‐0.0483◾
0.2779♦ ‐0.0506◾
0.3135♦ ‐0.0491◾
0.3001♦ ‐0.0466◾
0.3008♦ ‐0.0460◾
0.2794♦
[0.022] [0.030] [0.0217]
[0.0293] [0.0219]
[0.0282] [0.0218]
[0.0283] [0.0215]
[0.0297] [0.0216]
[0.0289] [0.0220]
[0.0292] [0.0220]
[0.0286]
University‐Grad
‐0.0922♦
0.451♦ ‐0.0921♦
0.4450♦ ‐0.0907♦
0.4196♦ ‐0.0911♦
0.4249♦ ‐0.0922♦
0.4509♦ ‐0.0911♦
0.4405♦ ‐0.0893♦
0.4308♦ ‐0.0804♦
0.3960♦
[0.026] [0.035] [0.0264]
[0.0356] [0.0268]
[0.0342] [0.0266]
[0.0348] [0.0264]
[0.0354] [0.0264]
[0.0352] [0.0266]
[0.0356] [0.0273]
[0.0352]
Other/unknown
‐ ‐ ‐0.2232♦
‐0.054 ‐0.2244♦
‐0.0465 ‐0.2236♦
‐0.0516 ‐0.2234♦
‐0.0413 ‐0.2225♦
‐0.013 ‐0.2189♦
‐0.0231 ‐0.2227♦
‐0.0247
‐ ‐ [0.0135]
[0.1313] [0.0135]
[0.1356] [0.0138]
[0.1279] [0.0130]
[0.1483] [0.0138]
[0.1637] [0.0150]
[0.1623] [0.0136]
[0.1470]
ParentalIncomeLevel($50000to$75000)
Extremelylow($0‐$5000)
0.016 0.003 0.0154 ‐0.0001 0.0222 ‐0.002 0.0191 ‐0.0049 0.0173 ‐0.0001 0.0206 ‐0.0057 ‐0.0284 0.0131 0.019 0.0091
[0.071] [0.069] [0.0703]
[0.0655] [0.0716]
[0.0588] [0.0705]
[0.0588] [0.0714]
[0.0680] [0.0722]
[0.0634] [0.0620]
[0.0746] [0.0720]
[0.0654]
$5000to$25000
0.030 ‐0.048 0.0311 ‐0.0511 0.0314 ‐0.0431 0.0325 ‐0.0489 0.0296 ‐0.045 0.0308 ‐0.0418 0.0315 ‐0.0395 0.0353 ‐0.041
[0.035] [0.037] [0.0353]
[0.0375] [0.0351]
[0.0359] [0.0356]
[0.0365] [0.0348]
[0.0377] [0.0353]
[0.0375] [0.0356]
[0.0382] [0.0355]
[0.0379]
$25000to$50000
0.023 ‐0.013 0.022 ‐0.0093 0.0213 ‐0.0044 0.0209 ‐0.0044 0.022 ‐0.0119 0.0204 ‐0.0061 0.0186 ‐0.0069 0.0213 ‐0.0021
[0.020] [0.021] [0.0199]
[0.0208] [0.0198]
[0.0204] [0.0198]
[0.0202] [0.0199]
[0.0213] [0.0198]
[0.0207] [0.0201]
[0.0212] [0.0198]
[0.0202]
$75000to$100000
0.017 0.0401* 0.0154 0.0456◾ 0.0166 0.0273 0.0153 0.0377* 0.0151 0.0416* 0.0142 0.0422* 0.0093 0.0485◾ 0.0159 0.0382*
[0.020] [0.023] [0.0197]
[0.0223] [0.0197]
[0.0216] [0.0196]
[0.0214] [0.0197]
[0.0230] [0.0197]
[0.0223] [0.0199]
[0.0227] [0.0197]
[0.0219]
$100000andup
0.019 0.0601◾ 0.0198 0.0583◾ 0.0187 0.0459* 0.0197 0.0508◾ 0.02 0.0570◾ 0.0191 0.0507◾ 0.0169 0.0527◾ 0.0255 0.0431*
[0.023] [0.026] [0.0235]
[0.0256] [0.0235]
[0.0250] [0.0235]
[0.0247] [0.0235]
[0.0265] [0.0234]
[0.0257] [0.0237]
[0.0259] [0.0236]
[0.0252]
(continued)
MESA‐MeasuringtheEffectivenessofStudentAid24
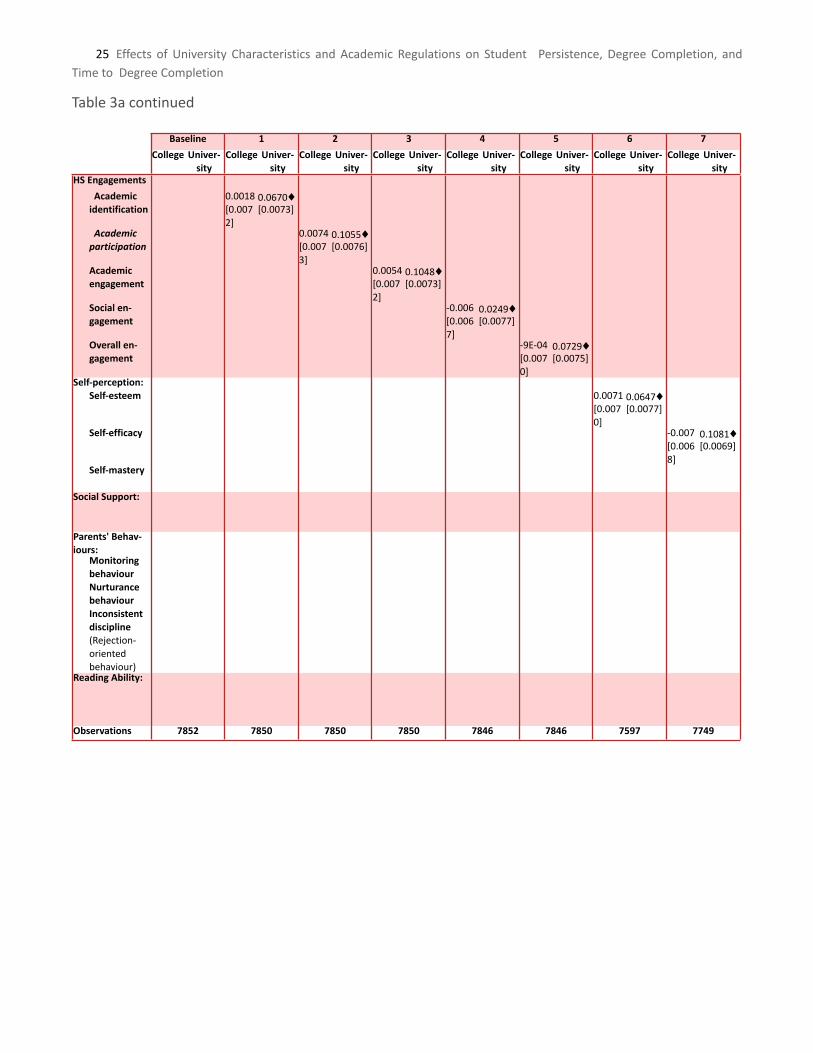
Table3acontinued
Baseline 1 2 3 4 5 6 7
College Univer‐sity
College Univer‐sity
College Univer‐sity
College Univer‐sity
College Univer‐sity
College Univer‐sity
College Univer‐sity
College Univer‐sity
HSEngagements
Academicidentification
0.0018 0.0670♦[0.0072]
[0.0073]
Academicparticipation
0.0074 0.1055♦[0.0073]
[0.0076]
Academicengagement
0.0054 0.1048♦[0.0072]
[0.0073]
Socialen‐gagement
‐0.006 0.0249♦[0.0067]
[0.0077]
Overallen‐gagement
‐9E‐04 0.0729♦[0.0070]
[0.0075]
Self‐perception:Self‐esteem 0.0071 0.0647♦
[0.0070]
[0.0077]
Self‐efficacy ‐0.007 0.1081♦[0.0068]
[0.0069]
Self‐mastery
SocialSupport:
Parents'Behav‐iours:
MonitoringbehaviourNurturancebehaviourInconsistentdiscipline(Rejection‐orientedbehaviour)
ReadingAbility:
Observations 7852 7850 7850 7850 7846 7846 7597 7749
25 Effects ofUniversityCharacteristics and Academic Regulations on Student Persistence,DegreeCompletion, andTimetoDegreeCompletion
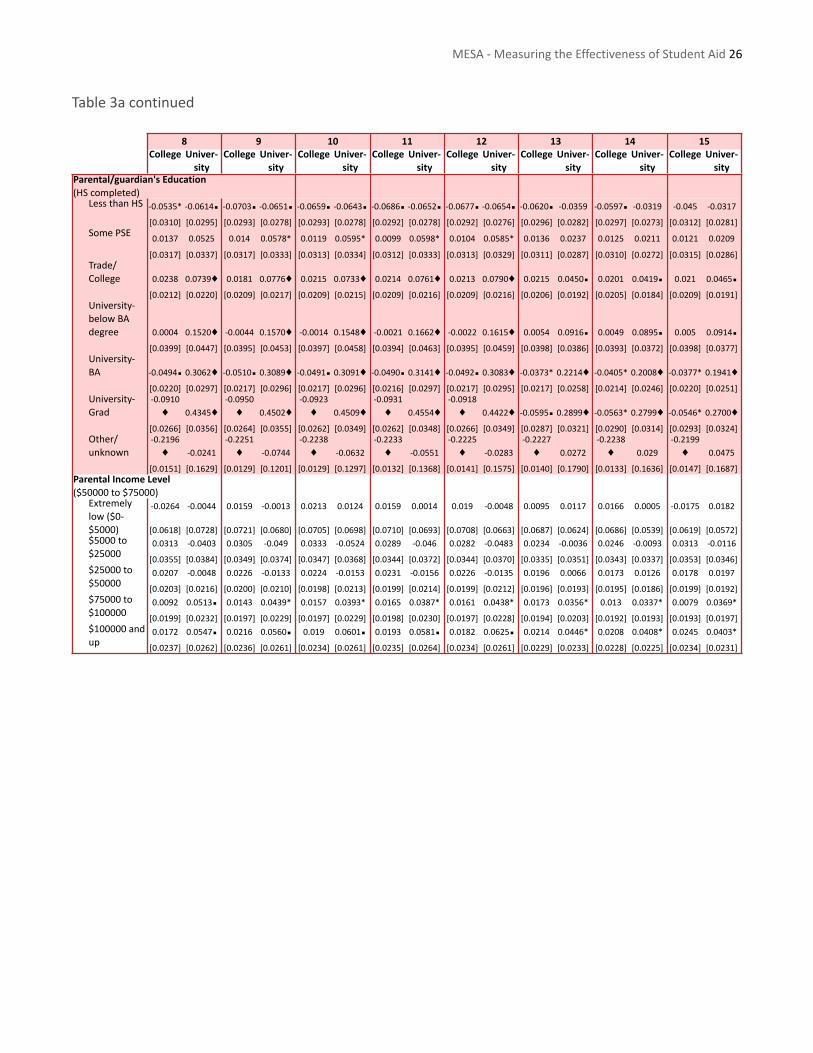
Table3acontinued
8 9 10 11 12 13 14 15
College Univer‐
sityCollege Univer‐
sityCollege Univer‐
sityCollege Univer‐
sityCollege Univer‐
sityCollege Univer‐
sityCollege Univer‐
sityCollege Univer‐
sityParental/guardian'sEducation(HScompleted)
LessthanHS ‐0.0535* ‐0.0614◾ ‐0.0703◾ ‐0.0651◾ ‐0.0659◾ ‐0.0643◾ ‐0.0686◾ ‐0.0652◾ ‐0.0677◾ ‐0.0654◾ ‐0.0620◾ ‐0.0359 ‐0.0597◾ ‐0.0319 ‐0.045 ‐0.0317
[0.0310] [0.0295] [0.0293] [0.0278] [0.0293] [0.0278] [0.0292] [0.0278] [0.0292] [0.0276] [0.0296] [0.0282] [0.0297] [0.0273] [0.0312] [0.0281]SomePSE 0.0137 0.0525 0.014 0.0578* 0.0119 0.0595* 0.0099 0.0598* 0.0104 0.0585* 0.0136 0.0237 0.0125 0.0211 0.0121 0.0209
[0.0317] [0.0337] [0.0317] [0.0333] [0.0313] [0.0334] [0.0312] [0.0333] [0.0313] [0.0329] [0.0311] [0.0287] [0.0310] [0.0272] [0.0315] [0.0286]Trade/College 0.0238 0.0739♦ 0.0181 0.0776♦ 0.0215 0.0733♦ 0.0214 0.0761♦ 0.0213 0.0790♦ 0.0215 0.0450◾ 0.0201 0.0419◾ 0.021 0.0465◾
[0.0212] [0.0220] [0.0209] [0.0217] [0.0209] [0.0215] [0.0209] [0.0216] [0.0209] [0.0216] [0.0206] [0.0192] [0.0205] [0.0184] [0.0209] [0.0191]University‐belowBAdegree 0.0004 0.1520♦ ‐0.0044 0.1570♦ ‐0.0014 0.1548♦ ‐0.0021 0.1662♦ ‐0.0022 0.1615♦ 0.0054 0.0916◾ 0.0049 0.0895◾ 0.005 0.0914◾
[0.0399] [0.0447] [0.0395] [0.0453] [0.0397] [0.0458] [0.0394] [0.0463] [0.0395] [0.0459] [0.0398] [0.0386] [0.0393] [0.0372] [0.0398] [0.0377]University‐BA ‐0.0494◾ 0.3062♦ ‐0.0510◾ 0.3089♦ ‐0.0491◾ 0.3091♦ ‐0.0490◾ 0.3141♦ ‐0.0492◾ 0.3083♦ ‐0.0373* 0.2214♦ ‐0.0405* 0.2008♦ ‐0.0377* 0.1941♦
[0.0220] [0.0297] [0.0217] [0.0296] [0.0217] [0.0296] [0.0216] [0.0297] [0.0217] [0.0295] [0.0217] [0.0258] [0.0214] [0.0246] [0.0220] [0.0251]University‐Grad
‐0.0910♦ 0.4345♦
‐0.0950♦ 0.4502♦
‐0.0923♦ 0.4509♦
‐0.0931♦ 0.4554♦
‐0.0918♦ 0.4422♦ ‐0.0595◾ 0.2899♦ ‐0.0563* 0.2799♦ ‐0.0546* 0.2700♦
[0.0266] [0.0356] [0.0264] [0.0355] [0.0262] [0.0349] [0.0262] [0.0348] [0.0266] [0.0349] [0.0287] [0.0321] [0.0290] [0.0314] [0.0293] [0.0324]Other/unknown
‐0.2196♦ ‐0.0241
‐0.2251♦ ‐0.0744
‐0.2238♦ ‐0.0632
‐0.2233♦ ‐0.0551
‐0.2225♦ ‐0.0283
‐0.2227♦ 0.0272
‐0.2238♦ 0.029
‐0.2199♦ 0.0475
[0.0151] [0.1629] [0.0129] [0.1201] [0.0129] [0.1297] [0.0132] [0.1368] [0.0141] [0.1575] [0.0140] [0.1790] [0.0133] [0.1636] [0.0147] [0.1687]ParentalIncomeLevel($50000to$75000)
Extremelylow($0‐$5000)
‐0.0264 ‐0.0044 0.0159 ‐0.0013 0.0213 0.0124 0.0159 0.0014 0.019 ‐0.0048 0.0095 0.0117 0.0166 0.0005 ‐0.0175 0.0182
[0.0618] [0.0728] [0.0721] [0.0680] [0.0705] [0.0698] [0.0710] [0.0693] [0.0708] [0.0663] [0.0687] [0.0624] [0.0686] [0.0539] [0.0619] [0.0572]$5000to$25000
0.0313 ‐0.0403 0.0305 ‐0.049 0.0333 ‐0.0524 0.0289 ‐0.046 0.0282 ‐0.0483 0.0234 ‐0.0036 0.0246 ‐0.0093 0.0313 ‐0.0116
[0.0355] [0.0384] [0.0349] [0.0374] [0.0347] [0.0368] [0.0344] [0.0372] [0.0344] [0.0370] [0.0335] [0.0351] [0.0343] [0.0337] [0.0353] [0.0346]$25000to$50000
0.0207 ‐0.0048 0.0226 ‐0.0133 0.0224 ‐0.0153 0.0231 ‐0.0156 0.0226 ‐0.0135 0.0196 0.0066 0.0173 0.0126 0.0178 0.0197
[0.0203] [0.0216] [0.0200] [0.0210] [0.0198] [0.0213] [0.0199] [0.0214] [0.0199] [0.0212] [0.0196] [0.0193] [0.0195] [0.0186] [0.0199] [0.0192]$75000to$100000
0.0092 0.0513◾ 0.0143 0.0439* 0.0157 0.0393* 0.0165 0.0387* 0.0161 0.0438* 0.0173 0.0356* 0.013 0.0337* 0.0079 0.0369*
[0.0199] [0.0232] [0.0197] [0.0229] [0.0197] [0.0229] [0.0198] [0.0230] [0.0197] [0.0228] [0.0194] [0.0203] [0.0192] [0.0193] [0.0193] [0.0197]$100000andup
0.0172 0.0547◾ 0.0216 0.0560◾ 0.019 0.0601◾ 0.0193 0.0581◾ 0.0182 0.0625◾ 0.0214 0.0446* 0.0208 0.0408* 0.0245 0.0403*
[0.0237] [0.0262] [0.0236] [0.0261] [0.0234] [0.0261] [0.0235] [0.0264] [0.0234] [0.0261] [0.0229] [0.0233] [0.0228] [0.0225] [0.0234] [0.0231]
MESA‐MeasuringtheEffectivenessofStudentAid26
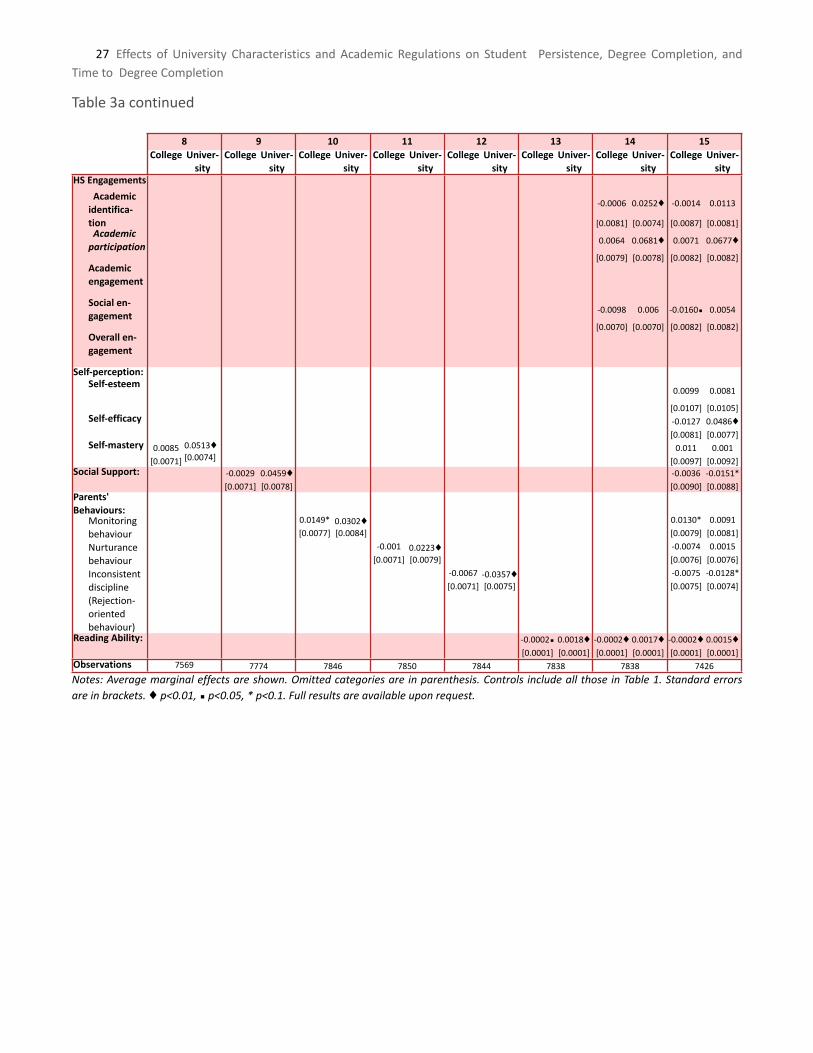
Table3acontinued
8 9 10 11 12 13 14 15 College Univer‐
sityCollege Univer‐
sityCollege Univer‐
sityCollege Univer‐
sityCollege Univer‐
sityCollege Univer‐
sityCollege Univer‐
sityCollege Univer‐
sityHSEngagements
Academicidentifica‐tion
‐0.0006 0.0252♦ ‐0.0014 0.0113
[0.0081] [0.0074] [0.0087] [0.0081]Academicparticipation
0.0064 0.0681♦ 0.0071 0.0677♦
[0.0079] [0.0078] [0.0082] [0.0082]Academicengagement
Socialen‐gagement
‐0.0098 0.006 ‐0.0160◾ 0.0054
[0.0070] [0.0070] [0.0082] [0.0082]Overallen‐gagement
Self‐perception:Self‐esteem
0.0099 0.0081
[0.0107] [0.0105]Self‐efficacy ‐0.0127 0.0486♦
[0.0081] [0.0077]Self‐mastery 0.0085 0.0513♦ 0.011 0.001
[0.0071] [0.0074] [0.0097] [0.0092]SocialSupport: ‐0.0029 0.0459♦ ‐0.0036 ‐0.0151*
[0.0071] [0.0078] [0.0090] [0.0088]Parents'Behaviours:
Monitoringbehaviour
0.0149* 0.0302♦ 0.0130* 0.0091[0.0077] [0.0084] [0.0079] [0.0081]
Nurturancebehaviour
‐0.001 0.0223♦ ‐0.0074 0.0015[0.0071] [0.0079] [0.0076] [0.0076]
Inconsistentdiscipline(Rejection‐orientedbehaviour)
‐0.0067 ‐0.0357♦ ‐0.0075 ‐0.0128*[0.0071] [0.0075] [0.0075] [0.0074]
ReadingAbility: ‐0.0002◾ 0.0018♦ ‐0.0002♦ 0.0017♦ ‐0.0002♦ 0.0015♦[0.0001] [0.0001] [0.0001] [0.0001] [0.0001] [0.0001]
Observations 7569 7774 7846 7850 7844 7838 7838 7426
Notes: Averagemarginaleffectsare shown.Omittedcategoriesareinparenthesis. Controlsincludeallthose inTable1. Standarderrorsareinbrackets.♦p<0.01,◾p<0.05,*p<0.1.Fullresultsareavailableuponrequest.
27 Effects ofUniversityCharacteristics and Academic Regulations on Student Persistence,DegreeCompletion, andTimetoDegreeCompletion
Table3b:EffectsofStudentBackgroundonAccesstoCollegeandUniversity,Females
Baseline 1 2 3 4 5 6 7
College Univer‐sity
College Univer‐sity
College Univer‐sity
College Univer‐sity
College Univer‐sity
College Univer‐sity
College Univer‐sity
College Univer‐sity
Parental/guardian'sEducation(HScom‐pleted)
LessthanHS ‐0.0353 ‐0.118♦ ‐0.0346 ‐0.1142♦ ‐0.0333 ‐0.1091♦ ‐0.0334 ‐0.1090♦ ‐0.0335 ‐0.1159♦ ‐0.0334 ‐0.1090♦ ‐0.036 ‐0.1036♦ ‐0.0368 ‐0.1028♦[0.029] [0.032] [0.0290] [0.0321] [0.0288] [0.0323] [0.0291] [0.0326] [0.0289] [0.0318] [0.0289] [0.0323] [0.0282] [0.0323] [0.0294] [0.0337]
SomePSE 0.0409 0.0454 0.0398 0.0444 0.0439 0.0328 0.0406 0.0384 0.041 0.0459 0.0398 0.044 0.0402 0.0446 0.0381 0.0374
[0.033] [0.035] [0.0330] [0.0347] [0.0325] [0.0328] [0.0327] [0.0332] [0.0330] [0.0351] [0.0328] [0.0340] [0.0328] [0.0350] [0.0326] [0.0340]Trade/College
‐0.0103 0.0618◾‐0.0109 0.0630♦ ‐0.0047 0.0448* ‐0.0084 0.0545◾ ‐0.0104 0.0626♦ ‐0.0106 0.0610♦ ‐0.009 0.0560◾ ‐0.0094 0.0494◾
[0.020] [0.024] [0.0203] [0.0237] [0.0200] [0.0231] [0.0201] [0.0232] [0.0203] [0.0239] [0.0202] [0.0235] [0.0204] [0.0241] [0.0202] [0.0233]University‐belowBAdegree
‐0.0811◾ 0.302♦ ‐0.0773◾ 0.2925♦ ‐0.0632* 0.2542♦ ‐0.0679* 0.2665♦ ‐0.0815◾ 0.3032♦ ‐0.0790◾ 0.2929♦ ‐0.0839◾ 0.2903♦ ‐0.0714◾ 0.2728♦[0.034] [0.040] [0.0346] [0.0391] [0.0351] [0.0404] [0.0350] [0.0391] [0.0340] [0.0394] [0.0341] [0.0389] [0.0341] [0.0407] [0.0349] [0.0392]
University‐BA
‐0.0807♦
0.299♦‐0.0780♦ 0.2884♦
‐0.0632♦ 0.2496♦
‐0.0687♦ 0.2621♦
‐0.0811♦ 0.2968♦
‐0.0772♦ 0.2819♦
‐0.0729♦ 0.2806♦
‐0.0750♦ 0.2673♦
[0.022] [0.027] [0.0225] [0.0268] [0.0225] [0.0264] [0.0226] [0.0266] [0.0224] [0.0267] [0.0225] [0.0265] [0.0229] [0.0271] [0.0222] [0.0266]University‐Grad
‐0.143♦ 0.372♦‐0.1390♦ 0.3568♦
‐0.1226♦ 0.3107♦
‐0.1279♦ 0.3226♦
‐0.1428♦ 0.3708♦
‐0.1380♦ 0.3511♦
‐0.1424♦ 0.3535♦
‐0.1334♦ 0.3208♦
[0.025] [0.032] [0.0250] [0.0324] [0.0263] [0.0325] [0.0262] [0.0328] [0.0245] [0.0318] [0.0251] [0.0322] [0.0240] [0.0321] [0.0254] [0.0321]Other/unknown
‐ ‐‐0.1217 ‐0.2256◾ ‐0.1153 ‐0.1454 ‐0.116 ‐0.1964* ‐0.126 ‐0.2228◾ ‐0.1233 ‐0.2315◾ ‐0.1023 ‐0.2421♦ ‐0.1193 ‐0.1561
‐ ‐ [0.1290] [0.0965] [0.1273] [0.1346] [0.1289] [0.1111] [0.1273] [0.1000] [0.1274] [0.0927] [0.1350] [0.0915] [0.1283] [0.1336]ParentalIncomeLevel($50000to$75000)
Extremelylow($0‐$5000)
‐0.0951◾ ‐0.087‐0.0969◾ ‐0.0746 ‐0.1028◾ ‐0.0505 ‐0.1002◾ ‐0.0565 ‐0.0923* ‐0.0741 ‐0.0975◾ ‐0.0513 ‐0.0928* ‐0.0817 ‐0.1005◾ ‐0.0694
[0.047] [0.095] [0.0471] [0.0931] [0.0451] [0.0958] [0.0460] [0.0950] [0.0476] [0.0955] [0.0467] [0.0951] [0.0476] [0.0989] [0.0473] [0.0933]$5000to$25000
‐0.0288 ‐0.102♦‐0.0268 ‐0.1150♦ ‐0.0277 ‐0.1043♦ ‐0.0249 ‐0.1173♦ ‐0.0283 ‐0.0986♦ ‐0.0279 ‐0.1031♦ ‐0.0219 ‐0.0962◾ ‐0.0318 ‐0.0946◾
[0.029] [0.038] [0.0295] [0.0368] [0.0293] [0.0367] [0.0295] [0.0360] [0.0294] [0.0376] [0.0294] [0.0371] [0.0301] [0.0374] [0.0294] [0.0376]$25000to$50000
‐0.00816 ‐0.0815♦‐0.0068 ‐0.0891♦ ‐0.0093 ‐0.0788♦ ‐0.0064 ‐0.0885♦ ‐0.0077 ‐0.0787♦ ‐0.0087 ‐0.0784♦ ‐0.0126 ‐0.0678♦ ‐0.0137 ‐0.0719♦
[0.020] [0.023] [0.0195] [0.0225] [0.0193] [0.0225] [0.0194] [0.0222] [0.0195] [0.0228] [0.0195] [0.0224] [0.0194] [0.0228] [0.0193] [0.0222]$75000to$100000
0.00336 0.02050.004 0.0195 0.0031 0.0185 0.0037 0.0185 0.0037 0.0204 0.0036 0.0195 ‐0.0007 0.0262 0.0008 0.0274
[0.020] [0.023] [0.0202] [0.0222] [0.0200] [0.0218] [0.0200] [0.0218] [0.0202] [0.0226] [0.0202] [0.0223] [0.0202] [0.0225] [0.0200] [0.0217]$100000andup
‐0.0143 0.103♦‐0.0154 0.1038♦ ‐0.0117 0.0936♦ ‐0.0147 0.0989♦ ‐0.0142 0.1057♦ ‐0.0166 0.1070♦ ‐0.0177 0.1094♦ ‐0.0178 0.1083♦
[0.023] [0.026] [0.0231] [0.0255] [0.0230] [0.0249] [0.0229] [0.0250] [0.0233] [0.0257] [0.0230] [0.0253] [0.0234] [0.0258] [0.0230] [0.0253]
(continued)
MESA‐MeasuringtheEffectivenessofStudentAid28
Table3bcontinued
Baseline 1 2 3 4 5 6 7
College Univer‐sity
College Univer‐sity
College Univer‐sity
College Univer‐sity
College Univer‐sity
College Univer‐sity
College Univer‐sity
College Univer‐sity
HSEngagements
Academicidentification
0.004 0.0643♦[0.0076] [0.0082]
Academicparticipation
‐0.0163◾ 0.1389♦
[0.0082] [0.0089]Academicengagement
‐0.007 0.1183♦[0.0079] [0.0084]
Socialen‐gagement
0.0114* 0.0229♦[0.0067] [0.0079]
Overallen‐gagement
0.0065 0.0756♦[0.0071] [0.0080]
Self‐perception:Self‐esteem 0.0007 0.0639♦
[0.0070] [0.0081]Self‐efficacy ‐0.0093 0.1134♦
[0.0072] [0.0076]Self‐mastery
SocialSupport:
Parents'Behav‐iours:
MonitoringbehaviourNurturancebehaviourInconsistentdiscipline(Rejection‐orientedbehaviour)
ReadingAbility:
Observations 8311 8311 8309 8309 8311 8309 8171 8252
29 Effects ofUniversityCharacteristics and Academic Regulations on Student Persistence,DegreeCompletion, andTimetoDegreeCompletion
Table3bcontinued
Baseline 8 9 10 11 12 13 14
CollegeUniver‐sity
CollegeUniver‐sity
CollegeUniver‐sity
CollegeUniver‐sity
CollegeUniver‐sity
CollegeUniver‐sity
CollegeUniver‐sity
CollegeUniver‐sity
Parental/guardian'sEducation(HScompleted)
LessthanHS ‐0.0346 ‐0.1087♦ ‐0.0383 ‐0.1187♦ ‐0.0355 ‐0.1161♦ ‐0.0359 ‐0.1174♦ ‐0.0344 ‐0.1194♦ ‐0.0334 ‐0.0732◾ ‐0.0323 ‐0.0667◾ ‐0.0365 ‐0.0602*
[0.0284] [0.0321] [0.0289] [0.0321] [0.0289] [0.0318] [0.0289] [0.0318] [0.0288] [0.0319] [0.0292] [0.0324] [0.0287] [0.0322] [0.0285] [0.0331]SomePSE 0.0391 0.0485 0.0387 0.0468 0.0412 0.0448 0.0406 0.0463 0.0404 0.0427 0.0498 0.0123 0.0518 0.0066 0.0472 0.0137
[0.0329] [0.0353] [0.0331] [0.0357] [0.0332] [0.0353] [0.0330] [0.0354] [0.0330] [0.0353] [0.0319] [0.0304] [0.0316] [0.0291] [0.0318] [0.0297]Trade/College ‐0.0087 0.0532◾ ‐0.0131 0.0613◾ ‐0.0117 0.0624♦ ‐0.0105 0.0626♦ ‐0.0103 0.0599◾ 0.0016 0.0226 0.0041 0.0166 0.0017 0.0145
[0.0204] [0.0241] [0.0203] [0.0241] [0.0203] [0.0240] [0.0203] [0.0240] [0.0203] [0.0240] [0.0198] [0.0212] [0.0195] [0.0207] [0.0197] [0.0210]University‐belowBAdegree ‐0.0831◾ 0.2911♦
‐0.0874♦ 0.3028♦ ‐0.0808◾ 0.3012♦ ‐0.0820◾ 0.3029♦ ‐0.0801◾ 0.2950♦ ‐0.0276 0.1653♦ ‐0.0156 0.1402♦ ‐0.0259 0.1420♦
[0.0342] [0.0402] [0.0339] [0.0397] [0.0342] [0.0396] [0.0340] [0.0398] [0.0342] [0.0396] [0.0370] [0.0371] [0.0377] [0.0369] [0.0381] [0.0367]University‐BA
‐0.0736♦ 0.2856♦
‐0.0849♦ 0.2967♦
‐0.0793♦ 0.2951♦
‐0.0808♦ 0.2990♦
‐0.0790♦ 0.2897♦ ‐0.0380* 0.1705♦ ‐0.0287 0.1458♦ ‐0.0291 0.1422♦
[0.0229] [0.0271] [0.0224] [0.0270] [0.0225] [0.0268] [0.0224] [0.0268] [0.0226] [0.0269] [0.0226] [0.0252] [0.0225] [0.0246] [0.0229] [0.0251]University‐Grad
‐0.1437♦ 0.3624♦
‐0.1524♦ 0.3738♦
‐0.1445♦ 0.3756♦
‐0.1432♦ 0.3731♦
‐0.1410♦ 0.3617♦
‐0.0942♦ 0.2166♦
‐0.0820♦ 0.1788♦
‐0.0954♦ 0.1795♦
[0.0238] [0.0318] [0.0229] [0.0315] [0.0244] [0.0318] [0.0245] [0.0319] [0.0248] [0.0322] [0.0280] [0.0304] [0.0287] [0.0300] [0.0278] [0.0302]Other/unknown ‐0.0998 ‐0.2445♦ 0.1242 0.032 ‐0.1169 ‐0.2089* ‐0.1168 ‐0.2050* ‐0.1277 ‐0.2467♦ ‐0.1241 ‐0.087 ‐0.1349 ‐0.0837 0.1213 0.0154
[0.1341] [0.0865] [0.1802] [0.2022] [0.1316] [0.1085] [0.1313] [0.1106] [0.1309] [0.0874] [0.1202] [0.1304] [0.1131] [0.1294] [0.1635] [0.1348]ParentalIncomeLevel($50000to$75000)
Extremelylow($0‐$5000)
‐0.0881* ‐0.0697 ‐0.0924* ‐0.0861 ‐0.0931◾ ‐0.0808 ‐0.0957◾ ‐0.0867 ‐0.0961◾ ‐0.0675‐0.1149♦ 0.0082
‐0.1157♦ 0.03 ‐0.1106◾ 0.037
[0.0495] [0.0989] [0.0482] [0.0953] [0.0475] [0.0990] [0.0467] [0.0953] [0.0464] [0.0956] [0.0410] [0.0923] [0.0405] [0.0988] [0.0437] [0.1009]$5000to$25000
‐0.0215 ‐0.0965◾ ‐0.0256 ‐0.0980♦ ‐0.0288 ‐0.1021♦ ‐0.0283 ‐0.1022♦ ‐0.0284 ‐0.1042♦ ‐0.0424 ‐0.0355 ‐0.0404 ‐0.0454 ‐0.0291 ‐0.046
[0.0301] [0.0378] [0.0299] [0.0376] [0.0294] [0.0374] [0.0294] [0.0376] [0.0294] [0.0372] [0.0281] [0.0344] [0.0279] [0.0332] [0.0293] [0.0335]$25000to$50000
‐0.0098 ‐0.0720♦ ‐0.0137 ‐0.0779♦ ‐0.0086 ‐0.0799♦ ‐0.0078 ‐0.0820♦ ‐0.0078 ‐0.0806♦ ‐0.0158 ‐0.0465◾ ‐0.0145 ‐0.0505♦ ‐0.02 ‐0.0451◾
[0.0195] [0.0229] [0.0194] [0.0230] [0.0195] [0.0230] [0.0195] [0.0230] [0.0195] [0.0229] [0.0189] [0.0197] [0.0186] [0.0194] [0.0188] [0.0198]$75000to$100000
0.0007 0.0233 0.0031 0.0232 0.0014 0.0227 0.0032 0.0207 0.0023 0.0222 ‐0.0017 0.0351* ‐0.0007 0.0323 ‐0.0061 0.0386*
[0.0202] [0.0225] [0.0202] [0.0227] [0.0202] [0.0225] [0.0202] [0.0226] [0.0202] [0.0225] [0.0191] [0.0202] [0.0189] [0.0198] [0.0189] [0.0198]$100000andup
‐0.0166 0.1025♦ ‐0.0137 0.1009♦ ‐0.0153 0.1054♦ ‐0.0139 0.1027♦ ‐0.0149 0.1045♦ ‐0.0096 0.0924♦ ‐0.0074 0.0880♦ ‐0.0129 0.0933♦
[0.0233] [0.0258] [0.0233] [0.0259] [0.0233] [0.0257] [0.0233] [0.0258] [0.0233] [0.0257] [0.0224] [0.0237] [0.0221] [0.0232] [0.0223] [0.0233]
MESA‐MeasuringtheEffectivenessofStudentAid30
Table3bcontinued
Baseline 8 9 10 11 12 13 14 College Univer‐
sityCollege Univer‐
sityCollege Univer‐
sityCollege Univer‐
sityCollege Univer‐
sityCollege Univer‐
sityCollege Univer‐
sityCollege Univer‐
sityHSEngagements
Academicidentifica‐tionAcademicparticipation
Academicengagement
Socialen‐gagement
Overallen‐gagement
Self‐perception:Self‐esteem
‐0.0014 0.0157
[0.0098] [0.0104]Self‐efficacy
‐0.0101 0.0466♦
[0.0084] [0.0087]Self‐mastery ‐0.0038 0.0548♦
‐0.0102 0.0025[0.0073] [0.0083]
[0.0095] [0.0102]SocialSupport: 0.0170◾ 0.0126
0.0189◾ ‐0.0296♦[0.0070] [0.0085]
[0.0082] [0.0091]Parents'Behav‐iours:
Monitoringbehaviour
‐0.0032 0.0383♦‐0.0038 0.0235♦
[0.0080] [0.0096][0.0079] [0.0088]
Nurturancebehaviour
‐0.0043 0.0047‐0.0054 ‐0.0096
[0.0073] [0.0083][0.0076] [0.0082]
Inconsistentdiscipline(Rejection‐orientedbehaviour)
‐0.0044 ‐0.0355♦‐0.0047 ‐0.0161◾
[0.0068] [0.0076]
[0.0069] [0.0072]ReadingAbility: ‐0.0003♦ 0.0023♦ ‐0.0003♦ 0.0021♦ ‐0.0003♦ 0.0019♦
[0.0001] [0.0001] [0.0001] [0.0001] [0.0001] [0.0001]Observations 8151 8254 8306 8306 8306 8304 8302 8049
Notes: Averagemarginaleffectsare shown.Omittedcategoriesareinparenthesis. Controlsincludeallthose inTable1. Standarderrorsareinbrackets.♦p<0.01,◾p<0.05,*p<0.1.Fullresultsareavailableuponrequest.
31 Effects ofUniversityCharacteristics and Academic Regulations on Student Persistence,DegreeCompletion, andTimetoDegreeCompletion
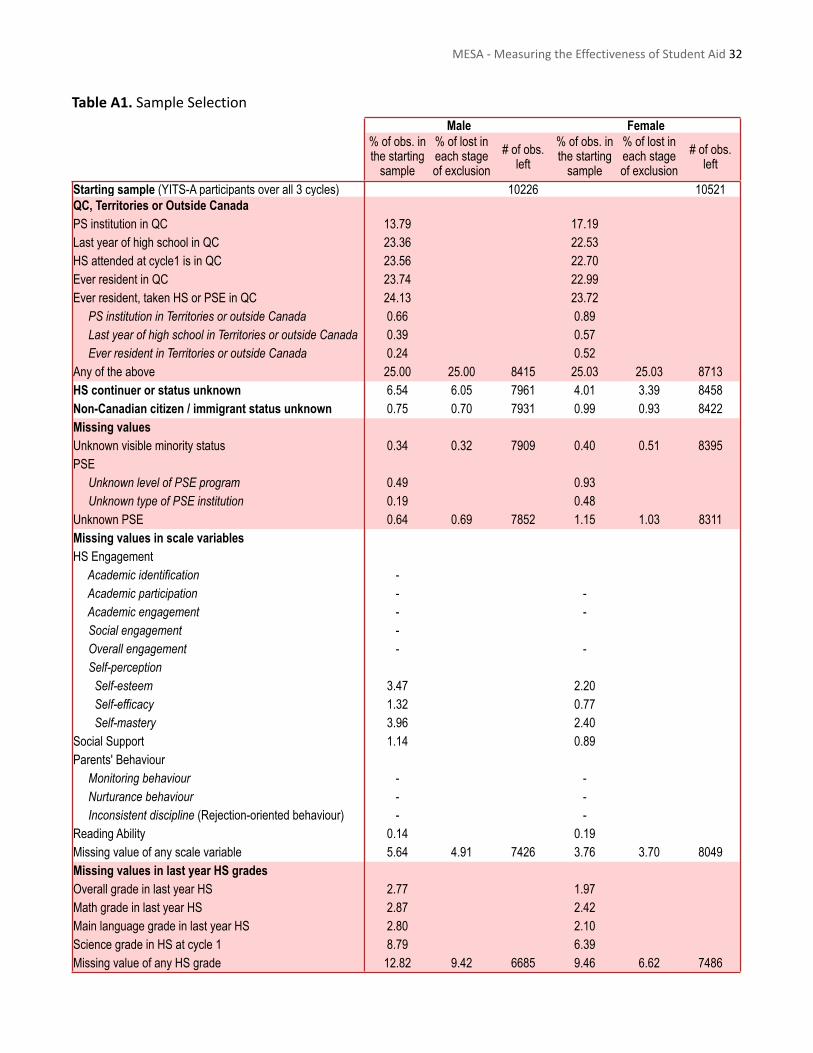
TableA1.SampleSelectionMale Female
% of obs. in the starting
sample
% of lost in each stage of exclusion
# of obs. left
% of obs. in the starting
sample
% of lost in each stage of exclusion
# of obs. left
Starting sample (YITS-A participants over all 3 cycles) 10226 10521QC, Territories or Outside CanadaPS institution in QC 13.79 17.19Last year of high school in QC 23.36 22.53HS attended at cycle1 is in QC 23.56 22.70Ever resident in QC 23.74 22.99Ever resident, taken HS or PSE in QC 24.13 23.72 PS institution in Territories or outside Canada 0.66 0.89 Last year of high school in Territories or outside Canada 0.39 0.57 Ever resident in Territories or outside Canada 0.24 0.52Any of the above 25.00 25.00 8415 25.03 25.03 8713HS continuer or status unknown 6.54 6.05 7961 4.01 3.39 8458Non-Canadian citizen / immigrant status unknown 0.75 0.70 7931 0.99 0.93 8422Missing valuesUnknown visible minority status 0.34 0.32 7909 0.40 0.51 8395PSE Unknown level of PSE program 0.49 0.93 Unknown type of PSE institution 0.19 0.48Unknown PSE 0.64 0.69 7852 1.15 1.03 8311Missing values in scale variablesHS Engagement Academic identification - Academic participation - - Academic engagement - - Social engagement - Overall engagement - - Self-perception
Self-esteem 3.47 2.20Self-efficacy 1.32 0.77Self-mastery 3.96 2.40
Social Support 1.14 0.89Parents' Behaviour Monitoring behaviour - - Nurturance behaviour - - Inconsistent discipline (Rejection-oriented behaviour) - -Reading Ability 0.14 0.19Missing value of any scale variable 5.64 4.91 7426 3.76 3.70 8049Missing values in last year HS gradesOverall grade in last year HS 2.77 1.97Math grade in last year HS 2.87 2.42Main language grade in last year HS 2.80 2.10Science grade in HS at cycle 1 8.79 6.39Missing value of any HS grade 12.82 9.42 6685 9.46 6.62 7486
MESA‐MeasuringtheEffectivenessofStudentAid32
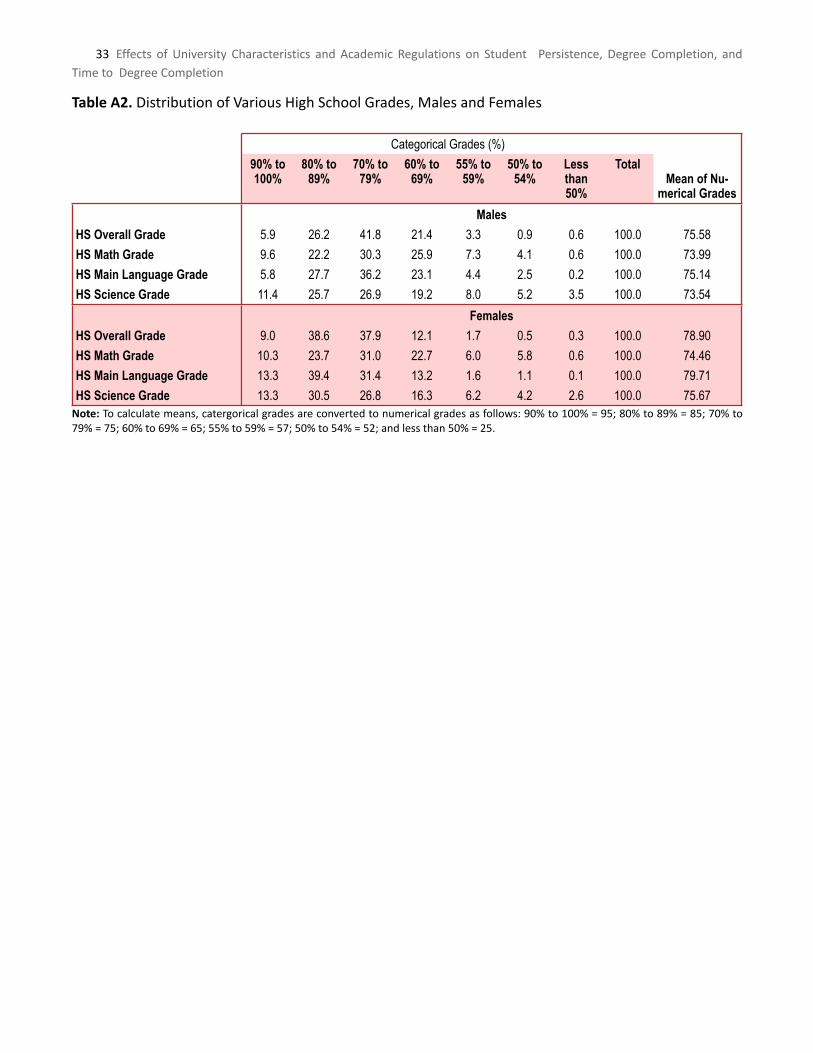
TableA2.DistributionofVariousHighSchoolGrades,MalesandFemales
Categorical Grades (%)
Mean of Nu-merical Grades
90% to 100%
80% to 89%
70% to 79%
60% to 69%
55% to 59%
50% to 54%
Less than 50%
Total
MalesHS Overall Grade 5.9 26.2 41.8 21.4 3.3 0.9 0.6 100.0 75.58HS Math Grade 9.6 22.2 30.3 25.9 7.3 4.1 0.6 100.0 73.99HS Main Language Grade 5.8 27.7 36.2 23.1 4.4 2.5 0.2 100.0 75.14HS Science Grade 11.4 25.7 26.9 19.2 8.0 5.2 3.5 100.0 73.54
FemalesHS Overall Grade 9.0 38.6 37.9 12.1 1.7 0.5 0.3 100.0 78.90HS Math Grade 10.3 23.7 31.0 22.7 6.0 5.8 0.6 100.0 74.46HS Main Language Grade 13.3 39.4 31.4 13.2 1.6 1.1 0.1 100.0 79.71HS Science Grade 13.3 30.5 26.8 16.3 6.2 4.2 2.6 100.0 75.67Note: Tocalculatemeans,catergoricalgradesareconvertedtonumericalgradesasfollows:90%to100%= 95; 80% to89%= 85; 70% to79%=75;60%to69%=65;55%to59%=57;50%to54%=52;andlessthan50%=25.
33 Effects ofUniversityCharacteristics and Academic Regulations on Student Persistence,DegreeCompletion, andTimetoDegreeCompletion
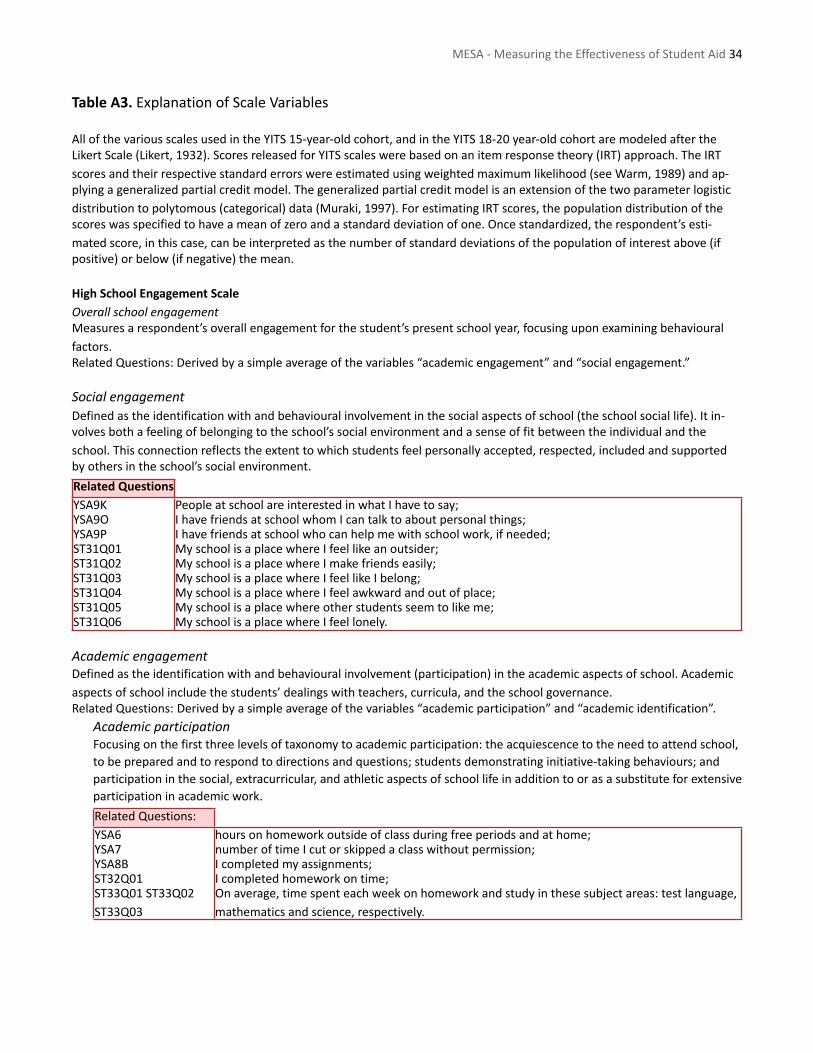
TableA3.ExplanationofScaleVariables
AllofthevariousscalesusedintheYITS15‐year‐oldcohort,andintheYITS18‐20year‐oldcohortaremodeledaftertheLikertScale(Likert,1932).ScoresreleasedforYITSscaleswerebasedonanitemresponsetheory(IRT)approach.TheIRTscoresandtheirrespectivestandarderrorswereestimatedusingweightedmaximumlikelihood(seeWarm,1989)andap‐plyingageneralizedpartialcreditmodel.Thegeneralizedpartialcreditmodelisanextensionofthetwoparameterlogisticdistributiontopolytomous(categorical)data(Muraki,1997).ForestimatingIRTscores,thepopulationdistributionofthescoreswasspecifiedtohaveameanofzeroandastandarddeviationofone.Oncestandardized,therespondent’sesti‐matedscore,inthiscase,canbeinterpretedasthenumberofstandarddeviationsofthepopulationofinterestabove(ifpositive)orbelow(ifnegative)themean.
HighSchoolEngagementScaleOverallschoolengagementMeasuresarespondent’soverallengagementforthestudent’spresentschoolyear,focusinguponexaminingbehaviouralfactors.RelatedQuestions:Derivedbyasimpleaverageofthevariables“academicengagement”and“socialengagement.”
SocialengagementDefinedastheidentificationwithandbehaviouralinvolvementinthesocialaspectsofschool(theschoolsociallife).Itin‐volvesbothafeelingofbelongingtotheschool’ssocialenvironmentandasenseoffitbetweentheindividualandtheschool.Thisconnectionreflectstheextenttowhichstudentsfeelpersonallyaccepted,respected,includedandsupportedbyothersintheschool’ssocialenvironment.
RelatedQuestionsYSA9K PeopleatschoolareinterestedinwhatIhavetosay;YSA9O IhavefriendsatschoolwhomIcantalktoaboutpersonalthings;YSA9P Ihavefriendsatschoolwhocanhelpmewithschoolwork,ifneeded;ST31Q01 MyschoolisaplacewhereIfeellikeanoutsider;ST31Q02 MyschoolisaplacewhereImakefriendseasily;ST31Q03 MyschoolisaplacewhereIfeellikeIbelong;ST31Q04 MyschoolisaplacewhereIfeelawkwardandoutofplace;ST31Q05 Myschoolisaplacewhereotherstudentsseemtolikeme;ST31Q06 MyschoolisaplacewhereIfeellonely.
AcademicengagementDefinedastheidentificationwithandbehaviouralinvolvement(participation)intheacademicaspectsofschool.Academicaspectsofschoolincludethestudents’dealingswithteachers,curricula,andtheschoolgovernance.RelatedQuestions:Derivedbyasimpleaverageofthevariables“academicparticipation”and“academicidentification”.
AcademicparticipationFocusingonthefirstthreelevelsoftaxonomytoacademicparticipation:theacquiescencetotheneedtoattendschool,tobepreparedandtorespondtodirectionsandquestions;studentsdemonstratinginitiative‐takingbehaviours;andparticipationinthesocial,extracurricular,andathleticaspectsofschoollifeinadditiontoorasasubstituteforextensiveparticipationinacademicwork.
RelatedQuestions:YSA6 hoursonhomeworkoutsideofclassduringfreeperiodsandathome;YSA7 numberoftimeIcutorskippedaclasswithoutpermission;YSA8B Icompletedmyassignments;ST32Q01 Icompletedhomeworkontime;ST33Q01ST33Q02ST33Q03
Onaverage,timespenteachweekonhomeworkandstudyinthesesubjectareas:testlanguage,mathematicsandscience,respectively.
MESA‐MeasuringtheEffectivenessofStudentAid34
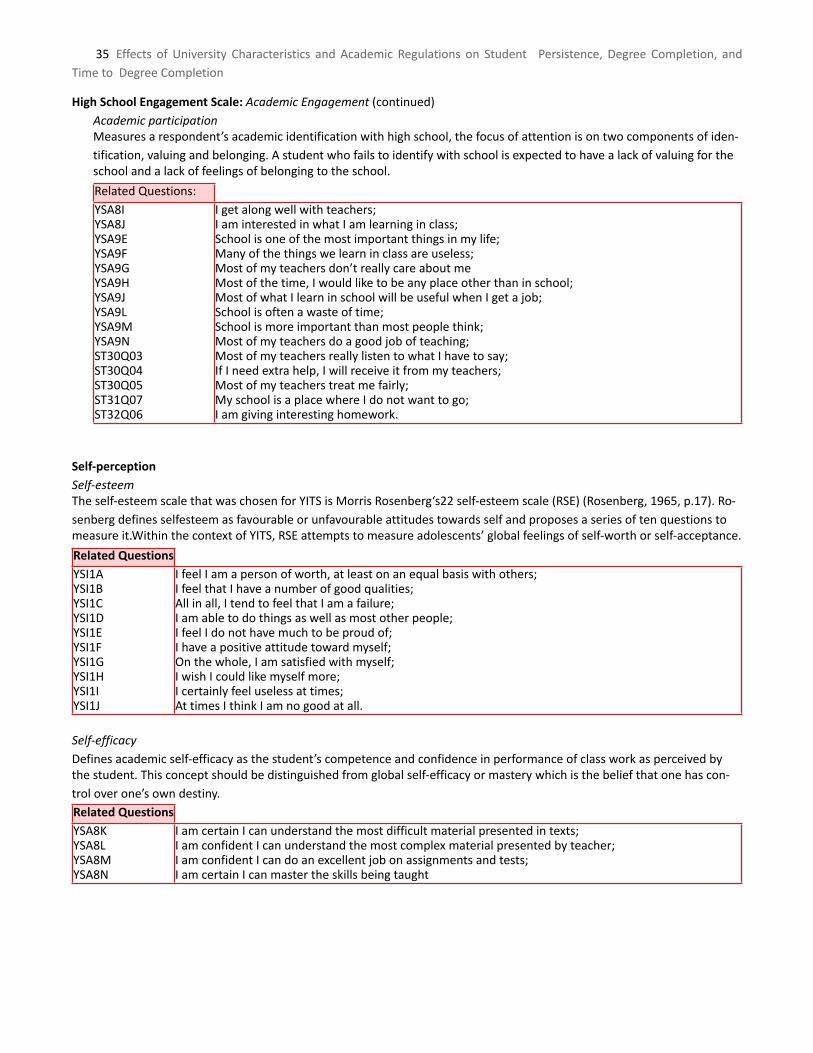
HighSchoolEngagementScale:AcademicEngagement(continued)AcademicparticipationMeasuresarespondent’sacademicidentificationwithhighschool,thefocusofattentionisontwocomponentsofiden‐tification,valuingandbelonging.Astudentwhofailstoidentifywithschoolisexpectedtohavealackofvaluingfortheschoolandalackoffeelingsofbelongingtotheschool.
RelatedQuestions:YSA8I Igetalongwellwithteachers;YSA8J IaminterestedinwhatIamlearninginclass;YSA9E Schoolisoneofthemostimportantthingsinmylife;YSA9F Manyofthethingswelearninclassareuseless;YSA9G Mostofmyteachersdon’treallycareaboutmeYSA9H Mostofthetime,Iwouldliketobeanyplaceotherthaninschool;YSA9J MostofwhatIlearninschoolwillbeusefulwhenIgetajob;YSA9L Schoolisoftenawasteoftime;YSA9M Schoolismoreimportantthanmostpeoplethink;YSA9N Mostofmyteachersdoagoodjobofteaching;ST30Q03 MostofmyteachersreallylistentowhatIhavetosay;ST30Q04 IfIneedextrahelp,Iwillreceiveitfrommyteachers;ST30Q05 Mostofmyteacherstreatmefairly;ST31Q07 MyschoolisaplacewhereIdonotwanttogo;ST32Q06 Iamgivinginterestinghomework.
Self‐perceptionSelf‐esteemTheself‐esteemscalethatwaschosenforYITSisMorrisRosenberg‘s22self‐esteemscale(RSE)(Rosenberg,1965,p.17).Ro‐senbergdefinesselfesteemasfavourableorunfavourableattitudestowardsselfandproposesaseriesoftenquestionstomeasureit.WithinthecontextofYITS,RSEattemptstomeasureadolescents’globalfeelingsofself‐worthorself‐acceptance.
RelatedQuestionsYSI1A IfeelIamapersonofworth,atleastonanequalbasiswithothers;YSI1B IfeelthatIhaveanumberofgoodqualities;YSI1C Allinall,ItendtofeelthatIamafailure;YSI1D Iamabletodothingsaswellasmostotherpeople;YSI1E IfeelIdonothavemuchtobeproudof;YSI1F Ihaveapositiveattitudetowardmyself;YSI1G Onthewhole,Iamsatisfiedwithmyself;YSI1H IwishIcouldlikemyselfmore;YSI1I Icertainlyfeeluselessattimes;YSI1J AttimesIthinkIamnogoodatall.
Self‐efficacyDefinesacademicself‐efficacyasthestudent’scompetenceandconfidenceinperformanceofclassworkasperceivedbythestudent.Thisconceptshouldbedistinguishedfromglobalself‐efficacyormasterywhichisthebeliefthatonehascon‐troloverone’sowndestiny.RelatedQuestionsYSA8K IamcertainIcanunderstandthemostdifficultmaterialpresentedintexts;YSA8L IamconfidentIcanunderstandthemostcomplexmaterialpresentedbyteacher;YSA8M IamconfidentIcandoanexcellentjobonassignmentsandtests;YSA8N IamcertainIcanmastertheskillsbeingtaught
35 Effects ofUniversityCharacteristics and Academic Regulations on Student Persistence,DegreeCompletion, andTimetoDegreeCompletion
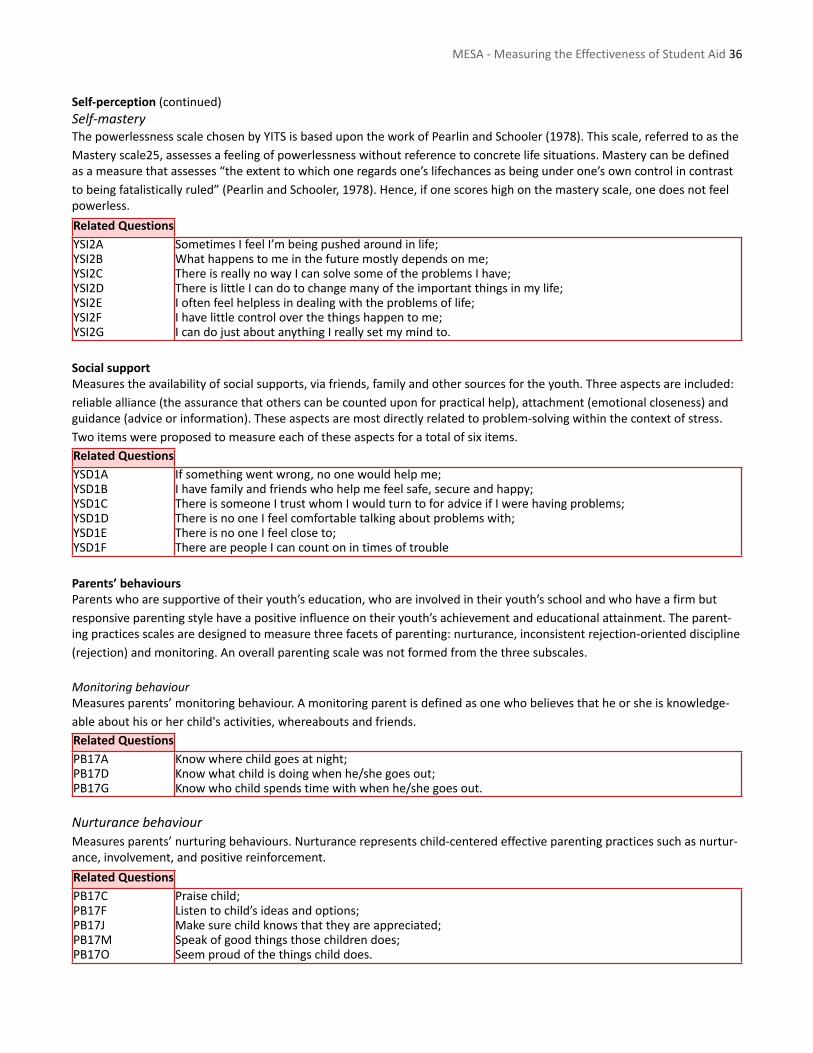
Self‐perception(continued)Self‐masteryThepowerlessnessscalechosenbyYITSisbasedupontheworkofPearlinandSchooler(1978).Thisscale,referredtoastheMasteryscale25,assessesafeelingofpowerlessnesswithoutreferencetoconcretelifesituations.Masterycanbedefinedasameasurethatassesses“theextenttowhichoneregardsone’slifechancesasbeingunderone’sowncontrolincontrasttobeingfatalisticallyruled”(PearlinandSchooler,1978).Hence,ifonescoreshighonthemasteryscale,onedoesnotfeelpowerless.
RelatedQuestionsYSI2A SometimesIfeelI’mbeingpushedaroundinlife;YSI2B Whathappenstomeinthefuturemostlydependsonme;YSI2C ThereisreallynowayIcansolvesomeoftheproblemsIhave;YSI2D ThereislittleIcandotochangemanyoftheimportantthingsinmylife;YSI2E Ioftenfeelhelplessindealingwiththeproblemsoflife;YSI2F Ihavelittlecontroloverthethingshappentome;YSI2G IcandojustaboutanythingIreallysetmymindto.
SocialsupportMeasurestheavailabilityofsocialsupports,viafriends,familyandothersourcesfortheyouth.Threeaspectsareincluded:reliablealliance(theassurancethatotherscanbecounteduponforpracticalhelp),attachment(emotionalcloseness)andguidance(adviceorinformation).Theseaspectsaremostdirectlyrelatedtoproblem‐solvingwithinthecontextofstress.Twoitemswereproposedtomeasureeachoftheseaspectsforatotalofsixitems.RelatedQuestionsYSD1A Ifsomethingwentwrong,noonewouldhelpme;YSD1B Ihavefamilyandfriendswhohelpmefeelsafe,secureandhappy;YSD1C ThereissomeoneItrustwhomIwouldturntoforadviceifIwerehavingproblems;YSD1D ThereisnooneIfeelcomfortabletalkingaboutproblemswith;YSD1E ThereisnooneIfeelcloseto;YSD1F TherearepeopleIcancountonintimesoftrouble
Parents’behavioursParentswhoaresupportiveoftheiryouth’seducation,whoareinvolvedintheiryouth’sschoolandwhohaveafirmbutresponsiveparentingstylehaveapositiveinfluenceontheiryouth’sachievementandeducationalattainment.Theparent‐ingpracticesscalesaredesignedtomeasurethreefacetsofparenting:nurturance,inconsistentrejection‐orienteddiscipline(rejection)andmonitoring.Anoverallparentingscalewasnotformedfromthethreesubscales.
MonitoringbehaviourMeasuresparents’monitoringbehaviour.Amonitoringparentisdefinedasonewhobelievesthatheorsheisknowledge‐ableabouthisorherchild'sactivities,whereaboutsandfriends.RelatedQuestionsPB17A Knowwherechildgoesatnight;PB17D Knowwhatchildisdoingwhenhe/shegoesout;PB17G Knowwhochildspendstimewithwhenhe/shegoesout.
NurturancebehaviourMeasuresparents’nurturingbehaviours.Nurturancerepresentschild‐centeredeffectiveparentingpracticessuchasnurtur‐ance,involvement,andpositivereinforcement.
RelatedQuestionsPB17C Praisechild;PB17F Listentochild’sideasandoptions;PB17J Makesurechildknowsthattheyareappreciated;PB17M Speakofgoodthingsthosechildrendoes;PB17O Seemproudofthethingschilddoes.
MESA‐MeasuringtheEffectivenessofStudentAid36
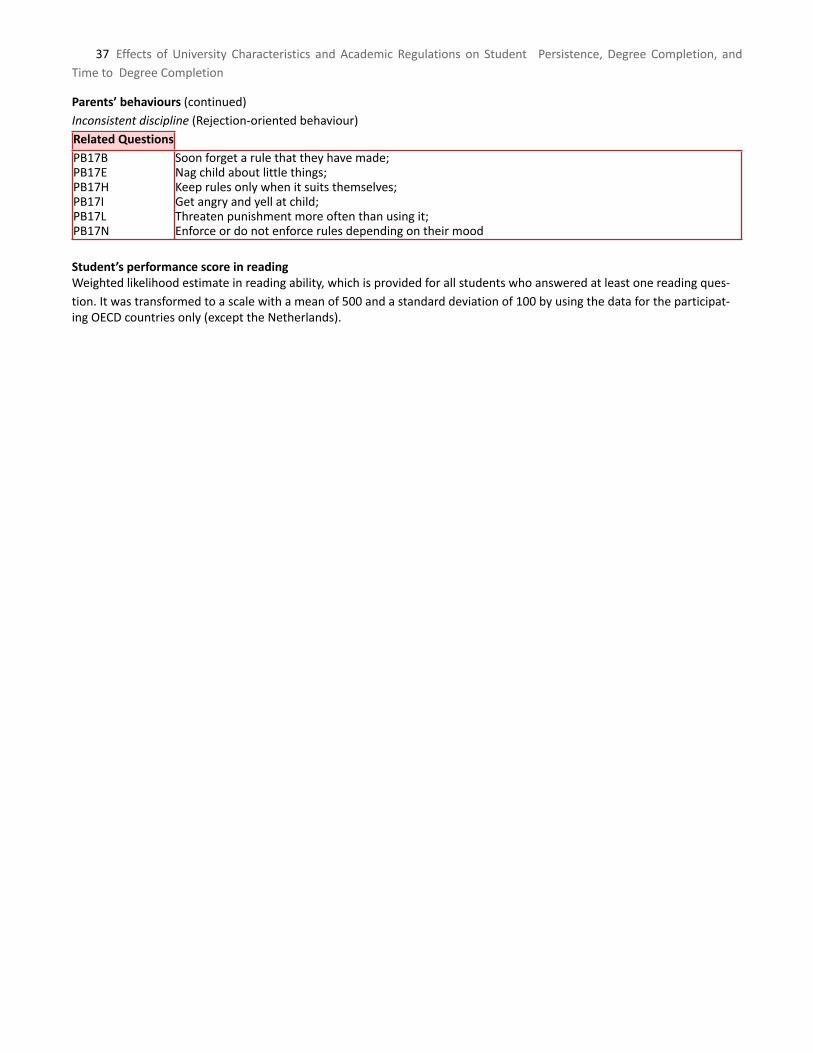
Parents’behaviours(continued)Inconsistentdiscipline(Rejection‐orientedbehaviour)RelatedQuestionsPB17B Soonforgetarulethattheyhavemade;PB17E Nagchildaboutlittlethings;PB17H Keeprulesonlywhenitsuitsthemselves;PB17I Getangryandyellatchild;PB17L Threatenpunishmentmoreoftenthanusingit;PB17N Enforceordonotenforcerulesdependingontheirmood
Student’sperformancescoreinreadingWeightedlikelihoodestimateinreadingability,whichisprovidedforallstudentswhoansweredatleastonereadingques‐tion.Itwastransformedtoascalewithameanof500andastandarddeviationof100byusingthedatafortheparticipat‐ingOECDcountriesonly(excepttheNetherlands).
37 Effects ofUniversityCharacteristics and Academic Regulations on Student Persistence,DegreeCompletion, andTimetoDegreeCompletion
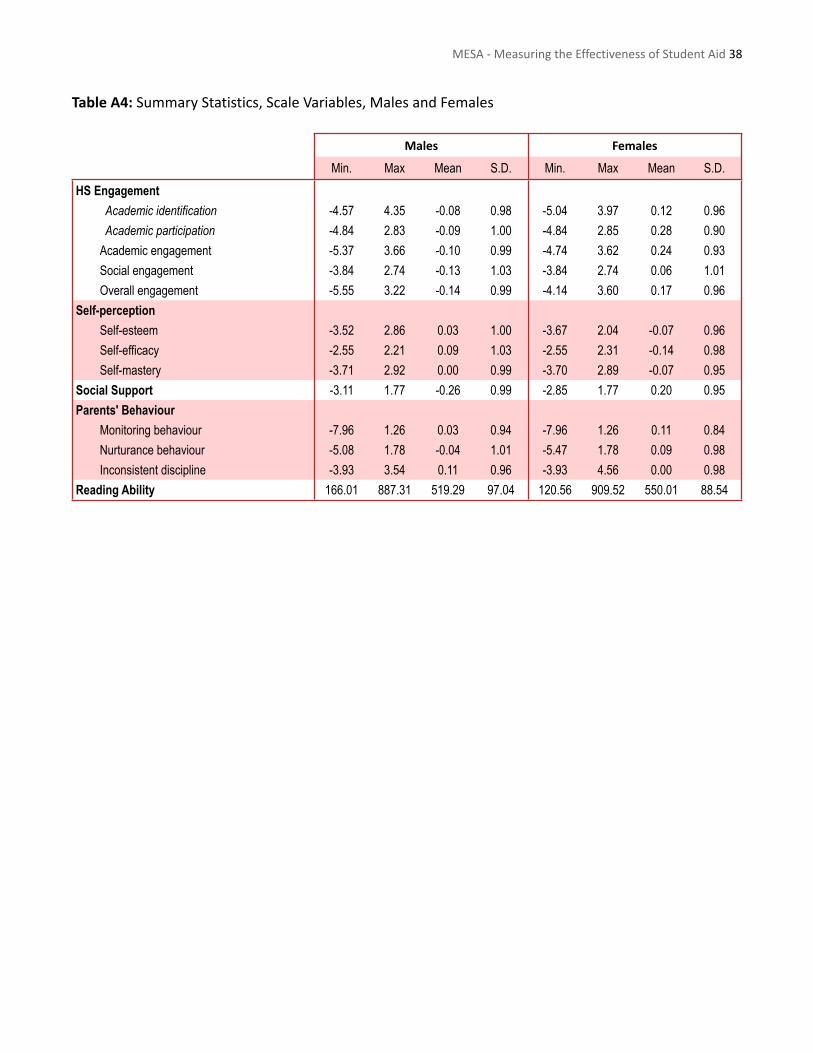
TableA4:SummaryStatistics,ScaleVariables,MalesandFemales
Males Females
Min. Max Mean S.D. Min. Max Mean S.D.HS Engagement
Academic identification -4.57 4.35 -0.08 0.98 -5.04 3.97 0.12 0.96 Academic participation -4.84 2.83 -0.09 1.00 -4.84 2.85 0.28 0.90Academic engagement -5.37 3.66 -0.10 0.99 -4.74 3.62 0.24 0.93Social engagement -3.84 2.74 -0.13 1.03 -3.84 2.74 0.06 1.01Overall engagement -5.55 3.22 -0.14 0.99 -4.14 3.60 0.17 0.96
Self-perceptionSelf-esteem -3.52 2.86 0.03 1.00 -3.67 2.04 -0.07 0.96Self-efficacy -2.55 2.21 0.09 1.03 -2.55 2.31 -0.14 0.98Self-mastery -3.71 2.92 0.00 0.99 -3.70 2.89 -0.07 0.95
Social Support -3.11 1.77 -0.26 0.99 -2.85 1.77 0.20 0.95Parents' Behaviour
Monitoring behaviour -7.96 1.26 0.03 0.94 -7.96 1.26 0.11 0.84Nurturance behaviour -5.08 1.78 -0.04 1.01 -5.47 1.78 0.09 0.98Inconsistent discipline -3.93 3.54 0.11 0.96 -3.93 4.56 0.00 0.98
Reading Ability 166.01 887.31 519.29 97.04 120.56 909.52 550.01 88.54
MESA‐MeasuringtheEffectivenessofStudentAid38