Embed Size (px)
Citation preview

TheEffectsofFuelPrices,Regulations,andOtherFactorsonU.S.CoalProduction,2008-2016
JohnCoglianeseDepartmentofEconomicsandHarvardKennedySchool,HarvardUniversity
ToddGerarden
HarvardKennedySchool,HarvardUniversity
JamesH.StockDepartmentofEconomicsandHarvardKennedySchool,HarvardUniversity
June15,2017

1
1.IntroductionandSummaryAsisshowninFigure1,between2008and2015,U.S.coalproductionfellfrom1,172milliontonsto897milliontonsandcoalemploymentfellfrom87,000to66,000.In2016,coalproductiondeclinedfurther,to739milliontons,37%belowits2008level.Itiswidelyunderstoodthataprimaryfactorinthisdeclinehasbeenthesharpdeclineinnaturalgasprices,whichhasledtothesubstitutionofnaturalgasforcoalinelectricitygeneration.In2008,thenationalaveragepriceofnaturalgasdeliveredtoanelectricitygeneratornationallywas4.3timesthepriceofcoal,onaBtubasis;by2016,thisrelativepricehadfallento1.4asaresultofthedevelopmentandspreadoffracking.Thisnationaldeclinemasksregionalvariation,withnaturalgaspricesbeingevenmorecompetitiveinsomeregions.Forthefirsttime,in2016electricitygeneratedfromgasovertookgenerationfromcoal.
Source:EnergyInformationAdministrationandBureauofLaborStatistics.EIAminingemploymentdatagothrough2015.
Figure1.U.S.coalproductionandcoalminingemployment,2002–2016.

2
Thedropingaspriceswasnottheonlyrelevantchangeinthemarketforcoalinthisperiod,however.Theseotherfactorsincludetheproliferationandexpansionofrenewableportfoliostandards(RPSs),newenvironmentalrules,changesinoverallelectricitydemand,andchangesindemandforsteamcoalexports.Inaddition,therewerefluctuationsindemandformetallurgicalcoal,spurredbychangingglobaleconomicconditions.Althoughallthesefactorsarequalitativelyrelevant,surprisingly,itremainsanopenquestionhowmuchofaquantitativerolethesefactorsplayedinthedeclineindemandforcoal.Understandingwhythisdeclineoccurred,inaquantitativesense,isimportantbecauseitshedslightonthelikelypathforcoalproductiongoingforward.Thispaperundertakesaquantitativedecompositionofthereasonsforthedeclineincoalproductionfrom2008to2016intoninefactors.Sixofthesefactorsexplainthedeclineindomesticsteamcoaluseforelectricity,whichaccountsforthebulkofU.S.coalproduction:changesinthepriceofcoalrelativetogas,environmentalregulations,renewableportfoliostandards,heatrates,overallelectricitydemand,andanunexplainedresidual.TheremainingthreefactorsrelatetotheotherusesofU.S.coal:changesinindustrialuse,netexports,andmetallurgicalcoal.Thedecompositioncombinesthreemethodologicalapproaches.First,wedecomposecoal’sshareofelectricitygenerationintotheeffectofchangingrelativeprices,airregulations(otherthanMATS),andrenewableportfoliostandardsoncoal’sshareofelectricitygeneration.Thisdecompositionisdoneeconometricallyusingmonthlydataongeneration,deliveredfuelprices,regulations,andRPSsbystate,allowingfordifferentseasonalpatternsacrossstates.Second,theoneairregulationthattookeffectoverthisperiodthatdoesnothaveregionalvariation–andthusisnotidentifiedbyvariationacrossstates–istheMATSrule.Here,weundertakeanovel“eventstudy”analysisoftheelectricitygeneratingunits(EGUs)thatlikelywereclosedasaresultofthisrule,andaddtheresultsintotheeconometricdecomposition.BecausesteamcoalforelectricitygenerationisthedominantuseofcoalintheUnitedStatesandbecausetotalelectricitygenerationwasroughlyconstantoverthisperiod,theeconometricdecompositionplustheMATSeventstudyaccountsformostofthechangesincoaldemand.Tocompletethedecomposition,weuseanaccountingapproachtoaddintherelativelysmallamount(intons)ofproductionarisingfromchangesinelectricityconsumption,inexportsofsteamcoal,andinmetallurgicalcoaldemand.Figure2presentstheresultingdecompositionofthedeclineincoalproductiontonnagefrom2008to2016(numericalvaluesarepresentedinSection5).Accordingtoourestimate,thedecliningpriceofnaturalgasrelativetocoal,onanenergy-adjustedbasis,explains92%ofthedeclineincoalproduction.Anadditional10%ofthedeclineisexplainedbyenvironmentalregulations,primarilytheCross-StateAirPollutionRule(CSAPR)andtheMercuryandAirToxics

3
Standard(MATS),whichtookeffectin2015through2016.Theremainingsevenfactorscontributesmall,largelyoffsettingamountstothechangeincoalprices.Weattributeasmallamountofthedecline,9milliontons,totheadoptionofRPSs,whileforthemiddlepartofthisperiodthegrowthincoalexportscontributedpositively.Thereisalsoasmallunexplainedcomponent,whicharisesfrommeasurementerrorfromcombiningdatafromdifferentsurveysandtheregressionresidualinthestate-leveleconometricmodelofshares.
Source:EIAdataandauthors’calculations
Figure2.Decompositionofchangesincoalproduction,2008-2016
Thedominantroleoftherelativepriceofcoaltonaturalgasinthisdecompositioninformstheprospectsforareboundinthecoalmarket.Becausethemajordriverinthedeclineistherelativepriceofcoaltonaturalgas,prospectsforareboundlargelyhingeonthepathofthisrelativeprice.EIA(2017)projectsnaturalgaspricesrisingslightlyoverthenextdecadeintheirreferencescenario,risingtoaround$5/MMBtuin2040,wellbelow2008prices.Somemarketdevelopmentsandpolicyactionscouldaffectthesepaths.Greateraccesstogasandcoal

4
depositsonfederallandswouldtendtolowerbothcoalandgaspricesandtheeffectonrelativepricesisinprincipleambiguous.However,becausesomeofthereductionincoalconsumptioninfavorofgasoccurredthroughearlyretirementsofcoalunits,wewouldnotexpectareversalinthecoal-gaspricetrendtoresultinafullreversalincoaldemand.Similarly,becausetheairregulationsweremeteitherbyinstallationofemissionscontrolsorbyclosingplants,possibleweakeningofthoserulesinthefutureareunlikelytocauseareversaloftheireffectsforgeneratorsnowincompliance.EIA(2017)alsoprojectstotalelectricitydemandtobeflatoverthenexttwodecadesunderalltheirscenarios.EvenifstatesscalebackRPSgoals,pastRPSshaveincentivizedtheconstructionofrenewablegenerationandthosefacilitieswillremain.Takentogether,ourmodelanddecompositionsuggeststhatintheprojectedenvironmentofstablerelativepricesofcoaltogas,existingrenewablespenetration,andstabletotalelectricitydemand,theprospectsforareboundincoalproductionareslim.Atthesametime,barringpricedecreasesofcompetitors–gasorrenewables–ourresultsareconsistentwithaplateau,notacontinuingdecline,incoaluse,undercurrentregulations.Thetwomarketthreatstothisplateaugoingforwardwouldbefurtherdeclinesinthepriceofnaturalgasandpotentialdeclinesinthepriceofrenewables.Concerningrenewables,ShanklemanandWarren(2017)projectsubstantialrenewablepricedeclines,butwenotethatthefullcostforbuildingnewrenewablesmustbeabletocompetewiththemarginalcostofcoalinexistingfacilitiesforrenewablestoproducesubstantialpenetrationofthecoalmarketwithoutpolicysupport.Atthesametime,wefindevidenceofhighpricesensitivityoftheshareasthepricesapproachenergyparity,sofurtherdropsinthepriceofnaturalgasrelativetocoalcouldsubstantiallyreducecoaldemandevenfurther.Thispaperismostcloselyrelatedtothreeotherpapersintheliterature.Knittel,Metaxoglou,andTrindade(2015)useplant-levelpaneldatatoidentifytheresponseofelectricitygenerationfromcoaltochangesintherelativepriceofcoaltonaturalgasandthenexaminehowthisresponsevariesbyownershipandmarkettype.Ouranalysisusesasimilarmethodologytomeasureresponsestorelativeprices,butfocusesonusingtheseestimatestodecomposechangesinoverallcoaldemand.Hauser,Bordoff,andMarsten(2017)decomposethedeclineincoaldemandintothecontributionsofseveralfactorsincludingenvironmentalregulations,measuringtheeffectsofeachregulationfromEPA’sexanteestimateintheRegulatoryImpactAnalysis,andmeasuringgas-coalsubstitutionbydeparturesofthosefuelsfrom2006EIAprojections;theiranalysisdoesnotusecoalorelectricityprices.Ouranalysisusesexpostdatatomeasuretheeffectsofenvironmentalregulations.Lastly,CulverandHong(2016)arguethatthelowerfuelcostsofnaturalgasandlowervolatilityofthesepricesmeanthatnewpowerplantsshouldbepoweredbynaturalgasinsteadofcoal;theyalsodiscusshowregulationsandpriceshaveaffectedcoal-firedgenerationfromexistingplantsbutdonotprovideanyformal

5
empiricalmodelornumericaldecompositions.OuranalysisexamineschangesinfuelusageacrossallEGUs,bothnewandexisting. Section2describesthedataandSection3presentsthemethodsandresultsforthestatepaneldataeconometricanalysis.Section4presentstheMATSeventstudy,andSection5explainstheoveralldecomposition.
2.Data2.1DatasourcesPartsofthisanalysisuseaggregatetimeseriesdataonthecoalmarket.DataonannualcoalproductioncomefromtheEnergyInformationAdministration(EIA)CoalDataBrowser.Coalconsumptionforelectricitygeneration,averagecoalpricesforelectricity,andaveragenaturalgaspricesforelectricityaretakenfromtheEIAElectricityDataBrowser.QuarterlydomesticconsumptionofmetallurgicalcoalwasdownloadedfromtheEIAOpenDataAPIandaggregatedtoanannualfrequency.WeuseddataonquarterlyexportsandimportsofcoalbyoriginanddestinationcountryfromtheEIAOpenDataAPIandaggregatedtoanationalannualtimeseriesofnetexportsfortheUS.Wealsoconstructpaneldataonelectricityproductionandthecoalmarketatthestatelevel.Weobtaindataonelectricitygenerationbothfromcoalandintotalacrossallfuels(bothinMWh)atthestatelevelfromtheEIAOpenDataAPIcoveringtheperiod2001-2016.DataonconsumptionofcoalbyEGUs,alongwiththedeliveredpricesofcoalandnaturalgasusedinelectricitygenerationaretakenfromtheEIApublicationElectricPowerMonthlyoverthe2003-2016period.EIAconstructsthedeliveredpricesofcoalandnaturalgasasaweightedaverageoverEGUs,weightedbythequantityofeachfuelusedbyEGU.Theheatrateisestimatedastheratioofa12-monthmovingaverageofstatecoalconsumptiontoa12-monthmovingaverageofstategenerationfromcoalpower.Thedatacontainsomemissingvaluesondeliveredfuelprices.1Although18%ofthepricesweremissing,thoseobservationsaccountforonly14%ofcoalgeneration.Wehandlethesemissingvaluestwoways.Forourprimaryresults,weomitobservationswithmissingpriceswhenestimatingtheregressions.Asasensitivitycheck,were-estimatethepaneldataregressionsusingimputedprices.Theimputedpriceisthepredictedvaluefromaregressionof
1EIAonlyreportsstateaveragedeliveredpriceswhensufficientlymanyEGUsreportingdeliveredpricesthataveragesdonotdiscloseconfidentialbusinessinformation.

6
logpricesonstateandtimefixedeffects,sothattheimputedlogpriceisthenationallogpriceforthatmonth,adjustedforaconstantstatedeparturefromthenationallogprice.Giventheregressioncoefficients,thecoaldeclinedecompositioniscomputedusingthefullsetofprices,observedandimputed.Wealsocreatedpaneldataonenvironmentalregulationsatthestatelevel.WeconstructindicatorstocapturewhetherindividualCleanAirActregulationsaffectagivencoalgeneratorbasedonthedateeachregulationwentintoeffectandthestateseachregulationcovered.ThisinformationwasgatheredfromtheEnvironmentalProtectionAgency(EPA)websiteandregulatoryfilings.TheCleanAirActregulationsincludedare:
• OTCNBPSeasonalNOx• NOxSipCallNBTPSeasonalNOx• CAIRAnnualNOx• CAIRSeasonalOzone• CAIRAnnualSO2• CSAPRAnnualSO2/NOx• CSAPRSeasonalOzone• MATS
Thisprocessresultedinabinaryvariableforeachregulation,withaoneindicatingthatoneormore(typically,all)EGUsinthatstate/monthweresubjecttotheregulation.Preliminaryanalysisshowedthatthereisinsufficientvariationinthedatatoestimateseparatecoefficientsforeachoftheserules.WethereforecombinedalltheCAIRrulesintoasingleCAIRdummyvariable,andwealsocombinedtheCSAPRrulesintoasingleCSAPRdummyvariable.ForallregulationsexceptforMATS,thisresultedinregulationsthathavevariationacrossstatesinmultiplemonths,sothatforthoseregulationstheeffectoftheregulationsisidentifiedfromstatevariation.Thisleavesuswithfourregulatorydummyvariableswithstate-levelvariationoverthisperiod:OTCNBPSeasonalNOx,NOxNBTP,CAIR,andCSAPR.ForMATS,theregulationaffectedallcoal-firedEGUssotheMATSbinaryindicatorisineffectatimedummyvariablethattakesthevalueofoneafterthecompliancedate.Wedonotusetimeeffectsinourregressionsbecausedoingsowouldattributethedeclinetotimeeffectswithoutenergy-economicsubstantivecontent.InsteadofidentifyingMATSfromtimeseriesvariation,weundertakeaplantclosingeventstudy,whichisreportedinSection4.Forthatstudy,weuseddataonplannedplantclosuresfromEIAForm860;thedetailsarediscussedinSection4.WeincorporatedataonRenewablePortfolioStandards(RPS)fromtheDatabaseofStateIncentivesforRenewablesandEfficiency(DSIRE)maintainedbytheNCCleanEnergy

7
TechnologyCenter.Ideally,wewouldliketohavetotalgenerationin-statemandatedbytheRPSs;howeverinpracticeitisnotfeasibletoconstructthatseries,bothbecauseoflackofrenewablegenerationquantitytargetdataforsomestatesandbecauseRPSrequirementstypicallycanbemet,tovaryingdegrees,byinterstatetradingofrenewableenergycredits.WethereforeusedasimplerRPSmeasure,whichisabinaryindicatorforthepresenceofanRPSbasedonthedateastatefirstestablisheditsRPS.Finally,ofatotalof8,429observations,89observationshavenocoal-firedelectricitygeneration.Mostoftheseobservationsareforstates(likeOregon,Washington,andCalifornia)inwhichthefinalcoal-firedEGEwasretiredduringthesampleperiod.These89observationsweredroppedfromtheanalysis.Wealsodroppedstateswithnocoal-firedgenerationovertheentireperiod(Idaho,RhodeIsland,Vermont,andD.C.).2.2DatadescriptionFigure3showstotalelectricitygenerationfromcoalpowerplantsintheUSsince2008(leftaxis)aswellasthenationalaveragedeliveredpricesofcoalandnaturalgasusedforelectricpower(rightaxis).Coalgenerationfellnearly40%overthistimeperiod.Itisalsohighlyseasonal,withseasonalpeaksforsummercoolingandwinterheating.Althoughcoalpriceswerefairlystable,naturalgaspricesfellbyalmosttwo-thirdsbetween2008and2016.

8
Source:EIA
Figure3.Electricitygenerationfromcoalandthedeliveredpricesofcoalandnaturalgas(monthlyfortheU.S.)
Thestrongseasonalityincoalgenerationobscurestherelationbetweencoalgenerationandgasprices,orrelativepricesofcoaltogas.Figure4thereforeplotsU.S.coaluseforelectricitygenerationandtheratioofthenational-averagedeliveredpriceofnaturalgastocoal,bothseasonallyadjustedinlogarithms.2Afterseasonaladjustment,astrongrelationshipbetweencoalconsumptionandnaturalgaspricesisapparent.Coalconsumptionmovescloselywiththerelativeprice.Thisco-movementisnotjustaconsequenceofbothseriescontaininga
2Theseasonalswereestimatedseparatelyforeachstateinaregressionofthelogarithmoftheseriesonmonthlydummyvariables.Thismirrorsthetreatmentofseasonalsinthepaneldataregressions,whichincludestate-by-montheffects.Analternativewouldbetoestimatetheseasonalsusingamethodthatallowstheseasonalstoevolve,suchasCensusX-11;howevergiventheshortdatasetheretheend-pointproblemsofseasonaladjustmentwithchangingseasonalsbecomesimportantsoweelectedtofixtheseasonals.

9
downwardtrend,rathertheincreaseoftherelativepricein2012through2013,andagaininthesecondhalfof2016,wasmatchedbyanincreaseincoalgeneration.
Source:EIAandauthors’calculations
Figure4.SeasonallyadjustedlogmonthlyU.S.coaluseatEGUsandlogrelativepriceofnaturalgastocoal,2009-2016
3.StatePanelDataAnalysisoftheCoalShareinElectricityGeneration
3.1MethodsThepaneldataregressionsestimatetheresponseoftheshareofelectricitygenerationbycoaltotherelativepriceofcoaltogas(onanenergycontentbasis),toenvironmentalregulations,andtothepresenceofRPSrequirements.Allregressionsareonmonthlydatabystateandincludestateeffectsandafullsetofmonthlyseasonalsforeachstate;thatis,allregressionsincludestateeffectsandinteractionsofthestateeffectswith11monthlybinaryindicators.

10
Becausethesharesareconstrainedtobebetweenzeroandone,weusealogistictransformoftheshares.Thisdoesnotensurelinearityoftheresultingspecificationandwethereforeexaminepossiblenonlinearities,inparticularnonlinearitiesintherelationshiptorelativeprices.Inaddition,wewanttoallowforthepossibilityofadjustmentlags,sothattheeffectofachangeinfuelpricesmightnottakefulleffectforseveralmonths,perhapsduetophysicalorcontractualadjustmentconstraints.Weallowfortheselagsintwoways:first(inourbaselinespecification)byusingthelogrelativepriceofmulti-monthmovingaveragesofthefuelprices,andsecondbyusingadistributedlagofthemonthlyfuelprices.Werefertotheserespectivelyasthestaticandthedynamicspecifications.Specifically,letgitdenotethefractionofelectricitygeneratedbycoalpowerinstateiandtimet.Thestaticspecificationis,
2( ) 1 1logit( ) ( )MA MA
it im t it it it it itg p p x r ua b b g q= + + + + + , (1)
whereaim(t)arestate-by-calendar-monthfixedeffects, MA
itp isamovingaverageofcurrentand
pastlogrelativeprices,𝑥"#isavectorofregulatorydummyvariables,and𝑟"#isadummyvariableforwhetherRenewablePortfolioStandardswereineffect.Inthebasespecification,MAitp isamovingaverageofcurrentand5lagsoflogrelativeprices.Thevectorofregulatory
variablesincludes:1)adummyforwhetheranyoftheCleanAirInterstateRule(CAIR)regulationsgoverningNOx,ozone,orSO2wereineffect;2)adummyforwhethereithertheyear-roundNOx/SO2ruleortheseasonalozonerulefromtheCross-StateAirPollutionRule(CSAPR)wereineffect;3)adummyforwhethertheNOxSipCallNBTPSeasonalNOxrulewasineffect;and4)adummyforwhethertheOTCNBPSeasonalNOxrulewasineffect.Thedynamicspecificationallowsforricherdynamics,butdoesnotparametricallyincorporatenonlinearities.LetLbethelagoperatorandletb(L)bealagpolynomial.Thedynamicspecificationis,
( )logit( ) (L) (1 ) (L)it im t it it it it it it itg D p D p x r ua b b g q= + ´ + - ´ + + + , (2)
wherepit= ( )ln /coal gasit itP P andDitisabinaryindicatorthatequalsoneifpitisabovethemedian
relativeprice.Theterm (L)it itD pb´ denotesthecurrentvalueandninelagsoflogrelative
prices,whereeachoftheregressorsisinteractedwithDit(sotheregressorforthekthlagwouldbeDitpit-k).Thedummyvariableinteractionspecification(2)allowsfordifferentpricedynamics,

11
includingdifferentcumulativeelasticities,dependingonwhethertherelativepriceishighorlow,whileimposingthatthecoefficientsontheremainingregressorsdonotdependontherelativeprice.Thisisaparametric(interaction)versionofthepartiallylinearregressionmodel.Wewillinterprettheresponsestoasmallchangeinlogprices,asestimatedbytheseregressions,aselasticitiesorsemi-elasticitiesofdemand,dependingonthesetting.Ifpriceswereexogenousthenwecouldassociatetheseregressionestimateswithestimatesofdemandelasticities.Overthisperiod,alargeportionofthedeclineinthegaspricestemsfromthedevelopment,improvement,anddeploymentoffrackingtechnology,whichfromtheperspectiveofdemandestimationconstitutesanexogenousshiftinthesupplyofgas.Theavailabilityoffrackedgasdependsonlocalpipelineinfrastructureandthechanginglocationoffrackingfieldswhichprovidesadditionalstate-levelexogenousvariationinprices.Althoughthereareseasonalswingsingaspricesasaresultofseasonalchangesindemand,allthespecificationsincludestate-levelseasonalswhichabsorbthissourceofpotentialendogeneity.Tous,thesefeaturessuggestthattreatingrelativepricesasexogenousisaplausibleapproximation.Thatsaid,transientvariationsinregionaldemand(e.g.aparticularlycoldwinter)wouldplausiblyleadtoregionalpricevariationssocoal,orgas,orrelativepricesare,strictlyspeaking,notexogenous.Resolvingthischallengewouldrequireaplausiblyexogenousinstrument.Therearecrediblesourcesofexogenousshiftsinsupply,forexamplerelatedtofrackingtechnologydevelopment,railtransportpricespikesforcoal(astherewerein2012-2014asrailtransportofoilincreased),orregionalvariationinsuccessfulgasexplorationwells.Forourpurposes,however,thedemandsforsuchinstrumentsarehighbecausetheyshouldmapoutregionalvariation,whichwouldallowustoidentifytheeffectsofenvironmentalregulationsandRPS.Butdevelopingsuchinstrumentsisbeyondthescopeofthispaper.3.2ResultsTable1presentstheestimatedcoefficientsinthebaselineandalternativeregressions.Wehighlightfourfeaturesoftheseresults.

12
(1) (2a) (2b) (3) (4a) (4b) (5) (6) Logit(CoalShareofElec.)
pMAit -1.329*** -- -- -1.425*** -- -- -0.724*** -1.405***
(0.181) -- -- (0.283) -- -- (0.0954) (0.188)pMA
it2 -0.304*** -- -- -0.314** -- -- -- -0.334***
(0.0769) -- -- (0.108) -- -- -- (0.0752)DynamicCoefficientsforAbove/Below
MedianRelativePrice-- Below
MedianAboveMedian
-- BelowMedian
AboveMedian
-- --
Δpit -- -0.357*** -0.939*** -- -0.371*** -0.818*** -- -- -- (0.0528) (0.164) -- (0.0570) (0.204) -- --
Δpit-1 -- -0.441*** -1.091*** -- -0.465*** -1.035*** -- -- -- (0.0583) (0.172) -- (0.0699) (0.219) -- --
Δpit-2 -- -0.505*** -1.031*** -- -0.523*** -0.988*** -- -- -- (0.0627) (0.184) -- (0.0773) (0.229) -- --
Δpit-3 -- -0.514*** -0.869*** -- -0.582*** -0.847*** -- -- -- (0.0708) (0.143) -- (0.0879) (0.196) -- --
Δpit-4 -- -0.543*** -0.899*** -- -0.609*** -0.867*** -- -- -- (0.0728) (0.137) -- (0.0953) (0.183) -- --
Δpit-5 -- -0.639*** -0.824*** -- -0.685*** -0.808*** -- -- -- (0.0822) (0.124) -- (0.0996) (0.188) -- --
Δpit-6 -- -0.592*** -0.907*** -- -0.629*** -0.931*** -- -- -- (0.0803) (0.129) -- (0.102) (0.203) -- --
Δpit-7 -- -0.675*** -0.975*** -- -0.703*** -0.988*** -- -- -- (0.0931) (0.141) -- (0.111) (0.208) -- --
Δpit-8 -- -0.583*** -0.877*** -- -0.688*** -0.909*** -- -- -- (0.0929) (0.145) -- (0.107) (0.218) -- --
pit-9 -- -0.800*** -1.081*** -- -0.896*** -1.082*** -- -- -- (0.0962) (0.150) -- (0.135) (0.226) -- --
CAIRDummy 0.0245 -0.00991 0.0986 0.0998 0.0492 0.0261 (0.0954) (0.0983) (0.103) (0.105) (0.0983) (0.0981)
CSAPRDummy -0.0992 -0.179 0.00296 -0.0544 -0.190 -0.0771 (0.127) (0.114) (0.173) (0.160) (0.126) (0.135)
OTCNOxDummy -- -- 0.395* 0.446* -- -- -- -- (0.180) (0.174) -- --
NBTPNOxDummy -0.0786 -0.0930 0.0237 0.0391 -0.00244 -0.145 (0.0898) (0.0777) (0.126) (0.127) (0.104) (0.0840)
RPSDummy -0.183 -0.117 -0.278** -0.235** -0.129 -0.188* (0.0956) (0.105) (0.0802) (0.0828) (0.102) (0.0920)
IncludesImputedPrices No No No Yes Yes Yes No NoMovingAverageLength 6Months -- -- 6Month -- -- 6Months 3Months
N 6325 6037 8340 8340 6325 6585
Notes:Dependentvariableisthelogistictransformofthestate-monthcoalshareingeneration.RegressorsaredescribedinSection3.1.Standarderrorsaretwo-wayclusteredbystateandtimeperiod.Allregressionsareestimatedon2002m1–2016m12.Significantatthe*5%,**1%,***0.1%level.
Table1.Panelregressionresults,sharesregressionsFirst,theeffectsofairregulationsandRPSrequirementsareestimatedtoreducethecoalshare,althoughmostcoefficientsarenotstatisticallysignificant.Inthebaselineregressions(1)and(2),thecoefficientsforRPS,CSAPR,andNBTPNOxareallestimatedtoreducethecoalshare.AlthoughthebaselineregressionsestimatedthatCAIRincreasedthecoalshare,thesecoefficientsarebothsmallandstatisticallyindistinguishablefromzero.WeviewthisasconsistentwithCAIRruleshavingasmall(possiblynegative)effectonthecoalshare,whichisdifficulttoidentifypreciselyfromstate-levelvariation.Second,asillustratedinFigure5,thenonlineartermintherelativepricesisstatisticallysignificantandconsistentwiththedemandbeingmoreelasticathigherrelativeprices.Consistentwiththegoodfitofthequadraticspecificationinthefigure,higherorderpolynomial

13
termsdonotsubstantiallychangetheestimatedfit.Restrictingtoalinearspecification,asinregression(5),resultsinaworsefitparticularlyduringthelateryearsofoursampleperiodwhenfallingnaturalgaspricesraisedtherelativepriceofcoal.
Notes:Bothvariablesareresidualizedonmonth-by-statefixedeffectsandregulatorydummiesbeforeplotting.Source:authors’calculations.
Figure5.Binnedscatterplotofshares(logittransform)v.logrelativeprice,controllingfornon-pricevariablesinthestaticregressionofTable1,column(1).Third,theestimateddistributedlagcoefficientsareconsistentwithmostoftheeffectofarelativepricechangeoccurringquickly,withinthefirstfewmonths.Figure6showsthecumulativedynamiceffectofaonepercentagepointchangeintherelativepriceusingvariousspecificationsinTable1.Whentherelativepriceishigh(approachingone),theeffectofaonepercentchangeintherelativepriceonthelogittransformoftheshareisroughlytwicewhatitiswhentherelativepriceislow.Thusthefigureprovidesadditionalevidencethatthestaticspecificationprovidesanaccurateapproximationtothemorecomplicateddynamicsofthedynamicspecification.Thestraightdashedlinesarethevaluesofthiseffect,estimatedusing

14
thestaticmodel.Thestaticestimatescloselyapproximate,andarewithinonestandarderrorof,thecumulativeeffectsinthetwo-regimedynamicspecification.Weinterpretthisfigureasprovidingsupportforusingthestaticspecificationforthedecomposition.
Notes:Thedynamicresponsescorrespondtocolumns(2a)and(2b)ofTable1.TheconstantdashedlinesaretheimpliedresponsesusingthestaticspecificationinTable1,column(1),evaluatedatthemeanrelativepriceinthesubsamplesusedtoestimatecolumns(2a)and(2b).Figure6.Cumulativedynamicresponseofcoalshare(logistictransform)toa1percentagepointchangeinthecoal-gasrelativeprice.Fourth,thedynamicandstaticregressionsgivesimilarpredictionsforchangesincoaldemand,andbothprovidegoodfitstothestate-levelsharedata.Figure7showsthepredictedvaluesfromthestaticregressionandfromthedynamicregression;botharefitoverthefullsample(notsplit-sampleforthelinearspecification)forfourrepresentativestates.Pennsylvaniahasamoderateuseofcoalwithlittleseasonalityandbothregressionsaresimilarlyclosetotheobserveddata.Incontrast,Montanahasstrongseasonalpatterns,butbothregressionsareabletofitthisdataowingtothestatebycalendarmonthfixedeffects.Wenotethat

15
comparablefigures(notshown)withoutthelogistictransformprovidespoorfitsforstateswithsharesnearzerooroneasare,respectively,NewYorkandWestVirginia,andinparticularoccasionallyproducepredictedsharesoutsidetheir0-1range.Thefitofthedynamictwo-regimemodelismarginallyworseinsomecasesthanthestaticlinearmodel,presumablybecausethenonlinearityisapproximatedinawaythatisnotsmooth.Thisplottoosupportstheuseofthestaticspecification.
Figure7.Actualandpredictedsharesforfourrepresentativestates:staticanddynamicspecifications(full-sampleestimates).
4.MATSEventStudyTheMATSruleregulatedemissionsoftoxicairpollutantsincludingmercury,arsenic,andheavymetalsfromcoal-andoil-firedpowerplants.Therulessetouttechnology-basedstandards.EPAexpectedthatitwouldbeeconomicallymorecost-effectivetoretiresomeplantsthantoimplementnewtechnology.InitsRegulatoryImpactAnalysis,EPAestimatedthat4.7GWof

16
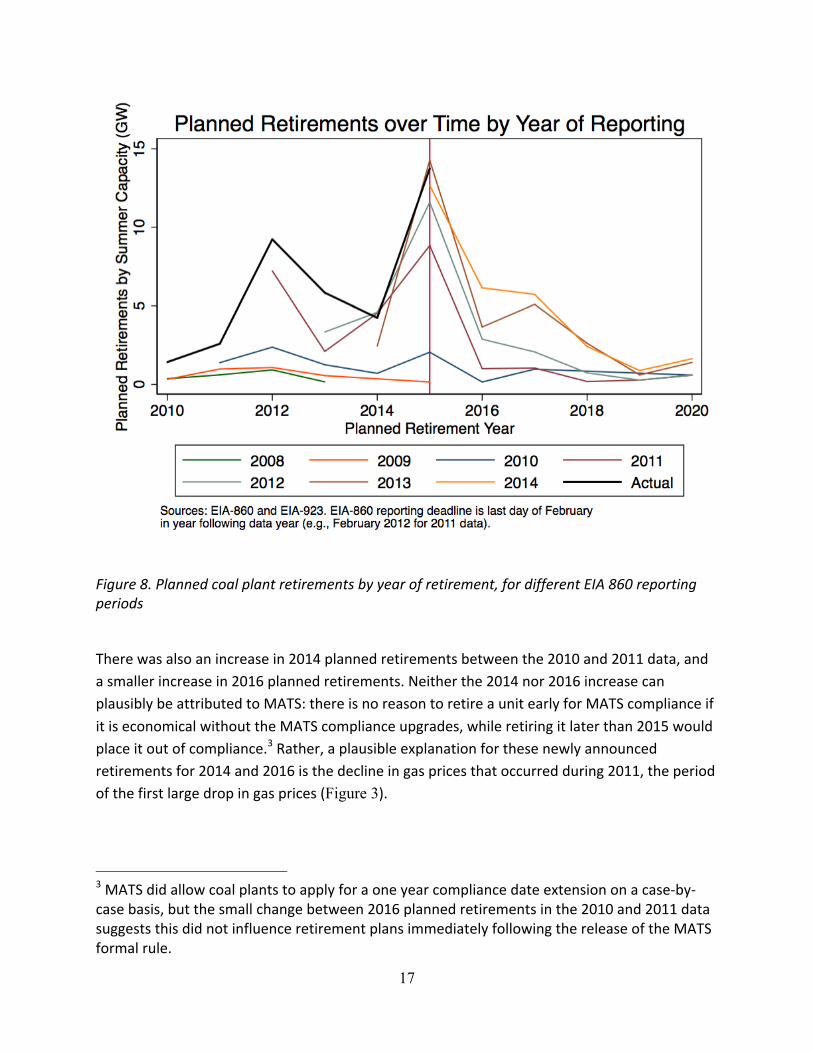
capacitywouldberetiredforMATScomplianceandthatpowersectorcoalconsumptionin2015wouldfallbyonepercentasaresultofMATS(EPA,2011).TheMATSruletookeffectin2015.BecausetheMATSruleappliednationally,adummyvariableindicatingtheMATSruleisnotseparatelyidentifiedfromtimeeffectsincludingnationalmeanchangesinprices,soestimatingtheeffectofMATSoncoalgenerationshareisnotamenabletotheregressionmethodsoftheprevioussection.Inthissection,wethereforetakeadvantageofaconvenientinstitutionalfeatureoftheMATSrulemakingtoundertakeaneventstudythatestimatesplantclosingsasaresultofMATS.Giventhisplantclosingsestimate,weestimatethesubsequenteffectoftheseclosingsoncoalconsumption.TheMATSrulehadbeenintrainfornearlytwodecades.TheCleanAirActamendmentsof1990requiredEPAtoprepareastudyonthehealtheffectsofhazardouspollutionfrompowerplants,andEPAsubmittedthestudyin1998.In2000,EPAdeterminedthatregulatingthosepollutantswasappropriateandnecessary.Afterlitigationandcourtdelays,theMATSrulewasproposedonMarch16,2011andwasfinalizedonDecember21,2011.UsingdatafromtheEIA,weareabletoestimatetheimpactoftheMATSrulepromulgationonplannedplantclosings.Conveniently,theEIAdata(EIAForm860)arecollectedbyasurveyofEGUowners,withadeadlineoftheendofFebruary,twomonthsaftertherelevantreportingyear.Thusformsfilledoutinearly2011wouldnothavetakenintoaccounttheMATSrule,whichhadnotyetbeenproposed,whileformsfilledoutinearly2012wouldtakeintoaccountthefinalizedMATSrule.Amongotherthings,EIAForm860asksforwhetheraunitisplannedtoberetiredand,ifso,whentheretirementisplannedtooccur.Becausethefinalruleincludedacomplianceschedule,withfinalcomplianceinMarch2015,changesinEIAForm860between2011and2012forretirementsplannedtooccurin2015canplausiblybeassociatedwiththeMATSrule.Someoftheseretirementsmightbeexpeditedplannedretirements,whileothersmightbenewlyplannedretirements.Figure8presentsaggregateplannedretirementsofcoalcapacityovertime,byyearofreporting.Asthefigureshows,thereisaspikeinretirementsin2015,thereportingyear.Muchofthatspikeisassociatedwithretirementsthatwerenotplannedinthe2010data,butwereplannedinthe2011data;thatis,retirementdecisionsthatoccurredbetweenFebruary2011andFebruary2012.
17
Figure8.Plannedcoalplantretirementsbyyearofretirement,fordifferentEIA860reportingperiods
Therewasalsoanincreasein2014plannedretirementsbetweenthe2010and2011data,andasmallerincreasein2016plannedretirements.Neitherthe2014nor2016increasecanplausiblybeattributedtoMATS:thereisnoreasontoretireaunitearlyforMATScomplianceifitiseconomicalwithouttheMATScomplianceupgrades,whileretiringitlaterthan2015wouldplaceitoutofcompliance.3Rather,aplausibleexplanationforthesenewlyannouncedretirementsfor2014and2016isthedeclineingaspricesthatoccurredduring2011,theperiodofthefirstlargedropingasprices(Figure 3).
3MATSdidallowcoalplantstoapplyforaoneyearcompliancedateextensiononacase-by-casebasis,butthesmallchangebetween2016plannedretirementsinthe2010and2011datasuggeststhisdidnotinfluenceretirementplansimmediatelyfollowingthereleaseoftheMATSformalrule.

18
WethereforeestimatetheadditionalMATS-relatedretirementsasthedifferencebetweentheincreaseinthe2015plannedretirements,minustheaverageincreasein2013,2014,and2016plannedretirements.ThisestimateddeclineinnameplatecapacityisshowninTable2.BecausetheindividualplantsareidentifiedintheForm860data,alongwiththeircoaluseinthereportingyear,wecancomputethedeclineincoaldemanddirectlyassociatedwiththeseplantclosures.Notethatthisdecline,alsoshowninTable2,isarguablyanoverestimateofthereductionincoaldemand,becauseitdoesnotaccountforapotentialincreaseincoaluseinnon-retiredunitstomakeupforthelostgenerationattheretiredunits.
Source:EIAForm860andauthors’calculations.
Table2.Event-studyestimateofMATSretirementeffectonnameplatecapacityanddirectcoalconsumption.AscanbeseeninTable2,theevent-studyestimateoftheeffectoftheMATSruleisareductioninnameplatecapacityof5.1GW,veryslightlygreaterthantheEPA’sestimate,andanassociatedreductionincoaldemandof6.2milliontons.
5.DecompositionInthissection,wedecomposethedeclineofcoalproductionintheUSsince2008intoseveralcomponents,buildingonresultsfromtheprevioustwosections.
A.NameplateCapacity(GW)
Surveyyear 2012 2013 2014 2015 20162010 2.7 1.4 0.8 2.4 0.22011 7.5 2.4 5.0 9.6 1.1
Difference,2011-2010 4.8 1.0 4.3 7.2 1.0non-MATSestimate 2.1MATSestimate 5.1
B.CoalConsumption(millionshorttons)
Surveyyear 2012 2013 2014 2015 20162010 4.6 2.3 1.2 4.6 0.32011 11.2 3.0 8.0 14.1 2.6
Difference,2011-2010 6.6 0.7 6.8 9.4 2.3non-MATSestimate 3.3MATSestimate 6.2
Retirementyear
Retirementyear

19
5.1MethodsOurdecompositionstartsbydecomposingtheconsumptionofcoalinyearyintocoalusedfordomesticelectricitygeneration,domesticindustrialsteamcoaluse,netsteamcoalexports,andmetallurgicalcoal.Thusthechangeincoalconsumptionfrom2008toyearyisthesumofthechangesofthesecomponents:
Total elec industrial netExports MetC C C C CD = D +D +D +D , (3)
whereΔCTotalisthechangeintotalcoalconsumptionfrom2008toyeary,thatis,ΔCTotal=
2008Total TotalyC C- ,andsoforthfortheotherterms.Weignorechangesincoalstocksandthus
equateannualconsumptionandannualproduction.Theunitsaremillionsoftonsofcoal.TheanalysisofSections3and4allowsusfurthertodecomposecoalusedforelectricitygenerationintochangesinrelativeprices(p),environmentalregulations(x),RPS(r),heatrates(h),andelectricitydemand(E)aswellasanunexplainedcomponent.Writecoalconsumedforelectricityinyearyasthesumofcoalforelectricityineachofthe50statesplusWashington
D.C.,thatis, 51
1elec elecy iyiC C
==å ,wherecoaltonnageconsumedinstateiinyearyistheproductof
itsshareingeneration,theheatrateinthatstate-year,andtotalgenerationinthatstate-year:eleciyC = iy iy iyg h E .TheeconometricmodelofSection3furtherrepresentsgiyintermsofpiy,xiy,
andriy.Becausecoalforelectricityisanonlinearfunctionofthepricesandtheotherdeterminants,weuseadecompositionbasedonrepeatedconditionalexpectations;thisapproachspecializestothefamiliarlineardecompositioninthecasethatthedeterminantsenteradditively.Letpydenotethesetofstateprices{piy}inyeariandsoforth.Nowdefinevytobetheunexpectedcomponentofcoalelectricity,giventhesedeterminants,thatis,vy=
( )| , , , ,elec elecy y y y y y yC E C p x r h E- ,sothat(identically) elec
yC = ( )| , , , ,elecy y y y y y yE C p x r h E v+ .Thus
thechangeincoalburnedforelectricitybetween2008andyearycanbewrittenas,
( ) ( )2008 2008 2008 2008 2008 2008 2008| , , , , | , , , ,elec elec elecy y y y y y yC E C p x r h E v E C p x r h E vé ù é ùD = + - +ë û ë û . (4)

20
Thisexpressioninturncanbeexpandedasthesumofdifferencesofconditionalexpectations,changingoneconditioningvariableatatime:4
( ) ( )( ) ( )( ) ( )
2008
2008 2008 2008
2008 2008 2008 2008 2008
2008 2
| , , , , | , , , ,
| , , , , | , , , ,
| , , , , | , , , ,
| ,
elec elec elecy y y y y y y y y y y
elec elecy y y y y y y y y
elec elecy y y y y y y
elecy
C E C p x r h E E C p x r h E
E C p x r h E E C p x r h E
E C p x r h E E C p x r h E
E C p x
é ùD = -ë ûé ù+ -ë ûé ù+ -ë û
+ ( ) ( )( ) ( )
008 2008 2008 2008 2008 2008
2008 2008 2008 2008 2008 2008 2008 2008 2008
2008
, , , | , , , ,
| , , , , | , , , ,
.
elecy y y y
elec elecy y y
y
r h E E C p x r h E
E C p x r h E E C p x r h E
v v
é ù-ë ûé ù+ -ë ûé ù+ -ë û
(5)
Thesixtermsin(5)respectivelyarethecontributionstothechangeincoalforelectricityofthechangeinprices,environmentalregulations,RFSs,heatrates,electricitydemand,andanunexplainedcomponent.5Theunexplainedcomponentencompassesresidualmodelingerroranddiscrepanciesintheheatrateidentitybecausedatacomefromdifferentsources.Thesesixterms,plusthethreefinaltermsin(3)–thatis,industrialuse,steamcoalnetexports,andmetallurgicalcoal–compriseournine-folddecomposition.5.2ResultsThedecompositionresultsareshowngraphicallyinFigure2,andnumericalvaluesaregiveninTable3.
4Wemaketwotechnicalnotesconcerningthedecomposition(5).First,becauseofthenonlinearity,theorderingofthevariablesmattersintheory.Numerically,however,changingtheorderofthevariablesmakesanegligiblechangeinthequantitativedecomposition.Second,becauseofthelogistictransformationinthesharesmodel,thesharesarenotlinearfunctionsoftheregressionerror,soinprincipletheconditionalexpectationincludesanadjustmentforthisnonlinearity.However,wefoundthatthisadjustment(thesecondordertermintheTaylorseriesexpansionoftheconditionalexpectation)isnumericallynegligible,sotheresultsheredonotincludethatadjustmentandarebasedontheleadingtermintheTaylorseriesexpansionoftheconditionalexpectationoftheshares.5Weadd6.2millionshorttonstotheenvironmentalregulationscomponentin2015and2016,representingthecontributionofMATSestimatedinSection4.Weaccordinglysubtract6.2millionshorttonsin2015and2016fromtheunexplainedcomponenttopreservetheadditivedecomposition.

21
Themoststrikingfeatureofthedecompositionistheroleplayedbythedecliningpriceofnaturalgas.Overthefullperiod,ofthe433milliontondeclineinproduction,397milliontons–92%ofthereduction–isattributabletocheapergasrelativetocoal.Inmanyyears,theamountofthedeclineattributabletocheapgasmorethanexplainstheoveralldecline,becauseofoffsettingfactors.Mostnotably,exportsgrewin2011-2013,partiallyoffsettingtheeffectofdeclininggaspricesduringthoseyears.Adeclineinoverallelectricitydemandmakesanegativecontributiontothechange,althoughinspectionofTable3indicatesthatthemaindeclineinoverallelectricitydemandoccurredduringtherecession(2009),andithasstayedbelowits2008valueforremainingperiod.RPSsmadeasmallnegativecontribution.TheeconometricmodelestimatesasmallandstatisticallyinsignificantcoefficientontheCAIRregulation,whichtookeffectin2009;counterintuitively,thisinsignificantcoefficientispositive,indicatingapositivecontribution,relativeto2008.Weviewthisasaconsequenceofthedifficultyofestimatingtheregulatoryimpactsusingstatevariation,combinedwithatleasttheCAIRregulationhavingarelativelysmalleffect.From2014to2016,thecontributionoftheairregulationsisestimatedtohavecontributedadeclineincoaldemandof40milliontons;thisisthecombinedeffectofCSAPRandtheMATSregulations.WeviewthestatisticallyinsignificantpositivecoefficientonCAIRasanomalous,andtreatthis40milliontondeclineastheeffectofairregulationsoverthisperiod.This40milliontondeclineconstitutes3.4%oftotalcoalproductionin2008,or9.2%ofthedeclinefrom2008to2016.

22
MillionShortTons
2008 2009 2010 2011 2012 2013 2014 2015 2016TotalCoalProduction 1172 1075 1084 1096 1016 985 1000 897 739 TotalChangefrom2008 -- -97 -87 -76 -155 -187 -172 -275 -433 MetCoal -- -7 -1 -1 -1 -1 -1 -2 -6NetExports -- -6 1 20 41 38 21 12 4IndustrialandOther -- 0 -23 17 24 -40 -2 20 -65Electricity -- -171 -128 -176 -284 -248 -254 -368 -431
RelativePrices -- -166 -163 -194 -331 -242 -190 -321 -397CAARegulations -- 13 13 13 12 13 13 -28 -27RPS -- -3 -5 -7 -7 -7 -8 -9 -9ElectricityDemand -- -44 -2 -10 -26 -20 -13 -27 -32Mwh/Ton -- 9 9 8 10 15 13 11 14Other/unexplained -- 21 19 14 59 -6 -68 6 20
Source:Authors’calculations
Table3.Decompositionofchangesincoalproductionsince2008

23
References
Culver,WalterJ.,andMingguoHong.2016"Coal'sdecline:Drivenbypolicyof
technology?"TheElectricityJournal29(7)50-61.EnergyInformationAdministration(EIA).2017.AnnualEnergyOutlook(AEO).U.S.
DepartmentofEnergy.EnvironmentalProtectionAgency(EPA).2011.RegulatoryImpactAnalysisfortheFinal
MercuryandAirToxicsStandards.Houser,Trevor,JasonBordoff,andPeterMarsters.2017."CanCoalMakeaComeback?"
ColumbiaCenteronGlobalEnergyPolicy.Knittel,ChristopherR.,KonstantinosMetaxoglou,andAndreTrindade.2015."NaturalGas
PricesandCoalDisplacement:EvidencefromElectricityMarkets".NBERWorkingPaper.Shankleman,Jess,andHayleyWarren.2017."SolarPowerWillKillCoalFasterThanYou
Think."AccessedJune15,2017.https://www.bloomberg.com/news/articles/2017-06-15/solar-power-will-kill-coal-sooner-than-you-think