Embed Size (px)
Citation preview
Cranfield University
Mark Keeler
The effects of heat input and interpass temperature on the
microstructure of duplex stainless steel during welding
School of Applied Sciences
MSc
Welding Engineering
Cranfield University
School of applied sciences
MSc Thesis
Academic year 2010-2011
Mark Keeler
The effects of heat input and interpass temperature on the
microstructure of duplex stainless steel during welding
Supervisor: Paul Colegrove
Academic Year 2010 to 2011
This thesis is submitted in partial fulfilment of the requirements for
the degree of MSc Welding Engineering
© Cranfield University, 2011. All rights reserved. No part of this publication may be reproduced
without the written permission of the copyright holder
i
Abstract
Intermetallic precipitates are known to have an extremely detrimental effect on both the mechanical
and corrosive properties of duplex stainless steel. The aim of the experiment was to find out if it
was interpass temperature or heat input that the most important factors in the formation of these
precipitates during welding.
Two sets of 5 butt welds were made on Duplex 2205 stainless steel using the Manual Metal Arc
Welding process. The first set of 5 welds with 1.0 KJ/mm heat input and the second 5 at 1.5 KJ/mm.
All plates started off with a pre heat of 150:C. The inter pass temperature for the first plate in each
set was also 150:C, this was increased in 50:C increments for each successive plate till the fifth one
had an inter pass temperature of 350:C.
It is known that the formation of intermetallic precipitates depends on time and diffusion at
elevated temperatures, these conditions can be found during the welding thermal cycle. The
complex welding cycles in multi-run welding can take the weldments to temperatures above that in
which these precipitates, and austenite, can exist and therefore they can revert back to the original
ferrite phase. At these elevated temperatures large ferrite grain growth can occur. If the
temperature cools too quickly then these other phases will not have time to reform leaving the
material with large ferrite grains. Both the presence of the precipitates and large ferrite grain
growth will have an equally detrimental effect on the toughness and the mechanical properties of
the weldment.
It was found that at the extremely high interpass temperature of 350:C and 1.5KJ heat input that
intermetallic precipitates become visible through micrographic examination, whereas the plate with
1.0KJ heat input at the same inter pass temperature did not. Although at lower interpass
temperatures of 200:C the phases were showing signs of having an affected structure which would
also have some detrimental effect on the materials properties.
From the results obtained it would seem that the formation of intermetallic phases is normally an in
service problem and only through poor welding practice did we find it attributable to welding.
However excessive heat input's and interpass temperatures do lead to an altered phase composition
and thermo mechanical history for the weldment which can affect the intended life cycle.
Keywords:
Duplex stainless steel, heat affected zone, micrographic examination, intermetallic precipitates,
interpass temperature, heat input, welding thermal cycle.

ii
Acknowledgements
I would like to thank Tom Donnellan (Sheffield and Perth) for his suggestion for the topic for this
thesis.
Because my funds were tight I'd like to thank Paul Sawyer from RCR Heat Treatment (Perth) and
Colin Lorrimar from Metallurgical Testing Services (Perth) and their staff for helping me set up my
experiments and with the testing afterwards.
Dr Supriyo Ganguly gave excellent advice and I would like to thank him for this.
iii
Table of contents
Abstract Acknowledgements Table of contents Table of figures Table of tables Table of graphs 1 Introduction 1 1.1 background 1 1.2 objective 2 Literature review 2 2.1 background 2 2.1.1 What is stainless steel? 2 2.1.2 Austenitic and Ferritic phase structures 2 2.2 Austenitic Stainless steels 7 2.2.1 Welding problems of austenitic stainless steels 7 2.3 Ferritic Stainless steels 8 2.2.1 Welding problems of ferritic S/S 8 2.3 Duplex stainless steel 8 2.3.1 Effects of alloying elements 9 2.3.2 Physical properties 12 2.3.3 Welding Duplex stainless steel 14 2.3.4 Corrosion resistance 15 2.3.5 Intermetallic compounds-precipitates 15 2.4 Maximum temperatures 18 2.4.1 475 Embrittlement 18 2.4.2 Recommended temperature 18 2.4.3 t12/8 cooling rate 19
3 Experiments and methodology 20
3.1 Experiment 20
3.1.1 Equipment 21
3.2 Material and weld preparation 22
3.2.1 Material composition 22
3.2.2 Plate preparation 23
3.2.3 Thermocouple 25
3.3 Welding 26
3.3.1 Preheat 26
3.3.2 Consumables 26
3.3.3 Welding 26
3.3.4 Heat input 27
3.4 Testing 29
3.4.1 Material preparation for testing 29
3.4.2 Etching 29
3.4.3 Metallographic examination 30
3.4.4 Ferrite count 32
iv
4 Results 34
4.1 Materials prior to experiment 34
4.2 Time at peak temperature 35
4.3 Macrographs 37
4.3.1 Parent plate 37
4.3.2 Heat affected zone 39
4.4 Ferrite count 40
5 Discussion 42
5.1 Welding Temperatures 42
5.2 Microstructure 42
5.2.1 Parent plate microstructure 42
5.2.2 HAZ microstructure 43
5.2.3 % Ferrite 43
6 Conclusion 45
7 References 47
v
Table of figures
Figure 1 Transformation from Ferritic to Austenitic grain structure. 2
Figure 2 Crystallographic changes due to addition of nickel. 3
Figure 3 Fe- Cr phase diagram showing gamma (y) loop. 3
Figure 4 The Schaeffler diagram. 4
Figure 5 Delong Diagram. 5
Figure 6 WRC-1992 diagram for predicting weld ferrite content and solidification mode. 6
Figure 7 Relationship between Chromium and Nickel contents for basic types of stainless steels. 6 Figure 8 Schematic illustration of the mechanism of solidification cracking. 7 Figure 9 Mechanisation of sensitisation. 8 Figure 10 Thermodynamic equilibrium system Fe-Cr-Ni for 68% Fe 9 Figure 11 Transformation from Ferritic to Duplex to Austenitic grain structure if too much
nickel is added. 10
Figure 12 Thermodynamic equilibrium system Fe-Cr-Ni for 68% Fe with the
addition of nitrogen. 11
Figure 13 Typical stress-strain curves for carbon and stainless steels. 13 Figure 14 Differences in impact strengths between austenitic, ferritic, ferritic austenitic (duplex) and martensitic stainless steels. 13 Figure 15 Impact energy, charpy V, of UNS S31803 (2205) parent metal and welded joint. 14 Figure 16 Time temperature transformation diagram showing effect of alloying elements on
precipitation reactions in duplex stainless steels. 15
Figure 17 Isothermal precipitation diagram for 2205 duplex stainless steel, annealed
at 1050:C. 16
Figure 18 Formation of Sigma phase on the grain boundaries of ferrite. 17
Figure 19 Photograph of the 16mm plate showing the kerf left from the plasma cutting process which needed to be removed. 23 Figure 20 Photograph showing monitoring of excess heat generated during grinding 24 Figure 21 Plate prepared for welding. 24 Figure 22 Thermocouple attachment unit 25 Figure 23 Rear of plate showing thermocouples at 10mm spacing's from the
weld centre line. 25 Figure 24 MMAW electrode baking oven and MMAW electrode hotbox used for preheating the plates and electrodes prior to welding. 26 Figure 25 A completed weld showing the plate at a 10 degree angle. 27 Figure 26 Lapping block and emery paper used to prepare samples for etching. 29
Figure 27 S31803 showing an unaffected structure. 30
Figure 28 Possibly affected structure of S31803 and J92205. 31
Figure 29 An affected structure of S31803 and J92205 31
Figure 30 showing a centre line phase structure in J92205. 32
Figure 31 Graphical representation of the magnetic field produced by the probe. 33
Figure 32 Areas of the sample tested with the ferrite scope. 33
Figure 33 Macrographs of the Duplex plate in the supplied un-welded condition. 34
Figure 34 Graph of peak temperatures for 1KJ/mm and 150:C interpass temperature. 35
Figure 35 Graph of peak temperatures for 1KJ/mm and 200:C interpass temperature. 35
vi
Figure 36 Graph of peak temperatures for 1KJ/mm and 250:C interpass temperature. 35
Figure 37 Graph of peak temperatures for 1KJ/mm and 300:C interpass temperature. 35
Figure 38 Graph of peak temperatures for 1KJ/mm and 350:C interpass temperature. 35
Figure 39 Graph of peak temperatures for 1.5KJ/mm and 150:C interpass temperature. 36
Figure 40 Graph of peak temperatures for 1.5KJ/mm and 200:C interpass temperature. 36
Figure 41 Graph of peak temperatures for 1.5KJ/mm and 250:C interpass temperature. 36
Figure 42 Graph of peak temperatures for 1.5KJ/mm and 300:C interpass temperature. 36
Figure 43 Graph of peak temperatures for 1.5KJ/mm and 350:C interpass temperature. 36
Figure 44 Duplex 2205 parent plate (A) 1KJ heat input 150:C interpass;
(B) 1.5KJ heat input 150:C interpass. 37
Figure 45 Duplex 2205 parent plate (C) 1KJ/mm heat input 200:C interpass;
(D) 1.5KJ heat input 200:C interpass. 38
Figure 46 Duplex 2205 parent plate (E) 1KJ heat input 250:C interpass ;
(F) 1.5KJ heat input 250:C interpass. 38
Figure 47 Duplex 2205 parent plate (A) 1KJ heat input 350:C interpass. 38
Figure 48 Duplex 2205 HAZ (A) 1KJ heat input 350:C interpass;
(B) 1.5KJ heat input 350:C interpass. 39
Figure 49 Duplex 2205 HAZ (A) 1.5KJ heat input 350:C interpass showing the weld zone,
fusion zone and parent material;
(B) 1.5KJ heat input 350:C interpass. Showing the HAZ near the cap. 39
Figure 50 Duplex 2205 HAZ (A) 1.5KJ heat input 350:C interpass. 39
Figure 51 Graph of % Ferrite count 1KJ/mm heat input. 40
Figure 52 Graph of % Ferrite count 1.5KJ/mm heat input. 40
vii
Table of tables
Table1 Alloy additions that promote ferrite and austenite. 4
Table 2 Comparative properties of the stainless steel alloy families. 12
Table 3 Precipitation reaction (and others) temperatures for duplex S/S. 16
Table 4 Upper temperature limits for duplex S/S from pressure vessel design
codes for working out maximum allowable stress values. 18
Table 5 Sanvik steels recommended welding variables. 20
Table 6 Heat inputs and interpass temperatures used during the experiment. 21
Table 7 Equipment list from experiment. 21
Table 8 Parent plate composition. 22
Table 9 Consumable composition. 22
Table 10 1KJ/mm Heat input welding variables and observations. 28
Table 11 1.5KJ/mm Heat input welding variables and observations. 28
Table 12 % ferrite count in the supplied un-welded plate. 34
Table 13 Cumulative time at temperatures above 350:C (1KJ heat input). 37
Table 14 Cumulative time at temperatures above 350:C (1.5KJ heat input). 37 Table 15 Average % Ferrite count 1KJ/mm heat input 41
Table 15 Average % Ferrite count 1.5KJ/mm heat input 41
Table of Equations
Eq 1 Nickel equivalent. 4
Eq 2 Chromium equivalent. 4
Eq 3 WRC-1992 Nickel equivalent. 6
Eq 4 WRC-1992 Chromium equivalent. 6
Eq 5 Ferrite formation during cooling. 11
Eq 6 Heat input KJ/mm 27
1
1. Introduction
1.1 Background Duplex stainless steel has a two phase structure austenite and ferrite in roughly equal proportions.
As such it combines the positive features of both these types of stainless steel. Such as excellent
resistance to corrosion, high strength, toughness and overall good weldability. In fact it is readily
welded by all the most common welding process such as SAW, MMAW, GTAW, FCAW etc.
Because of these properties duplex stainless steel is increasingly being used instead of austenitic
stainless steels in a wide range of industries such as the pulp and paper industry, desalination plants,
tankage, oil and gas industry.
Ideally the microstructure of the heat affected zone would have the same phase composition as the
original parent plate. Due to the repeated thermal cycles experienced in multi-pass welding this is
extremely unlikely resulting in the formation of unwelcome intermetallic precipitates which reduce
the corrosion and toughness values around the welded joint. If the thermal cycle is tightly controlled
then the properties of this zone can still be kept within acceptable limits. However these properties
can be cast aside through lack of control of the welding process.
1.2 Objective The aim of this study was to see at what temperatures intermetallic phases and other harmful micro
structural changes take place during and to see if this indeed a problem that is associated with
welding.
2
2. Literature review
2.1 background
2.1.1 What is stainless steel?
A steel that resists corrosion is known as stainless steel. This resistance to corrosion is due to the
Chromium forming a Chromium oxide film on the surface of the metal that becomes a passive layer
that insulates and protects the surface. The Chromium must be in concentrations of at least 11-12%
in solid solution before the oxide (1-nm thick) can cover the surface sufficiently to make it stainless.
(1)
The following are the groups of steels that make up the stainless steel (S/S) family.
Austenitic stainless steels: AISI 200 and 300 series
Ferritic stainless steels: AISI 400 series
Martensitic stainless steels: AISI 400 series
Duplex (ferritic-austenitic) Stainless steels: AISI 300 series
Precipitation hardening stainless steels
2.1.2 Austenitic and Ferritic phase structures
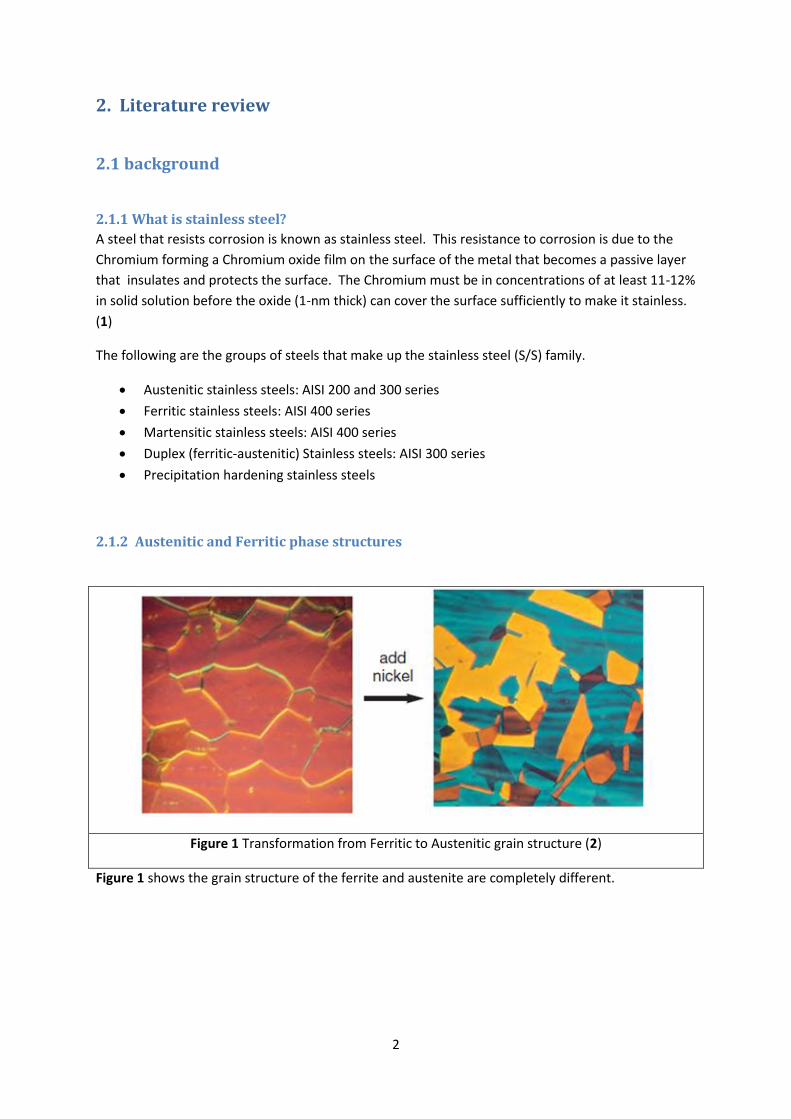
Figure 1 Transformation from Ferritic to Austenitic grain structure (2)
Figure 1 shows the grain structure of the ferrite and austenite are completely different.
3
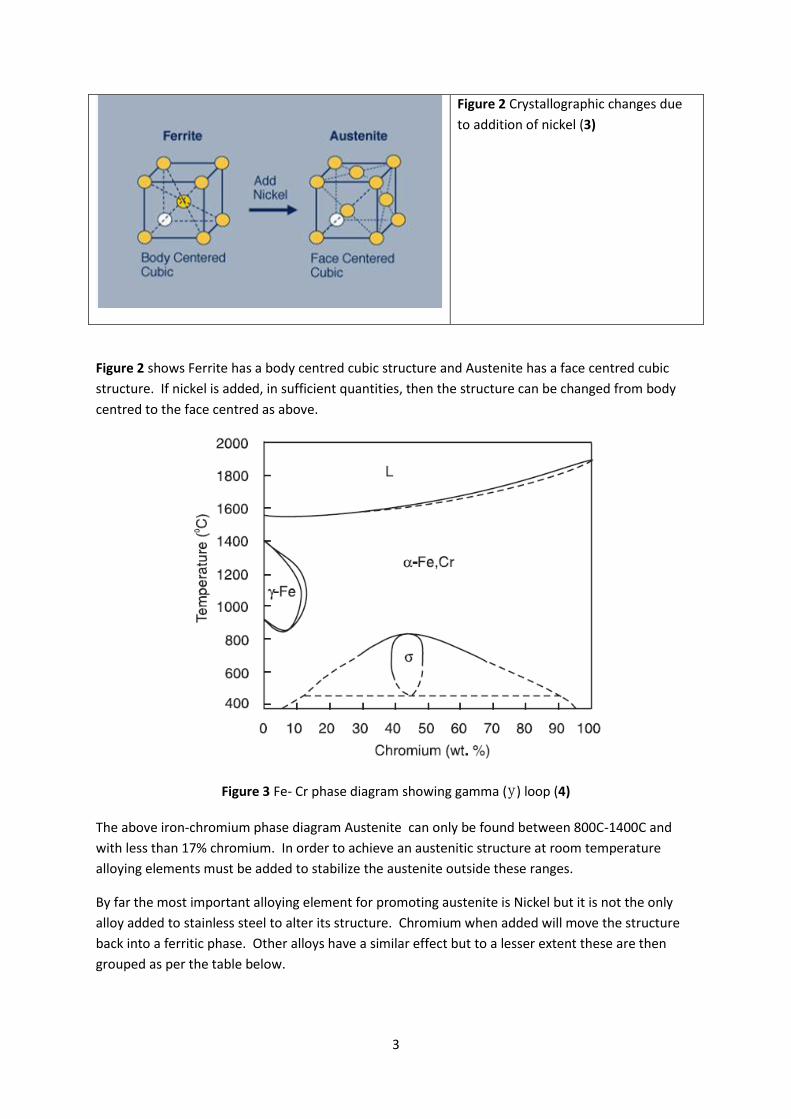
Figure 2 Crystallographic changes due
to addition of nickel (3)
Figure 2 shows Ferrite has a body centred cubic structure and Austenite has a face centred cubic
structure. If nickel is added, in sufficient quantities, then the structure can be changed from body
centred to the face centred as above.
Figure 3 Fe- Cr phase diagram showing gamma (y) loop (4)
The above iron-chromium phase diagram Austenite can only be found between 800C-1400C and
with less than 17% chromium. In order to achieve an austenitic structure at room temperature
alloying elements must be added to stabilize the austenite outside these ranges.
By far the most important alloying element for promoting austenite is Nickel but it is not the only
alloy added to stainless steel to alter its structure. Chromium when added will move the structure
back into a ferritic phase. Other alloys have a similar effect but to a lesser extent these are then
grouped as per the table below.
4
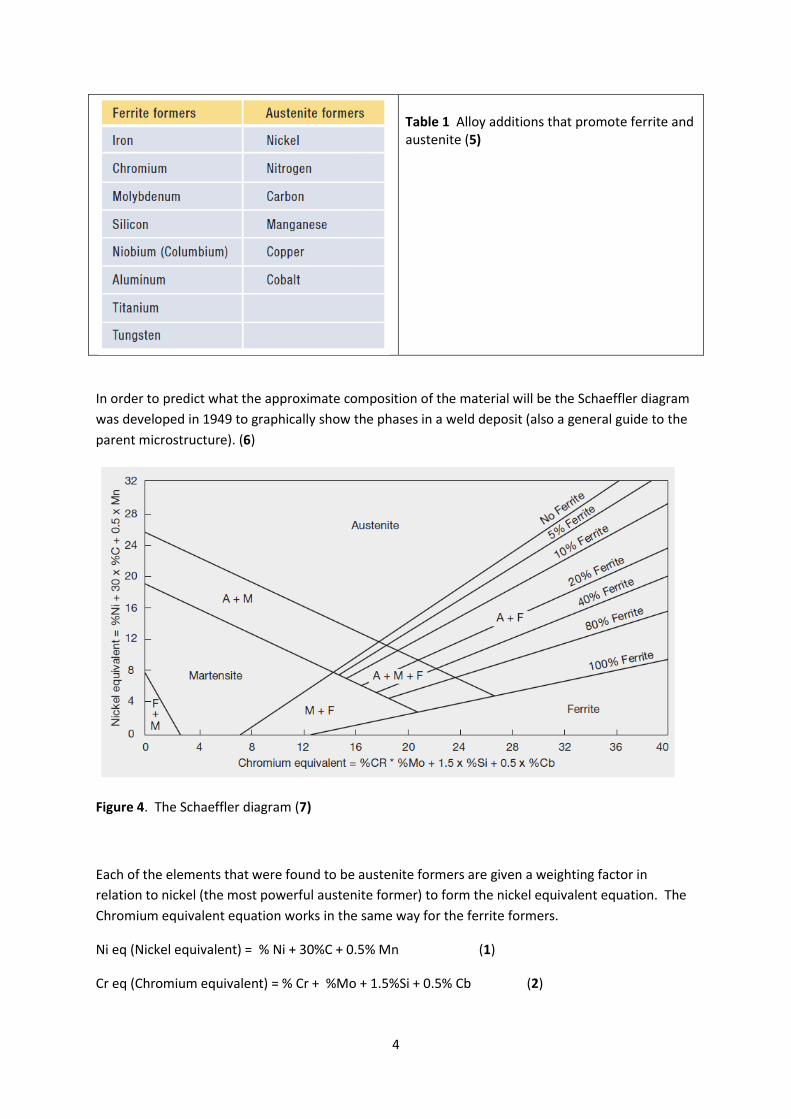
Table 1 Alloy additions that promote ferrite and austenite (5)
In order to predict what the approximate composition of the material will be the Schaeffler diagram
was developed in 1949 to graphically show the phases in a weld deposit (also a general guide to the
parent microstructure). (6)
Figure 4. The Schaeffler diagram (7)
Each of the elements that were found to be austenite formers are given a weighting factor in
relation to nickel (the most powerful austenite former) to form the nickel equivalent equation. The
Chromium equivalent equation works in the same way for the ferrite formers.
Ni eq (Nickel equivalent) = % Ni + 30%C + 0.5% Mn (1)
Cr eq (Chromium equivalent) = % Cr + %Mo + 1.5%Si + 0.5% Cb (2)
5
By plotting the materials composition using the above equations the structure of the material can
be determined at room temperature.
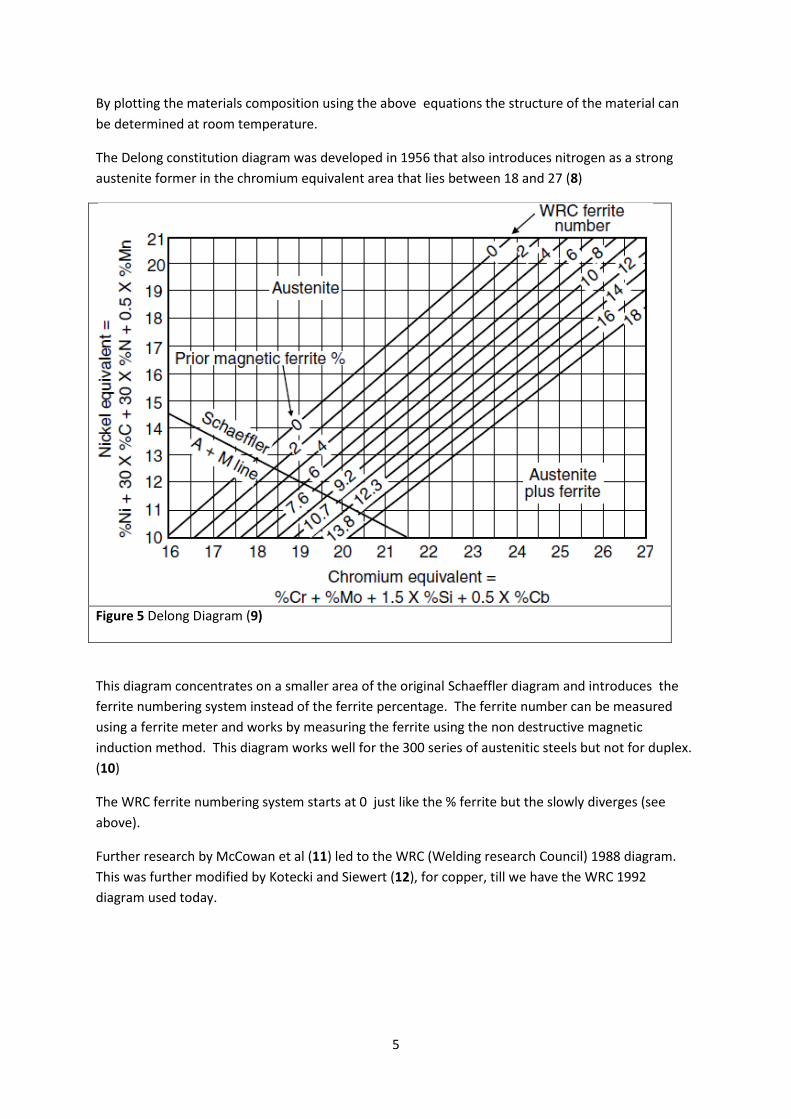
The Delong constitution diagram was developed in 1956 that also introduces nitrogen as a strong
austenite former in the chromium equivalent area that lies between 18 and 27 (8)
Figure 5 Delong Diagram (9)
This diagram concentrates on a smaller area of the original Schaeffler diagram and introduces the
ferrite numbering system instead of the ferrite percentage. The ferrite number can be measured
using a ferrite meter and works by measuring the ferrite using the non destructive magnetic
induction method. This diagram works well for the 300 series of austenitic steels but not for duplex.
(10)
The WRC ferrite numbering system starts at 0 just like the % ferrite but the slowly diverges (see
above).
Further research by McCowan et al (11) led to the WRC (Welding research Council) 1988 diagram.
This was further modified by Kotecki and Siewert (12), for copper, till we have the WRC 1992
diagram used today.
6
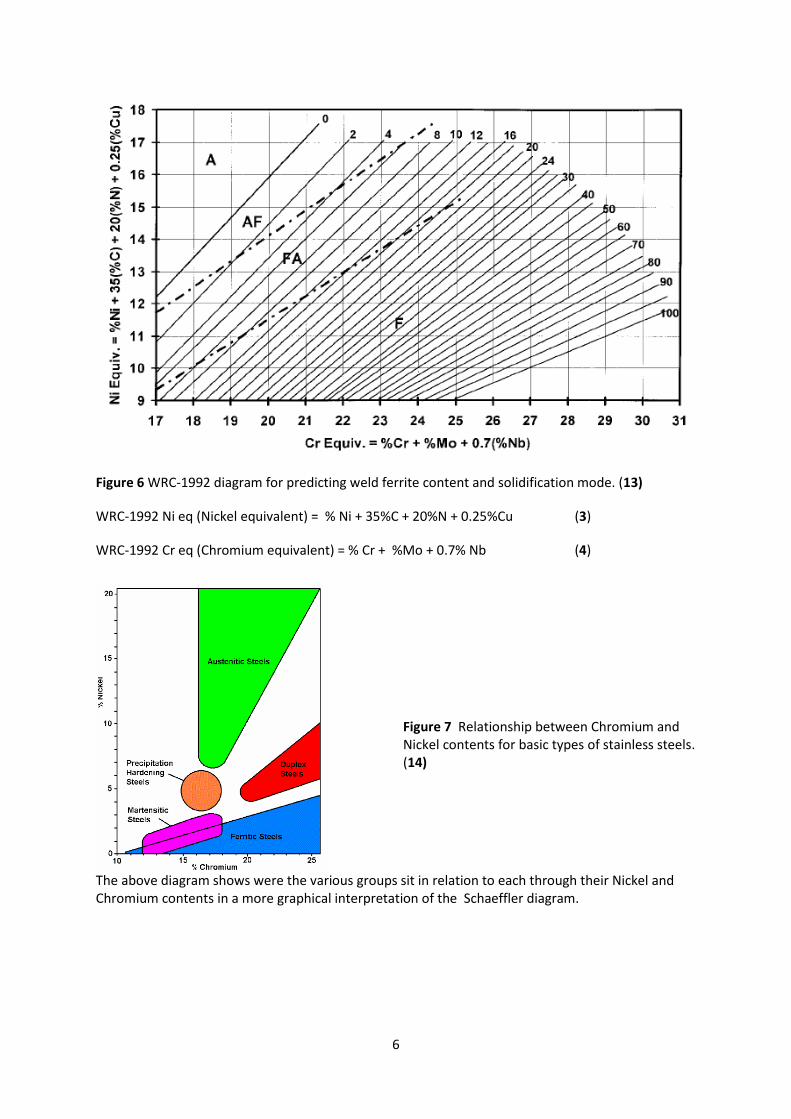
Figure 6 WRC-1992 diagram for predicting weld ferrite content and solidification mode. (13)
WRC-1992 Ni eq (Nickel equivalent) = % Ni + 35%C + 20%N + 0.25%Cu (3)
WRC-1992 Cr eq (Chromium equivalent) = % Cr + %Mo + 0.7% Nb (4)
Figure 7 Relationship between Chromium and Nickel contents for basic types of stainless steels. (14)
The above diagram shows were the various groups sit in relation to each through their Nickel and Chromium contents in a more graphical interpretation of the Schaeffler diagram.
7
2.2 Austenitic Stainless steels
Austenitic S/S have the best overall resistance to corrosion of all the stainless steels with those with
increased molybdenum (Type 316) and nickel being better at resistance to pitting corrosion in high
chloride environments.
The minimum requirement for an austenitic microstructure is generally 16.5% chromium with
further additions of nickel, manganese, nitrogen and carbon. Other elements can be added to
improve the corrosion, oxidation properties etc.
In order to eliminate the delta ferrite that can form in austenitic S/S the material is normally
supplied in the solution annealed condition. It is heated to approximately 1050:C then rapidly
cooled to room temperature. In conditions such as autogenous welding delta ferrite can reform if
welded without suitably alloyed consumables. Unlike ferritic S/S austenitic S/S does not experience
large grain growth and as such can be welded in thick sections.
2.2.1 Welding problems of austenitic stainless steels
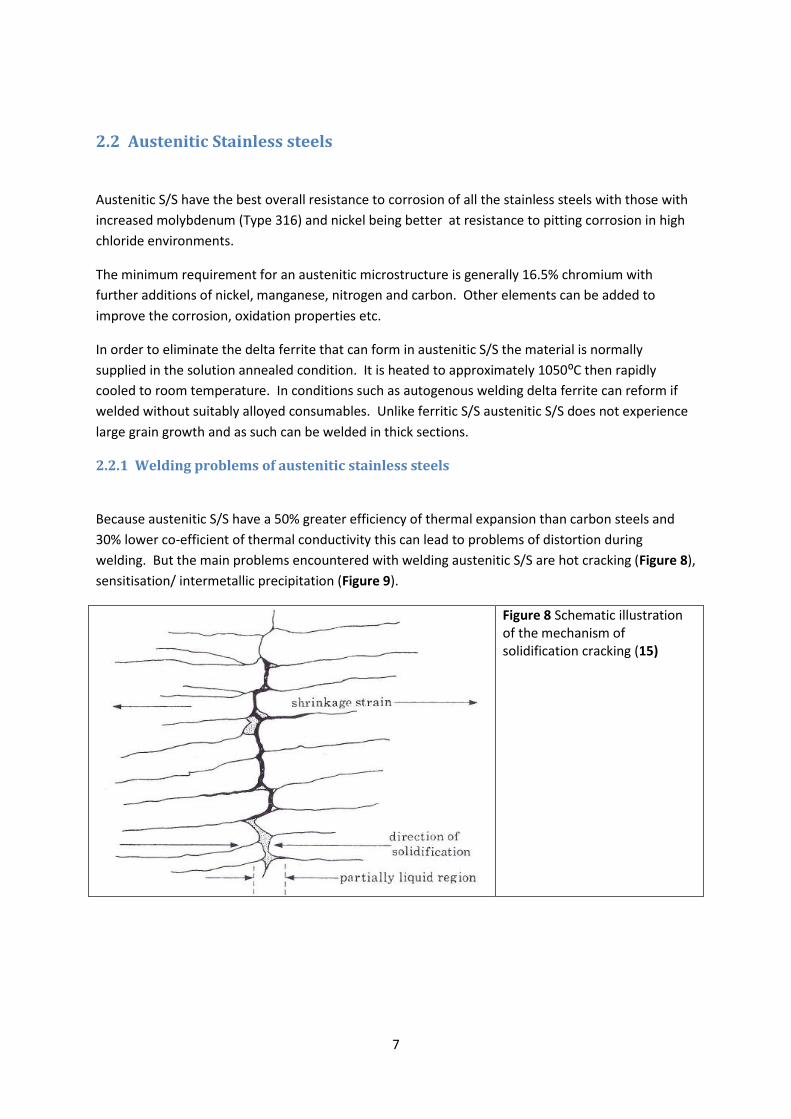
Because austenitic S/S have a 50% greater efficiency of thermal expansion than carbon steels and
30% lower co-efficient of thermal conductivity this can lead to problems of distortion during
welding. But the main problems encountered with welding austenitic S/S are hot cracking (Figure 8),
sensitisation/ intermetallic precipitation (Figure 9).
Figure 8 Schematic illustration of the mechanism of solidification cracking (15)
8
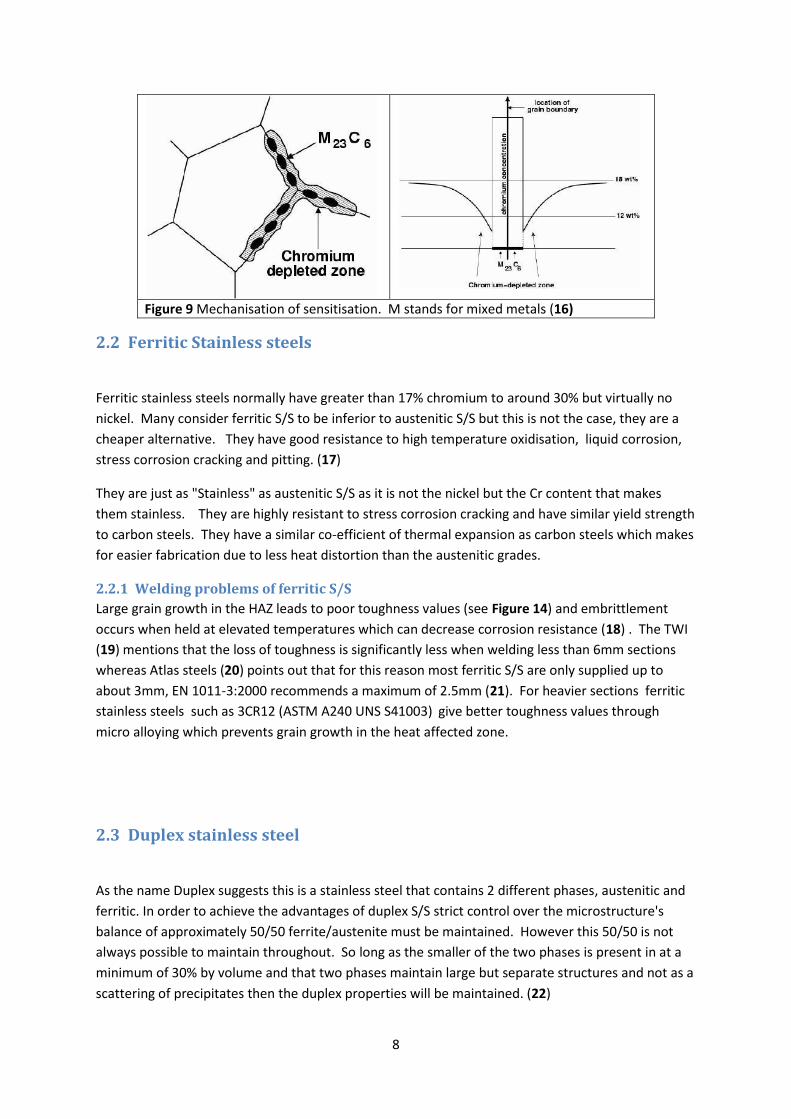
Figure 9 Mechanisation of sensitisation. M stands for mixed metals (16)
2.2 Ferritic Stainless steels
Ferritic stainless steels normally have greater than 17% chromium to around 30% but virtually no
nickel. Many consider ferritic S/S to be inferior to austenitic S/S but this is not the case, they are a
cheaper alternative. They have good resistance to high temperature oxidisation, liquid corrosion,
stress corrosion cracking and pitting. (17)
They are just as "Stainless" as austenitic S/S as it is not the nickel but the Cr content that makes
them stainless. They are highly resistant to stress corrosion cracking and have similar yield strength
to carbon steels. They have a similar co-efficient of thermal expansion as carbon steels which makes
for easier fabrication due to less heat distortion than the austenitic grades.
2.2.1 Welding problems of ferritic S/S
Large grain growth in the HAZ leads to poor toughness values (see Figure 14) and embrittlement
occurs when held at elevated temperatures which can decrease corrosion resistance (18) . The TWI
(19) mentions that the loss of toughness is significantly less when welding less than 6mm sections
whereas Atlas steels (20) points out that for this reason most ferritic S/S are only supplied up to
about 3mm, EN 1011-3:2000 recommends a maximum of 2.5mm (21). For heavier sections ferritic
stainless steels such as 3CR12 (ASTM A240 UNS S41003) give better toughness values through
micro alloying which prevents grain growth in the heat affected zone.
2.3 Duplex stainless steel
As the name Duplex suggests this is a stainless steel that contains 2 different phases, austenitic and
ferritic. In order to achieve the advantages of duplex S/S strict control over the microstructure's
balance of approximately 50/50 ferrite/austenite must be maintained. However this 50/50 is not
always possible to maintain throughout. So long as the smaller of the two phases is present in at a
minimum of 30% by volume and that two phases maintain large but separate structures and not as a
scattering of precipitates then the duplex properties will be maintained. (22)
9
Figure 10 Thermodynamic
equilibrium system Fe-Cr-Ni
for 68% Fe (23)
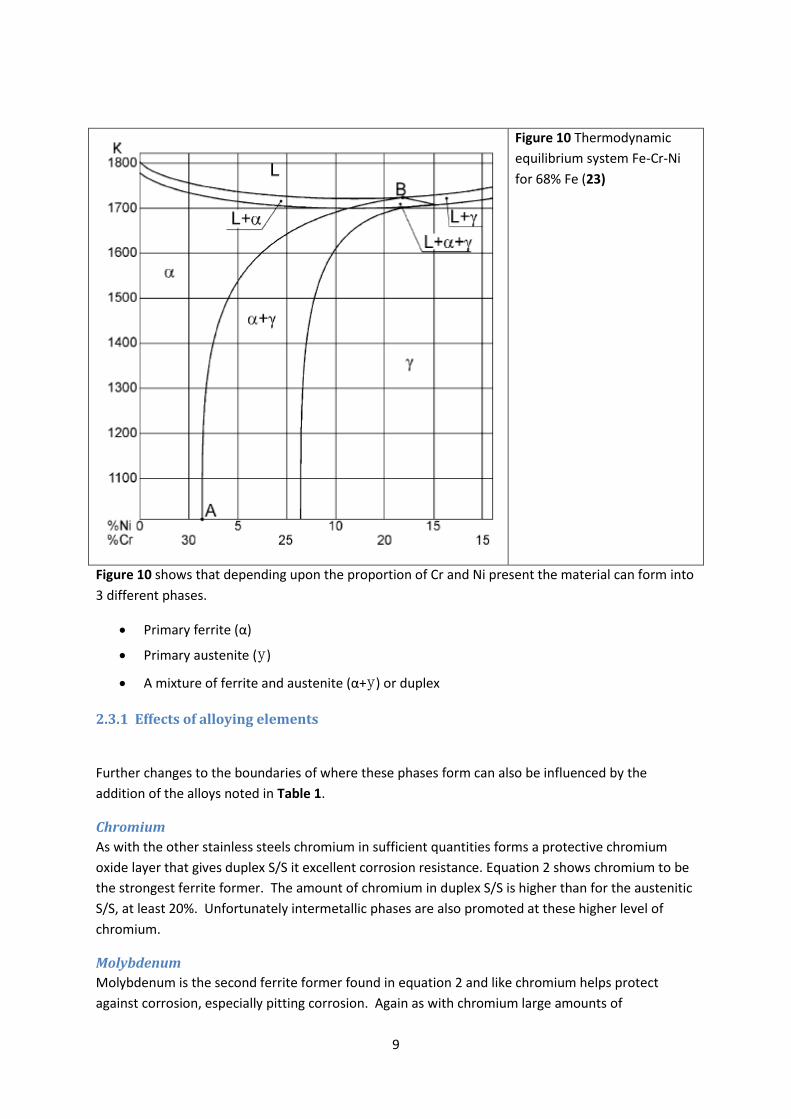
Figure 10 shows that depending upon the proportion of Cr and Ni present the material can form into
3 different phases.
Primary ferrite (α)
Primary austenite (y)
A mixture of ferrite and austenite (α+y) or duplex
2.3.1 Effects of alloying elements
Further changes to the boundaries of where these phases form can also be influenced by the
addition of the alloys noted in Table 1.
Chromium
As with the other stainless steels chromium in sufficient quantities forms a protective chromium
oxide layer that gives duplex S/S it excellent corrosion resistance. Equation 2 shows chromium to be
the strongest ferrite former. The amount of chromium in duplex S/S is higher than for the austenitic
S/S, at least 20%. Unfortunately intermetallic phases are also promoted at these higher level of
chromium.
Molybdenum
Molybdenum is the second ferrite former found in equation 2 and like chromium helps protect
against corrosion, especially pitting corrosion. Again as with chromium large amounts of
10
molybdenum can be detrimental due to the formation of intermetallic phases. For this reason it is
normally kept below 4% in duplex S/S.
Nitrogen
To counter the tendency of the chromium and molybdenum to form intermetallics nitrogen is added
to delay their precipitation. Due to the lowering of the intermetallics the toughness of the duplex
S/S increases. Also nitrogen is an austenite former and promotes y phase. It is also the strongest
solid solution strengthening element in duplex S/S so greatly increases strength. Like molybdenum
it increases the pitting corrosion resistance as well as crevice corrosion. If the nitrogen is present in
too large a quantity then it can form chromium nitrides (see figure 16) which can form brittle areas
in the material.
Nickel
As can be seen in Figure’s 1 and 2 it is the addition of Nickel that gives the austenite it's face centred
cubic structure. Equation 1 shows it to be the strongest of the austenite formers. Like nitrogen it
delays the formation of harmful intermetallic phases but to a much lesser degree. Figure 14 shows
that the toughness of austenitic S/S is superior to that of ferritic S/S. This is due to the face centred
cubic structure of the y phase.
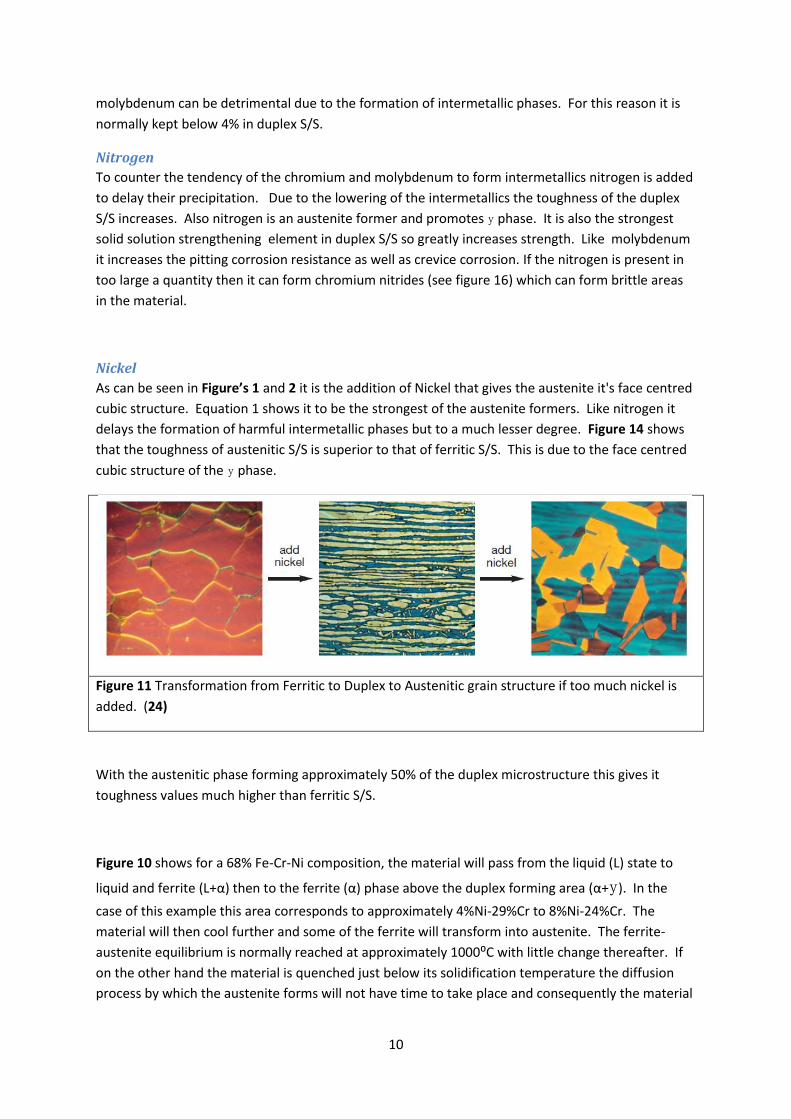
Figure 11 Transformation from Ferritic to Duplex to Austenitic grain structure if too much nickel is
added. (24)
With the austenitic phase forming approximately 50% of the duplex microstructure this gives it
toughness values much higher than ferritic S/S.
Figure 10 shows for a 68% Fe-Cr-Ni composition, the material will pass from the liquid (L) state to
liquid and ferrite (L+α) then to the ferrite (α) phase above the duplex forming area (α+y). In the
case of this example this area corresponds to approximately 4%Ni-29%Cr to 8%Ni-24%Cr. The
material will then cool further and some of the ferrite will transform into austenite. The ferrite-
austenite equilibrium is normally reached at approximately 1000:C with little change thereafter. If
on the other hand the material is quenched just below its solidification temperature the diffusion
process by which the austenite forms will not have time to take place and consequently the material
11
will be almost 100% ferrite at room temperature (25). If the material is not quenched then an
equilibrium structure of ferrite, austenite and intermetallic phases will be the equilibrium structure
(26 and Figure 18) as it cools without annealing.
If a line is followed the through the eutectic point (approx 12% Ni) it can be seen that the material
will pass through the liquid - austenitic - ferrite region and then becomes duplex for a short period
before passing through and into the austenitic region. No more transformation can take place and
the material will stay as an austenitic stainless steel.
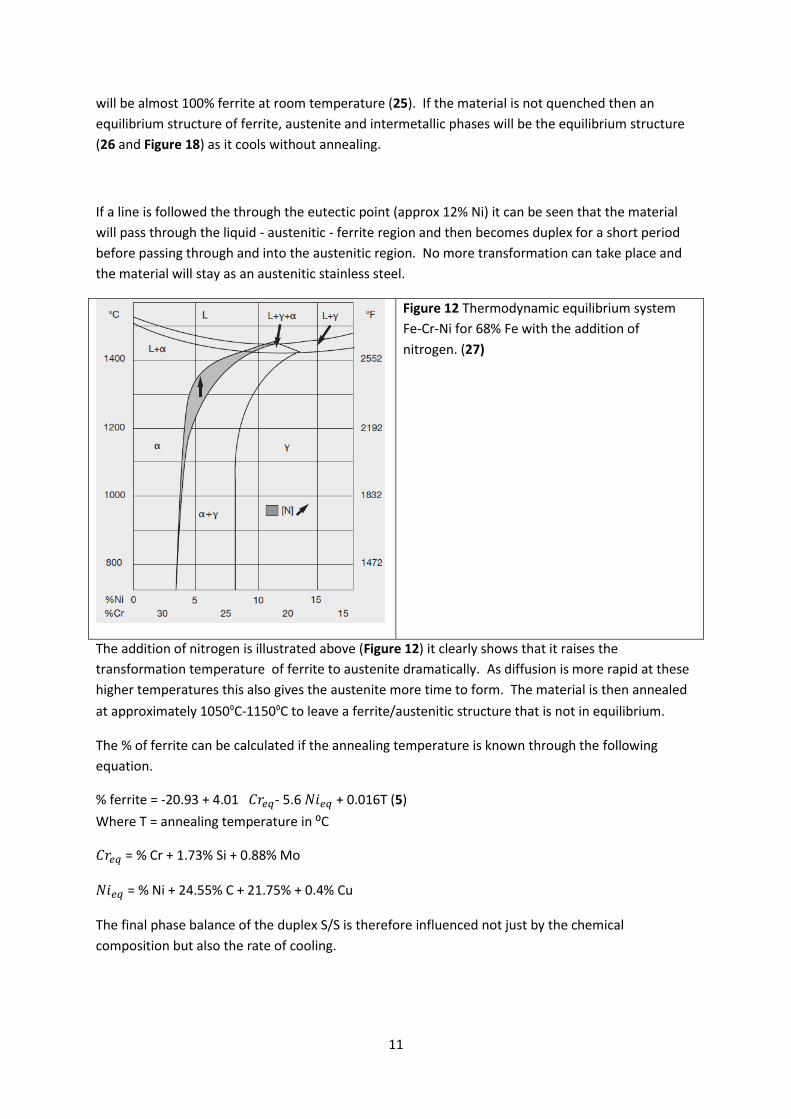
Figure 12 Thermodynamic equilibrium system
Fe-Cr-Ni for 68% Fe with the addition of
nitrogen. (27)
The addition of nitrogen is illustrated above (Figure 12) it clearly shows that it raises the
transformation temperature of ferrite to austenite dramatically. As diffusion is more rapid at these
higher temperatures this also gives the austenite more time to form. The material is then annealed
at approximately 1050⁰C-1150⁰C to leave a ferrite/austenitic structure that is not in equilibrium.
The % of ferrite can be calculated if the annealing temperature is known through the following
equation.
% ferrite = -20.93 + 4.01 - 5.6 + 0.016T (5)
Where T = annealing temperature in :C
= % Cr + 1.73% Si + 0.88% Mo
= % Ni + 24.55% C + 21.75% + 0.4% Cu
The final phase balance of the duplex S/S is therefore influenced not just by the chemical
composition but also the rate of cooling.
12
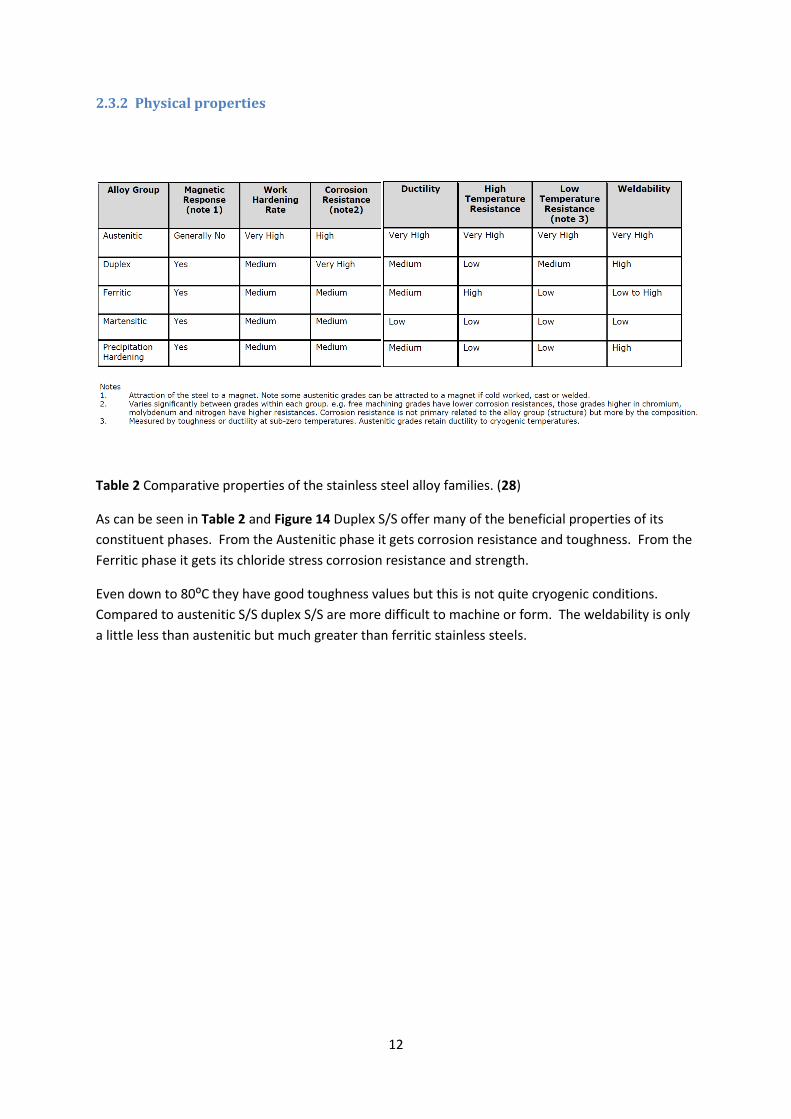
2.3.2 Physical properties
Table 2 Comparative properties of the stainless steel alloy families. (28)
As can be seen in Table 2 and Figure 14 Duplex S/S offer many of the beneficial properties of its
constituent phases. From the Austenitic phase it gets corrosion resistance and toughness. From the
Ferritic phase it gets its chloride stress corrosion resistance and strength.
Even down to 80:C they have good toughness values but this is not quite cryogenic conditions.
Compared to austenitic S/S duplex S/S are more difficult to machine or form. The weldability is only
a little less than austenitic but much greater than ferritic stainless steels.
13
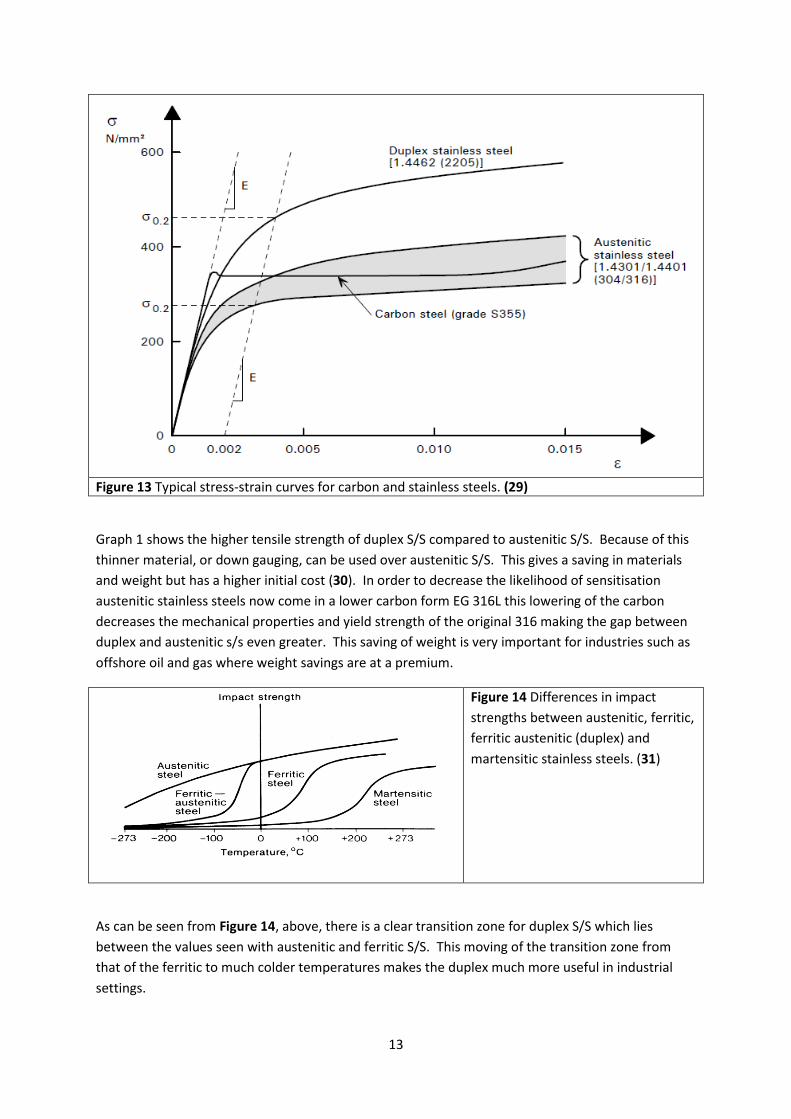
Figure 13 Typical stress-strain curves for carbon and stainless steels. (29)
Graph 1 shows the higher tensile strength of duplex S/S compared to austenitic S/S. Because of this
thinner material, or down gauging, can be used over austenitic S/S. This gives a saving in materials
and weight but has a higher initial cost (30). In order to decrease the likelihood of sensitisation
austenitic stainless steels now come in a lower carbon form EG 316L this lowering of the carbon
decreases the mechanical properties and yield strength of the original 316 making the gap between
duplex and austenitic s/s even greater. This saving of weight is very important for industries such as
offshore oil and gas where weight savings are at a premium.
Figure 14 Differences in impact
strengths between austenitic, ferritic,
ferritic austenitic (duplex) and
martensitic stainless steels. (31)
As can be seen from Figure 14, above, there is a clear transition zone for duplex S/S which lies
between the values seen with austenitic and ferritic S/S. This moving of the transition zone from
that of the ferritic to much colder temperatures makes the duplex much more useful in industrial
settings.
14
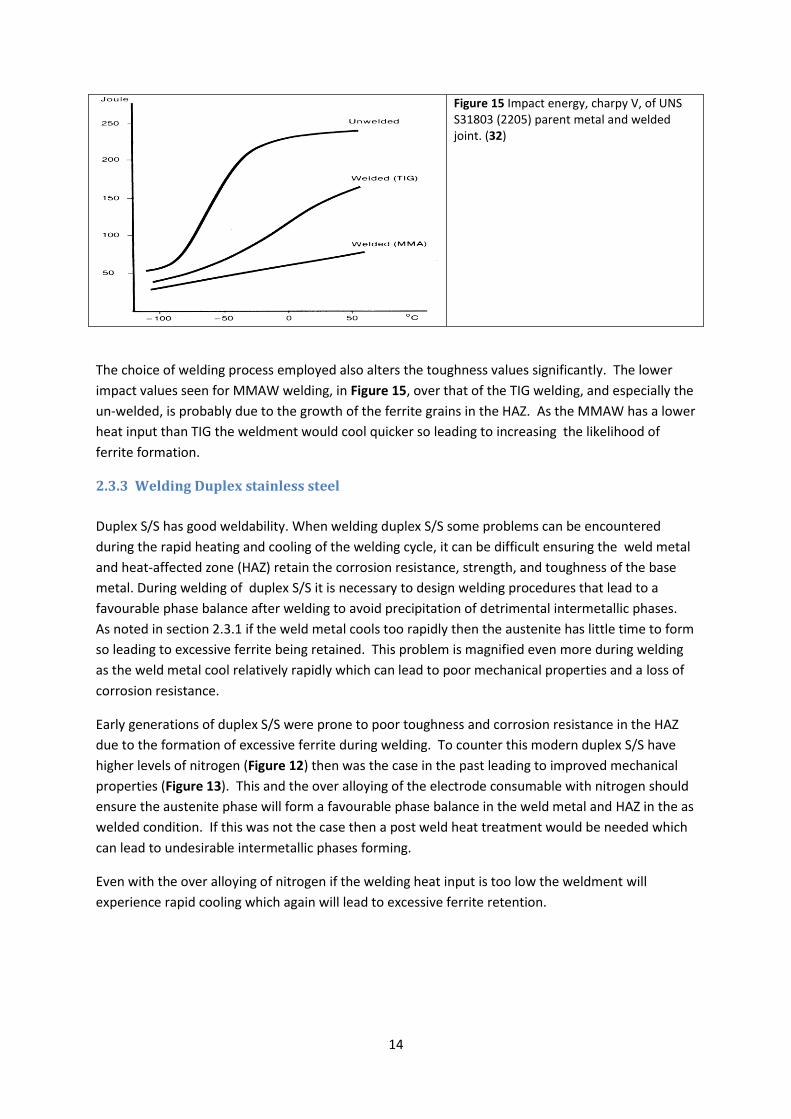
Figure 15 Impact energy, charpy V, of UNS S31803 (2205) parent metal and welded joint. (32)
The choice of welding process employed also alters the toughness values significantly. The lower
impact values seen for MMAW welding, in Figure 15, over that of the TIG welding, and especially the
un-welded, is probably due to the growth of the ferrite grains in the HAZ. As the MMAW has a lower
heat input than TIG the weldment would cool quicker so leading to increasing the likelihood of
ferrite formation.
2.3.3 Welding Duplex stainless steel
Duplex S/S has good weldability. When welding duplex S/S some problems can be encountered
during the rapid heating and cooling of the welding cycle, it can be difficult ensuring the weld metal
and heat-affected zone (HAZ) retain the corrosion resistance, strength, and toughness of the base
metal. During welding of duplex S/S it is necessary to design welding procedures that lead to a
favourable phase balance after welding to avoid precipitation of detrimental intermetallic phases.
As noted in section 2.3.1 if the weld metal cools too rapidly then the austenite has little time to form
so leading to excessive ferrite being retained. This problem is magnified even more during welding
as the weld metal cool relatively rapidly which can lead to poor mechanical properties and a loss of
corrosion resistance.
Early generations of duplex S/S were prone to poor toughness and corrosion resistance in the HAZ
due to the formation of excessive ferrite during welding. To counter this modern duplex S/S have
higher levels of nitrogen (Figure 12) then was the case in the past leading to improved mechanical
properties (Figure 13). This and the over alloying of the electrode consumable with nitrogen should
ensure the austenite phase will form a favourable phase balance in the weld metal and HAZ in the as
welded condition. If this was not the case then a post weld heat treatment would be needed which
can lead to undesirable intermetallic phases forming.
Even with the over alloying of nitrogen if the welding heat input is too low the weldment will
experience rapid cooling which again will lead to excessive ferrite retention.
15
2.3.4 Corrosion resistance
Duplex S/S is equally as good, and in some cases better, as other stainless steels in resisting
corrosion and stress-corrosion cracking in harsh environments. This is especially so in high chloride
environments as long as the ferrite stays above 30%.
Duplex S/S there are evaluated for two types of corrosion, pitting and crevice corrosion. The ways of
measuring these are.
Critical pitting temperature (CPT)
Critical crevice corrosion temperature (CCT)
Both of these are determined by the temperature above which corrosion will start to become
detectable within a 24 hour period in a ferric chloride solution. The ferric chloride simulates real life
environments such as sea water etc. Typically the CCT starts at 15:C to 20:C lower than the CPT.
The ASTM G48 standard is followed for testing of these critical temperatures (33)
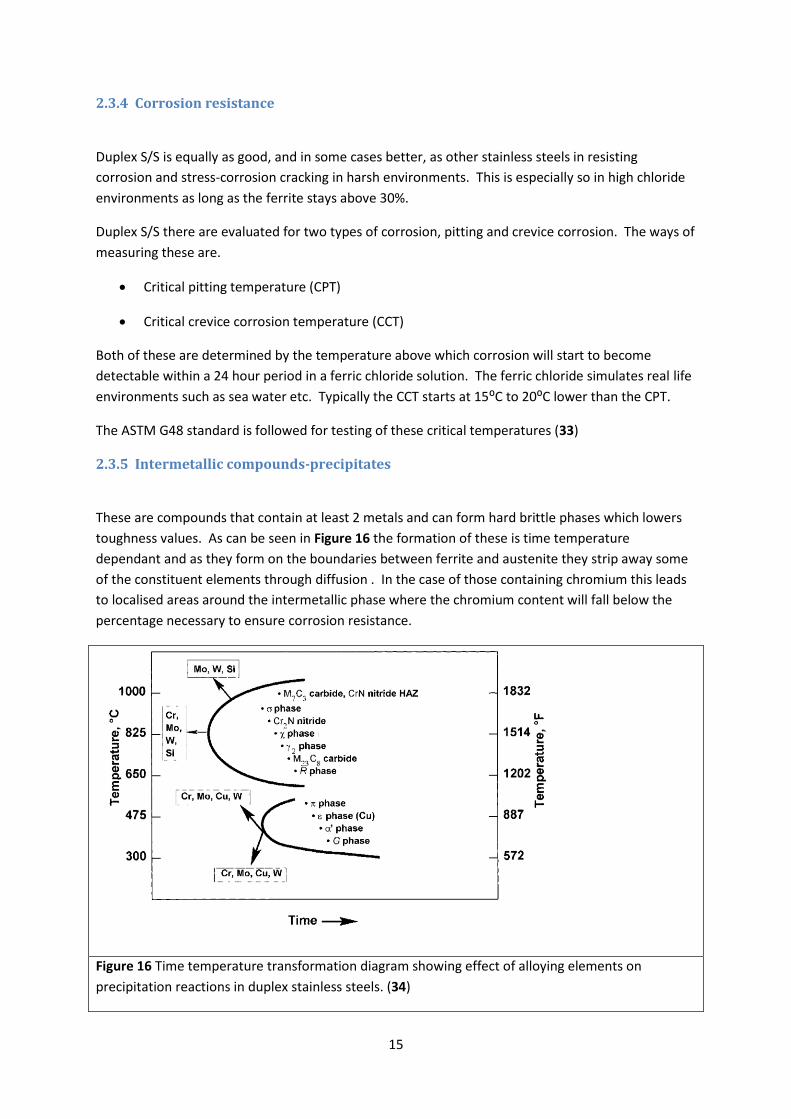
2.3.5 Intermetallic compounds-precipitates
These are compounds that contain at least 2 metals and can form hard brittle phases which lowers
toughness values. As can be seen in Figure 16 the formation of these is time temperature
dependant and as they form on the boundaries between ferrite and austenite they strip away some
of the constituent elements through diffusion . In the case of those containing chromium this leads
to localised areas around the intermetallic phase where the chromium content will fall below the
percentage necessary to ensure corrosion resistance.
Figure 16 Time temperature transformation diagram showing effect of alloying elements on
precipitation reactions in duplex stainless steels. (34)
16
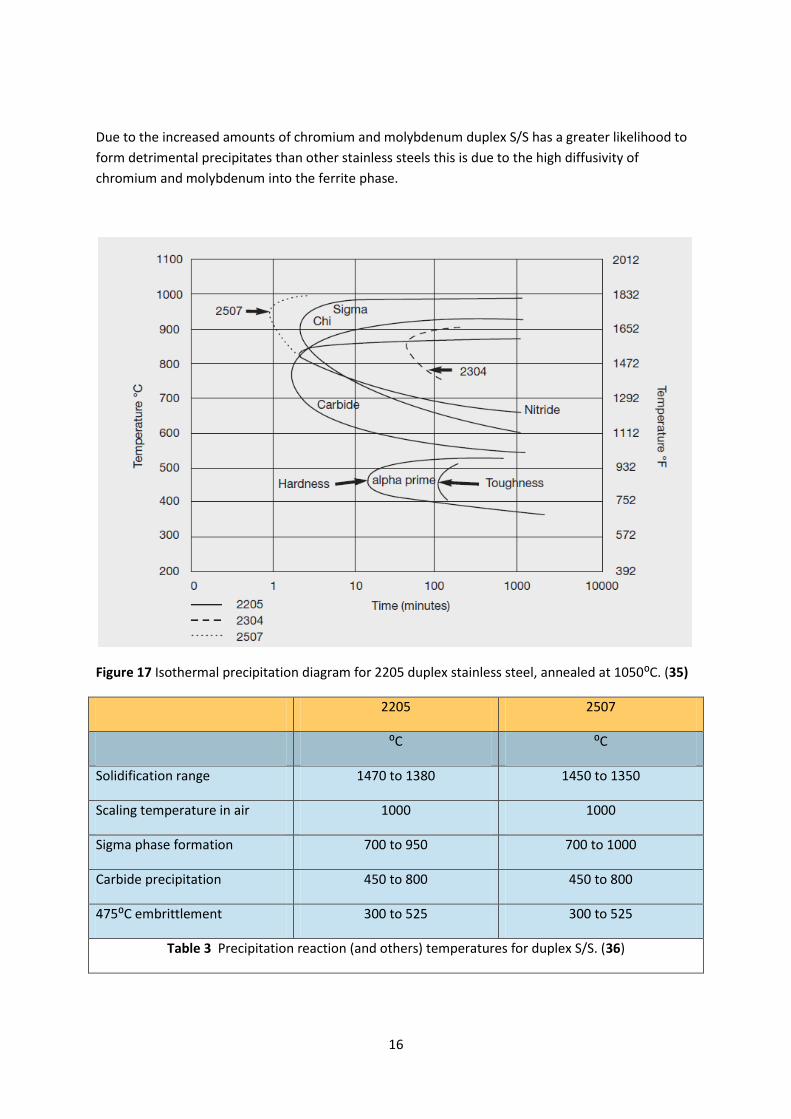
Due to the increased amounts of chromium and molybdenum duplex S/S has a greater likelihood to
form detrimental precipitates than other stainless steels this is due to the high diffusivity of
chromium and molybdenum into the ferrite phase.
Figure 17 Isothermal precipitation diagram for 2205 duplex stainless steel, annealed at 1050:C. (35)
2205 2507
:C :C
Solidification range 1470 to 1380 1450 to 1350
Scaling temperature in air 1000 1000
Sigma phase formation 700 to 950 700 to 1000
Carbide precipitation 450 to 800 450 to 800
475:C embrittlement 300 to 525 300 to 525
Table 3 Precipitation reaction (and others) temperatures for duplex S/S. (36)
17
Figure 17 shows how little time is needed in order for some of these precipitates to form. In the
case of Sigma, Chi, Carbide and Alpha prime this can occur approximately between 3 and 15
minutes. Table 3 shows the temperature ranges required for these precipitation reactions to take
place. As can be seen in the case of sigma at the lower temperature of 700:C it takes about an hour
for its formation it is only at the higher temperature of 900:C that this can form in 3 minutes.
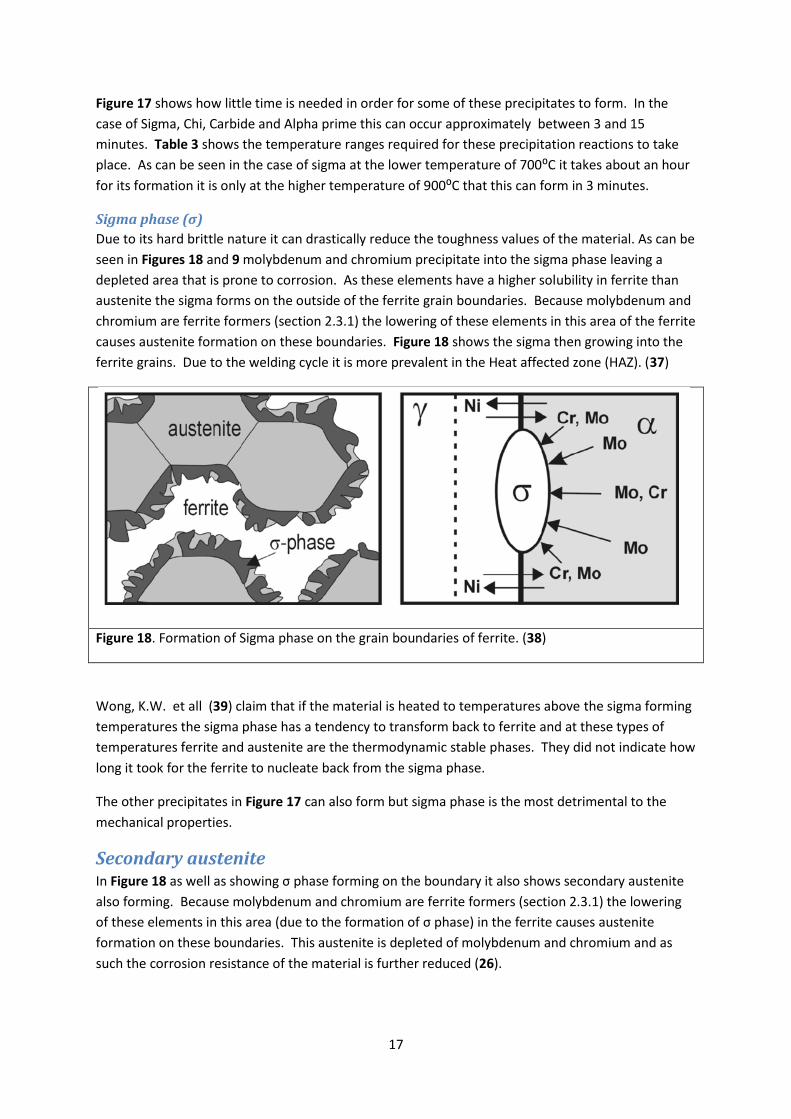
Sigma phase (σ)
Due to its hard brittle nature it can drastically reduce the toughness values of the material. As can be
seen in Figures 18 and 9 molybdenum and chromium precipitate into the sigma phase leaving a
depleted area that is prone to corrosion. As these elements have a higher solubility in ferrite than
austenite the sigma forms on the outside of the ferrite grain boundaries. Because molybdenum and
chromium are ferrite formers (section 2.3.1) the lowering of these elements in this area of the ferrite
causes austenite formation on these boundaries. Figure 18 shows the sigma then growing into the
ferrite grains. Due to the welding cycle it is more prevalent in the Heat affected zone (HAZ). (37)
Figure 18. Formation of Sigma phase on the grain boundaries of ferrite. (38)
Wong, K.W. et all (39) claim that if the material is heated to temperatures above the sigma forming
temperatures the sigma phase has a tendency to transform back to ferrite and at these types of
temperatures ferrite and austenite are the thermodynamic stable phases. They did not indicate how
long it took for the ferrite to nucleate back from the sigma phase.
The other precipitates in Figure 17 can also form but sigma phase is the most detrimental to the
mechanical properties.
Secondary austenite In Figure 18 as well as showing σ phase forming on the boundary it also shows secondary austenite
also forming. Because molybdenum and chromium are ferrite formers (section 2.3.1) the lowering
of these elements in this area (due to the formation of σ phase) in the ferrite causes austenite
formation on these boundaries. This austenite is depleted of molybdenum and chromium and as
such the corrosion resistance of the material is further reduced (26).
18
2.4 Maximum temperatures
2.4.1 475 Embrittlement
Figure 16 shows there are two groupings of precipitation the lower group are centred around 475:C
at the nose of the curve and as such there are known to cause "475:C embrittlement". One of the
most important is alpha(a') phase which will lead to hardening, loss of corrosion resistance and
embrittlement. As can be seen if Figure 17 this takes at least 20 minute to start at the 475:C
temperature. Some precipitation can take place at temperatures as low as 300:C, although at these
low temperatures this can take months if not years to take effect.
2.4.2 Recommended temperature
For the reasons given above it is recommended the there are maximum temperatures in which it is
suitable to use duplex S/S.
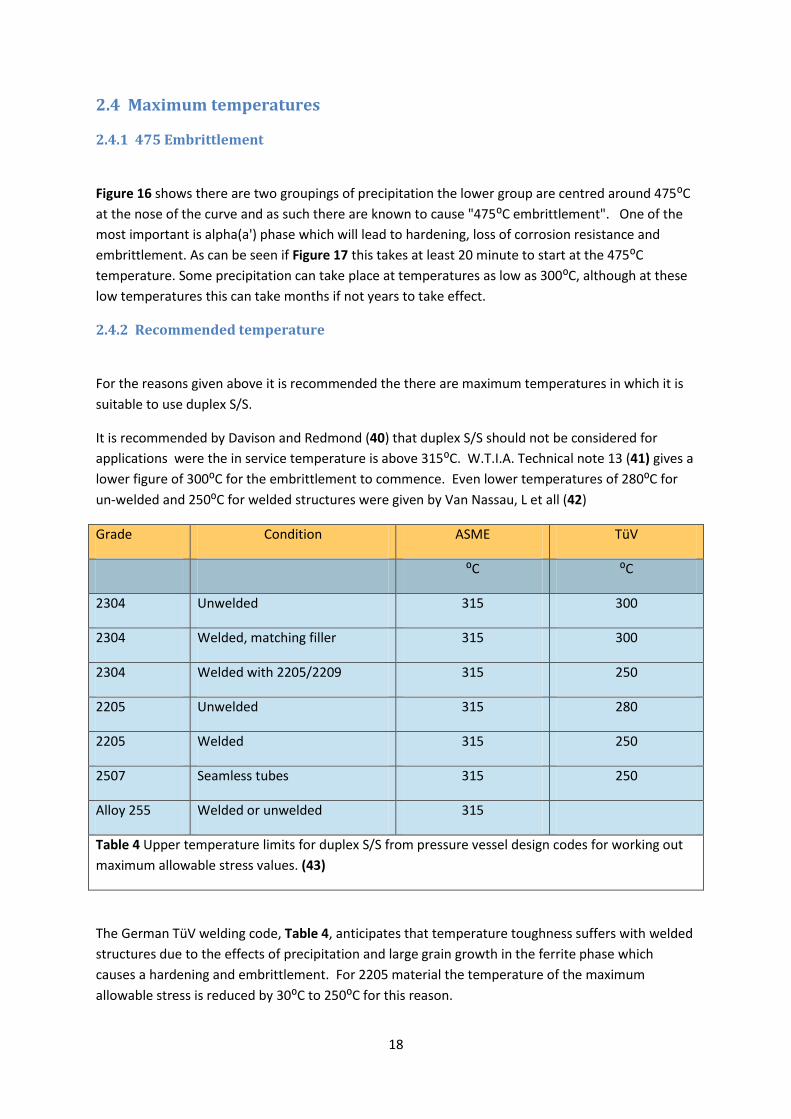
It is recommended by Davison and Redmond (40) that duplex S/S should not be considered for
applications were the in service temperature is above 315:C. W.T.I.A. Technical note 13 (41) gives a
lower figure of 300:C for the embrittlement to commence. Even lower temperatures of 280:C for
un-welded and 250:C for welded structures were given by Van Nassau, L et all (42)
Grade Condition ASME TüV
:C :C
2304 Unwelded 315 300
2304 Welded, matching filler 315 300
2304 Welded with 2205/2209 315 250
2205 Unwelded 315 280
2205 Welded 315 250
2507 Seamless tubes 315 250
Alloy 255 Welded or unwelded 315
Table 4 Upper temperature limits for duplex S/S from pressure vessel design codes for working out
maximum allowable stress values. (43)
The German TüV welding code, Table 4, anticipates that temperature toughness suffers with welded
structures due to the effects of precipitation and large grain growth in the ferrite phase which
causes a hardening and embrittlement. For 2205 material the temperature of the maximum
allowable stress is reduced by 30:C to 250:C for this reason.
19
2.4.3 t12/8 cooling rate
The rate of cooling between 1200:C and 800:C can be critical in achieving a the correct balance of
phases in duplex S/S. If the cooling is to rapid through this t12/8 zone then chromium nitrates can
form which will favour the formation of ferrite (25), however chromium nitrates can lower the
corrosion resistance. Whereas slower cooling through this range will favour austenite and in some
cases intermetallic precipitates (44). A cooling rate of 10 seconds through this critical zone was
proven to give an acceptable phase balance by Geipl, H. (45) This cooling rate is very difficult to
calculate as it involves taking direct temperature measurements in the weld pool as it solidifies.
Sieuri and Sandstrom (37) found that a cooling rate of
would be best to give the correct ferrite/austenite balance whilst at the same time limit the
formation of sigma phase during the critical t12/8 range.
20
3 Experiments and methodology
3.1 Experiment
The formation of intermetallic compounds rely on:
Diffusion
Time
Composition and thermal/thermo mechanical history (46)
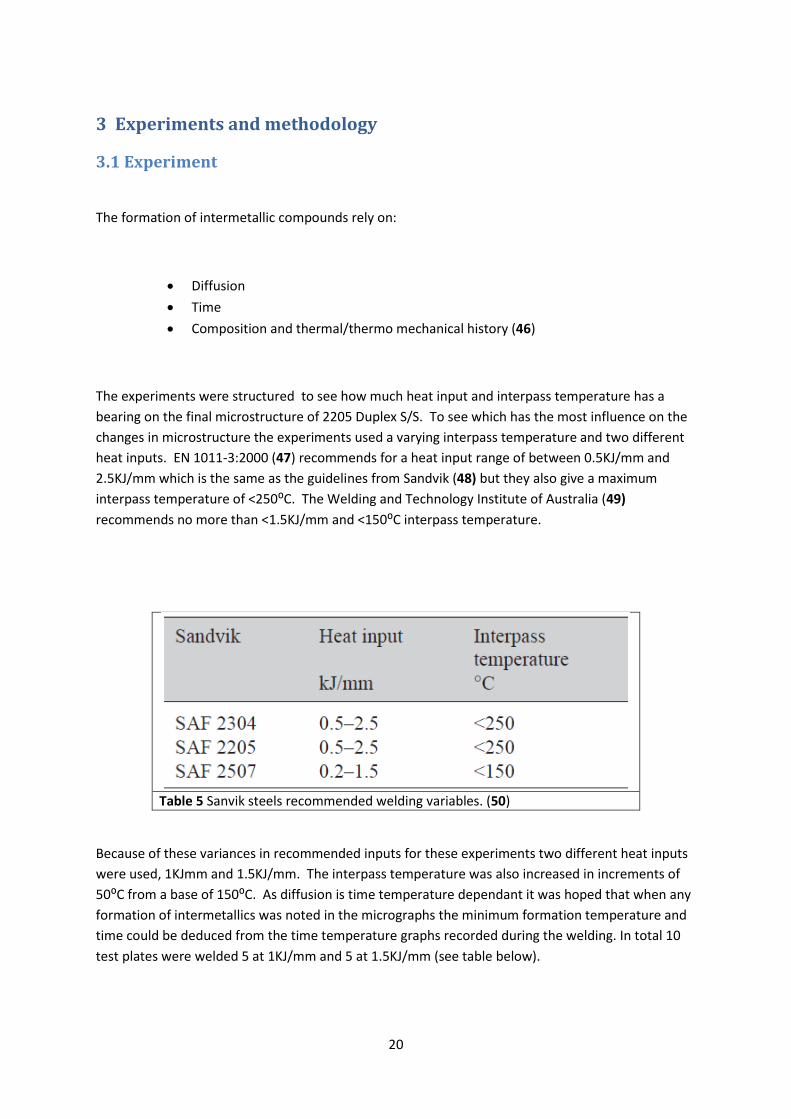
The experiments were structured to see how much heat input and interpass temperature has a
bearing on the final microstructure of 2205 Duplex S/S. To see which has the most influence on the
changes in microstructure the experiments used a varying interpass temperature and two different
heat inputs. EN 1011-3:2000 (47) recommends for a heat input range of between 0.5KJ/mm and
2.5KJ/mm which is the same as the guidelines from Sandvik (48) but they also give a maximum
interpass temperature of <250:C. The Welding and Technology Institute of Australia (49)
recommends no more than <1.5KJ/mm and <150:C interpass temperature.
Table 5 Sanvik steels recommended welding variables. (50)
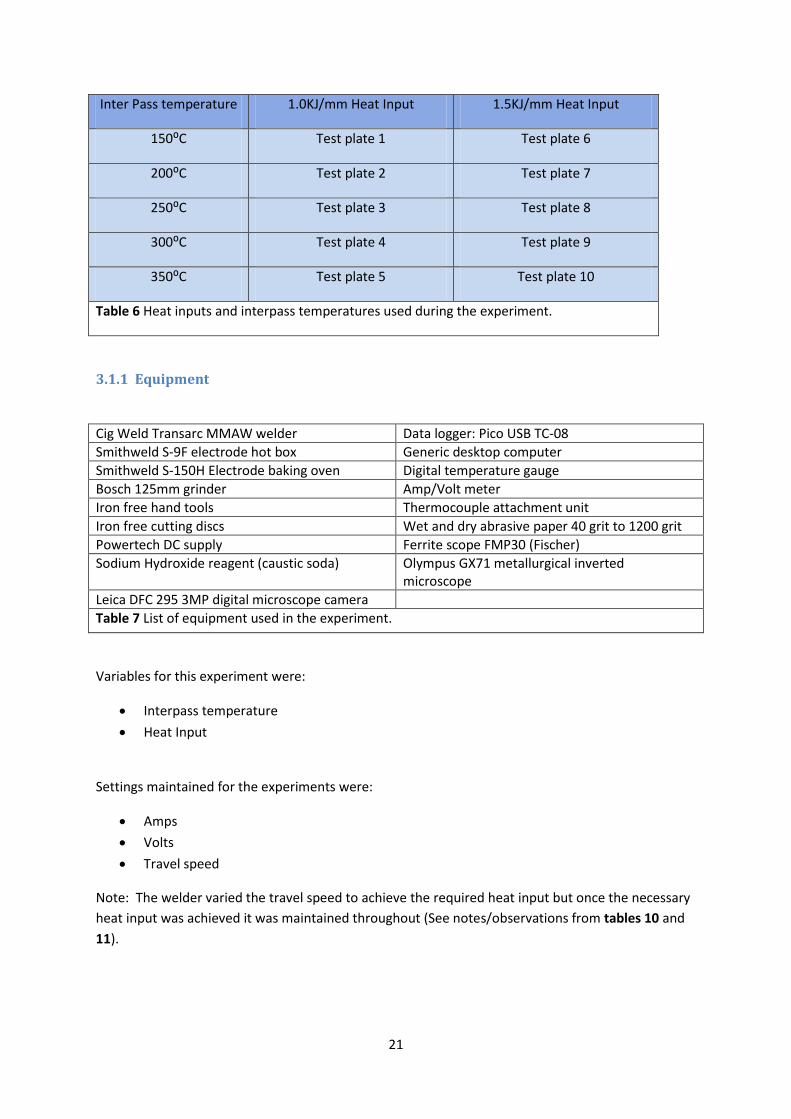
Because of these variances in recommended inputs for these experiments two different heat inputs
were used, 1KJmm and 1.5KJ/mm. The interpass temperature was also increased in increments of
50:C from a base of 150:C. As diffusion is time temperature dependant it was hoped that when any
formation of intermetallics was noted in the micrographs the minimum formation temperature and
time could be deduced from the time temperature graphs recorded during the welding. In total 10
test plates were welded 5 at 1KJ/mm and 5 at 1.5KJ/mm (see table below).
21
Inter Pass temperature 1.0KJ/mm Heat Input 1.5KJ/mm Heat Input
150:C Test plate 1 Test plate 6
200:C Test plate 2 Test plate 7
250:C Test plate 3 Test plate 8
300:C Test plate 4 Test plate 9
350:C Test plate 5 Test plate 10
Table 6 Heat inputs and interpass temperatures used during the experiment.
3.1.1 Equipment
Cig Weld Transarc MMAW welder Data logger: Pico USB TC-08
Smithweld S-9F electrode hot box Generic desktop computer
Smithweld S-150H Electrode baking oven Digital temperature gauge
Bosch 125mm grinder Amp/Volt meter
Iron free hand tools Thermocouple attachment unit
Iron free cutting discs Wet and dry abrasive paper 40 grit to 1200 grit
Powertech DC supply Ferrite scope FMP30 (Fischer)
Sodium Hydroxide reagent (caustic soda) Olympus GX71 metallurgical inverted microscope
Leica DFC 295 3MP digital microscope camera
Table 7 List of equipment used in the experiment.
Variables for this experiment were:
Interpass temperature
Heat Input
Settings maintained for the experiments were:
Amps
Volts
Travel speed
Note: The welder varied the travel speed to achieve the required heat input but once the necessary
heat input was achieved it was maintained throughout (See notes/observations from tables 10 and
11).
22
3.2 Material and weld preparation
3.2.1 Material composition
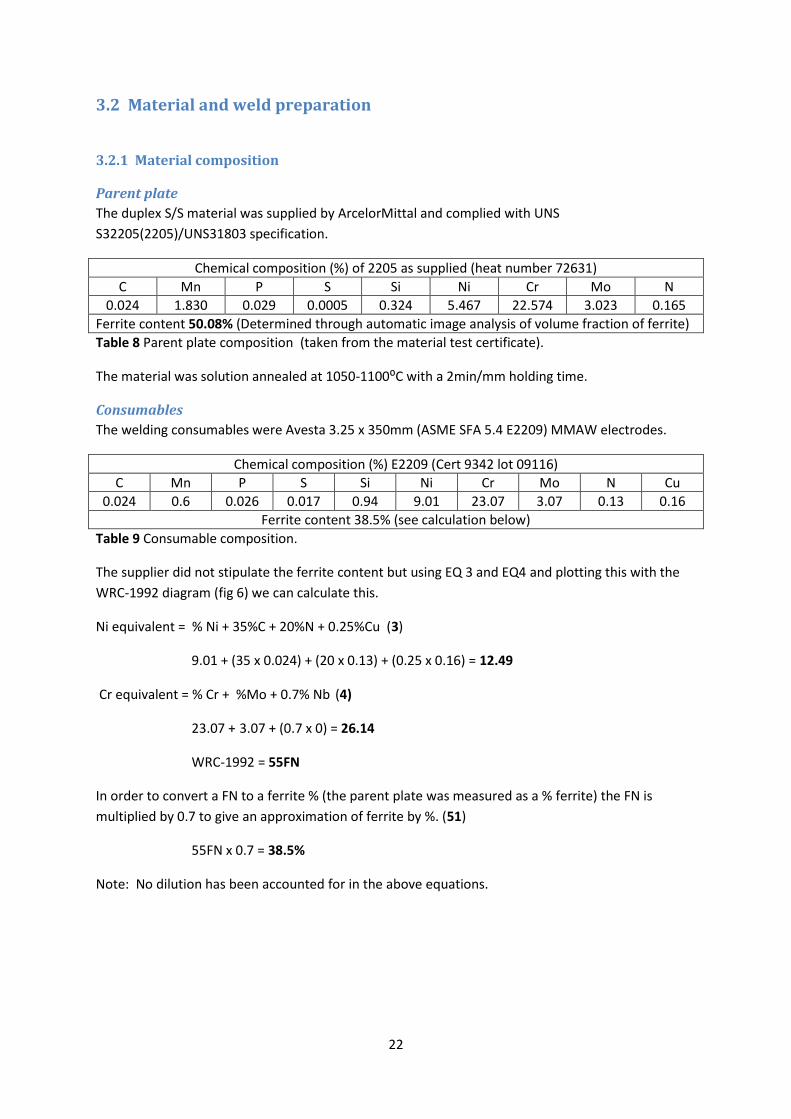
Parent plate
The duplex S/S material was supplied by ArcelorMittal and complied with UNS
S32205(2205)/UNS31803 specification.
Chemical composition (%) of 2205 as supplied (heat number 72631)
C Mn P S Si Ni Cr Mo N
0.024 1.830 0.029 0.0005 0.324 5.467 22.574 3.023 0.165
Ferrite content 50.08% (Determined through automatic image analysis of volume fraction of ferrite)
Table 8 Parent plate composition (taken from the material test certificate).
The material was solution annealed at 1050-1100:C with a 2min/mm holding time.
Consumables
The welding consumables were Avesta 3.25 x 350mm (ASME SFA 5.4 E2209) MMAW electrodes.
Chemical composition (%) E2209 (Cert 9342 lot 09116)
C Mn P S Si Ni Cr Mo N Cu
0.024 0.6 0.026 0.017 0.94 9.01 23.07 3.07 0.13 0.16
Ferrite content 38.5% (see calculation below)
Table 9 Consumable composition.
The supplier did not stipulate the ferrite content but using EQ 3 and EQ4 and plotting this with the
WRC-1992 diagram (fig 6) we can calculate this.
Ni equivalent = % Ni + 35%C + 20%N + 0.25%Cu (3)
9.01 + (35 x 0.024) + (20 x 0.13) + (0.25 x 0.16) = 12.49
Cr equivalent = % Cr + %Mo + 0.7% Nb (4)
23.07 + 3.07 + (0.7 x 0) = 26.14
WRC-1992 = 55FN
In order to convert a FN to a ferrite % (the parent plate was measured as a % ferrite) the FN is
multiplied by 0.7 to give an approximation of ferrite by %. (51)
55FN x 0.7 = 38.5%
Note: No dilution has been accounted for in the above equations.
23
3.2.2 Plate preparation
A relatively thick 16mm plate was selected for the experiment. It was hoped that the thick material
would allow enough welding runs to be deposited and allow the plate to "hold" the temperatures
achieved. For this reason the plates were kept to a small overall dimension of 150mm long x 75mm
wide to reduce the dissipation effect by conduction as seen in large plates with a large surface area.
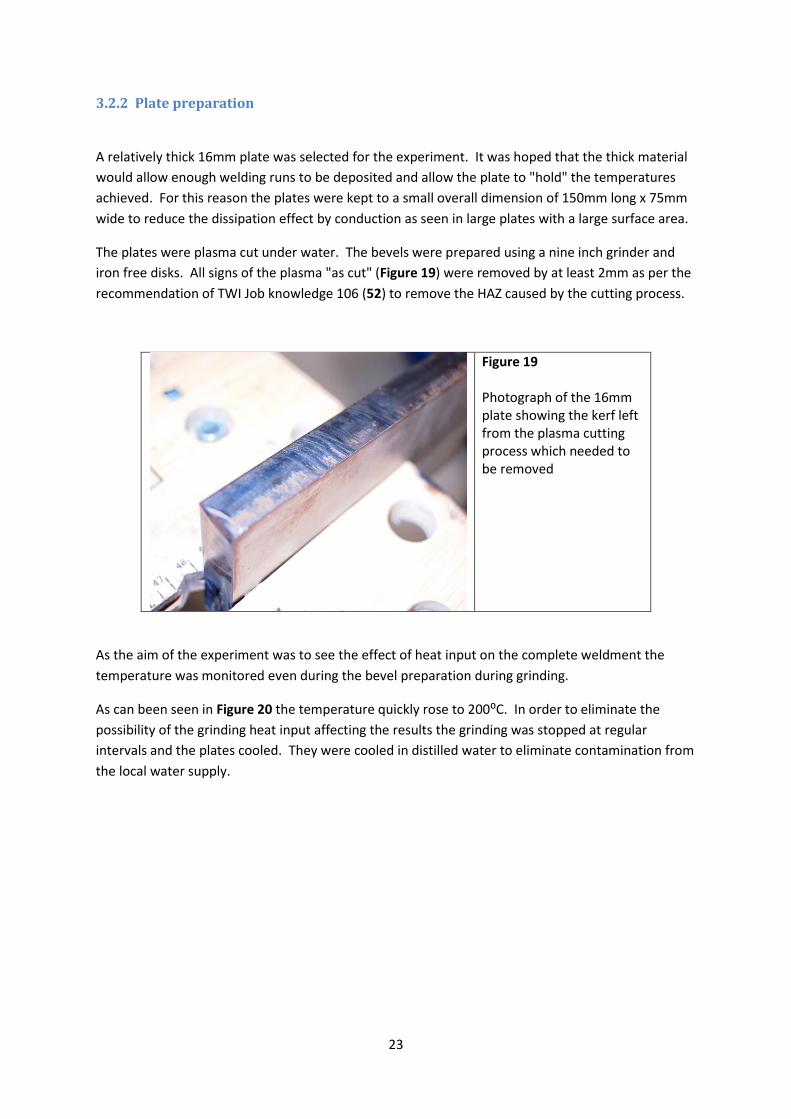
The plates were plasma cut under water. The bevels were prepared using a nine inch grinder and
iron free disks. All signs of the plasma "as cut" (Figure 19) were removed by at least 2mm as per the
recommendation of TWI Job knowledge 106 (52) to remove the HAZ caused by the cutting process.
Figure 19 Photograph of the 16mm plate showing the kerf left from the plasma cutting process which needed to be removed
As the aim of the experiment was to see the effect of heat input on the complete weldment the
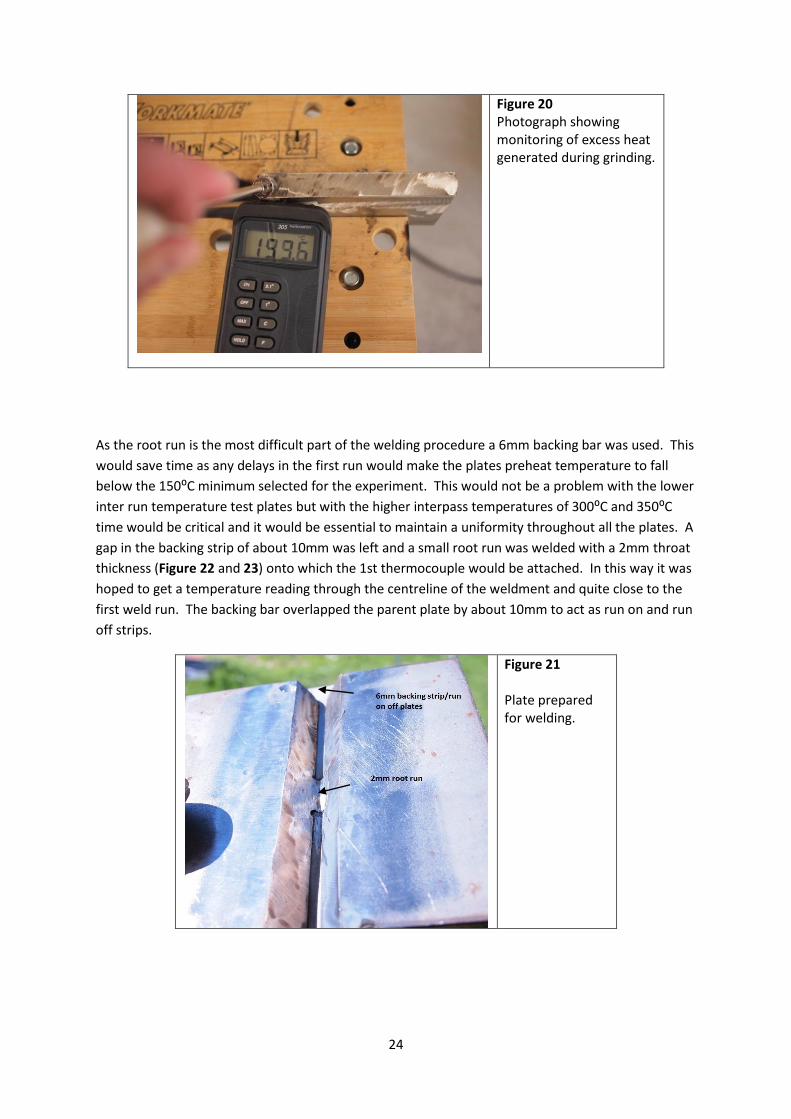
temperature was monitored even during the bevel preparation during grinding.
As can been seen in Figure 20 the temperature quickly rose to 200:C. In order to eliminate the
possibility of the grinding heat input affecting the results the grinding was stopped at regular
intervals and the plates cooled. They were cooled in distilled water to eliminate contamination from
the local water supply.
24
Figure 20 Photograph showing monitoring of excess heat generated during grinding.
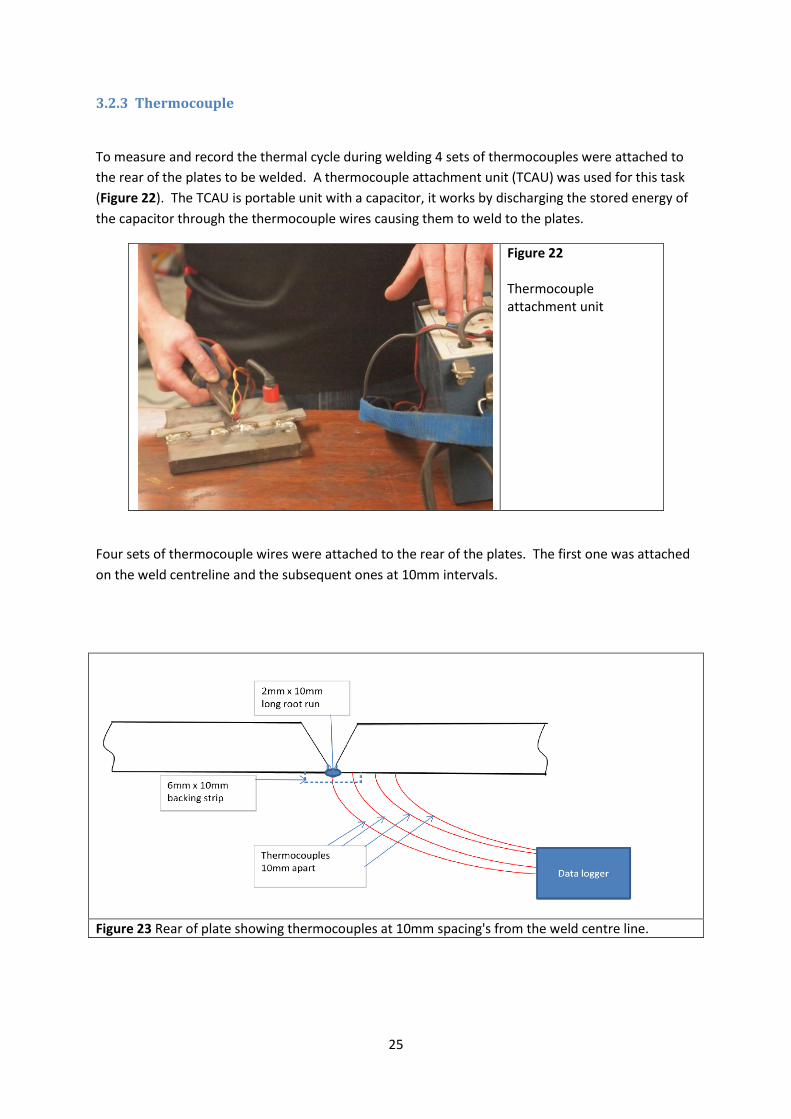
As the root run is the most difficult part of the welding procedure a 6mm backing bar was used. This
would save time as any delays in the first run would make the plates preheat temperature to fall
below the 150:C minimum selected for the experiment. This would not be a problem with the lower
inter run temperature test plates but with the higher interpass temperatures of 300:C and 350:C
time would be critical and it would be essential to maintain a uniformity throughout all the plates. A
gap in the backing strip of about 10mm was left and a small root run was welded with a 2mm throat
thickness (Figure 22 and 23) onto which the 1st thermocouple would be attached. In this way it was
hoped to get a temperature reading through the centreline of the weldment and quite close to the
first weld run. The backing bar overlapped the parent plate by about 10mm to act as run on and run
off strips.
Figure 21 Plate prepared for welding.
25
3.2.3 Thermocouple
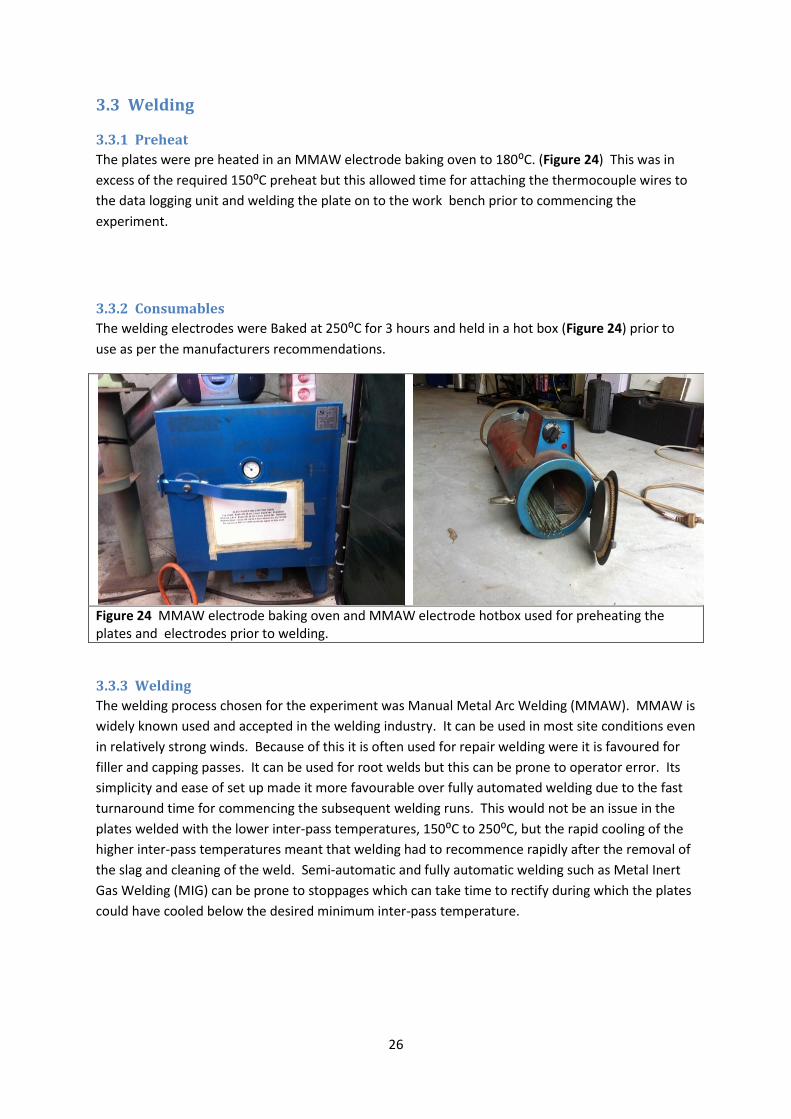
To measure and record the thermal cycle during welding 4 sets of thermocouples were attached to
the rear of the plates to be welded. A thermocouple attachment unit (TCAU) was used for this task
(Figure 22). The TCAU is portable unit with a capacitor, it works by discharging the stored energy of
the capacitor through the thermocouple wires causing them to weld to the plates.
Figure 22 Thermocouple attachment unit
Four sets of thermocouple wires were attached to the rear of the plates. The first one was attached
on the weld centreline and the subsequent ones at 10mm intervals.
Figure 23 Rear of plate showing thermocouples at 10mm spacing's from the weld centre line.
26
3.3 Welding
3.3.1 Preheat
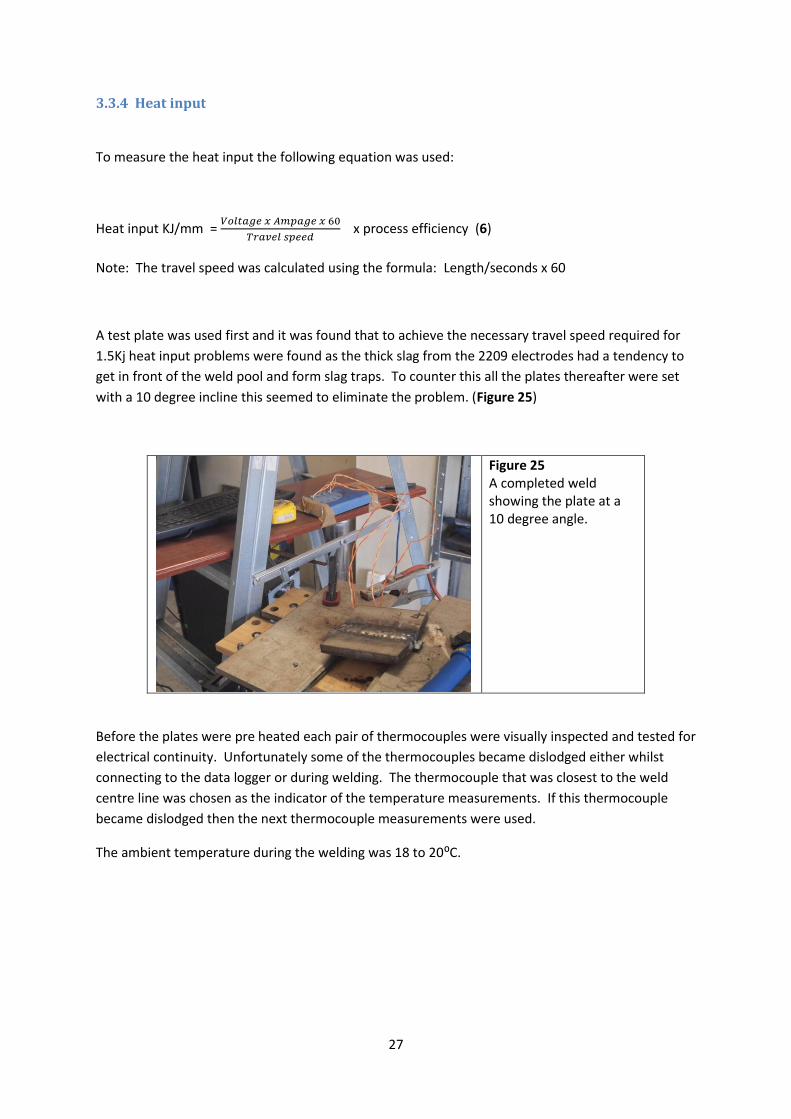
The plates were pre heated in an MMAW electrode baking oven to 180:C. (Figure 24) This was in
excess of the required 150:C preheat but this allowed time for attaching the thermocouple wires to
the data logging unit and welding the plate on to the work bench prior to commencing the
experiment.
3.3.2 Consumables
The welding electrodes were Baked at 250:C for 3 hours and held in a hot box (Figure 24) prior to
use as per the manufacturers recommendations.
Figure 24 MMAW electrode baking oven and MMAW electrode hotbox used for preheating the plates and electrodes prior to welding.
3.3.3 Welding
The welding process chosen for the experiment was Manual Metal Arc Welding (MMAW). MMAW is
widely known used and accepted in the welding industry. It can be used in most site conditions even
in relatively strong winds. Because of this it is often used for repair welding were it is favoured for
filler and capping passes. It can be used for root welds but this can be prone to operator error. Its
simplicity and ease of set up made it more favourable over fully automated welding due to the fast
turnaround time for commencing the subsequent welding runs. This would not be an issue in the
plates welded with the lower inter-pass temperatures, 150:C to 250:C, but the rapid cooling of the
higher inter-pass temperatures meant that welding had to recommence rapidly after the removal of
the slag and cleaning of the weld. Semi-automatic and fully automatic welding such as Metal Inert
Gas Welding (MIG) can be prone to stoppages which can take time to rectify during which the plates
could have cooled below the desired minimum inter-pass temperature.
27
3.3.4 Heat input
To measure the heat input the following equation was used:
Heat input KJ/mm =
x process efficiency (6)
Note: The travel speed was calculated using the formula: Length/seconds x 60
A test plate was used first and it was found that to achieve the necessary travel speed required for
1.5Kj heat input problems were found as the thick slag from the 2209 electrodes had a tendency to
get in front of the weld pool and form slag traps. To counter this all the plates thereafter were set
with a 10 degree incline this seemed to eliminate the problem. (Figure 25)
Figure 25 A completed weld showing the plate at a 10 degree angle.
Before the plates were pre heated each pair of thermocouples were visually inspected and tested for
electrical continuity. Unfortunately some of the thermocouples became dislodged either whilst
connecting to the data logger or during welding. The thermocouple that was closest to the weld
centre line was chosen as the indicator of the temperature measurements. If this thermocouple
became dislodged then the next thermocouple measurements were used.
The ambient temperature during the welding was 18 to 20:C.
28
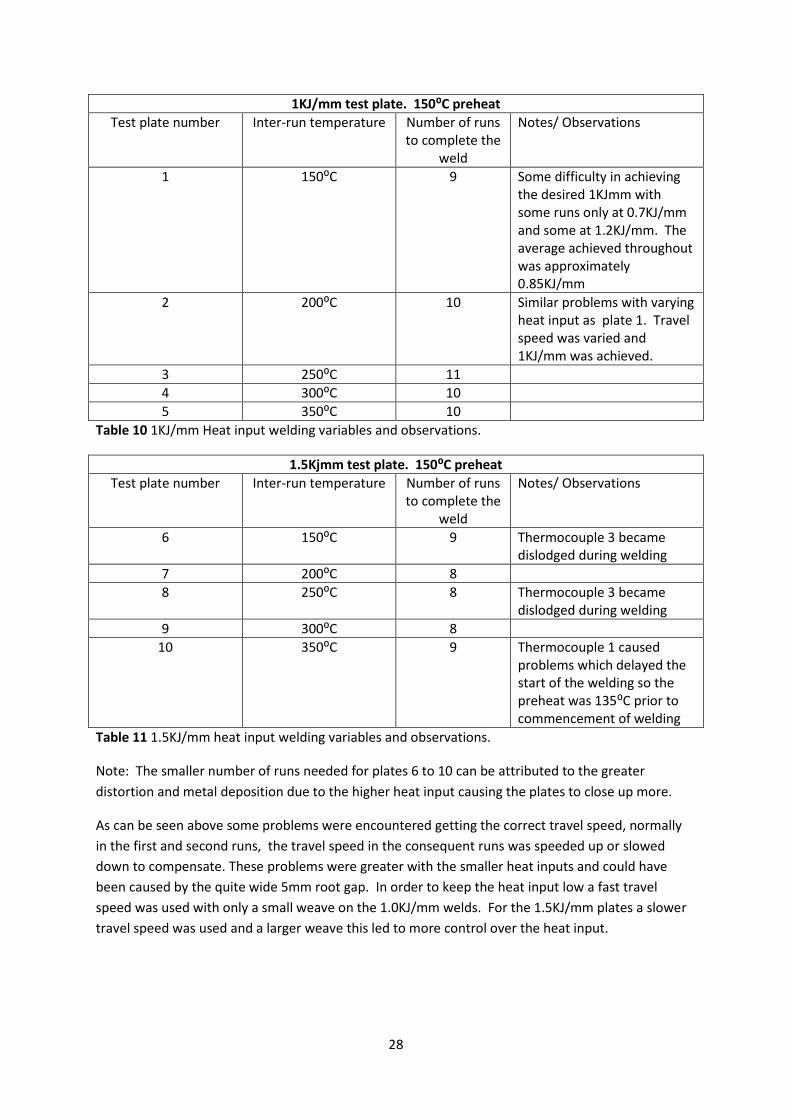
1KJ/mm test plate. 150⁰C preheat
Test plate number Inter-run temperature Number of runs to complete the
weld
Notes/ Observations
1 150:C 9 Some difficulty in achieving the desired 1KJmm with some runs only at 0.7KJ/mm and some at 1.2KJ/mm. The average achieved throughout was approximately 0.85KJ/mm
2 200:C 10 Similar problems with varying heat input as plate 1. Travel speed was varied and 1KJ/mm was achieved.
3 250:C 11
4 300:C 10
5 350:C 10
Table 10 1KJ/mm Heat input welding variables and observations.
1.5Kjmm test plate. 150⁰C preheat
Test plate number Inter-run temperature Number of runs to complete the
weld
Notes/ Observations
6 150:C 9 Thermocouple 3 became dislodged during welding
7 200:C 8
8 250:C 8 Thermocouple 3 became dislodged during welding
9 300:C 8
10 350:C 9 Thermocouple 1 caused problems which delayed the start of the welding so the preheat was 135:C prior to commencement of welding
Table 11 1.5KJ/mm heat input welding variables and observations.
Note: The smaller number of runs needed for plates 6 to 10 can be attributed to the greater
distortion and metal deposition due to the higher heat input causing the plates to close up more.
As can be seen above some problems were encountered getting the correct travel speed, normally
in the first and second runs, the travel speed in the consequent runs was speeded up or slowed
down to compensate. These problems were greater with the smaller heat inputs and could have
been caused by the quite wide 5mm root gap. In order to keep the heat input low a fast travel
speed was used with only a small weave on the 1.0KJ/mm welds. For the 1.5KJ/mm plates a slower
travel speed was used and a larger weave this led to more control over the heat input.
29
3.4 Testing
3.4.1 Material preparation for testing
On completion of the welding the plates were cut up using an automatic hacksaw to give samples
approximately 70mm in length. The samples were taken from the centre of the test piece where the
thermocouples had been attached. The hacksaw cut left a very rough finish which was removed
with a belt grinder. Care was taken to keep the heat down just as in the plate preparation in section
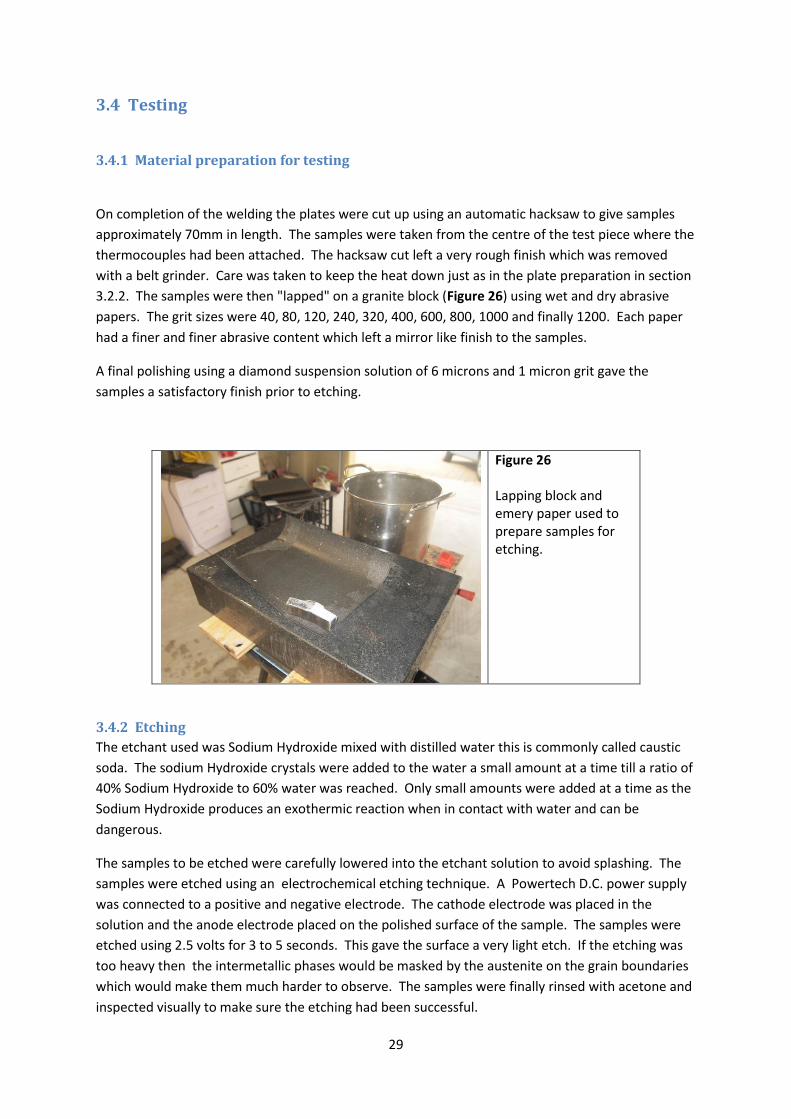
3.2.2. The samples were then "lapped" on a granite block (Figure 26) using wet and dry abrasive
papers. The grit sizes were 40, 80, 120, 240, 320, 400, 600, 800, 1000 and finally 1200. Each paper
had a finer and finer abrasive content which left a mirror like finish to the samples.
A final polishing using a diamond suspension solution of 6 microns and 1 micron grit gave the
samples a satisfactory finish prior to etching.
Figure 26 Lapping block and emery paper used to prepare samples for etching.
3.4.2 Etching
The etchant used was Sodium Hydroxide mixed with distilled water this is commonly called caustic
soda. The sodium Hydroxide crystals were added to the water a small amount at a time till a ratio of
40% Sodium Hydroxide to 60% water was reached. Only small amounts were added at a time as the
Sodium Hydroxide produces an exothermic reaction when in contact with water and can be
dangerous.
The samples to be etched were carefully lowered into the etchant solution to avoid splashing. The
samples were etched using an electrochemical etching technique. A Powertech D.C. power supply
was connected to a positive and negative electrode. The cathode electrode was placed in the
solution and the anode electrode placed on the polished surface of the sample. The samples were
etched using 2.5 volts for 3 to 5 seconds. This gave the surface a very light etch. If the etching was
too heavy then the intermetallic phases would be masked by the austenite on the grain boundaries
which would make them much harder to observe. The samples were finally rinsed with acetone and
inspected visually to make sure the etching had been successful.
30
The etchant reacts more so with the ferrite than the austenite so leaving the austenite slightly
elevated to the ferrite in the micrographs.
3.4.3 Metallographic examination
ASTM A 923 (46) sets out testing methods to be employed for detecting detrimental intermetallic
phases in duplex S/S. The three tests are:
Method A- Sodium hydroxide etch and metallographic examination.
Method B- Charpy impact testing.
Method C- G48 corrosion test.
For the purpose of this study only method A has been followed. The etching and micrograph do not
indicate the exact type of detrimental phases found but the absence of them would indicate an
unaffected structure. If intermetallics are observed then this is an indication that there will have a
detrimental effect on toughness and corrosion resistance. To quantify the detrimental effect would
require further testing using charpy impact testing to measure the reduction in the materials
toughness and a G48 corrosion test to measure the lowering of the materials corrosion resistance.
A general survey was carried out using an Olympus GX71 metallurgical inverted microscope with a
Leica DFC 295 3MP digital microscope camera to capture the images. This was started on the centre
line of the weld to the root. This was followed by moving the sample 2mm and repeating till one
half of the weldment was surveyed to the HAZ zone plus 10mm.
As the formation of intermetallic phases is dependent on temperature and cooling rate a more
thorough metallographic examination concentrated on the region's most likely to contain these
phases. This area is in the centre of the weldment as this is the area that cools most slowly.
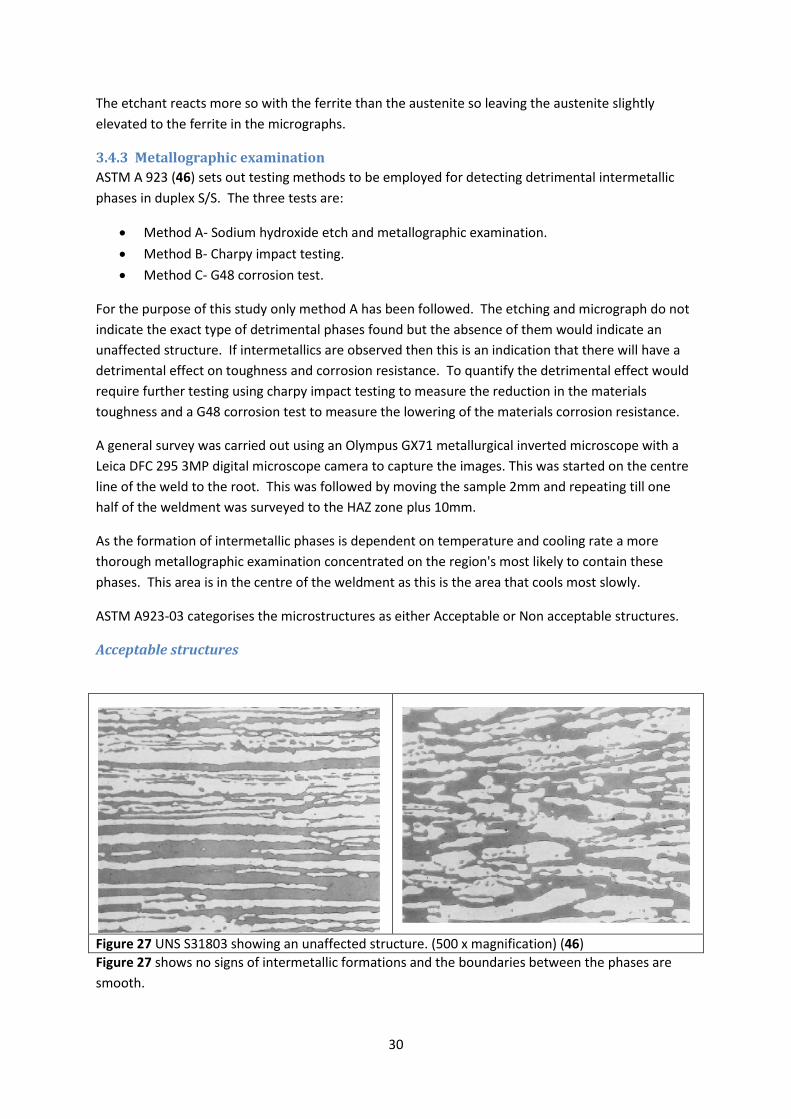
ASTM A923-03 categorises the microstructures as either Acceptable or Non acceptable structures.
Acceptable structures
Figure 27 UNS S31803 showing an unaffected structure. (500 x magnification) (46)
Figure 27 shows no signs of intermetallic formations and the boundaries between the phases are
smooth.
31
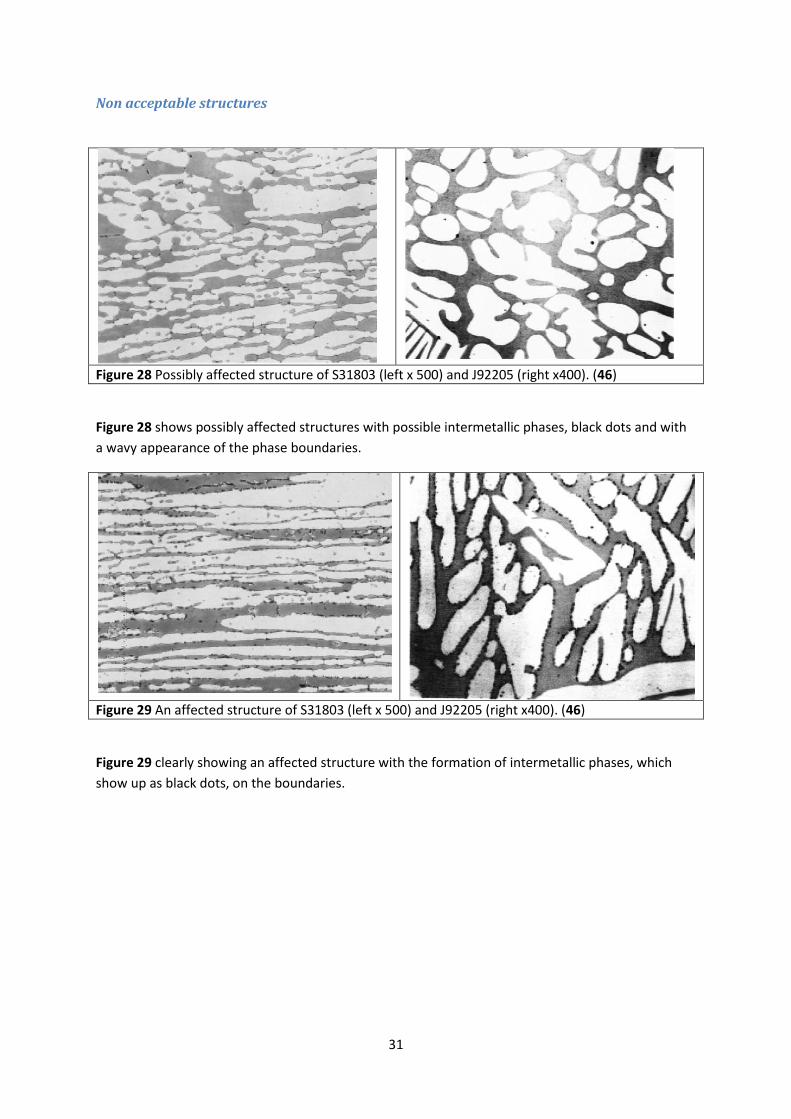
Non acceptable structures
Figure 28 Possibly affected structure of S31803 (left x 500) and J92205 (right x400). (46)
Figure 28 shows possibly affected structures with possible intermetallic phases, black dots and with
a wavy appearance of the phase boundaries.
Figure 29 An affected structure of S31803 (left x 500) and J92205 (right x400). (46)
Figure 29 clearly showing an affected structure with the formation of intermetallic phases, which
show up as black dots, on the boundaries.
32
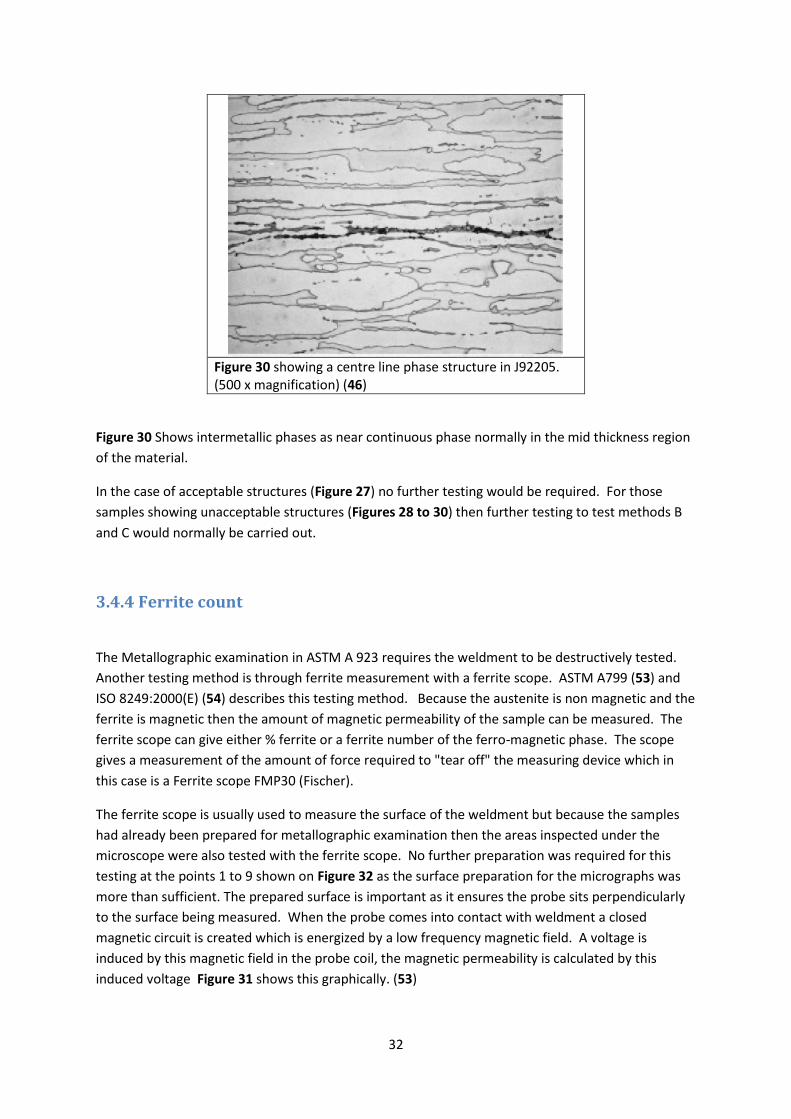
Figure 30 showing a centre line phase structure in J92205. (500 x magnification) (46)
Figure 30 Shows intermetallic phases as near continuous phase normally in the mid thickness region
of the material.
In the case of acceptable structures (Figure 27) no further testing would be required. For those
samples showing unacceptable structures (Figures 28 to 30) then further testing to test methods B
and C would normally be carried out.
3.4.4 Ferrite count
The Metallographic examination in ASTM A 923 requires the weldment to be destructively tested.
Another testing method is through ferrite measurement with a ferrite scope. ASTM A799 (53) and
ISO 8249:2000(E) (54) describes this testing method. Because the austenite is non magnetic and the
ferrite is magnetic then the amount of magnetic permeability of the sample can be measured. The
ferrite scope can give either % ferrite or a ferrite number of the ferro-magnetic phase. The scope
gives a measurement of the amount of force required to "tear off" the measuring device which in
this case is a Ferrite scope FMP30 (Fischer).
The ferrite scope is usually used to measure the surface of the weldment but because the samples
had already been prepared for metallographic examination then the areas inspected under the
microscope were also tested with the ferrite scope. No further preparation was required for this
testing at the points 1 to 9 shown on Figure 32 as the surface preparation for the micrographs was
more than sufficient. The prepared surface is important as it ensures the probe sits perpendicularly
to the surface being measured. When the probe comes into contact with weldment a closed
magnetic circuit is created which is energized by a low frequency magnetic field. A voltage is
induced by this magnetic field in the probe coil, the magnetic permeability is calculated by this
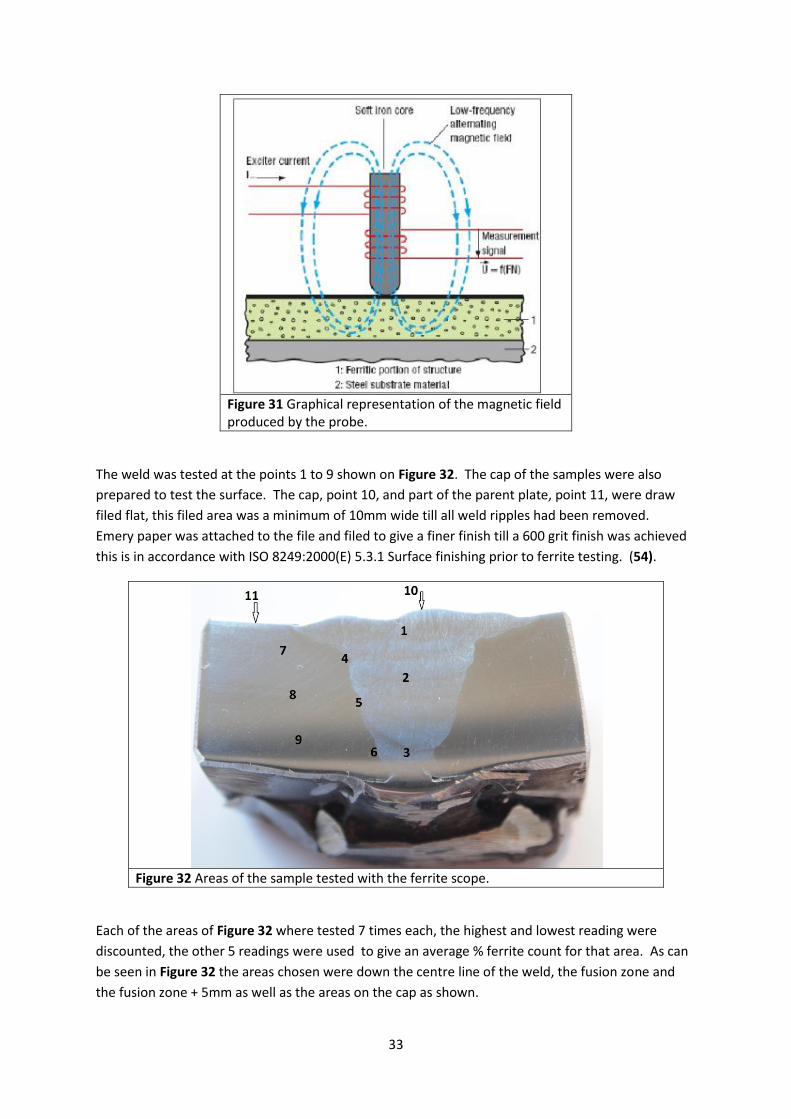
induced voltage Figure 31 shows this graphically. (53)
33
Figure 31 Graphical representation of the magnetic field produced by the probe.
The weld was tested at the points 1 to 9 shown on Figure 32. The cap of the samples were also
prepared to test the surface. The cap, point 10, and part of the parent plate, point 11, were draw
filed flat, this filed area was a minimum of 10mm wide till all weld ripples had been removed.
Emery paper was attached to the file and filed to give a finer finish till a 600 grit finish was achieved
this is in accordance with ISO 8249:2000(E) 5.3.1 Surface finishing prior to ferrite testing. (54).
Figure 32 Areas of the sample tested with the ferrite scope.
Each of the areas of Figure 32 where tested 7 times each, the highest and lowest reading were
discounted, the other 5 readings were used to give an average % ferrite count for that area. As can
be seen in Figure 32 the areas chosen were down the centre line of the weld, the fusion zone and
the fusion zone + 5mm as well as the areas on the cap as shown.
34
4 Results
4.1 Materials prior to experiment
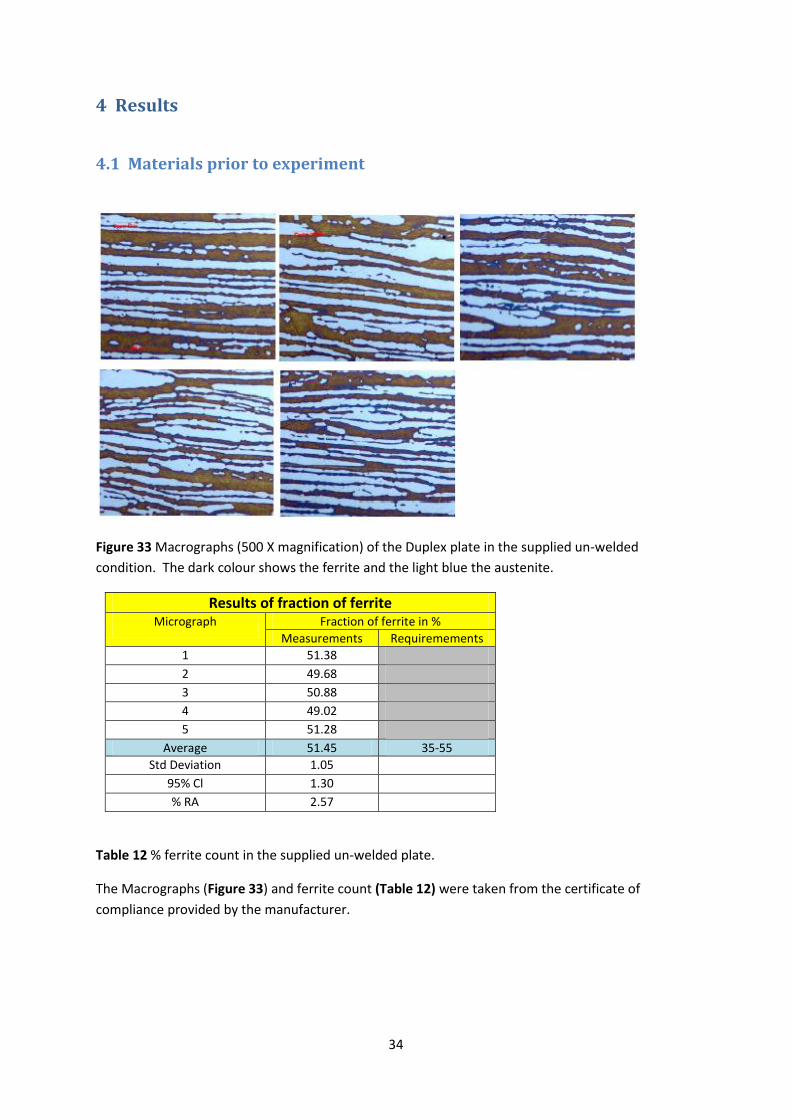
Figure 33 Macrographs (500 X magnification) of the Duplex plate in the supplied un-welded
condition. The dark colour shows the ferrite and the light blue the austenite.
Results of fraction of ferrite Micrograph Fraction of ferrite in %
Measurements Requiremements 1 51.38 2 49.68 3 50.88 4 49.02 5 51.28
Average 51.45 35-55 Std Deviation 1.05
95% Cl 1.30 % RA 2.57
Table 12 % ferrite count in the supplied un-welded plate.
The Macrographs (Figure 33) and ferrite count (Table 12) were taken from the certificate of
compliance provided by the manufacturer.
35
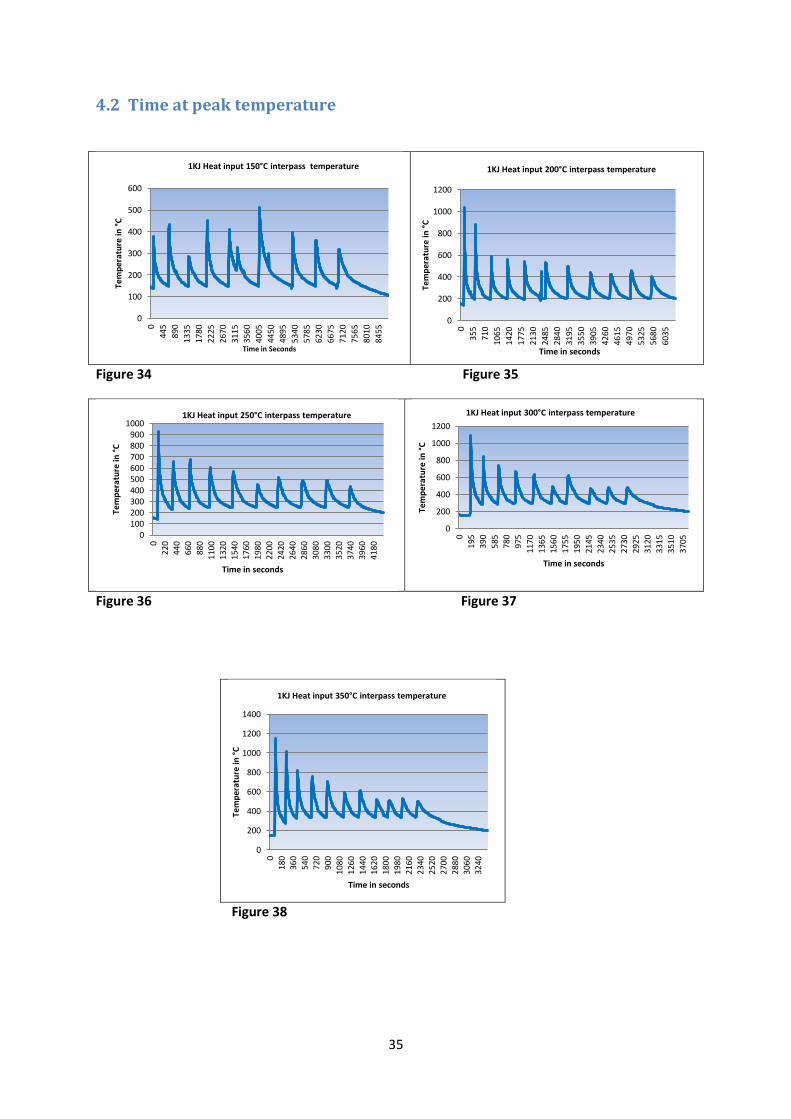
4.2 Time at peak temperature
Figure 34 Figure 35
Figure 36 Figure 37
Figure 38
0
100
200
300
400
500
600
0
44
5
89
0
13
35
17
80
22
25
26
70
31
15
35
60
40
05
44
50
48
95
53
40
57
85
62
30
66
75
71
20
75
65
80
10
84
55
Tem
per
atu
re in
°C
Time in Seconds
1KJ Heat input 150°C interpass temperature
0
200
400
600
800
1000
1200
0
35
5
71
0
10
65
14
20
17
75
21
30
24
85
28
40
31
95
35
50
39
05
42
60
46
15
49
70
53
25
56
80
60
35
Tem
per
atu
re in
°C
Time in seconds
1KJ Heat input 200°C interpass temperature
0 100 200 300 400 500 600 700 800 900
1000
0
220
440
660
880
1100
1320
1540
1760
1980
2200
2420
2640
2860
3080
3300
3520
3740
3960
4180
Tem
per
atu
re in
°C
Time in seconds
1KJ Heat input 250°C interpass temperature
0
200
400
600
800
1000
1200
0
195
390
585
780
975
1170
1365
1560
1755
1950
2145
2340
2535
2730
2925
3120
3315
3510
3705
Tem
per
atu
re in
°C
Time in seconds
1KJ Heat input 300°C interpass temperature
0
200
400
600
800
1000
1200
1400
0 1
80
36
0
54
0 7
20
90
0 1
08
0
12
60
14
40
16
20
18
00
19
80
21
60
23
40
25
20
27
00
28
80
30
60
32
40
Tem
per
atu
re in
°C
Time in seconds
1KJ Heat input 350°C interpass temperature
36
Figure 39 Figure 40
Figure 41 Figure 42
Figure 43
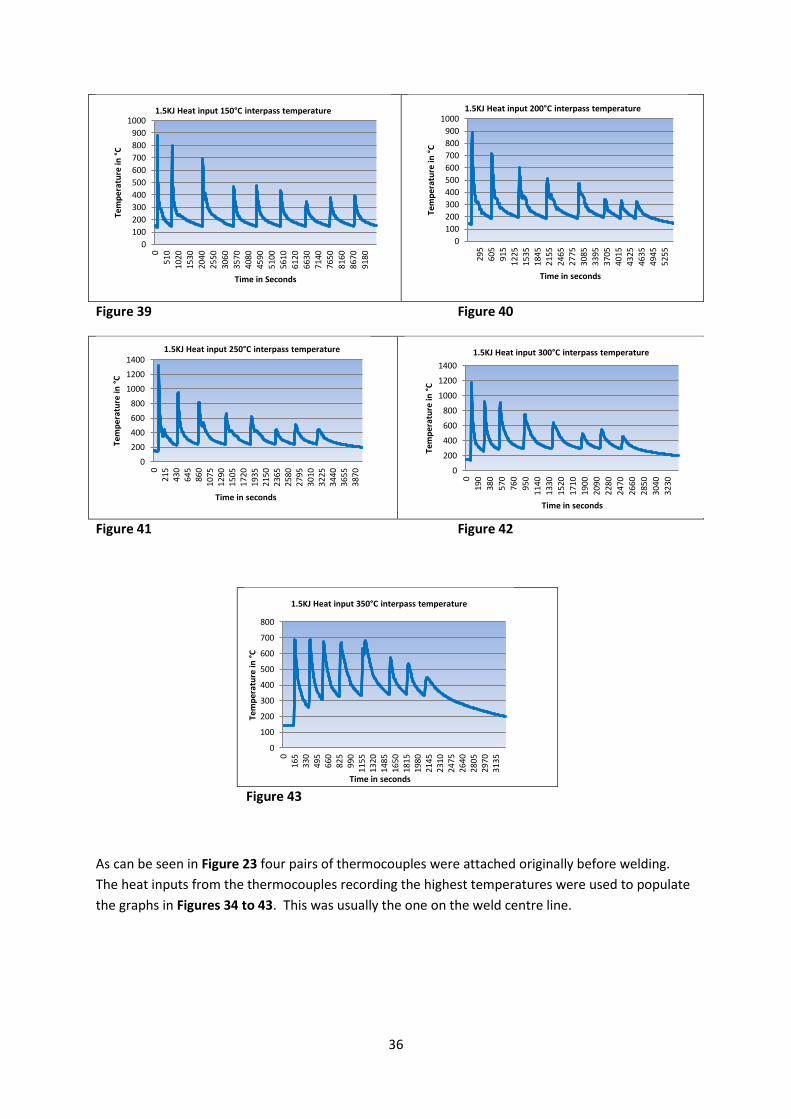
As can be seen in Figure 23 four pairs of thermocouples were attached originally before welding.
The heat inputs from the thermocouples recording the highest temperatures were used to populate
the graphs in Figures 34 to 43. This was usually the one on the weld centre line.
0
100
200
300
400
500
600
700
800
900
1000
0
51
0
10
20
15
30
20
40
25
50
30
60
35
70
40
80
45
90
51
00
56
10
61
20
66
30
71
40
76
50
81
60
86
70
91
80
Tem
per
atu
re in
°C
Time in Seconds
1.5KJ Heat input 150°C interpass temperature
0
100
200
300
400
500
600
700
800
900
1000
29
5 6
05
91
5 1
22
5 1
53
5 1
84
5 2
15
5 2
46
5 2
77
5 3
08
5 3
39
5 3
70
5 4
01
5 4
32
5 4
63
5 4
94
5 5
25
5
Tem
per
atu
re in
°C
Time in seconds
1.5KJ Heat input 200°C interpass temperature
0
200
400
600
800
1000
1200
1400
0 21
5
430
64
5
860
10
75
1290
15
05
1720
19
35
2150
23
65
2580
27
95
3010
32
25
3440
36
55
3870
Tem
per
atu
re in
°C
Time in seconds
1.5KJ Heat input 250°C interpass temperature
0
200
400
600
800
1000
1200
1400
0
190
380
570
760
950
1140
1330
1520
1710
1900
2090
2280
2470
2660
2850
3040
3230
Tem
per
atu
re in
°C
Time in seconds
1.5KJ Heat input 300°C interpass temperature
0
100
200
300
400
500
600
700
800
0 1
65
330
4
95
660
8
25
990
1
155
1
320
1
485
1
650
1
815
1
980
2
145
2
310
2
475
2
640
2
805
2
970
3
135
Tem
pe
ratu
re in
°C
Time in seconds
1.5KJ Heat input 350°C interpass temperature
37
Heat input and inter-run
temperature
Time above 350:C Minutes
Time above 400:C Minutes
Time above 450:C Minutes
Time above 500:C Minutes
1KJ/mm 150:C 4.66 1.75 0.41 .08
1KJ/mm 200:C 14.66 7.66 3.66 1.83
1KJ/mm 250:C 19.08 11.83 6.33 3.08
1KJ/mm 300:C 24.16 15.25 9.0 4.66
1KJ/mm 350:C 32.58 19.55 12.5 7.0
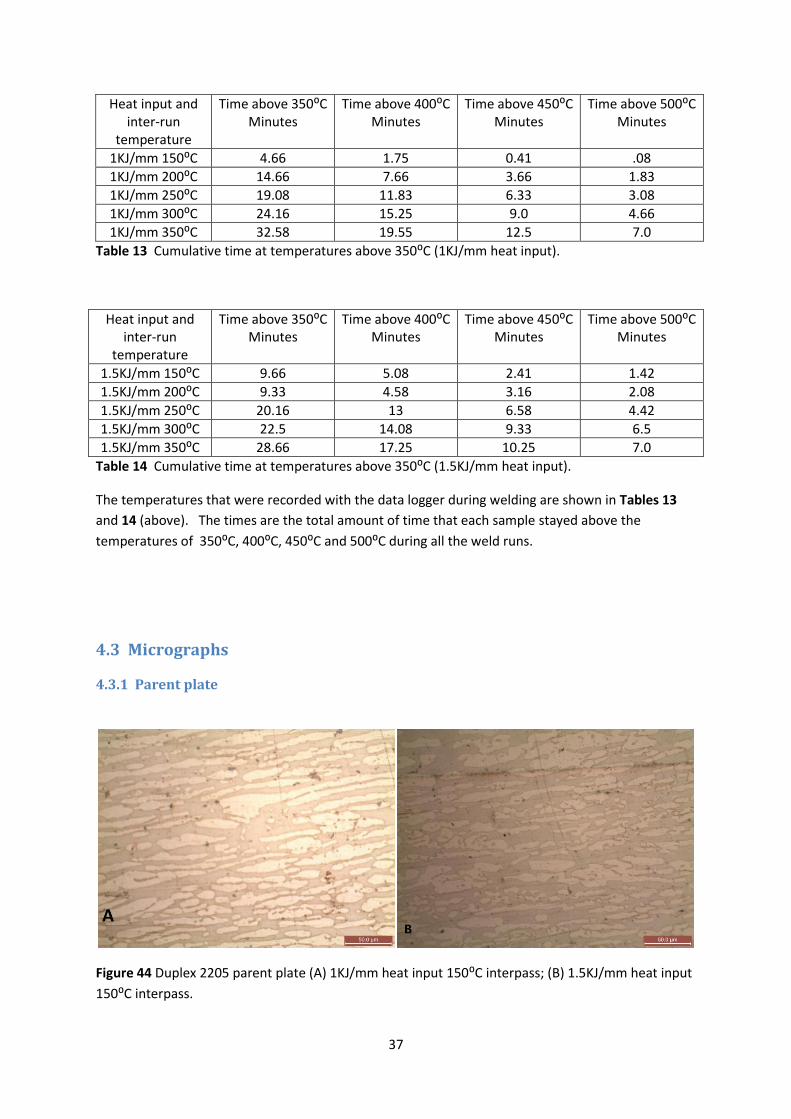
Table 13 Cumulative time at temperatures above 350:C (1KJ/mm heat input).
Heat input and inter-run
temperature
Time above 350:C Minutes
Time above 400:C Minutes
Time above 450:C Minutes
Time above 500:C Minutes
1.5KJ/mm 150:C 9.66 5.08 2.41 1.42
1.5KJ/mm 200:C 9.33 4.58 3.16 2.08
1.5KJ/mm 250:C 20.16 13 6.58 4.42
1.5KJ/mm 300:C 22.5 14.08 9.33 6.5
1.5KJ/mm 350:C 28.66 17.25 10.25 7.0
Table 14 Cumulative time at temperatures above 350:C (1.5KJ/mm heat input).
The temperatures that were recorded with the data logger during welding are shown in Tables 13
and 14 (above). The times are the total amount of time that each sample stayed above the
temperatures of 350:C, 400:C, 450:C and 500:C during all the weld runs.
4.3 Micrographs
4.3.1 Parent plate
Figure 44 Duplex 2205 parent plate (A) 1KJ/mm heat input 150:C interpass; (B) 1.5KJ/mm heat input
150:C interpass.
38
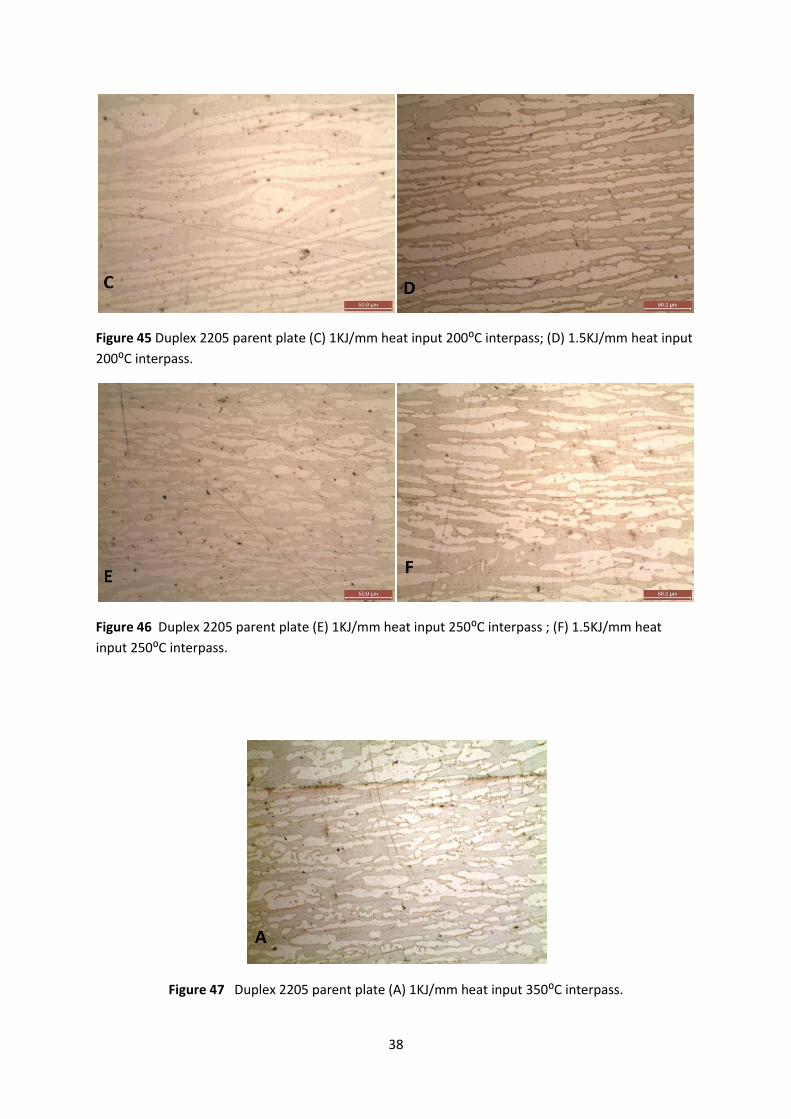
Figure 45 Duplex 2205 parent plate (C) 1KJ/mm heat input 200:C interpass; (D) 1.5KJ/mm heat input
200:C interpass.
Figure 46 Duplex 2205 parent plate (E) 1KJ/mm heat input 250:C interpass ; (F) 1.5KJ/mm heat
input 250:C interpass.
Figure 47 Duplex 2205 parent plate (A) 1KJ/mm heat input 350:C interpass.
39
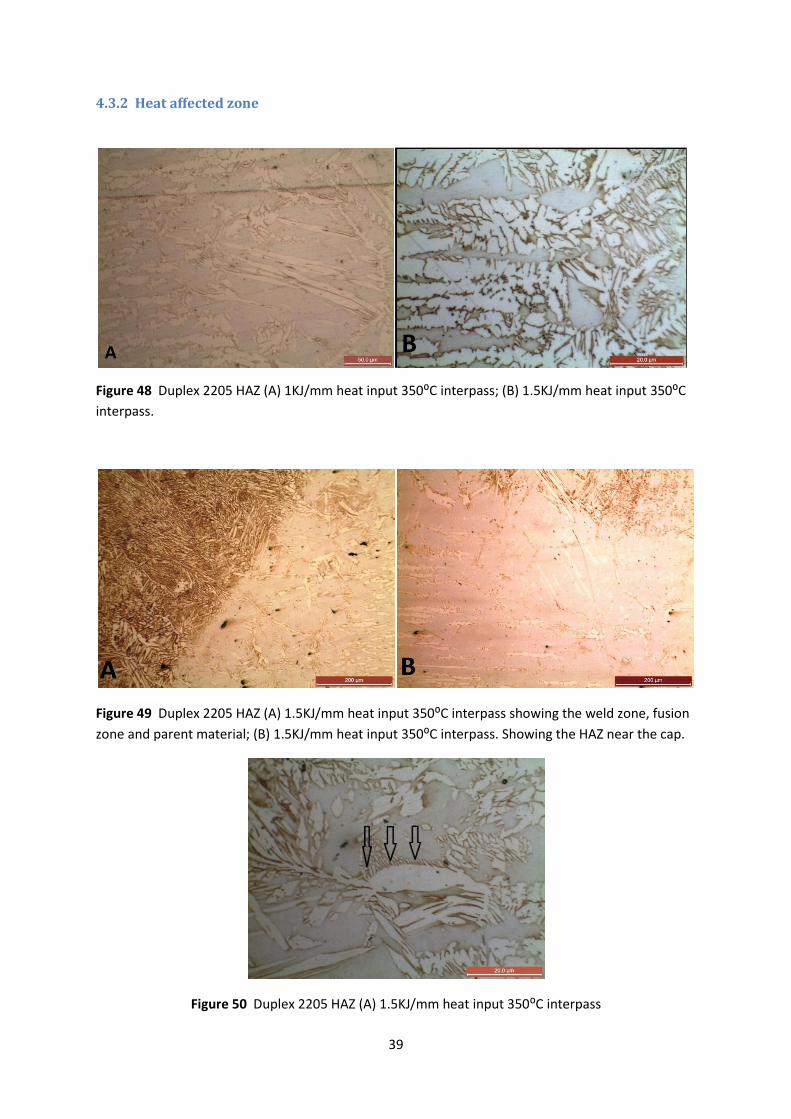
4.3.2 Heat affected zone
Figure 48 Duplex 2205 HAZ (A) 1KJ/mm heat input 350:C interpass; (B) 1.5KJ/mm heat input 350:C
interpass.
Figure 49 Duplex 2205 HAZ (A) 1.5KJ/mm heat input 350:C interpass showing the weld zone, fusion
zone and parent material; (B) 1.5KJ/mm heat input 350:C interpass. Showing the HAZ near the cap.
Figure 50 Duplex 2205 HAZ (A) 1.5KJ/mm heat input 350:C interpass
40
4.4 Ferrite count
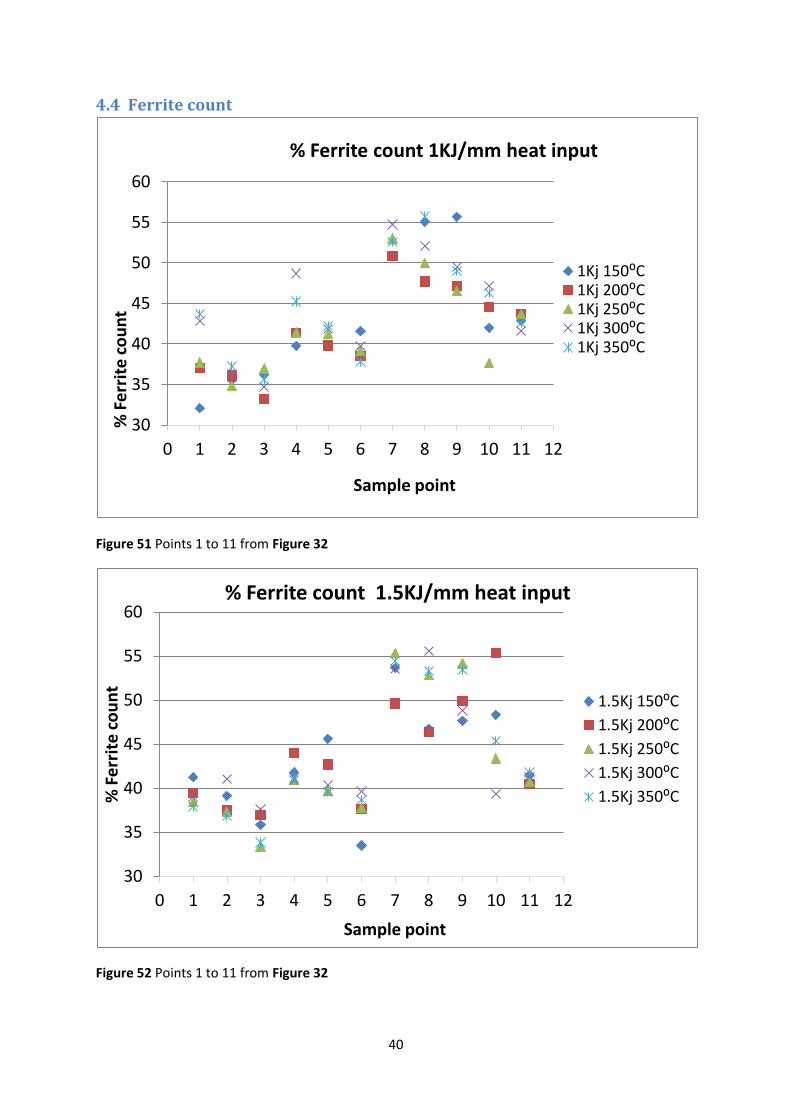
Figure 51 Points 1 to 11 from Figure 32
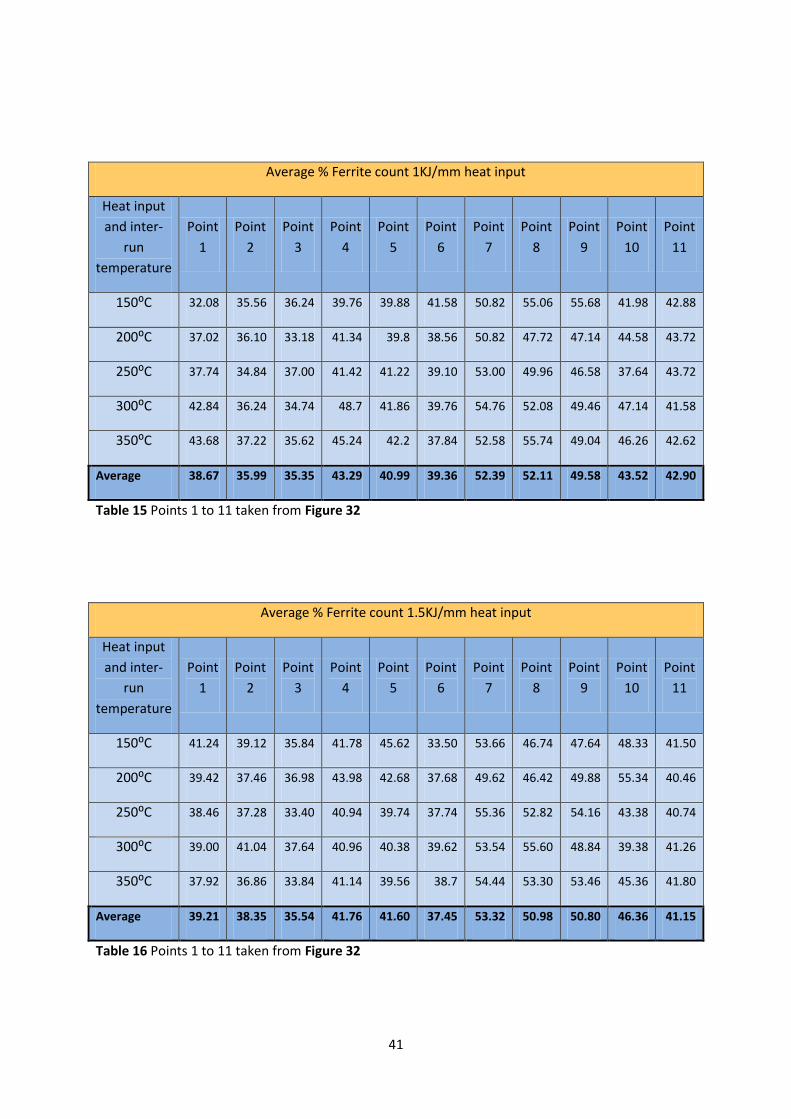
Figure 52 Points 1 to 11 from Figure 32
30
35
40
45
50
55
60
0 1 2 3 4 5 6 7 8 9 10 11 12
% F
err
ite
co
un
t
Sample point
% Ferrite count 1KJ/mm heat input
1Kj 150:C 1Kj 200:C 1Kj 250:C 1Kj 300:C 1Kj 350:C
30
35
40
45
50
55
60
0 1 2 3 4 5 6 7 8 9 10 11 12
% F
err
ite
co
un
t
Sample point
% Ferrite count 1.5KJ/mm heat input
1.5Kj 150:C
1.5Kj 200:C
1.5Kj 250:C
1.5Kj 300:C
1.5Kj 350:C
41
Average % Ferrite count 1KJ/mm heat input
Heat input
and inter-
run
temperature
Point
1
Point
2
Point
3
Point
4
Point
5
Point
6
Point
7
Point
8
Point
9
Point
10
Point
11
150:C 32.08 35.56 36.24 39.76 39.88 41.58 50.82 55.06 55.68 41.98 42.88
200:C 37.02 36.10 33.18 41.34 39.8 38.56 50.82 47.72 47.14 44.58 43.72
250:C 37.74 34.84 37.00 41.42 41.22 39.10 53.00 49.96 46.58 37.64 43.72
300:C 42.84 36.24 34.74 48.7 41.86 39.76 54.76 52.08 49.46 47.14 41.58
350:C 43.68 37.22 35.62 45.24 42.2 37.84 52.58 55.74 49.04 46.26 42.62
Average 38.67 35.99 35.35 43.29 40.99 39.36 52.39 52.11 49.58 43.52 42.90
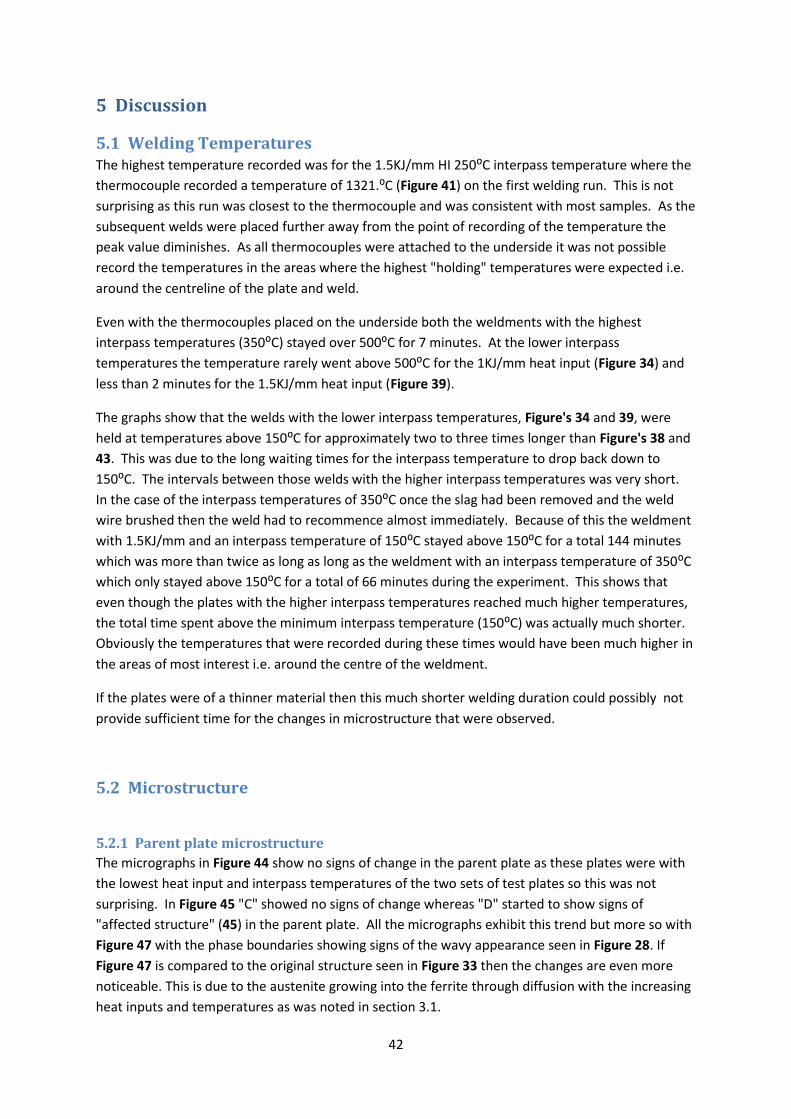
Table 15 Points 1 to 11 taken from Figure 32
Average % Ferrite count 1.5KJ/mm heat input
Heat input
and inter-
run
temperature
Point
1
Point
2
Point
3
Point
4
Point
5
Point
6
Point
7
Point
8
Point
9
Point
10
Point
11
150:C 41.24 39.12 35.84 41.78 45.62 33.50 53.66 46.74 47.64 48.33 41.50
200:C 39.42 37.46 36.98 43.98 42.68 37.68 49.62 46.42 49.88 55.34 40.46
250:C 38.46 37.28 33.40 40.94 39.74 37.74 55.36 52.82 54.16 43.38 40.74
300:C 39.00 41.04 37.64 40.96 40.38 39.62 53.54 55.60 48.84 39.38 41.26
350:C 37.92 36.86 33.84 41.14 39.56 38.7 54.44 53.30 53.46 45.36 41.80
Average 39.21 38.35 35.54 41.76 41.60 37.45 53.32 50.98 50.80 46.36 41.15
Table 16 Points 1 to 11 taken from Figure 32
42
5 Discussion
5.1 Welding Temperatures The highest temperature recorded was for the 1.5KJ/mm HI 250:C interpass temperature where the
thermocouple recorded a temperature of 1321.:C (Figure 41) on the first welding run. This is not
surprising as this run was closest to the thermocouple and was consistent with most samples. As the
subsequent welds were placed further away from the point of recording of the temperature the
peak value diminishes. As all thermocouples were attached to the underside it was not possible
record the temperatures in the areas where the highest "holding" temperatures were expected i.e.
around the centreline of the plate and weld.
Even with the thermocouples placed on the underside both the weldments with the highest
interpass temperatures (350:C) stayed over 500:C for 7 minutes. At the lower interpass
temperatures the temperature rarely went above 500:C for the 1KJ/mm heat input (Figure 34) and
less than 2 minutes for the 1.5KJ/mm heat input (Figure 39).
The graphs show that the welds with the lower interpass temperatures, Figure's 34 and 39, were
held at temperatures above 150:C for approximately two to three times longer than Figure's 38 and
43. This was due to the long waiting times for the interpass temperature to drop back down to
150:C. The intervals between those welds with the higher interpass temperatures was very short.
In the case of the interpass temperatures of 350:C once the slag had been removed and the weld
wire brushed then the weld had to recommence almost immediately. Because of this the weldment
with 1.5KJ/mm and an interpass temperature of 150:C stayed above 150:C for a total 144 minutes
which was more than twice as long as long as the weldment with an interpass temperature of 350:C
which only stayed above 150:C for a total of 66 minutes during the experiment. This shows that
even though the plates with the higher interpass temperatures reached much higher temperatures,
the total time spent above the minimum interpass temperature (150:C) was actually much shorter.
Obviously the temperatures that were recorded during these times would have been much higher in
the areas of most interest i.e. around the centre of the weldment.
If the plates were of a thinner material then this much shorter welding duration could possibly not
provide sufficient time for the changes in microstructure that were observed.
5.2 Microstructure
5.2.1 Parent plate microstructure
The micrographs in Figure 44 show no signs of change in the parent plate as these plates were with
the lowest heat input and interpass temperatures of the two sets of test plates so this was not
surprising. In Figure 45 "C" showed no signs of change whereas "D" started to show signs of
"affected structure" (45) in the parent plate. All the micrographs exhibit this trend but more so with
Figure 47 with the phase boundaries showing signs of the wavy appearance seen in Figure 28. If
Figure 47 is compared to the original structure seen in Figure 33 then the changes are even more
noticeable. This is due to the austenite growing into the ferrite through diffusion with the increasing
heat inputs and temperatures as was noted in section 3.1.
43
5.2.2 HAZ microstructure
The only micrograph that showed any definite intermetallic precipitation was for the weldment of
1.5KJ/mm 350:C interpass temperature (Figure 48 "B"). The intermetallics were shown up as black
dots on the boundaries between the phases. The weldment with the lower heat input, 1.0KJ but the
same interpass temperature (Figure 48 "A"). exhibited no signs of intermetallics present.
The micrograph's in Figure 49 show the area of the HAZ with large areas of ferrite, in fact the
austenite is found in thin bands in a sea of ferrite. Figure 49 "A" was taken in the centre of the
weldment so was held at an elevated temperature for an extended period but still there is more
ferrite than austenite. This is due to the welding thermal cycle in which any austenite forming will
revert back to ferrite when the next weld run is placed over the top of the previous run. This can be
seen in Figure 12 where the HAZ temperatures will rise taking the material back into the ferrite
forming range. As the temperature starts to fall back into the austenite forming range the next weld
will be deposited and the cycle will be repeated.
In Figure 49 "B" the micrograph was taken close to the surface near the cap of the weld and the lack
of austenite is even greater. This is due not to the welding thermal cycle reverting the austenite
back to ferrite as in Figure 40 "A" and Figure 40 "B" but to the rapid cooling of the weldment at the
cap so very little austenite can form from the ferrite as it passes through t12/8 cooling zone too
quickly.
In areas that have not been subjected to the extremes of the welding thermal cycle, i.e. on the
boundary between the HAZ and parent material, the temperatures have not reached that in which
the austenite has reverted back to ferrite. However this area has sat at temperatures where the
diffusion of the austenite from the ferrite can continue. Figure 50 appears to show the austenite
"growing" as Widmanst tten plates into the ferrite.
5.2.3 % Ferrite
Using the WRC 1992 diagram (Figure 6) it was estimated that the weld deposit should have been
38.5% ferrite.
Looking at Tables 15 - 16 and Figures 51 - 52 a pattern can be seen. The first 3 readings, points 1 to
3, were from the weld metal with point 1 being near the surface this had the highest ferrite, the
ferrite % decreased towards the base of the plate. This was consistent with points 4 to 6 for the HAZ
and 7 to 9 for the parent plate. This would indicate that because the base had a longer time at an
elevated temperature then the austenite had more opportunity to form.
Points 10 (cap) and 11 (plate surface) on Figure 32 also showed difference in ferrite readings over
the corresponding readings (points 1 and 7) taken just 3mm below the surface. The average for 10
44
was 44.36% against 38.62% for point 1, the average for 11 was 41.3% against 54.1% for point 7. This
can be explained for the weld metal as the cooling rate for point 10 through the t12/8 zone faster
than the 10 seconds required for the transformation of austenite from the ferrite (45). The areas of
11 and 7 would have passed through these temperature ranges much more slowly but this does not
explain why the surface has a much lower ferrite count than the sub-surface.
Point 3 had the lowest average ferrite count of all the points tested with an average of 35.35% for
1KJ/mm and 35.54 for the 1.5JK/mm samples. This low reading cannot be explained as an effect of
the cooling effect of the root being open to cooling in air If this was the case then the ferrite count
would actually be higher than what was measured. The low ferrite count must have come about
due to this area having the greatest amount of dilution between the weld and parent metal.
Even so the lowest average ferrite count of 35.35% was just above the 30% needed to retain the
duplex S/S properties so in this case was acceptable.
45
6 Conclusion
Although there didn't seem to be a huge difference between 1KJ/mm and 1.5KJ/mm heat inputs at
the various temperatures it was noticed that the first indication of an affected structure took place
at 1.5KJ/mm with only 200:C interpass temperature and yet the corresponding plate with same
temperature but a lower heat input there was no sign of this. When the 1KJ/mm plate had an
interpass temperature of 250:C the micrographs also showed these signs. All the following test
pieces exhibited these changes. It was also noticed that the only sample in which intermetallics
formed was of the higher heat input at 350:C and yet again the sample with 1KJ/mm showed no sign
but as noted in section 5.2.1 the microstructure had already shown signs of change. It may well be if
an interpass of 400:C had been applied to the 1KJ/mm sample then this would have started to
exhibit similar signs of intermetallic phases forming. From this it can be concluded that the increase
in heat input does have a direct affect on the microstructures final phase structure.
The increasing interpass temperature did have a marked effect on the structure of the HAZ and the
parent plate near the HAZ. The recommended interpass temperatures given by Sandvik (48 and
Table 5) of 250:C if used in conjunction with the maximum heat input of between
1.5KJmm/2.5KJmm would lead to a HAZ with an affected structure. The recommendations from the
Welding and Technology Institute of Australia (49) of <1.5KJ/mm and <150:C interpass temperature
would seem to be correct.
The welding procedures carried out in the experiments whilst acceptable for the lower interpass
temperatures were unrealistic above 250:C. Minimum interpass temperatures of 350:C using
MMAW welding are almost impossible to physically carry out in anything except small weldments.
The complex welding cycles encouraged the austenite in the HAZ to transform back to ferrite as
predicted by Wong, K.W. et all (39). This will lead to poor toughness values and reduced corrosion
resistance due to large ferrite grain growth.
As can be seen from tables 13 and 14 the precipitates need more time at elevated temperatures
than is normally seen in welding to form harmful precipitates.
From these results it would seem that intermetallic precipitation is not a welding problem but is an
in-service phenomenon where the weldment stays at an elevated temperature for long periods of
time and intermetallic precipitates can form slowly.
Once a satisfactory weld procedure has been ran and passed all the relevant testing necessary for
the particular welding code being used then the welding variables must be strictly adhered to. For
the MMAW welding used during the experiment the maximum interpass temperature of 150:C was
the only temperature where a satisfactory microstructure was produced for both the of the heat
inputs used. The heat input did seem to have an effect on the microstructure but so long as the
weld procedure has passed the relevant testing then this should be acceptable if the interpass
temperature is kept low enough.
The detrimental effects of heat input and interpass temperature on the microstructure of duplex
stainless steel during welding are therefore controllable. It is up to the design engineer to take into
consideration the thermo mechanical history imposed during welding to ensure that the service

46
temperature stays within acceptable limits. If this is adhered to then the weldment should free
from metallurgical problems throughout its life cycle.
47
7 References
1 International Molybdenum Association. Practical Guidelines for the fabrication of duplex stainless
steels. Citing internet source http://www.imoa.info/downloads/brochures_articles.php (accessed 12
August 2011).
2 International Molybdenum Association. Practical Guidelines for the fabrication of duplex stainless
steels. Citing internet source http://www.imoa.info/downloads/brochures_articles.php (accessed 12
August 2011) p 9.
3 Key to metals Duplex Stainless Steels: Part One Citing internet source
http://www.keytometals.com/page.aspx?ID=CheckArticle&site=kts&LN=FI&NM=208 (accessed 15
December 2011).
4 Bringas, John. Stainless Steel Metallurgy. In: The metals black book: Ferrous metals, Casti
Publishing Inc, 1997, p.87.
5 International Molybdenum Association Practical guidelines for the fabrication of high performance
austenitic stainless steels Citing internet source
http://www.imoa.info/downloads/brochures_articles.php (accessed 12 August 2011) p.7.
6 Bringas, John. Stainless Steel Metallurgy. In: The metals black book: Ferrous metals, Casti
Publishing Inc, 1997, p.87.
7 International Molybdenum Association Practical guidelines for the fabrication of high performance
austenitic stainless steels. P.8. Citing internet source.
http://www.imoa.info/downloads/brochures_articles.php (accessed 12 August 2011)
8 Nicholas, J. Stainless steels- predicting ferrite through the years, Citing internet source.
http://www.twi.co.uk/content/ksjmn002.html (accessed 25th June 2011).
9 Kou, Sindo. Transformation in Austenitic stainless steel welds. In: Welding Metallurgy 2nd Edition
Wiley 2003 P.224.
10 Feldstein, j., Lake. F., A new constitution diagram for predicting ferrite content of stainless steel
weld metals. Technical report Materials and design Volume 14 Number 6 1993 p.345.
11 McCowan, C. N., Siewert, T. A., and Olson, D. l. Stainless steel weld metal: prediction of ferrite
content. Welding Research Council Bull, 342: 1989 p.1-36.
12 Kotecki, D.J., and Siewert, T., A ; WRC-1992 constitution diagram for stainless steel weld metals: a
modification of the WRC-1988 diagram. Welding journal 71,1992 p171s-178s.
13 Kotecki, D.J., and Siewert, T., A ; WRC-1992 constitution diagram for stainless steel weld metals: a
modification of the WRC-1988 diagram. Welding journal 71,1992 p171s-178s.
14 Atlas steels Ferritic Stainless steels sheet, coil & plate, Citing internet source.
www.atlassteels.com.au, 2010 P6 (accessed 1st August 2011).
48
15 Baker, R.G,. Weldability and its implications for material requirements. Philosophical
Transactions of the Royal Society of London. Series A, Mathematical and Physical Sciences 1976.
p.129.
16 Sourmail,t., and Bhadeshia, H.K.D.h. Stainless Steels University of Cambridge p6.
17 Bringas, John. Stainless Steel Metallurgy. In: The metals black book: Ferrous metals, Casti
Publishing Inc, 1997, p.87.
18 Bringas, J. E., Stainless Steel Metallurgy The metals black book: Ferrous metals, Casti Publishing
Inc p.80.
19 Mathers, G., job knowledge 101. Welding of ferritic/martensitic stainless steels (July 2009), Citing
internet source. http://www.twi.co.uk/services/technical-information/job-knowledge/job-
knowledge-101-welding-of-ferritic-martensitic-stainless-steels-july-2009/?locale=en (accessed 24th
June 2011).
20 Atlas steels Ferritic Stainless steels sheet, coil & plate (2010) P6, Citing internet source.
www.atlassteels.com.au, (accessed 1st August 2011).
21 EN 1011-3:2000: Welding-Recommendations for welding of metallic materials - Part 3 Arc
welding of stainless steels P.18.
22 Jana. S,. Effect of heat input on the HAZ properties of two duplex stainless steels. Journal of
materials Processing Technology. 33, 1992 P.247-261.
23 Nowacki,J., Lukojc,A, Structure and properties of the heat affected zone of duplex steels welded joints. Journal of materials processing Technology 164-165 2005 p.1075. 24 International Molybdenum Association. Practical Guidelines for the fabrication of duplex
stainless steels. p.9. Citing internet source http://www.imoa.info/downloads/brochures_articles.php
(accessed 12 August 2011).
25 Kotecki, D,J,. 06 Welding, brazing, and soldering, Practice considerations for arc welding. Welding
of stainless steels ASM metals handbook collection P.1718.
26 Zbigniwe, S. and Dariusz, D., Sigma Phase Precipitation in Duplex Stainless Steel , 1st ed., Czesochowa University of Technology, Poland. 2004.
27 International Molybdenum Association. Practical Guidelines for the fabrication of duplex
stainless steels. p.10. Citing internet source
http://www.imoa.info/downloads/brochures_articles.php (accessed 12 August 2011).
28 Atlas steels Ferritic Stainless steels sheet, coil & plate, Citing internet source.
www.atlassteels.com.au, 2010 P.10 (accessed 1st August 2011).
29 Baddoo, N. R., Burgan, B. A., P291: Structural design of stainless steel. The steel construction institute 2001. P.6.
49
30 Noble, N,. 06 Welding, brazing, and soldering, Selection of wrought duplex stainless steels ASM
metals handbook collection P.1205.
31 Technical Note 16: Welding stainless steel. Welding and Technology Institute of Australia. 1985
p.11.
32 Technical Note 16 : Welding stainless steel. Welding and Technology Institute of Australia. (1985)
p.16.
33 ASTM G48-03 Standard Test Methods for Pitting and Crevice Corrosion Resistance of Stainless Steels and Related Alloys by Use of Ferric Chloride Solution. ASTM International, (2003). 34 Technical note 13: Stainless steels for corrosive environments. The Welding and Technology
Institute of Australia. 1998 p.15.
35 International Molybdenum Association. Practical Guidelines for the fabrication of duplex stainless steels. p.11. Citing internet source http://www.imoa.info/downloads/brochures_articles.php (accessed 12 August
2011).
36 International Molybdenum Association. Practical Guidelines for the fabrication of duplex stainless steels. p.12. Citing internet source http://www.imoa.info/downloads/brochures_articles.php (accessed 12 August
2011).
37 Sieurin, H. and Sandstrom, R, Sigma phase precipitation in duplex stainless steel 2205. Materials
Science and Engineering and Brinell Centre, Royal Institute of Technology (2007) p.271.
38 Zbigniwe, S. and Dariusz, D., Sigma Phase Precipitation in Duplex Stainless Steel, 1st ed., Czesochowa University of Technology, Institute of Materials Engineering. Poland. (2004) p.2.
39 Wong, K.W., Shek, C.H., Zhang, W., and Lai, J. K.L., σ phase dissolution in duplex stainless steel at
elevated temperature studied by thermal analysis. Materials letters 62 P.3991-3994. (2008).
40 Davison, R. M., Redmond, J. D., A guide to using duplex stainless steels. MATERIALS & DESIGN
Vol. 12 No. 4 AUGUST 1991.
41 Technical note 13: Stainless steels for corrosive environments. The Welding and Technology
Institute of Australia. 1998 p.6.
42 Van Nassau, I., Meelker, H., and Hilkes, J., Welding duplex and super-duplex stainless steels--a guide for industry. document 01463, Lincoln Norweld, July 1992. P.34.
43 International Molybdenum Association. Practical Guidelines for the fabrication of duplex stainless steels. p.12. Citing internet source http://www.imoa.info/downloads/brochures_articles.php (accessed 12 August
2011).
44 Burn, R. A., A critical review on the effect of intermetallic precipitates on the properties of Duplex
stainless steel. MSc Welding Engineering, Cranfield University 2009 P.47.
50
45 Geipl, H.,MAGM-Schweißen von korrosionsbest ndigen Duplex-st hlen 22Cr5(9)Ni3Mo. Einfluß
von Schutzgas- und Verfahrensvarianten. Lind - Sonderdruck Nr. 146 H llriegels-kreuth, 1989.
46 ASTM A 923-03 Standard test methods for detecting intermetallic phase in Duplex
Austenitic/Ferritic stainless steels. ASTM International 2004 p.1.
47 EN 1011-3:2000: Welding-Recommendations for welding of metallic materials - Part 3 Arc
welding of stainless steels. British Standards Institute. 2002 P.23.
48 Pettersson, C. O., Fager, S. A., Welding practice for the Sandvik duplex stainless steels SAF 2304,
SAF 2205 and SAF 2507. AB Sandvik Steel 1995 P.4.
49 Technical Note 16 : Welding stainless steel. Welding and Technology Institute of Australia. (1985)
p.16.
50 Pettersson, C. O., Fager, S. A., Welding practice for the Sandvik duplex stainless steels SAF 2304,
SAF 2205 and SAF 2507. AB Sandvik Steel 1995 P.4.
51 Lippold, J. C.,Kotecki, D.J., Welding metallurgy and weldability of stainless steels. John Wiley &
sons, New Jersey, 2005.
52 Mathers, G. Job knowledge 106 Duplex stainless steel - Part 2 (May 2010) Citing internet source.
http://www.twi.co.uk/services/technical-information/job-knowledge/job-knowledge-105-duplex-
stainless-steel-part-1-march-2010/?locale=en (accessed 13th April 2011).
53 ASTM A799/A799M - 10 Standard Practice for Steel Castings, Stainless, Instrument Calibration,
for Estimating Ferrite Content. ASTM International 1997 p.2.
54 ISO8249:2000(E) Welding -- Determination of Ferrite Number (FN) in austenitic and duplex
ferritic-austenitic Cr-Ni stainless steel weld metals. International Organization for Standardization
2000.


![Microstructure of laser metal deposited duplex stainless steel ......welding of duplex stainless steel grades [7, 8]. Therefore, the same phenomena are expected to occur when depositing](https://img.pdfslide.net/doc/110x75/60ad8418cfcf5514db0daf6a/microstructure-of-laser-metal-deposited-duplex-stainless-steel-welding-of.jpg)