Embed Size (px)
Citation preview

THE EFFECTS OF HIGHER-STAKES TEACHER EVALUATION ON OFFICE DISCIPLINARY REFERRALS
David D. Liebowitza
Lorna Porter
Dylan Bragg
University of Oregon
November 2019
ABSTRACT
Despite frequent political and policy debates, the effects of imposing accountability pressures on public school teachers are empirically indeterminate. In this paper, we study the effects of accountability in the context of teacher responses to student behavioral infractions in the aftermath of teacher evaluation reforms. We leverage cross-state variation in the timing of state policy implementation to estimate whether teachers change the rate at which they remove students from their classrooms. We find that higher-stakes teacher evaluation had no causal effect on the rates of disciplinary referrals, and we find no evidence of heterogeneous effects for grades subject to greater accountability pressures or in schools facing differing levels of disciplinary infractions. Our results are precisely estimated and robust to a battery of specification checks. Our findings provide insights on the effects of accountability policy on the black-box of classroom practice and highlight the loose-coupling of education policy and teacher behaviors.
Keywords: teacher evaluation, accountability, school discipline, difference-in-differences
JEL Classifications: I21, I24, I28
a We are grateful to the Education and Community Supports research unit at the University of Oregon for access to the School-Wide Information System data. We thank Kent McIntosh and Angus Kittelman for answering various data-related questions and providing substantive feedback. We thank Kaitlin Anderson, Chris Curran, Glen Waddell, participants at the Association of Public Policy and Management Fall Conference, the University of Oregon Applied Micro-Econometrics seminar, and the Education Policy Collaborative Annual Meeting for their feedback. All errors are our own. Correspondence regarding the paper can be sent to David Liebowitz at [email protected], Department of Educational Methodology, Policy and Leadership, 5267 University of Oregon, Eugene, OR 97403.

Evaluation and Discipline 1
1. Introduction
External accountability pressures and incentives are central tools policy makers possess to improve
teaching and learning conditions in schools. However, there is a complex relationship between
incentive- and accountability-based policies and local actor behavior, particularly in the public
sector (e.g., Dixit, 2002). A rich theoretical and empirical debate on the relative merits of
accountability-driven policies in education exists.1 In fact, much of the body of evidence on the
causal effects of accountability policies on school outcomes finds either mixed or no effects.2 Even
well-designed accountability and incentive policies can generate unintended responses, including
educational triage (Ladd & Lauen, 2010; Neal & Schanzenbach, 2010; Reback, 2008), curriculum
narrowing (Hamilton, Berends, & Stecher, 2005), and gaming (Figlio, 2006; Vogell, 2011). Thus,
system leaders have a critical interest in understanding whether and in what ways teachers and
principals respond to external accountability pressures.
In this paper, we study the effects of accountability pressures in the context of teacher
responses to student behavioral infractions in the aftermath of reforms that imposed higher stakes
on teacher evaluation at the beginning of the 2010s. The overwhelming majority of U.S. states
implemented higher-stakes teacher evaluation policies between 2011 and 2016 with the goal of
improving teachers’ performance through increased accountability and feedback. These policies
encourage evaluators to use observations of instruction and students’ performance on external
academic assessments to appraise teachers. In addition to providing incentives to improve
1 Compare, for instance, Dee & Wyckoff (2015), Chiang (2009), Hanushek (2009), Jackson, Rockoff & Staiger (2014) and Macartney, McMillan & Petronijevic (2018) with Figlio (2006), Ladd & Lauen (2010), Rothstein (2015) and Strunk, Barret & Lincove (2017). 2 See, among others, Brehm, Imberman & Lovenheim (2017), Chakrabarti (2014), Cullen, Koedel & Parsons (2019), Deming, Cohodes, Jennings, Jencks (2016), Eren (2019), Kraft, Brunner, Dougherty & Schwegman (2019), Macartney (2016), Özek (2012), Pope (2019), Reback, Rockoff & Schwartz (2014), Steinberg & Sartain (2015), and Stecher et al. (2018). Deming and Figlio (2016) and Liebowitz (2019) summarize this nuanced literature.

Evaluation and Discipline 2
instructional pedagogy, the introduction of high-stakes evaluation based on observations and test
scores increased pressures to create calm, orderly classroom learning environments. Unruly
classrooms are easily observable for teachers’ evaluators; more so than, for example, alignment of
instruction to grade-level standards. Further, to the extent that disruptive students create negative
externalities on other students’ learning (Carrell & Hoekstra, 2010), teachers can both increase their
expected observation score and improve their average student’s performance by reducing
incidences of active disruption in their classrooms. While one implicit goal of higher-stakes teacher
evaluation policy is, therefore, to encourage teachers to improve their classroom management
practices, teachers might also accomplish the goal of reducing disruptive behavior by imposing a
lower floor of tolerance for misbehavior before removing a student from class and sending her to
the office.3 Thus, by estimating the effect of these evaluation policies on the rates of Office
Disciplinary Referrals (ODRs), we investigate whether accountability pressures improve teacher
skill in managing classroom behavior or create distortionary incentives.
We leverage Kraft, Brunner, Dougherty and Schwegman’s (2019) tally of the introduction
of teacher evaluation policy reform in conjunction with disciplinary data from a large network of
over 2,500 schools implementing a common behavior management framework to fit a two-way,
fixed effect difference-in-differences model that estimates the impact of higher-stakes evaluation
on ODRs. Our first difference is the change in the rate of ODRs that may have been influenced by
the change in evaluation policy for schools in states that experienced the teacher evaluation policy
reform. Our second difference is the change in the rate of these ODRs for schools in states that had
not yet (or did not) experienced the change.
3 The typical mechanism by which teachers respond to student behavior that they have determined cannot be addressed in the classroom is to send students to a school administrator (principal, assistant principal, dean of students) in the school’s office. Other approaches include waiting to speak to an administrator in the hallway while accompanied by a staff member. For the purpose of this paper, we describe all such events as Office Disciplinary Referrals.

Evaluation and Discipline 3
To preview our results, our main findings are that high-stakes teacher evaluation has no
causal effect on the overall rate of classroom or subjective-classroom ODRs. We estimate these
null effects with precise zeros and can rule out effects larger than a decrease of 0.07 to 0.08 standard
deviations (SD) or an increase of 0.01 to 0.03 SDs for classroom and subjective-classroom referrals.
We find no evidence of a moderating effect when schools improve their implementation of a
widely-used behavioral improvement strategy known as Positive Behavioral Interventions and
Supports (PBIS). We find no evidence that the effects vary based on schools’ rates of referrals prior
to the start of higher-stakes evaluation. We also find no evidence of heterogeneous effects for
grades that are subject to more intense accountability pressures because students’ test scores in
these grades contribute to a school’s accountability status.
We subject our identification strategy and its assumptions to a host of robustness checks
and consistently find that high-stakes evaluation policies do not change disciplinary referral rates.
We conduct standard difference-in-difference assumption tests involving parallel trends, functional
form, balanced panels, differential timing and negative weighting. In an improvement over
standard approaches that struggle to capture endogenous differences across states, we have at our
disposal a set of more severe behavioral and non-classroom-based outcomes. Because these types
of infractions occur within the same contexts and presumably are not (or are less) influenced by
changes in teacher evaluation policy (i.e., students are no more/less likely to bring a knife to school
under pre- or post-treatment conditions and teachers are less likely to feel accountability pressures
for student behavior in the cafeteria), we argue that these outcomes capture any secular changes in
disciplinary climate or other policy reforms and should be unaffected by changes in teacher
evaluation policy. We directly test the effects of the implementation of teacher evaluation on these
unaffected outcomes, and we employ triple-difference estimates in which our third difference is
Evaluation and Discipline 4
the change in the rate of non-classroom and more severe behavioral referrals in an effort to purge
our main estimates of any secular trends or contemporaneous shocks. We also explicitly test
whether concurrent teacher accountability and discipline policy changes in the same time-span
predict changes in rates of disciplinary referrals or alter the predicted impact of teacher evaluation
reforms. We find no evidence that they do. In order to promote research transparency, we pre-
registered our quasi-experimental design in the Registry of Efficacy and Effectiveness Studies
(REES #1748) prior to receipt of our data.
Our findings contribute to new literatures estimating the causal effects of accountability
pressures on the black box of within-classroom behaviors by teachers and the effects of school
policies on disciplinary processes. While there is a growing consensus that teacher evaluation
policies increase voluntary exits, particularly among teachers rated poorly in observation- and
value-added-based evaluation schemes4 and some promising evidence that teacher observation
improves student outcomes,5 we know less about how high-stakes teacher evaluation policies
change what teachers do in the classroom. Our findings align with Phipps and Wiseman (2019)
who find no evidence that teachers shift their focus to a particular instructional domain as the
accountability pressure of an evaluator observation increases. Similarly, Garet et al. (2017) find no
evidence of changes in instructional practices in the aftermath of receiving performance feedback.
We study phenomena closely related to those described in Holbein and Ladd (2017). They
find that the frequency of serious student misbehaviors increased in schools that were barely
labeled as failing to make Adequate Yearly Progress under the No Child Left Behind Act. We study
accountability pressures that fall individually and exclusively on teachers. Additionally, we have
4 See Dee & Wyckoff (2015); Loeb, Miller & Wyckoff (2015); Cullen, Koedel & Parsons (2019). 5 See Taylor and Tyler (2012); Phipps (2018); and Burgess, Rawal and Taylor (2019). Note also Kraft, Blazar and Hogan’s (2018) meta-analysis of causal estimates of coaching interventions, which operate through some of the same mechanisms as evaluation.

Evaluation and Discipline 5
available multiple outcome measures that allow us to assess the likelihood that our results are
driven by changes in either student or educator behavior.
We also introduce a novel outcome to the causal literature that is rarely present in
administrative data but is a critical pre-cursor to exclusionary school discipline. Teachers’
classroom management practices and disciplinary responses are key mechanisms for student
engagement and are frequently students’ first points of entry into school disciplinary systems.
Growing evidence indicates that suspensions harm both near-term academic performance and the
future school attendance of suspended students (Anderson, 2019; Lacoe & Steinberg, 2018). This
is particularly salient given recent evidence on the causal effects of exclusionary discipline on
students’ future college enrollment and involvement in the criminal justice system (Bacher-Hicks,
Billings and Deming, 2019). However, while evidence indicates that zero tolerance policies
increase suspensions (Curran, 2016) and alternatives such as PBIS decrease them when
implemented well (Horner et al., 2009), the general equilibrium effects, including on non-
suspended students, of alternative policy approaches are indeterminate (Steinberg & Lacoe, 2018),
which may be a function of heterogeneous effects and uneven policy implementation (Skiba, 2015;
Welsh & Little, 2018). Our results suggest that teacher accountability policies, either on their own
or coupled with well-implemented systems to promote positive behavior, are not sufficient to limit
students’ entry into the disciplinary pipeline.
As a whole, we interpret our results as evidence that the introduction of high-stakes
accountability policies did not dramatically alter classroom disciplinary climates. Given the nature
of our data we are unable to examine the possibility that our results might be a product of
heterogeneous responses to increased accountability by teachers’ characteristics or skill.
Evaluation and Discipline 6
Nevertheless, we take our findings as suggestive of the loose coupling between education policy
and teaching practice.
We begin in Section 2 by providing an overview of teacher evaluation and student
discipline policies and processes. Then, in Section 3, we generate a simple theoretical model to
describe the factors that contribute to the generation of an ODR in order to motivate our analysis.
In Section 4, we describe our disciplinary and policy data. In Section 5, we present our empirical
estimation framework. In Section 6, we share our main results as well as evidence on the presence
of heterogeneous effects. In Section 7, we present a host of difference-in-differences assumption
and robustness checks. Finally, we conclude with a discussion of how our findings provide insight
into the complex relationship between accountability policy and teachers’ behaviors.
2. Teacher Evaluation and Student Discipline Policy
2.a Teacher Evaluation
In response to financial incentives from the Obama administration’s 2009 Race to the Top
competition, 44 states implemented new teacher evaluation policies between 2011 and 2016. In fact,
40 states enacted reforms of teacher evaluation between 2009 and 2011 (NCTQ, 2011, 2017),6 but
the exact timing of when these reforms came into effect spanned the subsequent six years. Our
identification strategy exploits this exogenous federal shock to state policy and the plausibly
random cross-state differences in the timing of the implementation of teacher evaluation reforms.
Generally, state legislation and regulation defined parameters for the evaluation process to which
local districts’ collective bargaining agreements were required to adhere. States frequently
6 Alaska, Kentucky and North Dakota passed new teacher evaluation laws in 2012; Texas did so in 2013.
Evaluation and Discipline 7
promulgated model evaluation policies that most districts adopted as written, although others
adopted them with modifications (NCTQ, 2017; Steinberg & Donaldson, 2016).
While the particulars of each state’s evaluation framework vary, as does district-level
policy implementation, this variation is largely endogenous. Thus, we focus on the common
accountability elements rather than on the intensity of accountability pressures across states and
districts. In almost all cases, teacher evaluation reforms entailed adopting a common rubric for
evaluating teachers’ performance with multiple rating categories. All state reforms to teacher
evaluation require that classroom observation of teaching practice be a part of a teacher’s final
rating, and in most cases these reforms establish a minimum frequency of classroom observations.
In addition, many states require some or all teachers to be evaluated based on student-learning
gains (either through formal measurements of students learning, through teachers’ contributions to
students’ progress towards locally determined learning objectives, or both). Some states
additionally include measures of whole-school performance or parent-, student-, and peer-surveys
of teacher competency. Some require annual evaluations for all teachers, while in other states
evaluation focuses primarily on new or probationary teachers. (Donaldson & Papay, 2015; Jacobs
& Doherty, 2015; Steinberg & Donaldson, 2016; Winters & Cowen, 2013).
While summative teacher ratings have varying consequences, the policy reforms represent
substantial increases in accountability pressures on teachers. Over three-fifths (61 percent) of states
instituted rules that led to the dismissal of teachers who were not rated Proficient, and almost half
(48 percent) of states use evaluation results for tenure decisions (Steinberg & Donaldson, 2016).
2.b Student Discipline
In the late 1980s and 1990s, states and districts increasingly adopted sets of policies
collectively known as “zero-tolerance discipline.” Many of these policies originated in response

Evaluation and Discipline 8
to the federal Gun-Free School Act of 1994, but soon extended beyond firearm offenses (Curran,
2016). Under such policies, students committing one among a set of pre-specified disciplinary
infractions were to be suspended or expelled from school, without discretion. In response to
widespread concern about the long-term effects of exclusionary discipline and the disproportionate
use of such disciplinary approaches for students of color, states and districts initiated reforms of
many zero-tolerance laws in the 2000s and 2010s (Rafa, 2019; U.S. Department of Education &
U.S. Department of Justice, 2014).
Some states have prohibited the use of suspension for less severe infractions (such as
defiance or truancy) or the length of suspensions overall, while others prohibit the use of
suspension in earlier grades except for extreme misbehavior (Steinberg & Lacoe, 2017; Anderson,
2019). Others require school districts to develop discipline plans that incorporate alternative
discipline programs, such as Positive Behavioral Intervention and Supports (PBIS), Multi-Tiered
Systems of Support (MTSS) and restorative justice practices (Rafa, 2019; Welsh & Little, 2018).
While discipline policy reforms have generally focused on suspension and expulsion, the
process by which students are removed from class for lower-level infractions is less frequently a
target of policy. To the student, Office Disciplinary Referrals (ODRs) are an entry point into the
disciplinary system. ODRs cause students to miss instructional time, may lead to additional
consequences ranging from lunch detention to suspension, and represent a signal to students about
how teachers perceive their behavior. However, they may provide students with opportunity to
reflect, develop relationships with school administrators, and improve their future behavior.
The consequences of ODRs extend beyond the referred student to classmates and
educators. ODRs have spillover effects as they influence the classroom composition during the
time the student is out of class. Further, the subjective, classroom-based ODR represents a teachers’
Evaluation and Discipline 9
interpretation of student behavior, and thus yields important signals about teachers’ tolerance for
student misbehavior and classroom management skills. Finally, ODRs impose significant time
burdens on educators who receive students removed from the classroom. While no precise
estimates of the amount of time that students spend outside of the classroom during each referral
exist, some states mandate that students not be sent back to class sooner than 30 minutes, within
the same class period, or before the principal has undertaken one of a set of prescribed disciplinary
measures (e.g., Louisiana Revised Statute §17.416 A.(1)(b)(iii)). For our purposes, the two essential
takeaways are: (1) state policy generally grants broad discretion to teachers to remove students
from the classroom; and (2) these removals have significant, though imperfectly understood,
implications for both students and educators.
3. Theoretical Predictions
We begin with a simple theoretical model to derive a test for the effects of teacher
accountability on instructional practice in the context of disciplinary referrals from the classroom
to a school administrator. The probability of an Office Disciplinary Referral (ODR) is a function
of the seriousness of the particular behavior (b), given a student’s characteristics (i) as well as her
past behavior in school (j), the school and system characteristics and policies (s), and teacher
characteristics and beliefs (t), such that: P(ODRbijst) = f(b, i, j, s, t).
Behaviors can be categorized into events that, for the purposes of student safety, require
students to leave the classroom (e.g., fights, weapons, smoking, etc.) and others in which the
decision to send the student from the classroom is more subjective in nature. We define this rough
dichotomization in our data more below, but generally P(ODRObjective) ≈ 1. P(ODRSubjective) is, all
else equal, strictly increasing asymptotically to 1 in the perceived severity of the infraction.
Evaluation and Discipline 10
Emerging evidence indicates that students’ race and family income, orthogonal to their behavior,
predicts the severity of disciplinary responses (e.g., Anderson & Ritter, 2017, 2018; Barrett,
McEachin, Mills, & Valant, 2019). Thus, we anticipate that 𝑃𝑃�𝑂𝑂𝑂𝑂𝑂𝑂𝐵𝐵𝐵𝐵𝐵𝐵𝐵𝐵𝐵𝐵,𝑃𝑃𝑃𝑃𝑃𝑃𝑃𝑃� ≥
𝑃𝑃�𝑂𝑂𝑂𝑂𝑂𝑂𝑊𝑊ℎ𝑖𝑖𝑖𝑖𝑖𝑖,𝑁𝑁𝑃𝑃𝑁𝑁−𝑝𝑝𝑃𝑃𝑃𝑃𝑃𝑃�. We anticipate that P(ODR) is generally declining as t skill increases, though
not necessarily monotonically, and that it depends on teacher beliefs about the value of ODRs.
For the purposes of our study, we seek to understand the values of the coefficients on the
accountability components of s. Teachers who observe a particular student misbehavior that
requires a subjective decision to determine whether to refer the student to the office make a choice
such that P(ODRSubjective | b,i,j,t) = EVALbijtβ1 + Sbijtβ2 +…Sbijtβn +Υ∙Zbijst+ εbijst. Given a particular
behavior, student and teacher interaction, the probability of an office referral depends on a vector
of school characteristics, policies and practices (S), which include teacher evaluation policy
(EVAL) alongside up to n other school characteristics. Zbijst describes a vector of interactions
between policy, practices and individuals. For example, schools that successfully implement a
system of behavioral supports should have, on average, fewer ODRs, 𝑃𝑃�𝑂𝑂𝑂𝑂𝑂𝑂𝑏𝑏𝑖𝑖𝑏𝑏𝑏𝑏𝑖𝑖|𝑃𝑃𝑃𝑃𝑃𝑃𝑃𝑃 = 0� ≥
𝑃𝑃�𝑂𝑂𝑂𝑂𝑂𝑂𝑏𝑏𝑖𝑖𝑏𝑏𝑏𝑏𝑖𝑖|𝑃𝑃𝑃𝑃𝑃𝑃𝑃𝑃 = 1�, but the effects of these policies may depend on the beliefs and preferences
of the teacher.
Our analytic challenge is to estimate the parameter on accountability policies holding all
else equal. Ex ante, it is not obvious what the effects of greater accountability pressures might be
on the rate of ODRs. On one hand, it is possible that greater accountability pressures may lead to
an increase in the rate at which teachers send students out of class. In particular, if classroom
observations are key contributors to teacher evaluation scores under high stakes evaluation
systems, teachers may be more likely to send students out of class for lesser infractions than under
low-stakes evaluation conditions in the hopes that fewer disruptions occur during a supervisor’s

Evaluation and Discipline 11
unanticipated visit. Further, if teacher evaluation scores are tied to assessment performance,
teachers may utilize the ODR more frequently to send students out of class if they perceive doing
so will result in a more effective learning environment for the majority of students.
On the other hand, it is possible that greater accountability pressures might lead to a
decrease in the rate of ODRs. A decrease in referrals may be evidence of improved teacher skills
resulting from high-stakes teacher evaluation policies. An alternative explanation for how the
introduction of high-stakes evaluation policies might decrease ODRs is that evaluators only
weakly observe and monitor teachers’ behavior management skills. Given principals’ difficulty in
finding time to observe teaching practice (Kraft & Gilmour, 2016), they may use the frequency of
teachers’ referral of students to the office as a proxy for their skill in classroom management. This
would create an incentive for teachers to reduce the frequency of ODRs in the aftermath of high-
stakes evaluation reform but not be desirable from the policy maker’s standpoint. Thus, positively
signed coefficients would provide relatively straightforward interpretations of the effects of
increased accountability on teachers’ practice, while negatively signed ones would be ambiguous.
4. Data
4.a Discipline data
School-Wide Information System (SWIS) data
The primary data source for our analytic strategy is the School-Wide Information System
(SWIS) data system. This data system is used by schools that track behavioral data associated with
the implementation of Positive Behavioral Implementation and Supports and maintained by the
Education and Community Supports research and outreach unit at the University of Oregon. We

Evaluation and Discipline 12
present in the main text of the paper a brief description of this data and our sample construction
and share complete information in Appendix B.
Our analytic sample focuses on U.S. traditional public schools subject to state evaluation
policies, for which we have outcome measures both before and after policy implementation. We
restrict our sample to grade-year observations nested in schools which we observe at least four
years before the adoption of high-stakes teacher evaluation and one year after the initial
implementation year. We form our measures of Office Disciplinary Referrals from counts of
referrals at the grade-school-year level. Thus, our main analytic sample includes 107,458 grade-
school-year observations, nested in 20,135 school-year observations. These represent a total of
2,564 schools in 939 districts. These data also include enrollment information that combine the
best available information from schools’ self-reports and their October 1 administrative count from
the NCES Common Core Data.
In Table 1, we present summary statistics for the full sample, for schools and students
located in states that never implemented high-stakes evaluation, and for schools and students in
states that did. Our sample is clearly not random. Schools that attempt to implement PBIS, have a
standardized office referral process, use the SWIS data management system, and agree that their
behavioral data can be used for research purposes are different from the full population of U.S.
schools. Thus, our results should be interpreted as generalizable only to schools with these
characteristics. However, our sample represents a vast number of schools across nearly all U.S.
states. Further, as we highlight in Table 1, the demographic characteristics of our sample broadly
match national racial and family income enrollment patterns; none differ by more than 4
percentage points. Our sample does over-represent urban and town-based schools by around 5
percentage points each and under-represent rural schools by around 9 percentage points.

Evaluation and Discipline 13
The average school in our sample enrolls 510 students. For ease of interpretation, we scale
our outcomes to be the rate of referrals per-500 students, per-day. In our full sample, the average
per-day number of referrals from classroom settings is 2.03 per 500 students and the average per-
day number of referrals from all other settings is 1.56 referrals per 500 students. This implies that
the average number of referrals across a 180-day school year for an average-sized school is around
650. Assuming each student spends 30 minutes out of class for each referral, this would suggest a
total of 325 hours of lost instructional time each year and a considerable administrative staffing
burden.7 There is considerable cross-school variability in the rate of referrals. The full-sample
standard deviation for classroom-based referrals is 2.83 (1.77 for non-classroom referrals). In many
schools, students miss substantial portions of the school year due to disciplinary events. The
average per-day number of referrals from classroom settings that are for one of six behaviors
defined by an expert panel (Greflund, McIntosh, Mercer, & May, 2014) as “subjective” in nature
was 1.29 referrals per 500 students. The average per-day number of referrals from classrooms that
fall into one of fourteen behaviors defined as “objective” was 0.48 per 500 students. 61.5 percent
of our grade-school-year observations are located in schools that conducted assessments of their
implementation of PBIS practices.8 In 71 percent of our school-year observations, schools were
assessed to be successfully implementing PBIS.
Civil Rights Data Collection (CRDC) suspension data
We supplement our main estimates with placebo tests using suspension data from the
restricted-use Civil Rights Data Collection (CRDC). We draw on five waves of data, from the
7 While this number is a rough approximation given the lack of precise estimates, we believe it is a conservative one. Students are typically required to complete a reflection form and conference with a school administrator before returning to class. Students unprepared to return to class remain with the administrator for longer periods. If one administrator were responsible for all referrals in a 500 student school (a reality in many contexts), this would mean that 22.5 percent of her 8-hour work days over 180 school days would be devoted to these referrals. 8 McIntosh et al. (2013) and Mercer, McIntosh & Hoselton (2017) detail the validation of these instruments.

Evaluation and Discipline 14
2005-2006 school year to the most recently-collected 2015-2016 school year that count the number
of students suspended in a given year. In the sample of 284,460 school-year observations in the
CRDC, the average school suspends 6 percent of its students per year (SD = 0.09).
4.b Teacher evaluation and discipline policy data
High-stakes evaluation reforms
Kraft et al. (2019) extend prior reviews by Steinberg and Donaldson (2016) and the National
Council on Teacher Quality (2016) and codify the timing of evaluation reforms in 44 states.
Following Kraft and co-authors, we code Implement Evaluation as one in the first fall in which a
new statewide evaluation policy is implemented. In Figure 1, we map the differential timing, by
state, of the implementation of higher-stakes evaluation policies as well as the six states that never
enacted new policies.9 The majority of schools in our sample experience high stakes evaluation,
though the overrepresentation of California schools in our data means that while 44 of 50 states
experienced high-stakes teacher evaluation policies, only 72 percent of schools in our sample end
up operating under a higher-stakes evaluation framework.
In Figure 2, we plot the raw outcome data for schools in states that experienced high-stakes
evaluation reform for the years before and after policy implementation. In Panel A, we present
trends for ODRs that originate in the classroom, our first outcome of interest. We observe no
evident discontinuity coinciding with the enactment of increased accountability measures for
teachers or any change in the slope of these raw averages. We observe the same patterns in Panel
B of Figure 2 which displays classroom-originating referrals for infractions that are subjective in
nature, our second outcome of interest. Thus, the descriptive evidence suggests that there may be
limited effects of the implementation of higher-stakes evaluation on teachers’ disciplinary
9 Appendix Table A1 provides state-by-state policy implementation details and counts of schools by state.

Evaluation and Discipline 15
decisions; however, secular patterns may mask an underlying causal relationship. This motivates
our identification strategy which we discuss in more detail below. One tool at our disposal are two
alternate outcomes that we would not anticipate would be affected by policy implementation: non-
classroom referrals and classroom-based referrals for objectively inappropriate behaviors. Figure
2 provides suggestive evidence that the trends in these placebo outcomes are unresponsive to
policy implementation, and we test this formally below.
Discipline policy reforms
To address concerns that shifts in ODR activity reflects reform in school discipline policy,
we collect data on two categories of disciplinary policy reforms and test whether our results are
robust to these policies. We compile information from the Compendium of School Discipline Laws
and Regulations (Bezinque, Garcia, Darling, & Stuart-Cassel, 2018) on whether any state-level
policies related to Teacher authority to remove students from the classroom and Limitations,
conditions, or exclusions for use of suspension and expulsion were enacted between 2006 and 2018.
Eight states and the District of Columbia revised statutes or regulations related to teachers’
authority to remove students from the classroom and 22 states and DC changed policies that limited
suspensions or expulsions for particular offenses or groups of students.
5. Empirical Strategy
Our identification strategy relies on the differential timing across states in the
implementation of teacher evaluation reforms. State legislatures enacted policy reforms in
response to an exogenous federal shock, but the date of statewide adoption of the new evaluation
systems varied as a function of the legislative bargaining process, the expiry of current collective
bargaining agreements and other elements of the political process that we argue are near-random.

Evaluation and Discipline 16
We begin by estimating a non-parametric event study. This approach allows us to flexibly
estimate any pre-policy trends or time-varying treatment effects. We fit the following model:
𝑂𝑂𝑂𝑂𝑂𝑂𝑔𝑔𝑏𝑏𝑏𝑏𝑖𝑖 = ∑ 1(𝑡𝑡 = 𝑡𝑡𝑏𝑏∗ + 𝑟𝑟)𝛽𝛽𝑃𝑃3+𝑃𝑃=−6 + �𝐗𝐗𝐣𝐣𝐣𝐣�𝜃𝜃 + Δ𝑔𝑔 + Γ𝑏𝑏 + Π𝑖𝑖 + 𝜀𝜀𝑏𝑏 (1)
In simplified form, this represents the per-500-student per-day rate of Office Disciplinary Referrals
(ODRgjst) for each grade-year observation in grade g, school j, state s and time t, regressed on a
series of indicators that take the value of 1 when the grade-year observation is a given number of
years pre- and post-policy reform, with 𝑡𝑡𝑏𝑏∗ indicating the year in which state s implemented the
higher-stakes teacher evaluation reform. This model includes grade- (delta), school- (gamma) and
year- (pi) fixed effects and a vector (X) of school-level (j) background characteristics. We include
a parsimonious set of plausibly exogenous school characteristic adjustments to capture school-
specific characteristics and improve the precision of our estimates. As policy affects every school
in a state, we do not anticipate that evaluation reforms would alter the demographic composition
of a school.10 We include the following demographic characteristics measured at the school level:
percent of students receiving free/reduced lunch, percent of students of various racial/ethnic
backgrounds, and school enrollment. We cluster standard errors at the state level, given this is the
level of the policy intervention that we study, and our errors are correlated across time within state
(Abadie, Athey, Imbens, & Wooldridge, 2017; Bertrand, Duflo, & Mullainathan, 2004).
The coefficients of interest are the seven βr (-5 ≤ r ≤ 1) which represent the effect of
evaluation reforms on rates of ODRs r years before and after the policy introduction.11 We measure
10 In fact, we regress the seven school demographic characteristics on our evaluation indicator and reject the null in only one instance. Evaluation implementation predicts a small decrease in the FRPL composition of a school (Beta: 1.25 p.p., SE: 0.52). Given the multiple hypotheses we test and the small magnitude of the coefficient, we take these results as consistent with our claim that school demographic characteristics are exogenous to policy implementation, though we present estimates without these adjustments in all cases to address this concern. 11 In our event-study results, we estimate coefficients for all available data (including binned categories for years 6+ pre-, 2 years post, and 3+ years post evaluation) but only interpret years -5 through 1 to ensure that we only compare units that are observable for all treatment timing years.

Evaluation and Discipline 17
all effects compared to the year prior to the reform (r= -1), and we assign all non-treated schools
to the same pre-policy year (r= -1).
Next, we extend Equation 1 into the pre/post difference-in-differences framework where
we pool estimates across years to increase precision and test the global effects of the policy:
𝑂𝑂𝑂𝑂𝑂𝑂𝑔𝑔𝑏𝑏𝑏𝑏𝑖𝑖 = 𝛽𝛽1𝐸𝐸𝐸𝐸𝐸𝐸𝐸𝐸𝑏𝑏𝑖𝑖 + �X𝒋𝒋𝒋𝒋�𝜃𝜃 + Δ𝑔𝑔 + Γ𝑏𝑏 + Π𝑖𝑖 + 𝜇𝜇𝑏𝑏 (2)
The indicator EVALst takes the value of 1 if the school is in a state that is in a year with a high-
stakes evaluation system. β1 is the causal parameter of interest. All other terms are defined as above.
We also relax the assumption of the standard difference-in-differences model of time-
invariant treatment effects in Equation (2) by adding a linear time trend:12
𝑂𝑂𝑂𝑂𝑂𝑂𝑔𝑔𝑏𝑏𝑏𝑏𝑖𝑖 = 𝛽𝛽1𝐸𝐸𝐸𝐸𝐸𝐸𝐸𝐸𝑏𝑏𝑖𝑖 + 𝛽𝛽2𝐸𝐸𝐸𝐸𝐸𝐸𝐸𝐸𝐸𝐸𝐸𝐸𝐸𝐸𝐸𝐸𝑂𝑂𝑏𝑏𝑖𝑖 + 𝛽𝛽3𝐸𝐸𝐸𝐸𝐸𝐸𝑂𝑂𝑏𝑏𝑖𝑖 + �𝐗𝐗𝐣𝐣𝐣𝐣�𝜃𝜃 + Δ𝑔𝑔 + Γ𝑏𝑏 + Π𝑖𝑖 + 𝜈𝜈𝑏𝑏 (3)
where YEARst is a linear time trend for state s, centered around the year the state implemented the
high-stakes teacher evaluation policy. The interaction term EVALxYEARst allows for the relative
time trends among schools in treated states to differ post-reform. The coefficient on the main effect
of treatment (β1) identifies the immediate response of the introduction of high-stakes evaluation of
ODRs and the coefficient on the interaction term (β2) captures linear deviations from the average
effect. The time-trend coefficient (β3) tests for any differential trends in the pre-reform period
among states that did and did not introduce high-stakes evaluation systems.13
12 Some analysts refer to Equation (3) as a Comparative Interrupted Time Series (C-ITS) 13 We may be concerned that the estimates from Equations (2) and (3) will be biased as a result of unobserved state-level factors that, contemporaneous with the introduction of high-stakes teacher evaluation, also affect ODRs. Triple difference (DDD) estimates that leverage alternative, potentially unaffected, outcomes help us address these sources of bias. We model these as follows: 𝑂𝑂𝑂𝑂𝑂𝑂𝑔𝑔𝑏𝑏𝑏𝑏𝑖𝑖 = 𝛽𝛽1𝐸𝐸𝐸𝐸𝐸𝐸𝐸𝐸𝐸𝐸𝐸𝐸𝐸𝐸𝐸𝐸𝐸𝐸𝐸𝐸𝐸𝐸𝑏𝑏𝑖𝑖 + 𝛽𝛽2𝐸𝐸𝐸𝐸𝐸𝐸𝐸𝐸𝑏𝑏𝑖𝑖 + 𝛽𝛽3𝐸𝐸𝐸𝐸𝐸𝐸𝐸𝐸𝐸𝐸𝐸𝐸𝑏𝑏𝑖𝑖 + �𝐸𝐸𝐸𝐸𝐸𝐸𝐸𝐸𝐸𝐸𝐸𝐸𝑏𝑏𝑖𝑖 ∙ Γ𝑏𝑏�𝜙𝜙 + (𝐸𝐸𝐸𝐸𝐸𝐸𝐸𝐸𝐸𝐸𝐸𝐸𝑏𝑏𝑖𝑖 ∙ Π𝑖𝑖)𝛿𝛿 + �𝐗𝐗𝐣𝐣𝐣𝐣�𝜃𝜃 +Δ𝑔𝑔 + Γ𝑏𝑏 + Π𝑖𝑖 + 𝜐𝜐𝑏𝑏. AFFECTst is an indicator variable that takes the value of one if the observation is one in which we would anticipate the introduction of high-stakes evaluation policies will affect the rate of ODRs or affect the rate more intensively. We contrast locations in which ODRs occur, specifically comparing classroom-originating ODRs, which we anticipate would be influenced by changes in the teacher evaluation policies, and non-classroom-originating ODRs, which we anticipate would not be affected by the policy changes. Alternatively, we contrast the type of infraction (subjective or objective) resulting in the ODR. β1 represents the effect of the introduction of the high-stakes evaluation policy on anticipated affected outcomes, compared to unaffected outcomes in states that had not yet or never adopted

Evaluation and Discipline 18
To better understand the effects of accountability pressures, we examine differences between
grade levels under greater and lesser accountability and differences across schools with varying
rates of referrals prior to the higher-stakes evaluation era. Specifically, we hypothesize that grades
3-11 will be subject to greater levels of accountability as these are years in which high-stakes testing
occurs in schools. We theorize that non-classroom and objective ODRs, as well as ODRs from
grades K-2 and 12, will be less sensitive to the introduction of high-stakes teacher evaluation. We
note here the pre-registration (Registry of Efficacy and Effectiveness Studies in Education 1748.2)
of our analytic plan in which we propose to explore the higher accountability applied to grades 3-
11.14 Additionally, we explore whether teachers respond differently to increased accountability
when the starting behavioral climate in their school differs by interacting ODR-rates in the year
prior to the implementation of evaluation policies with our policy indicator.
We also examine the extent to which the implementation of effective disciplinary support
strategies serves to moderate the effects of greater accountability. Specifically, what are the effects
on ODRs when schools develop better systems of behavioral supports in the context of higher-
stakes evaluation? The fixed-effects structure of our analysis means that our estimates are of the
effect of within-school improvements in the implementation of PBIS and the interaction of these
improvements with the introduction of high-stakes evaluation. However, we note explicitly the
exploratory nature of this analysis as the successful implementation of PBIS is clearly an
endogenous characteristic of the school.
the evaluation policy. We adjust for unexplained within-school and within-year heterogeneity in affected outcomes by interacting our AFFECT indicator with year- and school-indicators. As we show below, we find null effects for all of our double difference models, and so we do not feature our triple difference framework prominently. We do present these results in Tables A12 and A13 and, as expected, they also return precise zeros. 14 While all schools in states in our sample require high-stakes assessments in grades 3-8, high-school assessment requirements vary. All states require students to test at some point in grades 9-11. Some states require testing only in one of these grades, other states require testing across multiple years, still others allow student discretion on the grade in which students take tests. Our estimates are even closer to zero when we restrict our definition of higher-accountability grades to 3-8 (class: -0.026 (0.067); subjective-class: -0.022 (0.067)).

Evaluation and Discipline 19
For the coefficient β1 to be an unbiased estimand, we make three assumptions about our
estimates: (1) schools and grades in untreated states (and not-yet-treated states) provide a valid
counterfactual for schools and grades in treated states; (2) there are no unobserved simultaneous
shocks correlated with our outcomes and the introduction of higher-stakes teacher evaluation
reforms; and (3) the estimands for each grade and year are appropriately pooled to create the full
sample Average Treatment Effect (ATE). We test our first assumption by examining pre-trends in
our non-parametric event study specifications and then formally test for the existence of linear
trends in our DD estimates. We also restrict our sample to only those observations in states that
enacted teacher evaluation, so that our estimates rely only on plausibly random timing variations.
We address secular trends in school discipline activity through year fixed effects and, in some
specifications, time trends. However, if other policy reforms are contemporaneous with evaluation
policy reforms, our results would be biased. Thus, we test our second assumption with a series of
robustness checks in a set of placebo models in which we estimate the effects of teacher evaluation
on disciplinary events from outside the classroom or that are in response to behavioral events so
severe that we do not anticipate they would be affected by evaluation policy reform alone. Other
placebo tests explore the effects of evaluation reform on grade levels (K-2 and 12) which we argue
would be less subject to accountability pressures. In addition to using placebo outcomes, we also
create fictional dates for evaluation policy implementation that precede the actual years of adoption
and test whether these false evaluation years predict changes in referral rates. As a final test of the
second assumption, we fit a series of models in which we include other teacher accountability and
discipline policy reforms to assess whether they predict changes in ODR rates or moderate the
main effect of teacher accountability pressures.15
15 Kraft et al. (2019) seek to rule out threats to their identification strategy from contemporaneous teacher and accountability policy reforms, such as the implementation of Common Core Standards or licensure tests. These are
Evaluation and Discipline 20
There has been a recent explosion in the econometric literature documenting frequent failures
of the third assumption, particularly in the context of differential timing as an identification
strategy.16 We test our fixed effects for the presence of time-varying weights and negative
weighting, and we replicate our standard two-way fixed effect models using de Chaisemartin and
D’Haultfoeuille’s (2019) time-corrected Wald (Wald-TC) estimand.
We present information in Table 1 on the differences in schools and students which did and did
not experience high-stakes evaluation. The most notable difference is the larger school size for
schools that ever experienced high-stakes evaluation. While there are some baseline differences in
the characteristics of schools and students in states that did and did not experience high-stakes
evaluation, we account for this in our difference-in-differences estimation framework. As we
compare the difference in values before and after the policy change with differences in values over
the same time period in locales that did not or had not yet experienced the policy change, starting
differences between treated and untreated locales does not threaten the validity of our design.
Nevertheless, for external validity purposes, it is reassuring that the outcome values prior to the
start of the era of evaluation reform are quite close in schools located in states that did and did not
experience high-stakes teacher evaluation, all within 0.2 referrals per-500 students per day.
less relevant to our identification strategy as we are ultimately interested in whether and how increased accountability shifts teachers’ classroom practices. Our results are robust to the inclusion of policy indicators for the reform of tenure laws and weakening of collective bargaining (see Appendix Tables A14 and A15). To the extent that our estimates of teacher evaluation reforms are influenced by other accountability-related policy reforms, this would imply that our results are evidence of overall accountability pressures on teacher practice, rather than specific to teacher evaluation. 16 A non-exhaustive list includes: Athey & Imbens (2018); Borusyak & Jaravel (2017); de Chaisemartin & D’Haultfoueille (2019); Ferman & Pinto (2019); Gibbons, Serrato & Urbancic (2018); Imai & Kim (2019); and Goodman-Bacon (2018).
Evaluation and Discipline 21
6. Results
6.a Event-study estimates
We find no evidence that rates of Office Disciplinary Referrals (ODRs) changed in the
aftermath of the introduction of higher-stakes teacher evaluation policies. In Figure 3, we present
results from Equation 1 for both referrals originating in the classroom (Panel A) and referrals
originating in the classroom that are subjective in nature (Panel B). While there is some visual
evidence that ODRs decline somewhat after the introduction of high-stakes evaluation policies, all
estimates fall within the 95 percent confidence interval and are small in magnitude.
Independently, the results in Figure 3 provide little evidence that there were trends in the
rate of classroom-based or subjective referrals prior to the implementation of teacher evaluation
policies. This suggests the first assumption required of our DD estimates holds and we have no
need to instrument with leads in our event study (Freyaldenhoven, Hansen, & Shapiro, 2019).
6.b Difference-in-differences estimates
Results from our main difference-in-differences estimates confirm that we find no causal
effect of the implementation of high-stakes evaluation on rates of classroom- or classroom-
subjective ODRs. In Table 2, we present the results of Equations (2) and (3). While our estimates
are consistently signed and of nearly identical magnitude, in all cases we fail to reject the null. We
estimate these effects with precise zeros. In our preferred estimates (Models II and V), we can
confidently rule out ranges of effects greater than a decrease of 0.21 referrals or an increase of 0.04
referrals per-500 students, per day for classroom referrals and a decrease of 0.14 or an increase of
0.06 referrals per-500 students, per day for subjective-classroom referrals. These confidence
intervals correspond to a 0.08 standard deviations (SD) decrease and a 0.01 SDs increase or a 0.07

Evaluation and Discipline 22
SDs decrease and a 0.03 SDs increase for classroom and subjective referrals, respectively.17 In
addition to ruling out ODR rate shocks of all but the smallest substantive magnitudes, we find no
evidence of differential post-evaluation policy implementation trends in Models III or VI.
6.c Heterogeneity of effects
Strong systems of behavioral supports
We find no evidence that improvements in schools’ implementation of Positive Behavioral
Interventions and Supports (PBIS) practices serves to moderate the effects of accountability. We
present results in Table 3 of a series of estimates in the subset of grade-school-year observations
for which we have measures of PBIS implementation. As such measures are available in only 61.5
percent of our grade-school-year observations, in Models I and V we first re-estimate the results
from Table 2 and examine the main effect of evaluation implementation in this sub-sample of
observations. For these schools, the effects are even closer to zero. We then introduce the time-
varying effect of PBIS implementation and its interaction with teacher evaluation.18 In our
preferred specifications (Models III and VII), we can confidently rule out ranges of moderating
effects greater than a decrease of 0.16 referrals or an increase of 0.23 referrals per-500 students, per
day for classroom referrals and a decrease of 0.10 or an increase of 0.14 referrals per-500 students,
per day for subjective-classroom referrals. These correspond to 95 percent confidence intervals of
-0.06 SDs to +0.08 SDs for classroom referrals and -0.05 SDs to +0.07 SDs for subjective
referrals.19 We observe no post-evaluation implementation time trends.
17 We scale the precision of these null effects to the standard deviation of our outcomes across the full analytic sample. When we scale our outcome to the within-school standard deviation of our outcomes, our 95 percent confidence intervals are -0.13 to +0.02 SD and -0.12 to +0.05 SD units for the main effects of evaluation on classroom and subjective referrals, respectively. 18 The sign of the main effect of PBIS implementation is negative, consistent with our theoretical predictions, though relatively small in magnitude and imprecisely estimated. 19 When we scale our outcome to the within-school standard deviation, the 95 percent confidence interval on the moderating effects of PBIS are -0.09 to +0.14 and -0.08 to +0.11 SD units for classroom and subjective referrals.

Evaluation and Discipline 23
Pre-policy referral rates
We do not find any evidence of heterogeneity of effects by the rates of disciplinary referrals
in the year prior to evaluation policy implementation. In Table 4, we present results in Models 1
and IV in which we re-estimate our primary models on the sub-sample of grade-school-year
observations in states that ever experienced evaluation and that are not observed in the year
immediately prior to policy implementation (t=-1). We exclude this year so as not interact our
policy predictor with a value that is on both the left- and right-hand sides of our equations. These
results are consistent with our main estimates. In Models II-III and VI-VII, both the main effect of
evaluation implementation and its interaction with the pre-policy rate of referral are
indistinguishable from zero.20
Intensity of accountability pressures
We find no evidence of heterogeneous effects for grades that should be subject to more
intensive accountability pressures. In Table 5, we present results in which we restrict our grade-
school-year observations to those that represent grades 3 through 11. We again fail to reject the null
hypothesis and can confidently rule out small effects, both using effect size metrics and substantive
interpretations. We present the corresponding event study estimates for high-accountability grades
in Appendix Figure A2 and Table A3. We present analogous results for the moderating effects of
successful PBIS implementation in higher-accountability grades (3-11) in Appendix Table A4.
20 We similarly find no effects on quadratic terms for pre-policy referral rates (class: -0.000 (0.004); subjective: -0.000 (0.006)) and in models where we average referral rates from the two years prior to policy implementation and then leave these two years out (class: -0.011 (0.044); subjective: 0.019 (0.038)).

Evaluation and Discipline 24
7. Assumption Checks and Sensitivity Analyses
The three central assumptions of our identification strategy hold across multiple tests. Given
the extensive robustness checks we conduct, for the purpose of parsimony we display the relevant
results from these checks in Figures 4 and 5 in the main text of the paper and display the full set
of coefficients and statistics in Appendix A.
7.a Pre-trends
Our formal tests of the parallel trends assumption reinforce the graphical evidence from
Figures 2 and 3 that schools in states that did not implement higher-stakes evaluation (or had not
yet) provide valid counterfactuals. We present results of our tests of parallel pre-trends in Panel A
of Figures 4 and 5 (corresponding to Appendix Tables A5 and A6). If the assumption holds, these
coefficients should be indistinguishable from zero, which in all cases is true. Note that the pre-
trend coefficients without covariate adjustments are also indistinguishable from zero (Estimates
A1 and A4). As the unconditional parallel trends assumption is met, our models are robust to
concerns raised by Sant’Anna and Zhao (Sant’Anna & Zhao, 2019) about inaccurate treatment
effect estimates in the presence of heterogeneous treatment effects and covariate-specific time
trends. Estimates A3i and A6i present coefficients on quadratic time trends and are also
indistinguishable from zero.
7.b Placebo tests
We find no evidence that the introduction of high-stakes evaluation affects outcomes that
we do not anticipate these reforms would influence. Further, when we adjust the date of policy
implementation to create falsification tests, we find no evidence that these artificial policy
implementation dates influenced referral rates. We present these results in Panel B of Figures 4
and 5 (corresponding to Appendix Tables A7 – A10). Estimates of the effect of evaluation policy
Evaluation and Discipline 25
on unaffected outcomes should be indistinguishable from zero. Similarly, estimates of the effect
of placebo evaluation dates in years before the policy was actually implemented should also be
zero (or at least substantially attenuated in pooled pre- and post- tests).
We present Estimates B1 – B6 in Figure 4 as evidence that evaluation policy
implementation had no effect on ODRs from locations other than the classroom and on ODRs for
behavioral infractions that were objectively reasons to send students to the office. In estimates B7
– B10 we demonstrate that using a date of evaluation implementation two or four years21 before
the actual implementation date is not predictive of changes in ODR rates.
In Estimates B1 – B6 in Figure 5, we present the corresponding placebo outcome tests in
our analysis of potential heterogeneous effects in higher-accountability grades. Here, we use both
our main outcomes (classroom and objective ODRs) in the theoretically “unaffected” grades (K-
2, 12) as well as the secondary outcomes (other location and subjective ODRs) in the theoretically
“affected” grades (3-11). In Estimates B7 – B10, we present analogous falsification tests where we
use a date two or four years prior to the actual policy implementation and examine the effects on
just the high-accountability grades. Again, all estimates are indistinguishable from zero.
In Estimates B11 – B13 of Figure 4, we present results in which we test the effect of
evaluation policy implementation on rates of suspension from the Civil Rights Data Collection
(CRDC) sample. In this national sample of schools, we note that the introduction of evaluation
policies resulted in a one-percentage-point increase in the proportion of suspended students. This
outcome is scaled differently than our main outcome, nevertheless it is small in absolute magnitude
and not fully robust to alternate specifications (see Appendix Table A8). Thus, we interpret the
21 The four-year placebo test is the largest for which we are able to observe all schools pre-treatment.

Evaluation and Discipline 26
CRDC findings as indicative of some potential for endogenous shifts in state discipline policy but
generally in line with our other falsification tests.
7.c Alternate sample, policy, specification and weighting approaches
In our last set of robustness checks, we present further evidence that the schools in
untreated states provide valid counterfactuals, that our results are not driven by concurrent policies,
and that our results are robust to the method of weighting individual fixed effects ATEs into a
pooled estimate. In Panel C of Figures 4 and 5 (corresponding to Appendix Tables A11 – A17), we
present these results. In addition to the zero line, we also include for reference the point estimates
from our preferred models (Models II and V in Tables 2 and 5). Results of these robustness checks
should overlap with the main results. Given that our main models find that teacher evaluation
policy reform does not change the rate of ODRs, they should also overlap with zero.
We first test the robustness of our results to a slight expansion of our main analytic sample.
Our primary sample is comprised of 107,458 grade-school-year observations that represent 20,135
school-year observations. However, our data includes outcomes reported only at the school level
for an additional 384 school-year observations. We present results from re-estimating Equations
(2) and (3) using data aggregated at the school level in Estimates C1 – C4 in Figure 4. The estimates
are essentially identical to our grade-level models.
We estimate our primary models using Weighted Least Squares in which we weight each
observation by the grade-level enrollment. OLS estimates will return a heteroskedastic error term
because estimates of ODRs will be known with more precision in grades (and schools and states)
with a larger enrollment. Weighting our observations allows us to interpret our estimates as the
effect of teacher evaluation on the rate of ODRs in the average-sized grade. In Estimates C5 and
Evaluation and Discipline 27
C6 in Figure 4 and C1 and C4 of Figure 5, we present results from unweighted OLS models and
again fail to reject the null with respect to the main results or zero.
We find no evidence that our results are driven by endogenous differences between schools
in states that do and do not adopt high-stakes evaluation. Miller, Shenhav and Grosz (2019) recently
added to the literature finding that fixed-effects models which rely on selection into identification
often return biased results due to endogenous differences in those units which select the treatment.
Thus, in Estimates C7 and C9 of Figure 4 and C2 and C5 of Figure 5 we present results in which
we restrict our sample to only those grade-year observations nested in states which ever
implemented evaluation. These results, therefore, identify causal effects only off of differential
timing of when, and not whether, states enacted evaluation policy. We again fail to reject the null.
We may also be concerned that our difference-in-difference results are driven by events
substantially removed from policy enactment, particularly when we observe these time periods for
only some units. Given the start and end periods of our data, the maximal years pre- and post-
teacher evaluation reform that we can see for all observations is 5 years pre- and 1 year after the
initial policy implementation. In Estimates C8 and C10 of Figure 4 and C3 and C6 of Figure 5, we
restrict our sample to grade-year observations during this frame. In all of these estimates but one,
we reject the null. When we estimate the effect of evaluation reform for high-accountability grades
(3-11) on subjective ODRs in the balanced panel defined above, we find that it modestly reduced
the rate of ODRs. We choose to interpret this estimate as consistent with our main findings which
are modestly negative in magnitude but indistinguishable from zero.
As expected, our triple-difference estimates (Estimates C11 and C12 of Figure 4 and C7 and
8 of Figure 5) that difference out the change in non-classroom or objective-rationale referrals from
the change in our primary outcomes return estimates even closer to zero.

Evaluation and Discipline 28
We find no evidence that alternate teacher accountability or school discipline policy
reforms either predict any changes in the rates of disciplinary referrals or that they moderate the
effects of teacher evaluation. In Estimates C13 and C14 of Figure 4 and C9 and C10 of Figure 5, we
present the results of adjusting the main effect of teacher evaluation implementation for the
adoption of these other policy reforms. The results are indistinguishable from our main estimates
and zero. Appendix Tables A14 and A15 further demonstrate that none of the policy reforms
individually predicts changes in ODR rates. We also estimate the effects of bundles of
accountability policies separately from the effects of discipline reforms. All results are consistent.
We find no evidence that our results are driven or biased by greater treatment weights
imposed on units treated in the middle of the policy window due to greater conditional variance in
treatment (Goodman-Bacon, 2018), that there are any negative weights on our individual unit-year
observations, or that our results are sensitive to alternate mechanisms for weighting fixed effect
ITEs. In Panel A of Appendix Figure A3, we present the distribution of weights on each school-
year fixed effect by year that the unit was treated. We find no evidence of systematic variation in
fixed effect weight by year of implementation of teacher evaluation reform. In Panel B of Figure
A3, we plot the school-year-level ITE against its weight. Notably, there are no negative weights
and relatively few outlying values; thus, we are relatively unconcerned with the recent concerns
raised about fixed effects estimates in our sample.
We formally compare our results with de Chaisemartin and D’Haultfoeuille’s (2019) Wald-
TC estimator in Estimates C15 and C16 of Figure 4. Though the exact coefficients on these
estimates are slightly different than our main models, they are nevertheless extremely small in
magnitude and statistically indistinguishable from either zero or our main model coefficients. We
present the graphical event study using the Wald-TC estimands in Appendix Figure A4. Note,

Evaluation and Discipline 29
however, that the results using this estimand are less precise, and we are unable to rule out
relatively large effects given this approach.22
Finally, we note that our finding that successfully implementing PBIS has no moderating
effect on the implementation of high-stakes evaluation is robust to alternate sample construction.
In Appendix Tables A18 and A19, we present results that restrict the sample to grade-year
observations in states that ever implemented teacher evaluation as well as ones that restrict the
sample to 5-years-pre- and 1-year post-evaluation implementation. Results across all models are
equivalent to our main models.
8. Conclusion
Policy makers and school system leaders have a critical interest in understanding whether,
and if so how, educators respond to external accountability pressures. Designers of accountability-
based policies must carefully weight the purported benefits of the policy against its potential
harms. In this paper we find that, in the context of pressures from higher-stakes teacher evaluation
policies, teachers do not, on average, alter their responses to students’ classroom misbehavior.
Across a variety of specifications and robustness checks, we find no evidence that the rates of
removing students from class changed in the aftermath of these policy reforms, though we cannot
rule out the possibility of very small effects. Furthermore, we find no evidence that when schools
improve at developing systems of behavioral supports that these serve to moderate any effects of
evaluation implementation.
22 Replications of the Wald-TC results will return slightly different values due to the Stata package did_multipleGT’s use of the bootstrapping method for obtaining standard errors (we use 50 replications). To reduce computing resource demands, we estimate these results using our school-year sample, though in practice this does not affect our standard errors as we cluster them at the state level.
Evaluation and Discipline 30
We make considerable efforts to ensure that we have selected appropriate counterfactuals
to ensure that our findings do not reflect countervailing forces, either secular trends or unobserved
shocks, that mask the true effect of increased accountability. These threats are difficult to fully
disprove. Furthermore, data limitations prevent us from fully modeling teachers’ classroom-based
disciplinary responses. To better understand the data generating process, we would benefit from
records of each instance of student misbehavior, including those that do not result in an office
referral. Ideally, we would like to observe heterogeneity in teachers’ responses to accountability
pressures by demographic characteristics, preparation pathways, professional experiences,
assessed skill and more. Additionally, we are unable to distinguish whether our findings reflect
low-level intensity in the implementation of teacher evaluation or limits in the ability of
accountability pressures to influence teacher practice. We also do not observe the date of students’
disciplinary infractions, and so are unable to test Figlio’s (2006) finding that impending state
accountability assessments increase the severity of disciplinary responses. These outstanding
issues present promising opportunities for future analysis of the effects of accountability pressures
on classroom choices by teachers, including those beyond pedagogy.
Nevertheless, our findings contribute to the limited understanding of the effects of
accountability policy inside the black-box of classroom practice. For those hoping for dramatic
improvements in teaching practice as well as for those concerned about serious unintended
consequences of high-stakes evaluation policy, our findings present another reminder of the loose-
coupling between education policy, teacher behavior and classroom practices.
Evaluation and Discipline 31
References
Abadie, A., Athey, S., Imbens, G., & Wooldridge, J. (2017). When Should You Adjust Standard Errors for Clustering? (NBER Working Paper No. No. 24003). Cambridge, MA. https://doi.org/10.3386/w24003
Anderson, K. P. (2019). Academic, attendance, and behavioral outcomes of a suspension reduction policy: Lessons for school leaders and policy makers. Educational Administration Quarterly. https://doi.org/10.1177/0013161X19861138
Anderson, K. P., & Ritter, G. W. (2017). Disparate use of exclusionary discipline: Evidence on inequities in school discipline from a U.S. state. Education Policy Analysis Archives, 25(49). https://doi.org/10.14507/epaa.25.2787
Anderson, K. P., & Ritter, G. W. (2018). Do school discipline policies treat students fairly? Evidence from Arkansas. Educational Policy, 089590481880208. https://doi.org/10.1177/0895904818802085
Athey, S., & Imbens, G. (2018). Design-based analysis in difference-in-differences settings with staggered adoption (NBER Working Paper Series No. No. 24963). Cambridge, MA. https://doi.org/10.3386/w24963
Bacher-Hicks, A., Billings, S. B., & Deming, D. J. (2019). The School to Prison Pipeline: Long-Run Impacts of School Suspensions on Adult Crime (NBER Working Paper Series No. No. 26257). Cambridge, MA. https://doi.org/10.3386/w26257
Barrett, N., McEachin, A., Mills, J., & Valant, J. (2019). Disparities in student discipline by race and family income. Journal of Human Resources, (0118–9267R2). https://doi.org/10.3368/jhr.56.3.0118-9267R2
Bertrand, M., Duflo, E., & Mullainathan, S. (2004). How Much Should We Trust Differences-In-Differences Estimates? The Quarterly Journal of Economics, 119(1), 249–275. https://doi.org/10.1162/003355304772839588
Bezinque, A., Garcia, K., Darling, K., & Stuart-Cassel, V. (2018). Compendium of School Discipline Laws and Regulations for the 50 States, Washington, D.C. and the U.S. Territories. Washington, DC. Retrieved from http://safesupportivelearning.ed.gov/school-discipline-compendium
Borusyak, K., & Jaravel, X. (2017). Revisiting event study designs (SSRN Working Paper). SSRN Working Papers. https://doi.org/10.2139/ssrn.2826228
Bragg, D. (2019). School-wide information system: Dataset D0098. Eugene, OR: University of Oregon.
Brehm, M., Imberman, S. A., & Lovenheim, M. F. (2017). Achievement effects of individual performance incentives in a teacher merit pay tournament. Labour Economics, 44, 133–150. https://doi.org/10.1016/j.labeco.2016.12.008
Burgess, S., Rawall, S., & Taylor, E. S. (2019). Teacher peer observation and student test scores: Evidence from a field experiment in English secondary schools (Working Paper). Cambridge,

Evaluation and Discipline 32
MA. Retrieved from https://scholar.harvard.edu/files/erictaylor/files/teacher-peer-obsv-brt-jan-19.pdf
Carrell, S. E., & Hoekstra, M. L. (2010). Externalities in the Classroom: How Children Exposed to Domestic Violence Affect Everyone’s Kids. American Economic Journal: Applied Economics, 2(1), 211–228. https://doi.org/10.1257/app.2.1.211
Chakrabarti, R. (2014). Incentives and responses under No Child Left Behind: Credible threats and the role of competition. Journal of Public Economics, 110, 124–146. https://doi.org/10.1016/J.JPUBECO.2013.08.005
Chiang, H. (2009). How accountability pressure on failing schools affects student achievement. Journal of Public Economics, 93(9–10), 1045–1057. https://doi.org/10.1016/J.JPUBECO.2009.06.002
Cullen, J. B., Koedel, C., & Parsons, E. (2019). The compositional effect of rigorous teacher evaluation on workforce quality. Education Finance and Policy, 1–85. https://doi.org/10.1162/edfp_a_00292
Curran, F. C. (2016). Estimating the Effect of State Zero Tolerance Laws on Exclusionary Discipline, Racial Discipline Gaps, and Student Behavior. Educational Evaluation and Policy Analysis, 38(4), 647–668. https://doi.org/10.3102/0162373716652728
de Chaisemartin, C., & D’Haultfoeuille, X. (2019). Two-way Fixed Effects Estimators with Heterogeneous Treatment Effects (NBER Working Paper Series No. No. 25904). Cambridge. Retrieved from https://www.nber.org/papers/w25904
Dee, T. S., & Wyckoff, J. (2015). Incentives, Selection, and Teacher Performance: Evidence from IMPACT. Journal of Policy Analysis and Management, 34(2), 267–297. https://doi.org/10.1002/pam.21818
Deming, D. J., Cohodes, S., Jennings, J., & Jencks, C. (2016). School accountability, postsecondary attainment, and earnings. Review of Economics and Statistics, 98(5), 848–862. https://doi.org/10.1162/REST_a_00598
Deming, D. J., & Figlio, D. (2016). Accountability in US education: Applying lessons from K–12 experience to higher education. Journal of Economic Perspectives, 30(3), 33–56. https://doi.org/10.1257/jep.30.3.33
Dixit, A. (2002). Incentives and organizations in the public sector: An interpretive review. Journal of Human Resources, 37(4), 696–727.
Donaldson, M. L., & Papay, J. P. (2015). An Idea Whose Time Had Come: Negotiating Teacher Evaluation Reform in New Haven, Connecticut. American Journal of Education, 122(1), 39–70. https://doi.org/10.1086/683291
Eren, O. (2019). Teacher incentives and student achievement: Evidence from an Advancement Program. Journal of Policy Analysis and Management, 38(4), 867–890. https://doi.org/10.1002/pam.22146
Ferman, B., & Pinto, C. (2019). Inference in Differences-in-Differences with few treated groups and heteroskedasticity. The Review of Economics and Statistics, 101(3), 452–467.

Evaluation and Discipline 33
https://doi.org/10.1162/rest_a_00759
Figlio, D. N. (2006). Testing, crime and punishment. Journal of Public Economics, 90(4–5), 837–851. https://doi.org/10.1016/J.JPUBECO.2005.01.003
Freyaldenhoven, S., Hansen, C., & Shapiro, J. M. (2019). Pre-Event trends in the panel event-study design. American Economic Review, 109(9), 3307–3338. https://doi.org/10.1257/aer.20180609
Garet, M. S., Wayne, A. J., Brown, S., Rickles, J., Song, M., & Manzeseke, D. (2017). The Impact of Providing Performance Feedback to Teachers and Principals (NCESS 2018-4001). Washington, DC.
Gibbons, C., Serrato, J. C. S., & Urbancic, M. (2018). Broken or Fixed Effects? (NBER Working Paper Series No. No. 20342). Cambridge, MA. https://doi.org/10.3386/w20342
Goodman-Bacon, A. (2018). Difference-in-Differences with Variation in Treatment Timing (NBER Working Paper No. No. 25018). Cambridge, MA. https://doi.org/10.3386/w25018
Greflund, S., McIntosh, K., Mercer, S. H., & May, S. L. (2014). Examining Disproportionality in School Discipline for Aboriginal Students in Schools Implementing PBIS. Canadian Journal of School Psychology, 29(3), 213–235. https://doi.org/10.1177/0829573514542214
Hamilton, L. S., Berends, M., & Stecher, B. M. (2005). Teachers’ responses to standards-based accountability (Rand Working Papers No. WR-259-EDU). Santa Monica, CA. Retrieved from https://www.rand.org/pubs/working_papers/WR259.html
Hanushek, E. (2009). Teacher deselection. In D. D. Goldhaber & J. Hannaway (Eds.), Creating a new teaching profession (pp. 165–180). Washington, DC: Urban Institute Press.
Holbein, J. B., & Ladd, H. F. (2017). Accountability pressure: Regression discontinuity estimates of how No Child Left Behind influenced student behavior. Economics of Education Review, 58, 55–67. https://doi.org/10.1016/J.ECONEDUREV.2017.03.005
Horner, R. H., Sugai, G., Smolkowski, K., Eber, L., Nakasato, J., Todd, A. W., & Esperanza, J. (2009). A Randomized, wait-list controlled effectiveness trial assessing School-Wide Positive Behavior Support in elementary schools. Journal of Positive Behavior Interventions, 11(3), 133–144. https://doi.org/10.1177/1098300709332067
Hoselton, R. (2018). SWIS 2017-18 Summary Report. Eugene, OR.
Imai, K., & Kim, I. S. (2019). On the use of two-way fixed effects regression models for causal inference with panel data (Harvard University IQSS Working Paper). Cambridge, MA. Retrieved from https://imai.fas.harvard.edu/research/twoway.html
Jackson, C. K., Rockoff, J. E., & Staiger, D. O. (2014). Teacher Effects and Teacher-Related Policies. Annual Review of Economics, 6(1), 801–825. https://doi.org/10.1146/annurev-economics-080213-040845
Jacobs, S., & Doherty, K. (2015). State of the States 2015: Evaluating Teaching, Leading and Learning.
Kraft, M. A., Blazar, D., & Hogan, D. (2018). The effect of teacher coaching on instruction and

Evaluation and Discipline 34
achievement: A meta-analysis of the causal evidence. Review of Educational Research, 88(4), 547–588. https://doi.org/10.3102/0034654318759268
Kraft, M. A., Brunner, E. J., Dougherty, S. M., & Schwegman, D. J. (2019). Teacher evaluation reforms and the supply and quality of new teachers (Brown University Working Paper). Providence, RI. Retrieved from https://scholar.harvard.edu/files/mkraft/ files/kraft_et_al._teacher_evaluation_-_updated_feb_2019.pdf
Kraft, M. A., & Gilmour, A. F. (2016). Can Principals Promote Teacher Development as Evaluators? A Case Study of Principals’ Views and Experiences. Educational Administration Quarterly, 52(5), 711–753. https://doi.org/10.1177/0013161X16653445
Lacoe, J., & Steinberg, M. P. (2018). Do suspensions affect student outcomes? Educational Evaluation and Policy Analysis, 0(0). https://doi.org/10.3102/0162373718794897
Ladd, H. F., & Lauen, D. L. (2010). Status versus growth: The distributional effects of school accountability policies. Journal of Policy Analysis and Management, 29(3), 426–450. https://doi.org/10.1002/pam.20504
Liebowitz, D. D. (2019). Teacher evaluation for accountability and growth: Should policy treat them as complements or substitutes? (University of Oregon Working Paper). Retrieved from https://scholar.harvard.edu/files/dliebowitz/files/evaluation_compl_subs_july_2019.pdf
Loeb, S., Miller, L. C., & Wyckoff, J. (2015). Performance Screens for School Improvement. Educational Researcher, 44(4), 199–212. https://doi.org/10.3102/0013189X15584773
Macartney, H. (2016). The Dynamic effects of educational accountability. Journal of Labor Economics, 34(1), 1–28. https://doi.org/10.1086/682333
Macartney, H., McMillan, R., & Petronijevic, U. (2018). Teacher performance and accountability incentives (NBER Working Paper Series No. No. 24747). Cambridge, MA.
McIntosh, K., Mercer, S., Hume, A., Frank, J. L., Turri, M., & Mathews, S. (2013). Factors related to sustained implementation of schoolwide positive behavior support. Exceptional Children, 79(3), 293–311.
Mercer, S. H., McIntosh, K., & Hoselton, R. (2017). Comparability of Fidelity Measures for Assessing Tier 1 School-Wide Positive Behavioral Interventions and Supports. Journal of Positive Behavior Interventions, 19(4), 195–204. https://doi.org/10.1177/1098300717693384
Miller, D., Shenhav, N., & Grosz, M. (2019). Selection into identification in fixed effects models, with application to Head Start (NBER Working Paper Series No. No. 26174). Cambridge, MA. https://doi.org/10.3386/w26174
NCTQ. (2011). State of the States: Trends and Early Lessons on Teacher Evaluation and Effectiveness Policies. Washington, DC.
NCTQ. (2016). State-by-State Evaluation Timeline Briefs. Washington, DC.
NCTQ. (2017). State Teacher Policy Database. Retrieved from https://www.nctq.org/yearbook/home
Neal, D., & Schanzenbach, D. W. (2010). Left behind by design: Proficiency counts and test-based
Evaluation and Discipline 35
accountability. Review of Economics and Statistics, 92(2), 263–283. https://doi.org/10.1162/rest.2010.12318
Ozek, U. (2012). One day too late? Mobile students in the era of accountability (CALDER Working Paper Series No. No. 82). Washington, DC. Retrieved from https://caldercenter.org/sites/default/files/WP 82 Final.pdf
Phipps, A. R. (2018). Personnel contracts with production uncertainty: Theory and evidence from teacher performance incentives (unpublished Working Paper). Charlottesville, VA.
Phipps, A. R., & Wiseman, E. A. (2019). Enacting the rubric: Teacher improvements in windows of high-stakes observation. Education Finance and Policy, 1–51. https://doi.org/10.1162/edfp_a_00295
Pope, N. G. (2019). The effect of teacher ratings on teacher performance. Journal of Public Economics, 172, 84–110. https://doi.org/10.1016/J.JPUBECO.2019.01.001
Rafa, A. (2019). The Status of School Discipline in State Policy. Denver, CO. Retrieved from https://www.ecs.org/wp-content/uploads/The-Status-of-School-Discipline-in-State-Policy.pdf
Reback, R. (2008). Teaching to the rating: School accountability and the distribution of student achievement. Journal of Public Economics, 92(5–6), 1394–1415. https://doi.org/10.1016/J.JPUBECO.2007.05.003
Reback, R., Rockoff, J., & Schwartz, H. L. (2014). Under pressure: Job security, resource allocation, and productivity in schools under No Child Left Behind. American Economic Journal: Economic Policy, 6(3), 207–241. https://doi.org/10.1257/pol.6.3.207
Rothstein, J. (2015). Teacher quality policy when supply matters. American Economic Review, 105(1), 100–130. https://doi.org/10.1257/aer.20121242
Sant’Anna, P. H. C., & Zhao, J. B. (2019). Doubly robust difference-in-differences estimators (SSRN Working Papers No. 3293315). SSRN Electronic Journal. https://doi.org/10.2139/ssrn.3293315
Skiba, R. J. (2015). Interventions to Address Racial/Ethnic Disparities in School Discipline: Can Systems Reform Be Race-Neutral? In Race and Social Problems (pp. 107–124). New York, NY: Springer New York. https://doi.org/10.1007/978-1-4939-0863-9_7
Stecher, B., Holtzman, D., Garet, M., Hamilton, L., Engberg, J., Steiner, E., … Chambers, J. (2018). Improving Teaching Effectiveness: Final Report: The Intensive Partnerships for Effective Teaching Through 2015-2016. Santa Monica: RAND Corporation. https://doi.org/10.7249/RR2242
Steinberg, M. P., & Donaldson, M. L. (2016). The new educational accountability: Understanding the landscape of teacher evaluation in the post-NCLB era. Education Finance and Policy, 11(3), 340–359. https://doi.org/10.1162/EDFP_a_00186
Steinberg, M. P., & Lacoe, J. (2018). Reforming school discipline: School-level policy implementation and the consequences for suspended students and their peers. American Journal of Education, 125(1), 29–77. https://doi.org/10.1086/699811

Evaluation and Discipline 36
Steinberg, M. P., & Sartain, L. (2015). Does Teacher Evaluation Improve School Performance? Experimental Evidence from Chicago’s Excellence in Teaching Project. Education Finance and Policy, 10(4), 535–572. https://doi.org/10.1162/EDFP_a_00173
Strunk, K. O., Barrett, N., & Lincove, J. A. (2017). When tenure ends: The short-run effects of the elimination of Louisiana’s teacher employment protections on teacher exit and retirement. Retrieved from https://educationresearchalliancenola.org/files/publications/041217-Strunk-Barrett-Lincove-When-Tenure-Ends.pdf
Taylor, E. S., & Tyler, J. H. (2012). The Effect of Evaluation on Teacher Performance. American Economic Review, 102(7), 3628–3651. https://doi.org/10.1257/aer.102.7.3628
U.S. Department of Education, & U.S. Department of Justice. (2014). Dear colleague letter on the nondiscriminatory administration of school discipline. Washington, DC.
Vogell, H. (2011, July 26). Investigation into APS cheating finds unethical behavior across every level. Atlanta Journal-Constitution, p. 1. Retrieved from https://www.ajc.com/news/local/investigation-into-aps-cheating-finds-unethical-behavior-across-every-level/bX4bEZDWbeOH33cDkod1FL/
Welsh, R. O., & Little, S. (2018). The school discipline dilemma: A comprehensive review of disparities and alternative approaches. Review of Educational Research, 88(5), 752–794. https://doi.org/10.3102/0034654318791582
Winters, M. A., & Cowen, J. M. (2013). Would a value-added system of retention improve the distribution of teacher quality? A simulation of alternative policies. Journal of Policy Analysis and Management, 32(3), 634–654. https://doi.org/10.1002/pam.21705
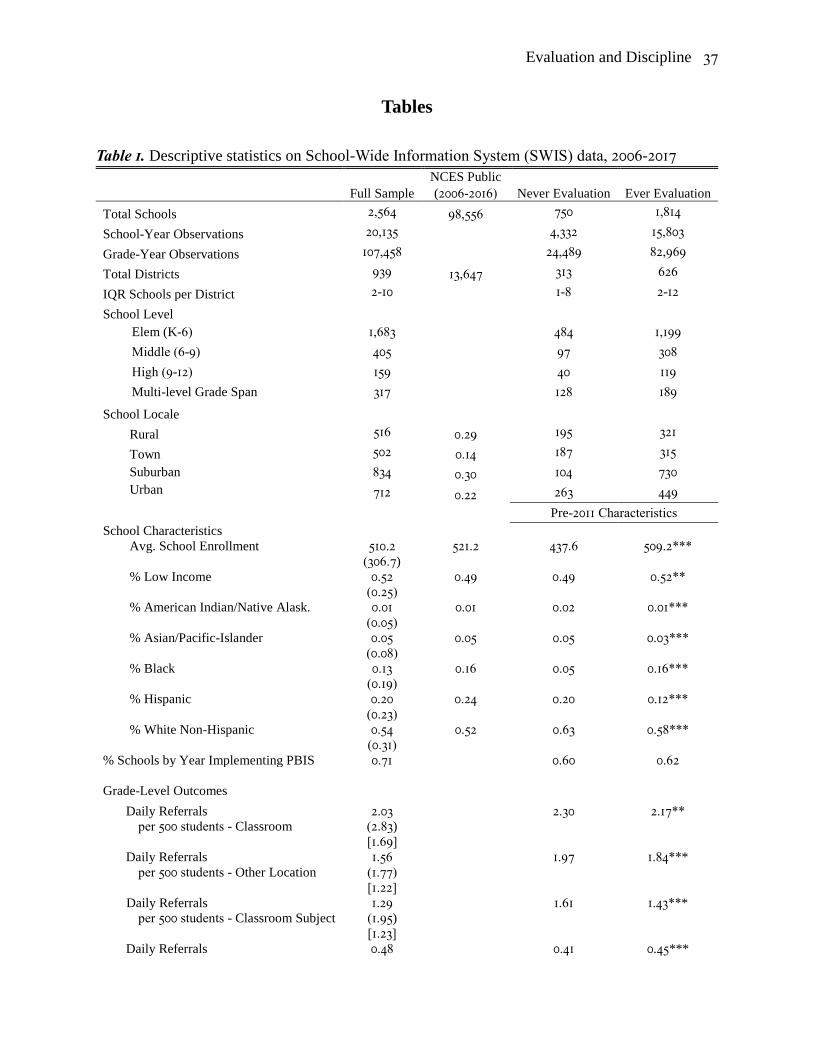
Evaluation and Discipline 37
Tables
Table 1. Descriptive statistics on School-Wide Information System (SWIS) data, 2006-2017
Full Sample NCES Public (2006-2016) Never Evaluation Ever Evaluation
Total Schools 2,564 98,556 750 1,814
School-Year Observations 20,135 4,332 15,803
Grade-Year Observations 107,458 24,489 82,969
Total Districts 939 13,647 313 626
IQR Schools per District 2-10 1-8 2-12
School Level
Elem (K-6) 1,683 484 1,199 Middle (6-9) 405 97 308 High (9-12) 159 40 119 Multi-level Grade Span 317 128 189
School Locale
Rural 516 0.29 195 321
Town 502 0.14 187 315 Suburban 834 0.30 104 730 Urban 712 0.22 263 449
Pre-2011 Characteristics School Characteristics
Avg. School Enrollment 510.2 521.2 437.6 509.2*** (306.7) % Low Income 0.52 0.49 0.49 0.52** (0.25) % American Indian/Native Alask. 0.01 0.01 0.02 0.01*** (0.05) % Asian/Pacific-Islander 0.05 0.05 0.05 0.03*** (0.08) % Black 0.13 0.16 0.05 0.16*** (0.19) % Hispanic 0.20 0.24 0.20 0.12*** (0.23) % White Non-Hispanic 0.54 0.52 0.63 0.58*** (0.31)
% Schools by Year Implementing PBIS 0.71 0.60 0.62 Grade-Level Outcomes
Daily Referrals per 500 students - Classroom
2.03 2.30 2.17** (2.83) [1.69]
Daily Referrals per 500 students - Other Location
1.56 1.97 1.84*** (1.77) [1.22]
Daily Referrals per 500 students - Classroom Subject
1.29 1.61 1.43*** (1.95) [1.23]
Daily Referrals 0.48 0.41 0.45***

Evaluation and Discipline 38
per 500 students - Classroom Object (0.90) [0.40]
% Schools under High-Stakes Evaluation 2010-11 0.00 2011-12 0.13 2012-13 0.16 2013-14 0.36 2014-15 0.52 2015-16 0.55 2016-17 0.72 2017-18 0.72
Notes: * p<.05, ** p<.01, *** p<.001. Sample characteristics and outcomes weighted by school enrollment. Standard deviations, where applicable, in parentheses. Within-school standard deviations in brackets. 85 school-year observations have race/ethnicity data imputed to the same-school median. 40 school-year observations have race/ethnicity data imputed to the district-school year median. 490 school-year observations have low-income data imputed to the same-school median. 59 school-year observations have low-income data imputed to the district-school year value. 67 school-year observations have low income data imputed to the district median. Low-income and race enrollment capped at 100 percent of school enrollment. Outcomes above 99th percentile re-coded to value of 99th percentile. Schools implementing PBIS defined in text. National public school averages are from NCES Digest of Education Statistics between fall 2006-2016 (latest available year). NCES counts are averages of counts from 2006-16, while NCES means are averages of yearly averages.

Evaluation and Discipline 39
Table 2. The effect of teacher evaluation reforms on Office Disciplinary Referrals, by location and subjectivity
A. Class B. Subjective I II III IV V VI Implement evaluation -0.084 -0.089 -0.083
-0.041 -0.042 -0.054
(0.063) (0.064) (0.073)
(0.050) (0.051) (0.044) Implement evaluation * Trend
0.046
0.007
(0.043)
(0.024) Time trend
-0.017
0.004
(0.033)
(0.023) School composition controls X X X X Grade-year observations (N) 107,458 107,458 107,458 107,458 107,458 107,458 School-year observations 20,135 20,135 20,135 20,135 20,135 20,135 R-squared 0.559 0.559 0.559 0.55 0.55 0.55
Notes: *p<.05, **p<.01, ***p<.001. Cells report estimates and associated standard errors clustered at the state level in parentheses. School controls include time-varying enrollment, proportion low-income and race/ethnicity. All models include grade, school and year fixed-effects and are weighted by grade enrollment.

Evaluation and Discipline 40
Table 3. The moderating effect of Positive Behavioral Interventions and Supports (PBIS) on the effect of teacher evaluation reforms on Office Disciplinary Referrals, by location and subjectivity
A. Classroom B. Subjective
I II III IV V VI VII VIII Implement evaluation -0.045 -0.083 -0.089 -0.244 -0.054 -0.075 -0.078 -0.193
(0.072) (0.110) (0.111) (0.200) (0.068) (0.085) (0.086) (0.110)
Implement PBIS well -0.116 -0.116 -0.105 -0.086 -0.086 -0.081
(0.064) (0.064) (0.064) (0.046) (0.046) (0.046)
Implement evaluation * PBIS 0.036 0.037 0.171 0.018 0.019 0.116
(0.099) (0.099) (0.191) (0.060) (0.061) (0.102)
Implement evaluation * Trend 0.139 0.064
(0.091) (0.050)
Implement evaluation * Trend * PBIS
-0.087 -0.064 (0.085) (0.045)
Time trend 0.002 0.016
(0.036) (0.034)
School composition controls X X X X
Grade-year observations (N) 66,076 66,076 66,076 66,076 66,076 66,076 66,076 66,076
School-year observations 12,309 12,309 12,309 12,309 12,309 12,309 12,309 12,309
R-squared 0.602 0.602 0.602 0.602 0.584 0.584 0.584 0.584 Notes: *p<.05, **p<.01, ***p<.001. Cells report estimates and associated standard errors clustered at the state level in parentheses. School controls include time-varying enrollment, proportion low-income and race/ethnicity. All models include grade, school and year fixed-effects and are weighted by grade enrollment. Models I and V replicate results from main DD estimate on PBIS implementation sub-sample. Fewer observations reflect subset of grade-school-year observations (61.5 percent) reporting PBIS implementation information.
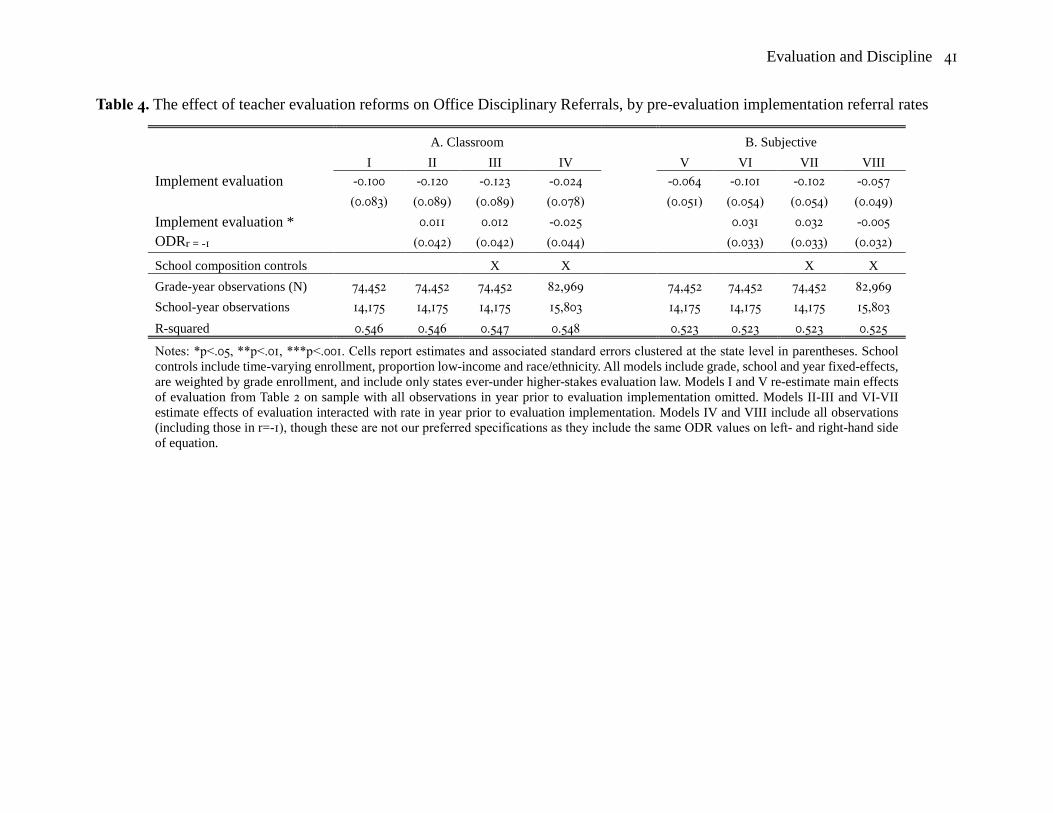
Evaluation and Discipline 41
Table 4. The effect of teacher evaluation reforms on Office Disciplinary Referrals, by pre-evaluation implementation referral rates
A. Classroom B. Subjective
I II III IV V VI VII VIII Implement evaluation -0.100 -0.120 -0.123 -0.024 -0.064 -0.101 -0.102 -0.057 (0.083) (0.089) (0.089) (0.078) (0.051) (0.054) (0.054) (0.049) Implement evaluation * ODRr = -1
0.011 0.012 -0.025 0.031 0.032 -0.005 (0.042) (0.042) (0.044) (0.033) (0.033) (0.032)
School composition controls X X X X Grade-year observations (N) 74,452 74,452 74,452 82,969 74,452 74,452 74,452 82,969 School-year observations 14,175 14,175 14,175 15,803 14,175 14,175 14,175 15,803 R-squared 0.546 0.546 0.547 0.548 0.523 0.523 0.523 0.525
Notes: *p<.05, **p<.01, ***p<.001. Cells report estimates and associated standard errors clustered at the state level in parentheses. School controls include time-varying enrollment, proportion low-income and race/ethnicity. All models include grade, school and year fixed-effects, are weighted by grade enrollment, and include only states ever-under higher-stakes evaluation law. Models I and V re-estimate main effects of evaluation from Table 2 on sample with all observations in year prior to evaluation implementation omitted. Models II-III and VI-VII estimate effects of evaluation interacted with rate in year prior to evaluation implementation. Models IV and VIII include all observations (including those in r=-1), though these are not our preferred specifications as they include the same ODR values on left- and right-hand side of equation.

Evaluation and Discipline 42
Table 5. The effect of teacher evaluation reforms on Office Disciplinary Referrals, by grade-level accountability pressures, location and subjectivity
A. Class (3-11 only) B. Subjective (3-11 only) I II III IV V VI Implement evaluation -0.092 -0.098 -0.096
-0.052 -0.054 -0.075
(0.067) (0.068) (0.078)
(0.057) (0.059) (0.046) Implement evaluation * Trend
0.054
0.008
(0.048)
(0.028) Time trend -0.018 0.008
(0.034) (0.025) School composition controls X X X X Grade-year observations (N) 64,431 64,431 64,431 64,431 64,431 64,431 School-year observations 19,630 19,630 19,630 19,630 19,630 19,630 R-squared 0.586 0.586 0.586 0.573 0.573 0.573
Notes: *p<.05, **p<.01, ***p<.001. Cells report estimates and associated standard errors clustered at the state level in parentheses. School controls include time-varying enrollment, proportion low-income and race/ethnicity. All models include grade, school and year fixed-effects and are weighted by grade enrollment.

Evaluation and Discipline 43
Figures
Figure 1. The timing of statewide teacher evaluation reforms and number of schools by state in analytic sample
Notes: Years represent the fall of the academic year in which new evaluation systems were fully implemented statewide. Numbers inside each state represent total schools in analytic sample (n=2,564). Full list of states with schools in sample and timing of evaluation in Appendix Table A1.

Evaluation and Discipline 44
Panel A. Location of ODR
Panel B. Objectivity of ODR
Figure 2. Average Office Disciplinary Referral rates before and after the introduction of teacher evaluation policies, by location of referral (Panel A) and objectivity of infraction (Panel B)
Notes: Points represent weighted average of Office Disciplinary Referrals for schools in states that implemented high-stakes evaluation. Line is best fit for those averages.

Evaluation and Discipline 45
Panel A. Classroom ODRs
Panel B. Subjective Classroom ODRs
Figure 3. Non-parametric event study displaying effect of high-stakes teacher evaluation reforms on rate of per-500-student, per-day Office Disciplinary Referrals (ODRs), by location and subjectivity
Notes: Point estimates for years pre- and post-evaluation reforms and corresponding 95 percent confidence intervals derived from event study model describe in Equation 1 that is weighted by grade enrollment, includes grade, school and year fixed effects and time-varying school characteristics, with standard errors clustered at state level. Full coefficients reported in Columns IIa and IIc of Appendix Table A2.

Evaluation and Discipline 46
Figure 4. Point estimates and 95 percent confidence intervals of tests of assumptions on main difference-in-differences analysis (grades K-12).
Notes: To meet difference-in-differences assumptions, all 95 confidence intervals should overlap with zero in Panels A and B. Estimates in Panel C should overlap with preferred DD model point estimates for classroom (dash: -0.089) and classroom, subjective ODRs (dash-point: -0.042). As these are indistinguishable from zero in the population, all estimates in Panel C should also overlap with zero. Data for estimates B11-B13 from Civil Rights Data Collection. Full set of point estimates available in Appendix Tables A5, A7, A8, A11, A12, A14 and A16.
A1. Class pre-trends
A2. Class pre-trends, cntrls
A3. Class pre-trends, linear & cntrls
A3i. Class pre-trends, quad & cntrls
A4. Subj pre-trends
A5. Subj pre-trends, cntrls
A6. Subj pre-trends, linear & cntrls
A6i. Subj pre-trends, quad & cntrls
-.5 0 .5
A. Pre-trends
B1. OtherB2. Other, cntrls
B3. Other, cntrls & timeB4. Object
B5. Object, cntrlsB6. Object, cntrls & time
B7. Class - Fake eval (t-2)B8. Class - Fake eval (t-4)B9. Subj - Fake eval (t-2)
B10. Subj - Fake eval (t-4)B11. CRDC
B12. CRDC, cntrlsB13. CRDC, cntrls & time
-.5 0 .5
B. Placebos
Class Subj
C1. Class school-level est.C2. Class school-level est., cntrls
C3. Subj. school-level est.C4. Subj. school-level est., cntrls
C5. Class unweighted, cntrlsC6. Subj. unweighted, cntrls
C7. Class, ever evalC8. Class, balanced panel
C9. Subj, ever evalC10. Subj, balanced panel
C11. DDD Class-Other, cntrlsC12. DDD Subj-Obj, cntrls
C13. Class, alt policy cntrlsC14. Subj, alt policy cntrlsC15. Class Wald-TC est.C16. Subj Wald-TC est.
-.5 0 .5
C. Addt'l Robustness Checks

Evaluation and Discipline 47
Figure 5. Point estimates and 95 percent confidence intervals of tests of assumptions on high-accountability grade difference-in-differences analysis (grades 3-11).
Notes: To meet difference-in-differences assumptions, all 95 confidence intervals should overlap with zero in Panels A and B. Estimates in Panel C should overlap with preferred DD model point estimates for classroom (dash: -0.098) and classroom, subjective ODRs (dash-point: -0.054). As these are indistinguishable from zero in the population, all estimates in Panel C should also overlap with zero. Full set of point estimates available in Appendix Tables A6, A9, A10, A13, A15, and A17.
A1. Class affect grades pre-trends
A2. Class affect grades pre-trends, cntrls
A3. Class affect grades pre-trends, linear & cntrls
A3i. Class affect grades pre-trends, quad & cntrls
A4. Subj affect grades pre-trends
A5. Subj affect grades pre-trends, cntrls
A6. Subj affect grades pre-trends, linear & cntrls
A6i. Subj affect grades pre-trends, quad & cnrls
-.3 -.2 -.1 0 .1 .2
A. Pre-trends
B1. Other, affect grades (3-11) onlyB2. Class, unaffect grades (K-2, 12) onlyB3. Other, unaffect grades (K-2, 12) only
B4. Object, affect grades (3-11) onlyB5. Subj, unaffect grades (K-2, 12) only
B6. Object, unaffect grades (K-2, 12) onlyB7. Class DD affect grades (3-11) only - Fake eval (t-2)B8. Class DD affect grades (3-11) only - Fake eval (t-4)B9. Subj DD affect grades (3-11) only - Fake eval (t-2)
B10. Subj DD affect grades (3-11) only - Fake eval (t-4)
-.3 -.2 -.1 0 .1 .2
B. Placebos
Class, 3-11 Subj, 3-11
C1. Class, affect grades (3-11) only - unweightC2. Class, affect grades (3-11) only - ever eval
C3. Class, affect grades (3-11) only - balanced panelC4. Subject, affect grades (3-11) only - unweight
C5. Subj, affect grades (3-11) only - ever evalC6. Subj, affect grades (3-11) only - balanced panel
C7. DDD Class-Other (3-11) only, cntrlsC8. DDD Subj-Obj (3-11) only, cntrls
C9. Class, affect grades (3-11) only - other policy cntrlsC10. Subj, affect grades (3-11) only - other policy cntrls
-.3 -.2 -.1 0 .1 .2
C. Addt'l Robustness Checks

Evaluation and Discipline 48
Appendix A. Additional Tables and Figures
Table A1. Education policy reforms by state, 2006-2018
Schools in
sample Implement evaluation
Eliminate tenure
Weaken collective bargaining
Change teach. authority to
remove stud. from class
Limit suspension/ exclusion
Alabama 0 2016 Alaska 1 2016 Arizona 3 2014 Arkansas 10 2013 California 371 None 2014 Colorado 67 2013 2012 Connecticut 75 2014 2018 2018 Delaware 0 2012 2018 Distr. of Columbia 0 2009 2009 2009; 2018 Florida 4 2011 2011 2009; 2018 Georgia 38 2014 2014 Hawaii 0 2013 2009 Idaho 7 2014 2011 2011 Illinois 320 2016 2016 Indiana 4 2014 2009 Iowa 124 None Kansas 8 2014 2014 Kentucky 85 2014
Louisiana 4 2012 2012 2009 2007; 2008; 2009; 2012; 2015
Maine 23 2016 Maryland 123 2013 2009 2014; 2017 Massachusetts 2 2013 Michigan 126 2011 2017 Minnesota 51 2014 2016 Mississippi 5 2014 Missouri 63 2013 Montana 69 None Nebraska 52 None Nevada 0 2015 2015 New Hampshire 42 2016 New Jersey 6 2013 2012 2016 New Mexico 7 2013 2009 New York 13 2012 North Carolina 131 2011 2013 2011 North Dakota 21 2015
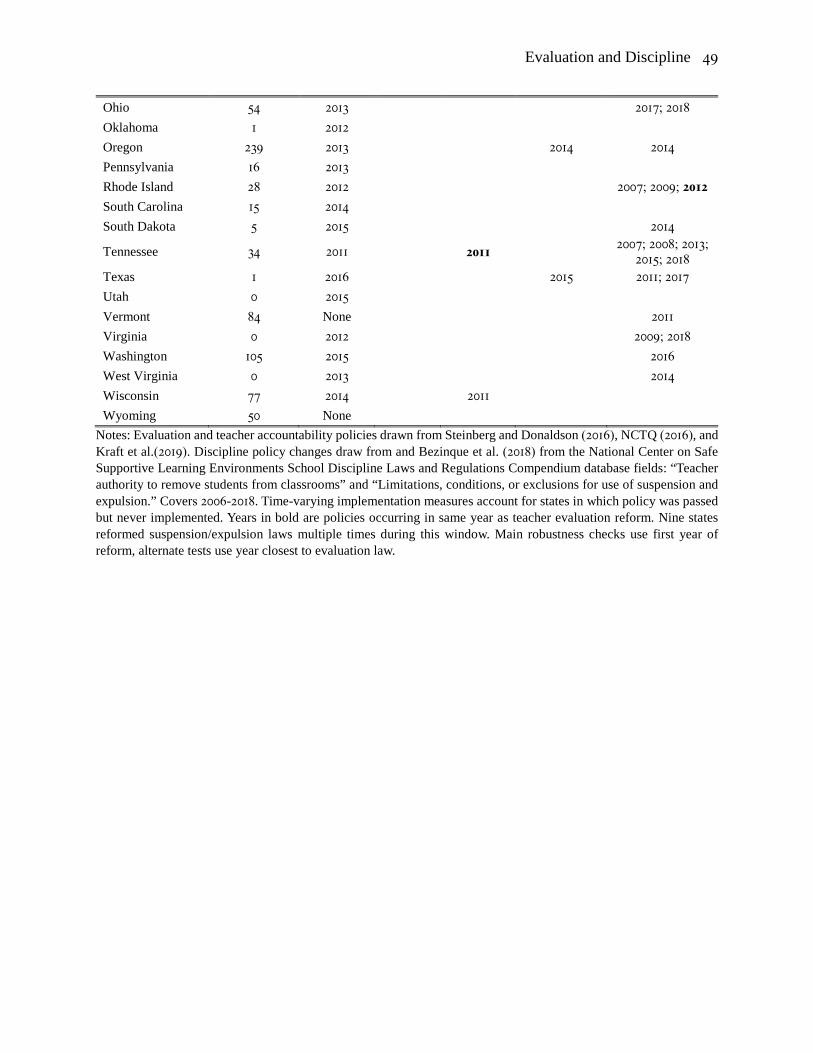
Evaluation and Discipline 49
Ohio 54 2013 2017; 2018 Oklahoma 1 2012 Oregon 239 2013 2014 2014 Pennsylvania 16 2013 Rhode Island 28 2012 2007; 2009; 2012 South Carolina 15 2014 South Dakota 5 2015 2014
Tennessee 34 2011 2011 2007; 2008; 2013; 2015; 2018
Texas 1 2016 2015 2011; 2017 Utah 0 2015 Vermont 84 None 2011 Virginia 0 2012 2009; 2018 Washington 105 2015 2016 West Virginia 0 2013 2014 Wisconsin 77 2014 2011 Wyoming 50 None
Notes: Evaluation and teacher accountability policies drawn from Steinberg and Donaldson (2016), NCTQ (2016), and Kraft et al.(2019). Discipline policy changes draw from and Bezinque et al. (2018) from the National Center on Safe Supportive Learning Environments School Discipline Laws and Regulations Compendium database fields: “Teacher authority to remove students from classrooms” and “Limitations, conditions, or exclusions for use of suspension and expulsion.” Covers 2006-2018. Time-varying implementation measures account for states in which policy was passed but never implemented. Years in bold are policies occurring in same year as teacher evaluation reform. Nine states reformed suspension/expulsion laws multiple times during this window. Main robustness checks use first year of reform, alternate tests use year closest to evaluation law.
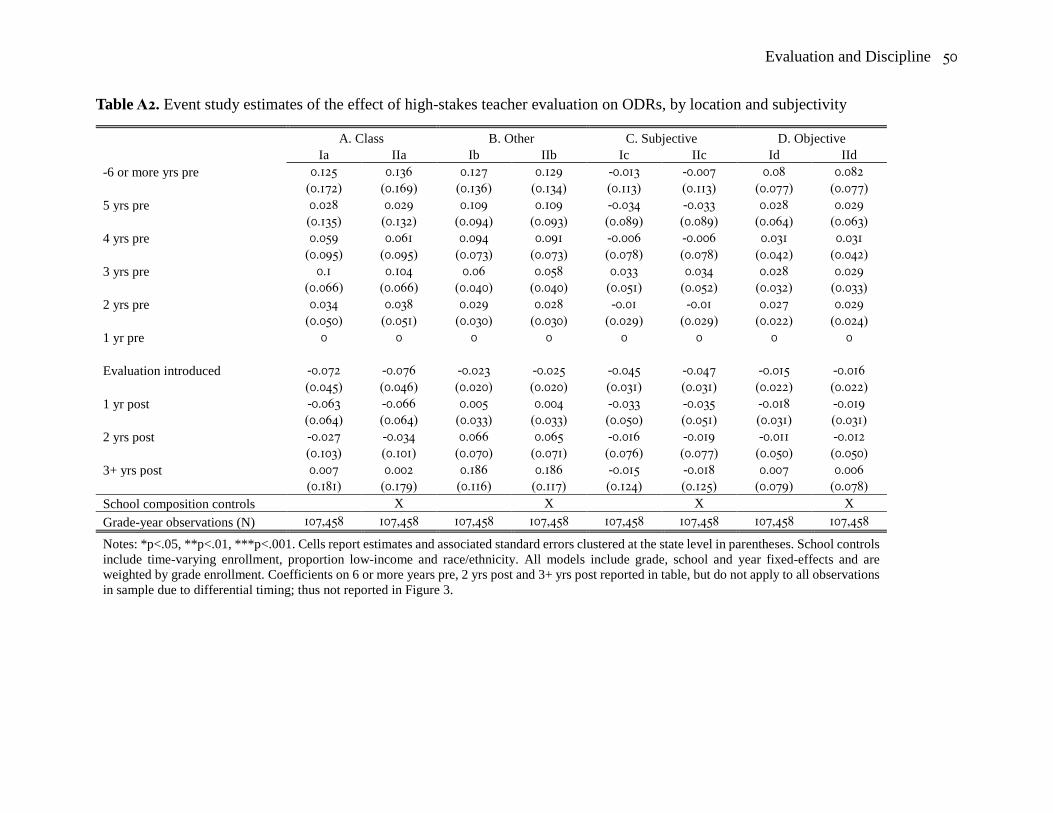
Evaluation and Discipline 50
Table A2. Event study estimates of the effect of high-stakes teacher evaluation on ODRs, by location and subjectivity
A. Class B. Other C. Subjective D. Objective Ia IIa Ib IIb Ic IIc Id IId
-6 or more yrs pre 0.125 0.136 0.127 0.129 -0.013 -0.007 0.08 0.082 (0.172) (0.169) (0.136) (0.134) (0.113) (0.113) (0.077) (0.077)
5 yrs pre 0.028 0.029 0.109 0.109 -0.034 -0.033 0.028 0.029 (0.135) (0.132) (0.094) (0.093) (0.089) (0.089) (0.064) (0.063)
4 yrs pre 0.059 0.061 0.094 0.091 -0.006 -0.006 0.031 0.031 (0.095) (0.095) (0.073) (0.073) (0.078) (0.078) (0.042) (0.042)
3 yrs pre 0.1 0.104 0.06 0.058 0.033 0.034 0.028 0.029 (0.066) (0.066) (0.040) (0.040) (0.051) (0.052) (0.032) (0.033)
2 yrs pre 0.034 0.038 0.029 0.028 -0.01 -0.01 0.027 0.029 (0.050) (0.051) (0.030) (0.030) (0.029) (0.029) (0.022) (0.024)
1 yr pre 0 0 0 0 0 0 0 0
Evaluation introduced -0.072 -0.076 -0.023 -0.025 -0.045 -0.047 -0.015 -0.016 (0.045) (0.046) (0.020) (0.020) (0.031) (0.031) (0.022) (0.022)
1 yr post -0.063 -0.066 0.005 0.004 -0.033 -0.035 -0.018 -0.019 (0.064) (0.064) (0.033) (0.033) (0.050) (0.051) (0.031) (0.031)
2 yrs post -0.027 -0.034 0.066 0.065 -0.016 -0.019 -0.011 -0.012 (0.103) (0.101) (0.070) (0.071) (0.076) (0.077) (0.050) (0.050)
3+ yrs post 0.007 0.002 0.186 0.186 -0.015 -0.018 0.007 0.006 (0.181) (0.179) (0.116) (0.117) (0.124) (0.125) (0.079) (0.078) School composition controls X X X X Grade-year observations (N) 107,458 107,458 107,458 107,458 107,458 107,458 107,458 107,458
Notes: *p<.05, **p<.01, ***p<.001. Cells report estimates and associated standard errors clustered at the state level in parentheses. School controls include time-varying enrollment, proportion low-income and race/ethnicity. All models include grade, school and year fixed-effects and are weighted by grade enrollment. Coefficients on 6 or more years pre, 2 yrs post and 3+ yrs post reported in table, but do not apply to all observations in sample due to differential timing; thus not reported in Figure 3.
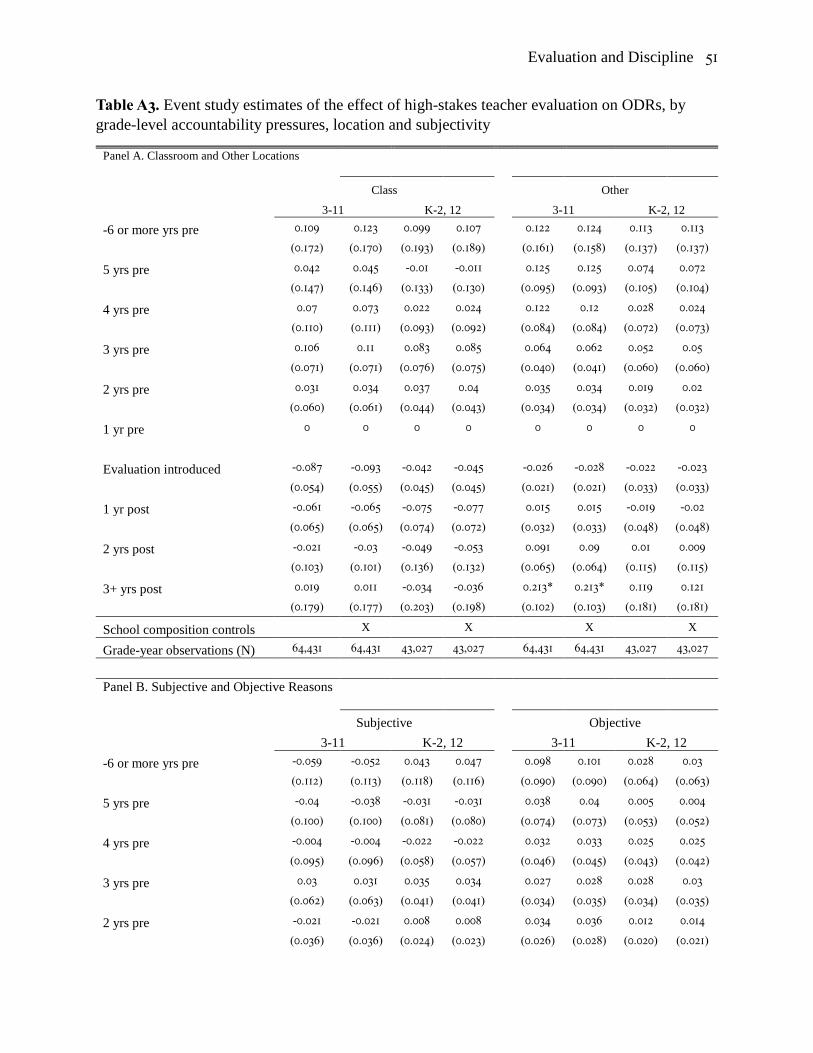
Evaluation and Discipline 51
Table A3. Event study estimates of the effect of high-stakes teacher evaluation on ODRs, by grade-level accountability pressures, location and subjectivity
Panel A. Classroom and Other Locations
Class Other
3-11 K-2, 12 3-11 K-2, 12
-6 or more yrs pre 0.109 0.123 0.099 0.107 0.122 0.124 0.113 0.113
(0.172) (0.170) (0.193) (0.189) (0.161) (0.158) (0.137) (0.137)
5 yrs pre 0.042 0.045 -0.01 -0.011 0.125 0.125 0.074 0.072
(0.147) (0.146) (0.133) (0.130) (0.095) (0.093) (0.105) (0.104)
4 yrs pre 0.07 0.073 0.022 0.024 0.122 0.12 0.028 0.024
(0.110) (0.111) (0.093) (0.092) (0.084) (0.084) (0.072) (0.073)
3 yrs pre 0.106 0.11 0.083 0.085 0.064 0.062 0.052 0.05
(0.071) (0.071) (0.076) (0.075) (0.040) (0.041) (0.060) (0.060)
2 yrs pre 0.031 0.034 0.037 0.04 0.035 0.034 0.019 0.02
(0.060) (0.061) (0.044) (0.043) (0.034) (0.034) (0.032) (0.032)
1 yr pre 0 0 0 0 0 0 0 0
Evaluation introduced -0.087 -0.093 -0.042 -0.045 -0.026 -0.028 -0.022 -0.023
(0.054) (0.055) (0.045) (0.045) (0.021) (0.021) (0.033) (0.033)
1 yr post -0.061 -0.065 -0.075 -0.077 0.015 0.015 -0.019 -0.02
(0.065) (0.065) (0.074) (0.072) (0.032) (0.033) (0.048) (0.048)
2 yrs post -0.021 -0.03 -0.049 -0.053 0.091 0.09 0.01 0.009
(0.103) (0.101) (0.136) (0.132) (0.065) (0.064) (0.115) (0.115)
3+ yrs post 0.019 0.011 -0.034 -0.036 0.213* 0.213* 0.119 0.121
(0.179) (0.177) (0.203) (0.198) (0.102) (0.103) (0.181) (0.181)
School composition controls X X X X
Grade-year observations (N) 64,431 64,431 43,027 43,027 64,431 64,431 43,027 43,027
Panel B. Subjective and Objective Reasons
Subjective Objective
3-11 K-2, 12 3-11 K-2, 12 -6 or more yrs pre -0.059 -0.052 0.043 0.047 0.098 0.101 0.028 0.03
(0.112) (0.113) (0.118) (0.116) (0.090) (0.090) (0.064) (0.063)
5 yrs pre -0.04 -0.038 -0.031 -0.031 0.038 0.04 0.005 0.004
(0.100) (0.100) (0.081) (0.080) (0.074) (0.073) (0.053) (0.052)
4 yrs pre -0.004 -0.004 -0.022 -0.022 0.032 0.033 0.025 0.025
(0.095) (0.096) (0.058) (0.057) (0.046) (0.045) (0.043) (0.042)
3 yrs pre 0.03 0.031 0.035 0.034 0.027 0.028 0.028 0.03
(0.062) (0.063) (0.041) (0.041) (0.034) (0.035) (0.034) (0.035)
2 yrs pre -0.021 -0.021 0.008 0.008 0.034 0.036 0.012 0.014
(0.036) (0.036) (0.024) (0.023) (0.026) (0.028) (0.020) (0.021)

Evaluation and Discipline 52
1 yr pre 0 0 0 0 0 0 0 0
Evaluation introduced -0.06 -0.062 -0.017 -0.018 -0.008 -0.01 -0.027 -0.028
(0.037) (0.038) (0.030) (0.030) (0.026) (0.026) (0.020) (0.020)
1 yr post -0.04 -0.041 -0.027 -0.028 -0.009 -0.01 -0.035 -0.036
(0.054) (0.056) (0.047) (0.047) (0.035) (0.034) (0.029) (0.029)
2 yrs post -0.018 -0.022 -0.021 -0.024 -0.007 -0.009 -0.018 -0.019
(0.080) (0.082) (0.086) (0.084) (0.057) (0.057) (0.049) (0.049)
3+ yrs post -0.011 -0.014 -0.039 -0.041 0.005 0.004 0.009 0.01
(0.132) (0.134) (0.114) (0.113) (0.084) (0.082) (0.085) (0.083)
School composition controls X X X X
Grade-year observations (N) 64,431 64,431 43,027 43,027 64,431 64,431 43,027 43,027
Notes: *p<.05, **p<.01, ***p<.001. Cells report estimates and associated standard errors clustered at the state level in parentheses. School controls include time-varying enrollment, proportion low-income and race/ethnicity. All models include grade, school and year fixed-effects and are weighted by grade enrollment. Coefficients on 6 or more years pre, 2 yrs post and 3+ yrs post reported in table, but do not apply to all observations in sample due to differential timing; thus not reported in Figure A2.
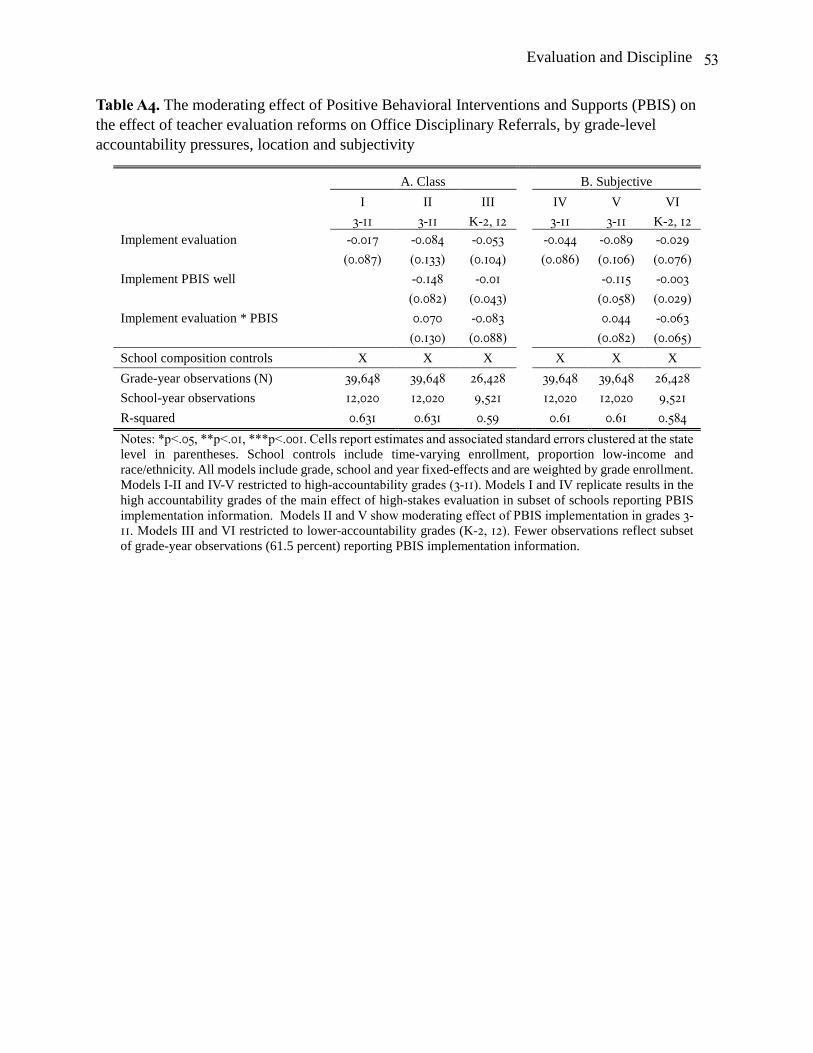
Evaluation and Discipline 53
Table A4. The moderating effect of Positive Behavioral Interventions and Supports (PBIS) on the effect of teacher evaluation reforms on Office Disciplinary Referrals, by grade-level accountability pressures, location and subjectivity
A. Class B. Subjective
I II III IV V VI
3-11 3-11 K-2, 12 3-11 3-11 K-2, 12 Implement evaluation -0.017 -0.084 -0.053 -0.044 -0.089 -0.029 (0.087) (0.133) (0.104) (0.086) (0.106) (0.076) Implement PBIS well -0.148 -0.01 -0.115 -0.003 (0.082) (0.043) (0.058) (0.029) Implement evaluation * PBIS 0.070 -0.083 0.044 -0.063
(0.130) (0.088) (0.082) (0.065)
School composition controls X X X X X X Grade-year observations (N) 39,648 39,648 26,428 39,648 39,648 26,428 School-year observations 12,020 12,020 9,521 12,020 12,020 9,521 R-squared 0.631 0.631 0.59 0.61 0.61 0.584 Notes: *p<.05, **p<.01, ***p<.001. Cells report estimates and associated standard errors clustered at the state level in parentheses. School controls include time-varying enrollment, proportion low-income and race/ethnicity. All models include grade, school and year fixed-effects and are weighted by grade enrollment. Models I-II and IV-V restricted to high-accountability grades (3-11). Models I and IV replicate results in the high accountability grades of the main effect of high-stakes evaluation in subset of schools reporting PBIS implementation information. Models II and V show moderating effect of PBIS implementation in grades 3-11. Models III and VI restricted to lower-accountability grades (K-2, 12). Fewer observations reflect subset of grade-year observations (61.5 percent) reporting PBIS implementation information.

Evaluation and Discipline 54
Table A5. Parallel trends assumption checks, by location and subjectivity
Class Other I II III IV V VI Panel A. Class and Other Locations Linear pre-trend -0.016 -0.017 -0.024 -0.027 -0.027 -0.02
(0.033) (0.033) (0.049) (0.026) (0.025) (0.023)
Quadratic pre-trend -0.001 0.001
(0.007) (0.004)
School composition controls X X X X
Grade-year observations (N) 107,458 107,458 107,458 107,458 107,458 107,458
School-year observations 20,135 20,135 20,135 20,135 20,135 20,135
R-squared 0.559 0.559 0.559 0.534 0.535 0.535 Subjective Objective
Panel B. Subjective and Objective Reasons
Linear pre-trend 0.004 0.004 -0.012 -0.011 -0.011 0.003
(0.023) (0.023) (0.040) (0.015) (0.015) (0.018)
Quadratic pre-trend -0.002 0.002
(0.005) (0.002)
School composition controls X X X X Grade-year observations (N) 107,458 107,458 107,458 107,458 107,458 107,458 School-year observations 20,135 20,135 20,135 20,135 20,135 20,135 R-squared 0.55 0.55 0.55 0.555 0.555 0.555 Notes: *p<.05, **p<.01, ***p<.001. Cells report estimates and associated standard errors clustered at the state level in parentheses. School controls include time-varying enrollment, proportion low-income and race/ethnicity. All models include grade, school and year fixed-effects and are weighted by grade enrollment.
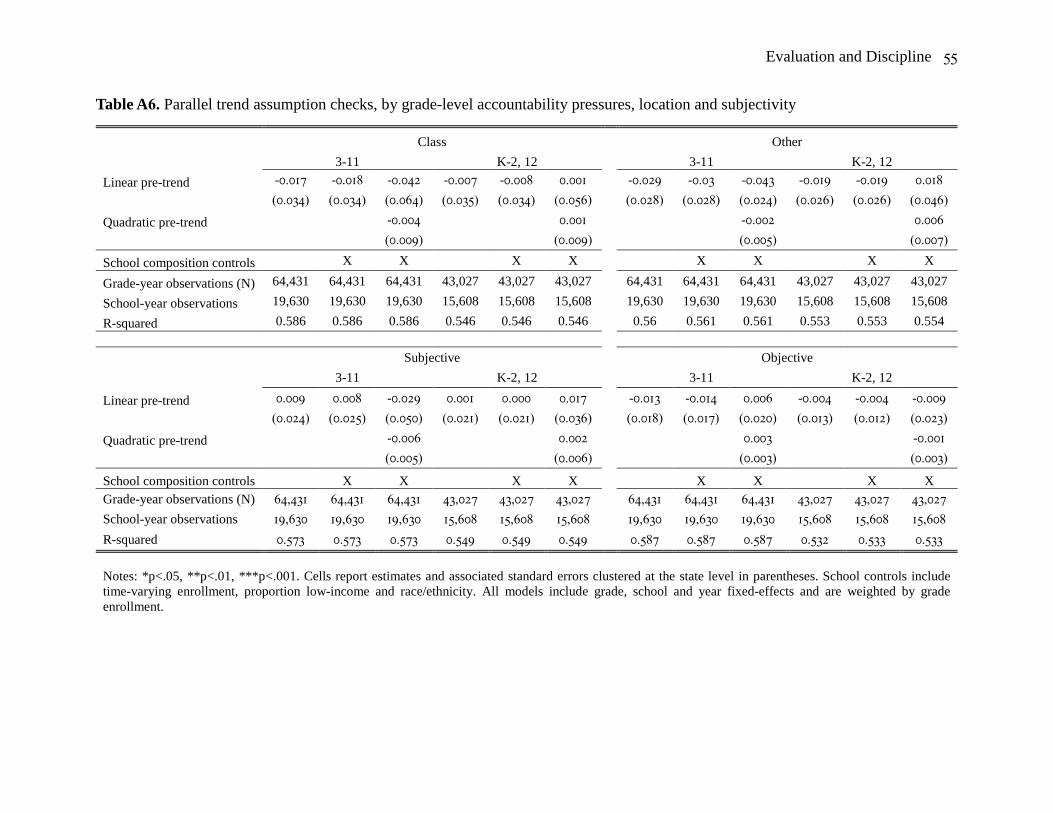
Evaluation and Discipline 55
Table A6. Parallel trend assumption checks, by grade-level accountability pressures, location and subjectivity
Class Other
3-11 K-2, 12 3-11 K-2, 12 Linear pre-trend -0.017 -0.018 -0.042 -0.007 -0.008 0.001 -0.029 -0.03 -0.043 -0.019 -0.019 0.018
(0.034) (0.034) (0.064) (0.035) (0.034) (0.056) (0.028) (0.028) (0.024) (0.026) (0.026) (0.046)
Quadratic pre-trend -0.004 0.001 -0.002 0.006
(0.009) (0.009) (0.005) (0.007)
School composition controls X X X X X X X X
Grade-year observations (N) 64,431 64,431 64,431 43,027 43,027 43,027 64,431 64,431 64,431 43,027 43,027 43,027
School-year observations 19,630 19,630 19,630 15,608 15,608 15,608 19,630 19,630 19,630 15,608 15,608 15,608
R-squared 0.586 0.586 0.586 0.546 0.546 0.546 0.56 0.561 0.561 0.553 0.553 0.554
Subjective Objective
3-11 K-2, 12 3-11 K-2, 12
Linear pre-trend 0.009 0.008 -0.029 0.001 0.000 0.017 -0.013 -0.014 0.006 -0.004 -0.004 -0.009
(0.024) (0.025) (0.050) (0.021) (0.021) (0.036) (0.018) (0.017) (0.020) (0.013) (0.012) (0.023)
Quadratic pre-trend -0.006 0.002 0.003 -0.001
(0.005) (0.006) (0.003) (0.003)
School composition controls X X X X X X X X Grade-year observations (N) 64,431 64,431 64,431 43,027 43,027 43,027 64,431 64,431 64,431 43,027 43,027 43,027 School-year observations 19,630 19,630 19,630 15,608 15,608 15,608 19,630 19,630 19,630 15,608 15,608 15,608 R-squared 0.573 0.573 0.573 0.549 0.549 0.549 0.587 0.587 0.587 0.532 0.533 0.533 Notes: *p<.05, **p<.01, ***p<.001. Cells report estimates and associated standard errors clustered at the state level in parentheses. School controls include time-varying enrollment, proportion low-income and race/ethnicity. All models include grade, school and year fixed-effects and are weighted by grade enrollment.

Evaluation and Discipline 56
Table A7. Alternate outcome and evaluation implementation year placebo tests, by location and subjectivity
I II III IV V Panel A. Class and Other Locations Other Class (fake) Implement evaluation -0.016 -0.017 -0.022 (0.032) (0.032) (0.039) Implement evaluation * Trend 0.096* (0.043) False eval implementation (t-2) -0.076 (0.060) False eval implementation (t-4) 0.004
(0.081) School composition controls X X X X Grade-year observations (N) 107,458 107,458 107,458 107,458 107,458 School-year observations 20,135 20,135 20,135 20,135 20,135 R-squared 0.534 0.534 0.535 0.559 0.559
Panel B. Subjective and Objective Reasons
Objective Subjective (fake) Implement evaluation -0.023 -0.025 -0.015 (0.029) (0.029) (0.033) Implement evaluation * Trend 0.019 (0.027) False eval implementation (t-2) -0.026 (0.051) False eval implementation (t-4) 0.032
(0.038) School composition controls X X X X Grade-year observations (N) 107,458 107,458 107,458 107,458 107,458 School-year observations 20,135 20,135 20,135 20,135 20,135 R-squared 0.555 0.555 0.555 0.55 0.55 Notes: *p<.05, **p<.01, ***p<.001. Cells report estimates and associated standard errors clustered at the state level in parentheses. School controls include time-varying enrollment, proportion low-income and race/ethnicity. All models include grade, school and year fixed-effects and are weighted by grade enrollment.

Evaluation and Discipline 57
Table A8. CRDC difference-in-difference estimates of high-stakes teacher evaluation policies on out of school suspensions, 2006-2015
A. Class B. Subj C. CRDC
I II III IV V VI Implement evaluation -0.038 -0.026 0.011** 0.011** 0.010 0.009
(0.062) (0.047) (0.004) (0.004) (0.006) (0.005) Implement evaluation * Trend -0.004
(0.003) Time trend 0.002*
(0.001) School composition controls X X X X X Grade-school-year observant. 88,401 88,401 NA NA NA NA School-year observations 16,562 16,562 284,460 284,460 234,295 284,460 R-squared 0.585 0.571 0.715 0.717 0.718 0.717 Notes: *p<.05, **p<.01, ***p<.001. Cells report estimates and associated standard errors clustered at the state level in parentheses. School controls include time-varying enrollment, Title I Status, and race/ethnicity. Models I and II re-estimate main results excluding years 2016-17 and 2017-18 to demonstrate comparability with time-frame of CRDC data. Models III-VI estimate rates of suspension in CRDC data. Model V restricted to schools in states that ever implemented high stakes evaluation reform. All CRDC models include school and year fixed-effects and are weighted by school enrollment. Data obtained from Civil Rights Data Collection. All CRDC sample sizes (school-year observations) rounded to nearest 5 per IES requirements.

Evaluation and Discipline 58
Table A9. Alternate outcome placebo tests, by high-accountability grade, location and subjectivity
A. By Location & Grade B. By Type & Grade I II III IV V VI
Other 3-11
Class K-2, 12
Other K-2, 12
Obj 3-11
Subj K-2, 12
Obj K-2, 12
Implement evaluation -0.015 -0.078 -0.026 -0.018 -0.024 -0.039
(0.031) (0.064) (0.042) (0.036) (0.039) (0.024) School composition controls X X X X X X
Grade-year observations (N) 64,431 43,027 43,027 64,431 43,027 43,027 School-year observations 19,630 15,608 15,608 19,630 15,608 15,608 R-squared 0.56 0.546 0.553 0.587 0.549 0.533 Notes: *p<.05, **p<.01, ***p<.001. Cells report estimates and associated standard errors clustered at the state level in parentheses. School controls include time-varying enrollment, proportion low-income and race/ethnicity. All models include grade, school and year fixed-effects and are weighted by grade enrollment.

Evaluation and Discipline 59
Table A10. Alternate evaluation year implementation placebo tests, by location and subjectivity (grades 3-11 only)
I II III IV V VI VII VIII
Class Other Class Other Subj Obj Subj Obj False eval implementation (t-2) -0.093 -0.098
-0.037 -0.012
(0.072) (0.064)
(0.064) (0.033)
False eval implementation (t-4)
0.006 -0.064
0.051 -0.032
(0.095) (0.073)
(0.040) (0.053)
School composition controls X X X X X X X X Grade-year observations (N) 64,431 64,431 64,431 64,431 64,431 64,431 64,431 64,431 School-year observations 19,630 19,630 19,630 19,630 19,630 19,630 19,630 19,630 R-squared 0.586 0.56 0.586 0.56 0.573 0.587 0.573 0.587
Notes: *p<.05, **p<.01, ***p<.001. Cells report estimates and associated standard errors clustered at the state level in parentheses. School controls include time-varying enrollment, proportion low-income and race/ethnicity. All models include grade, school and year fixed-effects and are weighted by grade enrollment.

Evaluation and Discipline 60
Table A11. Alternate specifications testing robustness to alternate samples and weighting of average treatment effects
I II III IV V VI VII VIII School estimates Wald-TC Ever eval Balanced panel Panel A. Class and Other Locations Class Class Other Class Other Implement evaluation -0.080 -0.062 -0.067 0.011 -0.070 -0.020 -0.108 -0.040
(0.066) (0.068) (0.076) (0.259) (0.059) (0.027) (0.064) (0.030) Implement evaluation * Time trend 0.043
(0.046)
Time trend -0.011
(0.034)
School composition controls X X X X X X X Grade-year observations (N) N/A N/A N/A N/A 82,969 82,969 83,455 83,455 School-year observations 20,519 20,519 20,519 20,519 15,803 15,803 15,599 15,599 R-squared 0.706 0.709 0.709 N/A 0.548 0.517 0.594 0.570 Panel B. Subjective and Objective Reasons
Subjective Subject Object Subject Object Implement evaluation -0.048 -0.035 -0.053 0.004 -0.066 0.004 -0.039 -0.036
(0.055) (0.056) (0.046) (0.235) (0.037) (0.028) (0.048) (0.028) Implement evaluation * Time trend -0.001
(0.029)
Time trend 0.010
(0.026)
School composition controls X X X X X X X Grade-year observations (N) N/A N/A N/A N/A 82,969 82,969 83,455 83,455 School-year observations 20,519 20,519 20,519 20,519 15,803 15,803 15,599 15,599 R-squared 0.724 0.727 0.727 N/A 0.526 0.577 0.582 0.583 * p < .05, ** p < .01, *** p < .001. Cells report estimates and associated standard errors clustered at the state level in parentheses. School controls include time-varying enrollment, proportion low-income and race/ethnicity. Models I-III estimated at school-level which includes 384 more school-year observations than main analytic sample. Models I-III include school and year fixed effects and are weighted by school enrollment. Models IV-VIII also include grade fixed effects and are weighted by grade enrollment. Models V and VI restricted to schools that experienced high-stakes evaluation. Models VII and VIII are a balanced panel restricted to school-year observations 5 years before through 1 year after introduction of high-stakes evaluation or never experienced it.

Evaluation and Discipline 61
Table A12. Triple-difference estimates of the effects of teacher evaluation reforms on Office Disciplinary Referrals
I II III Panel A. Class and Other Locations Implement evaluation * classroom -0.070 -0.072 -0.044 (0.045) (0.044) (0.042) Implement evaluation -0.015 -0.017 -0.030 (0.032) (0.033) (0.047) Implement evaluation * classroom * Trend -0.044 (0.024) Implement evaluation * Trend 0.093* (0.040) Time trend -0.022 (0.026) School composition controls X X Grade-year observations (N) 107,458 107,458 107,458 School-year observations 20,135 20,135 20,135 R-squared 0.554 0.554 0.554 IV V VI Panel B. Subjective and Objective Reasons
Implement evaluation * Subjective -0.020 -0.021 -0.019 (0.051) (0.051) (0.039) Implement evaluation -0.022 -0.023 -0.025 (0.028) (0.028) (0.034) Implement evaluation * Subjective * Trend -0.003 (0.029) Implement evaluation * Trend 0.015 (0.023) Time trend -0.003 (0.015) School composition controls X X Grade-year observations (N) 107,458 107,458 107,458 School-year observations 20,135 20,135 20,135 R-squared 0.574 0.574 0.574
* p < .05, ** p < .01, *** p < .001. Cells report estimates and associated standard errors clustered at the state level in parentheses. School controls include time-varying enrollment, proportion low-income and race/ethnicity. All models include grade, school, year, classroom/subjective, classroom/subjective-by-school and classroom/subjective-by-year fixed effects and are weighted by grade enrollment. Double-difference models available in Table 2 (class and subjective) and Table A7 (other and objective).

Evaluation and Discipline 62
Table A13. Triple-difference estimates of the effects of teacher evaluation reforms on Office Disciplinary Referrals, grades 3-11 only
I II III Panel A. Class and Other Locations Implement evaluation * classroom -0.079 -0.081 -0.052 (0.059) (0.059) (0.055) Implement evaluation -0.014 -0.016 -0.034 (0.031) (0.031) (0.048) Implement evaluation * classroom * Trend -0.046 (0.028) Implement evaluation * Trend 0.104* (0.045) Time trend -0.024 (0.025) School composition controls X X Grade-year observations (N) 64,431 64,431 64,431 School-year observations 19,630 19,630 19,630 R-squared 0.585 0.586 0.586 IV V VI Panel B. Subjective and Objective Reasons
Implement evaluation * Subjective -0.038 -0.039 -0.041 (0.065) (0.065) (0.050) Implement evaluation -0.015 -0.016 -0.019 (0.035) (0.035) (0.039) Implement evaluation * Subjective * Trend 0.003 (0.038) Implement evaluation * Trend 0.012 (0.028) Time trend -0.003 (0.015) School composition controls X X Grade-year observations (N) 64,431 64,431 64,431 School-year observations 20,135 20,135 20,135 R-squared 0.609 0.609 0.609
* p < .05, ** p < .01, *** p < .001. Cells report estimates and associated standard errors clustered at the state level in parentheses. School controls include time-varying enrollment, proportion low-income and race/ethnicity. All models include grade, school, year, classroom/subjective, classroom/subjective-by-school and classroom/subjective-by-year fixed effects and are weighted by grade enrollment. Double-difference models available in Tables 3 (class and subjective, grades 3-11) and Table A9 (other and objective, grades 3-11)

Evaluation and Discipline 63
Table A14. The effects of teacher evaluation, other accountability, and discipline policy reforms on ODRs, by location and subjectivity
Classroom ODRs Subjective ODRs
Separate Models
Joint Account.
Joint discipline
Full joint model
Separate Models
Joint Account.
Joint discipline
Full joint model
I II III IV V VI VII VIII Implement evaluation -0.089 -0.091 -0.101 -0.104 -0.042 -0.047 -0.045 -0.051
(0.064) (0.067) (0.067) (0.072) (0.051) (0.053) (0.045) (0.048)
Eliminate tenure -0.315 -0.316 -0.306 -0.121 -0.124 -0.105
(0.205) (0.204) (0.205) (0.153) (0.154) (0.156)
Weaken collective bargaining 0.105 0.134 0.156 0.193 0.207 0.212
(0.385) (0.373) (0.370) (0.248) (0.241) (0.235)
Alter teacher authority to remove student from class
0.110 0.119 0.109 0.070 0.094 0.094 (0.195) (0.199) (0.195) (0.144) (0.153) (0.151)
Alter limits to suspension/expulsion 0.032 0.018 0.03 -0.029 -0.044 -0.037
(0.095) (0.077) (0.078) (0.065) (0.049) (0.052)
School composition controls X X X X X X X X Grade-year observations (N) 107,458 107,458 107,458 107,458 107,458 107,458 107,458 107,458 School-year observations 20,135 20,135 20,135 20,135 20,135 20,135 20,135 20,135 Notes: *p<.05, **p<.01, ***p<.001. Cells report estimates and associated standard errors clustered at the state level in parentheses. School controls include time-varying enrollment, proportion low-income and race/ethnicity. All models include grade, school and year fixed-effects and are weighted by grade enrollment. Coefficients on Suspension Limit models that use the year of discipline reform closest to evaluation reform are 0.004 (0.094) and -0.041 (0.063) for class and subjective ODRs, respectively.

Evaluation and Discipline 64
Table A15. The effects of teacher evaluation, other accountability and discipline policy on ODRs, by location and subjectivity (grades 3-11 only)
Classroom ODRs (3-11 only) Subjective ODRs (3-11 only)
Separate Models
Joint Account.
Joint discipline
Full joint model
Separate Models
Joint Account.
Joint discipline
Full joint model
I II III IV V VI VII VIII
Implement evaluation -0.098 -0.100 -0.107 -0.109 -0.054 -0.058 -0.054 -0.059
(0.068) (0.072) (0.072) (0.076) (0.059) (0.061) (0.049) (0.052)
Eliminate tenure -0.342 -0.341 -0.332 -0.13 -0.133 -0.108
(0.251) (0.251) (0.255) (0.189) (0.191) (0.196)
Weaken collective bargaining 0.077 0.109 0.126 0.189 0.206 0.203
(0.446) (0.431) (0.429) (0.284) (0.275) (0.269)
Alter teacher authority to remove student from class
0.085 0.100 0.089 0.061 0.099 0.099 (0.194) (0.205) (0.201) (0.154) (0.171) (0.169)
Alter limits to suspension/exclusion 0.014 0.005 0.017 -0.064 -0.079 -0.072
(0.104) (0.097) (0.097) (0.071) (0.060) (0.062)
School composition controls X X X X X X X X Grade-year observations (N) 64,431 64,431 64,431 64,431 64,431 64,431 64,431 64,431 School-year observations 19,630 19,630 19,630 19,630 19,630 19,630 19,630 19,630 Notes: *p<.05, **p<.01, ***p<.001. Cells report estimates and associated standard errors clustered at the state level in parentheses. School controls include time-varying enrollment, proportion low-income and race/ethnicity. All models include grade, school and year fixed-effects and are weighted by grade enrollment. Coefficients on Suspension Limit models that use the year of discipline reform closest to evaluation reform are -0.025 (0.105) and -0.082 (0.069) for class and subjective ODRs, respectively.

Evaluation and Discipline 65
Table A16. Unweighted OLS estimates of the effect of teacher evaluation reforms on Office Disciplinary Referrals, by location and subjectivity
A. Class B. Subjective I II III IV V VI Implement evaluation -0.045 -0.048 -0.032 -0.025 -0.026 -0.02
(0.072) (0.073) (0.088) (0.054) (0.055) (0.060) Implement evaluation * Trend 0.038 0.006
(0.039) (0.026) Time trend -0.019 -0.005
(0.032) (0.024) School composition controls X X X X Grade-year observations (N) 107,458 107,458 107,458 107,458 107,458 107,458 School-year observations 20,135 20,135 20,135 20,135 20,135 20,135 R-squared 0.497 0.497 0.497 0.49 0.49 0.49 Notes: *p<.05, **p<.01, ***p<.001. Cells report estimates and associated standard errors clustered at the state level in parentheses. School controls include time-varying enrollment, proportion low-income and race/ethnicity. All models include grade, school and year fixed-effects.

Evaluation and Discipline 66
Table A17. Alternate specifications testing robustness to alternate samples, by location and subjectivity (grades 3-11 only)
Class, 3-11 Subject, 3-11
I II III IV
Ever eval Balanced panel Ever eval Balanced panel Implement evaluation -0.071 -0.121 -0.087* -0.043
(0.069) (0.064) (0.041) (0.051)
School composition controls X X X X Grade-year observations (N) 49,582 50,091 49,582 50,091 School-year observations 15,392 15,207 15,392 15,207 R-squared 0.583 0.621 0.558 0.603 Notes: *p<.05, **p<.01, ***p<.001. Cells report estimates and associated standard errors clustered at the state level in parentheses. School controls include time-varying enrollment, proportion low-income and race/ethnicity. All models include grade, school and year fixed-effects and are weighted by grade enrollment.
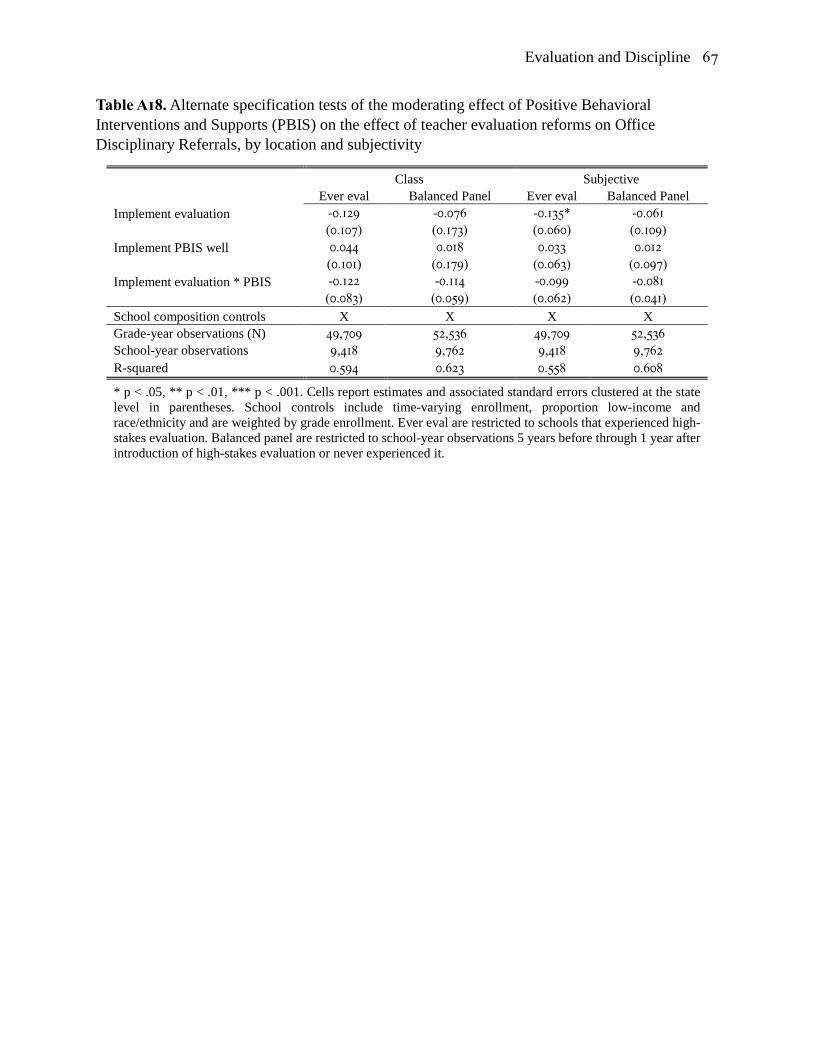
Evaluation and Discipline 67
Table A18. Alternate specification tests of the moderating effect of Positive Behavioral Interventions and Supports (PBIS) on the effect of teacher evaluation reforms on Office Disciplinary Referrals, by location and subjectivity
Class Subjective Ever eval Balanced Panel Ever eval Balanced Panel
Implement evaluation -0.129 -0.076 -0.135* -0.061 (0.107) (0.173) (0.060) (0.109)
Implement PBIS well 0.044 0.018 0.033 0.012 (0.101) (0.179) (0.063) (0.097) Implement evaluation * PBIS -0.122 -0.114 -0.099 -0.081
(0.083) (0.059) (0.062) (0.041) School composition controls X X X X Grade-year observations (N) 49,709 52,536 49,709 52,536 School-year observations 9,418 9,762 9,418 9,762 R-squared 0.594 0.623 0.558 0.608
* p < .05, ** p < .01, *** p < .001. Cells report estimates and associated standard errors clustered at the state level in parentheses. School controls include time-varying enrollment, proportion low-income and race/ethnicity and are weighted by grade enrollment. Ever eval are restricted to schools that experienced high-stakes evaluation. Balanced panel are restricted to school-year observations 5 years before through 1 year after introduction of high-stakes evaluation or never experienced it.

Evaluation and Discipline 68
Table A19. Alternate specification tests of the moderating effect of Positive Behavioral Interventions and Supports (PBIS) on the effect of teacher evaluation reforms on Office Disciplinary Referrals, by location and subjectivity (grades 3-11 only)
Class, 3-11 Subj, 3-11
I II III IV
Ever eval Balanced panel Ever eval Balanced panel Implement evaluation -0.110 -0.077 -0.159* -0.075
(0.136) (0.185) (0.077) (0.116) Implement PBIS well 0.054 0.048 0.047 0.047 (0.136) (0.201) (0.088) (0.110) Implement evaluation * PBIS -0.129 -0.142 -0.115 -0.108
(0.108) (0.079) (0.080) (0.054) School composition controls X X X X Grade-year observations (N) 29,678 31,560 29,678 31,560 School-year observations 9,195 9,535 9,195 9,535 R-squared 0.63 0.653 0.592 0.634 * p < .05, ** p < .01, *** p < .001. Cells report estimates and associated standard errors clustered at the state level in parentheses. School controls include time-varying enrollment, proportion low-income and race/ethnicity and are weighted by grade enrollment. Ever eval are restricted to schools that experienced high-stakes evaluation. Balanced panel are restricted to school-year observations 5 years before through 1 year after introduction of high-stakes evaluation or never experienced it.
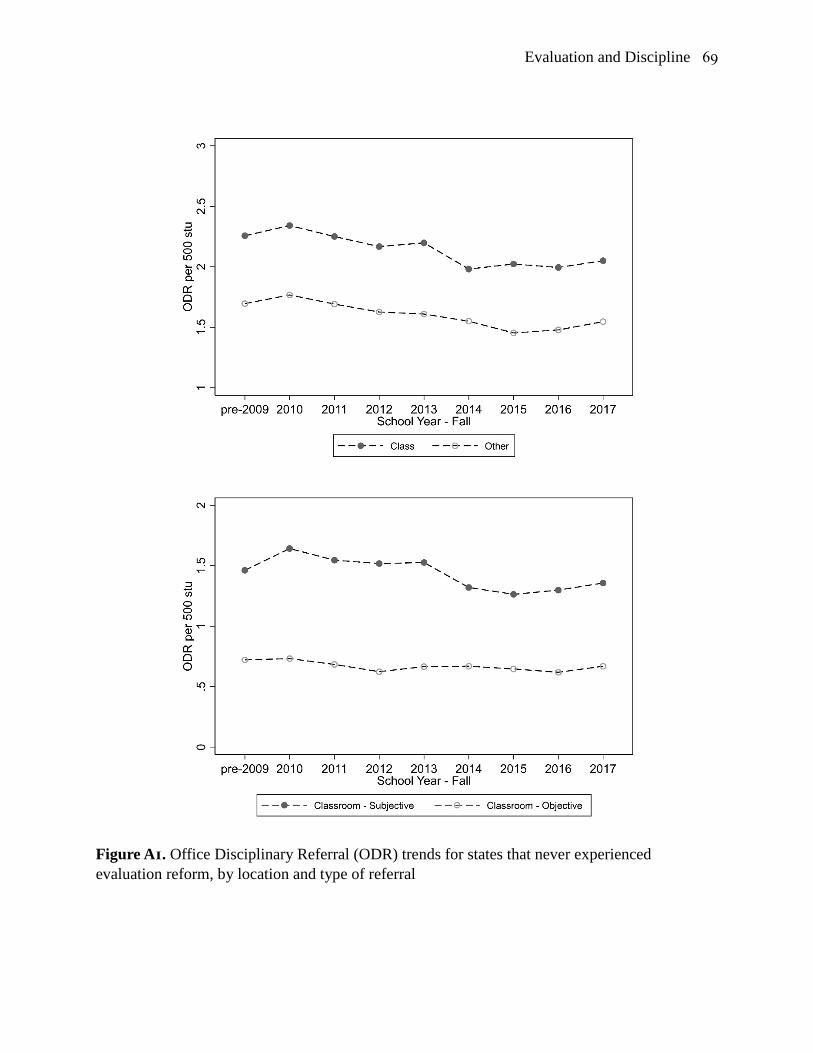
Evaluation and Discipline 69
Figure A1. Office Disciplinary Referral (ODR) trends for states that never experienced evaluation reform, by location and type of referral

Evaluation and Discipline 70
Panel A. Classroom ODRs
Panel B. Subjective Classroom ODRs
Figure A2. Non-parametric event study displaying effect of high-stakes teacher evaluation reforms on rate per-500-student, per-day Office Disciplinary Referrals (ODRs) in grades 3-11, by location and subjectivity
Notes: point estimates for years pre- and post-evaluation reforms and corresponding 95 percent confidence intervals derived from event study model describe in Equation 1 that is weighted by school size, includes grade, school and year fixed effects and time-varying school characteristics, with standard errors clustered at state level. Full coefficients reported in Models IIa and IIc of Appendix Table A3.
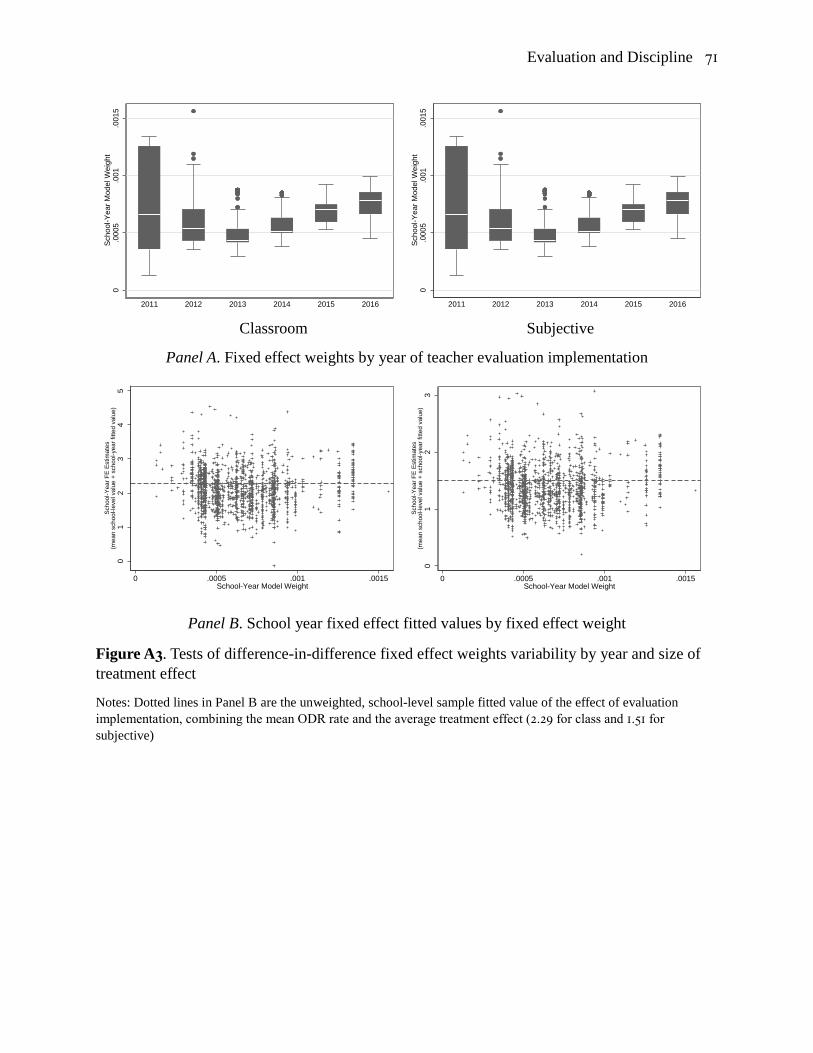
Evaluation and Discipline 71
Classroom Subjective
Panel A. Fixed effect weights by year of teacher evaluation implementation
Panel B. School year fixed effect fitted values by fixed effect weight
Figure A3. Tests of difference-in-difference fixed effect weights variability by year and size of treatment effect
Notes: Dotted lines in Panel B are the unweighted, school-level sample fitted value of the effect of evaluation implementation, combining the mean ODR rate and the average treatment effect (2.29 for class and 1.51 for subjective)
0.0
005
.001
.001
5Sc
hool
-Yea
r Mod
el W
eigh
t
2011 2012 2013 2014 2015 2016
0.0
005
.001
.001
5Sc
hool
-Yea
r Mod
el W
eigh
t
2011 2012 2013 2014 2015 2016
01
23
45
Scho
ol-Y
ear F
E Es
timat
es(m
ean
scho
ol-le
vel v
alue
+ s
choo
l-yea
r fitt
ed v
alue
)
0 .0005 .001 .0015School-Year Model Weight
01
23
Scho
ol-Y
ear F
E Es
timat
es(m
ean
scho
ol-le
vel v
alue
+ s
choo
l-yea
r fitt
ed v
alue
)
0 .0005 .001 .0015School-Year Model Weight

Evaluation and Discipline 72
Panel A. Class
Panel B. Subjective
Figure A4. Difference-in-difference estimates with Wald-TC estimand with prior-year placebos and post-implementation trend

Evaluation and Discipline 73
Appendix B. Data Description
B.1 SWIS PBIS Sample and Data
The School-wide Information System (SWIS) data on Positive Behavioral Interventions and Supports come from the Education and Community Supports research unit of the University of Oregon (Bragg, 2019). A key strategy to improve behavioral supports in schools implementing PBIS is to track behavioral data. As such, each behavioral incident that prompts a student to be referred to an administrator responsible for addressing misbehavior is recorded. Approximately 25,000 schools in the 2016-17 school year were attempting to implement PBIS in some form. About 11,000 of these schools used the SWIS data management system and 5,745 of these schools agreed to have their data used for research purposes (Hoselton, 2018).
We begin by restricting our sample to observations with valid data that were subject to the policies of interest. Due to data inconsistencies in which schools sharing the same ID appear in different states, we drop 27 school-year observations. We then restrict our sample to school-years appearing in and after the 2006-07 school year. At this point, we have 75,066 school-year observations. We exclude all Alternative and Juvenile Justice schools as they have different governing regulations, resulting in dropping 5,105 school-year observations. We also drop 103 school-year observations that are exclusively pre-schools as are may not subject to the same evaluation policy. For similar reasons, we exclude Bureau of Indian Affairs (134 school-year observations), schools in Guam and the Virgin Islands (172 school-year observations), and charter schools (924 school-year observations).
We then require that we observe schools in states that experience evaluation reform for four years prior to the adoption of high-stakes teacher evaluation and one year following the initial policy implementation. For school in states that never experience evaluation, we require that we observe them four times between 2006 and 2017. This substantially reduces our sample to 23,538 school year observations.
The SWIS data include enrollment data from the school’s NCES Common Core Data (CCD) record in most cases, but some schools do not report this October 1 count data and instead report a local tally of students. In the case of schools with highly transient populations, the October 1 count data in the CCD may represent enrollment of differences of 20 percent or more than a February 1 count. We attempt to capture the most complete enrollment data. We use the CCD enrollment data or the SWIS-reported enrollment when only one of the two is available. Otherwise, we use the average of the two. 1,512 school-year observations are either missing all enrollment data or have enrollment below 20 students and we exclude these.
We describe our imputations of race/ethnicity and low-income measures in the notes to Table 1. Even after these imputations, we still have 40 school-year observations without race/ethnicity data and 227 school-year observations without free- or reduced-price lunch (FRPL) data. We exclude these observations.
Evaluation and Discipline 74
We then limit our sample to school-years which have recorded Office Disciplinary Referrals (ODRs) originating in the classroom or other locations, and are subjective or objective in nature. We restrict our sample to schools that have measured outcomes in all four of these areas. Excluding these school-years missing one or more outcomes results in a further reduction of our sample of 1,059 school-years. This results in a school-level sample that includes 20,521 school-year observations. This is our sample for our school-level estimates in Appendix Table A10.
From this school-level sample, we further identify our main grade-school-year analytic sample. We restrict from our sample any school-year observation that does not have an outcome recorded for all of the four primary outcomes recorded at the grade level. This results in the exclusion of an additional 384 school-year observations and results in a main sample of 20,135 school-years. Embedded in these school-year observations are 107,458 grade-school-year observations. We re-shape our data to use these grade-school-year observations as our primary analytic units.
We categorize subjective and objective behaviors data following Greflund et al. (2014):
“Subjective behaviors were defined as behaviors that require not simply observing a discrete, objective event (e.g., a student smoking), but a significant value judgment regarding whether the intensity or quality of the behavior warrants an ODR (e.g., a student using inappropriate language). The average inter-rater agreement among the expert panel for all 24 problem behaviors was 90%. The following behaviors were categorized as subjective: abusive language/inappropriate language/profanity, defiance/disrespect/insubordination/ non-compliance, harassment/bullying, disruption, dress code violation, and inappropriate display of affection. The following behaviors were categorized as less subjective: physical aggression/fighting, tardy, skipping, truancy, property damage/vandalism, forgery/theft, inappropriate location/out of bounds, use/possession of tobacco, alcohol, drugs, combustibles, weapons, bomb threat/false alarm, and arson. Three problem behaviors did not meet the inter-rater reliability criterion and were also not classified as subjective: lying/cheating, technology violation, and gang affiliation display.” (2014, pp. 220–221)
Our outcome measures are the grade-school-year count of a particular category of ODR, divided by the total grade enrollment, divided by the number of school days in the year for that school. Then, we scale the outcome to the approximate average school size in our sample by multiplying this ratio by 500. As we discuss in the notes to Table 1, due to a small number of outlying values, we cap all outcome measures above the 99th percentile to the value of the 99th percentile.
We construct school-level measures of racial composition and the proportion of low-income students (measured by their receipt of free- or reduced-price lunch). These measures are constructed by dividing enrollment by race by total enrollment. All models adjusting for racial composition include the following racial/ethnic group percentages from the CCD and school reports: American Indian/Native Alaskan, Asian/Pacific Islander, Black, Hispanic and White, Non-Hispanic. As we discuss in the notes to Table 1, we observe a small number of school-year observations in which a particular demographic group represents more than the total school

Evaluation and Discipline 75
enrollment. These instances generally arise when total and sub-group enrollment figures differentially reflect in- and out-flows of students over the school year. We cap these values at 1. This affects 563 school-year observations.
We assign grade-school-year observations a value of 1 for PBIS implementation in years in which they meet self- and externally assessed criteria for successful implementation. To be classified as successfully implementing PBIS, schools had to meet one of the following thresholds: School-wide Evaluation Tool (SET): greater than or equal to 80 percent of expectations taught and overall implementation; Tiered Fidelity Inventory (TFI): Tier 1 ratio greater than or equal to 70 percent; Benchmark of Quality (BOQ: Total Ratio greater than or equal to 70 percent; Self-Assessment Survey (SAS): Implementation Average greater than or equal to 80; and Team Implementation Checklist (TIC): Implementation Average greater than or equal to 80 percent. We do not use the continuous implementation scores as they represent substantially different scales and are not linked across instruments (Greflund et al., 2014; Mercer, McIntosh, & Hoselton, 2017).
B.2 CRDC Data
As a placebo test of our main results, we estimate models using restricted-use Civil Rights Data Collection (CRDC) data set. CRDC data are collected biennially (for the most part) by the U.S. Department of Education, dating back to 1968. These data are primarily focused on civil rights issues such as discipline, bullying, and access for students with disabilities (U.S. Department of Education, 2018). In this study, we draw on five waves of data, from the 2005-2006 school year to the most recently-collected 2015-2016 school year. Within these waves of data, the U.S. Department of Education altered who was included in the sample. For the 2005-2006 and 2009-2010 waves, data were collected from a large, nationally representative sample of public schools and districts, while for the following three waves of data (2011-2012, 2013-2014, 2015-2016), data were collected from every public school and district in the country. These data do not include the last year of evaluation implementation covering schools in six states that implemented evaluation reforms in 2016-17. Thus, we re-estimate our results in our main sample restricting observations to only those appearing prior to 2016-17. As these results are consistent, we feel confident concluding that the CRDC sample provides an informative check for our main estimates.
To prepare the data, we first merge the school-level out-of-school suspension counts, enrollment, demographic, and Title I status data from all five waves of data to create a longitudinal dataset. There are differences in how the CRDC collected demographic data across the different waves, moving from five distinct racial/ethnic categories to seven. In order to create stable categories across the waves, we create five categories, Asian-American/Hawaiian students, African-American students, Hispanic students, White non-Hispanic students, and an Other category that includes American Indian and Multi-racial students. We impute missing enrollment values using the average enrollment values from the prior and proceeding wave of data, or in the case of the initial wave the two waves after, and the final wave the two waves prior. We use the same imputation approach for demographic enrollment values.
We then calculate the suspension rate by dividing the total number of students suspended by the schools’ total enrollment. Importantly, the out-of-school suspension rate measures the total number

Evaluation and Discipline 76
of students who were suspended throughout the year, not the total number of suspensions throughout the year. Therefore, the measure does not account for the additional number of suspensions that occurred if a student was suspended more than once in the school year. We do not include in-school suspensions nor expulsions in these analyses. We cap all suspension rates at 1, as there were rare cases in which schools reported a total number of students suspended that was larger than the school enrollment, which accounted for 1,435 observations. This has been previously documented in CRDC data (Losen & Gillespie, 2012), and may reflect that enrollment values are measured in Fall, while the count of students suspended is measured at the end of the school year, creating the opportunity to have more students suspended over the year’s course than the initial Fall enrollment count.
The CRDC data collection does not have a measure of school or district percent of students who qualify for Free or Reduced Price Lunch, so as a measure of socioeconomic status we use whether or not a school qualified as a Title I school. Values are not available for the 2005-2006 school year, so we impute Title I status based on the following wave, or in the case of schools that did not have a 2009-2010 value, the 2011-2012 value. We also impute missing values for following waves, using the maximum (0/1) from the prior and proceeding waves.
Aligned with how we prepare the referral data, we exclude schools according to a number of criteria. For schools in states that did implement high-stakes teacher evaluation policies, we retain only schools for which we have an observation prior to, and after, the evaluation implementation. For schools in states that did not implement high-stakes teacher evaluation policies, we retain only those with two or more observations. This results in an exclusion of 104,770 observations, a product of the fact that states which implemented evaluation in 2016 do not have observations after evaluation implementation, as well as other factors, such as schools closing or providing incomplete data across years. We further exclude Alternative, Juvenile Justice, and Charter schools, for a total of 19,135 observations excluded. We also exclude schools that offered only pre-K (another 3,460 observations), as well as schools with enrollment below 20 students (another 3,640 observations). We also, after imputation, exclude three observations for which we are unable to impute total enrolment, another 6,335 observations for which we ae unable to impute Title I status, and 380 that have missing suspension rates. Note that the preceding description of the number of observations excluded will not align precisely with the total CRDC observations and those in our sample due to the fact that we round all reported values to the nearest 5 per Institute for Education Sciences requirements.

Evaluation and Discipline 77
Table B1. CRDC descriptive statistics
Full Sample Never Under
Evaluation Ever Under Evaluation
Total Schools 65,315 11,730 53,580 School-Year Observations 284,460 50,165 234,295 Total Districts 9,460 1,880 7,580
Average School Enrollment 591.08 623.91 584.05 (SD) (443.48) (537.75) (420.23)
Racial/Ethnic Composition
% Asian/Hawaiian 0.06 0.11 0.04 (SD) (0.10) (0.15) (0.08) % African American 0.16 0.06 0.18 (SD) (0.22) (0.09) (0.24) % Hispanic 0.21 0.46 0.16 (SD) (0.25) (0.31) (0.20) % White 0.54 0.33 0.59 (SD) (0.32 (0.30) (0.30) % Other 0.03 0.03 0.03 (SD) (0.06) (0.06) (0.07)
Average Suspension Rate 0.06 0.05 0.06 (SD) (0.09) (0.07) (0.09) Notes: Standard deviations, where applicable, in parentheses. 25 school-year observations have total enrollment data imputed, 175 values were imputed for race/ethnicity, and 1,435 school-year observations have suspension rates capped at 1. Data obtained from Civil Rights Data Collection. All sample sizes (schools, school-year and district observations) rounded to nearest 5.
B.3 Teacher Evaluation and Accountability Policy Reform Data
We draw all data on teacher evaluation and accountability policies from Kraft et al. (2019) and refer our readers to their paper for details on this data collection process
B.4 Concurrent Discipline Policy Change Data
We compile data on concurrent discipline policy changes from the Compendium of School Discipline Laws and Regulations (Bezinque et al., 2018) on whether any state-level policies related to Teacher authority to remove students from the classroom and Limitations, conditions, or exclusions for use of suspension and expulsion were enacted between 2006 and 2018. We identify all relevant statute and regulation for each of these two categories in the online compendium: https://safesupportivelearning.ed.gov/school-discipline-compendium

Evaluation and Discipline 78
We then review each associated section of the state statute/regulation to identify any dates of revisions during the 2006-2018 window. Our default approach is to code any change in policy even minor ones; however, there are some instances when the language of the statute was revised to reflect the renaming of an agency or other minor shift. We exclude these from our reform tallies. We also exclude changes that focused exclusively on discipline policy for students with disabilities. In Table B2, we list the substance of these reforms with direct links to the statute. We code all of these policy changes based on the first fall of the school year under which the policy was implemented. There are six states that include schools in our sample that implemented multiple changes to limit suspension or expulsion (LA, MD, OH, RI, TN and TX). In our main robustness checks, we use the first observed policy change. We also test using the year closest to the implementation of evaluation reforms. Table B2. Content of discipline policy reforms
Tchr auth to
remove Limit
suspension Description
(teacher authority) Description
(limit suspension/expulsion) Alabama
Alaska
Arizona
Arkansas
California 2014 Limits on cause of suspension and age
Colorado 2012 Numerous changes to suspension reasons, disruptions/removal, and requiring that LEAs craft conduct
and discipline codes
Connecticut 2018 2018
"Act Concerning Classroom Safety
and Disruptive Behavior"
"Act Concerning Classroom Safety and Disruptive Behavior" focuses on reducing punitive/exclusionary discipline, which changed policy
around both classroom removal and suspension/exclusion
Delaware 2018 Require LEA discipline reports and
improvement plans (based on restorative justice) for schools
under certain thresholds
Distr. of Columbia 2009 2009; 2018
Outline tiers of behavior for classroom
discipline action and the
accompanying discipline responses
2009: tiers include certain behaviors that cannot result in a
suspension, such as absence ; 2018: limit length of suspension and who
can be suspended
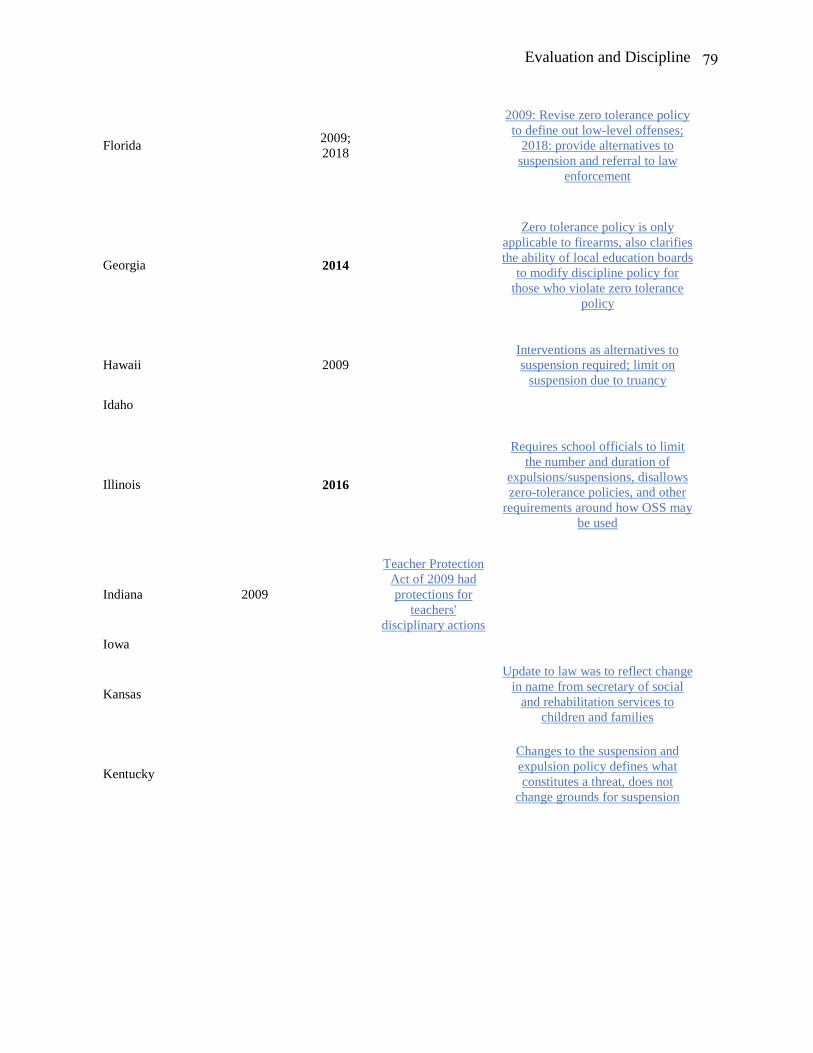
Evaluation and Discipline 79
Florida 2009; 2018
2009: Revise zero tolerance policy to define out low-level offenses;
2018: provide alternatives to suspension and referral to law
enforcement
Georgia 2014
Zero tolerance policy is only applicable to firearms, also clarifies the ability of local education boards
to modify discipline policy for those who violate zero tolerance
policy
Hawaii 2009 Interventions as alternatives to suspension required; limit on
suspension due to truancy
Idaho
Illinois 2016
Requires school officials to limit the number and duration of
expulsions/suspensions, disallows zero-tolerance policies, and other
requirements around how OSS may be used
Indiana 2009
Teacher Protection Act of 2009 had protections for
teachers' disciplinary actions
Iowa
Kansas Update to law was to reflect change
in name from secretary of social and rehabilitation services to
children and families
Kentucky Changes to the suspension and expulsion policy defines what constitutes a threat, does not
change grounds for suspension

Evaluation and Discipline 80
Louisiana 2009
2007; 2008; 2009; 2012; 2015
2009 permits principal to counsel alternatives to class removal; provide
makeup work
Changes in suspension/exclusion policy from 2007-08 increase
penalty for behavioral infractions. 2009: requires makeup work during
suspension; 2012: requires alt education during suspension, adds
provisions for bullying; 2015: prohibits suspension in K-5 for
uniform violation;
Maine
Maryland 2009 2014; 2017
Amend teachers' use of exclusion
2014: Require revisions of local student discipline policies to reflect
a number of elements, including positive behavioral supports,; 2017:
prohibit Prek-2nd grade suspensions/expulsions (w/specific
exceptions)
Massachusetts
Michigan 2017
"Rethink Discipline” law limits expulsion, requires consideration of
alternatives to suspension, sets presumption that suspension longer
than 10 days NOT justified
Minnesota 2016
Add in language that teachers may
"may remove students from class
under section 121A.61,
subdivision 2, for violent or disruptive
conduct."
Mississippi
Missouri
Montana Defines term of expulsion as 20+
days in 2009; requires annual review of policies in 2013, no
substantive changes Nebraska
Nevada 2015 Outlines the circumstances under
which students can be suspended/expelled for different
firearm/weapon incidents
New Hampshire Makes assignments available to students during period suspended

Evaluation and Discipline 81
New Jersey 2012 2016
Harassment, intimidation,
bullying grounds for removal from
classroom
Limited suspension for K-2 students
New Mexico 2009
Revise procedure teachers go through
for detention, suspension and
expulsions.
New York
North Carolina 2011 Changes in who has authority to
assign long-term suspensions and what services/opportunities are
provided to those suspended
North Dakota
Ohio 2017; 2018
2017: cannot be suspended for truancy; 2018: Limiting the use of
out-of-school suspensions and expulsions for pre-K-third graders,
money to support alternative discipline approaches
Oklahoma
Oregon 2014 2014
Revise code to require LEAs to plan for reducing
exclusionary discipline use
Major changes to discipline policy, focused on reducing suspensions
and expulsions
Pennsylvania
Rhode Island 2007; 2009; 2012
2007: Changes to weapons/alcohol policy; 2009: adopt the "1.3 Safe, Healthy, and Supportive Learning Environment" policy ; 2012: Can
no longer suspend students for truancy,
South Carolina
South Dakota 2014
Adds phrase "No local school board may impose a lesser
consequence than those established in § 13-32-9, but a local school district may adopt a policy (…)
with more strict consequences to meet the needs of the district”

Evaluation and Discipline 82
Tennessee
2007; 2008; 2013; 2015; 2018
2007 closed suspension hearing, fight=suspension, defines threat;
2008 discipline data reporting required; 2013 allows for self-
defense, adjusts language around assault of staff leading to suspension; 2015 allows
consequences for off-school ground behavior; 2018 specifies zero
tolerance
Texas 2015 2011; 2017
Lists the campus behavior
coordinator as a person to whom
teachers can send students after
student removal from classroom
2017: Limit grade of suspension for certain infractions, allowance for
positive behavioral programs; 2011: outline what "serious
misbehaviors" warrant expulsion
Utah
Vermont 2011 Allows suspension for off-school events
Virginia 2009; 2018
2009: no suspension for truancy, 2018: limit suspensions for
students grade 3 and below and outline time length limits on long-
term suspensions
Washington 2016 Limits on length of suspension and use of suspension outside explicit
circumstances
West Virginia 2014 Add section on weapon/substance possession procedures
Wisconsin
Wyoming