Embed Size (px)
Citation preview

2010 DOE Hydrogen Program
The Effects of Impurities on Fuel Cell Performance and Durability
May 9, 2011Trent M. Molter, Ph.D.
Associate Research Professor & Business Development OfficerCenter for Clean Energy Engineering
The University of Connecticut
(860) [email protected]
This presentation does not contain any proprietary, confidential, or otherwise restricted information
Project ID FC047

Overview
• Start March 2007• End August 2011• ~90% Complete
• Establish Tolerance to Fuel and System Derived Impurities
• Total Project Funding $2,481,917– DOE Share $1,985,533– Contractor Share $496,384
• Funding for FY10 - $399K• Funding for FY11 - $117K
Timeline
Budget
Barriers
• United Technologies Hamilton Sundstrand – Historical Impurity Data
• FuelCell Energy, Inc. – Impurity Test Support
• UConn C2E2 – Project Management
Partners

Relevance - Objectives• Overall Objective – Develop an Understanding of the Effects
of Various H2 Impurities on Fuel Cell Performance and Durability – Critically Important For Automotive Fuel Quality
• Specific Task Objectives Shown Below
Task Objectives 1.0 Contaminant Identification
• Identify specific contaminants and contaminant families present in both fuel and oxidant streams.
2.0 Analytical Method Development
• Development of analytical methods to study contaminants. • Experimental design of analytical studies. • Novel in situ detection methods.
3.0 Contaminant Studies
• Develop contaminant analytical models that explain these effects. • Establish an understanding of the major contamination-controlled mechanisms that
cause material degradation in PEM cells and stacks under equilibrium and especially dynamic loading conditions
4.0 Contaminant Model Development
• Construct material state change models that quantify that material degradation as a foundation for multiphysics modeling
• Establish the relationship between those mechanisms and models and the loss of PEM performance, especially voltage decay
5.0 Contaminant Model Validation
• Validate contaminant models through single cell experimentation using standardized test protocols.
6.0 Novel Mitigation Technologies
• Develop and validate novel technologies for mitigating the effects of contamination on fuel cell performance.
7.0 Outreach • Conduct outreach activities to disseminate critical data, findings, models, and relationships etc. that describe the effects of certain contaminants on PEM fuel cell performance.

Approach
• Leverage Existing Database From Prior Work– DOE Sponsored Activity
– USFCC Data
– Prior Electrolysis Product Experience
• Focus on Specific Impurities/Concentrations Identified by DOE/Industry/Working Groups
• Use Standardized Test Protocols Where Appropriate to Investigate Impurity Effects
• Develop Empirical Models Based on Our Findings

Project Work Plan/Deliverables
Industrial Experience BaseLaboratory ExperimentationLiterature Review
Contaminant Modeling and Validation
Novel Mitigation Technologies
Outreach& Education
Industrial Experience BaseLaboratory ExperimentationLiterature Review
Contaminant Modeling and Validation
Novel Mitigation Technologies
Outreach& Education
Effects of Impurities
on Fuel Cell Performance and Durability
1.0 Contaminant Identification
2.0 Analytical Method
Development
3.0 ContaminantStudies
4.0 ContaminantModel
Development
5.0 ContaminantModel
Validation
6.0 NovelMitigation
Technologies7.0 Outreach
Effects of Impurities
on Fuel Cell Performance and Durability
1.0 Contaminant Identification
2.0 Analytical Method
Development
3.0 ContaminantStudies
4.0 ContaminantModel
Development
5.0 ContaminantModel
Validation
6.0 NovelMitigation
Technologies7.0 Outreach
Deliverables•Validated Impurity Models•New Mitigation TechnologiesOutreach: Papers, Workshops, Technical Interchange, Etc.

Roles of Participants
United TechnologiesHamilton Sundstrand
Advise on Fate of Contaminants
The University of ConnecticutInstitute for Materials ScienceGas Analyses/Surface Studies
The University of ConnecticutSchool of EngineeringContaminant Testing
Modeling & Mitigation Strategies
FuelCell Energy Inc.Contaminant Identification
Fuel Cell Testing
The Universtiy of ConnecticutConnecticut Global Fuel Cell Center
Program Lead
•Electrolysis Contaminant Experience•Prior Contaminant Studies
•Surface Studies/Equipment•Gas Purity Analyses
•Fuel Cell Testing•Modeling/Transport Expertise•Industry Relationships
•Gas Contaminant Experience•Fuel Cell Test Experience
Critical Assumptions and Issues
• Issues: Impurity Database Not Well Established, More Coordination Between Laboratories Needed, Little Test Standardization
• Approach: Significant Coordination Between Labs Being Established Through DOE and Working Groups. Standardized Protocols, Hardware Configurations Being Established.

Hydrocarbons and Halogenated Compounds
Specification for Draft CD•NMHC/Total HC’s – 2 ppm•Formaldehyde – 10 ppb•Formic Acid – 0.2 ppm•Total Halogenates – 50 ppb
•Methane•Ethane•Ethylene•Acetaldehyde
•Formaldehyde
•Formic Acid
•Chloromethane•Others
Test Strategy•Focus on Molecules That May Be Present in Fuel Stream•Impurity Choices Based on Industry Input and Literature Review•Standardized Hardware•Standardized Test Protocols•Begin With High Levels•If No Effect, Move to Different Impurity•If There is Performance Impact, Reduce Concentration and Test•Outside Validation of Performance

Hardware and Test Definition
Parameter Early Intermediate RecentMembrane Nafion® 212 Nafion® 212 PRIMEA®
Loading (mg/cm2) (A/C) 0.4 / 0.2 0.4 / 0.4 0.1 / 0.4MEA OEM Ion Power Ion Power GoreGDL SGL 10 BB SGL 10 BB SGL 25 BCActive Area (cm2) 25 25 25
Parameter Early Intermediate
Recent
Temperature (°C) (A/Cell/C)
80 / 80 / 80 80 / 80 / 73 80 / 73 / 49
Humidity (%) (A/C) 100 / 100 100 / 75 75 / 25Stoich. (A/C) 1.3 / 2.0 2.0 / 2.0 1.2 / 2.0Flow Rate (A/C) Commensurate with current densityPressure (psig) (A/C) 25 / 25 25 / 25 7 / 7
Cell Hardware Definition
Test Condition Definition

Mixing and Means of Validating Concentrations
Gases and High Vapor Pressure Oxygenated Compoundse.g., Methane, Ethane, Acetaldehyde, Formaldehyde
Non-Gaseous Impuritiese.g., Formic Acid, Acetic Acid, Ethanol, Methanol, Propylene Glycol, Ethylene Glycol
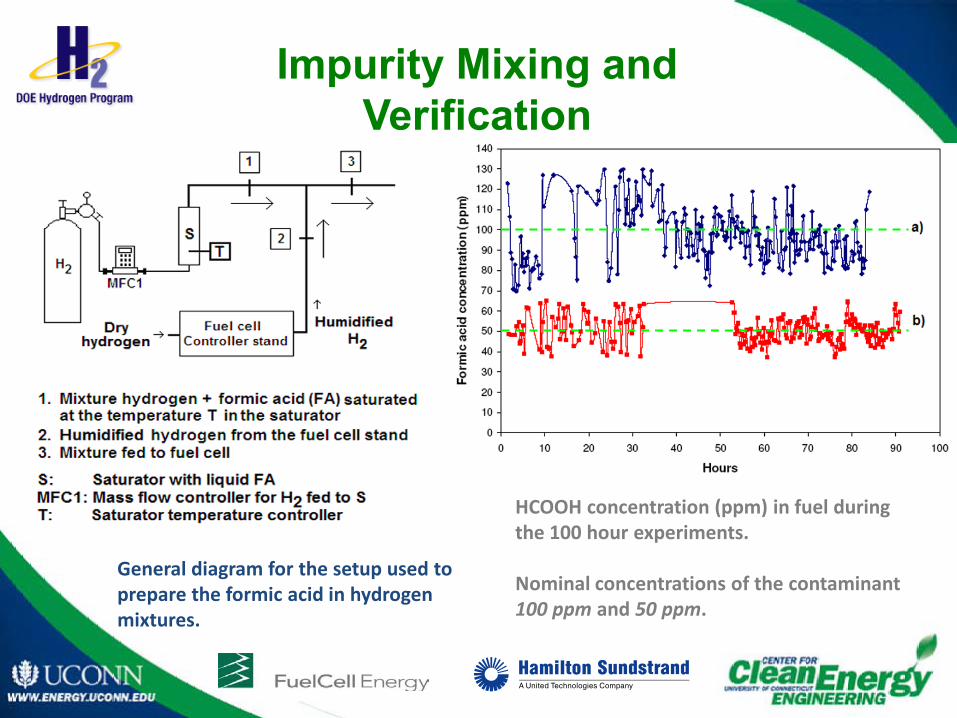
Impurity Mixing and Verification
General diagram for the setup used to prepare the formic acid in hydrogenmixtures.
HCOOH concentration (ppm) in fuel during the 100 hour experiments.
Nominal concentrations of the contaminant 100 ppm and 50 ppm.

Formic Acid (HCOOH) – 100 ppmOperating Conditions
Cell # Impurity Current Density
(mA/cm2)
RH (%)A/C
Cell Temp°C
Back Pressure
Stoich.A/C
35 100 ppm HCOOH 800 100/75 80 25 psig 2.0/2.0
MEA Vendor Membrane Active Area (cm2)
Pt Loading(mg/cm2) A/C
GDL
Ion-power Nafion® 212 25 0.4 / 0.4 SGL 10 BB
Test Procedure1) Fuel Cell conditioning;2) Operate the fuel cell for 100 hrs
with pure H2;3) Recondition the fuel cell when
preparing the impurity mixture;4) Introduce 100 ppm HCOOH and
operate for 100 hrs.
CV and other tests show that HCOOH can cross the membrane and contaminate the cathode. Full recovery of the peaks is not observed; however this may be caused by a combination of coarsening or dissolution of Pt, and more permanent effects of HCOOH contamination.

Formic Acid (HCOOH) – 2 ppm
Operating Conditions
Cell # Impurity Current Density
(mA/cm2)
RH (%)A/C
Cell Temp°C
Back Pressure
Stoich.A/C
48 2 ppm HCOOH 800 100/75 80 25 psig 2.0/2.0
MEA Vendor Membrane Active Area (cm2)
Pt Loading(mg/cm2) A/C
GDL
Gore Gore-Select® 25 0.1/0/4 SGL 25 BC
Test Procedure1) Fuel Cell conditioning;2) Operate the fuel cell for 100 hrs
with pure H2;3) Introduce 2 ppm HCOOH and
operate for 100 hrs.

Formaldehyde (HCHO) – 5 ppm
Operating Conditions
Cell # Impurity Current Density
(mA/cm2)
RH (%)A/C
Cell Temp°C
Back Pressure
Stoich.A/C
54 5 ppm HCHO 800 100/75 80 25 psig 2.0/2.0
MEA Vendor Membrane Active Area (cm2)
Pt Loading(mg/cm2) A/C
GDL
Gore Gore Select 25 0.1 / 0.4 SGL 25 BC
Test Procedure1) Fuel Cell conditioning;2) Operate the fuel cell for 100 hrs
with pure H2;3) Introduce 5 ppm HCHO and
operate for 100 hrs.
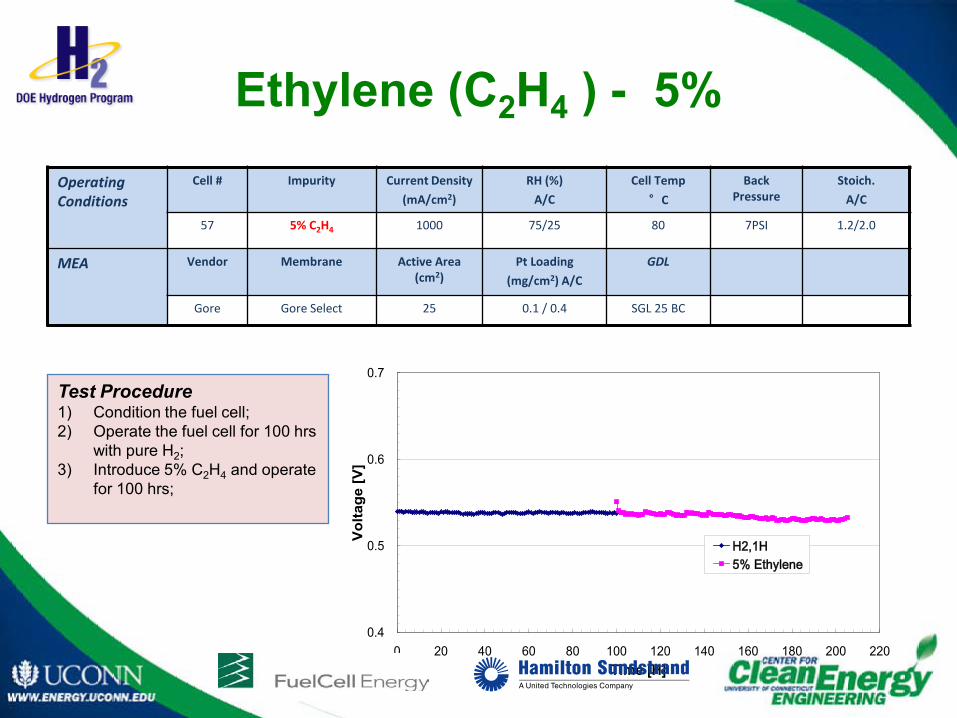
Ethylene (C2H4 ) - 5%Operating Conditions
Cell # Impurity Current Density
(mA/cm2)
RH (%)
A/C
Cell Temp
°C
Back Pressure
Stoich.
A/C
57 5% C2H4 1000 75/25 80 7PSI 1.2/2.0
MEA Vendor Membrane Active Area (cm2)
Pt Loading
(mg/cm2) A/C
GDL
Gore Gore Select 25 0.1 / 0.4 SGL 25 BC
Test Procedure1) Condition the fuel cell;2) Operate the fuel cell for 100 hrs
with pure H2;3) Introduce 5% C2H4 and operate
for 100 hrs;
0.4
0.5
0.6
0.7
0 20 40 60 80 100 120 140 160 180 200 220Time [H]
Vol
tage
[V]
H2,1H5% Ethylene

Acetaldehyde (CH3CHO) – 30 ppm
Operating Conditions
Cell # Impurity Current Density
(mA/cm2)
RH (%)
A/C
Cell Temp
°C
Back Pressure
Stoich.
A/C
57 30 ppm CH3CHO 800 100/75 80 25PSI 2.0/2.0
MEA Vendor Membrane Active Area (cm2)
Pt Loading
(mg/cm2) A/C
GDL
Gore Gore Select 25 0.1 / 0.4 SGL 25 BC
Test Procedure1) Condition the fuel cell;2) Operate the fuel cell for 100 hrs
with pure H2;3) Introduce 30 ppm CH3CHO and
run for 100 hrs;4) Remove 30 ppm CH3CHO and
switch back to H2 for 100 hrs for recovery test.
0.5
0.6
0.7
0.8
0 20 40 60 80 100 120 140 160 180 200 220 240 260 280 300 320
Time [H]
Volta
ge [
V]
H230 PPM, CH3CHOH2, Recovery

Methyl Chloride (CH3Cl) – 1 ppm
Operating Conditions
Cell # Impurity Current Density
(mA/cm2)
RH (%)A/C
Cell Temp°C
Back Pressure
Stoich.A/C
49 1 ppm CH3Cl 800 100/75 80 25 psig 2.0/2.0
MEA Vendor Membrane Active Area (cm2)
Pt Loading(mg/cm2) A/C
GDL
Gore Gore Select 25 0.1 / 0.4 SGL 25 BC
Test Procedure1) Fuel Cell conditioning;2) Operate the fuel cell for 100 hrs
with pure H2;3) Introduce 1 ppm CH3Cl and
operate for 100 hrs.

Methyl Chloride (CH3Cl) – 19 ppm
Operating Conditions
Cell # Impurity Current Density
(mA/cm2)
RH (%)
A/C
Cell Temp
°C
Back Pressure
Stoich.
A/C
52 19 ppm CH3Cl 800 See the figure 80 25 psig 2.0/2.0
MEA Vendor Membrane Active Area (cm2)
Pt Loading
(mg/cm2) A/C
GDL
Gore Gore Select 25 0.1 / 0.4 SGL 25 BC
Test Procedure1) Condition the fuel cell;2) Operate the fuel cell for 100 hrs
with pure H2;3) Introduce 19 ppm CH3Cl and run
for 50 hrs;4) Remove CH3Cl, switch to pure H2
and run another 50 hrs;5) Change RH and run for 75 hrs with
pure H2.6) Introduce 19 ppm CH3Cl again
and run for 100 hrs.

Impurity Test SummaryImpurity Class/Target Tested Concentration Source ResultNMHC/Total Hydrocarbons - 2 ppm Methane 100 ppm UCONN
Methane 1% JARIMethane 5% UCONN/JARIEthane 100 ppm JARIEthane 5% UCONN/JARIEthylene 100 ppm JARIEthylene 5% UCONN/JARI KeyAcetaldehyde 30 ppm UCONN 0 mvBenzene 500 ppm JARI <10 mvBenzene 750 ppm JARI >10 mv Benzene 1000 ppm JARI * Signifies Disagreement in DataToluene 20 ppm HNEIMethanol 500 ppm JARIMethanol 1500 ppm JARIMethanol 2000 ppm JARIMethanol 2500 ppm JARIAcetone 100 ppm JARIAcetone 250 ppm JARIAcetone 400 ppm JARIAcetone 500 ppm JARI
Formaldehyde - 10 ppb Formaldehyde 1 ppm UCONNFormaldehyde 3 ppm JARIFormaldehyde 5 ppm UCONN/JARI *Formaldehyde 10 ppm JARIFormaldehyde 20 ppm JARI
Formic Acid - 0.2 ppm Formic Acid 2 ppm UCONNFormic Acid 10 ppm JARIFormic Acid 20 ppm JARIFormic Acid 50 ppm UCONN/JARIFormic Acid 100 ppm UCONN/JARI *Formic Acid 500 ppm JARIFormic Acid 5% UCONN
Total Halogenates - 50 ppb Methyl Chloride 1 ppm UCONNMethyl Chloride 19 ppm UCONNPerchloroethylene 0.05 ppm SRNLPerchloroethylene 1 ppm SRNLPerchloroethylene 30 ppm SRNL

Gaps in Testing/Data
• Limited Test Conditions/Data Sets for Many of the Tests
• No Long-Term Tests Conducted – Aged Cells
• No Multi-Contaminant Tests Conducted
• Transients Not Examined (e.g., Automotive Load Cycles/Start-Stop)
• Limited Data Set for Halogenates
• Ethylene Data Collected on Poor Performing Cell
• What Happens With Recycle?

Impurity Test Summary
• NMHC/THC Target Met for Alkanes, Alkenes, Alcohols and Ketones
• More Data Needed for Aldehydes/Aromatics
• Formaldehyde Does Not Seem to Be a Problem
• Formic Acid Seems OK at 10X Target
• 50 ppb Target Might be a Problem for Halogenates
Difficult to Make a Broad Judgement on NMHC/THC’s or Total Halogenates
Impurity Class/Target Category Examples Concentration/Result Supports Target? SuggestionNMHC/Total Hydrocarbons - 2 ppm
Alkanes Methane, Ethane 5% YesAlkenes Ethylene 100 ppm YesAldehydes Acetaldehyde 30 ppm No Collect Data at Lower Conc.Alcohols Methanol 500 ppm YesKetones Acetone 100 ppm YesAromatics Benzene, Toluene 20 ppm No Collect Data at Lower Conc.
Formaldehyde - 10 ppb 1 ppm YesFormic Acid - 0.2 ppm 2 ppm YesTotal Halogenates - 50 ppb
Methyl Chloride 19 ppm YesPerchloroethylene 0.05 ppm No Separate Limits

Formic Acid Summary• Effects of HCOOH contamination on PEFC performance are investigated. Significant effect on
cell performance is observed.
• Periodic EIS during contamination shows increased charge transfer and diffusion resistance with contamination time.
• CV scans are performed during non-operating conditions. It is seen that HCOOH can cross-over to the cathode, which results in oxidation peaks at 0.4 V and 0.6 V.
• During the first CV scan, the oxidation peak seen at 0.4 V is completely removed, 0.6 V peak is decreased significantly.
– During cell operation, HCOOH can be oxidized at the cathode, where O2 is present and potentials are high enough.
• Exposure to pure H2 recovers part of the H2 desorption peak.
– No further recovery after first 20 hours.
– Catalyst degradation (unrelated to HCOOH) + any permanent effect of HCOOH
• Separate the contribution of the anode and the cathode is critical to further understand the contamination process.
– Further characterization is underway

Formic Acid Contamination Pathways
23
GC/MS, FT-IR, NMR, GC, Analysis
Schematic-Experimental Setup for HCOOH, CO, CO2 Evaluation (Cathode and/or Anode Side)
GC/MS-MS
- Identification and quantification of possible byproducts
- Monitoring gas evolution during continuous operation
Nuclear Magnetic Resonance, NMR
- Identify different organic compounds in small amounts of liquid samples
Gas Chromatography, GC
- Identification, quantification liquid compounds
FT-IR
- Identification of functional groups of gaseous streams
Formic Acid Mechanistic StudiesExample: Chemical Analysis

Studies of Aromatics
Constant Current of No.69 Cell @1000mA/cm^2
0.4
0.5
0.6
0.7
0 50 100 150 200 250 300 350 400 450
Time [H]
Vol
tage
[V]
H2, Averaged by 1 HourH2, IR Free20 PPM Toluene20 PPM Toluene, IR FreeH2, RecoverH2 Recover, IR FreeToluene, Again, IR Free
Cell Temp: 80CRH A/C: 75%/25%Stoic A/C: 1.2/2Back Pressure: 7PSIG/7PSIG
Perhaps a Very Small IrrecoverablePerformance ImpactIs Noted

Mixtures - Aromatics + CO
Constant Current Test, No74 Cell @1000mA/cm^2
0.4
0.5
0.6
0.7
0.8
0 100 200 300 400 500 600 700 800
Time [H]
Vol
tage
[V]
H2, Averaged By 1 HourH2, IR FreeH2, ContinuedH2, IR Free, Continued10 PPM C7H8+ 1 PPM CO10 PPM C7H8 + 1PPM CO, IR FreeH2, RecoverH2, IR Free, Recover1PPM CO1 PPM CO, IR FreeH2, RecoverH2, IR Free, Recover10PPM C7H8+1PPM CO+10 PPM C6H610PPM C7H8+1PPMCO+10PPMC6H6, IR FreeH2, FinalH2, IR Free, Final
Cell Temp: 80CRH Anode/Cathode: 75%/25%Stoic Flow Anode/Cathode: 1.2/2Back Pressure Anode/Cathode: 7PSIG/7PSIG
An Additive Effect of CO and Benzene is Noted –This May or May Not Be Amplified by the Presence ofToluene

Recent Test Summary Test ID: C2E2MEA: GORE, , Pt Loading A/C: 0.1/0.4 mgPt/ cm2
Cell Hardware: Fuel Cell Technologies Inc.Active Area: 25 cm2 Cell Temperature: 80°C Test Station: Teledyne MEDUSA®
Cell # Lot # Current Density RH (A/C) Flow Rates A/C Back Pressure A/C Contaminant Results
51 GORE 800 mA/cm2 100%/75% 279/664 sccm 25/25 PSIG 100PPM HCOOH Degradation
52 GORE 1000mA/cm2 75%/25% 210/883 sccm 7/7 PSIG 19PPM CH3CL No Degradation
54 GORE 800 mA/cm2 75%/25% 210/883 sccm 7/7 PSIG 5PPM HCHO No Degradation
57 GORE 1000 mA/cm2 75%/25% 210/883 sccm 7/7 PSIG 5% C2H4 No Degradation
64 GORE 1000 mA/cm2 75%/25% 210/883 sccm 7/7 PSIG 1% C2H4 No Degradation
66 GORE 800 mA/cm2 100%/75% 279/664 sccm 25/25 PSIG 30PPM CH3CHO No Degradation
69 GORE 1000 mA/cm2 75%/25% 210/883 sccm 7/7 PSIG 20PPM C7H8 Small Degradation?
71 GORE 1000 mA/cm2 75%/25% 210/883 sccm 7/7 PSIG 30PPM CH3CHO No Degradation
74 GORE 1000 mA/cm2 75%/25% 210/883 sccm 7/7 PSIG10PPM C7H8, 1 PPM CO, 10 PPM C6H6
Degradation Due to CO Amplified By Presence of Benzene
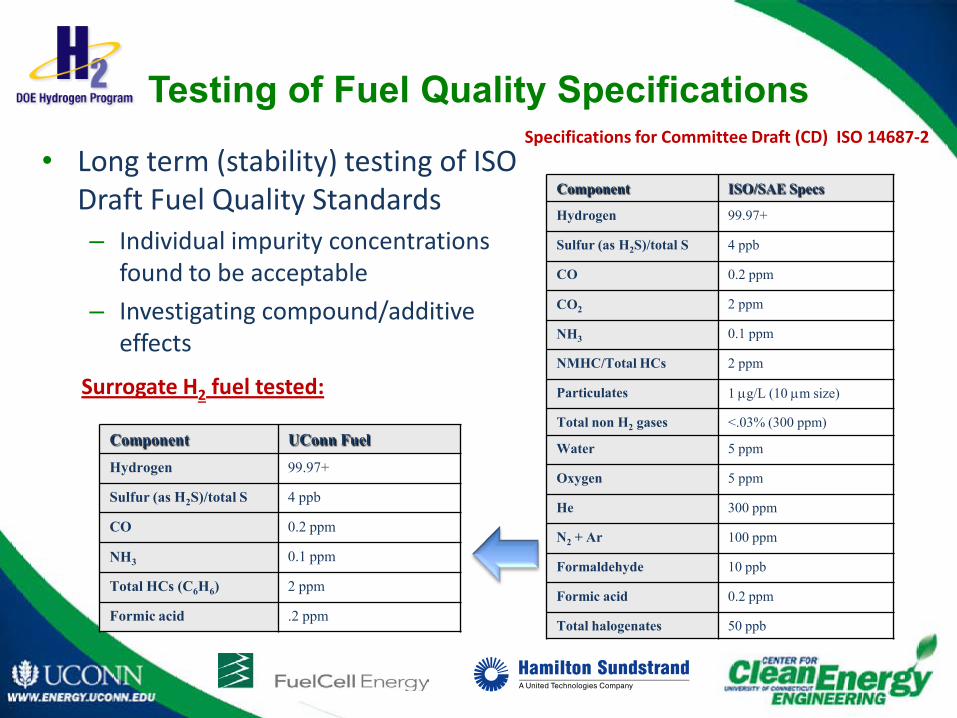
Testing of Fuel Quality Specifications
• Long term (stability) testing of ISO Draft Fuel Quality Standards– Individual impurity concentrations
found to be acceptable
– Investigating compound/additive effects
Component ISO/SAE Specs
Hydrogen 99.97+
Sulfur (as H2S)/total S 4 ppb
CO 0.2 ppm
CO2 2 ppm
NH3 0.1 ppm
NMHC/Total HCs 2 ppm
Particulates 1 µg/L (10 µm size)
Total non H2 gases <.03% (300 ppm)
Water 5 ppm
Oxygen 5 ppm
He 300 ppm
N2 + Ar 100 ppm
Formaldehyde 10 ppb
Formic acid 0.2 ppm
Total halogenates 50 ppb
Specifications for Committee Draft (CD) ISO 14687-2
Surrogate H2 fuel tested:
Component UConn Fuel
Hydrogen 99.97+
Sulfur (as H2S)/total S 4 ppb
CO 0.2 ppm
NH3 0.1 ppm
Total HCs (C6H6) 2 ppm
Formic acid .2 ppm

Impurity Cocktail Test Setup
• Gas Composition Used as an Ersatz for Fuel Quality Specification
• Gas Analyses Conducted at FCE Down to 4 ppb of H2S– SulfInert® Canisters– SKC 245-28
Sample Bags
CO + H2S
(bal. H2)
C6H6 + HCOOH (bal.
H2)
NH3
(bal. H2)
Gas Sampling

Durability Testing• Impurity Cocktail Test
– Carbon Monoxide analysis at ppb level
– Sulfur analysis (H2S and all other sulfur species) at ppb level
– Provided special sample cylinders for H2S analysis (with SulfInertcoating)
• Tested three cells at FCE for up to 2,500 hours at accelerated test condition of 1 A/cm2, to compare performance and evaluate potential long-term effect of contaminants.
Cell characteristics before/after
~700 hrs of testing at FCE
• Outreach: JHQTF, DOE Impurities meetings and program reviews
Sulfur Analysis Report

0
0.1
0.2
0.3
0.4
0.5
0.6
0.7
0.8
78 178 278 378 478 578
Cell
Volta
ge [V
]
Time [hr]
Cell Temp: 80ºCRH A/C: 75% / 25%Back Pressure A/C: 7/7 PSIGStoichiometric Flow Rate : (A/C) 1.2/2
Air Cylinder Change
Pure H2 Surrogate ISO-CD Composition Pure 5x Impurity Conc.
i.e.0.2 ppm CO4 ppb H2S1 ppm NH3
0.2 ppm HCOOH
i.e.1 ppm CO20 ppb H2S5 ppm NH3
1 ppm HCOOH10 ppm C6H6
Impurity Cocktail Testing

Mitigation Techniques
Three Main Categories1. Improved Materials2. Change in Operating Conditions
(T, CD, Stoich, Recycle)3. Processes for Cleaning Up
(External or Internal)
Issues/Concerns• Many Impurities Have Been
Studied Individually – Mitigation Strategy for Individual Impurity May Not be as Effective in Presence of Other Impurities
• Cocktail May Change Poisoning Mechanism/Model
Focus to AddressFormic Acid and Relate to Other Organics

Collaborations
• Collaborated With Hydrogen Quality Working Group on Test Methods, Results, Hardware Configurations, Modeling, Etc.
• Collaboration With ISO Working Group on H2 Quality Standards
• Student Collaboration With Dr. Karren More at ORNL on SEM/TEM Characterization of MEAs
• Continuous Exchange of Data/Personnel/Hardware Amongst our Team

Future Work
Task Milestone Date Year/Quarter 1.0 Contaminant Identification
• Contaminant Identification Review With DOE Sponsor & Industry Focus Group
Y1/Q2
2.0 Analytical Method Development
• Validate Analytical Methods For Studying Contaminants With Ersatz Gases
Y1/Q4
3.0 Contaminant Studies
• Establish an Understanding of the Major Contamination-Controlled Mechanisms that Cause Material Degradation
Y24Q3
4.0 Contaminant Model Development
• Determine the Relationship Between Contaminant Mechanisms and the Loss of PEM Performance, Especially Voltage Decay.
Y4/Q3
5.0 Contaminant Model Validation
• Validate Contamination Models Through Single Cell Experimentation Using Standardized Test Protocols and a DOE Approved Test Matrix
Y4/Q3
6.0 Novel Mitigation Technologies
• Demonstrate Novel Technologies for Mitigating the Effects of Contamination on Fuel Cell Performance
Y4/Q4
7.0 Outreach • Dissemination of Results Through Reports (DOE Approved), Papers and Workshops
Continuous
8.0 Project Management and Reporting
• Program Written Reports and Program Reviews Continuous
Future Activity•Wrap Up Collection of Data on Impurities With Incomplete Data Sets - From Global Test Efforts
•Near ISO Goals for Impurities Showing Effects•Sparse Data Sets•Data Sets Collected With Material Inconsistencies
•Complete Models/Validation – Share Data/Models With Others•Develop Plan and Implement Mitigation Activity•Continue Outreach/Coordination With Other Labs
Q1 Q2 Q3 Q4 Q1 Q2 Q3 Q4 Q1 Q2 Q3 Q4 Q1 Q2 Q3 Q4 Q1 Q2 Q3 Q41.0 Contaminant Identification2.0 Analytical Method Development3.0 Contaminant Studies4.0 Contamination Model Development5.0 Contaminant Model Validation6.0 Novel Mitigation Techniques7.0 Outreach8.0 Project Mgt. and Rptg.
Yr 1 Yr 2 Yr 3 Yr 4 Yr 5

Project Summary
• Relevance - A Deeper Understanding of the Effects of Specific Contaminants on Fuel Cell Performance is Necessary for Successful Commercialization
• Approach - Our Experienced Team Will:– Leverage Existing Knowledge and Will Systematically
Investigate Certain Fuel Contaminants of Interest– Create Empirical and Detailed Analytical Models to Predict the
Fate of Specific Contaminants and Their Effect on Fuel Cell Performance
• Technology Transfer - Data Will Be Shared Through Papers, Workshops, Working Groups, Etc.
• Collaboration – Active Partnership with UTC and FCE, Other Test Labs