Embed Size (px)
Citation preview
The effects of Kenya’s ‘smarter’ input subsidy program
on smallholder behavior and economic well-being: Do different quasi-experimental approaches lead to the same conclusions?
Nicole M. Mason Michigan State University
Department of Agricultural, Food, and Resource Economics [email protected]
Ayala Wineman
Michigan State University Department of Agricultural, Food, and Resource Economics
Lilian Kirimi Egerton University
Tegemeo Institute of Agricultural Policy and Development [email protected]
David Mather
Michigan State University Department of Agricultural, Food, and Resource Economics
Selected Poster prepared for presentation at the 2015 Agricultural & Applied Economics Association and Western Agricultural Economics
Association Joint Annual Meeting, San Francisco, CA, July 26-‐28
Copyright 2015 by Nicole M. Mason, Ayala Wineman, Lilian Kirimi, and David Mather. All rights reserved. Readers
may make verbatim copies of this document for non-commercial purposes by any means, provided that this copyright
notice appears on all such copies.
QUICK DESIGN GUIDE (--THIS SECTION DOES NOT PRINT--)
This PowerPoint 2007 template produces a 48”x96” professional poster. You can use it to create your research poster and save valuable time placing titles, subtitles, text, and graphics. We provide a series of online tutorials that will guide you through the poster design process and answer your poster production questions. To view our template tutorials, go online to PosterPresentations.com and click on HELP DESK. When you are ready to print your poster, go online to PosterPresentations.com.
Need Assistance? Call us at 1.866.649.3004
Object Placeholders
Using the placeholders To add text, click inside a placeholder on the poster and type or paste your text. To move a placeholder, click it once (to select it). Place your cursor on its frame, and your cursor will change to this symbol Click once and drag it to a new location where you can resize it. Section Header placeholder Click and drag this preformatted section header placeholder to the poster area to add another section header. Use section headers to separate topics or concepts within your presentation. Text placeholder Move this preformatted text placeholder to the poster to add a new body of text. Picture placeholder Move this graphic placeholder onto your poster, size it first, and then click it to add a picture to the poster.
RESEARCH POSTER PRESENTATION DESIGN © 2012
www.PosterPresentations.com
QUICK TIPS (--THIS SECTION DOES NOT PRINT--)
This PowerPoint template requires basic PowerPoint (version 2007 or newer) skills. Below is a list of commonly asked questions specific to this template. If you are using an older version of PowerPoint some template features may not work properly.
Template FAQs Verifying the quality of your graphics Go to the VIEW menu and click on ZOOM to set your preferred magnification. This template is at 100% the size of the final poster. All text and graphics will be printed at 100% their size. To see what your poster will look like when printed, set the zoom to 100% and evaluate the quality of all your graphics before you submit your poster for printing. Modifying the layout This template has four different column layouts. Right-click your mouse on the background and click on LAYOUT to see the layout options. The columns in the provided layouts are fixed and cannot be moved but advanced users can modify any layout by going to VIEW and then SLIDE MASTER. Importing text and graphics from external sources TEXT: Paste or type your text into a pre-existing placeholder or drag in a new placeholder from the left side of the template. Move it anywhere as needed. PHOTOS: Drag in a picture placeholder, size it first, click in it and insert a photo from the menu. TABLES: You can copy and paste a table from an external document onto this poster template. To adjust the way the text fits within the cells of a table that has been pasted, right-click on the table, click FORMAT SHAPE then click on TEXT BOX and change the INTERNAL MARGIN values to 0.25. Modifying the color scheme To change the color scheme of this template go to the DESIGN menu and click on COLORS. You can choose from the provided color combinations or create your own.
© 2013 PosterPresenta/ons.com 2117 Fourth Street , Unit C Berkeley CA 94710 [email protected]
Student discounts are available on our Facebook page. Go to PosterPresentations.com and click on the FB icon
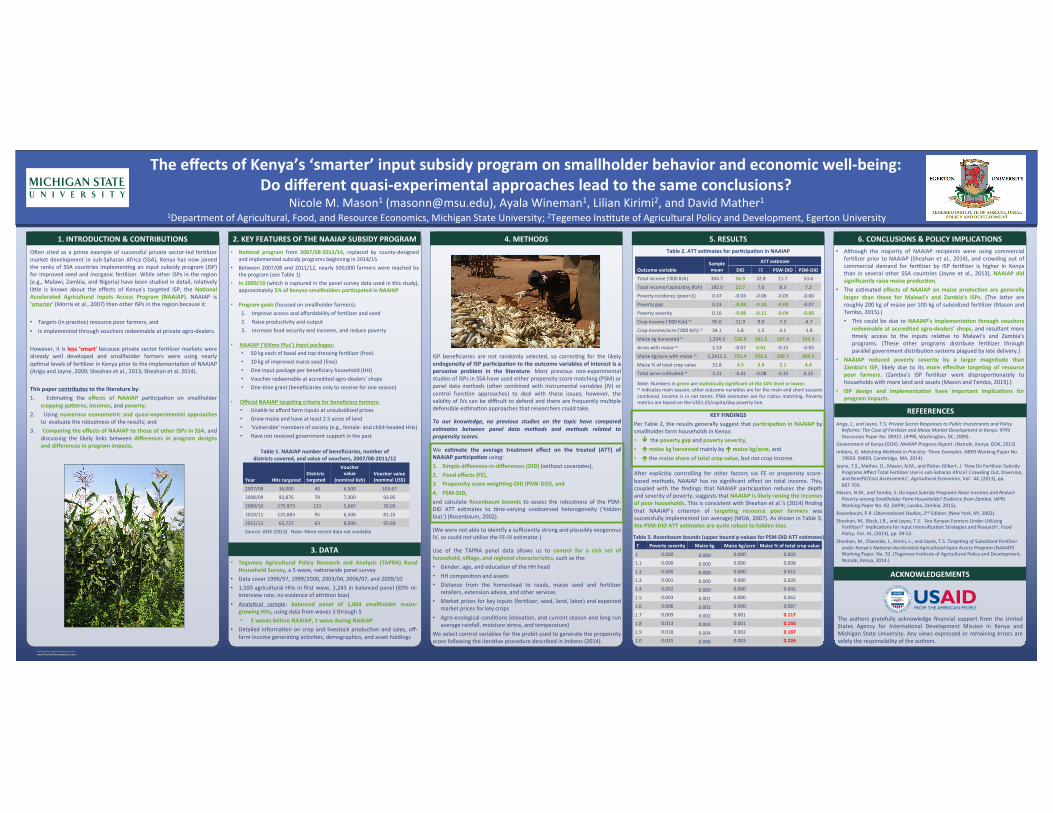
1. INTRODUCTION & CONTRIBUTIONS 2. KEY FEATURES OF THE NAAIAP SUBSIDY PROGRAM ODen cited as a prime example of successful private sector-‐led fer/lizer market development in sub-‐Saharan Africa (SSA), Kenya has now joined the ranks of SSA countries implemen/ng an input subsidy program (ISP) for improved seed and inorganic fer/lizer. While other ISPs in the region (e.g., Malawi, Zambia, and Nigeria) have been studied in detail, rela/vely liXle is known about the effects of Kenya’s targeted ISP, the NaGonal Accelerated Agricultural Inputs Access Program (NAAIAP). NAAIAP is ‘smarter’ (Morris et al., 2007) than other ISPs in the region because it: • Targets (in prac/ce) resource poor farmers, and • Is implemented through vouchers redeemable at private agro-‐dealers. However, it is less ‘smart’ because private sector fer/lizer markets were already well developed and smallholder farmers were using nearly op/mal levels of fer/lizer in Kenya prior to the implementa/on of NAAIAP (Ariga and Jayne, 2009; Sheahan et al., 2013; Sheahan et al. 2014). This paper contributes to the literature by: 1. Es/ma/ng the effects of NAAIAP par/cipa/on on smallholder
cropping paSerns, incomes, and poverty; 2. Using numerous econometric and quasi-‐experimental approaches
to evaluate the robustness of the results; and 3. Comparing the effects of NAAIAP to those of other ISPs in SSA, and
discussing the likely links between differences in program designs and differences in program impacts.
KEY FINDINGS Per Table 2, the results generally suggest that parGcipaGon in NAAIAP by smallholder farm households in Kenya: • ê the poverty gap and poverty severity, • é maize kg harvested mainly by é maize kg/acre, and • é the maize share of total crop value, but not crop income.
ADer explicitly controlling for other factors via FE or propensity score-‐based methods, NAAIAP has no significant effect on total income. This, coupled with the findings that NAAIAP par/cipa/on reduces the depth and severity of poverty, suggests that NAAIAP is likely raising the incomes of poor households. This is consistent with Sheahan et al.’s (2014) finding that NAAIAP’s criterion of targeGng resource poor farmers was successfully implemented (on average) (MOA, 2007). As shown in Table 3, the PSM-‐DID ATT esGmates are quite robust to hidden bias.
4. METHODS 6. CONCLUSIONS & POLICY IMPLICATIONS • Although the majority of NAAIAP recipients were using commercial
fer/lizer prior to NAAIAP (Sheahan et al., 2014), and crowding out of commercial demand for fer/lizer by ISP fer/lizer is higher in Kenya than in several other SSA countries (Jayne et al., 2013), NAAIAP did significantly raise maize producGon.
• The es/mated effects of NAAIAP on maize producGon are generally larger than those for Malawi’s and Zambia’s ISPs. (The laXer are roughly 200 kg of maize per 100 kg of subsidized fer/lizer (Mason and Tembo, 2015).) • This could be due to NAAIAP’s implementaGon through vouchers
redeemable at accredited agro-‐dealers’ shops, and resultant more /mely access to the inputs rela/ve to Malawi’s and Zambia’s programs. (These other programs distribute fer/lizer through parallel government distribu/on systems plagued by late delivery.)
• NAAIAP reduced poverty severity by a larger magnitude than Zambia’s ISP, likely due to its more effecGve targeGng of resource poor farmers. (Zambia’s ISP fer/lizer went dispropor/onately to households with more land and assets (Mason and Tembo, 2015).)
• ISP design and implementaGon have important implicaGons for program impacts.
REFEERENCES Ariga, J., and Jayne, T.S. Private Sector Responses to Public Investments and Policy Reforms: The Case of Fer=lizer and Maize Market Development in Kenya. IFPRI Discussion Paper No. 00921. (IFPRI, Washington, DC, 2009).
Government of Kenya (GOK). NAAIAP Progress Report. (Nairobi, Kenya: GOK, 2013). Imbens, G. Matching Methods in Prac=ce: Three Examples. NBER Working Paper No. 19959. (NBER, Cambridge, MA, 2014).
Jayne, T.S., Mather, D., Mason, N.M., and Ricker-‐Gilbert, J. ‘How Do Fer/lizer Subsidy Programs Affect Total Fer/lizer Use in sub-‐Saharan Africa? Crowding Out, Diversion, and Benefit/Cost Assessments’, Agricultural Economics, Vol. 44, (2013), pp. 687-‐703.
Mason, N.M., and Tembo, S. Do Input Subsidy Programs Raise Incomes and Reduce Poverty among Smallholder Farm Households? Evidence from Zambia. IAPRI Working Paper No. 92. (IAPRI, Lusaka, Zambia, 2015).
Rosenbaum, P.R. Observa=onal Studies, 2nd Edi=on. (New York, NY, 2002). Sheahan, M., Black, J.R., and Jayne, T.S. ‘Are Kenyan Farmers Under-‐U/lizing Fer/lizer? Implica/ons for Input Intensifica/on Strategies and Research’, Food Policy, Vol. 41, (2013), pp. 39-‐52.
Sheahan, M., Olwande, J., Kirimi, L., and Jayne, T.S. Targe=ng of Subsidized Fer=lizer under Kenya’s Na=onal Accelerated Agricultural Input Access Program (NAAIAP). Working Paper. No. 52. (Tegemeo Ins/tute of Agricultural Policy and Development, Nairobi, Kenya, 2014.)
ACKNOWLEDGEMENTS
• NaGonal program from 2007/08-‐2013/14, replaced by county-‐designed and implemented subsidy programs beginning in 2014/15
• Between 2007/08 and 2011/12, nearly 500,000 farmers were reached by the program (see Table 1)
• In 2009/10 (which is captured in the panel survey data used in this study), approximately 5% of Kenyan smallholders parGcipated in NAAIAP
• Program goals (focused on smallholder farmers): 1. Improve access and affordability of fer/lizer and seed 2. Raise produc/vity and output 3. Increase food security and incomes, and reduce poverty
• NAAIAP (‘Kilimo Plus’) input packages: • 50 kg each of basal and top dressing fer/lizer (free) • 10 kg of improved maize seed (free) • One input package per beneficiary household (HH) • Voucher redeemable at accredited agro-‐dealers’ shops • One-‐/me grant (beneficiaries only to receive for one season)
• Official NAAIAP targeGng criteria for beneficiary farmers: • Unable to afford farm inputs at unsubsidized prices • Grow maize and have at least 2.5 acres of land • ‘Vulnerable’ members of society (e.g., female-‐ and child-‐headed HHs) • Have not received government support in the past
0
1
2
3
4
5
6
Category 1
Category 2
Category 3
Category 4
Series 1
Series 2
Series 3
5. RESULTS
Nicole M. Mason1 ([email protected]), Ayala Wineman1, Lilian Kirimi2, and David Mather1 1Department of Agricultural, Food, and Resource Economics, Michigan State University; 2Tegemeo Ins/tute of Agricultural Policy and Development, Egerton University
The effects of Kenya’s ‘smarter’ input subsidy program on smallholder behavior and economic well-‐being: Do different quasi-‐experimental approaches lead to the same conclusions?
Outcome variable Sample mean
ATT esGmate
DID FE PSW-‐DID PSM-‐DID
Total income (‘000 Ksh) 304.7 56.9 32.8 21.7 53.6
Total income/capita/day (Ksh) 182.0 22.7 7.0 8.3 7.2
Poverty incidence (poor=1) 0.47 -‐0.04 -‐0.06 -‐0.05 -‐0.00
Poverty gap 0.23 -‐0.08 -‐0.10 -‐0.04 -‐0.07
Poverty severity 0.16 -‐0.08 -‐0.11 -‐0.04 -‐0.09
Crop income (‘000 Ksh) m 95.6 11.9 9.0 7.3 -‐4.7
Crop income/acre (‘000 Ksh) m 34.1 5.8 1.5 4.1 -‐1.8
Maize kg harvested m 1,334.3 520.6 361.2 187.4 533.4
Acres with maize m 1.53 -‐0.07 0.41 -‐0.15 -‐0.03
Maize kg/acre with maize m 1,2411.1 721.4 556.2 298.7 684.5
Maize % of total crop value 31.8 4.5 3.9 2.1 4.4
Total acres cul/vated m 3.21 -‐0.41 -‐0.08 -‐0.35 0.15
The authors gratefully acknowledge financial support from the United States Agency for Interna/onal Development Mission in Kenya and Michigan State University. Any views expressed or remaining errors are solely the responsibility of the authors.
Note: Numbers in green are staGsGcally significant at the 10% level or lower. m indicates main season; other outcome variables are for the main and short seasons combined. Income is in net terms. PSM es/mates are for radius matching. Poverty metrics are based on the US$1.25/capita/day poverty line.
Year HHs targeted Districts targeted
Voucher value
(nominal Ksh) Voucher value (nominal US$)
2007/08 36,000 40 6,500 103.67
2008/09 92,876 70 7,300 93.95
2009/10 175,973 131 5,687 76.03
2010/11 125,883 95 6,500 81.25
2011/12 63,737 63 8,000 95.69
Table 1. NAAIAP number of beneficiaries, number of districts covered, and value of vouchers, 2007/08-‐2011/12
Source: GOK (2013). Note: More recent data not available
3. DATA • Tegemeo Agricultural Policy Research and Analysis (TAPRA) Rural
Household Survey, a 5-‐wave, na/onwide panel survey • Data cover 1996/97, 1999/2000, 2003/04, 2006/07, and 2009/10 • 1,500 agricultural HHs in first wave, 1,243 in balanced panel (83% re-‐
interview rate; no evidence of aXri/on bias) • Analy/cal sample: balanced panel of 1,064 smallholder maize-‐
growing HHs, using data from waves 3 through 5 • 2 waves before NAAIAP, 1 wave during NAAIAP
• Detailed informa/on on crop and livestock produc/on and sales, off-‐farm income genera/ng ac/vi/es, demographics, and asset holdings
Table 2. ATT esGmates for parGcipaGon in NAAIAP
ISP beneficiaries are not randomly selected, so correc/ng for the likely endogeneity of ISP parGcipaGon to the outcome variables of interest is a pervasive problem in the literature. Most previous non-‐experimental studies of ISPs in SSA have used either propensity score matching (PSM) or panel data methods (oDen combined with instrumental variables (IV) or control func/on approaches) to deal with these issues; however, the validity of IVs can be difficult to defend and there are frequently mul/ple defensible es/ma/on approaches that researchers could take.
To our knowledge, no previous studies on the topic have compared es7mates between panel data methods and methods related to propensity scores.
We esGmate the average treatment effect on the treated (ATT) of NAAIAP parGcipaGon using: 1. Simple difference-‐in-‐differences (DID) (without covariates), 2. Fixed effects (FE), 3. Propensity score weighGng-‐DID (PSW-‐DID), and 4. PSM-‐DID, and calculate Rosenbaum bounds to assess the robustness of the PSM-‐DID ATT es/mates to /me-‐varying unobserved heterogeneity (‘hidden bias’) (Rosenbaum, 2002).
(We were not able to iden/fy a sufficiently strong and plausibly exogenous IV, so could not u/lize the FE-‐IV es/mator.)
Use of the TAPRA panel data allows us to control for a rich set of household, village, and regional characterisGcs, such as the: • Gender, age, and educa/on of the HH head • HH composi/on and assets • Distance from the homestead to roads, maize seed and fer/lizer
retailers, extension advice, and other services • Market prices for key inputs (fer/lizer, seed, land, labor) and expected
market prices for key crops • Agro-‐ecological condi/ons (eleva/on, and current season and long-‐run
average rainfall, moisture stress, and temperature) We select control variables for the probit used to generate the propensity score following the itera/ve procedure described in Imbens (2014).
Γ Poverty severity Maize kg Maize kg/acre Maize % of total crop value
1 0.000 0.000 0.000 0.003
1.1 0.000 0.000 0.000 0.008
1.2 0.000 0.000 0.000 0.015
1.3 0.001 0.000 0.000 0.026
1.4 0.002 0.000 0.000 0.042
1.5 0.003 0.001 0.000 0.062
1.6 0.006 0.001 0.000 0.087
1.7 0.009 0.002 0.001 0.117
1.8 0.013 0.003 0.001 0.150
1.9 0.018 0.004 0.002 0.187
2.0 0.025 0.006 0.003 0.226
Table 3. Rosenbaum bounds (upper bound p-‐values for PSM-‐DID ATT esGmates)