Embed Size (px)
Citation preview
The Effects of Leader-Member Exchange and Employee Wellbeing towards Employee Turnover
Intention
by
Kalsom Ali
B.Sc. Human Resource Development
M.Sc. Human Resource Development
Submitted in fulfilment of the requirements for the degree of
Doctor of Philosophy
Deakin University
June, 2014

iv
Dedication
I dedicate this thesis especially to my mother, Khatijah Salim
and those listed in the acknowledgement for their contributions
throughout the process and the development of this research.
v
Acknowledgements
All thankfulness and gratefulness be to Allah who guided and assisted me to
complete this study.
This journey has been a very humbling experience. Without support, wisdom and
guidance offered by people around me, I would not have completed this work. It
is a privilege to thank the people who were critical to the completion of this thesis.
I must reserve special gratitude for my supervisor, Dr John McWilliams for his
faith in my capacity to undertake this research. His constant guidance, assistance,
patience and support have been very important factors in the completion of this
thesis. My special thanks also goes to his partner Taraia for all her support and
concern. I’m blessed to get to know her.
My deepest appreciation is extended to my late father, Ali Mahmud. His spirit and
love towards knowledge is the strength to my success. I am most grateful to my
mother, Khatijah Salim for her undivided love, prayers and endless moral support
throughout my journey. My profound thanks also go to my relatives and big
family; my brothers, sisters, brothers-in-law, sisters-in-law and my nieces and
nephews. I will forever be grateful for the prayers and encouragement they gave
me this past 3 years.
Very special thank to the DGBS Head of Research; Dr John Hall, the Director of
Post Graduate Education, Swinburne University; Dr Julian Vieceli and Program
Director of Deakin Graduate School of Business; Dr Nichola Robertson for their
time reviewing my writing and for the advice. Their availability and willingness
to lend their hands meant a lot to me.
I would like to thank the Government of Malaysia for granting the scholarship
which enabled me to pursue my PhD study at Deakin Graduate School of
Business in Melbourne Australia.

vi
I would also like to acknowledge Faculty of Business and Law for funding my
data collection and thesis editing process. To all the support staff, thank you so
much for your assistance.
In particular, a big thanks to Associate Professor Kamarudin Kasim; the Director
General of Community College (2009-2012) for granting me permission to collect
data among his academic staffs. Special thanks also to the respondents for their
keen responses which provide me with important insights on the workplace
practice.
On a personal note, I would like to thank my friends in Malaysia and Australia
specially Kak Azni, Azim, Fida, Gira, Suaida, Gee and my colleagues from
Faculty of Business and Law; Zaheed, Kak Aina, Thuto, Sajad, Rajesh, Mansour,
Becs, Sera, MD, June and many more that I couldn’t list here whom I have shared
laughter, excitement and some very stressful and agonising moment of my PhD. I
will be always indebted to my best friend; Siti Fadilah Ali. Without her happiness
and kindness that she brings to my life, this venture would not have been realized.
Special thanks also go to Nurul Faisya Ishak whom makes my dreams possible.
vii
Contents
DEAKIN UNIVERSITY ACCESS TO THESIS - A ............................................. ii
Dedication .............................................................................................................. iv
Acknowledgements ................................................................................................. v
Contents ................................................................................................................. vii
List of Figures ........................................................................................................ xi
List of Tables ......................................................................................................... xii
List of Abbreviations ............................................................................................ xiii
Abstract ................................................................................................................ xiv
CHAPTER 1 INTRODUCTION
1.1 Background .................................................................................................. 1
1.1.1 Overview of Turnover .............................................................................. 1
1.1.2 The Decision to Stay or to Go .................................................................. 3
1.1.3 Turnover among Academicians in Malaysia ............................................ 8
1.2 Statement of the Problem ........................................................................... 11
1.3 Purpose of the Present Research ................................................................ 13
1.4 Research Question ...................................................................................... 14
1.5 Significance of the Study ........................................................................... 18
1.6 Research Outline ........................................................................................ 20
1.7 Conclusion .................................................................................................. 21
CHAPTER 2 LITERATURE REVIEW
2.1 Substitution of Turnover Intention on Actual Turnover ............................ 22
2.1.1 Reasons for Leaving: Psychological ....................................................... 24
2.2 Turnover Antecedents ................................................................................ 27
viii
2.2.1 Push Factors ............................................................................................ 27
2.2.1.1 Job Satisfaction ................................................................................... 27
2.2.2 Pull Factor ............................................................................................... 30
2.2.3 Personal Factor ....................................................................................... 31
2.3 Cost of Turnover as the Major Effect ......................................................... 32
2.4 Element in Turnover Model ....................................................................... 34
2.5 Leader-member Exchange (LMX) ............................................................. 37
2.5.1 Concept of LMX ..................................................................................... 37
2.5.2 Measurement and Dimensionality of the LMX Construct ..................... 40
2.6 The Importance of LMX in Employee Turnover Intention ........................ 41
2.7 The Concept of Employee Wellbeing (EWB) ............................................ 43
2.8 The Scope of Measurement ........................................................................ 46
2.8.1 Effect of Job Satisfaction on Employee Wellbeing ................................ 48
2.8.2 Effect on Life Satisfaction towards Employee Wellbeing ..................... 50
2.8.3 Effect on Work Stress towards Employee Wellbeing ............................ 51
2.8.4 Effect of Change at Workplace on Employee Wellbeing ....................... 53
2.8.5 Effect of Job Embeddeness on Employee Wellbeing ............................. 55
2.9 Theoretical Framework .............................................................................. 56
2.10 Conclusion .................................................................................................. 58
CHAPTER 3 RESEARCH METHODOLOGY
3.1 Introduction ................................................................................................ 59
3.2 Research Design ......................................................................................... 59
3.3 Population and Sampling ............................................................................ 60
3.4 Instrumentation ........................................................................................... 62
3.5 Data Collection Procedure .......................................................................... 73
ix
3.6 Data Analysis ............................................................................................. 73
3.7 Conclusion .................................................................................................. 74
CHAPTER 4 DATA ANALYSIS AND RESULTS
4.1 Introduction ................................................................................................ 75
4.2 Model Refinement Process ......................................................................... 75
4.2.1 Reliability ............................................................................................... 76
4.2.2 Confirmatory Factor Analysis (CFA) ..................................................... 77
4.2.2.1 Construct Validity ............................................................................... 79
4.2.2.2 Assessment of Measurement Models .................................................. 79
4.2.2.2.1 Goodness-of-fit Measurement Models ................................................ 79
4.2.2.2.2 Bootstrapping Approach ..................................................................... 83
4.2.2.2.3 Measurement Model Respecification .................................................. 83
4.2.2.2.4 Parameter Estimates ............................................................................ 85
4.2.2.3 Convergent Validity ........................................................................... 86
4.2.3 Discriminant Validity ............................................................................. 87
4.3 Data Screening ........................................................................................... 88
4.3.1 Missing Values ....................................................................................... 88
4.3.2 Outliers and Normality ........................................................................... 91
4.4 Sample Size ................................................................................................ 97
4.4.1 Sample Demographics ............................................................................ 99
4.5 Confirmatory Factor Analysis for Turnover Intention ............................. 101
4.6 Confirmatory Factor Analysis for LMX .................................................. 104
4.7 Confirmatory Factor Analysis for Employee Wellbeing ......................... 107
4.8 Specification of Structural Model ............................................................ 115
4.9 Summary .................................................................................................. 122
x
4.10 Conclusion ................................................................................................ 125
CHAPTER 5 DISCUSSION, RECOMMENDATIONS AND CONCLUSION
5.1 Introduction .............................................................................................. 126
5.2 Background Context ................................................................................ 127
5.3 Discussion of Findings ............................................................................. 129
5.3.1 Influence of LMX towards Employees’ Intention to Turnover ............ 132
5.3.2 Influence of LMX on Employee Wellbeing ......................................... 135
5.3.3 Influence of Employee Wellbeing on Employees’ Turnover Intention 136
5.3.4 Employee Wellbeing as Partially Mediate the relationship between
LMX and Turnover Intentions. ............................................................ 137
5.4 Strengths of the Research ......................................................................... 140
5.5 Implications of the Study ......................................................................... 141
5.5.1 Theoretical Implications ....................................................................... 141
5.5.2 Managerial Implications ....................................................................... 142
5.6 Limitations ............................................................................................... 144
5.7 Recommendation ...................................................................................... 146
5.8 Summary .................................................................................................. 147
5.9 Conclusion ................................................................................................ 150
Reference ............................................................................................................. 153
APPENDIX A: .................................................................................................... 189
ETHICS APPROVAL ......................................................................................... 190
APPENDIX B: .................................................................................................... 191
QUESTIONNAIRE (ENGLISH AND BAHASA MALAYSIA VERSION) .... 192
xi
List of Figures
Figure 2.1: A Model of the Employee Turnover Decision Process ...................... 36
Figure 2.2: Domains of Leadership ....................................................................... 38
Figure 2.3: Feelings and Location within the Affect Circumplex ......................... 45
Figure 2.4: Three Axes for the Measurement of Wellbeing .................................. 48
Figure 2.5: Framework for Organizational Change and Development ................. 54
Figure 2.6: Theoretical Framework ....................................................................... 57
Figure 3.1: Demographic Information ................................................................... 64
Figure 3.2: Turnover Intention .............................................................................. 66
Figure 3.3: Leader-Member Exchange (LMX) ..................................................... 67
Figure 3.4: Work Stress ......................................................................................... 68
Figure 3.5: Organizational Change ....................................................................... 69
Figure 3.6: Personal Wellbeing Index ................................................................... 71
Figure 3.7: Job Embeddedness .............................................................................. 72
Figure 4.1: Illustration of Boxplot for Item WS3 .................................................. 92
Figure 4.2: Illustration of Normal Probability Plot Based on Item ....................... 93
Figure 4.3: Illustration of Normal Probability Plot Based on Mean of All Items . 93
Figure 4.4: Turnover Intention Construct ............................................................ 101
Figure 4.5: Leader-member Exchange Constructs .............................................. 104
Figure 4.6: Employee Wellbeing Construct ........................................................ 111
Figure 4.7: Structural Equation Model ................................................................ 117
xii
List of Tables
Table 4.1: Model Refinement Process .................................................................. 76
Table 4.2: Goodness of Fit Statistics and Acceptable Cut-off Criteria…………..82
Table 4.3: Assessment of Normality ..................................................................... 95
Table 4.4: Survey Response Rate .......................................................................... 97
Table 4.5: Demographic Profile .......................................................................... 100
Table 4.6: Fit Indices for Turnover Intention ...................................................... 102
Table 4.7: Standardized Measurement Coefficients for Turnover Intention ....... 103
Table 4.8: Discriminant Validity for Turnover Intention .................................... 103
Table 4.9: Fit Indies for LMX ............................................................................. 106
Table 4.10: Standardized Measurement Coefficients for LMX .......................... 106
Table 4.11: Discriminant Validity for LMX ....................................................... 107
Table 4.12: Fit Indices for Employee Wellbeing ................................................ 112
Table 4.13: Standardized Measurement Coefficients for Employee Wellbeing . 113
Table 4.14: Discriminant Validity for Employee Wellbeing .............................. 114
Table 4.15: Fit Indices for Structural Model ....................................................... 118
Table 4.16: Parameter Estimates for Structural Model ....................................... 121
Table 4.17: Summary of Hypotheses Tests ......................................................... 123
Table 4.18: Mediation Analysis ...........................................................................123
xiii
List of Abbreviations
AGFI Adjusted Goodness of Fit Index
AMOS Analysis of Moment Structure
AVE Average Variance Extracted
CFA Confirmatory Factor Analysis
CFI Comparative Fit Index
CMIN Normed Chi-Square over Degree of Freedom
CR Critical Ratio
EFA Exploratory Factor Analysis
GFI Goodness of Fit Index
JDI Job Descriptive Index
LMX Leader-member Exchange
MAR Missing at Random
MCAR Missing Completely at Random
MOHE Ministry of Higher Education
NNFI Non-Normed Fit Index
RMSEA Root Mean Square Error of Approximation
SEM Structural Equation Modeling
SLI Staying and Leaving Index
SPSS Statistical Package for Social Sciences
SRMR Standardized Root Mean Square Residual
xiv
Abstract
Turnover intention is a phenomenon that consists of psychological, cognitive and
behavioural components. The employees decision whether to stay or to leave the
organization is perceived as having negative consequences for the operations of
the organization. It is a state of conflict, which happens across industries. Over the
decades, previous researchers have found a range of individual and organizational
factors, influencing the intention to quit the workplace. However, the influence of
employee wellbeing has not being fully explored. In addition, there has been little
attention paid to the role that leader-member exchange (LMX) might play in
relation to employee wellbeing and intention to leave the organisation.
The present study investigates the role of employee wellbeing in the relationship
of LMX and turnover intention. Data for this study were collected from
academicians working at the community colleges located in Peninsular Malaysia.
The data were analysed using structural equation modelling (SEM). A theoretical
model of both direct and indirect effects between the involved factors was tested
and examined.
The results indicate that employee wellbeing is partially mediated by the
association of LMX and turnover intention. Further, it established a direct effect
between LMX and turnover intention whiles the other intervening factor;
employee wellbeing, had both indirect relationships with both LMX and turnover
intention. Result on path analysis shows that LMX significantly predicts turnover
intention. Nevertheless, results of mediation analysis revealed that the relationship
xv
between LMX and turnover intention decreases when factor on employee
wellbeing is amended.
Overall, the findings of this study extend the existing understanding of the factors
that influence turnover intention among employee in organization. These factors
received considerably significant from employees and organizational perspectives.
The findings suggest management interventions to reduce voluntary turnover
either individual or collective turnover.
1
INTRODUCTION
CHAPTER 1
1.1 Background
1.1.1 Overview of Turnover
Employee turnover is one of the most widely researched topics in management
(Chou 2006). The reasons why employees leave organizations abound (Muchinsky
& Morrow 1980). Some can be classified as beyond the control of management.
Organizations need to identify those factors over which they do have some control
and address them (Holtom, Mitchell, Lee & Inderrieden 2005).
Turnover may be voluntary or involuntary. Voluntary turnover is an act that reflects
employee’s decision to leave the organization while involuntary turnover reflects an
employer’s decision to terminate the employment relationship (Shaw, Delery &
Gupta 1998). Study by most authors agree that both categories; voluntary and
involuntary turnovers have similar costs to the organisation (Dalton, Todor &
Krackhardt 1982). In the case of involuntary turnover, the decision maker should be
concerned with who to dismiss to secure long term organizational effectiveness
(Barrick, Mount & Strauss 1994). The management challenge is to keep the people
who keep them in business (Branham 2001).
2
Voluntary turnover can be a serious obstacle to productivity, quality and
profitability (Staw 1980; Van Dick, Christ, Stellmacher, Wagner, Ahlswede,
Grubba, Hauptmeier, Hoehfeld, Moltzen & Tissington 2004). It can reduce
efficiency because human assets and resources are difficult to replicate (Pfeffer,
Hatano & Santainen 2005). Generally voluntary turnover has negative
consequences for organization (Bartunek, Zhi Huang & Walsh 2008; Dalton &
Todor 1982; Johnston & Futrell 1989). It can create instability (Wasmuth & Davis
1983) and the high rates create hiring and training costs. Further, there is loss of
knowledge, reduced service capacity and increase in faulty decision making
(Balfour & Neff 1993). Disruption is common, projects stagnate, various activities
within the organisation are interrupted and the new employees who replace the old
experienced ones make a lot of mistakes until the replacements are trained (Cascio
2006; Roseman 1981). Effects on cost towards turnover are further discussed in
Chapter 2.
Turnover is most important in organizations that depend on human capital e.g. the
education sector. In this sector, a persistent loss in human capital leads to threat to
the nucleus such as knowledge and culture of that institution (Rosser 2004). A
number of researchers have argued that retaining the human resource is a major
management problem (Staw 1980; Sveiby 1997; Van Dick et al. 2004). For
example, a case study among four and five-star hotels reveals that the hospitality
sector generally regards high turnover as part of the work-group norm that has wide
cost ramifications (Davidson, Timo & Ying 2010). In the health industry a high
level of turnover among the nurses is of immense concern today; that puts the
community in danger of losing much needed health-care facilities (Mobley 1982).
3
According to Eagleson & Waldersee (2000), an organization in some industries can
function even though the turnover is as high as 67 per cent. Rates of turnover can
vary considerably but will always affect quality of the product and capacity of
productivity within the organization (Jiang, Baker & Frazier 2009). Generally,
turnover can be dysfunctional where the organisation loses its above average, or
otherwise valued performers (Steed & Shinnar 2004).
However, Price and Muller (1981) have a different view where they believed if
turnover reaches to be around 50 per cent of the organization’s net effect on
productivity; it is likely to be positive. In some situations, turnover can be
beneficial. For example, it encourage the infusion of knowledge and ideas and
stimulation of policy changes (Hayes, O'Brien-Pallas, Duffield, Shamian Buchan &
Hughes 2006). In work that involves stress and emotional burnout; employees who
stay longer than 18 months are usually not efficient; hence turnover may be
functional (Eagleson & Waldersee 2000). More research on the aggregate affect of
turnover is needed (Jones & Gates 2007).
1.1.2 The Decision to Stay or to Go
Wide-ranging factors, intrinsic and extrinsic have a bearing on an employee’s
decision to quit their job (Mano-Negrin & Kirschenbaum 1999). Researchers have
suggested that the ‘decision to leave’ and an individual’s ‘propensity to leave’ are
two related but different things (Johnston & Futrell 1989). ‘Propensity to leave’ is a
characteristic of outperformers. An outperformer is defined as an individual who
has surpassed others in terms of outcome and performance (Pheko 2013). A
4
collection of 24 quantitative studies has indicated that the outperformers or poor
performers are more likely to leave an organization than good performers (McEvoy
& Cascio 1987).
Intention to stay or leave depends on a multiplicity of factors which influence the
desirability and ease of movement (March & Simon 1958). Turnover researchers
have primarily focused on ‘perceived desirability of movement’ as evidenced by
measures of employee job satisfaction and typically conceived ‘ease-of-movement
criteria’ as job search behavior (Mobley 1977). People may decide to quit a job
because of push factors; associated with the nature of their organizational life,
which make remaining in the job intolerable (McBey & Karakowsky 2001).
Alternatively, they may quit because of pull factors when more attractive
alternatives are offered by other organizations (Mano-Negrin & Kirschenbaum
1999). If evaluation leads individuals to believe that the current job is worse than
the alternatives that have emerged or are likely to emerge this will create an
increased propensity to quit (Mitchell, Holtom, Lee & Graske 2001). Further
discussion of this factor is provided in Chapter 2.
Wright and Bonett (2007) found that job satisfaction was most strongly related to
turnover when employee wellbeing was low. According to the World Health
Organization (WHO) report in 1987, 75 per cent of people who consulted
psychiatrists did so because of problems linked to job dissatisfaction or the inability
to relax (Dollard & Winefield 1996). The United States National Occupational
Health and Safety Commission (NOHSC) 1991 reports recognized psychological
strain as a disease namely, neurosis, personality disorders, and alcohol and drug
5
dependency were all considered under the category of job stress related health
problems (Dollard & Winefield 1996). When stressors occur, employees are
reported to be unhappy with their current job (March & Simon 1958).
The ability to balance workplace and personal needs is perceived as an important
issue among employees globally (Mohd Noor 2011) and effectively predicts
turnover intention (Nicolle 2004). The balance between work and life is a key
factor in the individual’s decision to quit a job (Mardanov, Heischmidt & Henson
2008; Caproni 1997; Mood Noor 2011). For example, Ahuja, Chudoba, Kacmar,
McKnight and George (2007) reported stress among IT professionals who must
travel to and from client’s work-site thus reducing family time. The elimination of
long and nonstandard workhours together with greater allocation of personal time,
resolves the employee’s health related issues and social rhythms (Albertsen,
Rafnsdottir, Grismo, Tomasson & Kauppinen 2008).
Turnover may be a consequence of poor supervision, poor working environment
and inadequate compensation (Hinkin & Tracey 2000). Employees tend to leave
when their career opportunity with the current organization seems closed (Mitchell
et al. 2001). Studies in the healthcare industry indicate that age, tenure, job
satisfaction, organisational commitment, perceived job possibilities and supervisors
behaviour are the reasons of quitting (Hayes et al. 2006). Stress resulting from
staffing shortages, leadership style, supervisory relations, advancement
opportunities and inflexible administrative policies are highly associated with
employee turnover (Estryn-Behar, Fry & Hasselhorn 2010). Keeping in view the
6
innate risks regarding the decisions of quitting a job, individual risk propensity may
influence the decision to quit (Emberland & Rundmo 2010).
On the other hand, the probability of quitting is low if there are multiple problems
associated with the decision to quit, even though the urge to quit is strong (Allen
2004). Maertz and Campion (2004) have examined the way that people decide to
leave their jobs. The researchers concluded that people decide to quit, or stay, in
four ways; a) first; where the employee has looked into other job offers before
quitting the current position; b) second; where the employee has arranged to enter a
new position before quitting the current position; c) third; profiled type decides to
quit if certain situation arises at work; here the act of quitting is conditional upon
some future happening; and lastly d) fourth; type is titled as ‘impulsive quitting’
where the employee quits with no alternative job on the horizon.
Maertz & Griffeth (2004) discuss eight motives driving psychological “attachment
and withdrawal” from a job. The eight motivational forces are combined results of
firstly, affective forces which trigger the psychological comfort or discomfort;
secondly, contractual forces where completing the obligations can generate the
feeling of attachment within the organization whereas contract breaches by
organization can motivate the employee to quit; thirdly, constituent forces where
the employee maintains relationship with one or more of the constituents; fourthly,
alternative forces where good or plentiful opportunities attract or lack of them may
repel from their present organizations; fifthly, calculative forces, where future value
attainment may evolve a force of attachment and vice a versa; sixthly, normative
forces, expectations of the family or friends become the motive to remain or quit;
7
and finally, behavioral forces, where the employee calculates the explicit or
psychological costs of quitting; and eighth, moral or ethical forces where the
employee regards quitting or staying as just or fair (Maertz & Campion 2004). This
psychological ‘attachment’ promotes beliefs in the mutual exchange obligation
between employee and employer (Rousseau & Tijoriwala 1998).
The employee’s process of quitting a job is both behavioral and attitudinal because
the decision to leave a job may have many negative repercussions as well as the
move from one job position to another (Mobley 1977; Muchinsky & Morrow
1980); felt by the employee and their family as well as their work colleagues
(Behnke, MacDermid, Anderson & Weiss 2010; Maertz & Campion 2004). The
reasons an employee decided to quit may color the attitude of colleagues at the
workplace; which could in turn cause a group turnover (Heilmann, Holt & Rilovick
2008). It involves collective processes, which lead two or more individuals to share
decisions to leave their organization Bartunek et al. (2008). Morrow, Suzuki, Crum
and Pautsch (2005) believe supervision plays a meaningful role in this type of
collective turnover decision.
8
1.1.3 Turnover among Academicians in Malaysia
Study of academicians in the education industry is vital since they have direct links
with industry and community; playing an important role in enhancing the national
capacity to achieve in a volatile global knowledge economy (Lew 2011). Since the
turn of 21st Century, there has been a general increase of turnover of human capital
in Malaysia including among academicians, which can be ascribed to increase
access to higher education (Hong, Hao, Kumar, Ramendran & Kadiresan 2012) as
the number of institutions of higher education has grown creating competition for
academic talent (Conklin & Desselle 2007). Good academicians dissatisfied with
their current institution, have a mass of alternative choices open to them (Bascia &
Cumming 2005).
According to the National Higher Education Research Institute (NAHERI) (2004),
Malaysia has relied heavily on the academicians for the transition to a knowledge-
based economy in Malaysia since the 1980s. During that time, national focus was
placed on the turnover rate of university faculty members at both public and private
Malaysian Universities. Before the year 2000, the turnover rate of academicians in
Malaysia was quite low. The nation had not established its educational institutions
and the economy was developing (Wong 2009). The cost of education being higher,
not many citizens could afford it. However, the waking 21st century illustrated a
different scenario to Malaysia when Malaysians who went abroad for academic
reasons did not return. This stage; the so- called ‘brain drain’ sparked concern about
the rate of turnover. At beginning of the year 2004, the NAHERI reported an annual
turnover of 12 per cent (Hewitt Associates 2009/2010). The turnover rate continues
to increase at an alarming rate especially at the Private Higher Education Institutes
9
(PHEIS) and is such a regrettable moment to experience especially knowing that
most of those leavers are among Doctorate degrees holders (Hashim & Mahmood
2011).
However, the Malaysian government revamped its economy at the turn of the
century. Since then, the cost of education has decline significantly to encourage
more people to get education. The number of higher education and training
institutions have increased while academic experts are well paid and trained to give
quality training to students (Ahmad 1998). This implementation is towards
achieving developed economy, where as suggested by Hagen (2002); academicians
have been set as the role players and they deserved the best choices. This creates
more opportunities to academicians who were unsatisfied with their present
organization to seek for a better prospect in their career. This scenario thus causes
some management concern within the Ministry of Higher Education (MOHE)
which includes the academicians working at the community colleges (Nordin
2010).
Though resolution has taken place, it still constitute additional rate of voluntary
turnover among community college academicians recently (MOHE 2010). In the
year 2010, at the Annual Gathering between the Prime Minister and Civil Servants
(MPPA), the Prime Minister introduced A New Civil Service Scheme (SBPA)
(MOHE 2010). This scheme was aimed at reducing the numbers of civil servants
leaving the service (government sector) to go to the private sector. The salary caps
for public servants had been increased where all the public servants including the
academicians were given an increase between 3 to 7 percent of their current salary
10
(Nordin 2010). In addition, they were allowed to join other services within the
government without getting the consent from the Department Heads. This afford is
to counter the dissatisfaction from the perspective of monetary. Within community
colleges, the scheme was welcomed by most of the academicians who perceived a
pathway into a better-paid employment but the initiative did not improve retention
in the community college itself.
Nevertheless, since the government began to focus on developing and producing
skilled workers in great numbers to become a high income economic nation by the
year 2020, qualified industry trainers are very much in demand especially at the
public university (Nordin 2010). Staff turnover in community colleges has been
reported at 8.22% per annum since 2009 with only a quarter of the lost staff
replaced (MOHE 2010). Observers predict that community colleges will begin to
lose trained academicians who prefer to work at the public university (Abdul Razak
2013). Community colleges are unable to match not only private institutions but
also public university wages and conditions so they keep losing their valuable
people.
Hashim and Mahmood (2011) in a study of two Malaysian Universities, found that
academicians seek for job satisfaction; which they derive from; a) interpersonal
relationships with students and subordinates; b) interpersonal relationships with
colleagues; and c) autonomy and accountability for one’s own work. Holtom et al.
(2005) argue that job satisfaction significantly leads to overall satisfaction (or
wellbeing); but how far it has contributed to quit decisions has become the reason
to this present study.
11
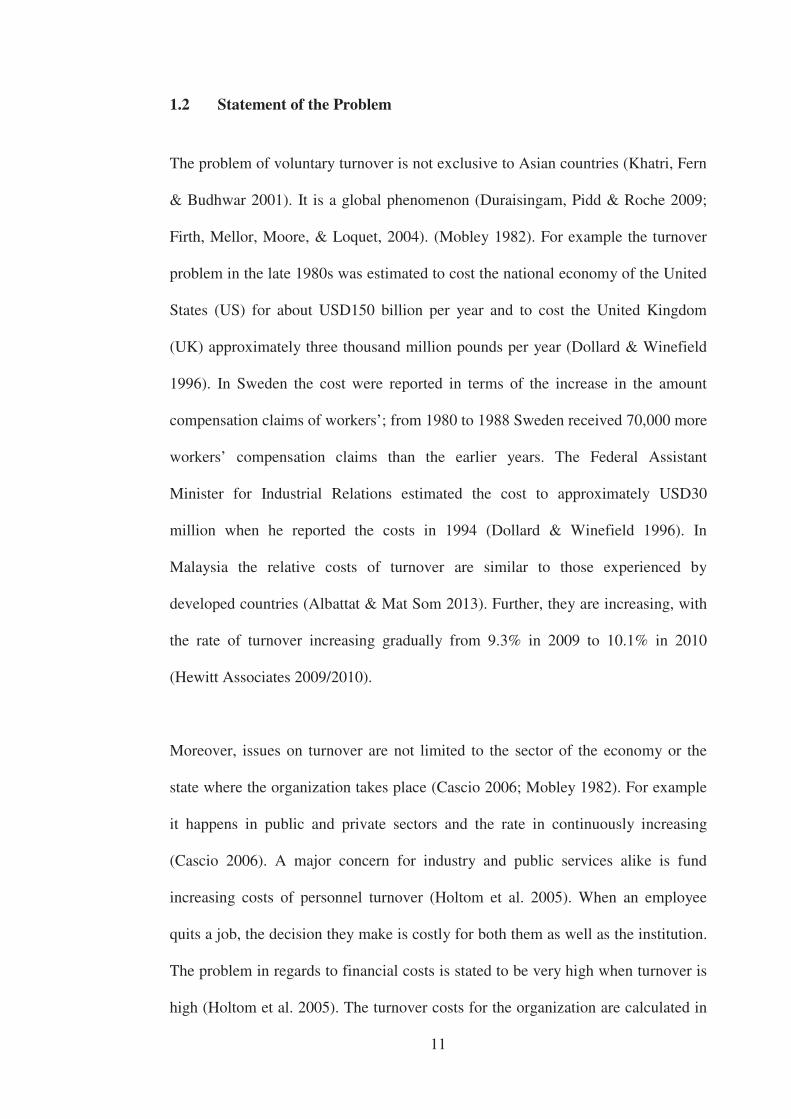
1.2 Statement of the Problem
The problem of voluntary turnover is not exclusive to Asian countries (Khatri, Fern
& Budhwar 2001). It is a global phenomenon (Duraisingam, Pidd & Roche 2009;
Firth, Mellor, Moore, & Loquet, 2004). (Mobley 1982). For example the turnover
problem in the late 1980s was estimated to cost the national economy of the United
States (US) for about USD150 billion per year and to cost the United Kingdom
(UK) approximately three thousand million pounds per year (Dollard & Winefield
1996). In Sweden the cost were reported in terms of the increase in the amount
compensation claims of workers’; from 1980 to 1988 Sweden received 70,000 more
workers’ compensation claims than the earlier years. The Federal Assistant
Minister for Industrial Relations estimated the cost to approximately USD30
million when he reported the costs in 1994 (Dollard & Winefield 1996). In
Malaysia the relative costs of turnover are similar to those experienced by
developed countries (Albattat & Mat Som 2013). Further, they are increasing, with
the rate of turnover increasing gradually from 9.3% in 2009 to 10.1% in 2010
(Hewitt Associates 2009/2010).
Moreover, issues on turnover are not limited to the sector of the economy or the
state where the organization takes place (Cascio 2006; Mobley 1982). For example
it happens in public and private sectors and the rate in continuously increasing
(Cascio 2006). A major concern for industry and public services alike is fund
increasing costs of personnel turnover (Holtom et al. 2005). When an employee
quits a job, the decision they make is costly for both them as well as the institution.
The problem in regards to financial costs is stated to be very high when turnover is
high (Holtom et al. 2005). The turnover costs for the organization are calculated in
12
three pronged basis i.e. firstly, “separation costs; secondly; replacement costs; and
lastly retraining costs” (Wright & Bonett 2007).
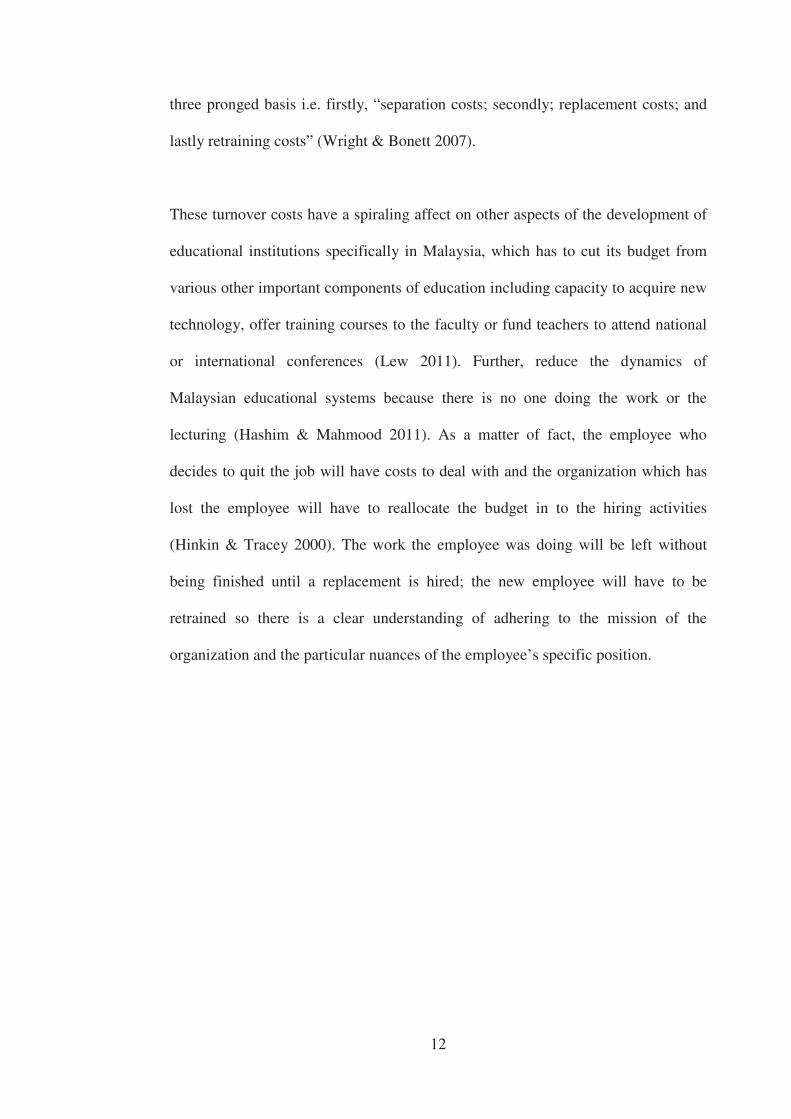
These turnover costs have a spiraling affect on other aspects of the development of
educational institutions specifically in Malaysia, which has to cut its budget from
various other important components of education including capacity to acquire new
technology, offer training courses to the faculty or fund teachers to attend national
or international conferences (Lew 2011). Further, reduce the dynamics of
Malaysian educational systems because there is no one doing the work or the
lecturing (Hashim & Mahmood 2011). As a matter of fact, the employee who
decides to quit the job will have costs to deal with and the organization which has
lost the employee will have to reallocate the budget in to the hiring activities
(Hinkin & Tracey 2000). The work the employee was doing will be left without
being finished until a replacement is hired; the new employee will have to be
retrained so there is a clear understanding of adhering to the mission of the
organization and the particular nuances of the employee’s specific position.
13
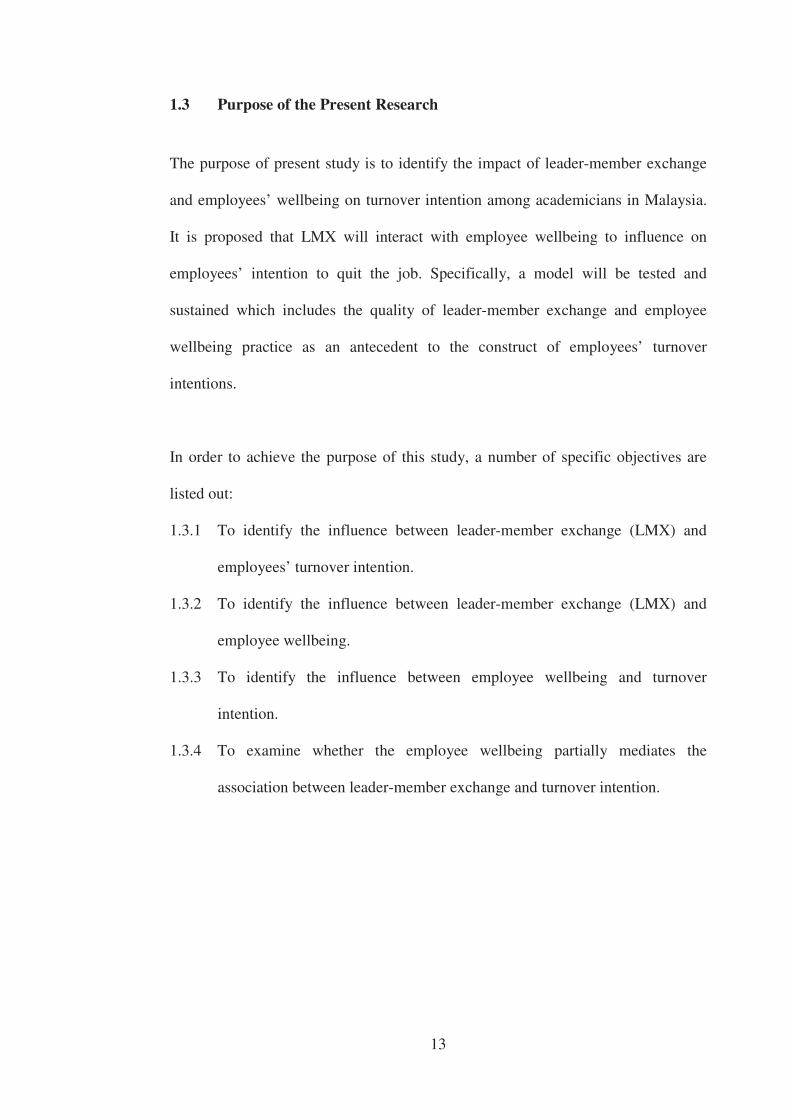
1.3 Purpose of the Present Research
The purpose of present study is to identify the impact of leader-member exchange
and employees’ wellbeing on turnover intention among academicians in Malaysia.
It is proposed that LMX will interact with employee wellbeing to influence on
employees’ intention to quit the job. Specifically, a model will be tested and
sustained which includes the quality of leader-member exchange and employee
wellbeing practice as an antecedent to the construct of employees’ turnover
intentions.
In order to achieve the purpose of this study, a number of specific objectives are
listed out:
1.3.1 To identify the influence between leader-member exchange (LMX) and
employees’ turnover intention.
1.3.2 To identify the influence between leader-member exchange (LMX) and
employee wellbeing.
1.3.3 To identify the influence between employee wellbeing and turnover
intention.
1.3.4 To examine whether the employee wellbeing partially mediates the
association between leader-member exchange and turnover intention.
14
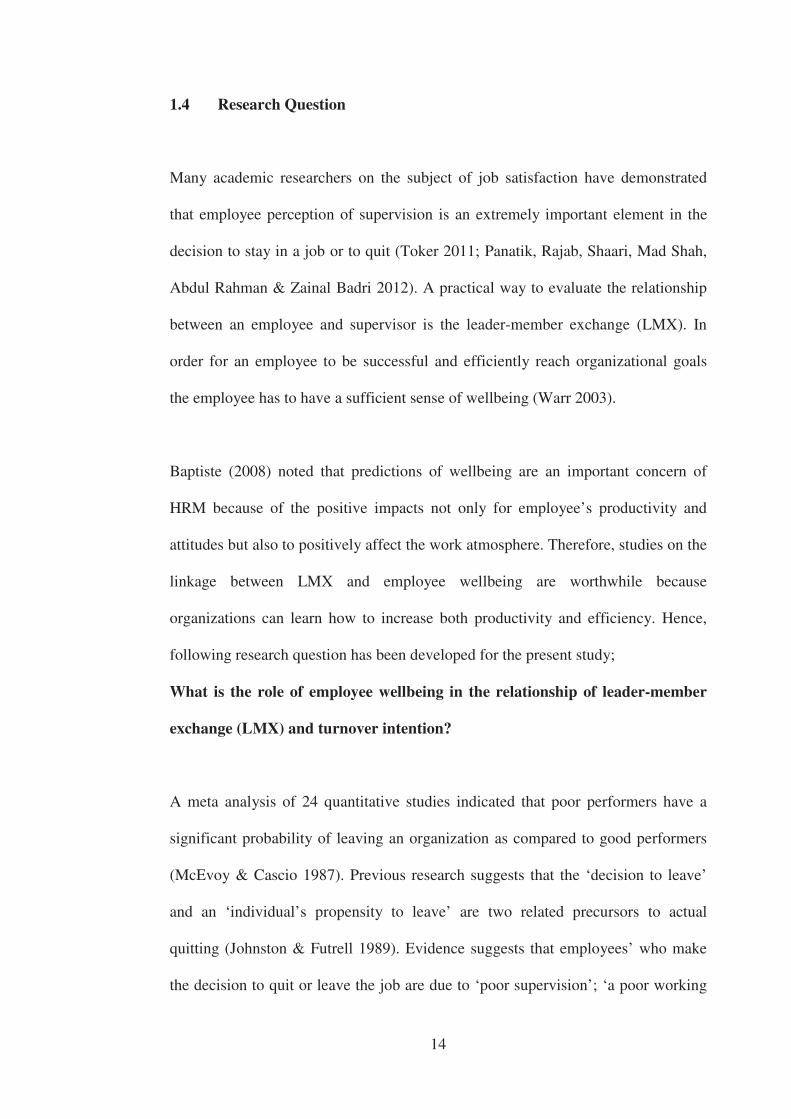
1.4 Research Question
Many academic researchers on the subject of job satisfaction have demonstrated
that employee perception of supervision is an extremely important element in the
decision to stay in a job or to quit (Toker 2011; Panatik, Rajab, Shaari, Mad Shah,
Abdul Rahman & Zainal Badri 2012). A practical way to evaluate the relationship
between an employee and supervisor is the leader-member exchange (LMX). In
order for an employee to be successful and efficiently reach organizational goals
the employee has to have a sufficient sense of wellbeing (Warr 2003).
Baptiste (2008) noted that predictions of wellbeing are an important concern of
HRM because of the positive impacts not only for employee’s productivity and
attitudes but also to positively affect the work atmosphere. Therefore, studies on the
linkage between LMX and employee wellbeing are worthwhile because
organizations can learn how to increase both productivity and efficiency. Hence,
following research question has been developed for the present study;
What is the role of employee wellbeing in the relationship of leader-member
exchange (LMX) and turnover intention?
A meta analysis of 24 quantitative studies indicated that poor performers have a
significant probability of leaving an organization as compared to good performers
(McEvoy & Cascio 1987). Previous research suggests that the ‘decision to leave’
and an ‘individual’s propensity to leave’ are two related precursors to actual
quitting (Johnston & Futrell 1989). Evidence suggests that employees’ who make
the decision to quit or leave the job are due to ‘poor supervision’; ‘a poor working
15
environment’; and ‘inadequate compensation’ (Hinkin & Tracey 2000). Ultimately,
the study which was done by Hinkin & Tracey (2000), theorized negative
relationship between quality of LMX and turnover intention due to subordinates in
lesser-quality relationship being pushed out of the organization. Thereby basing
upon the outcomes of the aforesaid research the present study proposes the
following hypothesis.
H1: Leader-member exchange significantly influences employees’ intention to
turnover
Researching the effect of LMX on employee wellbeing will offer a contribution to
understanding the complexities of behavior in the workplace. LMX and employee
wellbeing have been studied in the health, hospitality, banking, and ICT sectors
(Ahuja et al. 2007; Donoghue 2010; Johnson 1986; Mardanov et al. 2008).
However, in education sector in Malaysia, the evaluation of the needs for retention
of employees has not been given reasonable attention and as such no carefully
developed investigation has been made on a subject so relevant to the field of
academics.
The academicians in any education institution happen to be in the middle of the
action. As such they have stress from both the sides i.e. students, on one hand, and
management on the other. Their position as an academician is one that calls for
dynamic and innovative thinking each day. In other words they are in a high stress
job which calls for ‘thinking on their feet.’ The stress of teaching can result in a
difficult burden for both health and psychological wellbeing of academicians. With
a better understanding of the LMX effect on employee wellbeing, educational HRM
16
will be better equipped to deal with the problems which are causing a high turnover
rate among the academicians world over. Not only academic leaders, but policy
makers as well, need to have access to the best information available in order to
develop behaviors and policy to increase employee retention.
Job satisfaction needs to be reinforced and enhanced in order to keep academicians
at their place of employment. This aspect in the relationships bring to the forefront
for considering the LMX dynamic which is important to evaluate in reference to
employee satisfaction (Harris, Harris & Brouer 2009). Thus it can be said that
employee wellbeing has a positive correlation with workplace and life satisfaction
and so do a strong trusting relationship between employees and their managers that
include in the context of LMX. With this regards, this study proposed to test the
following hypothesis:
H2: Leader-member exchange significantly influences employee wellbeing
Various research studies done by Bartunek et al. (2008), Heilmann et al. (2008) and
Mitchell et al. (2001) have indicated that any improvement in the awareness
regarding the wellbeing of the employees, the management can reduce turnover
amongst its employees. Bartunek et al (2008) recognized that turnover involves
more than group-related antecedents and consequences. It also involves a collective
process that leads two or more individuals to share decisions to leave their
organizations. This, however, still grounded as an individual act.
An individual who is dissatisfied with the current employment have thoughts of
quitting (Heilmann et al. 2008). It is strongly agreed by March & Simon (1958) that
17
employees choose to stay or leave depending on the factors that influence the
desirability and simplicity of movement which regards to employee wellbeing. If
evaluation leads individuals to believe that the current job is worse than the
alternatives that the individual has; then this would tend to increase their desire to
leave and they would likely pursue those alternatives and leave the job (Mitchell et
al. 2001). The study tries to show whether employees’ wellbeing buffers the
employee intention on turnover. Therefore, the third hypothesis proposed for the
present study which is as follows has been based on this study.
H3: Employee wellbeing significantly influences employees' intention on turnover
Further guidance to show the convergence and divergence between various contents
and process of theories on turnover intention is very important. Maertz and
Campion (2004) have discussed the need for research on showing how process and
content approaches to turnover can be integrated. The bond that develops between
an educator or employee and their supervisor affects the moods of an educator or
even their desires to continue in the same job position (Harris, Kacmar & Witt
2005). These three main factors; convergence, divergence and process of turnover
intention theories constitute to be the foundation of the present research. The
current study will try to examine the role of employee wellbeing in securing good
practice of LMX in order to reduce turnover intention. Thus, the present study
proposes the following hypothesis:
H4: Employee wellbeing partially mediates the association between leader-member
exchange and turnover intention.
18
1.5 Significance of the Study
This study makes a significant contribution towards understanding the strength of
relationship between variables; the turnover intention; employee wellbeing; and
LMX. Though they are discussed from a competitive global environment
perspective, the discussion is relevant to organizations in Malaysia. Basically, LMX
is an important element of job satisfaction, which leads to another aspect of
employee wellbeing, job satisfaction. In general, research on turnover has been
studied for the past eighty years, and there are reports that low job satisfaction is the
main reason stated by employees for quitting and taking a different job (Ahuja et al.
2007; Wong 2009).
In addition, this study aims to contribute to management strategies for staff
retention by drawing attention to employee wellbeing aspects. For example in the
policy making for both pay and promotion specifically among academicians were
suggested to be revised since those are important determinants towards employee
commitment (Morris, Yaacob & Wood, 2003). This is due to the environment of
Malaysian higher education since 1980s where pay and promotion had been
proposed as problematic issues among scholars and need to be resolved (Arof &
Ismail 1986; Moris, Yaacob & Wood 2001).
However, it is not only about revising the policy of pay and promotion but
organization should also be seen to move beyond. Arthur (2001) explained that
there has been some advice given to corporations to not to even think of knowledge
workers as paid employees but instead to think of them as volunteers. The new
19
perception of knowledge workers as volunteers helps to visualize ‘a give and take’
in the workplace which is not based on a contractual monetary exchange for hours
on the job. Instead by using the volunteers’ ‘thought exercise’ it might be easier for
an employer to act on the idea that money is not the most satisfying reward for
employees given other choices. Dissatisfaction with salary may contribute to the
intention to leave the profession but, more likely, it discourages others from
entering into the profession (Hashim & Mohammad 2011).
The employers and HR departments need to appreciate this research study which
demonstrate employee’s interesting and challenging tasks in order to keep them
interested at their work which makes them happier at home (Holtom et al. 2005).
This strategy helps because of psychological impacts on employees (such as
academicians) which have not all been well understood yet. As a rhetorical example
to consider, when employees are offered a way to challenge themselves, to stretch
their talents, to develop their challenges and skills and to take responsibility for
their work, they have better feelings about themselves which include good feeling
about their job. Not only that, but perhaps the employee will feel like a ‘powerful
individual’ making positive additions to the mission of the organization instead of
feeling like ‘just a subordinate’ who must only follow directions (Harris, Wheeler
& Kacmar 2009).
Finally, this study makes a contribution to international HRM practices in order to
increase the number of loyal and best performers in the organization in the context
of globalization. Loyal and best performers may be highly influenced by the quality
of the relationship an employee has with their organization’s management
20
(McCarthy, Almeida & Ahrens 2011). Availability of alternative on job hunting
such as the internet has made the life easier whenever employees felt dissatisfaction
with their employment. The internet has made job searching in other regions much
easier as such academicians are able to easily communicate with their colleagues all
over the world. They can also learn about how other academicians are being treated
and how much they are being paid anywhere in the world (Ingersoll & May 2011).
An interesting variable to use as an example is the amount of money, compensation
or budgetary ‘perks’ offered to an employee. For knowledge workers like
academicians, the main positive attribute of a job was to have such “challenge” and
those factors are things that they are looking for (Cascio 2006; Holtom et al. 2005).
1.6 Research Outline
This thesis has been organized into five chapters: 1) Introduction; 2) Literature
review; 3) Research Methodology; 4) Data analysis and results; and 5) Discussion,
recommendations and conclusions. This Chapter 1 introduces the research. It
explains the statement of problem, purpose of the present research, research
question and significant of the research. In addition, this chapter outlining the
research hypotheses emerges from this study.
Chapter 2 reviews several sections, including a description of turnover intention,
antecedent of turnover and element in turnover model. The involved variables and
their relationships are also specified. From this base, a preliminary theoretical
framework is developed (figure 2.7)
21
Next, Chapter 3 covers the methodology of present research. The uses of
quantitative research are discusses and justified. Further, this chapter illustrated the
research instrument utilized in the process of data collection. This chapter
concluded with introduction of data analysis procedure employed in this study.
Chapter 4 outlines the analysis and results obtained from the collected data. It
reviews the sample characteristic through descriptive statistics and tests the
hypotheses through structural equation modeling. Model refinement process is in
detailed illustrated in this chapter.
The final chapter provides discussions to each research hypotheses tested in this
study. It also presents the implications and contributions of current study.
Limitations of the research are also discussed and the final conclusions are listed.
1.7 Conclusion
This first chapter provided a brief overview of the present research. It begins with a
brief explanation of the research topic which leads to research problem and
followed by the research question. The purpose of this research was also introduced
and the hypotheses of this study are outlined. Finally the significance of this
research is discussed. The extensive discussion on the other variables utilized in
this study has been included in the later part of the present study (Chapter 2). In
depth information about the constructs involved will be provided including past and
current literatures will be reviewed.
22
CHAPTER 2
LITERATURE REVIEW
2.1 Substitution of Turnover Intention on Actual Turnover
Turnover intention or intention to terminate membership of an organization has
been defined in various ways (Lee 2000). Jackofsky and Slocum (1987) defined it
as an individual's mental consideration or behavioural intention to quit the present
job within a year. This phenomenon is interpreted as the intention to deliberately,
consciously, and will fully leave an organization. Following this understanding,
Gaertner and Nollen (1992), defined it as the instrumental attachment between
organization and external opportunity which has been perceived in term of cost and
benefit of staying with the organization. Takase (2010) regards it as a multi-stage
process consisting of three components which are psychological, cognitive and
behavioural in nature.
In contrast, the act of turnover is defined as the employee’s movement across the
membership boundary of the organization (Price 2001). Most researchers involved
in turnover studies came towards the concrete definition of turnover as the
termination from employment (Cascio 1976; Mitchell, Holtom, Lee, Sablynski &
Erez 2001). Nevertheless, not all employees who intend to quit their job actually
quit.
23
Turnover intention can be triggered by negative psychological response towards
organization and external job situation which evolve into withdrawal cognition and
eventually lead to actual behavioural turnover (Staw 1980). Following to this
believe, Sousa-Poza and Henneberger (2002) came to an agreement that turnover
intention is an immediate precursor to actual turnover. For example, Sousa-Poza
and Henneberger (2002) claimed that over working hours among workers constitute
to physical and psychological constraints. Thus if this situation continues, workers
will react through unsatisfactory feelings and finally decided to leave.
Relationship between turnover intention and actual turnover has been broadly
discussed in the literature (Hom & Griffeth 1991; Mobley 1977). Result of most
research however, agreed that turnover intention is highly significant to turnover
behaviour (Hom & Griffeth 1991; Mobley Griffeth, Hand & Meglino 1979).
Mobley (1977) suggested, it depends on individual perception and evaluation
towards job alternatives. Both actual turnover and turnover intention are distinct
from each other and it is agreed that actual turnover is expected to increase when
the turnover intention increases. Researchers have tended to examine turnover
intention rather than actual turnover since it is easier to collect data from current
employees than those who have quit (Kim, Lee & Carlson 2010).
24
2.1.1 Reasons for Leaving: Psychological
March & Simon‘s (1958), equilibrium theory posited a balance between; i.)
perceived desirability of leaving the organization and ii.) perceived ease of
movement. Both complementary attitudinal aspects of individuals’ decisions to
terminate their employment (Parasuraman 1982). It presumed that the intensity of
the initial turnover intention was positively correlated to subsequent actual turnover
(Mobley 1982).
According to Lee and Mitchell (1994) and March and Simon (1958), decision to
participate in proposition forms a critical basis in understanding employee turnover.
The researcher in this study reviewed the theories of turnover, progressing from the
thoughts of Barnard (1938) and March and Simon (1958), refers to each one of
them as appropriate to inform the various aspects of the study. Firstly, the
Inducement Contribution Theory, that individuals are given inducements for the
contributions they make to organizations (Barnard 1938). When inducements are
equal to contributions, there is a state of equilibrium in the organization.
Proponents of the theory suggest that when an individual perceives an unfavourable
imbalance between contributions and inducements, the employee leaves the
organization (Sonnenfeld & Peiperl 1988). According to Barnard (1938),
employees and managers must cooperate to reduce conflict in organizations and
increase productivity. However, it is also believed that a lot of financial reward was
not a way of enhancing performance or reducing turnover but argued for
indoctrinating employees, and encouraging existence of informal groups in
25
organizations as a way of increasing cohesiveness among workers and commitment
to the organization, and therefore reducing turnover (Cascio 2006).
Secondly, employee participation in the organization is perceived through the
equilibrium theory where it pointed out two major components that influence the
intention on turnover; which include perceived desirability of leaving the
organization and perceived ease of movement (March & Simon 1958a). Both
factors are shown as the complementary attitudinal aspects of individuals' decisions
to terminate their employment (Parasuraman 1982). Organizations have to pay the
participants well as an incentive for them to continue participating in making the
contributions. Participation continues as long as the utility from inducements are
higher than contributions (Jones & Gates 2007).
The employees utility or satisfaction is based on; the salary, the job being in
conformity with the person’s self image, the predictability of the major job
relationships and compatibility with the job and work roles (Brooke, Russell &
Price 1988). When the participant’s considerations are not met, dissatisfaction will
occur and often results with a desire to leave the organization (Holtom et al. 2005;
Jiang et al. 2009). ease of leaving an organization depends on the marketability of
the employee in the job market, the availability of jobs, and the number of suitable
organizations in which one will fit (Schaefer 2002).
In addition, March and Simon (1958) remarks that when a change is made in an
organization that alters the inducements to any group of participants or explicitly
alters contributions made by them, or the organizations activities, the occasions will
26
thus results a change in participation. The effects of the change in participation thus
can reflect the quantity of production by the individual worker through absenteeism
which leads to turnover criteria.
Finally, turnover can be regarded as part of Equity Theory in organizations
(Pritchard 1969). Employees see work returns as being inequitable when their input
such as effort, skills and qualifications they bring to work are not being adequately
compensated compared to others with similar qualities. The employees expected
compensation is based on the market value of the services being provided, the
skills, experience they have and not only how much their counterpart in the same
organization is earning (Griffeth & Gaertner 2006). When others in the same
institution earn comparatively more, the effects of inequity are felt more.
Underpayment is viewed in Equity Theory as the most common inequality which
will lead employees to asking for pay increases, reducing performance efforts, or
leaving the organizations (Dansereau, Cashman & Graen 1973). Price and Mueller
(1981) summed up that inequity perception towards job satisfaction leads to
intention to turnover which, further contributes to actual turnover behaviour.
27
2.2 Turnover Antecedents
Turnover is perceived as positive phenomenon by the employees since they will
receive a better job offer with respect to various benefits (Schyns, Torka &
Gössling 2007). In spite of that, underperforming would also prefer to leave while
those who perform well will stay with the organization. A number of individual,
organizational and economic variables may influence an individual’s decision to
leave the organization (Mossholder, Settoon & Henagan 2005).
2.2.1 Push Factors
To begin with, there is a push factor, the aspects associated with the nature of
organizational life (McBey & Karakowsky 2001) which in a way might become the
major cause of turnover. Low level of job satisfaction is the main push factor of
employee’s intention to quit (Lanigan 2008; Siong, Mellor, Moore & Firth 2006;
Wasmuth & Davis 1983) and job search. (Jiang et al. 2009; Mobley 1977). Lack of
job satisfaction may lead to negative attitude towards organization (Shen, Cox &
McBride 2004). This will be elaborated by the following passage below.
2.2.1.1 Job Satisfaction
Job satisfaction is defined as “... a pleasurable or positive emotional state resulting
from the appraisal of one’s job or job experiences” (Locke 1969). It was regarded
as affective attachment to the job, viewed in terms of global satisfaction, or in
regard to a particular aspect of the job.
28
The construct of job satisfaction begins as an inducement contribution balance but
is developed as a factor theory in the Cornel Job Descriptive Index (JDI). JDI is a
standard measurement of job satisfaction, which purposes to balance between the
work-role inputs and outcomes (Smith, Kendall & Hulin 1969). Work-role inputs
entail training, experience, effort and times (Smith, Smith & Rollo 1974). The
outcomes of job satisfaction is a broad concept encompassing specific facets of
satisfaction that stems from various sources such as equal pay, job characteristic,
quality of supervision, social relationship in workplace and opportunities for
promotion on the job (Smith et al. 1974; Van Dick et al. 2004).
Further, contemporary studies expended job satisfaction including the flexibility of
workload and working pattern, readiness of career development together with
pleasant working environment (Arthur 2001; Davidson et al. 2010; Lanigan 2008;
Reed 2003; Shen et al. 2004). In a pioneering study on the job satisfaction and
turnover by Mobley (1977), presented a model of turnover decision, which
identifies the link on satisfaction-turnover relationship. Mobley concentrated on
how satisfaction affects turnover, and came to the conclusion that dissatisfaction
with the job or leadership leads to the thought of quitting, intention to stay or leave,
and actually quitting.
Employees who experience job satisfaction are more likely to be productive and
stay on the job (Babakus, Cravens, Johnston & Moncrief 1996; Lambert & Hogan
2009). This has been supported by Mitchell, Holtom et al. (2001), where they
strongly believed that dissatisfied people will leave and money is the factor that
makes them stay. However, approaches focus solely on pay increases contribute
29
relatively little success since employees prefer looking at the positive long-term
employment pattern through promotion opportunities (Robb 2002). Yet, increasing
the salary can be expensive and it does not automatically guaranteed the staff to
stay (Nicolle 2004). Scott, Bishop and Chen (2003) emphasized the use of
participative work designs such as quality circles, self-directed work team and join
management between labor task forces and employee ownership for increasing job
satisfaction. On a contrary reviewed, Gaertner (1999), believed only few of the
structural determinants including distributive justice, and promotional chances are
directly related to job satisfaction.
There are several different field of studies through direct or indirectly have the
similar agreement perceived job disatisfaction causes the intention of turnover
(Gaertner 1999; Jiang et al. 2009; Scott et al. 2003; Siong et al. 2006; Van Dick et
al. 2004). For example, recent study found that the loss of 60 nurses at Kuwaiti
Hospital showing high percentage of reason on job dissatisfaction that drives the
intention to quit were due to non-cooperative nursing manager and bureaucratic
structure of the hospital (Alotaibi 2008). This finding was supported with the
believed that work content and work environment in which the administrators and
nurse managers have more control, have a stronger relationship with satisfaction
than the economic or individual factors (Blau & Boal 1989). On the other hand,
Van Dick et al. (2004) discovered that organizational identification preserves and
enhances part of one’s job satisfaction which in turn will explain the intention to
stay or to go. The researchers believed that individual who are strongly identified
with their organization perceive actual work situation strongly lead to higher job
satisfaction.
30
When dissatisfaction occur, it can simply pursue conflict whether it’s personal or
task oriented hence one side decides to leave the organization rather than continue
the fight (Staw 1980). However, the link between dissatisfaction and turnover is
very complicated (Winterton 2004). The reason for this is because dissatisfaction
with work usually does not lead workers to quit immediately. In fact, there is a
temporal lag between elements of job dissatisfaction, low organizational
commitment, intention to quit, perceived alternatives, ease of movement, and actual
separation.
2.2.2 Pull Factor
On the opposite side of push factors are the pull factors. Pull factors is the external
influences which is out of employees present employment (McBey & Karakowsky
2001). In this case, turnover occur when there are more attractive alternatives (Shen
et al. 2004). Attractions of alternative position that offers a new job experience
enhance turnover behaviour (Mano-Negrin & Kirschenbaum 1999). Pull factors
also include a good job market (Wasmuth & Davis 1983), well payment, high
standard working conditions, good business networking and well-known brand
name (Budhwar, Varma, Malhotra & Mukherjee 2009). For example, one would
leave the organization and work with a well known organization or a big company
such as IBM and Shell.
In the meantime, outside factor which is largely unrelated to the work such as
illness and moving away should also be considered as the cause of employee
deciding whether to stay or to leave the company (Shen et al. 2004). An employee
31
will never leave for the competitors if the current organization is the best in
business and have a reputation as such plus treating them as a valuable asset (Reed
2003).
2.2.3 Personal Factor
Individual characteristics are part of personal factor. Impact concerning on
individual characteristic might influence the intention to quit (McBey &
Karakowsky 2001). Personal factor such as self-esteem might influence the
intention of employee to retain with the organization which they commit to or
turning over the job (Mitchell et al. 2001; Siong et al. 2006). Standard characteristic
relate to turnover including control on gender, monitory status, age, household size,
job tenure and length of time living in certain place (Moynihan & Landuyt 2008).
For March and Simon (1958), educational aspect would be positively associated
with turnover where increased in level of education may lead to higher individual
expectations and subsequently leaver behaviour. Employee who more likely to stay
with organization are older, highly educated, married with high personal income
and having responsibility for financially supporting the household (McBey &
Karakowsky 2001). In call centre industry, type of the contract offered to
employees either full-time, part-time, permanent or temporary workers could be
related to their intention to leave (Schalk & van Rijckevorsel 2007).
32
2.3 Cost of Turnover as the Major Effect
Turnover is actually the cause of various disadvantages including cost of moving
and loss of valued work relationship (Kim et al. 2010). Apparently, studies have
shown that turnover is negatively affects organizations in many different ways as
such produces devastating effect on organizations (Davidson et al. 2010). For
example, it is observed that turnover has the economic impact on organizational
development and other human resource development intervention (Hatcher 1999).
In fact, there is an agreement among researchers and industry professional that
turnover is costly (Steed & Shinnar 2004). Employee turnover is not only expensive
and disruptive to employees, a small percentage reduction in turnover of an
organization can make a significant difference in the organization’s profitability
(Niederman, Sumner & Maertz Jr 2007). Turnover, as shown by several
researchers, comes with large costs to the organization. The costs of turnover are
highly influenced by how each organization allocate their resources to attract,
develop and retain employees (Tracey & Hinkin 2008). Thus, questions such as,
should we retain and retrain to develop the human capital capacity needed, fire and
hire the capacity needed, or outsource the capacity, become common and critical
human capital strategic choice questions (Geroy & Venneberg 2003).
There are direct and indirect cost so call as hard and soft cost where hard cost is
tangible or visible cost and soft cost is intangible cost or hidden cost (Steed &
Shinnar 2004). For most position, the major direct cost of turnover are incurred in
the first three months of the employment (Hinkin & Tracey 2000). Costs which
33
directly relate to turnover include cost of replacement, cost for temporary workers
and cost for over-time by co-workers (Siong, Mellor, Moore & Firth 2006).
Despite hiring well educated and skilled workers, organizations will have to spend
time and money to train and induct new employees (Ghere & York-Barr 2007;
Tracey & Hinkin 2008) to bring them up to required standards of job performance;
thus, training will always be a cost to the organization in case of separations. At
times, turnover costs are simply not appreciated by employers. Given the two
reasons of, no statutory requirements to report turnover and the possibility of not
appreciating the turnover cost, the studied organization was presumed not to have
done any cost computation of the employee turnover (Cascio 2006). In addition,
(Hillmer, Hillmer & McRoberts 2004) classify the tangible cost into seven
quantifiable component model that consist of screening, interviewing, testing,
wages, training, orientation and technology.
On the other hand, Whitt (2006) taking into consideration regarding indirect cost of
turnover in two different parts firstly as transitions cost and second the productivity
costs. It is the most difficult cost to assess and control plus it can be lost in four
ways firstly through commitment, learning curve of all job, assistance from peers
and supervisors and finally, the vacancy typically in form of lost revenues or sales
(Tracey & Hinkin 2008). Hillmer et al. (2004) tried to compare an effective and
efficient call centre as a benchmark in terms of delivers services and customers
need and desire to estimate the intangible cost.
34
There is also different perspective on cost of turnover which is from cost of lost
opportunities including the time and energy invested in each new hire (Ghere &
York-Barr 2007). The most important when addressing the loss of employee
leaving involves is on the investment of money and time spent (Lanigan 2008).
Likewise, the costs associated with having an unhappy employee that is looking to
leave the organization cannot be ignored (Hinkin & Tracey 2000).
2.4 Element in Turnover Model
March and Simon (1958) developed a comprehensive turnover participation model
that includes the employee’s perception of the following key decision variables:
desirability of movement, possibility of intra-organizational transfer, and ease of
movement. March and Simon argued that voluntary employee departure results
from a decision to participate, which, they theorized, derives from two sub-
decisions about the perceived ease and desirability of movement. Over time,
perceived ease of movement has changed its meaning to perceived job alternatives,
and perceived desirability of movement has come to mean job satisfaction (Price &
Mueller 1981). In fact, studies on job satisfaction and perceived job alternative
towards turnover continuously debated by researchers (e.g. Carsten & Spector
1987; Judge 1993; Lambert, Hogan & Barton 2001) throughout the decades.
Several models have expanded the original research of March and Simon (1958),
for instant based on Figure 2.1 Mobley (1977), introduced a Model of the
Employee Turnover Decision Process. It leads to a comprehensive explanation on
the employee intention to quit the job. There are large numbers of research agree
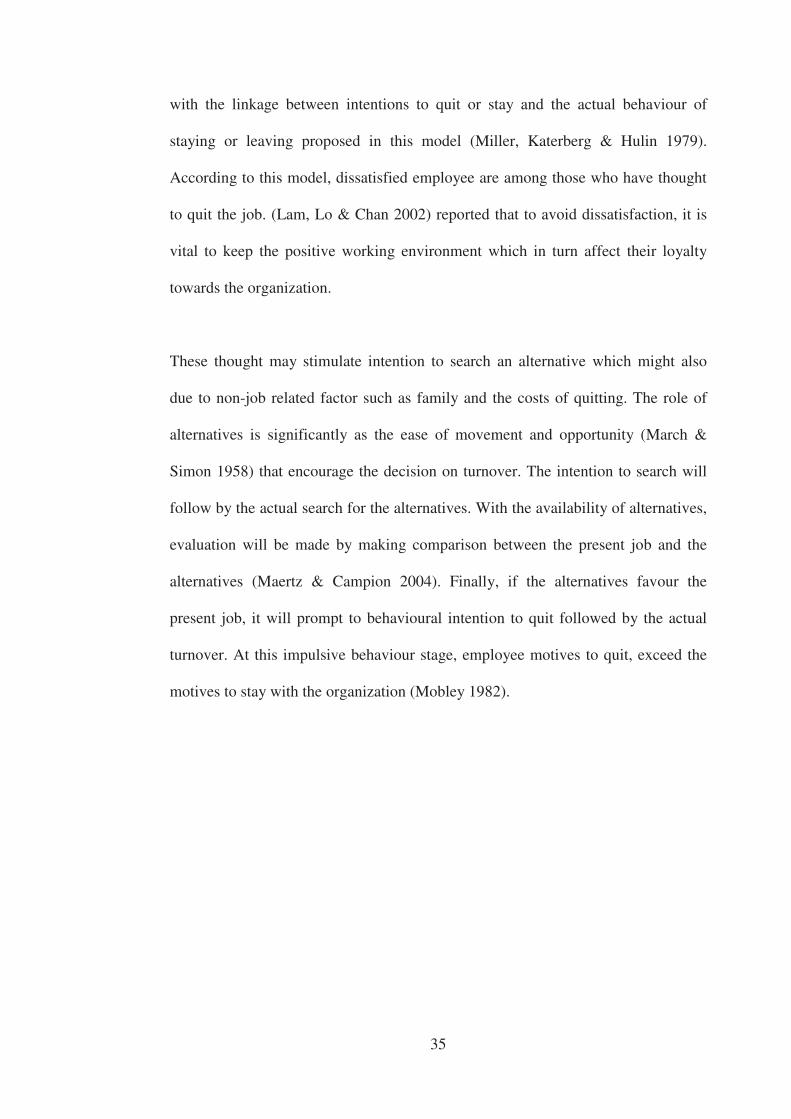
35
with the linkage between intentions to quit or stay and the actual behaviour of
staying or leaving proposed in this model (Miller, Katerberg & Hulin 1979).
According to this model, dissatisfied employee are among those who have thought
to quit the job. (Lam, Lo & Chan 2002) reported that to avoid dissatisfaction, it is
vital to keep the positive working environment which in turn affect their loyalty
towards the organization.
These thought may stimulate intention to search an alternative which might also
due to non-job related factor such as family and the costs of quitting. The role of
alternatives is significantly as the ease of movement and opportunity (March &
Simon 1958) that encourage the decision on turnover. The intention to search will
follow by the actual search for the alternatives. With the availability of alternatives,
evaluation will be made by making comparison between the present job and the
alternatives (Maertz & Campion 2004). Finally, if the alternatives favour the
present job, it will prompt to behavioural intention to quit followed by the actual
turnover. At this impulsive behaviour stage, employee motives to quit, exceed the
motives to stay with the organization (Mobley 1982).
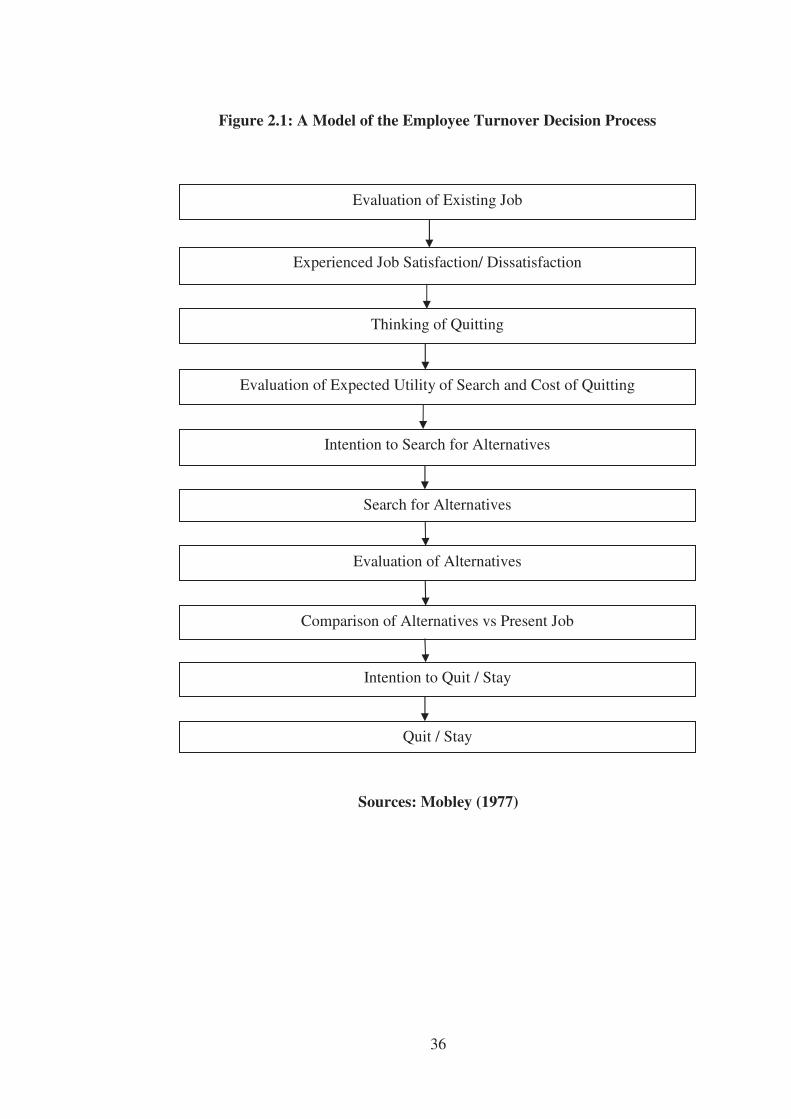
36
Sources: Mobley (1977)
Evaluation of Existing Job
Experienced Job Satisfaction/ Dissatisfaction
Thinking of Quitting
Evaluation of Expected Utility of Search and Cost of Quitting
Intention to Quit / Stay
Quit / Stay
Intention to Search for Alternatives
Search for Alternatives
Evaluation of Alternatives
Comparison of Alternatives vs Present Job
Figure 2.1: A Model of the Employee Turnover Decision Process
37
2.5 Leader-member Exchange (LMX)
2.5.1 Concept of LMX
Leader-member exchange theory, originally is known as the vertical dyad linkage
(VDL) leadership approach (Dansereau 1975; Dansereau et al. 1973; Graen &
Cashman 1975). VDL differed from previous theories which often had an
underlying assumption that leaders treated all members the same. VDL
characterized leader and member relationships by physical or mental effort,
emotional support, information, and trust (Graen & Uhl-Bien 1995). On the other
hand, leader-member exchange (LMX) is a dyadic approach to understanding the
manager-employee working relationship where one person have direct authority
over the other (Kim et al. 2010).
Low quality LMX relationships (i.e. out-group exchanges) were described by
interactions that were primarily based on the employment contract. On the other
hand, high-quality relationships (i.e. "in-group" exchanges) were based on higher
levels of trust and emotional support than the formal job description identified
(Smith 2003). Therefore, the difference between relationship qualities was
originally considered as dichotomous, as relationships between leaders and
members were characterized as either bad ("out-group") or good ("in-group)
(Collins 2007). Research by Hofmann, Morgeson & Gerras (2003) on LMX and
context specific citizenship shows that high-quality and low-quality relationships
develop rather quickly and remain stable over time.
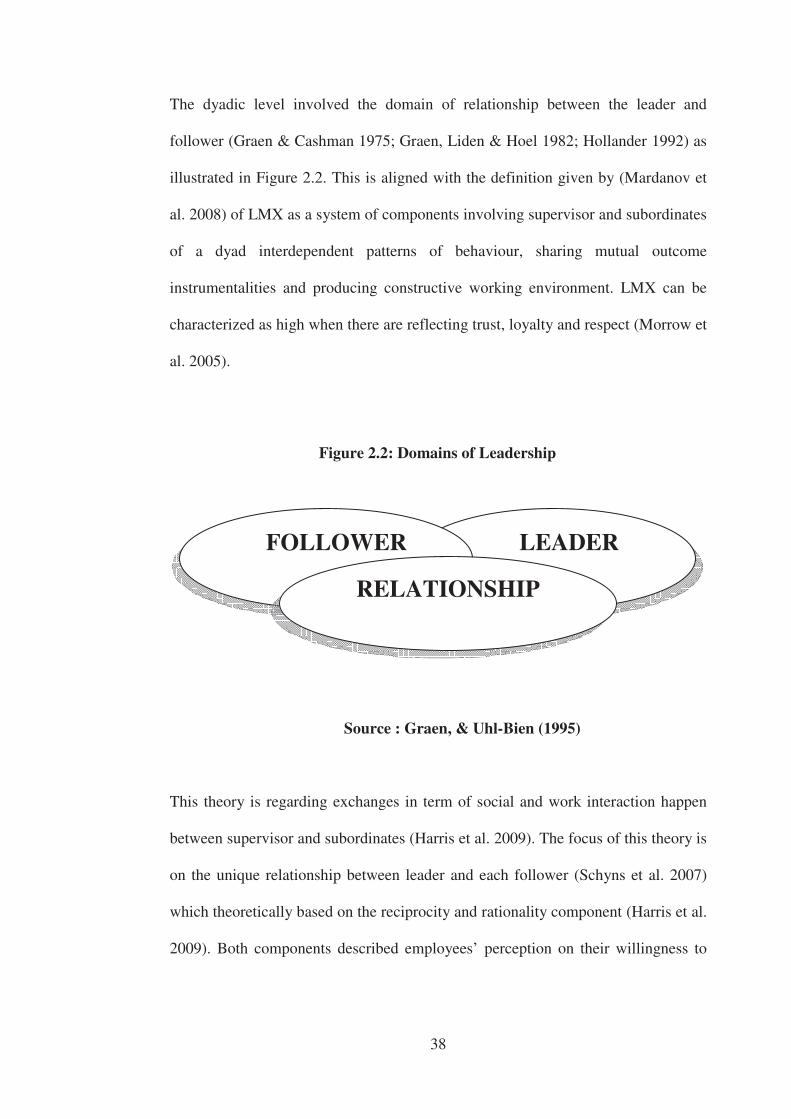
38
The dyadic level involved the domain of relationship between the leader and
follower (Graen & Cashman 1975; Graen, Liden & Hoel 1982; Hollander 1992) as
illustrated in Figure 2.2. This is aligned with the definition given by (Mardanov et
al. 2008) of LMX as a system of components involving supervisor and subordinates
of a dyad interdependent patterns of behaviour, sharing mutual outcome
instrumentalities and producing constructive working environment. LMX can be
characterized as high when there are reflecting trust, loyalty and respect (Morrow et
al. 2005).
Source : Graen, & Uhl-Bien (1995)
This theory is regarding exchanges in term of social and work interaction happen
between supervisor and subordinates (Harris et al. 2009). The focus of this theory is
on the unique relationship between leader and each follower (Schyns et al. 2007)
which theoretically based on the reciprocity and rationality component (Harris et al.
2009). Both components described employees’ perception on their willingness to
LEADER FOLLOWER
RELATIONSHIP
Figure 2.2: Domains of Leadership
39
assist, share ideas and give responds to other work group members and vice versa
(Smith 2003).
LMX theory is a subset of social exchange theory which draws the exchange
relationship between leaders and followers of the same group (Dansereau 1975;
Graen et al. 1982). Usually, leaders will develop a special exchange relationship
with a certain trusted subordinates who function as assistants, lieutenants or
advisors while the rest is substantially different (Yukl 1994). During the
interactions, supervisor will delegate the task and necessary responsibilities and
both parties will engage in the role-making process (Lee 2000). Supervisor as a
leader in an organization plays the important part in determining subordinate’s
work role (Harris et al. 2005).
Experiencing good LMX practice is beneficial for the employees especially during
the early employment period, thus improving their skills sets and enhancing their
marketability (Morrow et al. 2005). It is usual that, employees with high quality
LMX with the leader receive a greater work-related benefit as compared to low
quality LMX relationships (Kim et al. 2010). In other words, the more important
role will be assigned to those preferred by supervisor and they are among good
performers whereas lesser roles are filled by those less liked and they are perceived
as less capable employees (Harris et al. 2005).
Supervisors perceive employee’s performance and likeability as major indicators in
choosing the right employee to fulfil the more important organizational roles as
compared to less capable and less liked (Harris et al. 2009). As a leader in
40
organization, they can encourage high standard of quality among different work
group members which might lead to desirable outcomes including better
performance, higher job satisfaction and organizational commitment (Kim et al.
2010). The desirable outcome is being measured during the role-making process
whether it goes above or beyond expectation.
2.5.2 Measurement and dimensionality of the LMX construct
Graen et. al. (1995) argued that the LMX construct has multiple dimensions
including mutual respect and trust and leadership obligation. Mutuality means that
both parties, the leader and the follower must develop together the dimensions and
exchange that are valued by both parties (Dienesch & Liden 1986). The exchange
element remained over time through the process of collaborating the task (Lee
2000). Professional trust and respect is a degree to which each member of the dyad
has built a reputation within or outside of the organization (Liden & Maslyn 1998).
Obligation or role in the organization is something that can promote the behaviour
of a leader (Lee 2000). However, leader should also consider providing valued
resources including physical resources, information and attractive task assignment
(Liden & Maslyn 1998).
These dimensions have been supported by many researchers (Collins 2007) and
will be utilized in the present research. It is believe that using more than one
measure of LMX at a time, can contribute to the uniqueness of the information
(Graen et al. 1982). This measure relates to dyadic relationship that develops
41
interlock behaviour between leader and follower (Lee 2000) and characterizes the
high quality LMX relationship (Collins 2007; Graen et al. 1982).
2.6 The Importance of Leader-Member Exchange in Employee Turnover
Intention
Vast literature is available on the direct or indirect role of leadership in relation to
employee intention to stay or turnover. In trying to understand the reason why
many workers leave one employment for another, the concept of leadership in
relation to the employee must be explored (Bufe & Murphy 2004). Most
importantly, the role of leadership in employee turnover cannot be overlooked
(Graen et al. 1982). There are various studies conducted between LMX quality and
the relationship with turnover intention and the results vary. Grean and Uhl-Bien
(1995), reported that the development of LMX addressed different relationships
between LMX and organizational variables.
Contemporary evidence suggests that the lower the quality of LMX, the greater the
level of employee actual turnover (Schyns et al. 2007). Poor relationship between
leaders and members of the organization can cause the organization to lose
commitment and satisfaction on the job (Graen & Uhl-Bien 1995; Mardanov et al.
2008). Therefore, whenever the employees believe that they are able to gain
alternative employment, turnover intention will increase (Harris et al. 2005). This
strongly support that LMX relationship are related to organizational variables such
as performance, job satisfaction, employee turnover and organizational
commitment (Graen & Uhl-Bien 1995).
42
Evidence suggests that many workers leave their jobs because they do not get along
with their superiors (Robbins & Davidhizar 2007). Of 20,000 department workers
interviewed, 95% of exiting employees attributed their search for a new position to
an ineffective manager (Myatt 2008). Robbins and Davidhizar (2007) also reported
that effective leadership in individual nursing units has a direct effect on nurse staff
satisfaction.
In contrast, a meta-analytic study among 207 truck drivers shows that LMX quality
found to be nonlinearly related to turnover intention where the employee were
energized to quit even though there were higher or lower quality of relationship
between supervisor and subordinates (Morrow et al. 2005). This finding is
supported by Harris et. al. (2009) stated that unless for those who are higher in
political skill since there are ample access to the supervisor plus might have
opportunity to influence any situation occur. The power of political skills in low
LMX quality affect the turnover intention to be increased because the employee
have sense of believe that the quality relationship with the supervisor are unlikely
to change therefore , to achieve the personal goal, it is better to leave the
organization (Harris et al. 2009).
However, a study by (Harris et al. 2005) suggested a U-shaped curvilinear
relationship between LMX and turnover intention that links both high and low
quality of LMX would lead to turnover intention. This result simply replicated the
latest study among 232 frontline workers and 88 supervisors employed in
hospitality industry (Kim et al. 2010). It showed a mix finding where there are
linear relationships between LMX quality and turnover intent in some cases whiles
43
the others showing the nonlinear relationships. Moreover, the study asserted that
turnover intention is high when the quality of LMX is at high and low level while
the employees try to stay with the organization when the quality of LMX is at
moderate level (Harris et al. 2005). Moderate quality LMX establishes a state of
equilibrium which hinders the thought of leaving the organization as compared to
subordinates in lower quality LMX, however they believe they do not have to work
as hard as the high quality LMX.
On top of that, Maertz and Griffeth (2004) reported that the relationship between
LMX quality and turnover intention were associated with the motivational forces
that are alternative and calculative Alternative is the believe of getting new job
opportunity while calculative is the cost-benefit assessment concerning the ability
to go ahead with the present job which can cause comfort or discomfort with the
organizational environment (Harris et al. 2005).
2.7 The Concept of Employee Wellbeing (EWB)
Wellbeing is defined in various different perspectives. Wellbeing is described as
emotional well-being (Mishra et al. 2010), psychological well-being (Emberland &
Rundmo 2010; Stetz, Castro & Bliese 2007), employee well-being (Holman 2002;
Renwick 2009) and 'wellness' (Vickers 2006). There is a trend towards
psychological or social definitions of wellbeing (Warr 1987). Researchers regard
wellbeing as a subjective or ‘psychological’ experience (Warr, Butcher &
Robertson 2004). It consists of both affective and cognitive components (Diener,
Kahneman & Schwarz 2003). In fact, subjective wellbeing has been reported to be
44
significantly related to psychological wellbeing (Evans 1997; Evans, Thompson,
Browne, Barr & Barton 1993) and the terms are used interchangeably (Walker
2009).
Wellbeing is defined as combination of personal growth purpose in life, positive
relations with others, environmental mastery and social contribution (Keyes 1998).
These conventional wellbeing concepts referred as living in a state that is some
sense good (Warr et al. 2004) and significantly related to overall quality of life
(Cummins & Group 2006). Experienced wellbeing can change slowly over long
periods of time or can be transitory during brief periods where a person can feel
good in some respects and feel bad in others within the same period of time (Warr
2003).
Wellbeing is associated in a systematic ways of particular features and personality
disposition (Warr 1987), see Figure 2.3. For example, “positive affect” is expected
to cover all feeling on the right-hand side of the figure involving both low and high
activation (Warr et al. 2004). Furthermore, it is also strongly influenced by factors
related to attitude and self-image and motivational models (Jamal 1999). Daniel
(2006), argues that employees prefer working environment that fits with their
personalities and more likely to provide motivators that meet their needs. When
organizations were able to offer a range of different motivators such as flexible
working practices, then it is likely that employees will have positive feeling thus
find something that can contribute to the organization in return (Baptiste 2008).
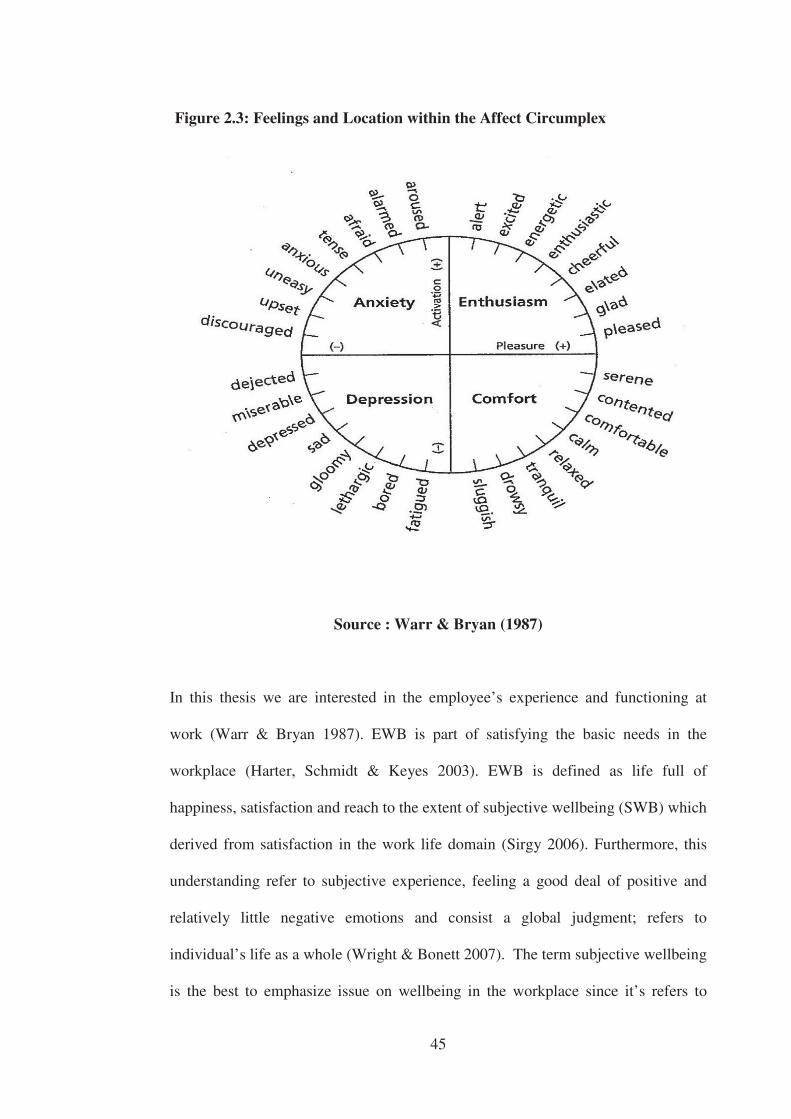
45
Source : Warr & Bryan (1987)
In this thesis we are interested in the employee’s experience and functioning at
work (Warr & Bryan 1987). EWB is part of satisfying the basic needs in the
workplace (Harter, Schmidt & Keyes 2003). EWB is defined as life full of
happiness, satisfaction and reach to the extent of subjective wellbeing (SWB) which
derived from satisfaction in the work life domain (Sirgy 2006). Furthermore, this
understanding refer to subjective experience, feeling a good deal of positive and
relatively little negative emotions and consist a global judgment; refers to
individual’s life as a whole (Wright & Bonett 2007). The term subjective wellbeing
is the best to emphasize issue on wellbeing in the workplace since it’s refers to
Figure 2.3: Feelings and Location within the Affect Circumplex
46
individual’s evaluations of their lives based on their own perspective (Diener &
Lucas 2003). Therefore, for the purpose of this study, subjective wellbeing will be
formulated in terms of employee wellbeing on overall life satisfaction and
happiness perspective.
2.8 The Scope of Measurement
In order to get the entire figure of subjective wellbeing, it is important to know
what each domain consists (Diener, Lucas 2003). The quality of life construct has a
complex composition (Cummins & Group 2006). It is influenced in certain part by
different factors for instance the “job specific” wellbeing-people feelings about
themselves in relation to their job and “context free” wellbeing- broader focus
covering feelings in setting (Warr 1987). “Job specific” can emerge from
satisfaction on work, job engagement, job tension, depression, burnout and job
involvement while “context free” possibly comes from life satisfaction, happiness,
positive and negative affect, anxiety and other types of feeling (Warr 1990).
Subjective wellbeing is often measured in a single dimension roughly from feeling
bad to feeling good (Warr et al. 2003). This prevents us from distinguishing “job
specific” and “context free” wellbeing. It is better to consider wellbeing as
measured along three main axes (Diener, Suh, Schaie & Lawton 1997) as shown in
Figure 2.4. The first axe is displeasure to pleasure, the positive pole to measure
satisfaction or happiness. The other two axes run from anxiety to comfort and
depression to enthusiasm, both axes illustrate mental arousal. Feeling anxiety are
viewed as having a combination of low pleasure with high mental arousal while
47
comfort is figure as low pleasure and its goes the same for the feeling from
depression to enthusiasm. The arousal dimension on its own is not considered to
reflect wellbeing, therefore the end-points are unlabelled (Warr 1987).
Characteristics of a person in term of his or her location on each three axes are inter
correlated because the central importance of feelings of pleasure and have different
association with certain variables (Warr 1987). For example measures on overall
job satisfaction and life satisfaction as level a person’s of job. Previous studies
reported that the higher the level of one’s job, the lesser the job-related depression
however significantly high in job-related anxiety (Birdi, Warr & Oswald 1995;
Warr 1990). Furthermore, various attempts have been made in order to prove the
relationship between job specific and context free wellbeing in each individual.
The overlaps connection between the situation from home to work and vice versa
(Warr 1987) is also known as “spillover”. The positive scenario of spillover study
has shown that a male employee who is enjoying his job and is experiencing great
feeling at the office shows a good personal interaction with the family members
(Piotrkowski 1978). The opposite spillover happen when a father had put his full
effort and worked all day long, coming back home exhausted, irritated and
emotionally non-responsive (Warr 2003). General differences between men and
women might also expect to influence the likely relation between job specific and
context free wellbeing. This is because women tend to put more time into filling
multiple roles than do men (Nolen-Hoeksema & Rusting 2003). A study has proven
that the number of working hours per week for a women is significantly higher than
for a men since women have to engage not only to paid workforce but also to do the
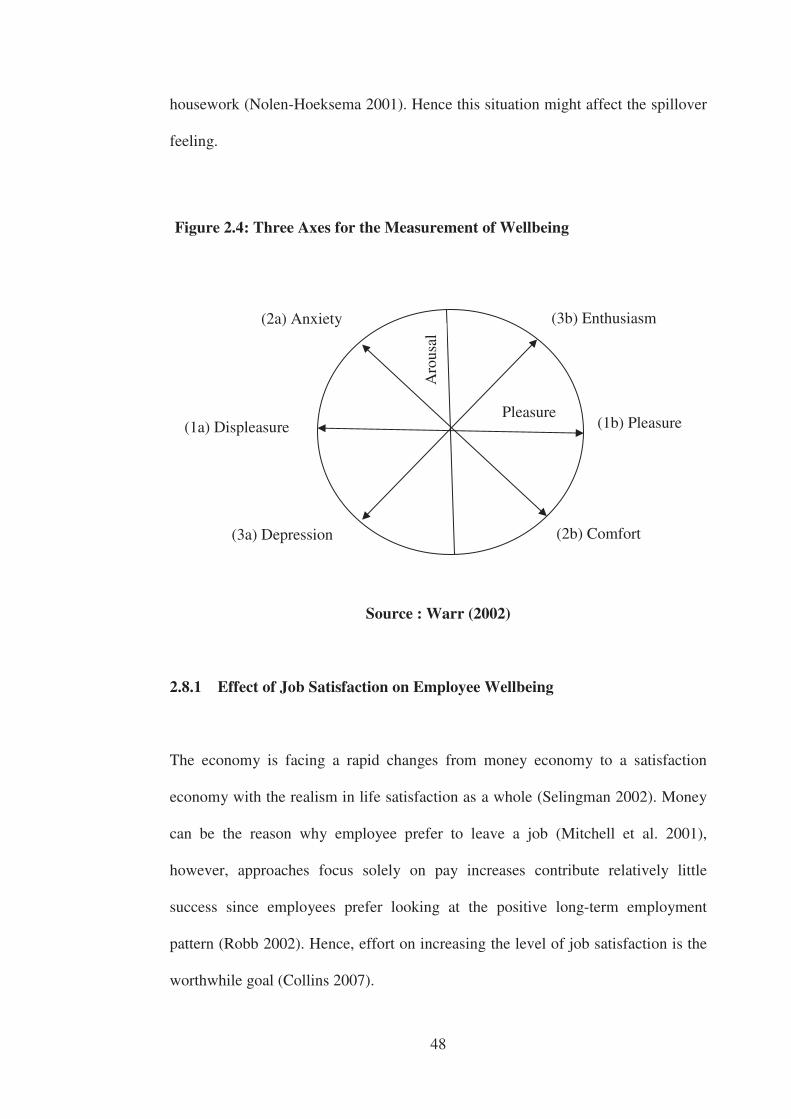
48
housework (Nolen-Hoeksema 2001). Hence this situation might affect the spillover
feeling.
Source : Warr (2002)
2.8.1 Effect of Job Satisfaction on Employee Wellbeing
The economy is facing a rapid changes from money economy to a satisfaction
economy with the realism in life satisfaction as a whole (Selingman 2002). Money
can be the reason why employee prefer to leave a job (Mitchell et al. 2001),
however, approaches focus solely on pay increases contribute relatively little
success since employees prefer looking at the positive long-term employment
pattern (Robb 2002). Hence, effort on increasing the level of job satisfaction is the
worthwhile goal (Collins 2007).
(3b) Enthusiasm
Aro
usal
(1b) Pleasure
(2b) Comfort (3a) Depression
(1a) Displeasure
(2a) Anxiety
Pleasure
Figure 2.4: Three Axes for the Measurement of Wellbeing
49
Job satisfaction is a sense of satisfaction with work and the entire organizational
context (Jernigan III, Beggs & Kohut 2002). It is specifically defined as a
pleasurable or positive emotional state occur from evaluation towards particular job
or job experiences (Locke, Latham, Smith, Wood & Bandura 1990). Currie (2001)
viewed job satisfaction as state of individual’s satisfaction with the terms and
conditions of employment and factors that related to physical work environment.
For example, job satisfaction release from the relationship of substantial
organizational outcomes such as job characteristic, pay, colleagues, supervisors,
organizational commitment, job security and other nature of work undertaken (Lee
2000; Van Dick et al. 2004; Warr et al. 2003) and similarly posit in the 9 features
by Warr & Bryan (1987).
Job satisfaction can be classified as “intrinsic” and “extrinsic” job satisfaction
(Herzberg, Mausner & Snyderman 1959 & Warr et al. 2003). “Intrinsic” job
satisfaction including the satisfaction underlying the work behaviour itself for
instance opportunity for personal control and opportunity for utilizing the skills
whilst the “extrinsic” job satisfaction is the facet on the background of the work
activities such as working condition and job security. These different facet-specific
satisfaction are positively inter correlated and recently use in measuring job
satisfaction through multiple items questionnaire to obtain reliable estimates (Warr
1987).
Conversely, achieving higher level of job satisfaction is particularly useful strategy
to promote employee wellbeing in workplace (Baptiste 2008) and being part of life
satisfaction (Sirgy 2006). Lack of job satisfaction is the main push factor of
50
employee’s intention on deciding to quit (Lanigan 2008; Wasmuth & Davis 1983;
Siong et al. 2006) and issue on wellbeing at workplace reported as the indicator of
changing a job (Staw 1980; Wright 2009). For example, Mobley (1977), describes
the model of employees’ turnover decision process which begin when individual
experiencing job dissatisfaction and try to explore job alternatives and evaluate
these in terms of their expected unity. Therefore, improving job satisfaction is a
vital action (Lawson, Noblet & Rodwell 2009).
2.8.2 Effect on Life Satisfaction towards Employee Wellbeing
Individual’s life is a significant part of employee wellbeing as most of his/her
waking life was spending at work (Harter, Schmidt & Hayes 2002). Apparently,
studies by Judge & Watanabe (1993) and Spector (1997) agreed that measures of
job satisfaction tend to correlate at least half the range (0.5 to 0.6) with the
measures of life satisfaction. However, life satisfaction plays greater role than job
satisfaction in reality. Near, Smith, Rice & Hunt (1983) using surveys Of American
adults found that nonwork satisfaction was stronger predicting overall satisfaction
as compared to job satisfaction. Research by Avolio & Sosil (1999), added that
employee requires not only tangible but more intangible benefit including stable job
with pension and other benefits. This is because employee perceived their desired
as so called enjoyable, fulfilling and socially useful (Avolio & Sosik 1999; Harter
et al 2002).
Therefore, Harter et al. (2002) suggested that the proponent of employee wellbeing
such as the presence of positive appraisals and strong relationship within the
51
workplace contribute to high quality of life. The strengths that best predicted
achievement of life satisfaction are gratitude, curiosity, zest and hope (Park,
Peterson and Seligman 2004). Further (Park et al. 2004) added wellbeing and
happiness or fulfilment captured from life satisfaction, inherent in virtuous action.
With these respect, work life is pervasive to employee wellbeing that will cause to
life satisfaction (Harter et al. 2002). Warr (1999) supported that the mode of
interaction between job satisfaction and life satisfaction might spill over into wider
form of wellbeing.
2.8.3 Effect on Work Stress towards Employee Wellbeing
The element of work stress is an important factor affecting employees’ health and
wellbeing (Jamal 1999). It is often measured as negative form of wellbeing and
identified as anxiety and depression (Warr 1987). Anxiety and depression or mood
disorder are often associated with excessive sadness, worry and fear, guilt and
shame (Howard Berenbaum, Hyunh-Nhu Le & Jose Gomez 2003). These negative
wellbeing possibly occur due to genetic factors (Kendler, Neale & Heath 1995).
However, at workplace, increasing workload and organizational change might
impact wellbeing and stimulate stress among employees (Woods 2010).
A typical form of stress in the workplace environment is job-related ‘burnout’
(Warr et al. 2003). This occupational hazard usually results in work setting that are
high in demands but low in resources (Maslach 1998). There are three job-related
stress dimension including emotional exhausted, depersonalization (felt distance
from others) and reduced personal accomplishment (Maslach 1998; Warr 2002).
52
Personal attributes and organizational variables may also influence the development
of burnout (Warr 1987).
Job stress is one’s reactions to work environment characteristics along with
psychological threatening (Jamal 1999). Individuals experience excessive stress
was not because they are different from the other, but because they are more
sensitive to undesirable outcomes (Howard Berenbaum et al. 2003). However,
stress at moderate level in most jobs is generally accepted and beneficial as a
healthy stimulant to encourage people to deal with challenges at work (Macdonald
2005).
Job stress can result in negative attitudes towards other people, jobs and
organizational itself (Maslach 1998). Under behavioural consequences, job stress is
reported to be significantly related to reduction on job performance, absenteeism,
turnover intention (Daley & Parfitt 1996; Dollard & Winefield 1996). Previous
studies on employee wellbeing and turnover intention showed that stressors are the
most reason (Stetz et al. 2007) employee’s decision to quit. It is the emotional
dissonance experience in work roles that influence the intention to leave the
organization consequently will reduce the emotional wellbeing (Mishra et al. 2010).
Stress also effect the physiological aspects such as increase in heart rate, blood
pressure and catecholamine levels (Warr 2002). The existence of workplace stress
is undeniable. Prevention and control is very important (Macdonald 2005).
53
2.8.4 Effect of Change at Workplace on Employee Wellbeing
The ability to adapt to changes is important to experienced wellbeing (Nancy &
Catherine 2003). Changes in organizational forms and activities including re-design
of work processes, networked forms of organizing, restructuring, downsizing,
cultural change and technological change (Warr 2002).
Change initiatives are subject to failure due to human factors such as change related
responses, attitudes and behaviours (Kotter 1995). Individuals are likely to
experience change differently through their own perception, estimation and
determination whether it is a threat or challenge (Martin 2001). With this respect,
organization will not able to achieve their strategic objectives of change until their
employees have a sense of readiness towards change and making individual
transformational (St Amour 2001).
The developed framework included below (Figure 2.5) for analysing organizational
change provides an understanding of the importance of the organization’s
interactions with its environment (Warr 2002). At every level in the organization, it
is vital to take a systematic approach to change (Pettigrew 1991) to make it
compatible with the environmental factors that create demand for change (Warr
2002).
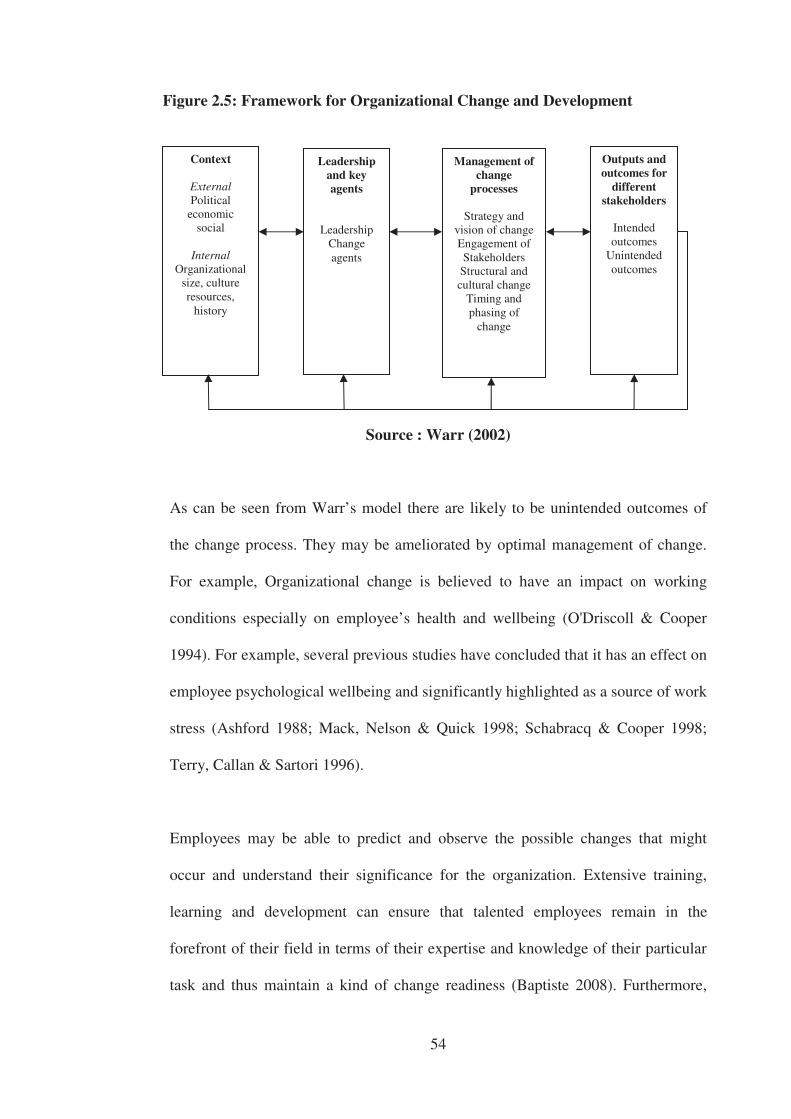
54
Source : Warr (2002)
As can be seen from Warr’s model there are likely to be unintended outcomes of
the change process. They may be ameliorated by optimal management of change.
For example, Organizational change is believed to have an impact on working
conditions especially on employee’s health and wellbeing (O'Driscoll & Cooper
1994). For example, several previous studies have concluded that it has an effect on
employee psychological wellbeing and significantly highlighted as a source of work
stress (Ashford 1988; Mack, Nelson & Quick 1998; Schabracq & Cooper 1998;
Terry, Callan & Sartori 1996).
Employees may be able to predict and observe the possible changes that might
occur and understand their significance for the organization. Extensive training,
learning and development can ensure that talented employees remain in the
forefront of their field in terms of their expertise and knowledge of their particular
task and thus maintain a kind of change readiness (Baptiste 2008). Furthermore,
Context
External Political
economic social
Internal
Organizational size, culture resources,
history
Leadership and key agents
Leadership Change agents
Management of change
processes
Strategy and vision of change Engagement of Stakeholders
Structural and cultural change
Timing and phasing of
change
Outputs and outcomes for
different stakeholders
Intended outcomes
Unintended outcomes
Figure 2.5: Framework for Organizational Change and Development
55
Armenakis, Harris and Mossholder (1993) argued that employee attitudes towards
organizational change affect organizational outcomes such as job satisfaction,
productivity, morale, absenteeism and turnover.
2.8.5 Effect of Job Embeddeness on Employee Wellbeing
Job embeddedness in the construct that addressed how well a person fit in a job and
community; having the interpersonal links with on and off the job and what a
person would have to sacrifice in leaving their place of employment or community
(Mitchell et al. 2001). This critical aspect of job embeddedness are labelled in three
dimensions namely “fit”, “links” and “sacrifice” and they are significant in both on
and off the job thus emerges a similar perspective of job satisfaction. Holtom,
Mitchell & Lee (2006) defined the dimension of “fit” as an employee’s perceived
compatibility with organization and environment; “link” as formal and informal
connection between employee and organization and “sacrifice” as the perceived
cost or psychological benefits which forfeited from the organizational departure.
These dimensions were measured from the same attributions including employee’s
work environment, supervision, co-workers and pay (Griffeth, Hom & Gaertner
2000).
Through job embeddedness, a new perspective on organizational behaviour which
represents a broad constitution of influences on employee wellbeing immersed in
the employee background (Mitchell et al. 2001). As mentioned by Loius (1980), the
idea of misfit contributed to unmet expectations which would cause surprise or
dissatisfaction as well as ignorance to employee wellbeing. Job embededdness is
56
agreed as a stronger predictor of job outcome and psychological explanation such
as job satisfaction (Holtom et al. 2006). This is supported with a recent study by
Sun, Zhao, Yang & Fan (2011) saying that positive psychological state makes
employees easily linked with and embedded with the organization and job.
Therefore (Mitchell et al. 2001) suggested that careful attention with the
connections employees make with people, institution and activities inside and
outside the organization are required.
2.9 Theoretical framework
The theoretical framework of this study was drawn from a broad research tradition
which links leader-member exchange (LMX) and wellbeing in relationship to
turnover intention. The research contribution to this framework includes 3 main
researches. Both the independent variables namely as LMX and wellbeing is going
to be used to identify their relationship with turnover intention as the dependent
variable. In between those studies, it will also try to determine the relationship
between LMX and wellbeing.
Several researchers have examined the relationship between LMX and turnover
intention (Collins 2007; Graen et al. 1982; Harris et al. 2005; Morrow et al. 2005;
Schyns et al. 2007) and the results vary considerably. The LMX construct is based
on the principle given by most of the scholars including mutual trust, respect and
also the leader’s obligations (Choy 2009; Dienesch & Liden 1986; Graen &
Cashman 1975; Graen et al. 1982). The study is also going to partially mediate the
employee wellbeing in order to look at the effect on employee intention towards
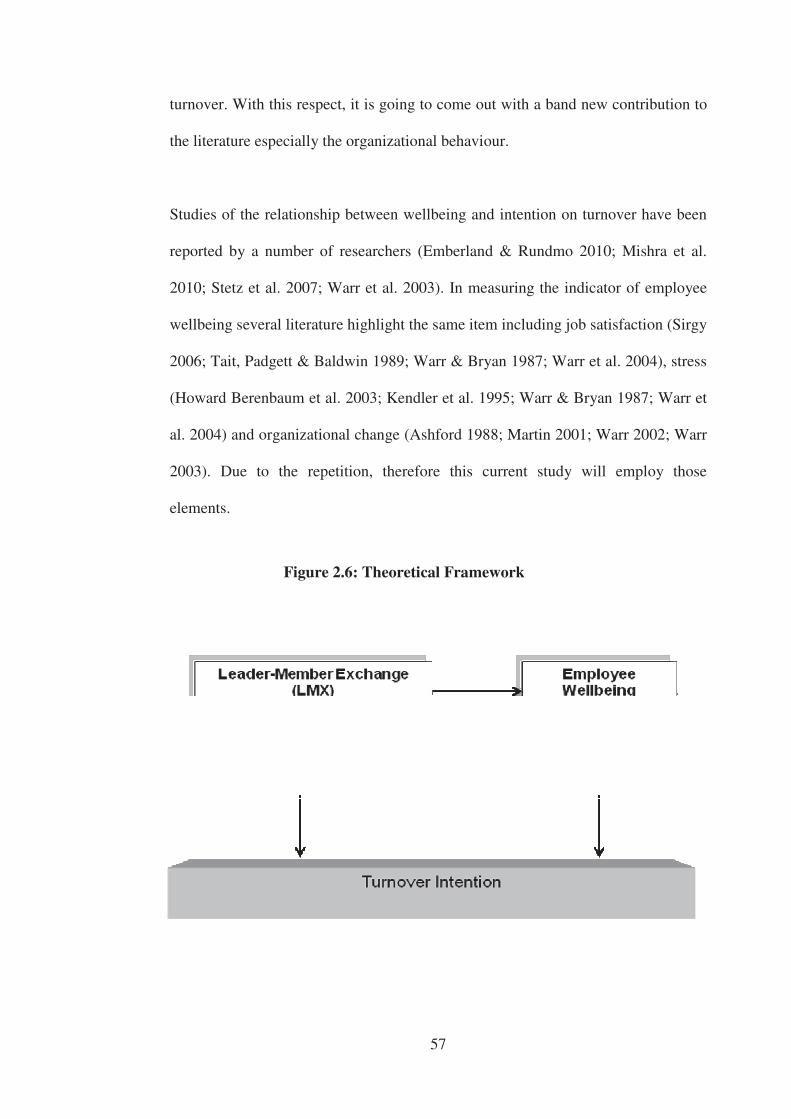
57
turnover. With this respect, it is going to come out with a band new contribution to
the literature especially the organizational behaviour.
Studies of the relationship between wellbeing and intention on turnover have been
reported by a number of researchers (Emberland & Rundmo 2010; Mishra et al.
2010; Stetz et al. 2007; Warr et al. 2003). In measuring the indicator of employee
wellbeing several literature highlight the same item including job satisfaction (Sirgy
2006; Tait, Padgett & Baldwin 1989; Warr & Bryan 1987; Warr et al. 2004), stress
(Howard Berenbaum et al. 2003; Kendler et al. 1995; Warr & Bryan 1987; Warr et
al. 2004) and organizational change (Ashford 1988; Martin 2001; Warr 2002; Warr
2003). Due to the repetition, therefore this current study will employ those
elements.
Figure 2.6: Theoretical Framework
58
2.10 Conclusion
This chapter provided a review and discussion of a literature for the theoretical
foundation of this study. The review contended several parts- a detailed review on
turnover intention including the antecedents and consequences of turnover
intention, a review of literature on the LMX and employee wellbeing together with
a comprehensive dimension of LMX-turnover intention and employee wellbeing-
turnover intention relationships. The discussion of previous studies reveals that
there is relatively little understanding about the significance of employee wellbeing
in the relationship of LMX and turnover intention. In regard to the issue, this
chapter presented a theoretical framework of the relationships between turnover
intention, LMX and employee wellbeing. The framework serves as a basis for
answering the research question developed in Chapter 1. Following this chapter,
research design and data collection will be presented in the next chapter.
59
CHAPTER 3
RESEARCH METHODOLOGY
3.1 Introduction
This chapter outlines method, used in this research, to test the hypotheses and
conceptual framework discussed in Chapter 2. A quantitative approach through a
large survey research has been utilised. The chapter aims to (1) describe the
research design (2) explain the population and sample selection (3) discuss the
measurement used in the instrument and data collection and (4) outline the
statistical methods used to analyse the data.
3.2 Research Design
A quantitative approach was used in this study in order to provide statistical data to
empirically test the relationship between dependent and independent variables
(Hair, Joseph, Bush & Ortinau 2000). Quantitative research allows collection of
data from a large group of respondents (Morgan 1998).
Data were obtained through distribution of a questionnaire. This method has been
consistently used by turnover intention researchers due to the methodological
effectiveness in evaluating the relationship among variables of interest statistically
60
(Egan, Yang & Bartlett 2004; Igbaria & Greenhaus 1992; Lee & Mowday 1987;
Mobley, Horner & Hollingsworth 1978).
3.3 Population and Sampling
The study was conducted among academicians at Community Colleges in
Malaysia. There has been little turnover research conducted among public sector
organizations in developing countries (Yaghi & Alibeli 2013). There are seventy
two branches of community college all over Malaysia with a total of 3042
academicians, classified as; lecturer, teacher and trainer with different
qualifications (3 PhD, 394 Masters, 1961 Degree and 684 Diplomas)(DCCE, 2010).
The selected organization is the high potential on actual turnover (9.8%) as
recorded in the previous statistical report (MOHE 2010). In New Economic Model
2009, the Malaysian prime minister encouraged staff to transfer to some other
academic institutions (Nordin 2010) subsequently the number of academics leaving
community colleges is increasing annually. Every year, around 200 to 250 new
staffs are required to fill the vacuum. With only 50 to 75 qualified people applying
(MOHE 2010). This drives their interest to know why some of the academicians
would like to transfer to other organization.
For the pilot study, the sampling frame was among the academicians from all
different institutions in Malaysia. They have the same working environment as the
actual sample for this study.
61
The sampling frame for main study was among the population of the academicians
in community college. This study only focuses on the community college located in
Peninsular Malaysia. The reason of choosing this area is because it has recorded a
high rate of actual turnover in previous years based on statistics of higher education
Malaysia (MOHE 2010).
For the actual study, purposive sampling technique has been employed in choosing
the sample for this study. Purposive sampling method is a non-probability method
where the respondents were chosen from the recommendation of knowledgeable
people (Tongco 2007). On top of that, this sampling technique was chosen due to
its ability to focus on a particular group that can provide reliable and robust data
(Sekaran & Bougie 2010; Tongco 2007). It is noted that this techniques has been
employed throughout the decade in turnover studies (Aarons, Fettes, Sommerfeld &
Palinkas 2012; Ang & Slaughter 2004; Ross 1984; Zhang & Feng 2011). The
purposive sampling method was also selected because the sampling informant had
the same level of knowledge or skills (Ardichvili, Page & Wentling 2003). With
regards to this sampling method, it allows to document events that similar group of
people in community colleges witness or involve (Zelditch 1962).
Finally, numbers of 2042 participants were identified from 68 out of 72 branches of
community colleges all around Peninsular Malaysia. Every academician of the
selected college had been given a set of questionnaire regarding their intention on
turnover based on factor of LMX and employee wellbeing together a few items on
demographics background. The questionnaires, sealed by the respondents were
62
handed to the representatives identified by me from the colleges. No names were
mentioned to secure secrecy.
3.4 Instrumentation
The dependent variable in this study is turnover intention while the independent
variables are LMX and employee wellbeing. Variables were measured using a
questionnaire derived using existing scales. Questionnaire items were drawn from
the existing validated research instruments used in the previous studies. Data
collection using questionnaires has been widely used as a substantive method in
turnover studies (Chun, Wong & Tjosvold 2007; Herrbach, Mignonac & Gatignon
2004; Lam et al. 2002; Mardanov et al. 2008).
Questionnaire items were translated into the Malaysian national language (Bahasa
Melayu) and back translated into English to validate translation for the research
purposes (Brislin 1970). Back translation was undertaken, by two English lecturers
from English Department, University Technology of Malaysia, both fluent, in both
Bahasa Melayu and English. The questionnaire was translated into Bahasa Melayu
purposely to make it easier since it is their mother tongues. Following that, it has
been back-translated into English in order to make sure the term and message
remain the same (Brislin 1986). Both translations revealed that there is no
significant difference in the meaning of each items in the questionnaire. Translation
into Bahasa Melayu was to ensure reliability among responses (Bates &
Khasawneh 2005). Pre-testing of questionnaire items was performed with a pilot
sample to ensure that the questionnaire was comprehensible. It also helped in the
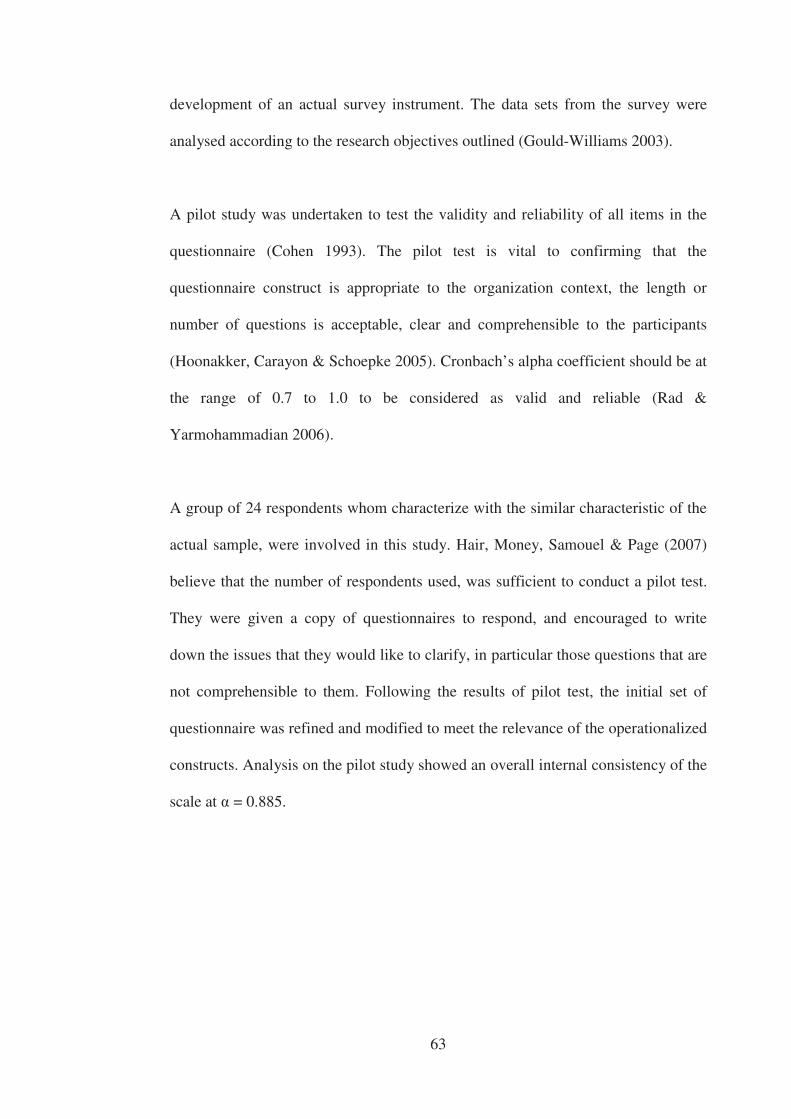
63
development of an actual survey instrument. The data sets from the survey were
analysed according to the research objectives outlined (Gould-Williams 2003).
A pilot study was undertaken to test the validity and reliability of all items in the
questionnaire (Cohen 1993). The pilot test is vital to confirming that the
questionnaire construct is appropriate to the organization context, the length or
number of questions is acceptable, clear and comprehensible to the participants
(Hoonakker, Carayon & Schoepke 2005). Cronbach’s alpha coefficient should be at
the range of 0.7 to 1.0 to be considered as valid and reliable (Rad &
Yarmohammadian 2006).
A group of 24 respondents whom characterize with the similar characteristic of the
actual sample, were involved in this study. Hair, Money, Samouel & Page (2007)
believe that the number of respondents used, was sufficient to conduct a pilot test.
They were given a copy of questionnaires to respond, and encouraged to write
down the issues that they would like to clarify, in particular those questions that are
not comprehensible to them. Following the results of pilot test, the initial set of
questionnaire was refined and modified to meet the relevance of the operationalized
constructs. Analysis on the pilot study showed an overall internal consistency of the
scale at = 0.885.
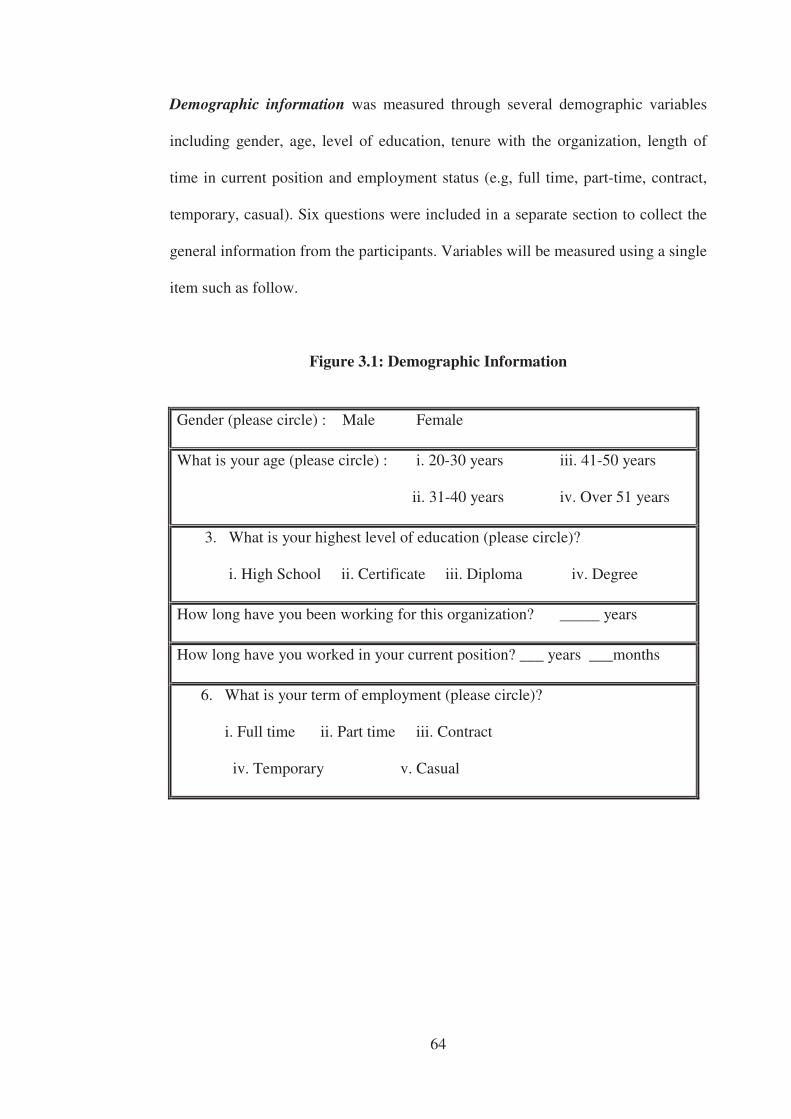
64
Demographic information was measured through several demographic variables
including gender, age, level of education, tenure with the organization, length of
time in current position and employment status (e.g, full time, part-time, contract,
temporary, casual). Six questions were included in a separate section to collect the
general information from the participants. Variables will be measured using a single
item such as follow.
Figure 3.1: Demographic Information
Gender (please circle) : Male Female
What is your age (please circle) : i. 20-30 years iii. 41-50 years
ii. 31-40 years iv. Over 51 years
3. What is your highest level of education (please circle)?
i. High School ii. Certificate iii. Diploma iv. Degree
How long have you been working for this organization? _____ years
How long have you worked in your current position? ___ years ___months
6. What is your term of employment (please circle)?
i. Full time ii. Part time iii. Contract
iv. Temporary v. Casual
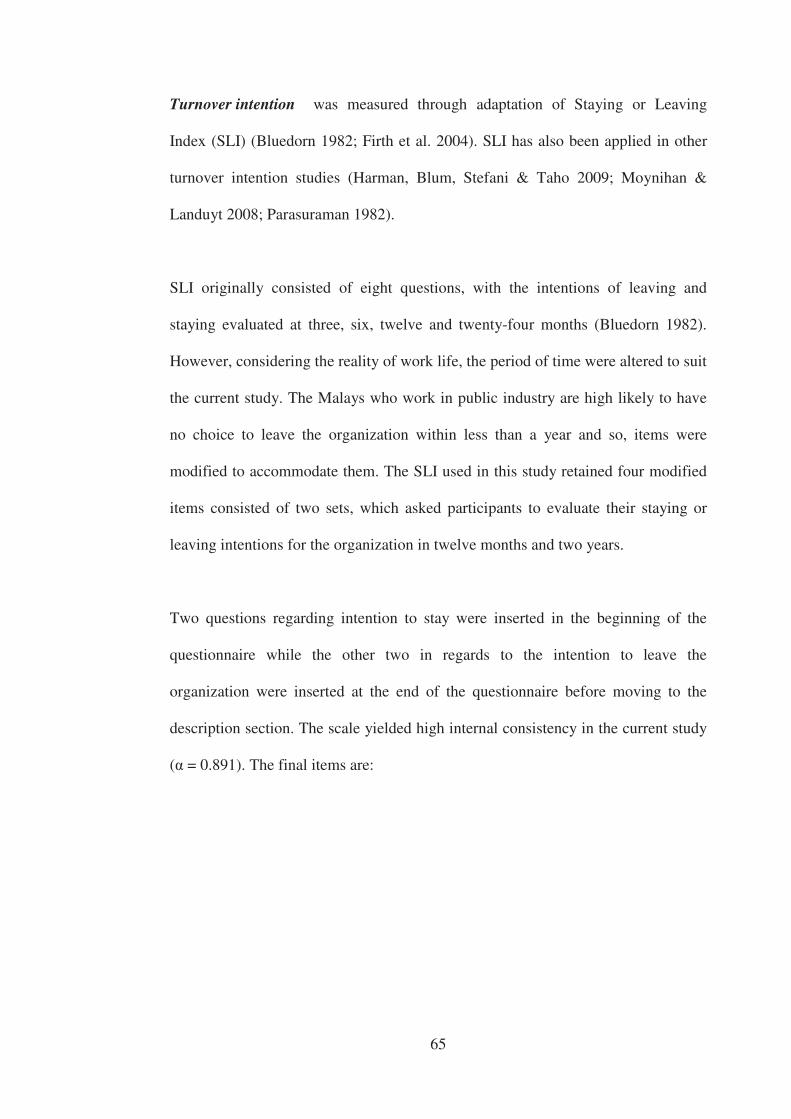
65
Turnover intention was measured through adaptation of Staying or Leaving
Index (SLI) (Bluedorn 1982; Firth et al. 2004). SLI has also been applied in other
turnover intention studies (Harman, Blum, Stefani & Taho 2009; Moynihan &
Landuyt 2008; Parasuraman 1982).
SLI originally consisted of eight questions, with the intentions of leaving and
staying evaluated at three, six, twelve and twenty-four months (Bluedorn 1982).
However, considering the reality of work life, the period of time were altered to suit
the current study. The Malays who work in public industry are high likely to have
no choice to leave the organization within less than a year and so, items were
modified to accommodate them. The SLI used in this study retained four modified
items consisted of two sets, which asked participants to evaluate their staying or
leaving intentions for the organization in twelve months and two years.
Two questions regarding intention to stay were inserted in the beginning of the
questionnaire while the other two in regards to the intention to leave the
organization were inserted at the end of the questionnaire before moving to the
description section. The scale yielded high internal consistency in the current study
( = 0.891). The final items are:
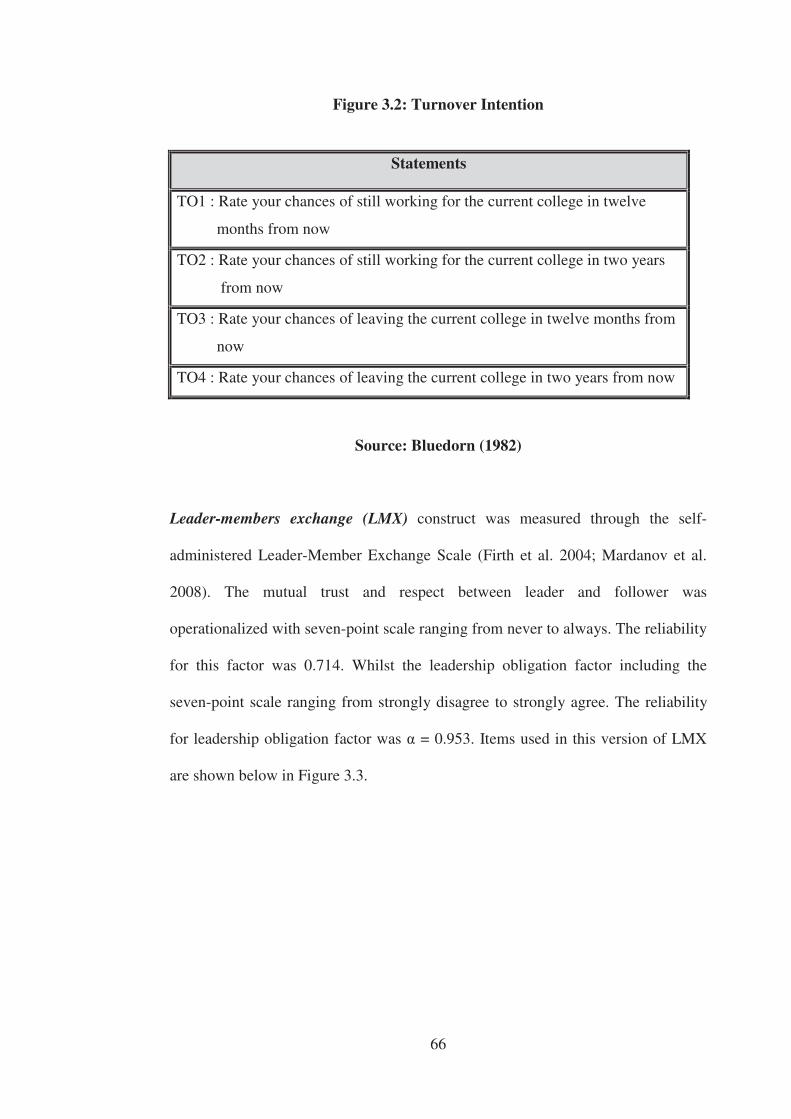
66
Figure 3.2: Turnover Intention
Statements
TO1 : Rate your chances of still working for the current college in twelve
months from now
TO2 : Rate your chances of still working for the current college in two years
from now
TO3 : Rate your chances of leaving the current college in twelve months from
now
TO4 : Rate your chances of leaving the current college in two years from now
Source: Bluedorn (1982)
Leader-members exchange (LMX) construct was measured through the self-
administered Leader-Member Exchange Scale (Firth et al. 2004; Mardanov et al.
2008). The mutual trust and respect between leader and follower was
operationalized with seven-point scale ranging from never to always. The reliability
for this factor was 0.714. Whilst the leadership obligation factor including the
seven-point scale ranging from strongly disagree to strongly agree. The reliability
for leadership obligation factor was = 0.953. Items used in this version of LMX
are shown below in Figure 3.3.
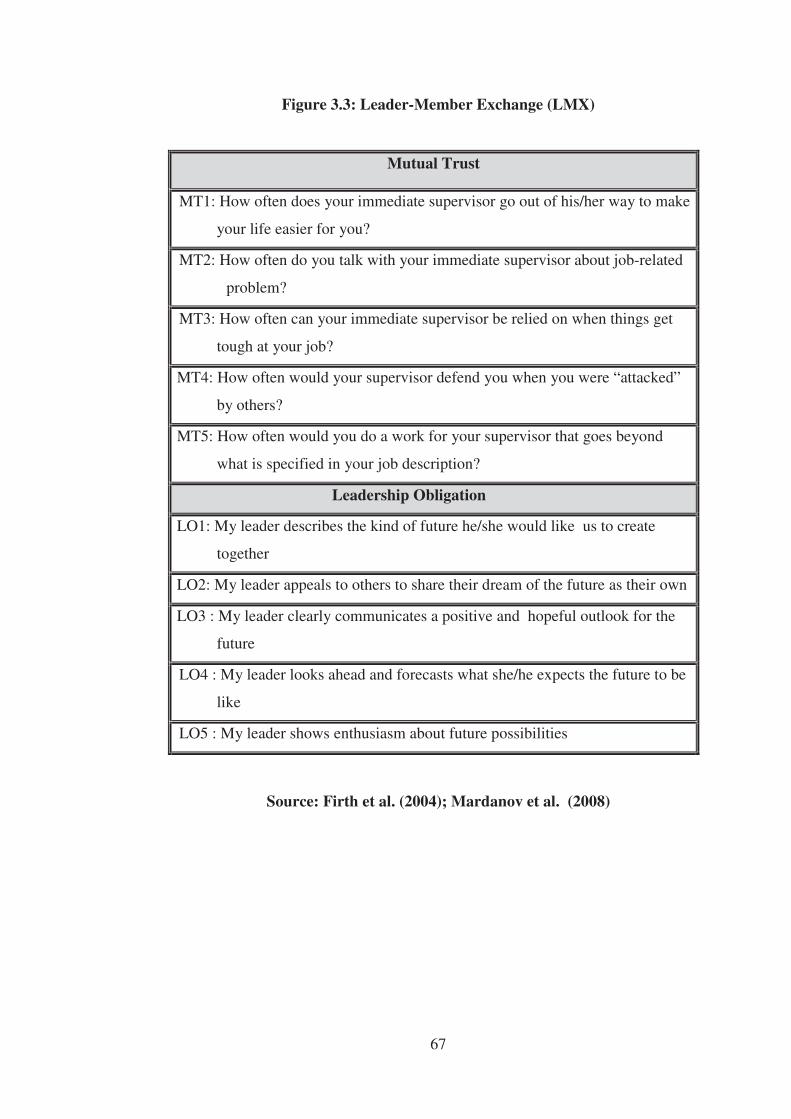
67
Figure 3.3: Leader-Member Exchange (LMX)
Mutual Trust
MT1: How often does your immediate supervisor go out of his/her way to make
your life easier for you?
MT2: How often do you talk with your immediate supervisor about job-related
problem?
MT3: How often can your immediate supervisor be relied on when things get
tough at your job?
MT4: How often would your supervisor defend you when you were “attacked”
by others?
MT5: How often would you do a work for your supervisor that goes beyond
what is specified in your job description?
Leadership Obligation
LO1: My leader describes the kind of future he/she would like us to create
together
LO2: My leader appeals to others to share their dream of the future as their own
LO3 : My leader clearly communicates a positive and hopeful outlook for the
future
LO4 : My leader looks ahead and forecasts what she/he expects the future to be
like
LO5 : My leader shows enthusiasm about future possibilities
Source: Firth et al. (2004); Mardanov et al. (2008)
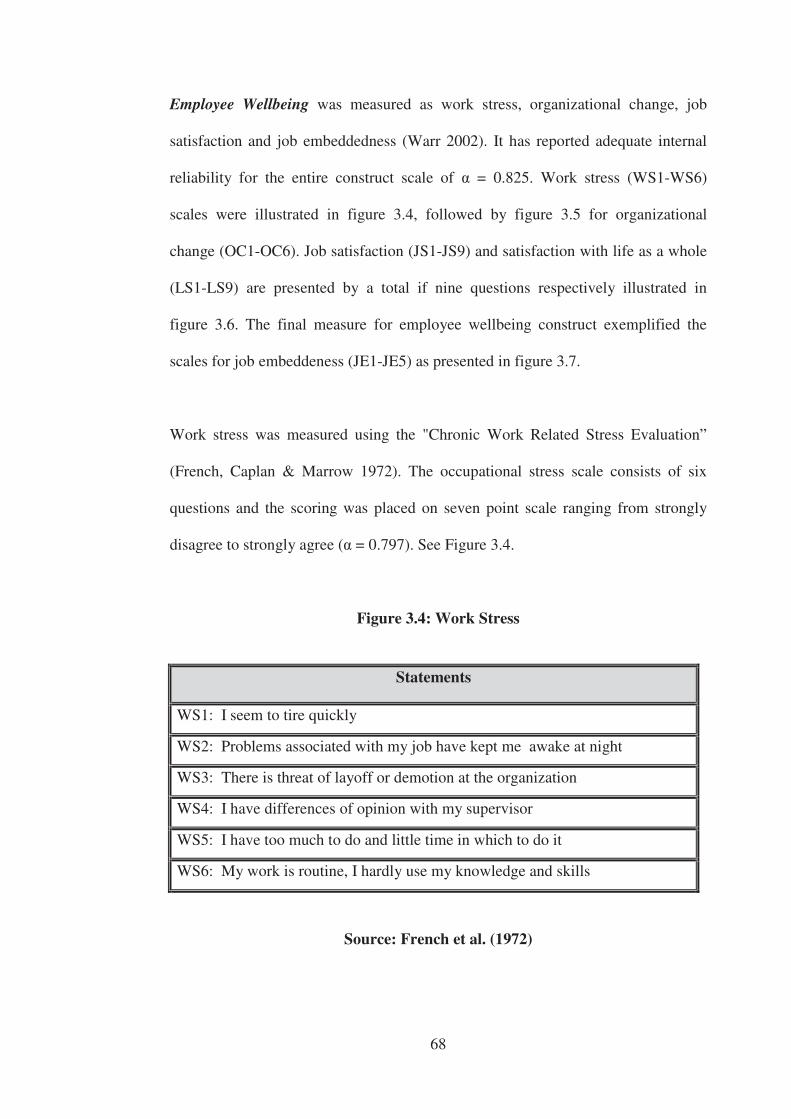
68
Employee Wellbeing was measured as work stress, organizational change, job
satisfaction and job embeddedness (Warr 2002). It has reported adequate internal
reliability for the entire construct scale of = 0.825. Work stress (WS1-WS6)
scales were illustrated in figure 3.4, followed by figure 3.5 for organizational
change (OC1-OC6). Job satisfaction (JS1-JS9) and satisfaction with life as a whole
(LS1-LS9) are presented by a total if nine questions respectively illustrated in
figure 3.6. The final measure for employee wellbeing construct exemplified the
scales for job embeddeness (JE1-JE5) as presented in figure 3.7.
Work stress was measured using the "Chronic Work Related Stress Evaluation”
(French, Caplan & Marrow 1972). The occupational stress scale consists of six
questions and the scoring was placed on seven point scale ranging from strongly
disagree to strongly agree ( = 0.797). See Figure 3.4.
Figure 3.4: Work Stress
Statements
WS1: I seem to tire quickly
WS2: Problems associated with my job have kept me awake at night
WS3: There is threat of layoff or demotion at the organization
WS4: I have differences of opinion with my supervisor
WS5: I have too much to do and little time in which to do it
WS6: My work is routine, I hardly use my knowledge and skills
Source: French et al. (1972)
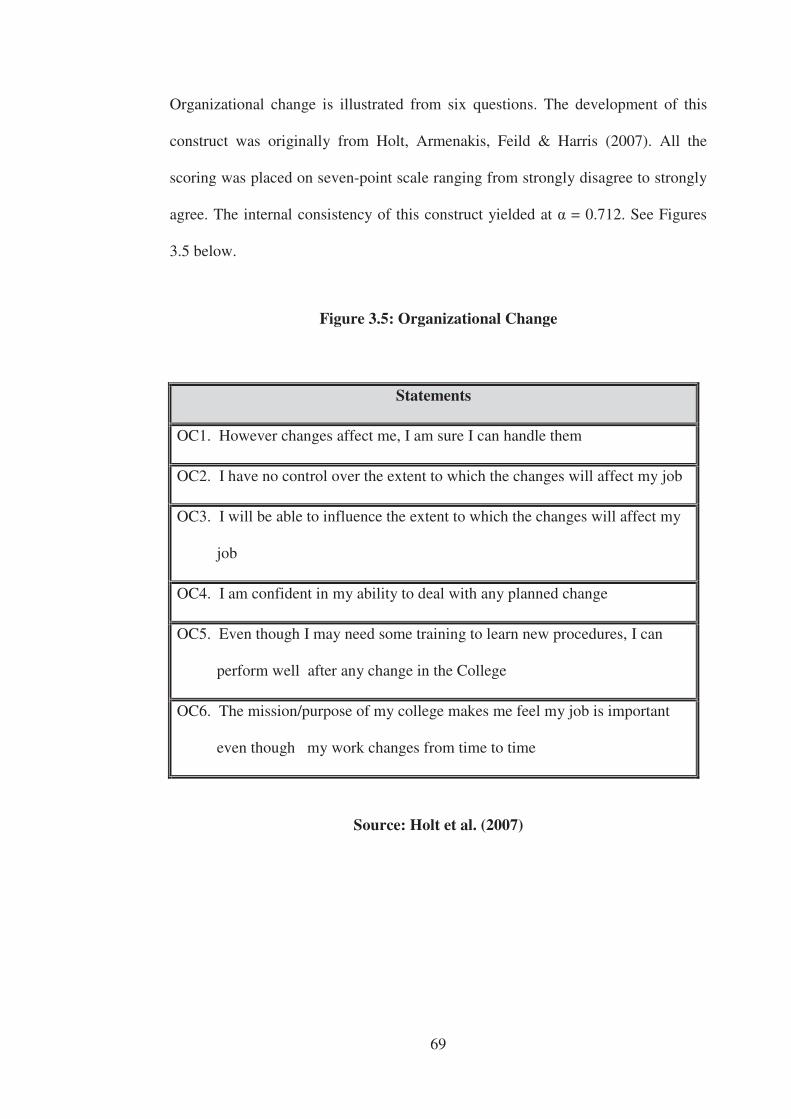
69
Organizational change is illustrated from six questions. The development of this
construct was originally from Holt, Armenakis, Feild & Harris (2007). All the
scoring was placed on seven-point scale ranging from strongly disagree to strongly
agree. The internal consistency of this construct yielded at = 0.712. See Figures
3.5 below.
Figure 3.5: Organizational Change
Statements
OC1. However changes affect me, I am sure I can handle them
OC2. I have no control over the extent to which the changes will affect my job
OC3. I will be able to influence the extent to which the changes will affect my
job
OC4. I am confident in my ability to deal with any planned change
OC5. Even though I may need some training to learn new procedures, I can
perform well after any change in the College
OC6. The mission/purpose of my college makes me feel my job is important
even though my work changes from time to time
Source: Holt et al. (2007)
70
Job satisfaction and satisfaction with life as a whole factor were determined through
items based on Personal Wellbeing Index-Adult (PWI-A) for ‘The International
Wellbeing Group 2006’ (Cummins & Group 2006). PWI-A is needed in this study
typically to explains the variance in satisfaction with life not only focusing at work
environment but looking at life as a whole. There are 9 items measuring the job
satisfaction factor rated on seven-point likert scale ranging from strongly disagree
to strongly disagree. This factor showed a reliability = 0.888.
Satisfaction with life as a whole was measured using 9 items scoring from
extremely dissatisfied to extremely satisfied. The reliability was recorded as =
0.878. The question items are in Figure 3.6.
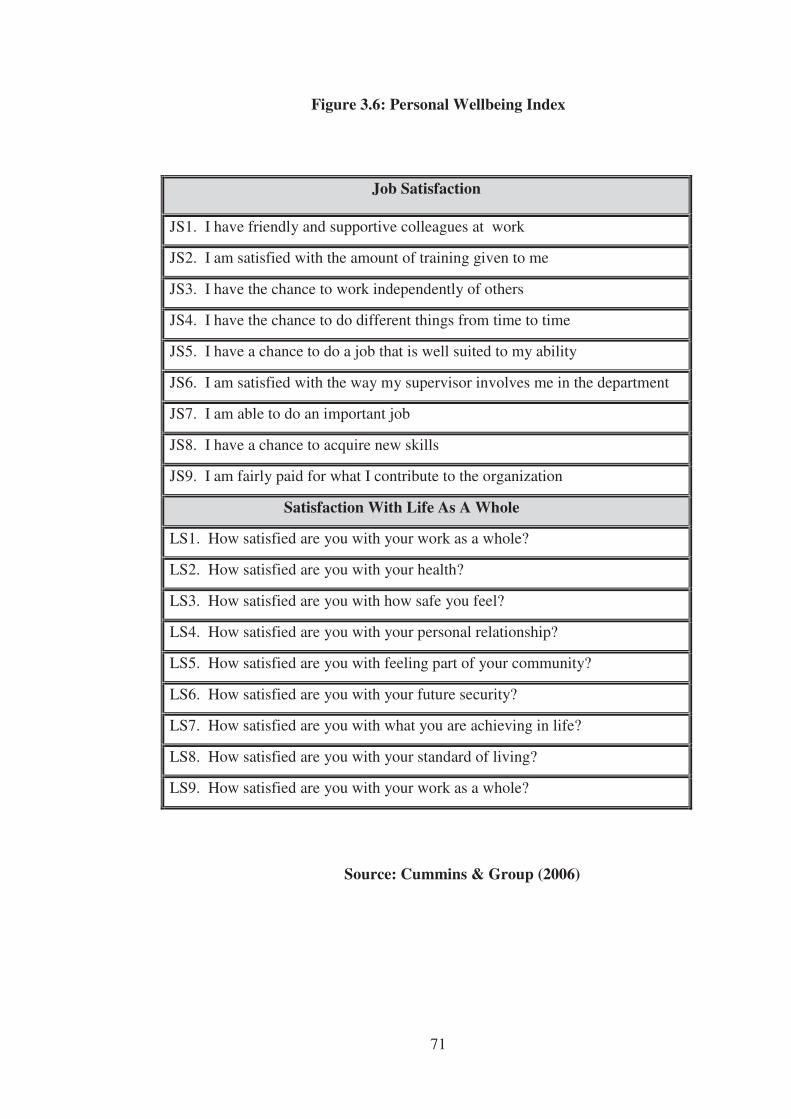
71
Figure 3.6: Personal Wellbeing Index
Source: Cummins & Group (2006)
Job Satisfaction
JS1. I have friendly and supportive colleagues at work
JS2. I am satisfied with the amount of training given to me
JS3. I have the chance to work independently of others
JS4. I have the chance to do different things from time to time
JS5. I have a chance to do a job that is well suited to my ability
JS6. I am satisfied with the way my supervisor involves me in the department
JS7. I am able to do an important job
JS8. I have a chance to acquire new skills
JS9. I am fairly paid for what I contribute to the organization
Satisfaction With Life As A Whole
LS1. How satisfied are you with your work as a whole?
LS2. How satisfied are you with your health?
LS3. How satisfied are you with how safe you feel?
LS4. How satisfied are you with your personal relationship?
LS5. How satisfied are you with feeling part of your community?
LS6. How satisfied are you with your future security?
LS7. How satisfied are you with what you are achieving in life?
LS8. How satisfied are you with your standard of living?
LS9. How satisfied are you with your work as a whole?
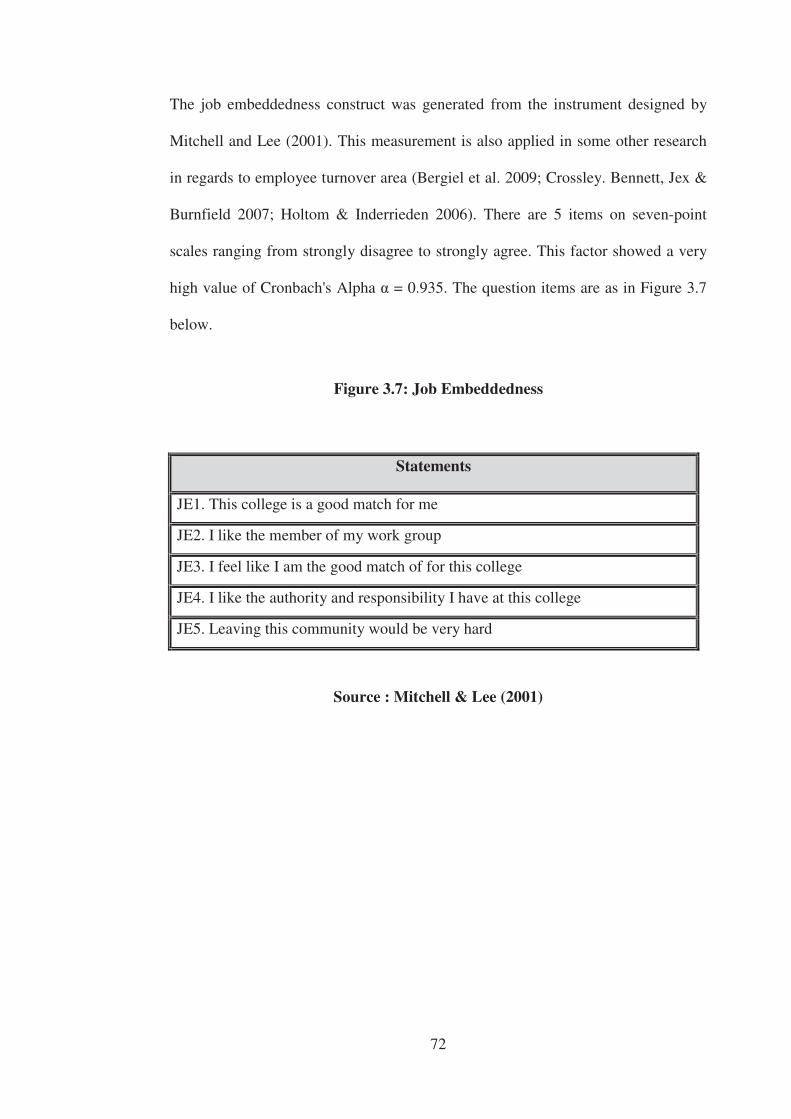
72
The job embeddedness construct was generated from the instrument designed by
Mitchell and Lee (2001). This measurement is also applied in some other research
in regards to employee turnover area (Bergiel et al. 2009; Crossley. Bennett, Jex &
Burnfield 2007; Holtom & Inderrieden 2006). There are 5 items on seven-point
scales ranging from strongly disagree to strongly agree. This factor showed a very
high value of Cronbach's Alpha = 0.935. The question items are as in Figure 3.7
below.
Figure 3.7: Job Embeddedness
Statements
JE1. This college is a good match for me
JE2. I like the member of my work group
JE3. I feel like I am the good match of for this college
JE4. I like the authority and responsibility I have at this college
JE5. Leaving this community would be very hard
Source : Mitchell & Lee (2001)
73
3.5 Data Collection Procedure
Prior to the collection of the data, an official approval letter was obtained from the
General Director of Community College and Deakin University Ethics Committee
(Appendix A); that enabled the researcher to access the list of academicians as
subjects in this study.
As indicated earlier, questionnaires were distributed by a representative of each
community college who had been made aware of the aims and background of the
study and the issue regarding the anonymity and confidentiality of the responses.
To ensure the anonymity and confidentiality of the response, each respondent was
provided with a sealed envelope to return the completed survey (Chen 2001; Kim
et al. 2010). The questionnaires were given back to the selected representatives by
hand. Once collected, they will then send them back to me personally. The process
was done in three months from September to November 2011.
3.6 Data Analysis
The data assembled were analysed using quantitative method. Quantitative method
was chosen due to its ability in explaining phenomena by collecting numerical data
that is going to be analyse using mathematical based (Muijs 2011).
To present the main characteristics of the sample, this study employed descriptive
statistics which include frequencies, percentages, means, and standard deviations
(Pallant 2010). Specifically to test the study hypotheses, structural equation
74
modelling (SEM) was used. It is suitable for this study because it subject to test the
existing model or theory and also estimating causal relations using combination of
statistical data (Kline 2010). This technique allows confirmatory modelling which
suit for both, theory testing and theory development (Hair, Black & Babin 2010).
Specifically in this study, SEM was considered because the research model consists
of several latent variables and involves mediating variables (Luna-Arocas & Camps
2008). To measure the hypothesized model of this study through SEM, fit indices
were used to acquire the goodness of the model (Byrne 2010). Since the instrument
was adaptation of the previous studies instrument, it was exempted from
undertaking the test for factor unidimentionality as in the Exploratory Factor
Analysis (EFA) and should proceed with the Confirmatory Factor Analysis (CFA).
3.7 Conclusion
This chapter described and justified the study design and method including pilot
and main study. It concluded that based on the result of the reliability test, each
construct of the instrument were reliable for the use in the main study. Starting
from an overview of the research design, the population and sampling method,
instrumentation and data analysis were described in detail. A further explanation of
the analysis techniques which will test the hypotheses developed and discussion of
the conceptual framework of this study are shown in the following chapter (Chapter
4).
75
CHAPTER 4
DATA ANALYSIS AND RESULTS
4.1 Introduction
This chapter presents the results of the survey, including empirical tests of the
hypotheses advanced in this thesis. It begins with the model refinement process,
followed by data screening and a discussion of the sample.
Following this are sub-sections that discuss the assessment of the measurement
model through confirmatory factor analysis for each construct in this study,
including turnover intention, leader-member exchange (LMX) and employee
wellbeing. Finally, tests of the structural model through assessment of its causal
associations are reported.
4.2 Model Refinement Process
The model refinement process comprised from pilot study towards the main study
instrument. The reason for this refinement process was to ensure both reliability
and validity of all item sets used (Straub, Boudreau & Gefen 2004). Three stages
were involved, beginning with reliability testing of each item-set per construct
using Cronbach's Alpha (Churchill 1979; Hair et al. 2010), a test of the remaining
items for convergent validity using confirmatory factor analysis (CFA) (Anderson
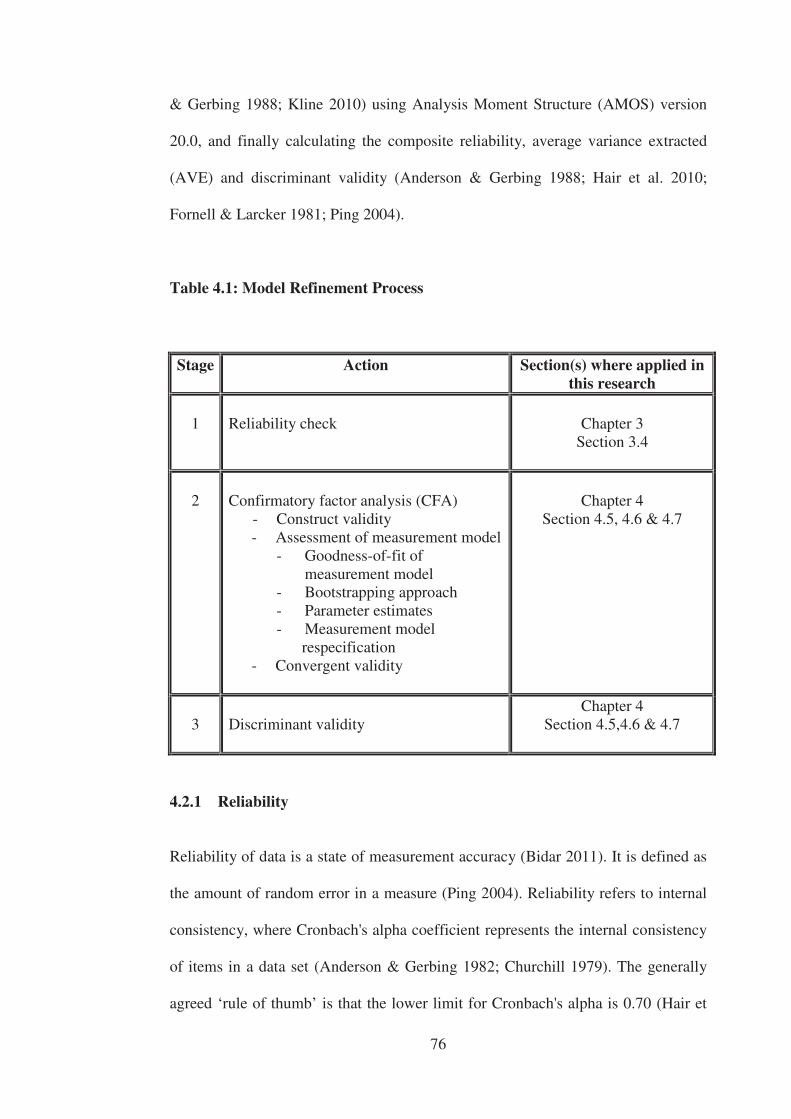
76
& Gerbing 1988; Kline 2010) using Analysis Moment Structure (AMOS) version
20.0, and finally calculating the composite reliability, average variance extracted
(AVE) and discriminant validity (Anderson & Gerbing 1988; Hair et al. 2010;
Fornell & Larcker 1981; Ping 2004).
Table 4.1: Model Refinement Process
Stage Action Section(s) where applied in this research
1
Reliability check
Chapter 3
Section 3.4
2
Confirmatory factor analysis (CFA)
- Construct validity - Assessment of measurement model
- Goodness-of-fit of measurement model
- Bootstrapping approach - Parameter estimates - Measurement model
respecification - Convergent validity
Chapter 4
Section 4.5, 4.6 & 4.7
3
Discriminant validity
Chapter 4 Section 4.5,4.6 & 4.7
4.2.1 Reliability
Reliability of data is a state of measurement accuracy (Bidar 2011). It is defined as
the amount of random error in a measure (Ping 2004). Reliability refers to internal
consistency, where Cronbach's alpha coefficient represents the internal consistency
of items in a data set (Anderson & Gerbing 1982; Churchill 1979). The generally
agreed ‘rule of thumb’ is that the lower limit for Cronbach's alpha is 0.70 (Hair et
77
al. 2010) and items were excluded in this study if their deletion resulted in
improved internal consistency. Items that contributed least to Cronbach's alpha
value were the first to be considered for deletion (DeVellis 1991). The results for
this stage of model refinement were explained in Chapter 3. The reliable item-sets
were then employed in the main study instrument.
4.2.2 Confirmatory Factor Analysis (CFA)
The following stage was to confirm the validity since reliability does not ensure
validity (Kline 2010). In the second stage of the model refinement process,
confirmatory factor analysis was undertaken, which demonstrated construct validity
and convergent validity. CFA is a key component of SEM confirming the validity
of the existence of factorial structures (Hair et al. 2010). Further, CFA also
represents the measurement model of SEM (Al-Dossary 2008; Loehlin 1992).
The measurement model shows a relationship between items known as observed
variables (indicators) and underlying factors that are represented by latent variables
(theoretical constructs) (Jöreskog & Sörbom 1982). The measurement model is
most commonly used to determine the patterns of interrelationships among several
constructs (Anderson & Gerbing 1982). A good measurement model is a
requirement to the analysis of the causal relations among the latent variables
(Anderson & Gerbing 1982). The assessment of convergent and discriminant
validity of the related constructs are established through the factor loadings and
goodness-of-fit-measures. The relationships among the manifest variables would be
attributable to the theoretical latent construct (Cohen et al. 2003), which means that
78
once a successful model is found, possibly after respecification, it is then focussed
on in the estimation of the theoretical model.
To begin with, a measurement model was developed for each of the constructs
based on the treatment of outliers. The method of estimation was chosen to
establish the difference between the observed and estimated covariance matrices
(Anderson & Gerbing 1988). No dependent relationship between constructs should
be included in the model; alternatively, co-variational relationships should be used
(Byrne 2010). A single-factor congeneric measurement model should be developed
initially and expanded to the factors that comprise a high-order construct and finally
to all of the factors / constructs included in the study. Throughout the assessment of
the measurement models, goodness-of-fit statistics were evaluated and if found to
be unfit, model re-specification was undertaken (Saleh 2006).
In this study, data retained in SPSS Version 20 was submitted to a confirmatory
factor analysis (CFA), which was conducted using AMOS. The principle
component was utilised to define the relationship between observed and latent
variables (Collins 2007). Each latent variable was assumed to affect the
dependence's scores in individual questionnaire items. The latent variables in this
study consist of turnover intention, LMX and employee wellbeing. All of these
constructs were measured by a higher order factor (Keith, Fine, Taub, Reynolds &
Kranzler 2006).
79
4.2.2.1 Construct Validity
Construct validity exists when an instrument is a good representation of the
construct it is intended to measure (Bollen 1989; DeVellis 1991). It is represented
by the goodness-of-fit indices of a model. Goodness-of-fit shows the best
relationship between constructs or part measures of constructs that define a model,
which purport to confirm the construct validity of the construct (Ping 2004). The
correlation between target measures (i.e., observed variables or indicators),
significance value, direction and magnitude are indicators to support construct
validity.
4.2.2.2 Assessment of Measurement Models
There are two crucial elements in assessing a measurement model, namely
goodness-of-fit and the estimation of parameters of the model (Bryne 2001; Fan &
Wang 1998; Hu & Bentler 1999).
4.2.2.2.1 Goodness-of-fit Measurement Models
Overall, model fit referred to three types of goodness-of-fit measures (1) absolute
fit measures, (2) incremental fit measures, and (3) parsimony fit measures. They are
used to compare and observe the covariance matrices (Hair et al. 2010). However,
Arbuckle (2009) and Byrne (2010) suggest that there are different ‘rules of thumb’
in deciding the minimum level requirement of the values for good model fit.
80
Absolute fit measures allow detail to the extent where the model as a whole shows
an acceptable fit to the data (Hair et al. 2010). Incremental fit measures assess how
much better the model that assumes some relationships is compared to the null
model in which no relationships among the variables are proposed (Bollen 1998).
Parsimonious fit measures consider the number of estimate coefficients required to
achieve a level of fit (Hair et al. 2010). The measurement models were tested for
one pair of factors at a time. The rationale for this is that a non-significant value for
one pair of factors can be hidden when tested with several pairs that have
significant values (Anderson & Gerbing 1988).
In measuring the overall fit of the measurement models, the value of x2 (chi-
square), together with its associated degrees of freedom (df) at the non-significant
value of p>0.01 were utilized (Hair et al. 2010). The value of x2 over df (x2/df) will
have to be smaller than 3 to attain a good-fitting model. However, the attribute of
x2/df is significantly sensitive to sample size therefore the scores ranging from 4 to
5 are deemed acceptable (Hair et al. 2010; Lei & Wu (2007), Tanaka (1987) &
Ullman & Bentler (2013) .
Together with these, other fit indices including Root Mean Square Error of
Approximation (RMSEA), Standardized Root Mean Square Residual (SRMR),
Goodness of Fit Index (GFI), Adjusted Goodness of Fit Index (AGFI), and
Comparative Fit Index (CFI) were employed. The RMSEA represents the
discrepancy per degree of freedom between the population data and the
hypothesized model (Al-Dossary 2008). According to Hair et al. (2010), RMSEA
values of less than 0.5 can be considered as good fit values, 0.8 as acceptable fit
81
and values greater than 0.10 indicate poor fit. In contrast, the SRMR represents the
average value across all standardized residuals and ranges from 0 to 1 (Byrne
2010). However, in order to acquire a good fitting model, the value should be
smaller than 0.08.
GFI and AGFI are similar to squared multiple correlations and indicate the relative
amount of sample variance and covariance explained by a model. However, AGFI
adjusts the number of degrees of freedom in the specified model (Al-Dossary
2008). Both indices with values exceeding 0.95 indicate a good fit for models in
studies with small sample sizes, while 0.90 and above is the benchmark for those
studies with large sample sizes (Byrne 2010; Hair et al. 2010).
In contrast, the non-normed fit index (NNFI) and comparative fit index (CFI)
compares the fit of a hypothesized model with the null model (Al-Dossary 2008).
NNFI improves the overall fit by comparing the chi-square (x2) value of the
proposed model with the null model, while CFI represents the ratio of improvement
of non-centrality in the proposed model to the non-centrality of the null model
(Hair et al. 2010). Values above 0.90 of CFI suggest a good fitting model for a
complex model with a large sample, while values above 0.95 indicate a good fitting
model when a smaller sample is employed (Hair et al. 2010). At times, values
greater than 1.0 can be obtained for these indices. Table 4.2 summarizes the
goodness-of-fit statistics and the acceptable cut-off criteria.
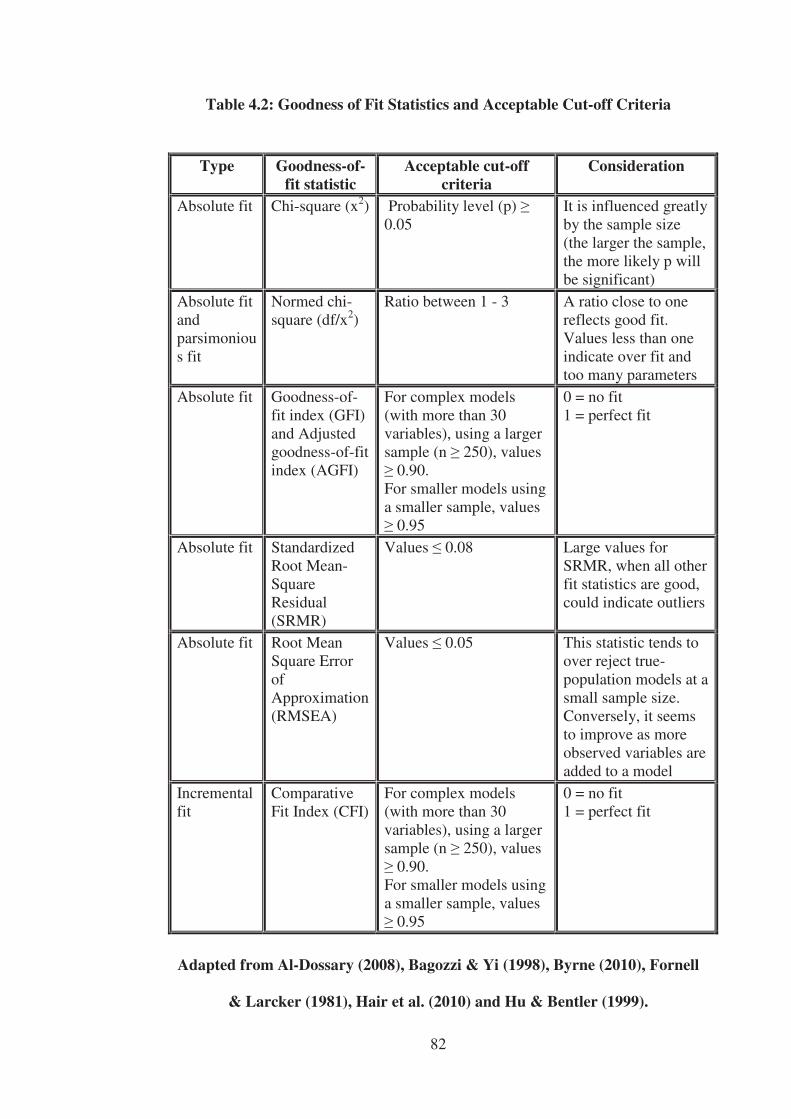
82
Table 4.2: Goodness of Fit Statistics and Acceptable Cut-off Criteria
Type Goodness-of-fit statistic
Acceptable cut-off criteria
Consideration
Absolute fit Chi-square (x2) Probability level (p) 0.05
It is influenced greatly by the sample size (the larger the sample, the more likely p will be significant)
Absolute fit and parsimonious fit
Normed chi-square (df/x2)
Ratio between 1 - 3 A ratio close to one reflects good fit. Values less than one indicate over fit and too many parameters
Absolute fit Goodness-of-fit index (GFI) and Adjusted goodness-of-fit index (AGFI)
For complex models (with more than 30 variables), using a larger sample (n 250), values
0.90. For smaller models using a smaller sample, values
0.95
0 = no fit 1 = perfect fit
Absolute fit Standardized Root Mean-Square Residual (SRMR)
Values 0.08 Large values for SRMR, when all other fit statistics are good, could indicate outliers
Absolute fit Root Mean Square Error of Approximation (RMSEA)
Values 0.05 This statistic tends to over reject true-population models at a small sample size. Conversely, it seems to improve as more observed variables are added to a model
Incremental fit
Comparative Fit Index (CFI)
For complex models (with more than 30 variables), using a larger sample (n 250), values
0.90. For smaller models using a smaller sample, values
0.95
0 = no fit 1 = perfect fit
Adapted from Al-Dossary (2008), Bagozzi & Yi (1998), Byrne (2010), Fornell
& Larcker (1981), Hair et al. (2010) and Hu & Bentler (1999).
83
4.2.2.2.2 Bootstrapping Approach
Bootstrapping is an approach that treats a random sample of data as a substitute for
the population and re-samples a specified number of times to generate sample
bootstrap estimates, standard errors and confidence intervals (Byrne 2001).
Through bootstrapping, even though the distribution of population is unknown, the
true sampling properties of statistics were examined randomly (Yung & Chan
1999).
Apart from being able to test the paths and the robustness of a model, this approach
also helps to characterize the statistical properties precisely certain particular
sample size (Bentler & Chou 1987). It contributes to creating a sub-samples from
the original sample and estimates a model for each sub-sample (Gallagher, Ting &
Palmer 2008). Further, in this research the bootstrap estimator through the Bollen
and Stine test of correctness was used to determine how stable or good the sample
statistic was as an estimate of the population parameter (Byrne 2001; Schumacker
& Lomax 1996).
4.2.2.2.3 Measurement Model Respecification
One reason for a poorly fitting model is misspecification. A poor fitting
measurement model will dictate the need for a revised model (Anderson & Gerbing
1982; Cohen et al. 2003). Evidence of misspecification derived from the initial
results of the measurement model testing where it does not accord with the priori
hypotheses suggests that respecification or reanalysis is needed (Bryne 2001). The
84
process of respecification was guided mainly by theory; where no parameters or
variables were included or excluded without theoretical support (Anderson &
Gerbing 1988; Schumacker & Lomax 2004). Possible modifications can be
detected by looking at the standardized regression weights and also the
standardized residual covariances. Anderson and Gerbing (1988) agreed that both
techniques applied to measurement model respecification are able to verify the
dimensionality of the constructs implied. Modifications to an initial model are
made, by adding or deleting one variable or parameter at a time.
Firstly, in order to ensure a strong association between factor and variable in a
measurement model, the standardized factor loadings or standardized regression
weights, of each item, are identified. The possibility to remove an item based on its
standardized factor loading or standardized regression weight is taken to be at least
0.50 on each individual item (Churchill 1979), while the best value should be
greater than 0.7 (Hair et al. 2010).
A second aid in assessing the potential source of misspecification is the value of the
standardized residual covariance. Generally, large standardized residual
covariances indicate a poorly fitted model, whereas large values for one variable
suggest misspecification for that variable only (Byrne 2010). Those standardized
residual covariances that are larger than 2.58 should be considered for deletion
(Byrne 2001).
The final route to consider is to review the critical ratios. The benchmark for
critical ratios is significantly different from zero or greater than 1.96. Critical ratios
85
are sensitive to sample size; therefore, in a small sample some parameter estimates
might not be significant. In respect to this, in considering excluding any non-
significant parameters based on the critical ratios, it is important to revise the
theoretical rationale before deciding whether to retain the parameter or to delete it.
4.2.2.2.4 Parameter Estimates
The goodness-of-fit measures assess the overall adequacy of a model, except for the
information about individual parameters explicitly and other aspects of the internal
structure of the model (Bagozzi & Yi 1988; Hu & Bentler 1999). It is possible that
various fit statistics indicate a satisfactory fit, but the parameter estimates may not
be significant with the existence of low reliability. Therefore, in order to acquire a
global fit measure, it is important that researchers also scrutinize the individual
parameters and internal structure of any model (Bagozzi & Yi 1988).
However, when considering excluding any non-significant parameters, it is vital to
consider the size of the sample because some parameter estimates might not be
significant in small samples. The theoretical rationale for the estimated parameters
needs to be taken into consideration; therefore, non-significant parameters that
make theoretical sense should be retained.
86
4.2.2.3 Convergent Validity
Convergent validity was assessed by determining whether each indicator's
estimated pattern coefficient, on its posited underlying construct factor is
significant. Convergent validity is defined as a measure of the magnitude of the
direct structural relationship between an observed variable and latent construct
(Fornell & Larcker 1981). It locates the correlation among each item in order to
measure whether items of the same construct measure the same thing (Bidar 2011).
Further, it helps to measure the direct extent of the relationship between an
observed variable and latent construct.
To summarize how well a particular construct is measured, reflective indicators
were involved, including composite reliability and average variance extracted
(AVE) (Fornell & Larcker 1981). Composite reliability estimates the internal
consistency and is analogous to Cronbach’s alpha of a latent variable. Composite
reliability is linked together with AVE as AVE suggests how far a particular
construct has more error-free (extracted) variance. Based on convergent validity,
the acceptable cut-off is 0.5 for average variance extracted (AVE) and 0.7 for
composite reliability (CR) (Hair et al. 2010).
87
4.2.3 Discriminant Validity
The final stage of the model refinement process was the calculation of composite
reliability and average variance extracted (AVE) per dimension for multi-
dimensional constructs. At this stage, discriminant validity was tested, by ensuring
the variance shared between each construct and its measures exceeded the variance
shared between each of the constructs (Fornell & Larcker 1981; Anderson &
Gerbing 1988). A further discriminant validity test was performed by constraining
the estimated correlation parameter between the constructs. Validity was supported
when the average variance extracted for the constructs exceeded the square of the
correlation between the constructs (Fornell & Larcker 1981).
Discriminant validity provides evidence that each construct theoretically should not
be similar between one and another (Straub et al. 2004). In contrast to convergent
validity, it brings to an understanding that discriminant validity measures the extent
to which latent variables are differing from each other. By doing these, the
validation of the measurement model designed in this study will be accomplished
(Bock, Zmud, Kim & Lee 2005).
88
4.3 Data screening
Data screening is required to avoid encountering problems at a later stage and to
improve the model solution (Collins 2007; Gallagher et al. 2008). Specifically in
this stage, it is purposely to ensure that data had been transcribed accurately by
looking at the inconsistent responses by checking the missing data, outliers and to
ensure the data is normally distributed (Malhotra 1999). Further, it is considered as
a critical first step when dealing with multivariate statistical techniques to ensure
that the data entered are free from error (Hair et al. 2010). Data screening was
conducted by detecting any ‘out of range values’ using the ‘descriptive’ and
frequencies commands through Statistical Package for Social Sciences (SPSS)
version 20.0.
4.3.1 Missing values
Missing values happen when data consist of various codes to indicate lack of
response, such as “Don’t know,” “Refused,” “Unintelligible,” and so on which
result in partial loss of information (Schafer & Graham 2002). Missing data is a
pervasive problem in sample surveys (Tabachnick & Fidell 2007), however, in
contrast, SEM requires complete data with no missing values (Little 1988a).
Therefore, questionnaires that are incomplete due to failure of some respondents to
answer certain questions or assign appropriate values must be removed from the
sample.
89
There are different types of missing data. There are Missing at Random (MAR),
Missing Completely at Random (MCAR) and Non-ignorable (Hair et al. 2010;
Tabachnick & Fidell 2007). MCAR happens when missing values are randomly
distributed across all cases unlike MAR and Non-ignorable where they are not
randomly distributed across all cases (Little 1988b). However, MAR is randomly
distributed within one or more sub-samples, while non-ignorable has the probability
of “missingness” that cannot be predicted from variables in the data. Missingness is
the indicator to identify what is known and what is missing (Schafer & Graham
2002).
In this study, the missing data pattern procedure is shown to be consistent under
MAR since it happened among several sub-samples. Having MAR data in this
study shows that there was a predictable pattern from other variables in the data set
(Tabachnick & Fidell 2007). In other words, the probability of missingness is
dependent on the observed variables in the data (Schafer & Graham 2002).
There are several ways of coping with missing values, including imputation,
weighting and direct analysis of the incomplete data (Little & Rubin 1989).
Imputation is where the researcher replaces the missing data with suitable values,
which employ the standard complete-data and filled in data method. Weighting will
delete the incomplete cases. This consists of listwise deletion and pairwise deletion.
In listwise deletion, cases are deleted in the sample if they have missing data in any
of the variables (Gallagher et al. 2008) while for pairwise deletion, deletion occurs
by discarding cases on a variable by variable basis (Enders & Bandalos 2001).
Finally, direct analysis of the incomplete data uses two forms of approach including
90
maximum likelihood and available-case analysis. Maximum likelihood estimates is
a modern procedure which computed to treats the missing data as random variables
to be integrated out of the likelihood function as if they were never sampled
(Schafer & Graham 2002).
In this study, there were 4.6% of missing values evaluated with respect to cases.
Under available-case analysis, missing data were accessed by computing a dummy
variable reflecting the presence of missing data of each variable in the model and
this missing data was adjusted with all other variables in the model (Allison 2003).
It was found that 49 questionnaires contained missing data for some of the
construct measures. The distribution shows that with 49 cases of missing values
scattered all over the data, 20 cases had at least 20% or more of the overall items
unanswered. The remaining 29 cases had less than 15% missing values.
Hence, to overcome the missing values located, Tabachnick and Fidell (2007)
suggested an alternative treatment of missing data through weighing or deletion.
The specific method of deletion namely listwise deletion was chosen since it is easy
to implement and under most conditions it shows less bias of chi-square (x2)
(Enders & Bandalos 2001; Hair et al. 2010). Therefore, missing values in those
cases were discarded from the preliminary analysis. After deleting the missing
values, the number of remaining cases was 1008.
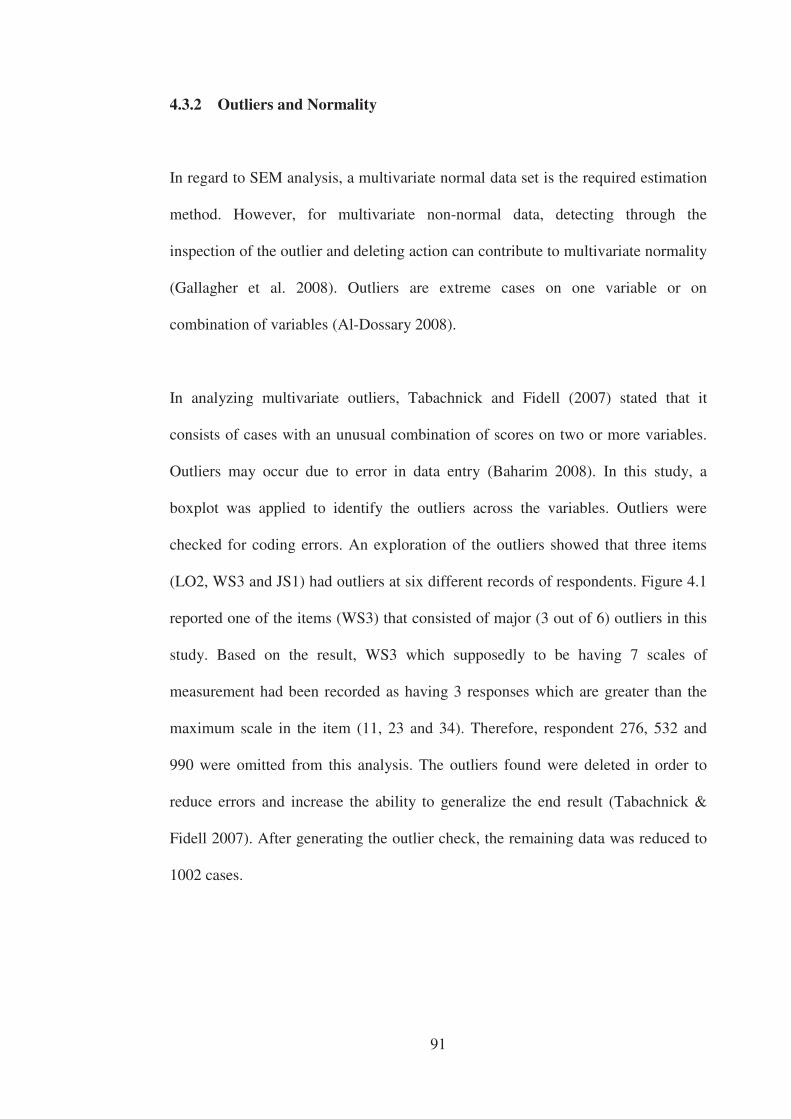
91
4.3.2 Outliers and Normality
In regard to SEM analysis, a multivariate normal data set is the required estimation
method. However, for multivariate non-normal data, detecting through the
inspection of the outlier and deleting action can contribute to multivariate normality
(Gallagher et al. 2008). Outliers are extreme cases on one variable or on
combination of variables (Al-Dossary 2008).
In analyzing multivariate outliers, Tabachnick and Fidell (2007) stated that it
consists of cases with an unusual combination of scores on two or more variables.
Outliers may occur due to error in data entry (Baharim 2008). In this study, a
boxplot was applied to identify the outliers across the variables. Outliers were
checked for coding errors. An exploration of the outliers showed that three items
(LO2, WS3 and JS1) had outliers at six different records of respondents. Figure 4.1
reported one of the items (WS3) that consisted of major (3 out of 6) outliers in this
study. Based on the result, WS3 which supposedly to be having 7 scales of
measurement had been recorded as having 3 responses which are greater than the
maximum scale in the item (11, 23 and 34). Therefore, respondent 276, 532 and
990 were omitted from this analysis. The outliers found were deleted in order to
reduce errors and increase the ability to generalize the end result (Tabachnick &
Fidell 2007). After generating the outlier check, the remaining data was reduced to
1002 cases.
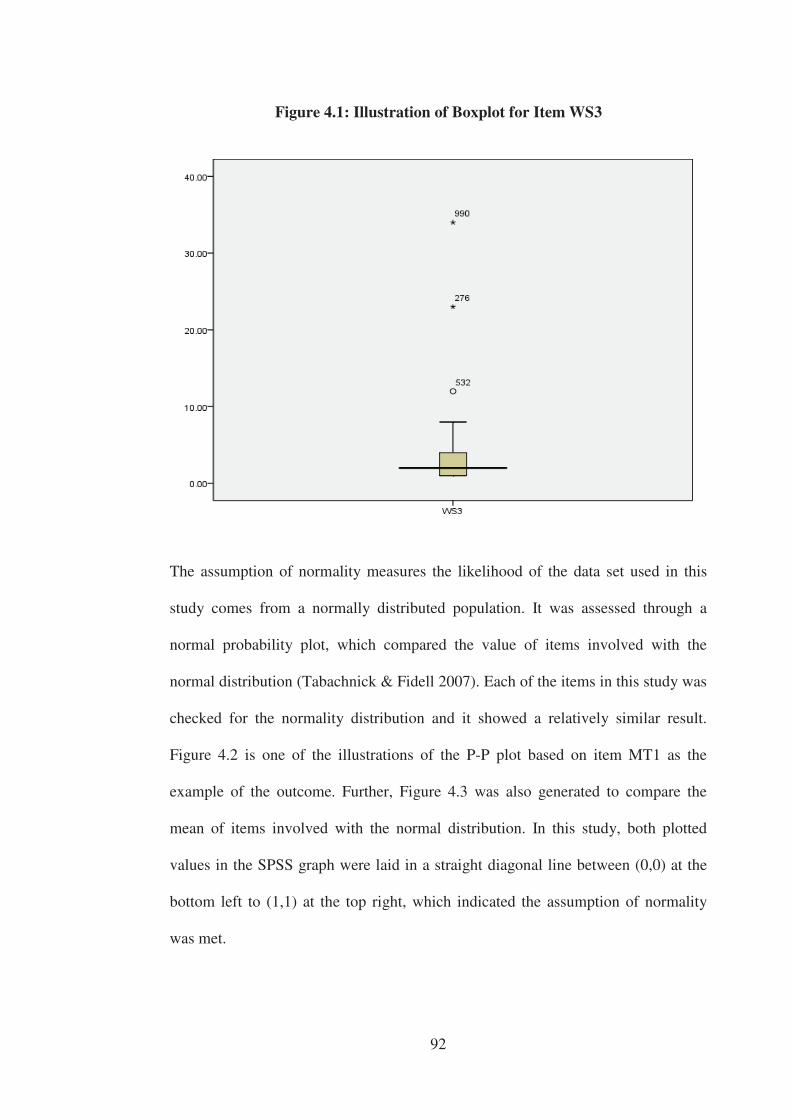
92
The assumption of normality measures the likelihood of the data set used in this
study comes from a normally distributed population. It was assessed through a
normal probability plot, which compared the value of items involved with the
normal distribution (Tabachnick & Fidell 2007). Each of the items in this study was
checked for the normality distribution and it showed a relatively similar result.
Figure 4.2 is one of the illustrations of the P-P plot based on item MT1 as the
example of the outcome. Further, Figure 4.3 was also generated to compare the
mean of items involved with the normal distribution. In this study, both plotted
values in the SPSS graph were laid in a straight diagonal line between (0,0) at the
bottom left to (1,1) at the top right, which indicated the assumption of normality
was met.
Figure 4.1: Illustration of Boxplot for Item WS3
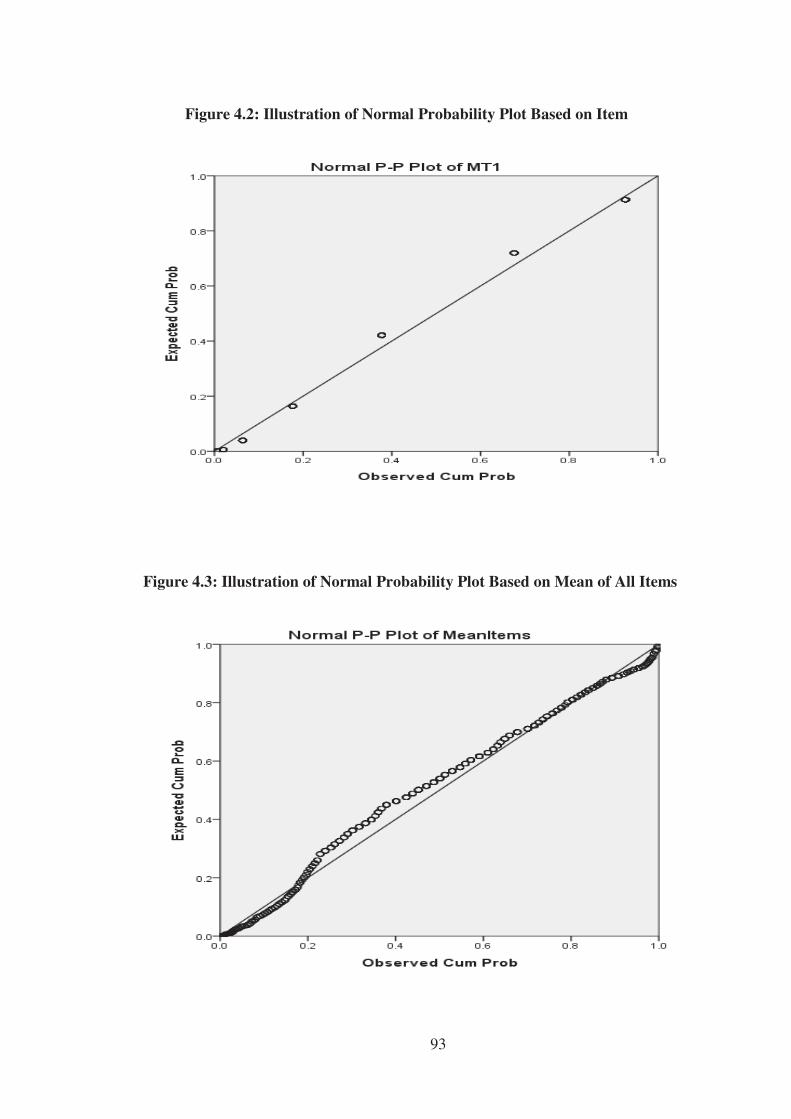
93
Figure 4.2: Illustration of Normal Probability Plot Based on Item
Figure 4.3: Illustration of Normal Probability Plot Based on Mean of All Items
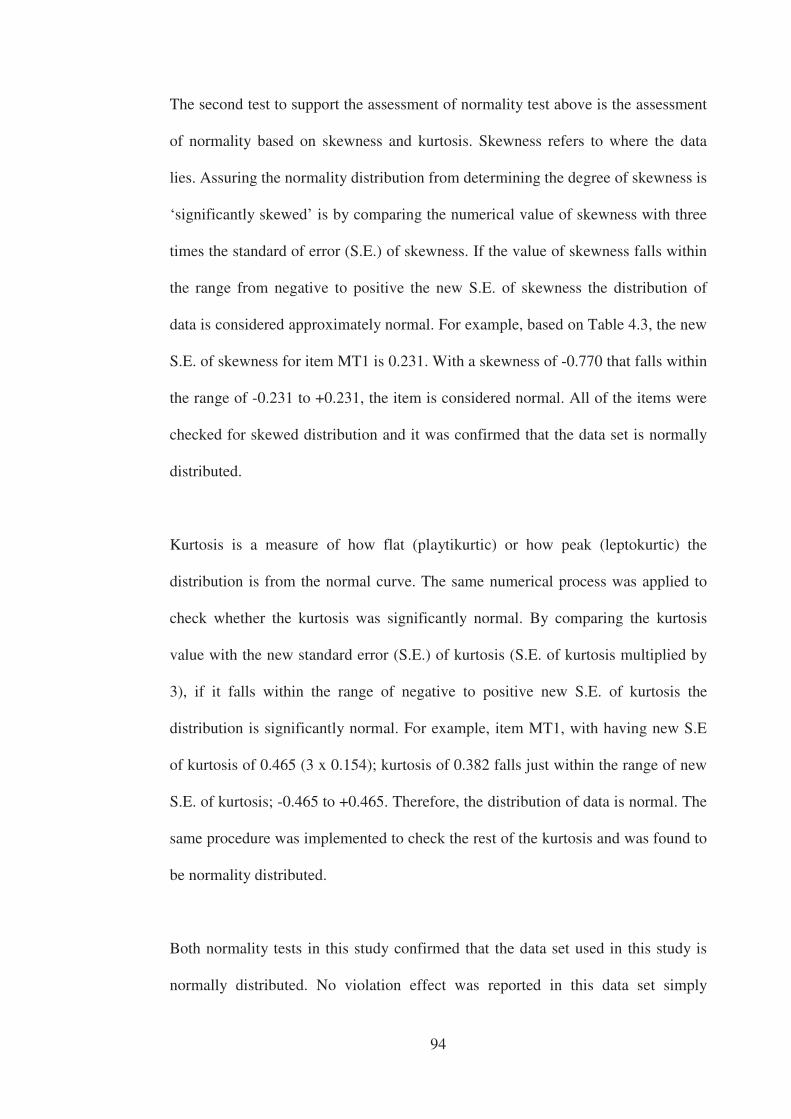
94
The second test to support the assessment of normality test above is the assessment
of normality based on skewness and kurtosis. Skewness refers to where the data
lies. Assuring the normality distribution from determining the degree of skewness is
‘significantly skewed’ is by comparing the numerical value of skewness with three
times the standard of error (S.E.) of skewness. If the value of skewness falls within
the range from negative to positive the new S.E. of skewness the distribution of
data is considered approximately normal. For example, based on Table 4.3, the new
S.E. of skewness for item MT1 is 0.231. With a skewness of -0.770 that falls within
the range of -0.231 to +0.231, the item is considered normal. All of the items were
checked for skewed distribution and it was confirmed that the data set is normally
distributed.
Kurtosis is a measure of how flat (playtikurtic) or how peak (leptokurtic) the
distribution is from the normal curve. The same numerical process was applied to
check whether the kurtosis was significantly normal. By comparing the kurtosis
value with the new standard error (S.E.) of kurtosis (S.E. of kurtosis multiplied by
3), if it falls within the range of negative to positive new S.E. of kurtosis the
distribution is significantly normal. For example, item MT1, with having new S.E
of kurtosis of 0.465 (3 x 0.154); kurtosis of 0.382 falls just within the range of new
S.E. of kurtosis; -0.465 to +0.465. Therefore, the distribution of data is normal. The
same procedure was implemented to check the rest of the kurtosis and was found to
be normality distributed.
Both normality tests in this study confirmed that the data set used in this study is
normally distributed. No violation effect was reported in this data set simply
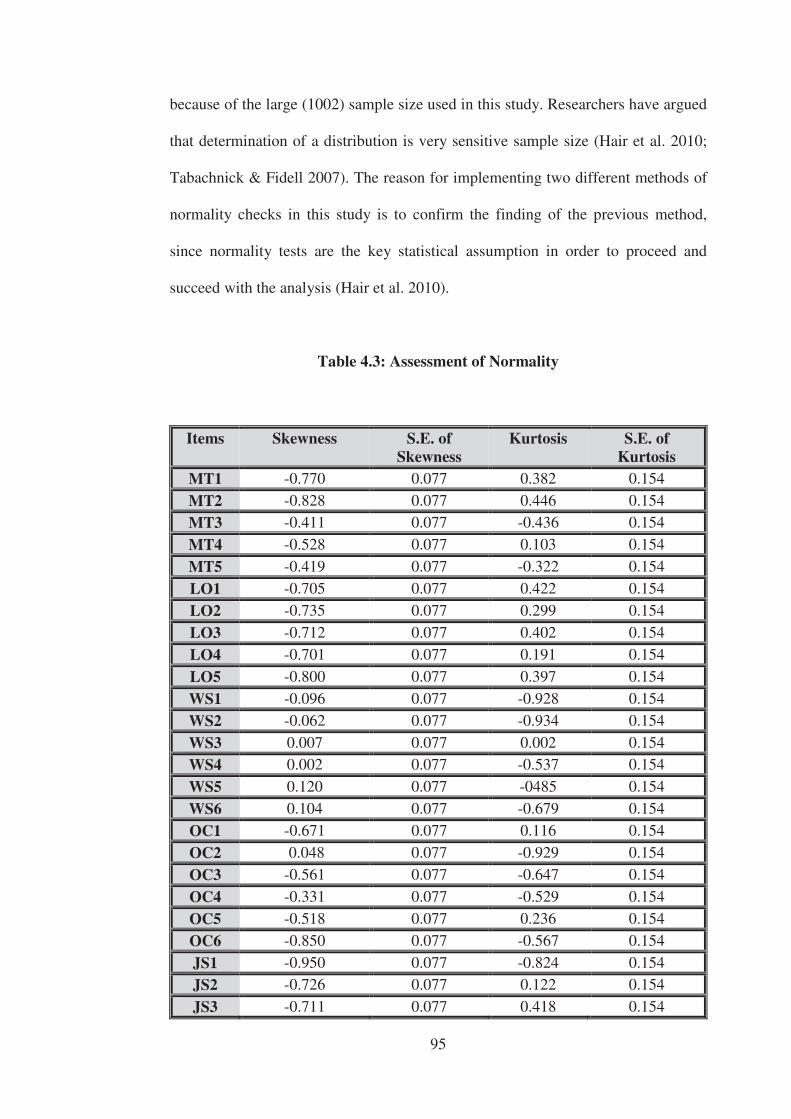
95
because of the large (1002) sample size used in this study. Researchers have argued
that determination of a distribution is very sensitive sample size (Hair et al. 2010;
Tabachnick & Fidell 2007). The reason for implementing two different methods of
normality checks in this study is to confirm the finding of the previous method,
since normality tests are the key statistical assumption in order to proceed and
succeed with the analysis (Hair et al. 2010).
Table 4.3: Assessment of Normality
Items Skewness S.E. of Skewness
Kurtosis S.E. of Kurtosis
MT1 -0.770 0.077 0.382 0.154
MT2 -0.828 0.077 0.446 0.154 MT3 -0.411 0.077 -0.436 0.154
MT4 -0.528 0.077 0.103 0.154
MT5 -0.419 0.077 -0.322 0.154
LO1 -0.705 0.077 0.422 0.154
LO2 -0.735 0.077 0.299 0.154
LO3 -0.712 0.077 0.402 0.154
LO4 -0.701 0.077 0.191 0.154
LO5 -0.800 0.077 0.397 0.154
WS1 -0.096 0.077 -0.928 0.154
WS2 -0.062 0.077 -0.934 0.154
WS3 0.007 0.077 0.002 0.154 WS4 0.002 0.077 -0.537 0.154
WS5 0.120 0.077 -0485 0.154
WS6 0.104 0.077 -0.679 0.154
OC1 -0.671 0.077 0.116 0.154
OC2 0.048 0.077 -0.929 0.154
OC3 -0.561 0.077 -0.647 0.154
OC4 -0.331 0.077 -0.529 0.154
OC5 -0.518 0.077 0.236 0.154
OC6 -0.850 0.077 -0.567 0.154
JS1 -0.950 0.077 -0.824 0.154 JS2 -0.726 0.077 0.122 0.154
JS3 -0.711 0.077 0.418 0.154
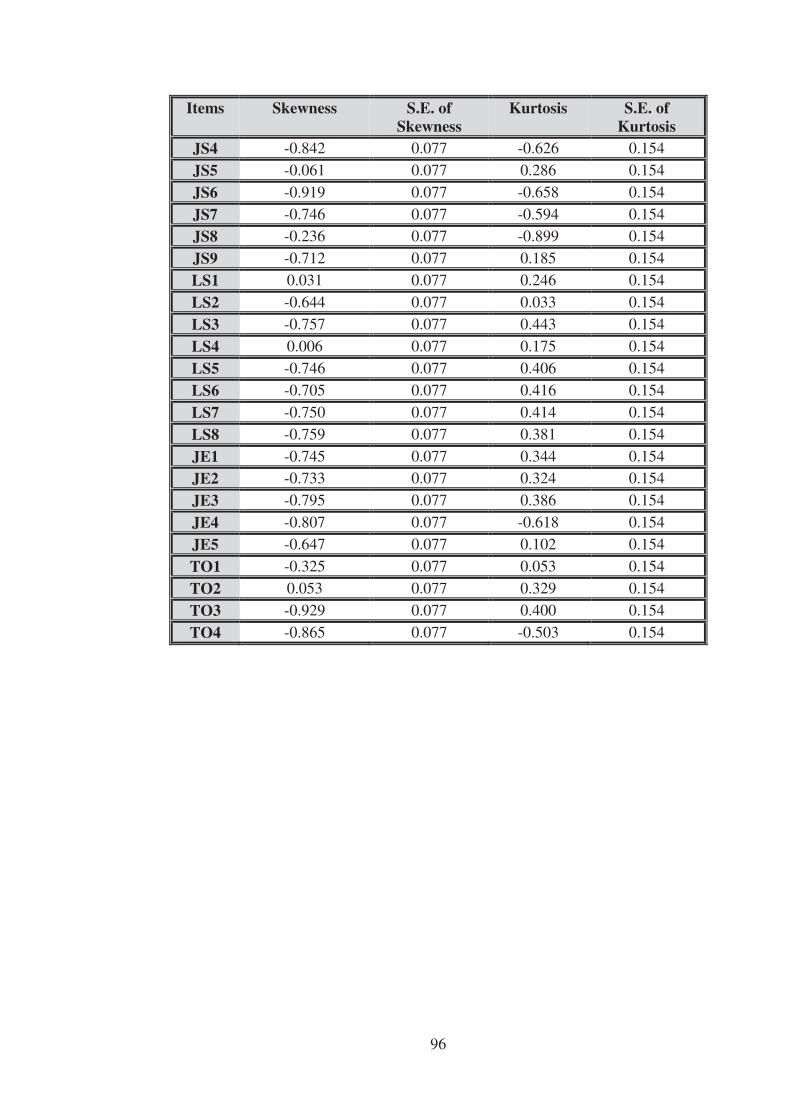
96
Items Skewness S.E. of Skewness
Kurtosis S.E. of Kurtosis
JS4 -0.842 0.077 -0.626 0.154
JS5 -0.061 0.077 0.286 0.154
JS6 -0.919 0.077 -0.658 0.154
JS7 -0.746 0.077 -0.594 0.154 JS8 -0.236 0.077 -0.899 0.154
JS9 -0.712 0.077 0.185 0.154
LS1 0.031 0.077 0.246 0.154
LS2 -0.644 0.077 0.033 0.154
LS3 -0.757 0.077 0.443 0.154
LS4 0.006 0.077 0.175 0.154
LS5 -0.746 0.077 0.406 0.154
LS6 -0.705 0.077 0.416 0.154
LS7 -0.750 0.077 0.414 0.154
LS8 -0.759 0.077 0.381 0.154
JE1 -0.745 0.077 0.344 0.154 JE2 -0.733 0.077 0.324 0.154
JE3 -0.795 0.077 0.386 0.154
JE4 -0.807 0.077 -0.618 0.154
JE5 -0.647 0.077 0.102 0.154
TO1 -0.325 0.077 0.053 0.154
TO2 0.053 0.077 0.329 0.154
TO3 -0.929 0.077 0.400 0.154
TO4 -0.865 0.077 -0.503 0.154
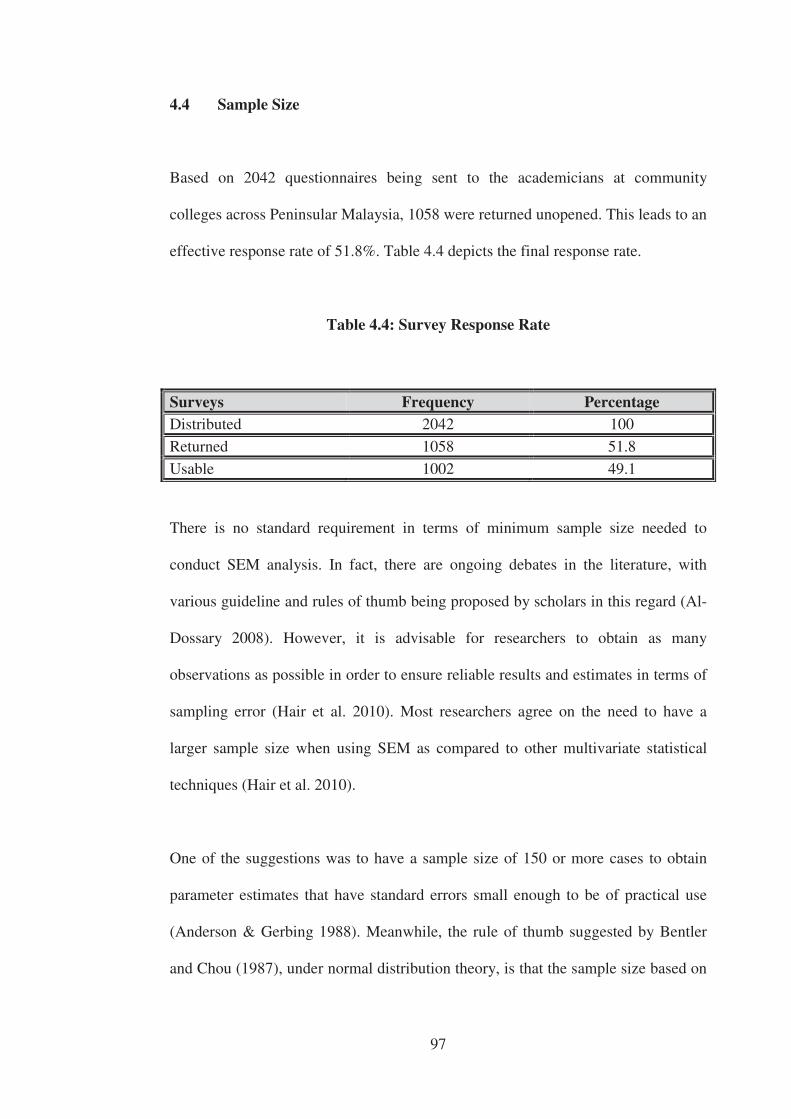
97
4.4 Sample Size
Based on 2042 questionnaires being sent to the academicians at community
colleges across Peninsular Malaysia, 1058 were returned unopened. This leads to an
effective response rate of 51.8%. Table 4.4 depicts the final response rate.
Table 4.4: Survey Response Rate
Surveys Frequency Percentage Distributed 2042 100
Returned 1058 51.8
Usable 1002 49.1
There is no standard requirement in terms of minimum sample size needed to
conduct SEM analysis. In fact, there are ongoing debates in the literature, with
various guideline and rules of thumb being proposed by scholars in this regard (Al-
Dossary 2008). However, it is advisable for researchers to obtain as many
observations as possible in order to ensure reliable results and estimates in terms of
sampling error (Hair et al. 2010). Most researchers agree on the need to have a
larger sample size when using SEM as compared to other multivariate statistical
techniques (Hair et al. 2010).
One of the suggestions was to have a sample size of 150 or more cases to obtain
parameter estimates that have standard errors small enough to be of practical use
(Anderson & Gerbing 1988). Meanwhile, the rule of thumb suggested by Bentler
and Chou (1987), under normal distribution theory, is that the sample size based on
98
the ratio of at least 5:1 of the number of free parameters. Tanaka (1987) has
suggested a 20:1 ratio of sample size per free parameters.
Alternatively, Hair et al. (2010) recommended a range of 100 to 500 cases, which is
subject to several considerations stated to be based on the number of constructs in a
model. For instance, models containing five or fewer constructs with high item
communalities ( 0.6) should have a minimum of 100 cases, while models with
seven or fewer constructs should have at least 150 at modest communalities (0.5).
They further stated that models with seven or fewer constructs at lower
communalities (< 0.45) should have a minimum 300 cases and finally models with
larger numbers of constructs at any communalities should have at least 500 cases.
A large rate of return was achieved in this study, with a total of 1058 responses,
reduced, after the screening process, to 1002 usable responses. The sample for
analysis was selected using SPSS. Apparently, with nine constructs employed in the
model, the sample size used in this study meets the recommendations offered by
Hair et al. (2010).
99
4.4.1 Sample Demographics
Sample demographics presented included gender, educational qualification, tenure,
length of holding current position and term of employment. Statistics show that
respondents characteristic vary widely. The demographic details provide a
generalized view regarding the sample involved and the information given has no
influence on the level of analysis in this study.
Table 4.5 shows that the sample was made up mostly of female respondents
(61.5%). Nearly half (49.8%) of the respondents were from the age group between
20 to 30 years and 31 to 40 years. It is also revealed that the majority of the
respondents in this sample have a degree qualification (61.3%), as would be
expected.
Over fifty per cent (65.9%) of the respondents have less than five years’ tenure with
the organization and were still working within the same position. Finally, the table
reveals that a significant number (884), representing 88.2% of full time academics,
had participated in this survey.
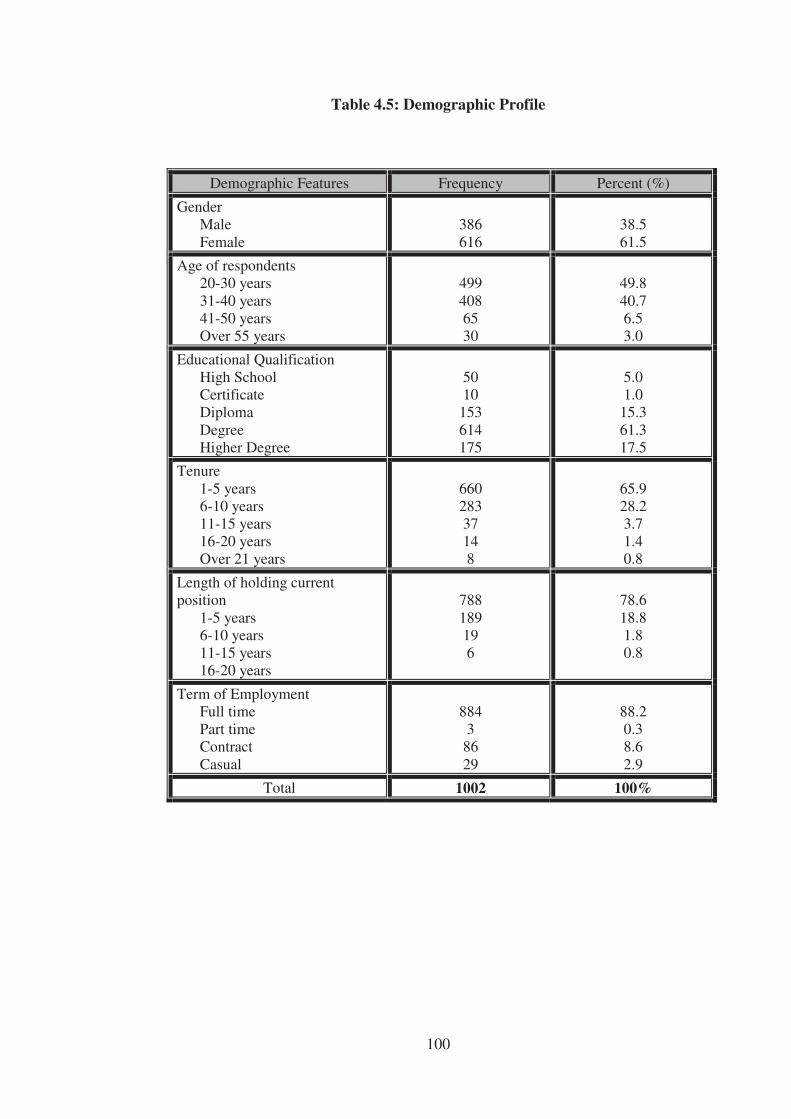
100
Table 4.5: Demographic Profile
Demographic Features Frequency Percent (%)
Gender Male Female
386 616
38.5 61.5
Age of respondents 20-30 years 31-40 years 41-50 years Over 55 years
499 408 65 30
49.8 40.7 6.5 3.0
Educational Qualification High School Certificate Diploma Degree Higher Degree
50 10
153 614 175
5.0 1.0
15.3 61.3 17.5
Tenure 1-5 years 6-10 years 11-15 years 16-20 years Over 21 years
660 283 37 14 8
65.9 28.2 3.7 1.4 0.8
Length of holding current position 1-5 years 6-10 years 11-15 years 16-20 years
788 189 19 6
78.6 18.8 1.8 0.8
Term of Employment Full time Part time Contract Casual
884
3 86 29
88.2 0.3 8.6 2.9
Total 1002 100%
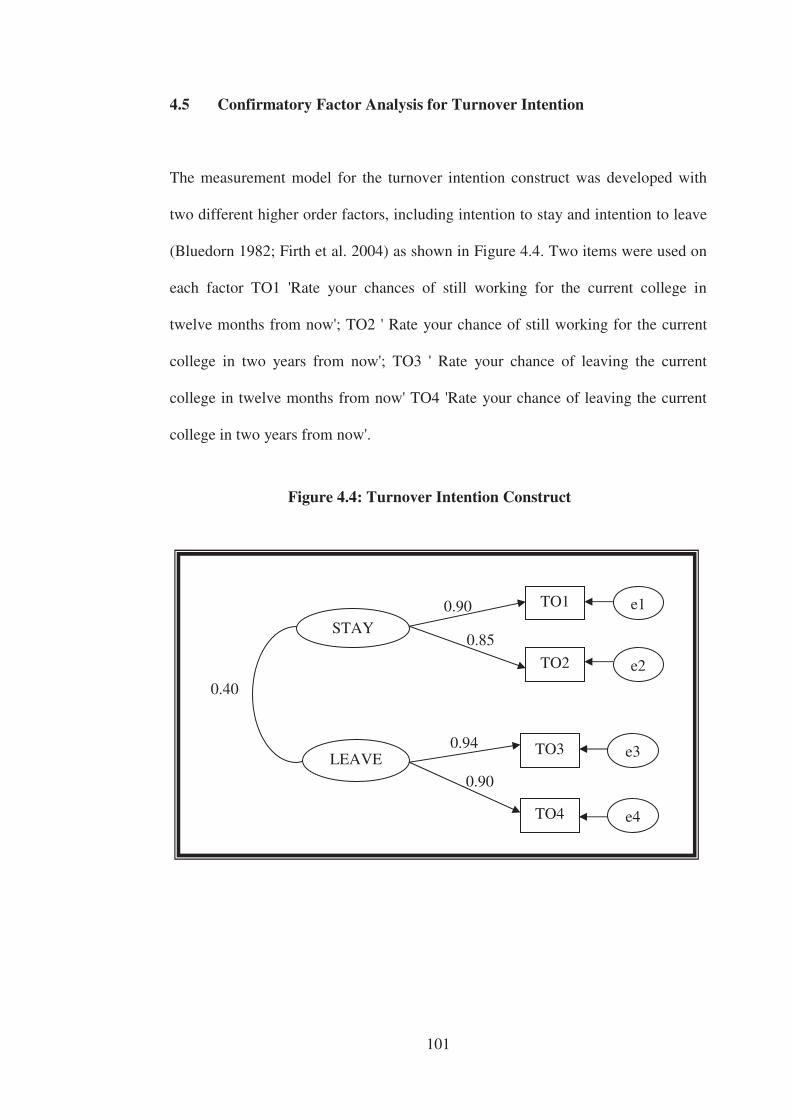
101
4.5 Confirmatory Factor Analysis for Turnover Intention
The measurement model for the turnover intention construct was developed with
two different higher order factors, including intention to stay and intention to leave
(Bluedorn 1982; Firth et al. 2004) as shown in Figure 4.4. Two items were used on
each factor TO1 'Rate your chances of still working for the current college in
twelve months from now'; TO2 ' Rate your chance of still working for the current
college in two years from now'; TO3 ' Rate your chance of leaving the current
college in twelve months from now' TO4 'Rate your chance of leaving the current
college in two years from now'.
STAY
LEAVE
0.90
0.94
0.85
0.90
0.40
TO3
TO4
TO2
TO1 e1
e2
e3
e4
Figure 4.4: Turnover Intention Construct
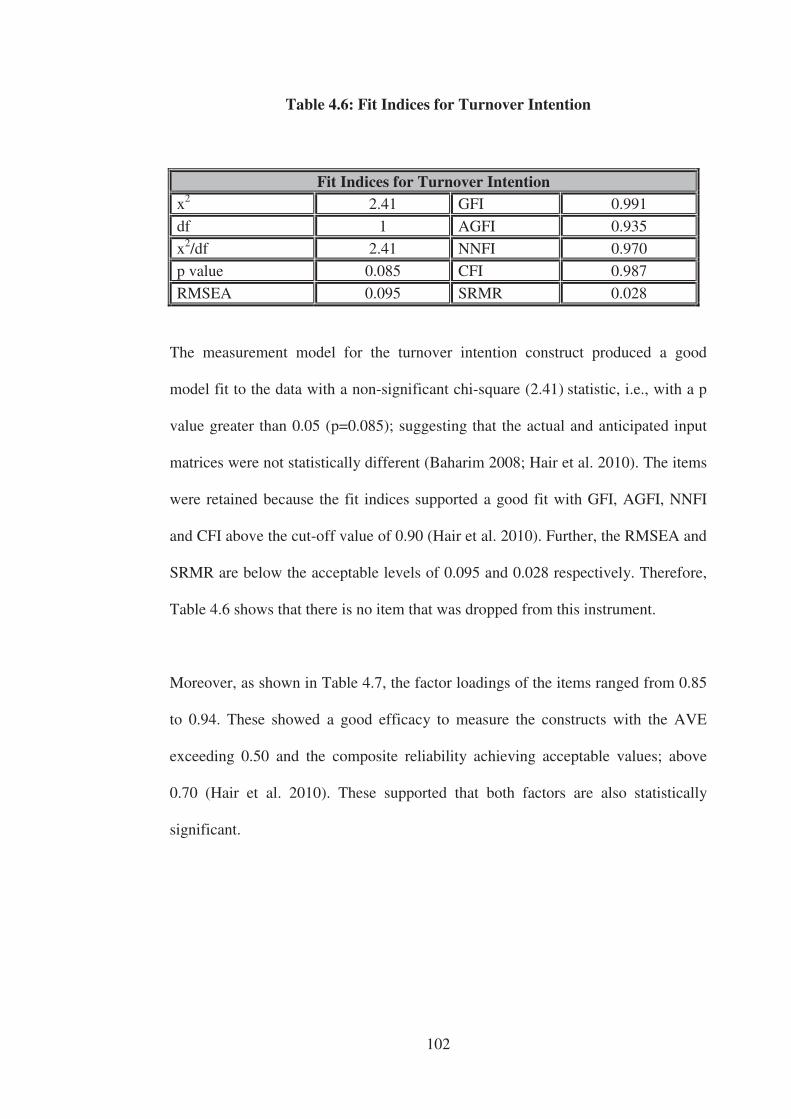
102
Table 4.6: Fit Indices for Turnover Intention
Fit Indices for Turnover Intention x2 2.41 GFI 0.991 df 1 AGFI 0.935 x2/df 2.41 NNFI 0.970 p value 0.085 CFI 0.987 RMSEA 0.095 SRMR 0.028
The measurement model for the turnover intention construct produced a good
model fit to the data with a non-significant chi-square (2.41) statistic, i.e., with a p
value greater than 0.05 (p=0.085); suggesting that the actual and anticipated input
matrices were not statistically different (Baharim 2008; Hair et al. 2010). The items
were retained because the fit indices supported a good fit with GFI, AGFI, NNFI
and CFI above the cut-off value of 0.90 (Hair et al. 2010). Further, the RMSEA and
SRMR are below the acceptable levels of 0.095 and 0.028 respectively. Therefore,
Table 4.6 shows that there is no item that was dropped from this instrument.
Moreover, as shown in Table 4.7, the factor loadings of the items ranged from 0.85
to 0.94. These showed a good efficacy to measure the constructs with the AVE
exceeding 0.50 and the composite reliability achieving acceptable values; above
0.70 (Hair et al. 2010). These supported that both factors are also statistically
significant.
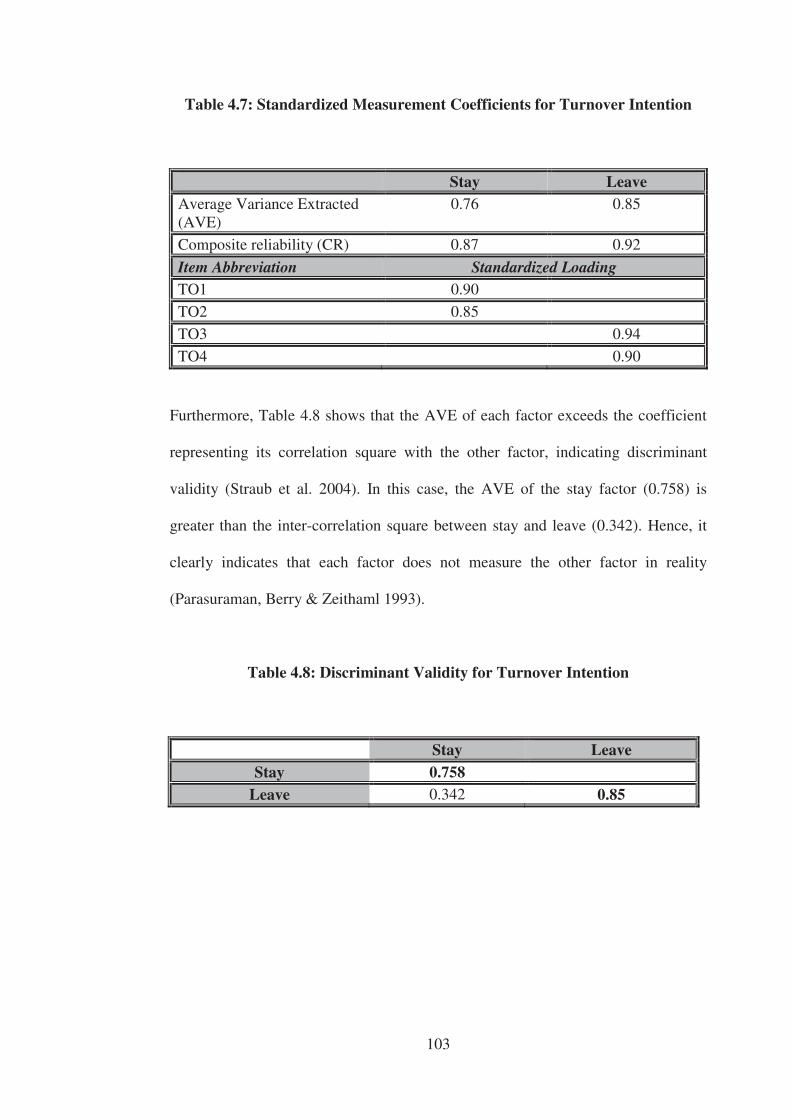
103
Table 4.7: Standardized Measurement Coefficients for Turnover Intention
Stay Leave Average Variance Extracted (AVE)
0.76 0.85
Composite reliability (CR) 0.87 0.92
Item Abbreviation Standardized Loading TO1 0.90
TO2 0.85
TO3 0.94
TO4 0.90
Furthermore, Table 4.8 shows that the AVE of each factor exceeds the coefficient
representing its correlation square with the other factor, indicating discriminant
validity (Straub et al. 2004). In this case, the AVE of the stay factor (0.758) is
greater than the inter-correlation square between stay and leave (0.342). Hence, it
clearly indicates that each factor does not measure the other factor in reality
(Parasuraman, Berry & Zeithaml 1993).
Table 4.8: Discriminant Validity for Turnover Intention
Stay Leave Stay 0.758
Leave 0.342 0.85
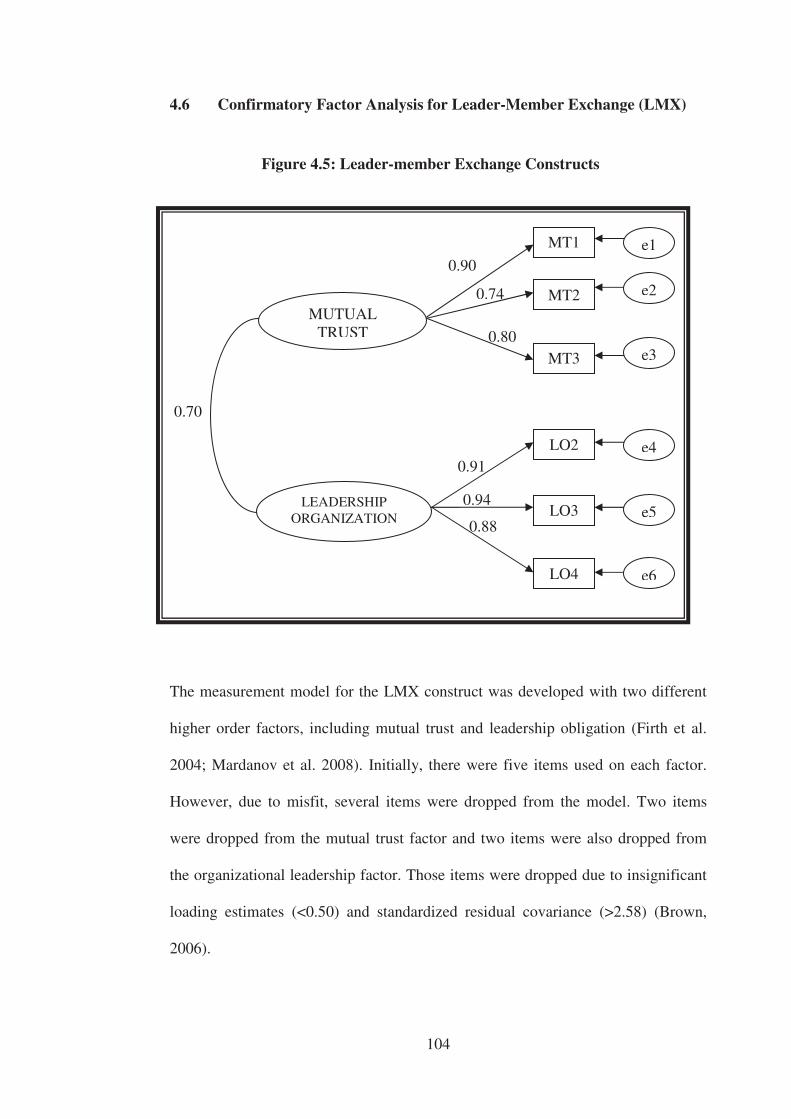
104
4.6 Confirmatory Factor Analysis for Leader-Member Exchange (LMX)
The measurement model for the LMX construct was developed with two different
higher order factors, including mutual trust and leadership obligation (Firth et al.
2004; Mardanov et al. 2008). Initially, there were five items used on each factor.
However, due to misfit, several items were dropped from the model. Two items
were dropped from the mutual trust factor and two items were also dropped from
the organizational leadership factor. Those items were dropped due to insignificant
loading estimates (<0.50) and standardized residual covariance (>2.58) (Brown,
2006).
Figure 4.5: Leader-member Exchange Constructs
MUTUAL TRUST
LEADERSHIP ORGANIZATION
0.74
0.80
0.91
0.94
0.88
LO4
MT3
MT2
LO3
LO2
e2
e3
e4
e5
e6
MT1
0.90 e1
0.70
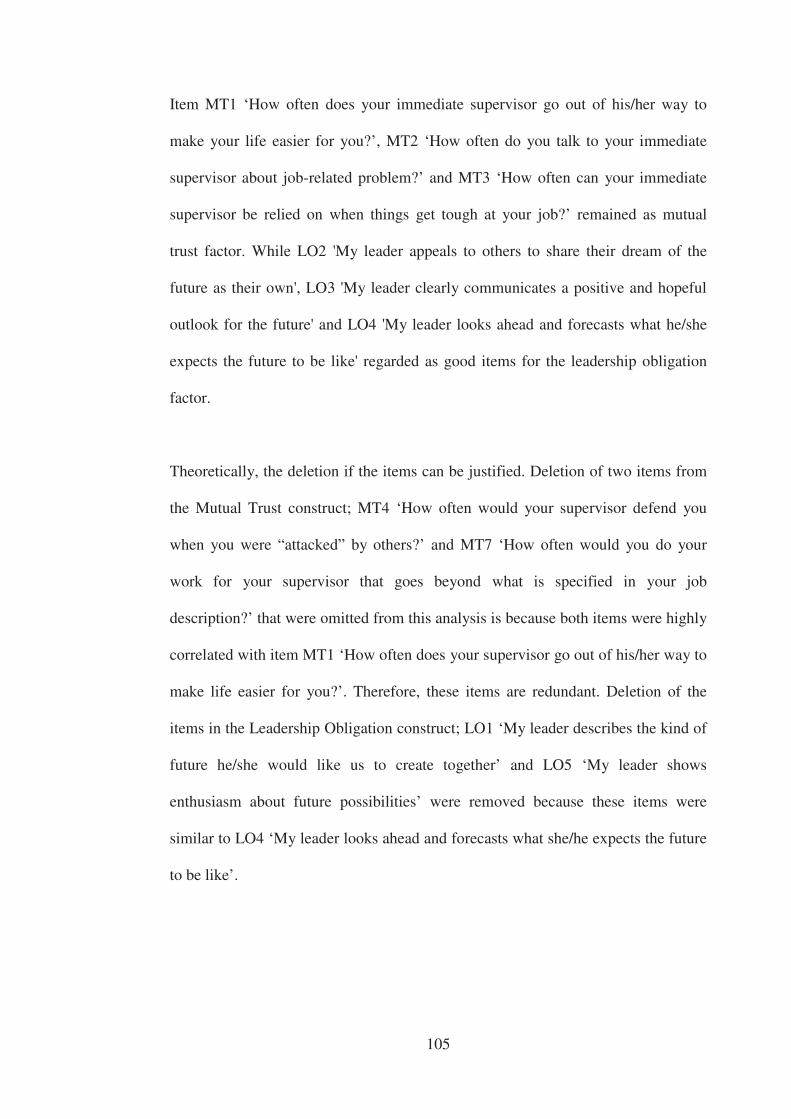
105
Item MT1 ‘How often does your immediate supervisor go out of his/her way to
make your life easier for you?’, MT2 ‘How often do you talk to your immediate
supervisor about job-related problem?’ and MT3 ‘How often can your immediate
supervisor be relied on when things get tough at your job?’ remained as mutual
trust factor. While LO2 'My leader appeals to others to share their dream of the
future as their own', LO3 'My leader clearly communicates a positive and hopeful
outlook for the future' and LO4 'My leader looks ahead and forecasts what he/she
expects the future to be like' regarded as good items for the leadership obligation
factor.
Theoretically, the deletion if the items can be justified. Deletion of two items from
the Mutual Trust construct; MT4 ‘How often would your supervisor defend you
when you were “attacked” by others?’ and MT7 ‘How often would you do your
work for your supervisor that goes beyond what is specified in your job
description?’ that were omitted from this analysis is because both items were highly
correlated with item MT1 ‘How often does your supervisor go out of his/her way to
make life easier for you?’. Therefore, these items are redundant. Deletion of the
items in the Leadership Obligation construct; LO1 ‘My leader describes the kind of
future he/she would like us to create together’ and LO5 ‘My leader shows
enthusiasm about future possibilities’ were removed because these items were
similar to LO4 ‘My leader looks ahead and forecasts what she/he expects the future
to be like’.
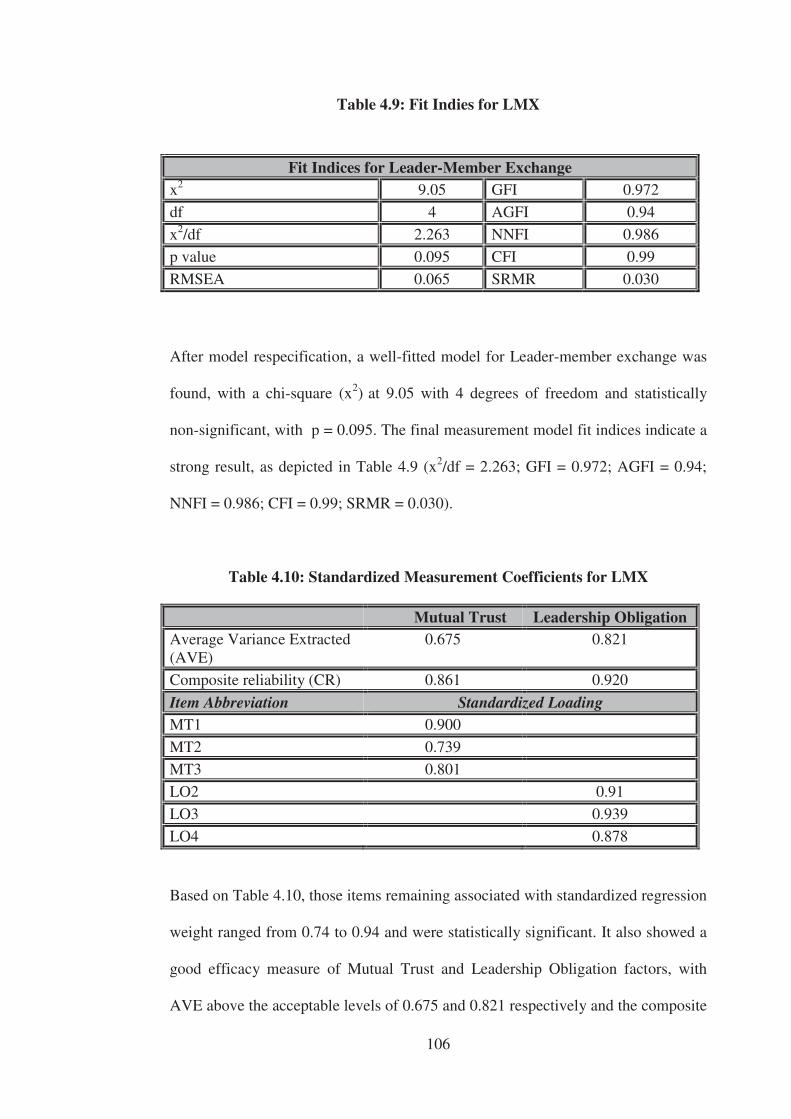
106
Table 4.9: Fit Indies for LMX
After model respecification, a well-fitted model for Leader-member exchange was
found, with a chi-square (x2) at 9.05 with 4 degrees of freedom and statistically
non-significant, with p = 0.095. The final measurement model fit indices indicate a
strong result, as depicted in Table 4.9 (x2/df = 2.263; GFI = 0.972; AGFI = 0.94;
NNFI = 0.986; CFI = 0.99; SRMR = 0.030).
Table 4.10: Standardized Measurement Coefficients for LMX
Based on Table 4.10, those items remaining associated with standardized regression
weight ranged from 0.74 to 0.94 and were statistically significant. It also showed a
good efficacy measure of Mutual Trust and Leadership Obligation factors, with
AVE above the acceptable levels of 0.675 and 0.821 respectively and the composite
Fit Indices for Leader-Member Exchange x2 9.05 GFI 0.972 df 4 AGFI 0.94
x2/df 2.263 NNFI 0.986 p value 0.095 CFI 0.99
RMSEA 0.065 SRMR 0.030
Mutual Trust Leadership Obligation Average Variance Extracted (AVE)
0.675 0.821
Composite reliability (CR) 0.861 0.920
Item Abbreviation Standardized Loading MT1 0.900
MT2 0.739
MT3 0.801
LO2 0.91
LO3 0.939
LO4 0.878
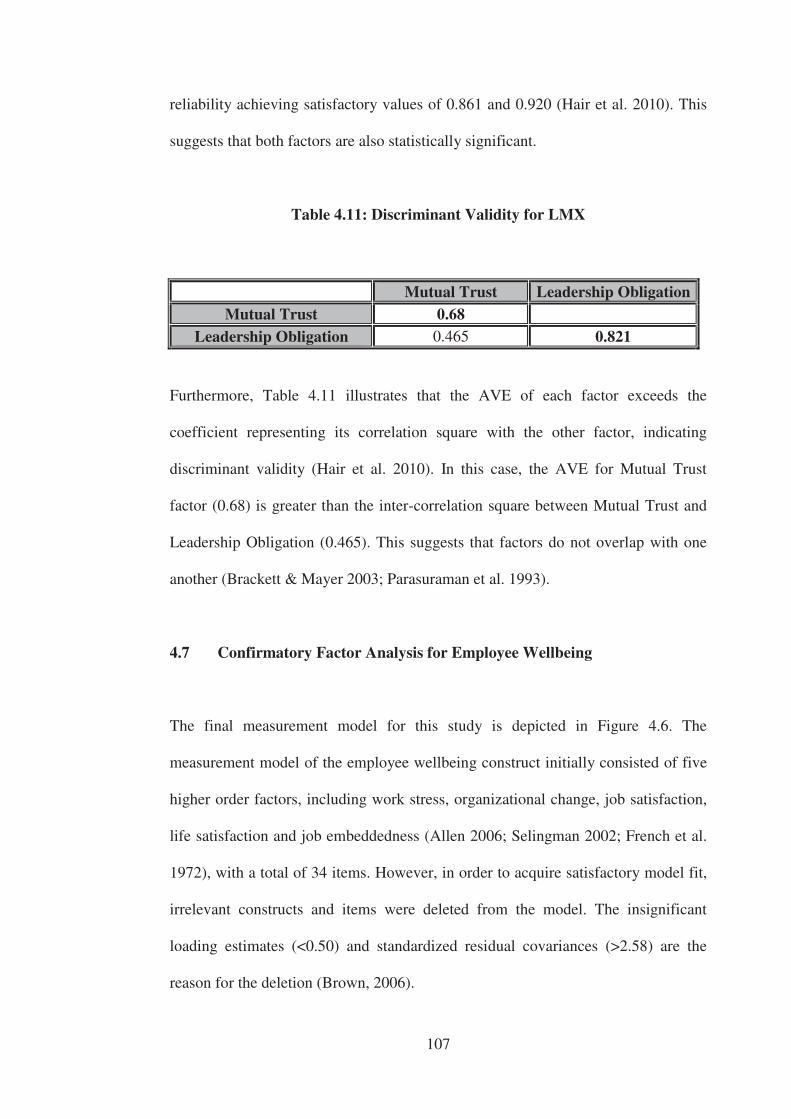
107
reliability achieving satisfactory values of 0.861 and 0.920 (Hair et al. 2010). This
suggests that both factors are also statistically significant.
Table 4.11: Discriminant Validity for LMX
Mutual Trust Leadership Obligation Mutual Trust 0.68
Leadership Obligation 0.465 0.821
Furthermore, Table 4.11 illustrates that the AVE of each factor exceeds the
coefficient representing its correlation square with the other factor, indicating
discriminant validity (Hair et al. 2010). In this case, the AVE for Mutual Trust
factor (0.68) is greater than the inter-correlation square between Mutual Trust and
Leadership Obligation (0.465). This suggests that factors do not overlap with one
another (Brackett & Mayer 2003; Parasuraman et al. 1993).
4.7 Confirmatory Factor Analysis for Employee Wellbeing
The final measurement model for this study is depicted in Figure 4.6. The
measurement model of the employee wellbeing construct initially consisted of five
higher order factors, including work stress, organizational change, job satisfaction,
life satisfaction and job embeddedness (Allen 2006; Selingman 2002; French et al.
1972), with a total of 34 items. However, in order to acquire satisfactory model fit,
irrelevant constructs and items were deleted from the model. The insignificant
loading estimates (<0.50) and standardized residual covariances (>2.58) are the
reason for the deletion (Brown, 2006).
108
In order to obtain a good fit, one construct (Work Stress), which contained six items
was modified based on the unacceptable value of residual covariance (>2.58)
(Brown 2006) and estimate loading from the standardized regression weight
(<0.50) (Hair et al. 2010). There are three remaining items WS1 ‘I seem to tire
quickly', WS2 ‘Problems associated with my job have kept me awake at night’ and
WS6 ‘My work is routine; I hardly use my knowledge and skills’ with an
acceptable regression weight 0.78, 0.77 and 0.75 respectively. Theoretically, the
deletion of three other items from this construct is because WS3 ‘There is threat of
layoff or demolition at the organization’ is not within the practice in this
organization. In the case of item WS5 ‘I have too much to do and little time in
which to do it’ perceived as having the same meaning with WS2 ‘problem
associated with my job have kept me awake at night’. The third items omitted was
the item WS4 ‘I have differences of opinion with my supervisor’ theoretically due
to not being absolutely standing for work stress quality (Robertson, 2007).
Under the Organizational Change construct, there were three items removed since
they do not meet the minimal requirement of standardized regression weight. Item
OC2 ‘I have no control over the extent to which the changes will affect my job’,
OC3 ‘I will be able to influence the extent to which the changes will affect my job’
and OC6 ‘The mission/purpose of my college makes me feel my job is important
even though your work changes from time to time’ have standardized regression
weights of 0.265, 0.45 and 0.47 respectively. This is theoretically argued that the
items do not relatively measure the organizational change construct.
109
Following this is the construct of Job Satisfaction where four items (JS1 ‘I have
friendly and supportive colleagues at work’, JS6 ‘I am satisfied with the way my
supervisor involves me in the department’ JS8 ‘I have a chance to acquire new
skills’ and JS9 ‘I am fairly pain for what I contribute to the organization’) remained
in order to obtain a good fit. Theoretically the omission of JS2 ‘I am satisfied with
the amount of training given to me’ is because it has a high correlation with item
JS8 ‘I have a chance to acquire new skills’ where the item maybe redundant.
Further, item JS3 ‘I have the chance to work independently of others’ was designed
with no distinct from item JS1‘I have friendly and supportive colleagues at work’.
The other 3 items (JS4 ‘I have time to do different things from time to time’, JS5 ‘I
have a chance to do a job that is well suited to my ability’ and JS7 ‘I am able to do
an important job’) were excluded from the model because they have similar
practice to item JS6 ‘I am satisfied with the way my supervisor involves me in the
department’.
The fourth construct in this model is life satisfaction. The remaining four items LS1
‘How satisfied are you with your work as a whole?’, LS2 ‘How satisfied are you
with your health?’, LS3 ‘How satisfied are you with how safe you feel?’ and
LS5‘How satisfied are you with feeling part of your community?’ from this
construct show that they had adequate factor loading and having the score of
standardized residual covariance below 2.58. Whereas, item LS4 ‘How satisfied are
you with your personal relationship?’, LS7 ‘How satisfied are you with what you
are achieving in life?’ and LS8 ‘How satisfied are you with your standard of
living?’ held the standardized regression weight below the acceptable bar with 0.40,
0.43, 0.48 respectively. This leads to a theoretical justification where the deleted
110
items show that the underlying relationship between items and construct does not
have an effect on this study (Robertson 2007). The final item (LS6 ‘How satisfied
are you with your future security?’) was excluded in the model probably because
this item was being tapped into by the item LS3 ‘How satisfied are you with how
safe you feel?’.
The final construct for this measurement model is Job Embeddedness. Initially,
there were 5 items (JE1 'This college is a good match for me', JE2 'I like the
member of my work group', JE3 'I feel like I am the good match if this college', JE4
'I like the authority and responsibility I have at this college', JE5 'Leaving the
community would be very hard') to measure job embeddedness and they were
submitted to confirmatory factor analysis. The result found that JE1 'This college is
a good match for me' and JE2 'I like the member of my work group' were deleted
due to having unacceptable value of standardized residual covariance at 2.997 and
2.980 respectively. The omitted items explain that item JE1 and JE2 might be
redundant and having the same understanding in item JE3 'I feel like I am the good
match with this college'.
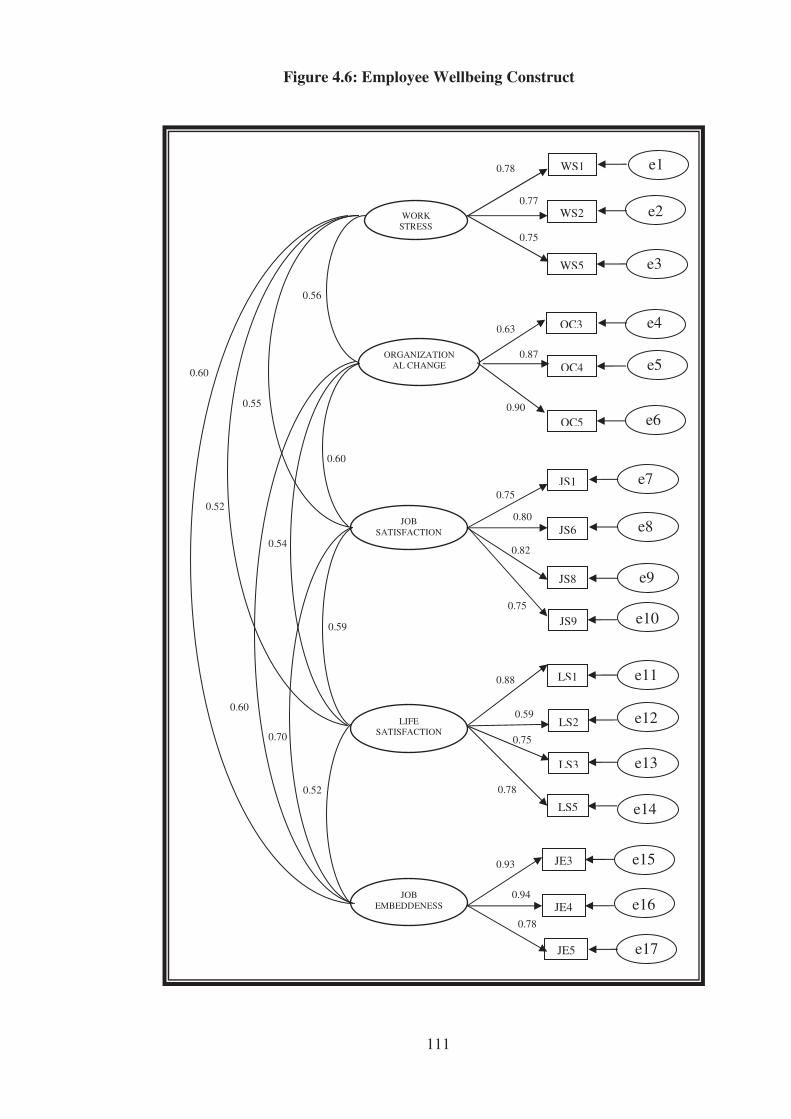
111
Figure 4.6: Employee Wellbeing Construct
0.94
0.78
0.59
0.60
0.56
0.55
0.52 JOB
SATISFACTION
ORGANIZATIONAL CHANGE
LIFE SATISFACTION
JOB EMBEDDENESS
JS6
JS1
0.63
0.80
0.75
0.90
0.82
LS5
LS3
0.78
0.75
0.88
JE4
0.93
0.60
0.52
0.70
0.60
0.54
0.59
OC3
LS1
JE3
JE5
OC5
WORK STRESS
WS1
WS5
LS2
JS9
JS8
0.77
0.87
0.75
0.78
0.75
OC4
WS2
e1
e2
e3
e7
e6
e5
e4
e14
e15
e16
e17
e9
e10
e11
e12
e13
e8
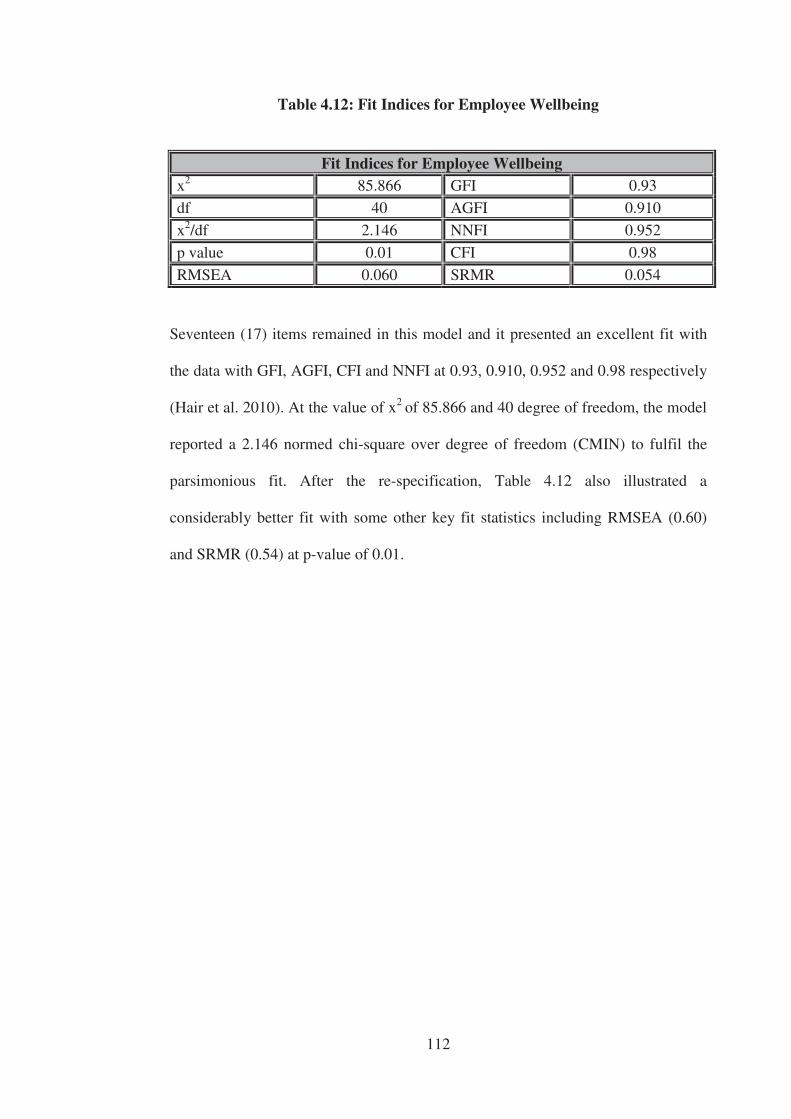
112
Table 4.12: Fit Indices for Employee Wellbeing
Fit Indices for Employee Wellbeing x2 85.866 GFI 0.93 df 40 AGFI 0.910 x2/df 2.146 NNFI 0.952 p value 0.01 CFI 0.98 RMSEA 0.060 SRMR 0.054
Seventeen (17) items remained in this model and it presented an excellent fit with
the data with GFI, AGFI, CFI and NNFI at 0.93, 0.910, 0.952 and 0.98 respectively
(Hair et al. 2010). At the value of x2 of 85.866 and 40 degree of freedom, the model
reported a 2.146 normed chi-square over degree of freedom (CMIN) to fulfil the
parsimonious fit. After the re-specification, Table 4.12 also illustrated a
considerably better fit with some other key fit statistics including RMSEA (0.60)
and SRMR (0.54) at p-value of 0.01.
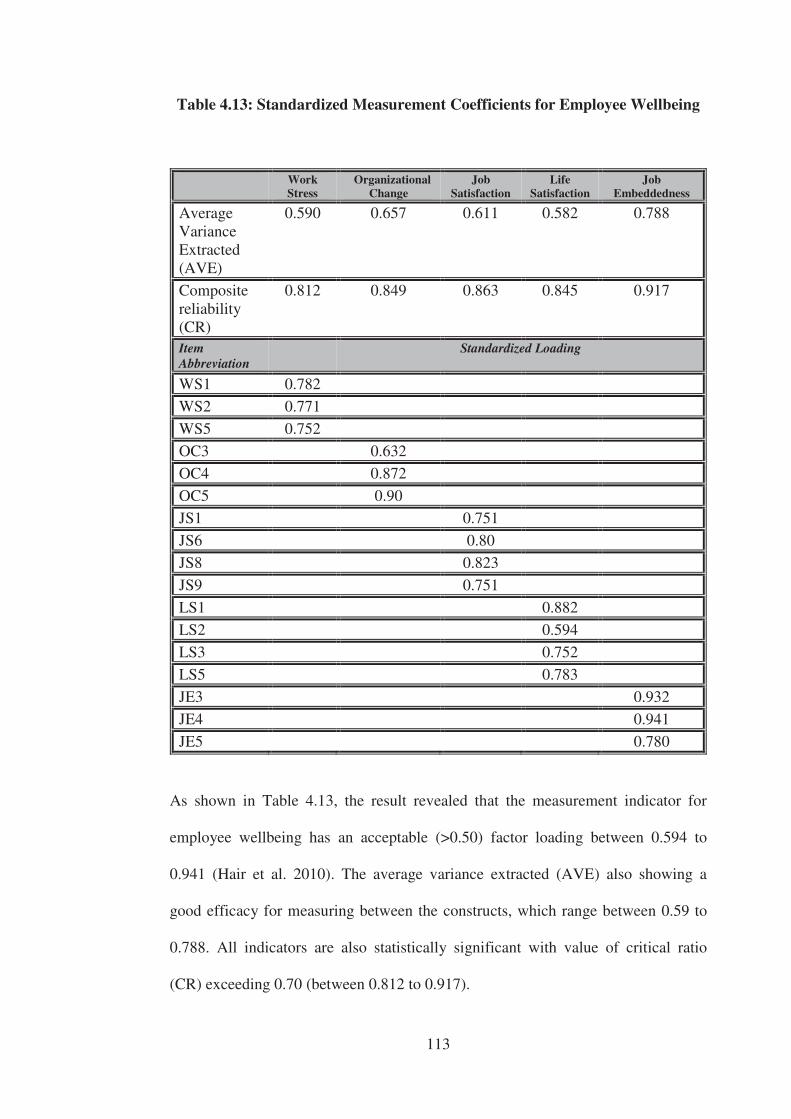
113
Table 4.13: Standardized Measurement Coefficients for Employee Wellbeing
Work Stress
Organizational Change
Job Satisfaction
Life Satisfaction
Job Embeddedness
Average Variance Extracted (AVE)
0.590 0.657 0.611 0.582 0.788
Composite reliability (CR)
0.812 0.849 0.863 0.845 0.917
Item Abbreviation
Standardized Loading
WS1 0.782
WS2 0.771
WS5 0.752
OC3 0.632
OC4 0.872
OC5 0.90
JS1 0.751
JS6 0.80
JS8 0.823
JS9 0.751
LS1 0.882
LS2 0.594
LS3 0.752
LS5 0.783
JE3 0.932
JE4 0.941
JE5 0.780
As shown in Table 4.13, the result revealed that the measurement indicator for
employee wellbeing has an acceptable (>0.50) factor loading between 0.594 to
0.941 (Hair et al. 2010). The average variance extracted (AVE) also showing a
good efficacy for measuring between the constructs, which range between 0.59 to
0.788. All indicators are also statistically significant with value of critical ratio
(CR) exceeding 0.70 (between 0.812 to 0.917).
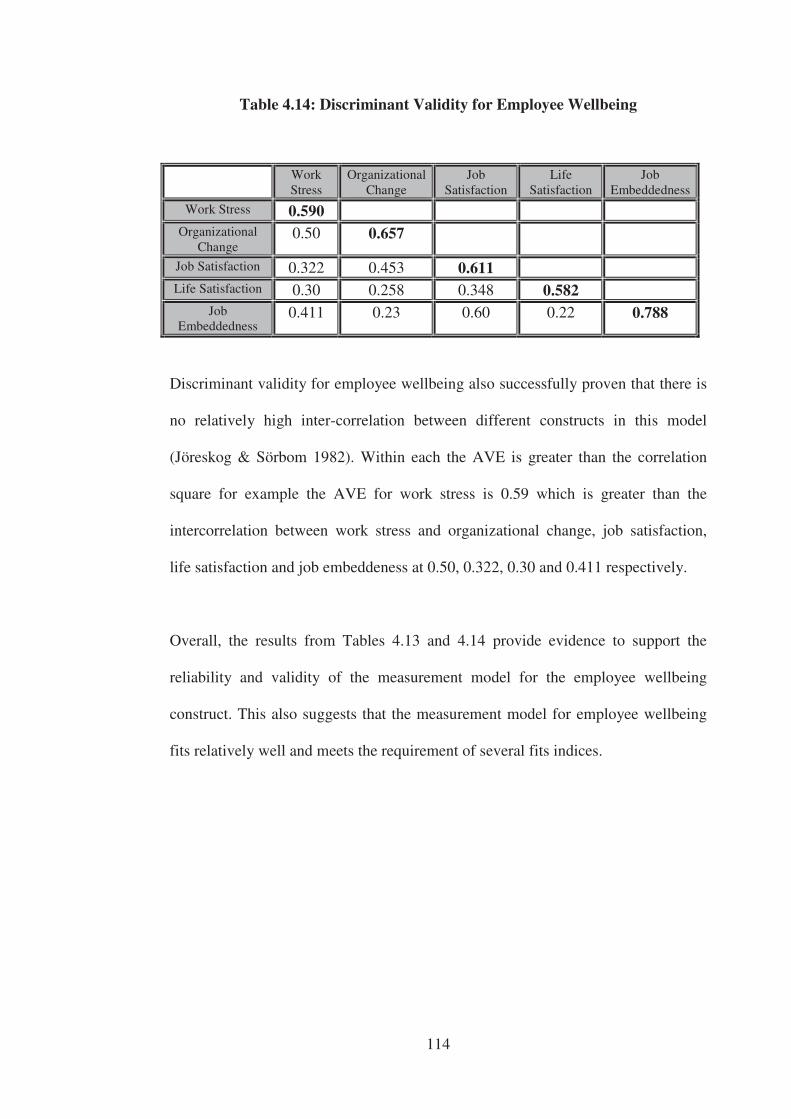
114
Table 4.14: Discriminant Validity for Employee Wellbeing
Discriminant validity for employee wellbeing also successfully proven that there is
no relatively high inter-correlation between different constructs in this model
(Jöreskog & Sörbom 1982). Within each the AVE is greater than the correlation
square for example the AVE for work stress is 0.59 which is greater than the
intercorrelation between work stress and organizational change, job satisfaction,
life satisfaction and job embeddeness at 0.50, 0.322, 0.30 and 0.411 respectively.
Overall, the results from Tables 4.13 and 4.14 provide evidence to support the
reliability and validity of the measurement model for the employee wellbeing
construct. This also suggests that the measurement model for employee wellbeing
fits relatively well and meets the requirement of several fits indices.
Work Stress
Organizational Change
Job Satisfaction
Life Satisfaction
Job Embeddedness
Work Stress 0.590 Organizational
Change 0.50 0.657
Job Satisfaction 0.322 0.453 0.611 Life Satisfaction 0.30 0.258 0.348 0.582
Job Embeddedness
0.411 0.23 0.60 0.22 0.788
115
4.8 Specification of Structural Model
Following the measurement model stage, the structural model was then specified by
assigning the relationships between constructs based on the conceptual framework
that was advanced in Chapter 2. The structural model was used to test the
hypotheses of the study.
Specifically in this study, a mediation analysis within the structural model was
involved. Mediation analysis of structural model consists of three types of variables
that form a chain of relations among the variables called direct effect and indirect
effect and also known as mediated effect (MacKinnon & Fairchild 2009). These
relations in a mediation structural model are represented by three equations
(MacKinnon & Dwyer 1993).
Y = i1+cX+e1
(1)
Y = i2+c’X+bM+e2
(2)
M = i3+aX+e3
(3)
Where Y is the dependent variable, X is the independent variable and M is the
mediating variable. c represents the coefficient to show how strongly X predicts Y;
c’ is the prediction of Y from X, (when the strength of the M-to-Y removed); b is
the coefficient for the strength of the relation between M and Y (with the strength
of the X-to-Y relation removed) and a is the coefficient representing the strength of
the relationship between X and M. The intercepts in each equation representing the
116
average score of each variable are i1 and i2 and i3, respectively; and e1, e2 and e3
represent the error or the part of the relation that cannot be predicted (MacKinnon
& Fairchild 2009). Based on the equation, a direct effect involved between X to Y
with the strength of the mediator relation removed, a mediation effect or indirect
effect is the effect of X to Y execute the mediator and finally a total effect of X on
Y is computed by the addition of the two effects (direct and indirect effect).
In a particular mediation model, the independent variable (X) predicts the mediator
variable (M) which predicts the outcome; the dependent variable (Y) (Fairchild &
McQuillin 2010). Thus, mediator variable is depicted as the intermediator in the
relation between X and Y which explains how or why these two variables (X and
Y) are related.
The following hypotheses can now be tested:
H1:Leader-member exchange significantly influences employees’ intention to
turnover
H2: Leader-member exchange significantly influences employee wellbeing
H3: Employee wellbeing significantly influences employees' intention on turnover
H4: Employee wellbeing partially mediates the association between leader-member
exchange and turnover intentions.
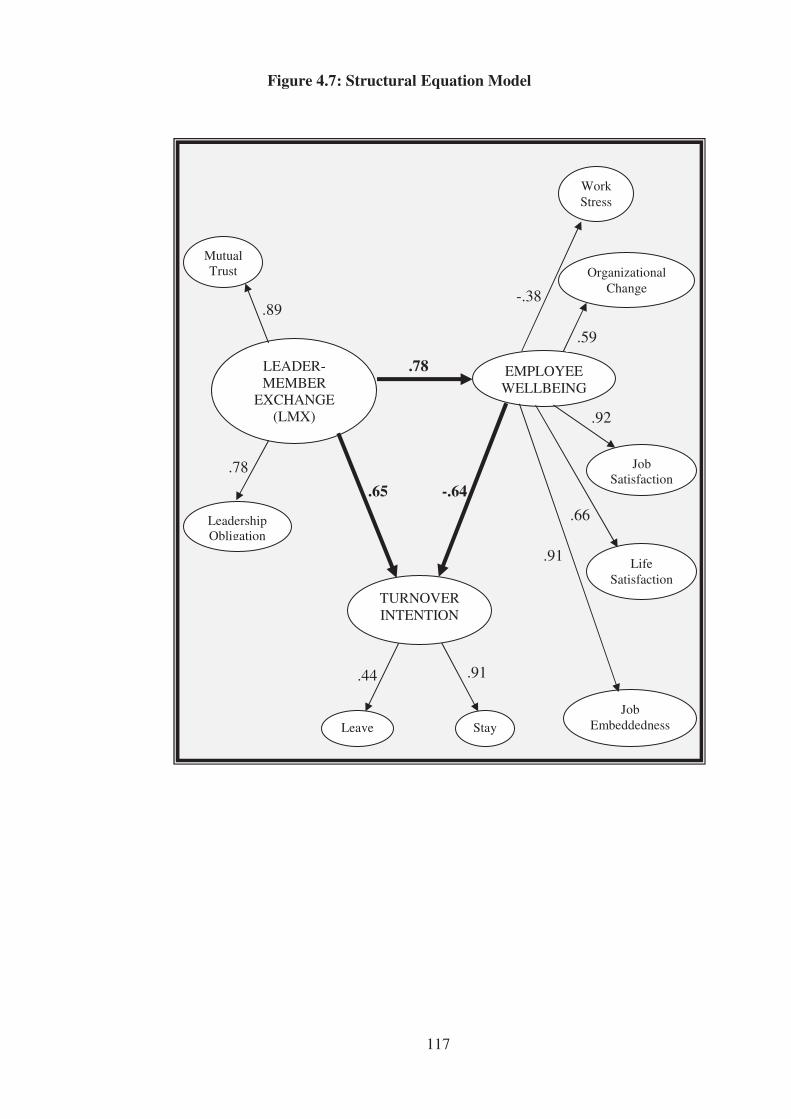
117
Figure 4.7: Structural Equation Model
Stay Leave
Leadership Obligation
Mutual Trust
TURNOVER INTENTION
LEADER-MEMBER
EXCHANGE (LMX)
Job Embeddedness
Life Satisfaction
Job Satisfaction
Organizational Change
Work Stress
EMPLOYEE WELLBEING
.89 -.38
.59
.78
.78
-.64 .65
.91
.66
.92
.91 .44
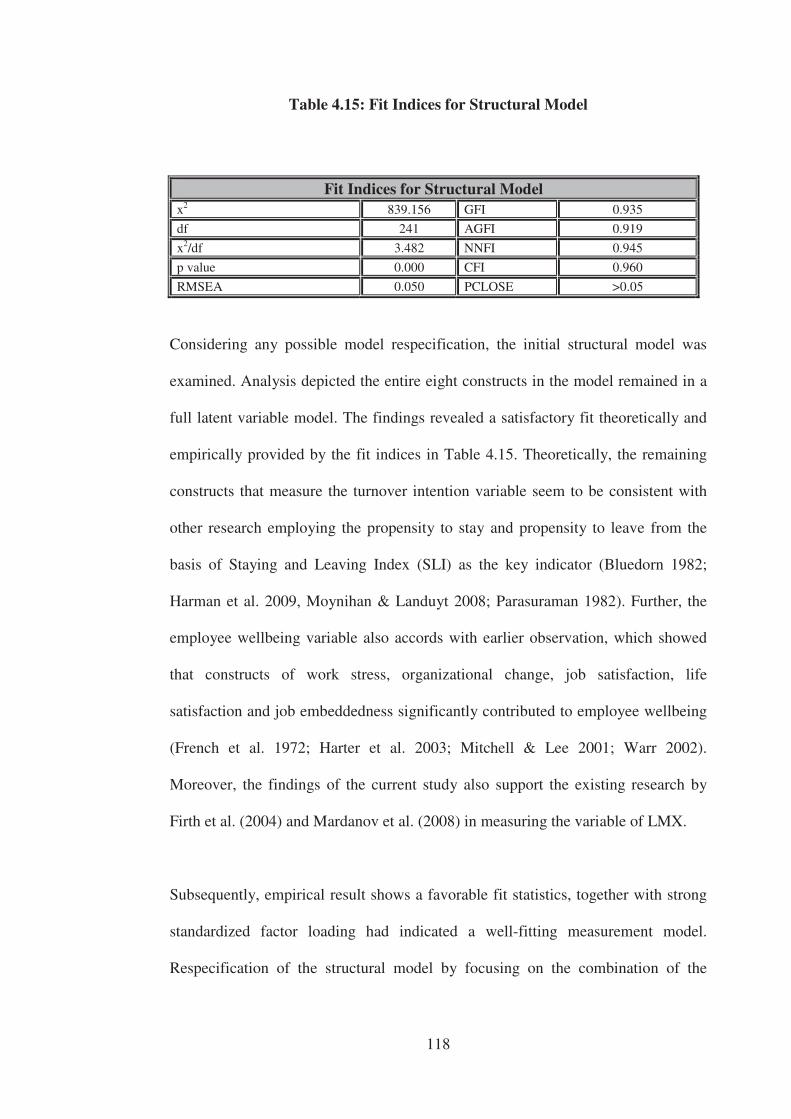
118
Table 4.15: Fit Indices for Structural Model
Considering any possible model respecification, the initial structural model was
examined. Analysis depicted the entire eight constructs in the model remained in a
full latent variable model. The findings revealed a satisfactory fit theoretically and
empirically provided by the fit indices in Table 4.15. Theoretically, the remaining
constructs that measure the turnover intention variable seem to be consistent with
other research employing the propensity to stay and propensity to leave from the
basis of Staying and Leaving Index (SLI) as the key indicator (Bluedorn 1982;
Harman et al. 2009, Moynihan & Landuyt 2008; Parasuraman 1982). Further, the
employee wellbeing variable also accords with earlier observation, which showed
that constructs of work stress, organizational change, job satisfaction, life
satisfaction and job embeddedness significantly contributed to employee wellbeing
(French et al. 1972; Harter et al. 2003; Mitchell & Lee 2001; Warr 2002).
Moreover, the findings of the current study also support the existing research by
Firth et al. (2004) and Mardanov et al. (2008) in measuring the variable of LMX.
Subsequently, empirical result shows a favorable fit statistics, together with strong
standardized factor loading had indicated a well-fitting measurement model.
Respecification of the structural model by focusing on the combination of the
Fit Indices for Structural Model x2 839.156 GFI 0.935
df 241 AGFI 0.919
x2/df 3.482 NNFI 0.945
p value 0.000 CFI 0.960
RMSEA 0.050 PCLOSE >0.05
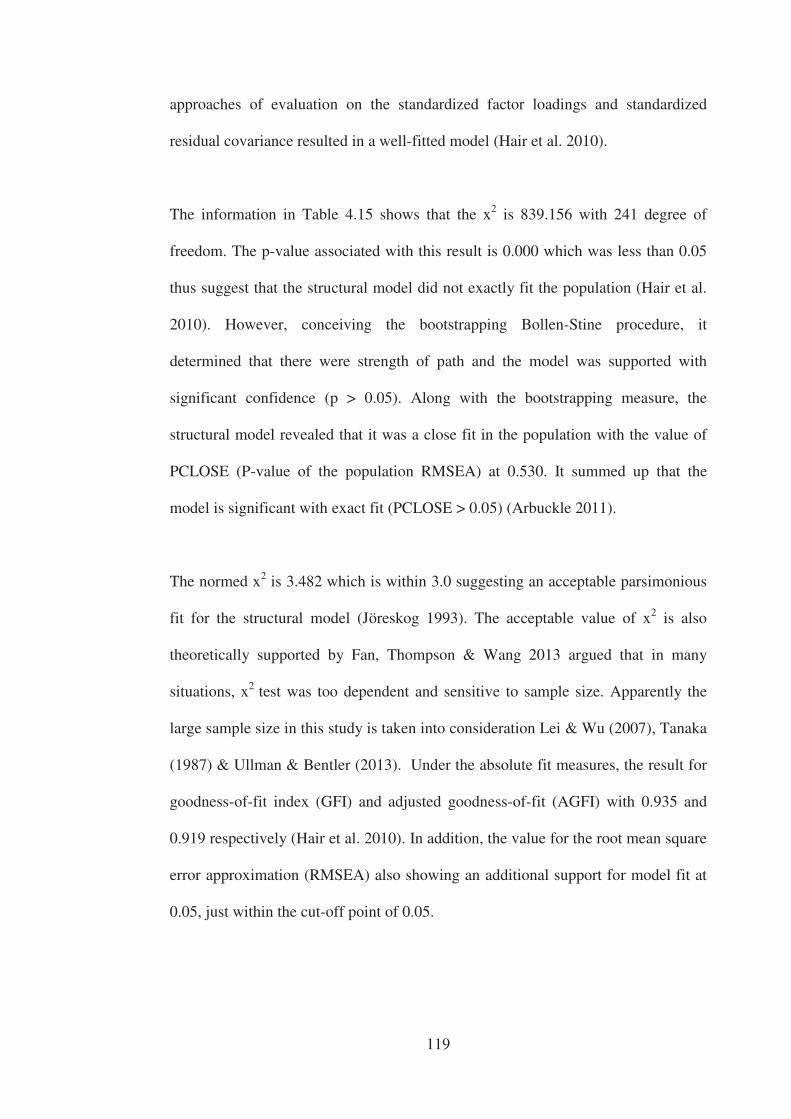
119
approaches of evaluation on the standardized factor loadings and standardized
residual covariance resulted in a well-fitted model (Hair et al. 2010).
The information in Table 4.15 shows that the x2 is 839.156 with 241 degree of
freedom. The p-value associated with this result is 0.000 which was less than 0.05
thus suggest that the structural model did not exactly fit the population (Hair et al.
2010). However, conceiving the bootstrapping Bollen-Stine procedure, it
determined that there were strength of path and the model was supported with
significant confidence (p > 0.05). Along with the bootstrapping measure, the
structural model revealed that it was a close fit in the population with the value of
PCLOSE (P-value of the population RMSEA) at 0.530. It summed up that the
model is significant with exact fit (PCLOSE > 0.05) (Arbuckle 2011).
The normed x2 is 3.482 which is within 3.0 suggesting an acceptable parsimonious
fit for the structural model (Jöreskog 1993). The acceptable value of x2 is also
theoretically supported by Fan, Thompson & Wang 2013 argued that in many
situations, x2 test was too dependent and sensitive to sample size. Apparently the
large sample size in this study is taken into consideration Lei & Wu (2007), Tanaka
(1987) & Ullman & Bentler (2013). Under the absolute fit measures, the result for
goodness-of-fit index (GFI) and adjusted goodness-of-fit (AGFI) with 0.935 and
0.919 respectively (Hair et al. 2010). In addition, the value for the root mean square
error approximation (RMSEA) also showing an additional support for model fit at
0.05, just within the cut-off point of 0.05.
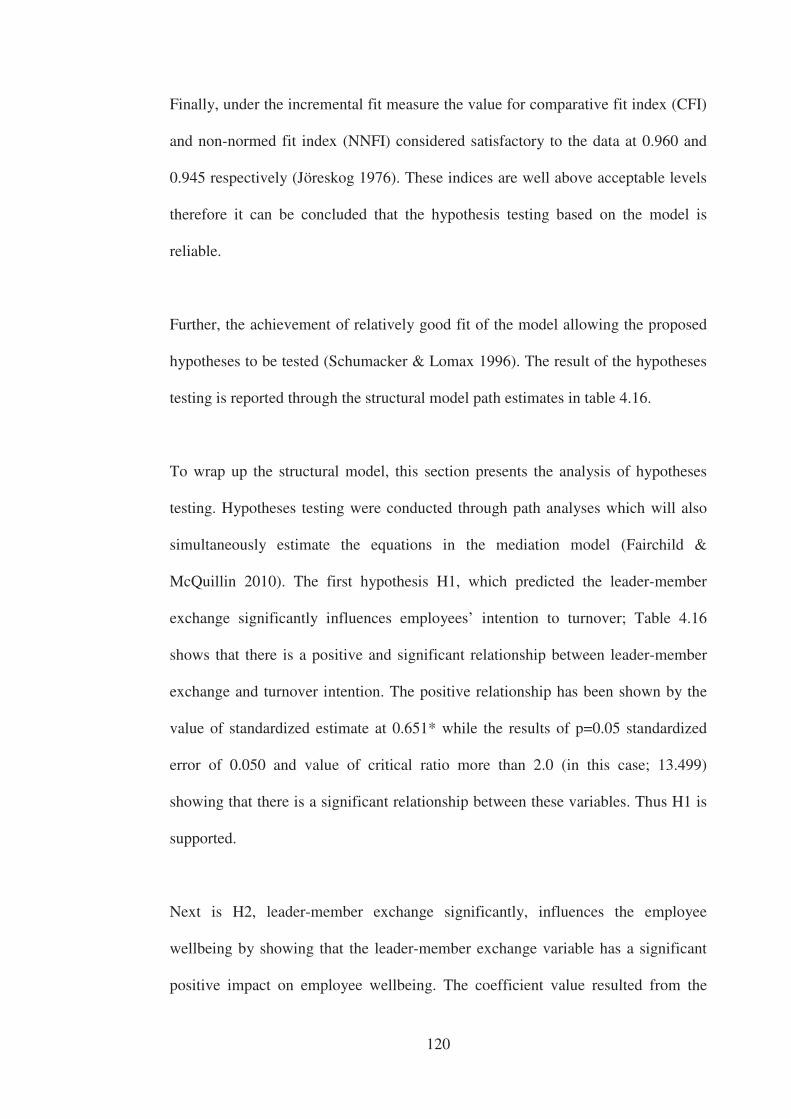
120
Finally, under the incremental fit measure the value for comparative fit index (CFI)
and non-normed fit index (NNFI) considered satisfactory to the data at 0.960 and
0.945 respectively (Jöreskog 1976). These indices are well above acceptable levels
therefore it can be concluded that the hypothesis testing based on the model is
reliable.
Further, the achievement of relatively good fit of the model allowing the proposed
hypotheses to be tested (Schumacker & Lomax 1996). The result of the hypotheses
testing is reported through the structural model path estimates in table 4.16.
To wrap up the structural model, this section presents the analysis of hypotheses
testing. Hypotheses testing were conducted through path analyses which will also
simultaneously estimate the equations in the mediation model (Fairchild &
McQuillin 2010). The first hypothesis H1, which predicted the leader-member
exchange significantly influences employees’ intention to turnover; Table 4.16
shows that there is a positive and significant relationship between leader-member
exchange and turnover intention. The positive relationship has been shown by the
value of standardized estimate at 0.651* while the results of p=0.05 standardized
error of 0.050 and value of critical ratio more than 2.0 (in this case; 13.499)
showing that there is a significant relationship between these variables. Thus H1 is
supported.
Next is H2, leader-member exchange significantly, influences the employee
wellbeing by showing that the leader-member exchange variable has a significant
positive impact on employee wellbeing. The coefficient value resulted from the
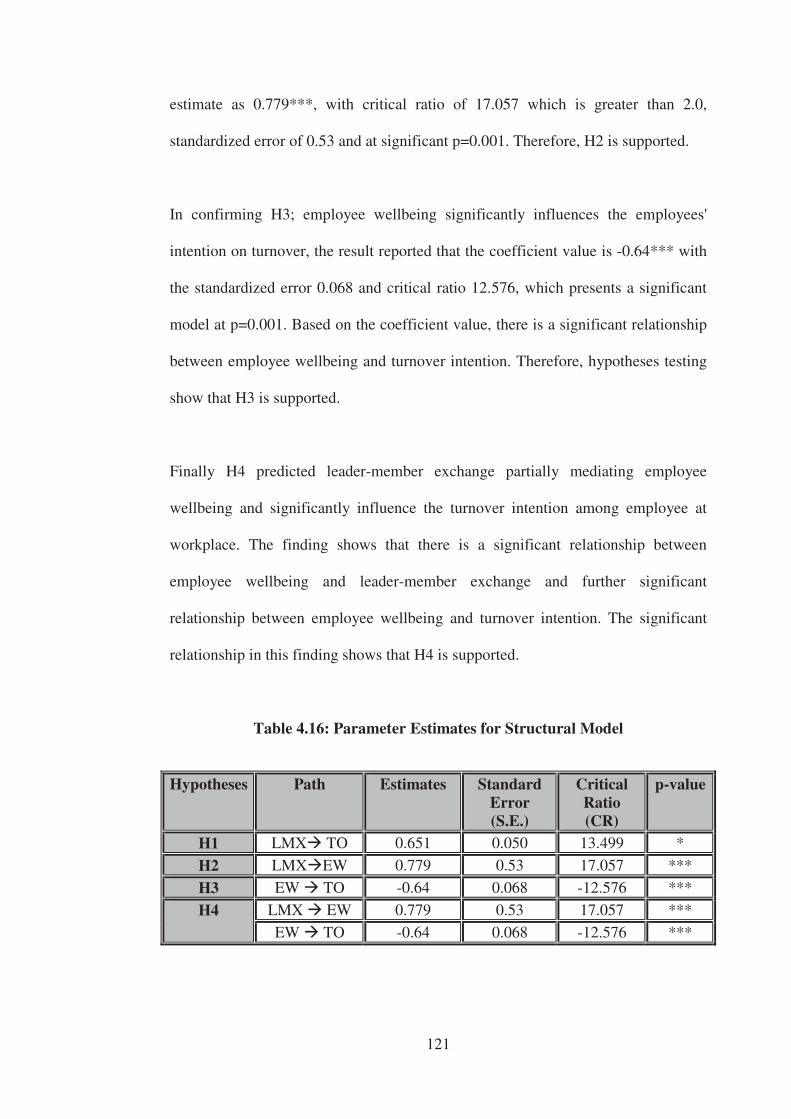
121
estimate as 0.779***, with critical ratio of 17.057 which is greater than 2.0,
standardized error of 0.53 and at significant p=0.001. Therefore, H2 is supported.
In confirming H3; employee wellbeing significantly influences the employees'
intention on turnover, the result reported that the coefficient value is -0.64*** with
the standardized error 0.068 and critical ratio 12.576, which presents a significant
model at p=0.001. Based on the coefficient value, there is a significant relationship
between employee wellbeing and turnover intention. Therefore, hypotheses testing
show that H3 is supported.
Finally H4 predicted leader-member exchange partially mediating employee
wellbeing and significantly influence the turnover intention among employee at
workplace. The finding shows that there is a significant relationship between
employee wellbeing and leader-member exchange and further significant
relationship between employee wellbeing and turnover intention. The significant
relationship in this finding shows that H4 is supported.
Table 4.16: Parameter Estimates for Structural Model
Hypotheses Path Estimates Standard Error (S.E.)
Critical Ratio (CR)
p-value
H1 LMX TO 0.651 0.050 13.499 *
H2 LMX EW 0.779 0.53 17.057 ***
H3 EW TO -0.64 0.068 -12.576 ***
H4 LMX EW 0.779 0.53 17.057 ***
EW TO -0.64 0.068 -12.576 ***
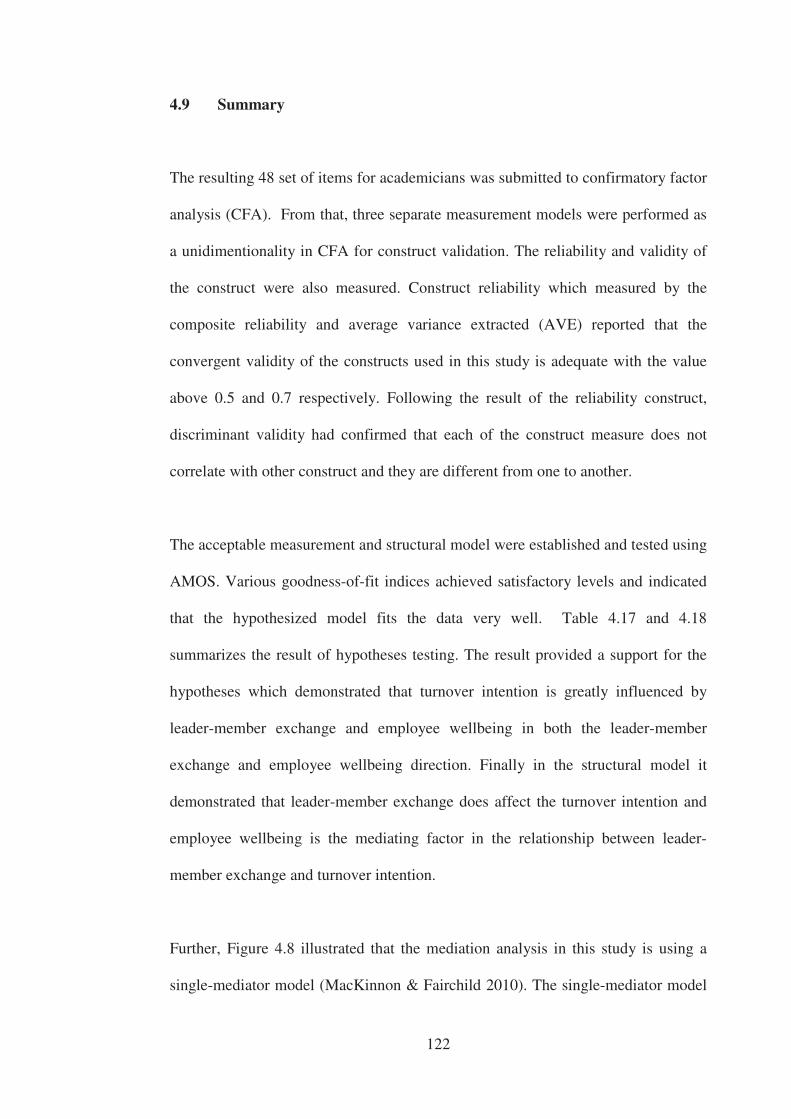
122
4.9 Summary
The resulting 48 set of items for academicians was submitted to confirmatory factor
analysis (CFA). From that, three separate measurement models were performed as
a unidimentionality in CFA for construct validation. The reliability and validity of
the construct were also measured. Construct reliability which measured by the
composite reliability and average variance extracted (AVE) reported that the
convergent validity of the constructs used in this study is adequate with the value
above 0.5 and 0.7 respectively. Following the result of the reliability construct,
discriminant validity had confirmed that each of the construct measure does not
correlate with other construct and they are different from one to another.
The acceptable measurement and structural model were established and tested using
AMOS. Various goodness-of-fit indices achieved satisfactory levels and indicated
that the hypothesized model fits the data very well. Table 4.17 and 4.18
summarizes the result of hypotheses testing. The result provided a support for the
hypotheses which demonstrated that turnover intention is greatly influenced by
leader-member exchange and employee wellbeing in both the leader-member
exchange and employee wellbeing direction. Finally in the structural model it
demonstrated that leader-member exchange does affect the turnover intention and
employee wellbeing is the mediating factor in the relationship between leader-
member exchange and turnover intention.
Further, Figure 4.8 illustrated that the mediation analysis in this study is using a
single-mediator model (MacKinnon & Fairchild 2010). The single-mediator model
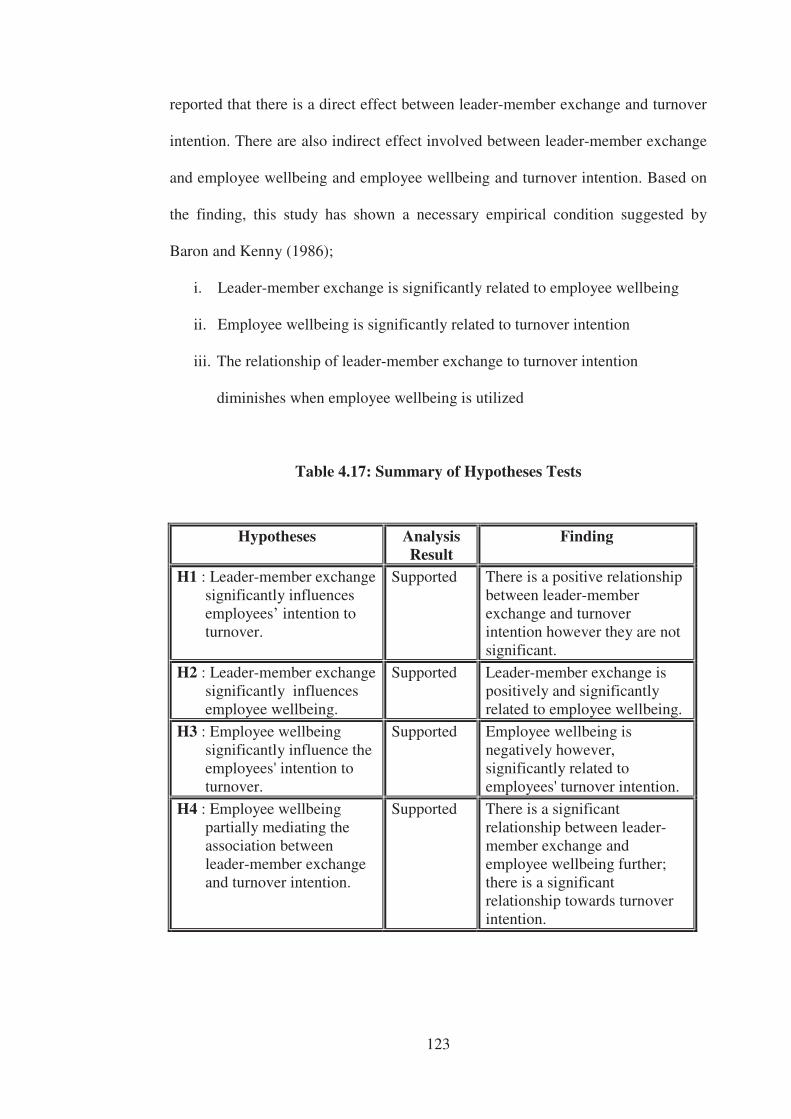
123
reported that there is a direct effect between leader-member exchange and turnover
intention. There are also indirect effect involved between leader-member exchange
and employee wellbeing and employee wellbeing and turnover intention. Based on
the finding, this study has shown a necessary empirical condition suggested by
Baron and Kenny (1986);
i. Leader-member exchange is significantly related to employee wellbeing
ii. Employee wellbeing is significantly related to turnover intention
iii. The relationship of leader-member exchange to turnover intention
diminishes when employee wellbeing is utilized
Table 4.17: Summary of Hypotheses Tests
Hypotheses Analysis Result
Finding
H1 : Leader-member exchange significantly influences employees’ intention to turnover.
Supported There is a positive relationship between leader-member exchange and turnover intention however they are not significant.
H2 : Leader-member exchange significantly influences employee wellbeing.
Supported Leader-member exchange is positively and significantly related to employee wellbeing.
H3 : Employee wellbeing significantly influence the employees' intention to turnover.
Supported Employee wellbeing is negatively however, significantly related to employees' turnover intention.
H4 : Employee wellbeing partially mediating the association between leader-member exchange and turnover intention.
Supported There is a significant relationship between leader-member exchange and employee wellbeing further; there is a significant relationship towards turnover intention.
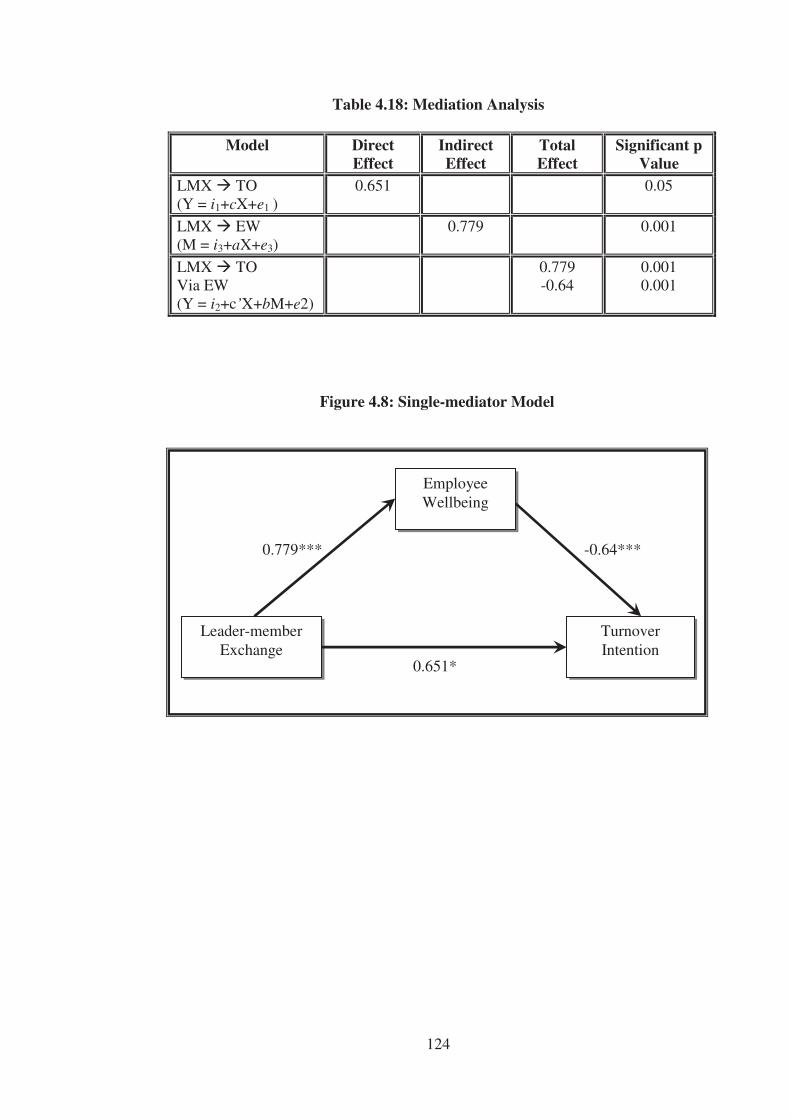
124
Table 4.18: Mediation Analysis
Model Direct Effect
Indirect Effect
Total Effect
Significant p Value
LMX TO (Y = i1+cX+e1 )
0.651 0.05
LMX EW (M = i3+aX+e3)
0.779 0.001
LMX TO Via EW (Y = i2+c’X+bM+e2)
0.779 -0.64
0.001 0.001
Employee Wellbeing
Leader-member Exchange
Turnover Intention
0.779***
0.651*
-0.64***
Figure 4.8: Single-mediator Model
125
4.10 Conclusion
This chapter presented the result of the main study from both the measurement
model and structural model. The purpose of using structural model in this study was
to ensure the consistency of the hypothesized construct with the proposed
mediating effects.
In conclusion, the hypotheses and subsequent finding for this study were achieved
through the method and assessment using the structural equation modeling. Further
discussion of the hypotheses testing and managerial implication of the finding will
be established in Chapter Five.
126
CHAPTER 5
DISCUSSION, RECOMMENDATIONS AND
CONCLUSION
5.1 Introduction
This final chapter reports the result yielded from the designed research question:
what is the role of employee wellbeing in the relationship of leader-member
exchange (LMX) and turnover intention. This chapter begins with a brief
explanation on the research context. It is followed by discussion of the research
findings including the gaps indentified from the literature. It then provides the key
contributions of the theoretical and managerial implications and considers
limitations of the study together with recommendations for future studies. The
chapter also concludes with a summary of the entire thesis and its original
contribution.
127
5.2 Background context
The discussion of turnover intention in the literature has generally focused on the
reasons why employees have a propensity to stay and leave an organization Mobley
et al. (1999), (Kim et al. 2010) (Cascio 1976; Mitchell et al. 2001). The emergence
of global competition in the job market has apparently become the main contributor
to turnover (Schaefer 2002).
Actual turnover causes various disadvantages to organizations, such as moving
costs, losing talent and losing valued relationships among colleagues (Kim et al.
2010, Steed & Shinnar 2004, Tracey & Hinkin 2008, Whitt 2006, Staw 1980; Van
Dick et al. 2004). However, Schyns et al. (2007) observed that employees consider
turnover intention positively because they will have the courage to find better job
offers and associated benefits. Turnover intention is related to company policies,
perception of workers and characteristics of the labour market which constitute the
complementary attitudinal components in the decisions of people quit their jobs
(Parasuraman 1982). For example, inequality of treatment is linked to search for
better opportunities (Dansereau et al. 1973).
Turnover intention occurs naturally in any organization. However, much of the
previous research was done in private sector organization (Moynihan & Landuyt
2008). The turnover rate varied from one industry to another, with service
industries, entertainment, arts and recreation industries and retail trade industries
registering the highest turnover rates as compared to industries such as high-tech,
128
utilities and professional-association industries (Society for Human Resource
Management 2011).
In recent years, the number of studies about the effect of turnover intention on
organizations has increased. Some related issues are discussed across disciplines
and not only limited to technical areas such as in hospitality (Davidson et al. 2010;
Hinkin & Tracey 2000) and healthcare (Price & Muller 1981; Robin & Davidzihar
2007), but also among customer service (Schalk & van Rijckevorsel 2007; Zhong et
al. 2006) and administration (Dansereau et al. 1973). However, the empirical
evidence has been equivocal as agreed by Houkes, Janssen, deJonge & Bakker
2003, Lee & Mowday (1987) and Mobley & Williams (1978). The current study
contributes to the debate by adding data related to academicians in Malaysia.
The problem with most studies on turnover is that they merely focused on
demographic variables and job satisfaction as their predictors (Martin 1979). In the
Malaysian context, particularly for women, turnover is linked to conflicting work
and family duties (Choong, Keh, Tan & Tan 2013). A recent Malaysian public
sector has reported an increase in the rate of attrition of nearly 10% (MOHE 2010).
Since it is difficult to measure the actual turnover, this study narrows the scope by
focusing on turnover intention. Through the identification of antecedents on
turnover intention, it can shed some light in understanding actual turnover in the
Malaysian education system (Mobley 1977; Hom & Griffith 1999).
The purpose of this study was to substantiate a model that identifies the impact of
leader-member exchange practice and employee wellbeing relationships on
129
turnover intention in a community college. Prior research has demonstrated that
turnover intention is linked to push (Lanigan 2008; Siong et al. 2006 & Wasmuth &
Davis 1983) and pull (McBey & Karakowsky 2001; Shen et al. 2004) factors. Thus,
the aim of this research was to extend current knowledge of turnover intention by
looking at the role of LMX and employee wellbeing in mediation relationships.
5.3 Discussion of Findings
In this study, it was hypothesized that:
H1: Leader-member exchange significantly influences employees’ intention to
turnover
H2: Leader-member exchange significantly influences the employee wellbeing
H3: Employee wellbeing significantly influences the employees' intention on
turnover
H4: Employee wellbeing partially mediates the association between leader-member
exchange and turnover intentions.
The constructs for every variable were operationalized in a questionnaire that
comprised forty nine items related to turnover intention, LMX and employee
wellbeing. The questionnaire was distributed as a census to all academicians
working in community colleges located in Peninsular Malaysia with a response rate
of 51.8% (1002 responses). SEM was used to test a model of the interaction
between variables.
130
The discussion of the results from Chapter 4 is organized into four sections
corresponding to the hypotheses developed in Chapter 1. To test the impact of
leader-member exchange on turnover intention, measures of employee wellbeing as
a mediator effect were used to assess the turnover intention among the academics in
community colleges as in this study. The measurement and structural model tested
in this study suggests that the theoretical models are valid for this research. The
results of the structural model are displayed in Figure 5.1 using mediating analysis
as predicted in the conceptual framework developed for this study as discussed in
Chapter 2. The present results are significant in respect of the direct and indirect
effect between involved variables.
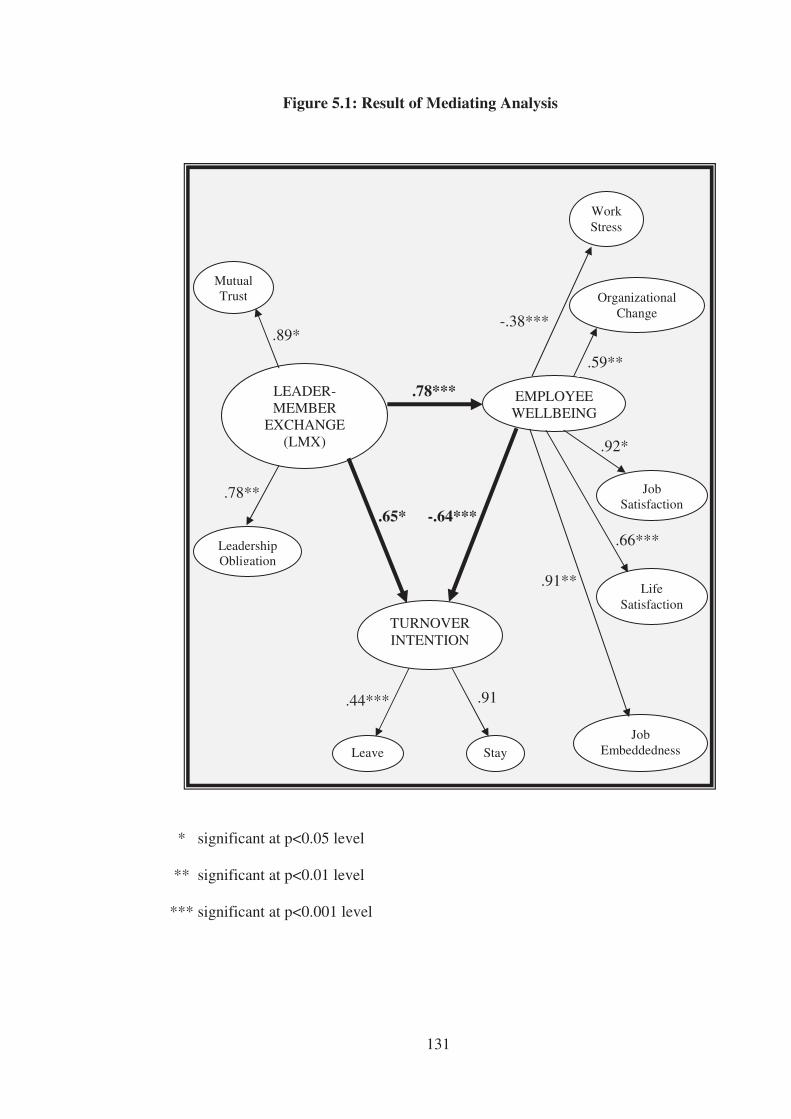
131
* significant at p<0.05 level
** significant at p<0.01 level
*** significant at p<0.001 level
Figure 5.1: Result of Mediating Analysis
Stay Leave
Leadership Obligation
Mutual Trust
TURNOVER INTENTION
LEADER-MEMBER
EXCHANGE (LMX)
Job Embeddedness
Life Satisfaction
Job Satisfaction
Organizational Change
Work Stress
EMPLOYEE WELLBEING
.89* -.38***
.59**
.78**
.78***
-.64*** .65*
.91**
.66***
.92*
.91 .44***
132
5.3.1 Influence of LMX towards Employees’ Intention to Turnover
The hypothesis envisaged that the LMX as the independent variable and turnover
intention construct as the dependent variable; reported a coefficient estimate of =
0.065. The value indicates a significant relationship at p value less than 0.05. Thus,
the findings support the first hypothesis.
The positive value of coefficient estimate ( = 0.65) results in positive relationship
between LMX and turnover intention. Thus, suggests two different possibilities that
are high implementation on LMX constitute to high turnover intention; or low
implementation on LMX constitute to low turnover intention.
This results are in contrast to Grean et al. (1982), Joyce (2006), Myatt (2008),
Robbins & Davidhizar (2007) and Schyns et al. (2007) which previously reported
that low quality LMX leads to high employee turnover rate. However, it still
supported the previous finding by Harris et al. (2009) and Morrow et al. (2005).
With the positive direction of the relationship between leader-member exchange
and turnover intention, this finding was unexpected and suggests that the high
implementation of leader-member exchange in community colleges causes high
employee turnover intention among academicians in community colleges and vice
versa.
The positive relationships reported in this study suggest two different perspectives.
Firstly, when implementation of LMX is high and turnover intention is high;
finding suggests that the leader in community college effectively facilitates
(mentor/train/prepare) the academicians to move on with the college through
133
political skills (Ahearn, Ferris, Hochwarter, Douglas & Ammeter 2004). Harris et
al. (2009) strongly agreed that the existence of political skills significantly affected
the way how the quality of LMX in the organization is perceived as high. Leaders
with political skills are better able to understand others at work and use such
knowledge to influence others to act in ways that enhance their personal or
organizational objectives (Ahearn et. al. 2004). However, solely applying the
political skills is such an unhealthy work culture by which leaders of the
organization misused their power and abilities for personal reason Pfeffer et al.
(2009). In this case, high intention to leave the community college is in the
response of the individual’s perception towards incongruity with the work culture.
At this stage, ample support from leaders in the community college does not
guarantee that the academicians will stay with the college since each individual
perceived goal differently. This is because the leaders are more incline to gain
support from the top management for their self benefits rather than practicing to
become an effective leaders.
Further, survey responses indicate that though an academician feels comfortable
with his or her current position, it does not determine his or her intention to stay
with the community colleges in the future. As Budhwar, Varma, Malhotra &
Mukherjee (2009) suggests, the importance of pull factors; when outside
environment is better the current organization and sense of loyal has gone. Loyalty
is an interactive influence to turnover intention Moynihan and Landuyt (2008).
Therefore, the strong attachment an individual feels towards the organization may
be fostered. Management can work in with employees to alleviate the strong
134
engagement work culture that is motivating the employee’s attitudes towards their
job (Rogers, Clow & Kash 1994).
The second perspective of the result; when implementation of LMX is low and
turnover intention is low; the result suggests that it happen because poor LMX may
induce the perception that the chance for an academician to secure a position
outside a community college is low. Therefore to stay with the community college
is a better choice for them. Low implementation on LMX disengages the
academicians with their role-making process and reducing their opportunity to
received challenging task (Kim et. al. 2010 & Lee 2000). As a consequence of poor
LMX, fellow workers have a strong belief that they do not have to work hard
because they know that at any circumstances, they will not going any further in
their career path (Harris et al. 2005). They will keep distance and being avoidance
physically, cognitively and emotionally during the organizational role performance
too (Saks 2005). However, the present of disengagement academicians are believed
to share the similar objective that is to ensure the successful of their end career; that
is to ensure that they have secure retirement path (Chen, Chang & Yeh 2004).
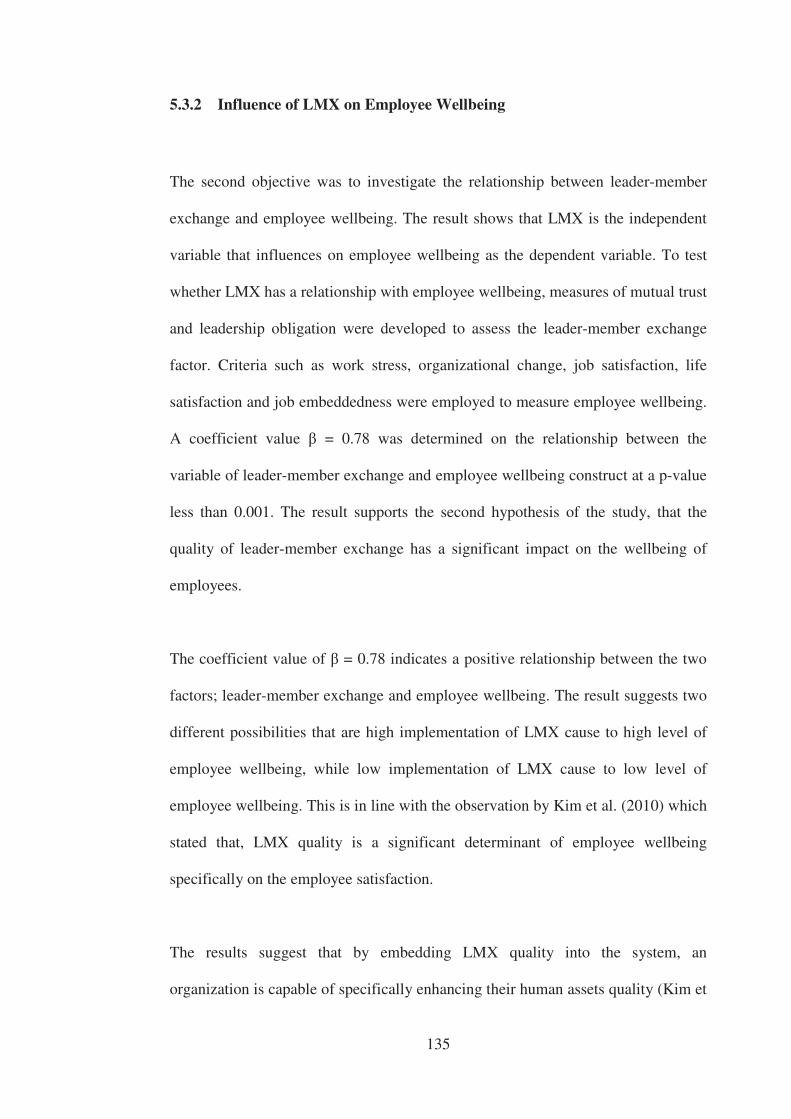
135
5.3.2 Influence of LMX on Employee Wellbeing
The second objective was to investigate the relationship between leader-member
exchange and employee wellbeing. The result shows that LMX is the independent
variable that influences on employee wellbeing as the dependent variable. To test
whether LMX has a relationship with employee wellbeing, measures of mutual trust
and leadership obligation were developed to assess the leader-member exchange
factor. Criteria such as work stress, organizational change, job satisfaction, life
satisfaction and job embeddedness were employed to measure employee wellbeing.
A coefficient value = 0.78 was determined on the relationship between the
variable of leader-member exchange and employee wellbeing construct at a p-value
less than 0.001. The result supports the second hypothesis of the study, that the
quality of leader-member exchange has a significant impact on the wellbeing of
employees.
The coefficient value of = 0.78 indicates a positive relationship between the two
factors; leader-member exchange and employee wellbeing. The result suggests two
different possibilities that are high implementation of LMX cause to high level of
employee wellbeing, while low implementation of LMX cause to low level of
employee wellbeing. This is in line with the observation by Kim et al. (2010) which
stated that, LMX quality is a significant determinant of employee wellbeing
specifically on the employee satisfaction.
The results suggest that by embedding LMX quality into the system, an
organization is capable of specifically enhancing their human assets quality (Kim et
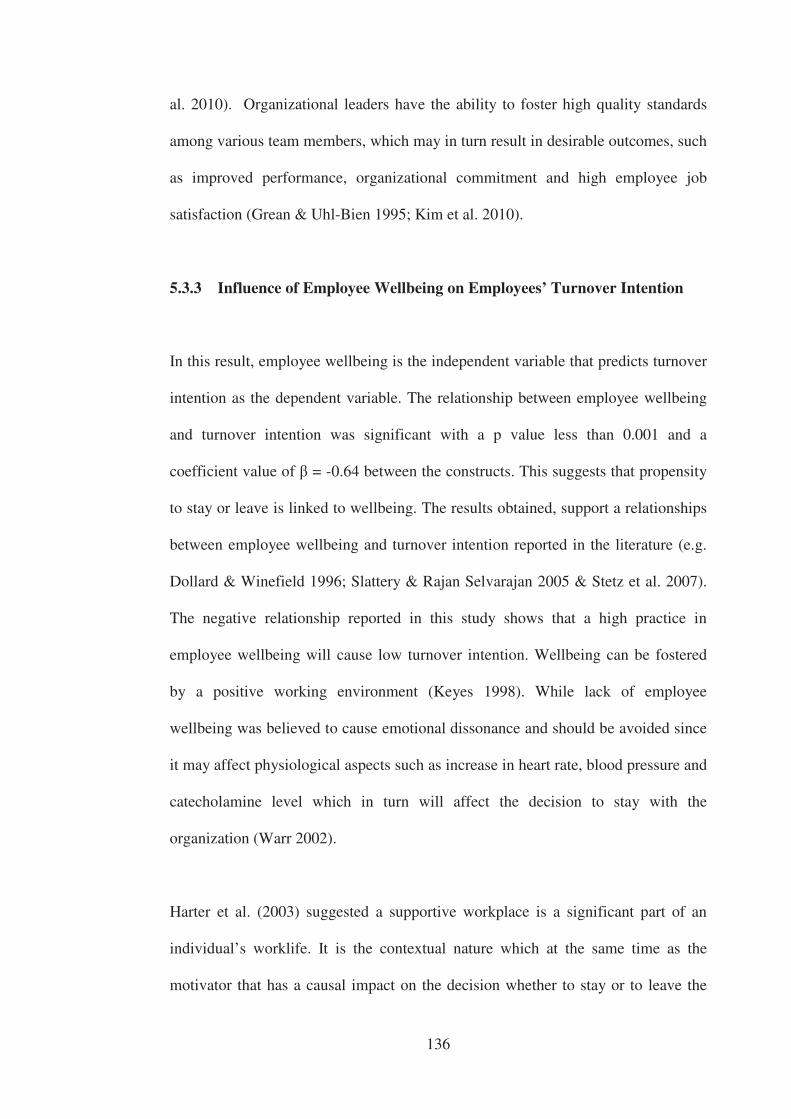
136
al. 2010). Organizational leaders have the ability to foster high quality standards
among various team members, which may in turn result in desirable outcomes, such
as improved performance, organizational commitment and high employee job
satisfaction (Grean & Uhl-Bien 1995; Kim et al. 2010).
5.3.3 Influence of Employee Wellbeing on Employees’ Turnover Intention
In this result, employee wellbeing is the independent variable that predicts turnover
intention as the dependent variable. The relationship between employee wellbeing
and turnover intention was significant with a p value less than 0.001 and a
coefficient value of = -0.64 between the constructs. This suggests that propensity
to stay or leave is linked to wellbeing. The results obtained, support a relationships
between employee wellbeing and turnover intention reported in the literature (e.g.
Dollard & Winefield 1996; Slattery & Rajan Selvarajan 2005 & Stetz et al. 2007).
The negative relationship reported in this study shows that a high practice in
employee wellbeing will cause low turnover intention. Wellbeing can be fostered
by a positive working environment (Keyes 1998). While lack of employee
wellbeing was believed to cause emotional dissonance and should be avoided since
it may affect physiological aspects such as increase in heart rate, blood pressure and
catecholamine level which in turn will affect the decision to stay with the
organization (Warr 2002).
Harter et al. (2003) suggested a supportive workplace is a significant part of an
individual’s worklife. It is the contextual nature which at the same time as the
motivator that has a causal impact on the decision whether to stay or to leave the
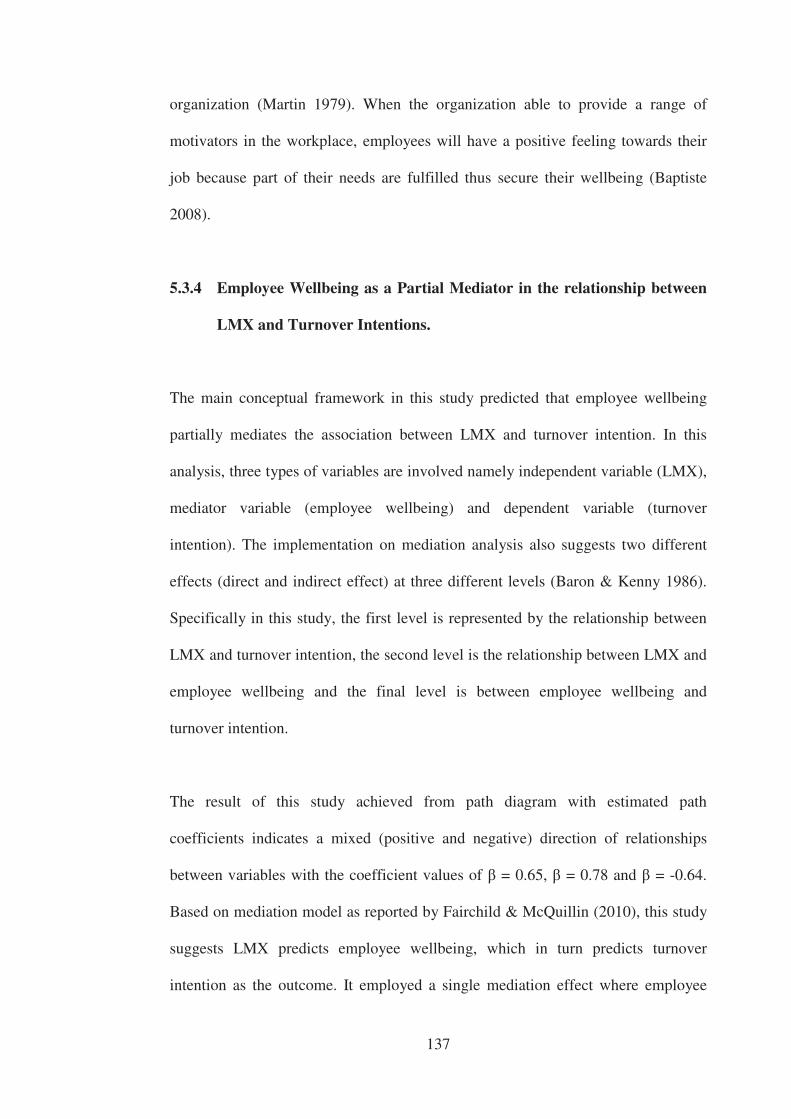
137
organization (Martin 1979). When the organization able to provide a range of
motivators in the workplace, employees will have a positive feeling towards their
job because part of their needs are fulfilled thus secure their wellbeing (Baptiste
2008).
5.3.4 Employee Wellbeing as a Partial Mediator in the relationship between
LMX and Turnover Intentions.
The main conceptual framework in this study predicted that employee wellbeing
partially mediates the association between LMX and turnover intention. In this
analysis, three types of variables are involved namely independent variable (LMX),
mediator variable (employee wellbeing) and dependent variable (turnover
intention). The implementation on mediation analysis also suggests two different
effects (direct and indirect effect) at three different levels (Baron & Kenny 1986).
Specifically in this study, the first level is represented by the relationship between
LMX and turnover intention, the second level is the relationship between LMX and
employee wellbeing and the final level is between employee wellbeing and
turnover intention.
The result of this study achieved from path diagram with estimated path
coefficients indicates a mixed (positive and negative) direction of relationships
between variables with the coefficient values of = 0.65, = 0.78 and = -0.64.
Based on mediation model as reported by Fairchild & McQuillin (2010), this study
suggests LMX predicts employee wellbeing, which in turn predicts turnover
intention as the outcome. It employed a single mediation effect where employee
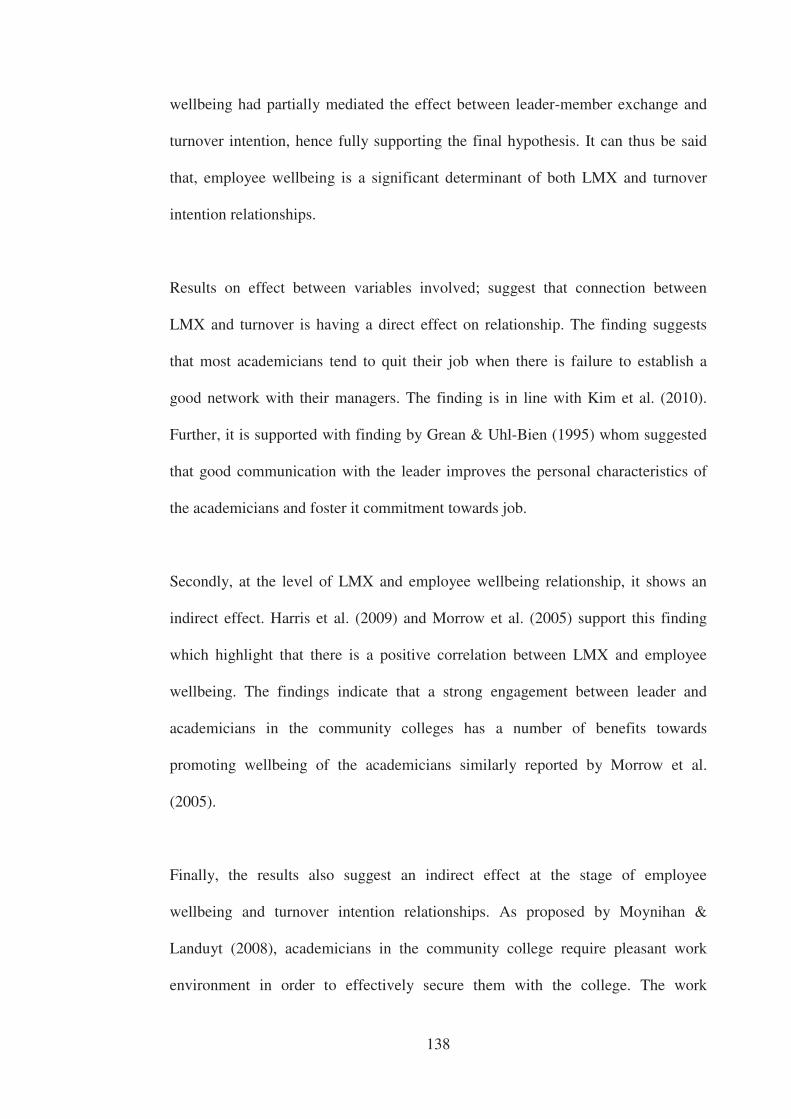
138
wellbeing had partially mediated the effect between leader-member exchange and
turnover intention, hence fully supporting the final hypothesis. It can thus be said
that, employee wellbeing is a significant determinant of both LMX and turnover
intention relationships.
Results on effect between variables involved; suggest that connection between
LMX and turnover is having a direct effect on relationship. The finding suggests
that most academicians tend to quit their job when there is failure to establish a
good network with their managers. The finding is in line with Kim et al. (2010).
Further, it is supported with finding by Grean & Uhl-Bien (1995) whom suggested
that good communication with the leader improves the personal characteristics of
the academicians and foster it commitment towards job.
Secondly, at the level of LMX and employee wellbeing relationship, it shows an
indirect effect. Harris et al. (2009) and Morrow et al. (2005) support this finding
which highlight that there is a positive correlation between LMX and employee
wellbeing. The findings indicate that a strong engagement between leader and
academicians in the community colleges has a number of benefits towards
promoting wellbeing of the academicians similarly reported by Morrow et al.
(2005).
Finally, the results also suggest an indirect effect at the stage of employee
wellbeing and turnover intention relationships. As proposed by Moynihan &
Landuyt (2008), academicians in the community college require pleasant work
environment in order to effectively secure them with the college. The work
139
environment is important since it reflects how the organization interacts with the
members. It is categorized as a social-psychological factor, which is associated with
structural variable (Deery, Iverson & Walsh 2006). Social-psychological factor is
the frame of organizational behavior such as ability to express creativity and
individual intrinsic motivation with existence support from the workplace (Shalley
& Perry-Smith 2001). For example, when the work environment is conducive to the
creativity requirements of the job, individual has high level of satisfaction and low
intention to turnover (Shalley, Gilson & Blum 2000). Alternatively, it helps to deal
with the organizational pressure and improves he innovativeness of the organization
(Amabile 1988).
Having a mediation effect in this study, suggest that employee wellbeing could be a
supportive element in preventing the intention to leave the organization. It also
supported previous research by Baron and Kenny (1986) that indirect effects
improve and take control of the direct effect.
140
5.4 Strengths of the Research
This research is unique in examining simultaneously, the effect of organizational
behavior specifically employee wellbeing and LMX towards turnover intention
from a global context of discussion. By integrating the factors influencing turnover
intention, it suggests that employees prefer lively and secure working conditions in
managing their own career (Warr 2002). Lack of room for development, will create
uncertainties among employees (Arthur 2001). Employees work for learning, fun
and personal goals as well as money (Gaertner 1999; Scott, Bishop & Chen 2003;
Mitchell et al. 2001). Fulfilling such needs should lead to optimum performance
(Gartner 1999; Scott 2003).
Malaysian public sector employees were surveyed in this study. This expands on
existing research at the international level. The data collected are valid and reliable
for the context of this research. They provide a basis for cross-cultural comparison
of talent management practices. All of the scales have been statistically tested
rigorously using pre-testing, confirmatory factor analysis, reliability test and
validity test of the constructs.
The final advantage nurtured from using SEM specifically using mediation
analysis; where it added the ability to estimate the direct and indirect relationships
(Little et al. 2007). Mediation analysis is the complex extensions contextual
variable analysis. It is a better approach as compared to standardized regression
approaches which require a series of sequential estimations. By using this approach,
researcher may also capable to identify three main elements as suggested by
141
Fairchild and McQuillin (2010); firstly the supportive element which encourages
intended behavior. Secondly the ineffective element which did not contributes to
changing the behavioral outcome. Finally the iatrogenic element; promotes
unintended effects of particular practices.
5.5 Implications of the Study
5.5.1 Theoretical Implications
This study provides empirical evidence of a relationship between leader-member
exchange and turnover intention. It also adds to the number of studies of the
relationship between employee wellbeing and turnover intention. Few studies have
linked employee wellbeing to business-unit outcomes such as employee turnover
intention (Harter et al. 2002). Further, it suggests an indirect relationship between
leader-member exchange and employee wellbeing and of employee wellbeing and
turnover intention. The result supports the role of LMX and employee wellbeing in
employees’ decision to stay or to leave the organization found in other studies
(Dollard & Winefield 1996; Grean & Uhl-Bien 1995; Harris et al. 2009; Keyes
1998; Kim et al. 2010; Morrow et al. 2005; Slattery & Selvarajan 2005; and & Stetz
et al. 2007).
Further, the study expands the literature by providing empirical evidence of a
different view of understanding the antecedents of actual quitting behaviour. This
implies that the intention to quit a job by employees is not a rigid process; it is
customized based on each employee’s situation. To date, no study has been
142
conducted which empirically examines the role of employee wellbeing in the
association between leader-member exchange and turnover intention in the context
of Malaysian public sector organizations. Therefore, this study contributes a
different perspective of findings, discussion and understanding on factors that
influence turnover intention in the public sector in Malaysia.
5.5.2 Managerial Implications
The study has several managerial implications in relation to retaining a loyal and
happy workforce. This will help to avoid a perception of imbalance between
contribution and inducements among employees, which is a major influence on
turnover intention (March & Simon 1958). Further, it also helps to avoid the feeling
of inequality which also associated with intention to quit a job among employees
(Dansereau et al. 1973).
This study also points to important contributions for managers so that both
individual as well as collective turnover can be avoided. The actions of
management must start by as soon as possible through communication with
individual who shows dissatisfaction (Holtom et al. 2005). Baptiste (2008) listed
the main actions the managers need to attend in order to improve employee
retention. Firstly, the management must demonstrate trust towards its employees.
There are ways to increase the sense of management’s trust towards employees by
carefully selecting the right person for the right job. Listening to the concerns and
the suggestions of employees on management decisions concerning their area of
responsibility has shown to be a “high commitment” motivator (Pfeffer et al. 2005).
143
Management also need to organize training and development opportunities for the
employees. There is a need to be recognized of the importance of dissatisfaction if
more than one person is expressing lack of satisfaction. (Holtom et al. 2005). The
relationships which employees maintain within an organization need to be taken
into account by managers, because that is how groups are impacted by an
individual’s dissatisfaction (Bartunek et al. 2008).
Furthermore, with the availability of data on employee wellbeing, it shows that
employee seek for tangible and intangible benefit to make them happy working
with the college. For example, having pleasant working conditions can play a
crucial role in the retention of satisfied and loyal employees. For that reason,
organizations should ensure that employees operate in a safe and comfortable
environment with feasible infrastructure and supportive kinship (Currie 2001).
Employees should also be provided with the suitable need such as an appropriate
number of students, ergonomic classrooms and teaching equipments that match
their area of study. This will be highly beneficial to an organization because it will
not only help in retaining its current employees, but also constitute a pull factor for
drawing talented employees from other organizations (McBey & Karakowsky
2001). Loyal and happy employees can also be retained through attractive tenure
systems. Moynihan & Landuyt (2008), argue that organizations should move
towards permanent job tenures that guarantee job security in order to lessen
employee turnover.
As the collection of data on employee turnover intention, this study in some way
highlight an issues emerging from this finding related to the presenteeism norm
144
which occurs in community colleges. As agreed by Cooper & Dewe (2008),
presenteeism norm is the loss of productivity which takes place when academics
perform below par at work due to physical and mentally ill health. The employees
have been said as disengaged with the college however they retain with the college
due to no other option available for them. Based on summaries from previous
studies, it is essential to anticipate the personality of the employee (e.g passion
towards their job and loss of performance) and the workplace pressure that
influences presenteeism (Baker-McClearn, Greasley, Dale & Griffith 2010). This
might help to identify the real performer and the outperformer. Therefore,
whenever organization come across low quality performer, the organization should
open up to let go their current employee as keeping them are unnecessary (Johnson,
Griffeth & Griffin 2000). Rather than considering retaining passive and non-
productive employees which will result in loss of profit and affect the effectiveness
of the organization it is more desirable to terminate the employees.
5.6 Limitations
The implications of this study are tempered by two aspects of limitations founded
on the research method and research design. Based on the research method, since
this study employed purposive sampling technique, the limitation is having a larger
number of female respondents than male respondents. Gender control has been
established as a personal characteristic that may influence a person’s intention to
quit a job (Moynihan & Landuyt 2008). Interestingly, findings by Gornick &
Jacobs (1998), provide evidence that women in the public sector have high job
security and stability. However, gender imbalance in the number of respondents in
145
this study may subject the findings of the study to gender bias, which may in turn
lead to inaccurate deductions.
In addition, the researcher exclusively uses quantitative data though questionnaires
distributed to academicians working at the community colleges only and uses their
responses to analyse research findings to make generalizations. Firstly, this method
not only limits the way of respondent’s expression. Secondly, to carrying out a
study on turnover intention in one institution is a great limitation for the study since
the opinion of academicians at the community colleges may not sufficient to
represent the opinion of other academicians in other learning institutions or even
employees in different organization. The education sector is very wide, especially
given the various levels of education. As a result, it is hard to generalize the results
of the study across the education sector or across all industries.
Furthermore, the limitation pertains to the research design adopted. A multivariate
data analysis of using SEM is perceived mainly static in nature. The imputation of
direct and indirect effect relationships between the constructs may difficult to
decide how adequate the model is to the reality. Although researcher established the
associations between the constructs statistically, the inferring of the estimates in
this study is questionable. In fact, the support of theoretical explanation for the
empirical results does not always seem to be possible in all aspects of SEM
stimulation or analysis that can helps to better understanding (Bagozzi & Yi 1988;
Fan, Thompson & Wang 2009).
146
This study also limits to mediation analysis which only focusing on the causal
effects between the constructs. Through mediation analysis, any particular
contextual factors can be conceptualized. However, it would be better if a fitted
model able to determine the most important factor that contribute to a certain
particular aspect or behaviour to be happened which can be done through
moderation analysis.
5.7 Recommendation
There is abundant room for further progress in determining turnover intention
issues. Future studies on turnover intention should try to gain qualitative data
collection methods, specifically by conducting interviews on employees about their
preferences whether they wanted to stay or actually they have determination to quit
their organizations. An extensive study with qualitative approach will allow a
greater range of responses from participants than is possible in surveys.
In addition, future research should try as much as possible to include a
proportionate number of respondents in terms of gender to avoid subjecting the
results to gender bias. Though it is hard to achieve this, proportionality can be
enhanced by sending questionnaires to an equal number of male and female
respondents.
Furthermore, future research should use sample which is not restricted to a certain
organization as it was in this study (only among academicians in community
colleges) in order to aid in generalization of results. Future researcher should obtain
147
data from respondents in different institutions. A large representation from various
organization of the similar industry (education), may verified to persistency and
consistency of the results. This will help in diversified opinions on turnover
intention, which in turn will make it easier for the researchers to make correct
inferences and generalize their results over a large population.
Despite the focus on goodness-of-fit measures, a large involvement of sample
should not only set for the mediation analysis. This advantage may also contribute
to a moderation analysis in regards to turnover intention study. By implementing a
moderation effect, a particular study will discover the factor that contributes to
main reason for the propensity to leave a job. In this respect, it will not only focus
on cross-sectional design which allow correlational analysis but is also able to
provide causal inferences to be drawn.
5.8 Summary
This study sought to establish the factors that influence the intention of employees
to leave an organization. Structural equation modeling has been chosen as it is
widely employed in the social and behavioural sciences studies (Anderson &
Gerbing 1988). It plays a role as a statistical technique which is comprised of
developing and applying method in discovering the complex interrelations among
variables (Jöreskog 1976). Practically in this study, it allows a simultaneous
intervention of measurement and a structural model for instance in investigating the
interaction among abstract concepts of turnover intention, employee wellbeing and
LMX.
148
The reliability of the construct was achieved and as suggested by Hair et al. (2010)
it was sent to confirmatory factor analysis and the validity of the factorial structures
was confirmed. Mediation analysis in structural model was then chosen due to it
useful role in understanding the mechanism of a practice where it enable to
distinguish element of the practice which led to success or failure (Fairchild &
McQuillin 2010). The results of the mediating model show a well fitted model
developed with the acceptable cut-off criteria achieved as recommended by Al-
Dossary (2008), Bagozzi & Yi (1998), Byrne (2010), Fornell & Larcker (1981) and
Hu & Bentler (1999); x2 = 839.156, df = 241, CMIN = 3.482, p-value = 0.000,
RMSEA = 0.050, GFI = 0.935, AGFI = 0.919, NNFI = 0.945 and CFI = 0.960.
In general, the quality of leader-member exchange has a direct relationship with
turnover intention, while the employee wellbeing has both indirect relationships
with leader-member exchange and turnover intention. The study shows that the
direct impact of LMX on turnover intention is trivial. This contradicts previous
research by Graen & Uhl-Bien (1995) who associated low quality LMX with high
turnover intention and turnover rate. The = 0.65 showing that leader-member
exchange does have significant influence on academics turnover intention and
alternative hypothesis for H1 is accepted. However, practically in the context of a
community college, leader-member exchange does not contribute to academics’
decision to stay or to leave. It can thus be deduced that, for high quality LMX to
significantly influence the intention of employees to leave a firm, nevertheless,
there has to be other supplementary organizational factors that cause employee
determination to quit.
149
Furthermore, the description of major findings in this study showed that factors in
employee wellbeing among academics in community colleges are partially
mediated by the association of leader-member exchange and turnover intention. In
the relation between employee wellbeing and turnover intention, this study support
previous studies by Dollard & Winefield 1996; Kim et al. 2010; Slattery &
Selvarajan 2005 & Stetz et al. 2007). Both indirect effect showing significant path
coefficient = 0.78 and = -0.64. The significant level achieved in the hypotheses
testing showed that H2, H3 and H4 are supported. From the study, it can be
concluded that, the wellbeing of academicians in community colleges is highly
dependent on the relationship that they have with their superiors, which in turn
influences their decision to either continue working for the organization or to quit
their jobs. Therefore, it is advisable for community colleges to ensure that a
positive leader-member relationship exists within the institution in order to retain
the academics with them.
Overall, the findings of this study extend the existing understanding of the factors
that influence turnover intention among employee in organization. Factor of LMX
and employee wellbeing received considerably significant from employees and
organizational perspectives. From the employee’s point of view, having a strong
engagement with the organization at every stage of their employment is important
because it helps to improve their set of skills and boost their marketability. As for
the organizational, maintaining the quality of employee engagement in the
organization is simply worthy since it promotes a good work relationship,
manageable workload and positive work-balance. Through identifying those factors
150
that causes turnover intention, organization has been reasonably initiate necessary
changes to reduce this attribute from happen.
5.9 Conclusion
This study has drawn and outlines the following conclusions:
1. It has examined the effect of LMX and employee wellbeing towards
turnover intention grounded by the theoretical framework in the literature.
2. The study utilized data from 1002 samples of academicians in community
colleges located in Peninsular Malaysia.
3. Mediation analysis with has been employed through SEM approach using
AMOS 20.0. Through mediation analysis, the study shows a well-fitted
model and suggested both direct and in direct effects of involved variables.
4. The study tested the following hypotheses and the results vary considerably.
H1: Leader-member exchange significantly influences employees’
intention to turnover.
The hypothesis is supported with quite a high and significant coefficient
estimates. It shows a positive direction of relationship which means
that high implementation on LMX contributes to high turnover
intention. Though it is in contrast to nature of organizational
behaviour perspective, this however has been support by previous
studies (Harris et al. 2009 & Morrow et al. 2005) in LMX context.
151
H2: Leader-member exchange significantly influences the employee
wellbeing.
The tested hypothesis is supported and shows a strong and significant
coefficient estimates. With positive direction achieved, the result
shows that high implementation on LMX, contributes to high in
employee wellbeing. The finding suggests to support the previous
research by Grean & Uhl-Bien (1995) and Kim et al. (2010).
H3: Employee wellbeing significantly influences the employees' intention on
turnover.
This hypothesis is supported with reasonable and significant coefficient
estimates. It shows a negative direction of the relationships indicates that
in low employee wellbeing the employee intention on turnover is high.
This recent finding is in line with results showed by Dollard &
Winefield (1996), Keyes (1998), Slattery & Selvarajan
(2005) and Stetz et al. (2007).
H4: Employee wellbeing partially mediates the association between leader-
member exchange and turnover intentions.
This hypothesis was tested through path diagram estimation. As
suggested by Fairchild & McQuillin (2010), the estimated path
coefficients in this study indicated a mixed direction of relationships
between two pairs of variables. There is a direct effect between LMX
and turnover intention relationship. Whereas, employee wellbeing
152
gives indirect effect involve in both relationships with LMX and
turnover intention. Consequently, the hypothesis is supported.
5. With the gap identified in this study, this research simply contributes to
expend the body of existing literatures.
153
Reference
Aarons, G.A., Fettes, D.L., Sommerfeld, D.H. & Palinkas, L.A. (2012). Mixed
methods for implementation research application to evidence-based practice
implementation and staff turnover in community-based organizations
providing child welfare services. Child maltreatment, 17(1), 67-79.
Abdul Razak, M. N. (2013). Keynote Address at Invest Malaysia 2013.
Ahearn, K., Ferris, G., Hochwarter, W., Douglas, C. & Ammeter, A. (2004). Leader
political skill and team performance. Journal of Management, 30(2004),
309-327.
Ahmad, R. H. (1998). Educational development and reformation in Malaysia: past,
present and future. Journal of Educational Administration, 36(5), 462-475.
Ahuja, M., Chudoba, K., Kacmar, C., McKnight, D., & George, J. (2007). IT road
warriors: Balancing work-family conflict, job autonomy, and work overload
to mitigate turnover intentions. MIS Quarterly, 31(1), 1-17.
Albattat, A. R. S. & Mat Som, A. P. (2013). Employee dissatisfaction and turnover
crises in the Malaysian hospitality industry. International Journal of
Business an Management, 8(5), 62-71.
Albertsen, K., Rafnsdottir G. L., Grismo, A. Tomasson, K. & Kauppinen K. (2008).
Workhours an worklife balance. SJWEH Suppl, 2008:(5), 14-21.
Al-Dossary, S. (2008). A study of the factors affecting student retention at King
Saud University, Saudi Arabia: Structural equation modelling and
qualitative methods. University of Stirling. Doctor of Philosophy.
Allen, D. G. (2004). Explaininig the turnover intentions and turnover. Innovative
theory and empirical research on employee turnover.
154
Allen, D.G. (2006). Do organizational socialization tactics influence newcomer
embeddedness and turnover? Journal of Management, 32(2), 237-56.
Allison, P.D. (2003). Missing data techniques for structural equation modeling.
Journal of Abnormal Psychology, 112(4), 545.
Alotaibi, M. (2008). Voluntary turnover among nurses working in Kuwaiti
hospitals. Journal of Nursing Management, 16(3), 237-245.
Anderson, J. C., & Gerbing, D. W. (1982). Some methods for respecifying
measurement models to obtain unidimentional construct measurement.
Journal of Marketing Research, 453-460.
Anderson, J.C., & Gerbing, D.W. (1988). Structural equation modeling in practice:
A review and recommended two-step approach. Psychological
Bulletin,103(3), 411-23.
Ang, S. & Slaughter, S. (2004). Turnover of information technology professionals:
the effects of internal labor market strategies', ACM SIGMIS Database,
35(3), 11-27.
Arbuckle, J. (2009). Amos 18 User's Guide. SPSS Incorporated.
Ardichvili, A., Page, V. & Wentling, T. (2003). Motivation and barriers to
participation in virtual knowledge-sharing communities of practice. Journal
of knowledge management, 7(1), 64-77.
Armenakis, A. A., Harris, S. G. & Mossholder, K. W. (1993). Creating readiness
for organizational change. Human Relations, 46(6), 681-705.
Arof, R. & Ismail, N.A.R. (1986). Crisis in the university discipline. Paper
presented at the Seminar on Higher Eucation in Malaysia: A Reevaluation,
Kuala Lumpur.
155
Arthur, D. (2001). The Employee Recruitment And Retention Handbook. New
York: American Management Association.
Ashford, S. J. (1988). Individual strategies for coping with stress during
organizational transitions. The Journal of Applied Behavioral Science,
24(1), 19.
Avolio, B. J. & Sosik J. J. (1999). A life-span framework for assessing the impact
of work on white-collar workers. In Willis, S. L. & Reid, J. D. (Eds.), Life in
the middle: Psychological and social development in middle age. San
Diego, (CA: Academic Press.
Babakus, E., Cravens, D. W., Johnston, M., & Moncrief, W. C. (1996). Examining
the role of organizational variables in the salesperson job satisfaction model.
Journal of Personal Selling and Sales Management, 16, 33-46.
Bagozzi R.P. & Yi Y. (1988). On the Evaluation of Structural Equation Models.
Journal of Academy of Marketing Science, 16(1), 74-94.
Baharim, S.B. (2008). The influence of knowledge sharing on motivation to
transfer training: a Malaysian public sector context. Victoria University
Melbourne, Australia. Doctor of Philosophy.
Baker-McClearn, D., Greasley, K., Dale, J. & Griffith, F. (2010). Absence
management and presenteeism: The pressures on employees to attend work
and the impact of attendance on performance. Human Resource
Management Journal, 20(3), 311-328.
Balfour, D. L., & Neff, D. M. (1993). Predicting and managing turnover in human
service agencies: A case study of an organization in crisis Public Personnel
Management, 22(3), 473.
156
Baptiste, N. (2008). Tightening the link between employee wellbeing at work and
performance: A new dimension for HRM. Management Decision, 46(2),
284-309.
Barnard, C. I. (1938). The functions of the executive (Vol. 11): Cambridge, Mass.:
Harvard University Press.
Baron, R. M. & Kenny, D. A. (1986). The moderator-mediator variable distinction
in social psychological research: Conceptual, strategic and statistical
considerations. Journal of Personality and Social Psychology, 51(6), 1173-
1182.
Bartunek, J. M., Zhi Huang, & Walsh, I. J. (2008). The development of a process
model of collective turnover. Human Relations, 61(1), 5-38.
Barrick, M. R., Mount, M. K. & Strauss J. P. (1994). Antecedents of involuntary
turnover due to a redution in force. Personnel Psychology, 47(3), 515-535.
Bascia, N. & Cumming, A. (2005). International handbook of educational policy
(Vol. 1): Springer.
Bates, R. & Khasawneh, S. (2005). Organizational learning culture, learning
transfer climate and perceived innovation in Jordanian organizations.
International Journal of Training and Development, 9(2), 96-109.
Behnke, A. O., MacDermid, S. M., Anderson, J. C., & Weiss, H. M. (2010). Ethnic
variations in the connection between work-induced family separation and
turnover intent. Journal of Family Issues, 31(5), 626-655.
Bentler, P. M. & Chou, C. (1987). Practical issues in structural modelling.
socialogical methods and research. 6(1), 78-117.
157
Bergiel, E. B., Nguyen, V. Q., Clenney, B. F. & Taylor, G. S. (2009). Human
resource practices, job embeddedness and intention to quit. Management
Research News, 32(3), 205-19.
Bidar, F. (2011). The impact of electronically- Enabled supply chain on channel
relationship and firm performance. Swinburne University of Technology,
Australia. Doctor of Philosophy.
Birdi, K., Warr, P., & Oswald, A. (1995). Age differences in three components of
employee well being. Applied Psychology, 44(4), 345-373.
Blau, G., & Boal, K. (1989). Using job involvement and organizational
commitment interactively to predict turnover. Journal of Management,
15(1), 115-127.
Bluedorn, A. C. (1982). A unified model of turnover from organizations. Human
Relations, 35(2), 135-153.
Bock, G. W., Zmud, R. W., Kim, Y. G. & Lee, J. N. (2005). Behavioral intention
formation in knowledge sharing: Examining the roles of extrinsic
motivators, social-psychological forces, and organizational climate. MIS
Quarterly, 87-111.
Bollen, K. A. (1998). Structural equation models. Wiley Online Library.
Brackett, M. A. & Mayer, J. D. (2003). Convergent, discriminant, and incremental
validity of competing measures of emotional intelligence. Personality and
Social Psychology Bulletin, 29(9), 1147-58.
Branham, L. (2001). 24 ways to hang on to your most valuable talent: Keeping the
people who keep you in business. American Management Association.
Brislin, R. W. (1970). Back-translation for cross-cultural research. Journal of
Cross-cultural Psychology, 3, 185-216.
158
Brislin, R. W. (1986). The wording and translation of research instruments. Sage
Publications Inc.
Brooke, P. P., Russell, D. W., & Price, J. L. (1988). Discriminant validation of
measures of job satisfaction, job involvement, and organizational
commitment. Journal of Applied Psychology,73(2), 139.
Brown, T. A. (2006). Confirmatory factor analysis for applied research. The
Guilford Press.
Budhwar, P. S., Varma, A., Malhotra, N., & Mukherjee, A. (2009). Insights into the
Indian call centre industry: Can internal marketing help tackle high
employee turnover? Journal of Services Marketing, 23(5), 351-362.
Bufe, B., & Murphy, L. (2004). How to keep them once you've got them. Journal
of Accountancy, 198(6), 57-61.
Byrne, B. M. (2010). Structural Equation Modeling with Amos Basic Concepts,
Applications and Programming. Routledge Taylor & Francis Group, New
York, USA.
Caproni, P. J. (1997). Work/life blance: You can't get there from here. Journal of
Applie Behavioral Science, 33(1) 46-56.
Carsten, J. M., & Spector, P. E. (1987). Unemployment, job satisfaction, and
employee turnover: A meta-analytic test of the Muchinsky model. Journal
of Applied Psychology, 72(3), 374-381.
Cascio, W. F. (1976). Turnover, biographical data, and fair employment practice.
Journal of Applied Psychology, 61(5), 576-580.
Cascio, W. F. (2006). The economic impact of employee behaviors on
organizational performance. California Management Review, 48(4), 41-59.
CC Education (2010). Quick Facts Department of Community College Education.
159
Chen, T., Chang, P, & Yeh, C. (2004). A study of career needs, career development
programs, job satisfaction and turnover intentions of R & D personnel,
Career Development International, 9(4), 424-437.
Chen, Z. (2001). Further investigation of the outcomes of loyatly to supervisor: Job
satisfaction and intention to stay. Journal of Managerial Psychology, 16(8),
650-660.
Choong, Y-O., Keh, C-G., Tan, Y-T. & Tan, C-E. (2013). Impacts of demographic
staff in Malaysian private universities. Journal of Basic and Applied
Sciences, 7(6), 46-54.
Chou, C.-L. (2006). The predictors of food preparation staff's leaving intention in
the Taiwan hotel industry. University of South Australia. Doctor of
Philosophy.
Choy, J. W. C. (2009). Leader-member Exchange and Performance: The Mediating
Roles of Delegation, Participation, and Job Satisfaction. Unpublished Full
Conventional Thesis, La Trobe University, Victoria.
Chuebang, P., & Baotham, S. (2011). Voluntary turnover intentions: Effects on
perceived organizatinal support and organizational commitment of Thai
employees in Rajabhat Universities. Review of Business Research, 11(3), 1-
12.
Chun, H., Wong, A. & Tjosvold, D. (2007). Turnover intention and performance in
China: The role of positive affectivity, Chinese values, perceived
organizational support and constructive controversy, Journal of
Occupational & Organizational Psychology, 80(4), 735-51.
Churcill, G. A., Jr. (1979). A Paradigm for Developing Better Measures of
Marketing Constructs. Journal of Marketing Research, 16(1), 64-73.
160
Cohen, A. (1993). Work commitment in relation to withdrawal intentions and
unions effectiveness. Journal of Business Research, 26(1), 75-90.
Cohen, J., Cohen, P., West, S. G. & Aiken L. S. (2003). Applied Multiple
Regression/ Correlation Analysis for the Behavioural Sciences (Third Ed.).
Mahwah: Lawrence Erlbaum Associated Publishers.
Collins, M. D. (2007). Understanding the relationships between leader-member
exchange (LMX), psychological empowerment, job satisfaction, and
turnover intent in a limited-service restaurant environment. The Ohio State
University. Doctor of Philosophy.
Conklin, M. H., & Desselle, S. P. (2007). Job turnover intentions among pharmacy
faculty. American Journal of Pharmaceutical Education, 71 (4).
Cooper, C. & Dewe, P. (2008). Well-being: Absenteeism, presenteeism, costs and
challenges. Society of occupational Medicine, 58, 522-524.
Creswell, J. W. (1994). Research Design. Sage Publications Thousand Oaks, CA
Crossley, C. D., Bennett, R. J., Jex, S. M. & Burnfield, J. L. (2007). Development
of a global measure of job embeddedness and integration into a traditional
model of voluntary turnover. Journal of Applied Psychology, 92(4), 1031.
Cummins, R. A., & Group, T. I. W. (2006). Manual of personal wellbeing index-
adult (PWI-A). Deakin University: The Australian Centre Quality of Life,
Deakin University.
Currie, D. (2001). Managing employee well-being. Chandos Publishing (Oxford)
Limited, Oxford.
Daley, A. J., & Parfitt, G. (1996). Good health--is it worth it? Mood states, physical
well-being, job satisfaction and absenteeism in members and non-members
161
of a British corporate health and fitness club. Journal of Occupational &
Organizational Psychology, 69(2), 121-134.
Dalton, D. R., & Todor, W. D. (1982). Turnover: A lucrative hard dollar
phenomenon. Academy of Management Review, 7(2), 212-218.
Dalton, D. R., Todor, W. D., & Krackhardt, D. M. (1982). Turnover overstated:
The functional taxonomy. Academy of Management Review, 7(1), 117-123.
Dansereau, F. (1975). A vertical dyad linkage approach to leadership within formal
organizations: A longitudinal investigation of the role making process.
Organizational Behavior and Human Performance, 13(1), 46-78.
Dansereau, F., Cashman, J. & Graen, G. (1973). Instrumentality theory and equity
theory as complementary approaches in predicting the relationship of
leadership and turnover among managers. Organizational Behavior and
Human Performance, 10(2), 184-200.
Davies, G., & Stacey, E. (Eds.) (2003). Quality of education at a distance. Kluwer
Academics Publishers, USA.
Davidson, M. C. G., Timo, N. & Ying, W. (2010). How much does labour turnover
cost? International Journal of Contemporary Hospitality Management,
22(4), 451-466.
Deery S. J., Iverson, R. D. & Walsh, J. T. (2006). Toward a better understanding of
psychological contract breach: A study of customer service employees.
Journal of Applied Psychology, 91(1), 166-175.
DeVellis, R. F. (1991). 'Scale development: Theory and applications', Sage
Publications, Newbury, CA.
Diener, E., Kahneman, D., & Schwarz, N. (2003). Well-being: The foundations of
hedonic psychology: Russell Sage Foundation New York.
162
Diener, E., Suh, E., Schaie, K., & Lawton, M. (1997). Subjective well-being and
age: An international analysis. Annual Review of Gerontology and
Geriatrics, 17, 304.
Diener, R. (2003). Personality and Subjective Wellbeing. New York: Russell Sage
Foundation.
Dienesch, R. M., & Liden, R. C. (1986). Leader-member exchange model of
leadership: A critique and further development. Academy of Management
Review, 11(3), 618-634.
Dollard, M. F., & Winefield, A. H. (1996). Managing occupational stress: A
national and international perspective. International Journal of Stress
Management, 3(2), 69-83.
Donoghue, C. (2010). Nursing home staff turnover and retention: An analysis of
national level data. Journal of Applied Gerontology, 29(1), 89-106.
Dougherty, T. W., Bluedorn, A. C. & Keon, T. L. (1985). Precursors of employee
turnover: A multiple-sample causal analysis. Journal of Organizational
Behavior, 6(4), 259-271.
Duraisingam, V., Pidd, K., & Roche, A. M. (2009). The impact of work stress and
job satisfaction on turnover intentions: A study of Australian specialist
alcohol and other drug workers. Drugs: Education, Prevention & Policy,
16(3), 217-231.
Eagleson, C. M. W. a. G., & Waldersee, R. (2000). The sacrificial HR strategy in
call centers. International Journal of Service Industry Management, 11(2),
174-184.
Egan, T. M., Yang, B., & Barlett, K. R. (2004), The effects of organiational
learning culture and job satisfaction on motivation to transfer learning and
163
turnover intention, Human Resource Development Quarterly, 15(3), 279-
301.
Emberland, J. S. & Rundmo, T. (2010). Implications of job insecurity perceptions
and job insecurity responses for psychological well-being, turnover
intentions and reported risk behavior. Safety Science, 48(4), 452-459.
Enders, C. K. & Bandalos, D. L. (2001). The relative performance of full
information maximum likelihood estimation for missing data in structural
equation models, Structural Equation Modeling, 8(3), 430-57.
Estryn-Behar, M., I. J. M. B., Fry, C. & Hasselhorn, H. M. (2010). Longitudinal
analysis of personal and work-related factor associated with turnover among
nurses. Nursing Research, 59(3), 166-177.
Evans, D. R. (1997). Health promotion, wellness programs, quality of life and the
marketing of psychology. Canadian Psychology/Psychologie canadienne,
38(1), 1-12.
Evans, D. R., Thompson, A. B., Browne, G. B., Barr, R. M. & Barton, W. B.
(1993). Factors associated with the psychological well-being of adults with
acute leukemia in remission. Journal Of Clinical Psychology, 49(2), 153-
160.
Fairchild A. J. & McQuillin S. D. (2010). Evaluating mediation and moderation
effects in School Psychology: A presentation of methods and review of
current pratice. Journal of School Psychology, 48, 53-84.
Fan, X., Thompson, B. & Wang, L. (2009). Effects of sample size, estimation
methods and model specification on structural equation modeling fit
indexes. Structural Equation Modeling: A Multidisciplinary Journal,
Routledge.
164
Firth, L., Mellor, D., Moore, K. & Loquet, C. (2004). How can managers reduce
employee intention to quit? Journal of Managerial Psychology, 19(2), 170-
187.
Fornell, C., & Larcker, D. F. (1981). Evaluating structural equation ,models with
unobservable variables and measurement error. Journal of Marketing
Research, 18, 39-50.
French, J., Caplan, R. & Marrow, A. (1972). The failure of success, Amacom New
York.
Fritz M. S., & MacKinnon D. P. (2007). Requaired Sample Size to Detect the
Mediated Effect. Association for Psychological Science, 18(3).
Gaertner, S. (1999). Structural determinants of job satisfaction and organizational
commitment in turnover models. Human Resource Management Review,
9(4), 479-493.
Gaertner, K. N. & Nollen S. D. (1992). Turnover intentions and desire among
executives. Human Relations, 45(5), 447-465.
Gallagher, D., Ting, L. & Palmer, A. (2008). A journey into the unknown; taking
the fear out of structural equation modeling with AMOS for the first-time
user. Marketing Review, 8(3), 255-75.
Geroy, G. D., & Venneberg, D. L. (2003). A view to human capital metrics.
Critical Issues in HRD: An agenda for the twenty-first century, 87-103.
Ghere, G., & York-Barr, J. (2007). Paraprofessional turnover and retention in
inclusive programs: Hidden costs and promising practices. Remedial and
Special Education, 28(1), 21-32.
165
Gornick, J. C. & Jacobs, J. A. (1998). Gender, the welfare state and public
employment: A comparative study of seven industrialized countries.
American Socilogical Review, 63(5), 688-710.
Gould-Williams, J. (2003). The importance of HR practices and workplace trust in
achieving superior performance: A study of public-sector organizations.
International Journal of Human Resource Management, 14(1), 28-54.
Graen, G. & Cashman, J. F. (1975). A role-making model of leadership in formal
organizations: A developmental approach. Leadership frontiers, 143, 165.
Graen, G. B., Liden, R. C. & Hoel, W. (1982). Role of leadership in the employee
withdrawal process. Journal of Applied Psychology, 67(6), 868.
Graen, G. B. & Uhl-Bien, M. (1995). Relationship-based approach to leadership:
Development of leader-member exchange (LMX) theory of leadership over
25 years: Applying a multi-level multi-domain perspective. The Leadership
Quarterly, 6(2), 219-247.
Griffeth, R. W. & Gaertner, S. (2006). A role for equity theory in the turnover
process: An empirical test. Journal of Applied Social Psychology, 31(5),
1017-1037.
Griffeth, R. W., Hom, P. W. & Geartner, S. (2000). A meta-analysis of antecedents
and correlates of employee turnover: Update, moderator tests, and research
implications for millenium. Jounal of Management, 26, 463-488.
Groves, R. M., Fowler Jr, F. J., Couper, M. P., Lepkowski, J. M., Singer, E. &
Tourangeau, R. (2009). Survey Methodology, Wiley.com.
Hagen, R. (2002). Globalization, university transformation and economic
regeneration: A UK case study of public/private sector partnership.
International Journal of Public Sector Management, 15(3), 204-218.
166
Hair, J. F., Black, W. C. & Babin, B. J. (2010). Multivariate Data Analysis: A
Global Perspective, Pearson Education.
Hair, J. F., Bush, R. P., & Ortinau, D. J. (2000). Marketing research: A practical
approach for the millennium, Irwin Professional Publishing.
Hair, J. F., Money, A. H., Samouel, P. & Page, M. (2007). Research methods for
business. Hoboken, N J: Wiley.
Harman, W. S., Blum, M., Stefani, J. & Taho, A. (2009). Albanian turnover: Is the
job embeddedness construct predictive in an Albanian context. Journal of
Behavioral and Applied Management, 10(2), 192-205.
Harris, K. J., Harris, R. B. & Brouer, R. L. (2009). LMX and subordinate political
skill: Direct and interactive effects on turnover intentions and job
satisfaction. Journal of Applied Social Psychology, 39(10), 2373-2395.
Harris, K. J., Kacmar, K. M.& Witt, L. A. (2005). An examination of the
curvilinear relationship between leader–member exchange and intent to
turnover. Journal of Organizational Behavior, 26(4), 363-378.
Harris, K. J., Wheeler, A. R., & Kacmar, K. M. (2009). Leader-member exchange
and empowerment: Direct and interactive effects on job satisfaction,
turnover intentions, and performance. The Leadership Quarterly, 20(3),
371-382.
Harter, J. K., Schmidt, F. L. & Hayes, T. L. (2002). Business-unit level relationship
between employee satisfaction, employee engagement and business
outcomes: A meta-analysis. Journal of Applied Psychology, 87, 268-279.
Harter, J., Schmidt, F., & Keyes, C. (2003). Well-being in the workplace and its
relationship to business outcomes: A review of the Gallup studies.
Flourishing: Positive psychology and the life well-lived, 205-224.
167
Harvie, C. & Lee, B. C. (2002). The role of SMEs in national economies in East
Asia, Edward Elgar Publishing, 2.
Hashim, R. A. & Mahmood, R. (2011). State of job satisfaction among academic
staffs in Malaysian universities. Unitar E-Journal, 7(1), 15-26.
Hatcher, T. (1999). How multiple interventions influenced employee turnover: A
case study. Human Resource Development Quarterly, 10(4), 365-382.
Hayes, L. J., O'Brien-Pallas, L., Duffield, C., Shamian, J., Buchan, J., Hughes, F.
(2006). Nurse turnover: A literature review. International Journal of
Nursing Studies, 43(2), 237-263.
Heilmann, S. G., Holt, D. T., & Rilovick, C. Y. (2008). Effects of career plateauing
on Turnover: A Test of a Model. Journal of Leadership and Organizational
Studies, 15(1), 59-68.
Herrbach, O, Mignonac, K & Gatignon, A-L. (2004). Exploring the role of
perceived external prestige in managers' turnover intentions', International
Journal of Human Resource Management, 15(8), 1390-407.
Herzberg, F., Mausner, B. & Synderman, B. (1959) The motivation to work (2nd ed)
New York: Wiley.
Hewitt Associates, (2009/2010) in Ab Rahman, R. (2012). A study on turnover
intention trend in commercial banks in Penang, Malaysia. University of
Science Malaysia.
Hillmer, S., Hillmer, B., & McRoberts, G. (2004). The real costs of turnover:
Lessons from a call center. Human Resource Planning, 27(3), 34-41.
Hinkin, T. R., & Tracey, J. B. (2000). The cost of turnover: Putting a price on the
learning curve. Cornell Hotel and Restaurant Administration Quarterly,
41(3), 14-21.
168
Hofmann, D. A., Morgeson, F. P., & Gerras, S. J. (2003). Climate as a moderator of
the relationship between leader-member exchange and content specific
citizenship: safety climate as an exemplar. Journal of Applied Psychology,
88(1), 170.
Hollander, E. P. (1992). Leadership, followership, self, and others. The Leadership
Quarterly, 3(1), 43-54.
Holt, D. T., Armenakis, A. A., Field, H. S. & Harris, S. G. (2007). Readiness for
organizational change: The systematic development of a scale. The Journal
of Applied Behavioral Science, 43(2), 232-255.
Holman, D. (2002). Employee wellbeing in call centres. Human Resource
Management Journal, 12(4), 35-50.
Holtom, B. C., & Inderrieden, E. J. (2006). Integrating the unfolding model and job
embeddedness model to better understand voluntary turnover. Journal of
Managerial Issues, 435-52.
Holtom, B. C., Mitchell, T. R., & Lee, T. W. (2006). Increasing human and social
capital by applying job embeddedness theory. Organizational Dynamics
35(4), 316-331.
Holtom, B. C., Mitchell, T. R., Lee, T. W., & Inderrieden, E. J. (2005). Shocks as
causes of turnover: What they are and how organizations can manage them.
Human Resource Management, 44(3), 337-352.
Hom, P. W., & Griffeth, R. W. (Eds.). (1995). Employee turnover: International
Thomson Publishing.
Hom, P., & Griffeth, R. (1991). Structural equations model test of a turnover
theory: Crosssectional and longitudinal analyses. Journal of Applied
Psychology, 76, 350–366.
169
Hong, E. N., Hao, L., Kumar, R., Ramendran, C. & Kadiresan, V. (2012). An
effectiveness of human resource management practices on employee
retention in institution of higher learning: A regression analysis.
International Journal of Business Research & Management, 3(2).
Hoonakker, P., Carayon, P. & Schoepke, J. (2005). Development of a questionnaire
to evaluate turnover and retention in the IT workforce: Art or science.
Centre for Quality and Productivity Improvement, Department of Industrial
and Systems Engineering, University of Wisconsin-Madison, WI, USA, 1-6.
Houkes, I., Janssen, P. P. M., deJonge, J. & Bakker, A. B. (2003). Personality, work
characteristics and employee wellbeing: A longitudinal analysis of additive
and moderating effects. Journal of Occupational Health Psychology 8(1),
20-38.
Howard Berenbaum, C. R., Hyunh-Nhu Le, L. V., Jose Gomez (2003).
Disturbances in Emotion. New York: Russell Sage Foundation.
Hu, L. & Bentler, P. M. (1999). Cutoff criteria for fit indexes in covariance
structural analysis: Conventional criteria versus new alternatives. Structural
Equation Modelling, 6(1), 1-55.
Igbaria, M., & Greenhaus, J. H. (1992). Deterinants of MIS employees. Turnover
Intentions: A Structural Equation Model. Magazine Communications of the
ACM, 35(2), 34-49.
Ingersoll, R.& May, H. (2011). Recruitment, retention and the minority teacher
shortage. Consortium for Policy Research in Education.
Jackofsky, E. F., & Slocum, J. W. Jr. (1987). A causal analysis of the impact of job
performance on the voluntary turnover process. Journal of Occupational
Behavior, 8, 263-270.
170
Jamal, M. (1999). Job stress and employee well-being: a cross-cultural empirical
study. Stress Medicine, 15(3), 153-158.
Jaros, S. J. (1997). An assessment of Meyer and Allen's 1991: Three-Component
Model of Organizational Commitment and Turnover Intentions. Journal of
Vocational Behavior, 51, 319-337.
Jernigan III, I., Beggs, J. M. & Kohut, G. F. (2002). Dimensions of work
satisfaction as predictors of commitment type. Journal of Managerial
Psychology, 17(7), 564-579.
Jiang, B., Baker, R., & Frazier, G. (2009). An analysis of job dissatisfaction and
turnover to reduce global supply chain risk: Evidence from China. Journal
of Operations Management, 27(2), 169-184.
Johnson, K. (1985). Labour turnover in hotels. Service Industries Journal, 5(2),
135-152.
Johnson, K. (1986). Labour Turnover in Hotels. Service Industries Journal, 6(3),
362-380.
Johnson, J. T, Griffeth, R. W. & Griffin, M. (2000). Factors discriminating
functional and dysfunctional salesforce turnover. Journal of Business and
Industrial Marketing, 15(6), 399-415.
Johnston, M. W., & Futrell, C. M. (1989). Functional salesforce turnover: An
empirical investigation into the positive effects of turnover. Journal of
Business Research, 18(2), 141-157.
Jones, C. B., & Gates, M. (2007). The Costs and Benefits of Nurse Turnover: A
Business Case for Nurse Retention. Online Journal of Issues in Nursing,
12(3), 5-5.
171
Jöreskog, K. G. (1976). Structural equation models in the social sciences:
Specification, estimation and testing. Department of Statistics, University of
Uppsala.
Jöreskog, K. G. (1993). Testing structural equation models. Sage Age Focus
Editions, 154, 294.
Jöreskog, K. G., & Sörbom, D. (1982). Recent developments in structural equation
modeling. Journal of marketing research, 404-16.
Judge, T. A. (1993). Does affective disposition moderate the relationship between
job satisfaction and voluntary turnover? Journal of Applied Psychology,
78(3), 395-401.
Judge, T. A. & Shinichiro, W. (2001). Another look at the job satisfaction-life
satisfaction relationship. Journal of Applied Psychology, 78(6), 939-948.
Kendler, K. S., Walters, E.E., Neale, M. C., Kessler, R.C., & Heath, A. C., Eaves,
L. J. (1995). The structure of the genetic and environmental risk factors for
six major psychiatric disorders in women: phobia, generalized anxiety
disorder, panic disorder, bulimia, major depression, and alcoholism.
Archives of General Psychiatry, 52(5), 374.
Keith, T. Z., Fine, J.G., Taub, G. E., Reynolds, M.R., & Kranzler, J. H. (2006).
Higher order, multisample, confirmatory factor analysis of the Wechsler
intelligence scale for children- Fourth Edition: What Does It Measure?',
School Psychology Review, 35(1), 108-27.
Keyes, C. (1998). Social well-being. Social psychology quarterly, 61(2), 121-140.
Khatri, N., Fern, C. T., & Budhwar, P. (2001). Explaining employee turnover in an
Asian context. Human Resource Management Journal, 11(1), 54-74.
172
Kim, B., Lee, G., & Carlson, K. (2010). An examination of the nature of the
relationship between Leader-Member-Exchange (LMX) and turnover intent
at different organizational levels. International Journal of Hospitality
Management, 29(4), 591-597.
Kline, R. B. (2010). Principles and practice of structural equation modeling, The
Guilford Press.
Kotter, J. P. (1995). Leading change. Harvard business review, 73(2), 59-68.
Lam, T., Lo, A., & Chan, J. (2002). New employees' turnover intentions and
organizational commitment in the Hong Kong Hotel Industry. Journal of
Hospitality & Tourism Research, 26(3), 217-234.
Lambert, E., & Hogan, N. (2009). The importance of job satisfaction and
organizational commitment in shaping turnover intent: A test of a causal
model. Criminal Justice Review, 34(1), 96-118.
Lambert, E. G., Hogan, N. L. & Barton, S. M. (2001). The impact of job
satisfaction on turnover intent: a test of a structural measurement model
using a national sample of workers. Social Science Journal, 38(2), 233.
Lanigan, K. (2008). Retaining people practical strategies to reduce staff turnover.
Accountancy Ireland, 40(1), 48-50.
Lawson, K. J., Noblet, A. J., & Rodwell, J. J. (2009). Promoting employee
wellbeing: the relevance of work characteristics and organizational justice.
Health Promotion International, 24(3), 223-233.
Lee, H. R. (2000). An empirical study of organizational justice as a mediator of the
relationships among leader-member exchange and job satisfaction,
organizational commitment, and turnover intentions in the lodging industry.
Virginia Polytechnic Institute and State University.
173
Lee T. W. & Mitchell, T. R. (1994). An alternative approach: The unfolding model
of voluntary employee turnover. The Academy of Management Review,
19(1), 51-89.
Lee, T. W. & Mowday, R. T. (1987). Voluntarily leaving an organization: An
empirical investigation of Steers and Mowday's model of turnover.
Academy of Management Journal, 30(4), 721-743.
Lei P., & Wu, Q. (2007). Introduction to structural equation modeling: Issues and
practical considerations. Instructional topics in educational measurement,
NCE instructional module. Educational Measurement: Issues and Practice
26(3), 33-43.
Lew, T. (2011). Affective organizational commitment and turnover intention of
academics in Malaysia. International Conference on Business and
Economics Research, 1, IACSIT Press.
Liden, R. C. & Maslyn, J. M. (1998). Multidimensionafity of leader-member
exchange: An empirical assessment through scale development. Journal of
Management, 24(1), 43.
Little, R. J. A. (1988a). Missing-data adjustments in large surveys. Journal of
Business & Economic Statistics, 287-96.
Little, R. J. A. (1988b). A test of missing completely at random for multivariate
data with missing values. Journal of the American Statistical Association,
1198-202.
Little, R. J. A. & Rubin, D. B. (1989). The analysis of social science data with
missing values. Sociological Methods & Research, 18(2-3), 292-326.
174
Little T. D, Card N. A, Bovaird J.A. Preacher K.J. & Crandall C.S. (2007).
Structural Equation Modeling of Mediation and Moderation with Contextual
Factors.
Locke, E. A., Latham, G. P., Smith, K. J., Wood, R. E., & Bandura, A. (1990). A
theory of goal setting & task performance. Prentice-Hall Englewood Cliffs,
NJ.
Locke, E. A. (1969). What is job satisfaction? Organizational behavior and human
performance, 4(4), 309-336.
Loius, M. R. (1980). Career transitions: Varieties and commonalities. Academy of
Management Review, 5, 329-340.
Loehlin, J. C. (1992). Latent variable models: An introduction to factor, path and
structural Analysis (Second Ed.). Mahwah: Lawrence Erlbaum Associates.
Luna-Arocas, R & Camps, J. (2008). A model of high performance work practices
and turnover intentions. Personnel Review, 37(1), 26-46.
Macdonald, L. A. C. (2005). Wellness at work: protecting and promoting employee
health and wellbeing. CIPD Publishing.
MacKinnon D. P. & Fairchild A. J. (2009). Current direction in mediation analysis.
Curr Dir Psychol Sci, 18(1), 16-20.
Mack, D. A., Nelson, D. L. & Quick, J. C. (1998). The stress of organisational
change: A dynamic process model. Applied Psychology, 47(2), 219-232.
Maertz, C. P. & Campion, M. A. (2004). Profiles in quitting: Integrating process
and content turnover theory. Academy of Management Journal, 47(4), 566-
582.
175
Maertz, C. P., & Griffeth, R. W. (2004). Eight motivational forces and voluntary
turnover: A theoretical synthesis with implications for research. Journal of
Management, 30(5), 667-683.
Mahbar, S. & Aman, Z. (2010). Malaysia Higher Education Statistics. Ministry Of
Higher Education, Malaysia.
Malhotra, N. K. (1999). Marketing research, an applied orientation. 3rd Edition,
Englewood Cliffs, NJ Prentice-Hall.
Mangan, J., Lalwani, C. & Gardner, B. (2004). Combining quantitative and
qualitative methodologies in logistics research. International Journal of
Physical Distribution & Logistics Management, 34(7), 565-578.
Mano-Negrin, R., & Kirschenbaum, A. (1999). Push and pull factors in medical
employees' turnover decisions: The effect of a careerist approach and
organizational benefits on the decision to leave the job. International
Journal of Human Resource Management, 10(4), 689-702.
March, & Simon. (1958). Organization. United States of America: John Wiley &
Sons, Inc.
Mardanov, I. T., Heischmidt, K., & Henson, A. (2008). Leader-Member exchange
and job satisfaction bond and predicted employee turnover. Journal of
Leadership and Organizational Studies, 15(2), 159-175.
Martin, A. J. (2001). Employee adjustment during organizational change: The role
of climate, organizational level and occupation. Doctor of Philosophy.
Martin, T. N. (1979). A contextual moel of employee turnover intentions. Academy
of Management Journal, 1979(22), 313-324.
Maslach, C. (1998). A multidimensional theory of burnout. Theories of
organizational stress, 68–85.
176
McBey, K., & Karakowsky, L. (2001). Examining sources of influence on
employee turnover in the part-time work context. Career Development
International, 6(1), 39-48.
McBride, S. A., & Munday, R. G. (1992). Community college faculty job
satisfaction and propensity to leave. Community Junior College Research
Quartely of Research and Practice, 16, 157-165.
McCarthy, G., Almeida, S., & Ahrens, J. (2011). Understanding employee
wellbeing practices in Australian organizations. International Journal of
Health & Wellness, 1(1), 181-197.
McEvoy, G. M., & Cascio, W. F. (1987). Do good or poor performers leave? A
meta-anaylysis of the relationship between performance and turnover.
Academy of Management Journal, 30(4), 744-762.
Miller, H. E., Katerberg, R., & Hulin, C. L. (1979). Evaluation of the Mobley,
Horner, and Hollingsworth model of employee turnover. Journal of Applied
Psychology, 64(5), 509-517.
Mishra, K., Bhatnagar, S., & Deepti (2010). Linking emotional dissonance and
organizational identification to turnover intention and emotional well-being:
A study of medical representatives in India. Human Resource Management,
49(3), 401-419.
Mitchell, T. & Lee, T. W. (2001). The unfolding moel of voluntary turnover and
job embededness: Foundations for a comprehensive theory of attachment.
Organizational Behavior, 23, 189-246.
Mitchell, T., Holtom, B., Lee, T., & Graske, T. (2001). How to keep your best
employees: Developing an effective retention policy and executive
177
Commentary. The Academy of Management Executive (1993-2005), 15(4),
96-109.
Mitchell, T. R., Holtom, B. C., Lee, T. W., Sablynski, C. J. & Erez, M. (2001).
Why people stay: Using job embeddedness to predict voluntary turnover.
Academy of Management Journal, 44(6), 1102-1121.
Mobley, W. H. (1977). Intermediate linkages in the relationship between job
satisfaction and employee turnover. Journal of Applied Psychology, 62(2),
237-240.
Mobley, W. H. (Ed.). (1982). Employee Turnover:Causes, Consequences, and
Control. Canada: Addison-Wesley Publishing Company.
Mobley, W. H., Griffeth, R. W., Hand, H. H., & Meglino, B. M. (1979). Review
and conceptual analysis of the employee turnover process. Psychological
bulletin, 86(3), 493.
Mobley, W. H., Horner, S. O. & Hollingsworth, A. T. (1978). An Evaluation of
precursors of Hospital Employee Turnover, Journal of Applied Psychology,
63(4), 408.
Mohd Noor, K. (2011). Work-life balance and intention to leave among academics
in Malaysian public higher education intstitutions. International Journal of
Business & Social Science, 2(1).
MOHE, M. O. H. E. (2010). Leading knowledge excellence: Statistics of higher
education Malaysia. Ministry of Hihger Education Malaysia.
Morgan, D. L. (1998). Practical strategies for combining qualitative and
quantitative methods: Applications to health research. Qualitative Health
Research, 8(3), 362-376.
178
Morris, D., Yaacob, A. & Wood, G. (2001). Securing diversity in human resources:
lessons from Malaysia. Asia Pacific Business Review, 8(1), 63-79.
Morris, D., Yaacob, A. & Wood, G. (2003). Attitudes towards pay and promotion
in the Malaysian higher educational sector. Employee Relation, 26(2), 137-
150.
Morrow, P., Suzuki, Y., Crum, M., Ruben, R. & Pautsch, G. (2005). The role of
leader-member exchange in high turnover work environments. Journal of
Managerial Psychology, 20(8), 681-694.
Mossholder, K. W., Settoon, R. P. & Henagan, S. C. (2005). A relational
perspective on turnover: Examining structural, attitudal and behavioral
Predictors. Academy of Management Journal, 48(4), 607-618.
Moynihan, D. P., & Landuyt, N. (2008). Explaining Turnover Intention in State
Government: Examining the Roles of Gender, Life Cycle, and Loyalty.
Review of Public Personnel Administration, 28(2), 120-143.
Muchinsky, P. M., & Morrow, P. C. (1980). A multidisciplinary model of voluntary
employee turnover. Journal of Vocational Behavior, 17(3), 263-290.
Muijs, D. (2011). Doing quantitative research in education with SPSS, Sage
Publications Ltd.
NAHERI, N. H. E. R. I. (2004). Enhancing Quality of Faculty in Private Higher
Education Institutions. Penang, Malaysia: USM, Penang.
Nancy, C., Catherine A. S. (2003). Life Task Participation and Wellbeing: The
Importance of TRaking Part in Daily Life. New York: Russell Sage
Foundation.
179
Near, J. P., Smith, C. A., Rice, R. W. & Hunt, R. G. (1983). Job satisfaction and
nonwork satisfaction as components of life satisfaction. Journal of Applied
Social Psychology, 13, 126-144.
Nicolle, L. (2004). Don't let your staff disappear. Computer Weekly, 40-41.
Niederman, F., Sumner, M. & Maertz Jr, C. P. (2007). Testing and extending the
unfolding model of voluntary turnover to IT professionals. Human Resource
Management, 46(3), 331-347.
Nolen-Hoeksema, S. (2001). Gender differences in depression. Current Directions
in Psychological Science, 10(5), 173.
Nolen-Hoeksema, S., Rusting, C. L. (2003). Gender Differences in Wellbeing:
Russell Sage Foundation.
Nordin, K. (2010). New year address. Enculturing quality, innovation and
Collegiality. National Printing Private Limited (PNMB).
O'Driscoll, M. P. & Cooper, C. L. (1994). Coping with work-related stress: A
critique of existing measures and proposal for an alternative methodology.
Journal of Occupational and Organizational Psychology.
Pallant, J. (2010). SPSS survival manual: A step by step guide to data analysis
using SPSS , McGraw-Hill International.
Parasuraman, S. (1982). Predicting turnover intentions and turnover behavior: A
multivariate analysis. Journal of Vocational Behavior, 21(1), 111-121.
Parasuraman, A., Berry, L.L. & Zeithaml, V.A. (1993). More on improving service
quality measurement. Journal of Retailing, 69(1), 140-7.
Pallant, J. (2010). SPSS Survival Manual: A Step by Step Guide to Dataa Analysis
Using SPSS. McGraw-Hill International.
180
Panatik, S. A., Rajab, A., Shaari, R., Mad Shah I., Abdul Rahman, H., Zainal Badri
S. K. (2012). Impact of work-related stress on wellbeing among
academician in Malaysia research university. International Conference on
Education and Management Innovation, 30, IACSIT Press.
Park, N., Peterson, C. & Selingman, M. E. P. (2004). Strengths of character and
wellbeing. Journal of Social and Clinical Psychology, 23, 603-619.
Pettigrew, A. & Whipp R. (1991). Managing change for competitive success.
Oxford: Basil Blackwell.
Pfeffer, J., Hatano, T., & Santalainen, T. (2005). Producing sustainable competitive
advantage through the effective management of people and executive
commentary. The Academy of Management Executive (1993-2005), 95-108.
Pheko, M. M. (2013). The impact of resource loss and resource gain among
Botswana employees: A test of the conservation of resources theory.
International Journal of Business and Social Science, 4(4).
Ping, R. A., (2004). On assuring valid measures for theoretical models using survey
data. Journal of Business Research, 57(2), 125-141.
Piotrkowski, C. S. (1978). Work and the family system. New York: Free.
Price, J. L. (2000). Reflections on the determinants of voluntary turnover.
International Journal of Manpower, 22(7), 600-624.
Price, J. L., & Mueller, C. W. (1981). A causal model of turnover for nurses.
Academy of Management Journal, 543-565.
Pritchard, R. D. (1969). Equity theory: A review and critique. Organizational
Behavior and Human Performance, 4(2), 176-211.
181
Rad, A. M. M. & Yarmohammadian, M. H. (2006). A study of relationship between
managers' leadership style and employees' job satisfaction. Leadership in
Health Services, 19(2), 11-28.
Reed, D. (2003). The people powerhouse. Precision Marketing, 15(24), 19.
Renwick, D. (2009). The origins of employee wellbeing in Brazil: an exploratory
analysis. Employee Relations, 31(3), 312-321.
Robb, D. (2002). Reducing Call Center Turnover. Customer Interface, 15(3), 34.
Rogers, J. D., Clow, K. E., & Kash, T. J. (1994). Increasing job satisfaction of
service personnel. Journal of Services Marketing, 8(1), 14-26.
Robbins, B. & Davidhizar, R. (2007). Transformational leadership in healthcare
today. The Health Care Manager, 26(30, 234-239.
Robertson, N. (2007). Self-service technologies and consumer complaining
behaviour: An empirical investigation. Deakin University. Doctor of
Philosophy.
Roseman, E. (Ed.). (1981). Managing Employee Turnover (First ed.): American
Management Associations, New York.
Ross, A. L. (1984). A study of child care staff turnover. Child care quarterly, 13(3),
209-24.
Rosser, V. J. (2004). Faculty members' intentions to leave: A national study on their
worklife and satisfaction. Research in Higher Education, 45(3), 285-309.
Rousseau D. M. & Tijoriwala S. A. (1998). Assessing psychological constracts:
Issues, alternatives an measures. Journal of Organizational Behavior, 19,
679-695.
Saks, A. M. (2006). Antecedents and consequences of employee engagement.
Journal of Managerial Psychology, 21(7) 600-619.
182
Saleh, M. A. (2006). Antecedents of commitment to an import supplier. Queensland
University of Technology. Doctor of Philosophy.
Sekaran, U. & Bougie, R. (2010). Research method for business: A skill building
approach. Wiley London.
Selingman E. P. M. (Ed.). (2002). Authentic Happiness; Using the New Psychology
to Realize Your Potential for Lasting Fulfillment: FP Free Press.
Schabracq, M. J. & Cooper, C. L. (1998). Toward a phenomenological framework
for the study of work and organizational stress. Human Relations, 51(5),
625-648.
Schaefer, K. (2002). Strategies for minimizing the effects of manager turnover on
the Randolph-Sheppard business enterprise program. Review, 34(2), 87-95.
Schafer, J. L. & Graham, J. W. (2002). Missing data: Our view of the state of the
art. American Psychological Association, 7(2), 147-177.
Schalk, R., & Van Rijckevorsel, A. (2007). Factors influencing absenteeism and
intention to leave in a call centre. New Technology, Work & Employment,
22(3), 260-274.
Schumacker, R & Lomax, R. (1996). A beginner's guide to structural equation
modeling. Mahwah, New Jersey: Lawrence Erlbaum Associates, 288, 144.
Schyns, B., Torka, N. & Gössling, T. (2007). Turnover intention and preparedness
for change: Exploring leader-member exchange and occupational self-
efficacy as antecedents of two employability predictors. Career
Development International, 12(7), 660-679.
Scott, D., Bishop, J. & Chen, X. (2003). An examination of the relationship of
employee involvement with job satisfaction, employee cooperation, and
183
intention to quit in US invested enterprise in China. International Journal of
Organizational Analysis, 11(1), 3-20.
Shalley, C. E., Gilson, L. L. & Blum, T. C. (2000). Matching creativity
requirement and the the work environment: Effects on satisfaction and
intentions to leave. Academy of Management Journal, 43(2), 215-223.
Shalley, E. S. & Perry-Smith, J. E. (2001). Effects of social-psychological factors
on cretive-performance: The role of informational and controlling expected
evaluation and modeling experience. Organizational Behavior an Human
Decision Process, 84(1), 1-22.
Shaw, J. D., Delery, J. E., Jenskins, G. D. & Gupta, N. (1998). An organization-
level analysis of voluntry and involuntry turnover. Academy of Management
Journal, 41(5), 511-525.
Shelly, C. E. & Perry-Smith J. E. (2001). Effet of social-psychological factors on
creative performance: The role of information and controlling expected
evaluation and modeling experience. Organizational Behaviour and Human
Decision Processes, 84(1), 1-22.
Shen, J., Cox, A. & McBride, A. (2004). Factors influencing turnover and retention
of midwives and consultants: a literature review. Health Services
Management Research, 17(4), 249-262.
Siong, Z. M. B., Mellor, D., Moore, K. A. & Firth, L. (2006). Predicting intention
to quit in the call centre industry: does the retail model fit? Journal of
Managerial Psychology, 21(3), 231-243.
Sirgy, M. (2006). Developing a conceptual framework of employee well-being
(EWB) by applying goal concepts and findings from personality-social
psychology. Applied Research in Quality of Life, 1(1), 7-38.
184
Slattery, J. P. & Rajan Selvarajan, T. T. (2005). Antecedents to temporary
employee's turnover intention. Journal of Leadership & Organizational
Studies, 12(1), 53-66.
Smith, M. L., Jr. (2003). Reciprocity and social exchange relationships in
organizations: Examining why and how individuals contribute to
organizational social capital. ProQuest Information & Learning, US.
Smith, P. C., Kenall, L. M. & Hulin, C. L. (1969). The measurement of satisfaction
in work and retirement: A strategy for the study of attitude. Chicago: Ran
McNally.
Smith, P. C., Smith, O. W. & Rollo J. (1974). Factor structure for black an white of
the job descriptive inex an its discrimination of job satisfaction. Journal of
Applie Psychology, 59(1), 99-100.
Sousa-Poza, A. & Henneberger, F. (2002). An empirical analysis of working-hours
constraints in twenty-one countries. Review of Social Economy, LX(2), 209-
242.
Sonnenfeld, J. A. & Peiperl, M. A. (1988). Staffing policy as a strategic response:
A typology of career systems. Academy of Management Review, 588-600.
Spector, P. E. (1997). Job satisfaction: Application, assessment, causes &
consequences. Advance topics in organizational behavior (ATOB).
St Amour, D. (2001). Successful organizational change: Effective management of
people and cultural issues. Canadian Manager, 20–22.
Staw, B. (1980). The consequences of turnover. Journal of Occupational
Behaviour, 1(4), 253-273.
185
Steed, E. D. & Shinnar, R. S. (2004). Making employee turnover calculations
useful. Journal of Human Resources in Hospitality & Tourism, 2(1), 77 -
89.
Stetz, M. C., Castro, C. A., & Bliese, P. D. (2007). The impact of deactivation
uncertainty, workload, and organizational constraints on reservists
psychological well-being and turnover intentions. Millitary Medicine
172(6), 576-580.
Straub, D., Boudreau, M-C & Gefen, D. (2004). Validation guidelines for IS
positivist research. Communications of the Association for Information
Systems, 13(24), 380-427.
Sun, T., Zhao, X. W., Yang, L. B. & Fan, L. H. (2011). The impact of
psychological cpital on job embeddedness and job performance among
nurses: a structural equation aproach. Journal of Advance Nursing, 68(1),
69-79.
Sveiby, K. E. (1997). The new organizational wealth. Berrett-Koehler Publishers.
Tabachnick, B., & Fidell, L., (2007). Using multivariate statistics. Boston: Pearson
Education, Inc.
Tait, M., Padgett, M. Y., & Baldwin, T. T. (1989). Job and life satisfaction: A
reevaluation of the strength of the relationship and gender effects as a
function of the date of the study. Journal of Applied Psychology, 74(3), 502.
Takase, M. (2010). A concept analysis of turnover intention: Implications for
nursing management. Collegian: Journal of the Royal College of Nursing
Australia, 17(1), 3-12.
186
Tanaka J.S. (1987). How big is big enough?: Sample size and goodness of fit in
structural equation models with latent variables. Society for Research in
Child Development, 58(1), 134-146.
Terry, D. D. J., Callan, V. J. & Sartori, G. (1996). Employee adjustment to an
organizational merger: Stress, coping and intergroup differences. Stress
Medicine, 12(2), 105-122.
Tongco, M. D. C. (2007). Purposive sampling as a tool for informant selection.
Ethnobotany Research & Applications, 5, 147-158.
Toker, B. (2011). Job satisfaction of academic staff: An empirical study on Turkey.
Quality Assurance in Education, 19(2), 156-169.
Tracey, J. B. & Hinkin, T. R. (2008). Contextual factors and cost profiles associated
with employee turnover. Cornell Hospitality Quarterly, 49(1), 12-27.
Trounson, A. (2010). Fixed contract discourage academics. The Australians
Ullman J. B., & Bentler, P. M. (2013). Structural Equation Modeling: Chapter 23,
Handbook of Psychology, Second Edition, John Wiley & sons, Inc.
Van Dick, R., Christ, O., Stellmacher, J., Wagner, U., Ahlswede, O., Grubba, C.,
Hauptmeier, M., Hoehfeld, C., Moltzen, K., & Tissington, P. (2004). Should
I stay or should I go? Explaining turnover intentions with organizational
identification and job satisfaction. British Journal of Management, 15(4),
351-360.
Vickers, M. (2006). Towards employee wellness: Rethinking bullying paradoxes
and masks. Employee Responsibilities and Rights Journal, 18(4), 267-281.
Wang, H., Law, K. S., Hackett, R. D., Wang, D. & Chen, Z. X. (2005). Leader-
member exchange as a mediator of the relationship between
187
transformational leadership and followers' performance and organizational
citizenship behavior. Academy of Management Journal, 48(3), 420-32.
Walker, M. E. (2009). Relationship of spirituality, subjective well-being, and
psychological well-being in a population of African-American college
students. Unpublished Doctoral Dissertation.
Warr, P. (1987). Psychology at Work. England: Penguin Books.
Warr, P. (1990). The measurement of well-being and other aspects of mental health.
Journal of Occupational Psychology, 63(3), 193-210.
Warr, P. (Ed.). (2002). Psychology at Work. England: Penguin Book.
Warr, P. & Bryan. (1987). Work, unemployment, and mental health: Clarendon
Press Oxford.
Warr, P. Butcher, V. & Robertson, I. (2004). Activity and psychological well-being
in older people. Aging & Mental Health, 8(2), 172-183.
Warr, P., in Kahneman, Diener, & Schwarz (Eds.). (2003). Wellbeing and the
Workplace. New York: Russell Sage Foundation.
Wasmuth, W. J. & Davis, S. W. (1983). Managing employee turnover. Cornell
Hospitality Quarterly, 23(4), 15-22.
Whitt, W. (2006). The impact of increased employee retention on performance in a
customer contact center. Manufacturing & Service Operations
Management, 8(3), 235-252.
Winterton, J. (2004). A conceptual model of labour turnover and retention. Human
Resource Development International, 7(3), 371-390.
Wong S.K., E. (2009). Case study of factors influencing jobs satisfaction in two
Malaysian universities. International Journal of Business Research, 2(2).
188
Woods, C. (2010). Employee wellbeing in the higher education workplace: a role
for emotion scholarship. Higher Education, 1-15.
Wright, T. A. (2009). Much more than meets the eye: The role of psychological
well-being in job performance, employee retention and cardiovascular
health. Organizational Dynamics, 39(1), 13-23.
Wright, T. A., & Bonett, D. G. (2007). Job satisfaction and psychological well-
being as nonadditive predictors of workplace turnover. Journal of
Management, 33(2), 141.
Yaghi, A. & Alibeli, M. (2013). The impact of selected economic and social factors
on women employement in the public sector in eighteen countries. Modern
Management Science & Engineering, 1(2), 156-160.
Yukl, G. A. (1994). Leadership in organization: Prentice International.
Yung, Y-K. & Chan, W. (1999). Statistical analysis using bootstrapping: Concepts
and implementation. Statistical Strategies for Small Sample Research, 88-
105.
Zelditch Jr, M. (1962). Some methodological problems of field studies. American
Journal of Sociology, 566-76.
Zhang, Y. & Feng, X. (2011). The relationship between job satisfaction, burnout,
and turnover intention among physicians from urban state-owned medical
institutions in Hubei, China: A cross-sectional study. BMC health services
research, 11(1), 235.
189
APPENDIX A:
ETHICS APPROVAL

190
8 August 2011 Dear Kalsom,
Thank you for submitting the above project for consideration by the Faculty Human Ethics Advisory Group (HEAG). The HEAG recognised that the project complies with the National Statement on Ethical Conduct in Research Involving Humans (2007) and has approved it. You may commence the project upon receipt of this communication. The approval period is for three years. It is your responsibility to contact the Faculty HEAG immediately should any of the following occur:
• Serious or unexpected adverse effects on the participants • Any proposed changes in the protocol, including extensions of time • Any changes to the research team or changes to contact details • Any events which might affect the continuing ethical acceptability of the project • The project is discontinued before the expected date of completion.
You will be required to submit an annual report giving details of the progress of your research. Failure to do so may result in the termination of the project. Once the project is completed, you will be required to submit a final report informing the HEAG of its completion. Please ensure that the Deakin logo is on the Plain Language Statement and Consent Forms. You should also ensure that the project ID is inserted in the complaints clause on the Plain Language Statement, and be reminded that the project number must always be quoted in any communication with the HEAG to avoid delays. All communication should be directed to [email protected] The Faculty HEAG and/or Deakin University Human Research Ethics Committee (HREC) may need to audit this project as part of the requirements for monitoring set out in the National Statement on Ethical Conduct in Research Involving Humans (2007). If you have any queries in the future, please do not hesitate to contact me. We wish you well with your research. Kind regards, Katrina Fleming HEAG Secretariat Faculty of Business and Law

191
APPENDIX B:
QUESTIONNAIRE
(ENGLISH AND BAHASA MALAYSIA
VERSION)
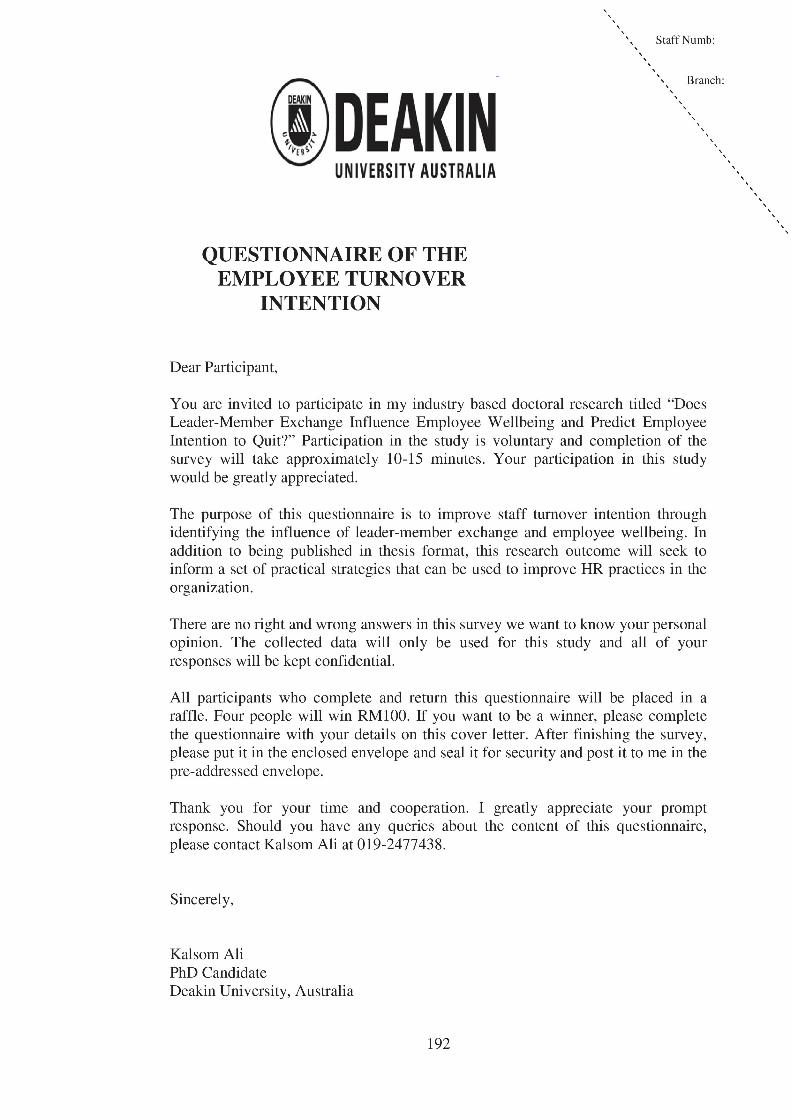
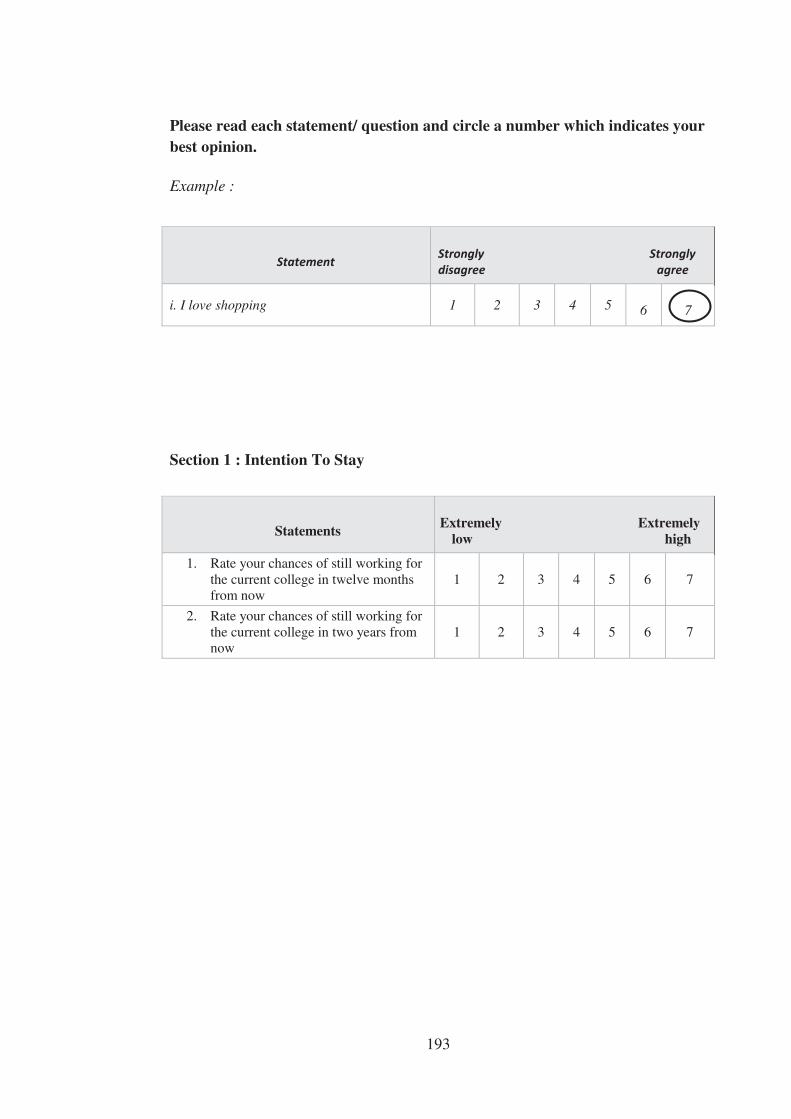
193
Please read each statement/ question and circle a number which indicates your best opinion. Example :
Section 1 : Intention To Stay
i. I love shopping 1 2 3 4 5
6
7
Statements Extremely Extremely
low high
1. Rate your chances of still working for the current college in twelve months from now
1 2 3 4 5
6
7
2. Rate your chances of still working for the current college in two years from now
1 2 3 4 5
6
7
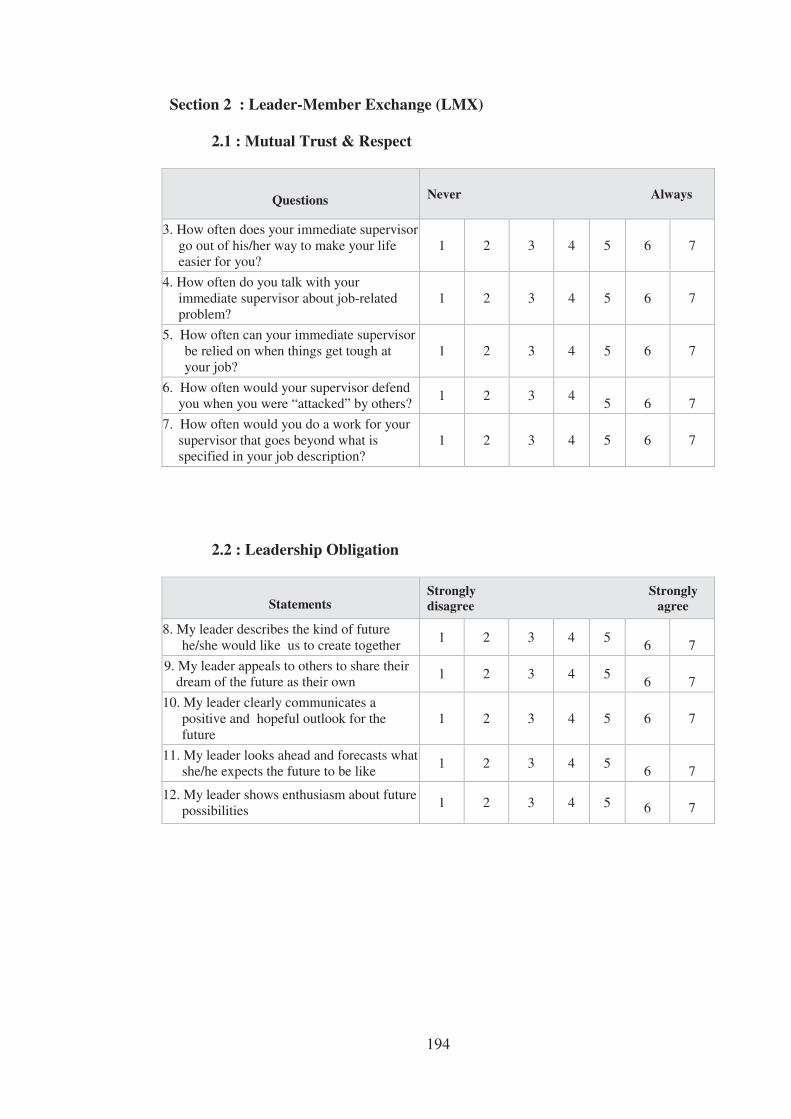
194
Section 2 : Leader-Member Exchange (LMX) 2.1 : Mutual Trust & Respect
Questions
Never Always
3. How often does your immediate supervisor go out of his/her way to make your life easier for you?
1 2 3 4
5
6
7
4. How often do you talk with your immediate supervisor about job-related problem?
1 2 3 4
5
6
7
5. How often can your immediate supervisor be relied on when things get tough at your job?
1 2 3 4
5
6
7
6. How often would your supervisor defend you when you were “attacked” by others?
1 2 3 4
5
6
7
7. How often would you do a work for your supervisor that goes beyond what is specified in your job description?
1 2 3 4
5
6
7
2.2 : Leadership Obligation
Statements Strongly Strongly disagree agree
8. My leader describes the kind of future he/she would like us to create together
1 2 3 4 5
6
7
9. My leader appeals to others to share their dream of the future as their own
1 2 3 4 5
6
7
10. My leader clearly communicates a positive and hopeful outlook for the future
1 2 3 4 5
6
7
11. My leader looks ahead and forecasts what she/he expects the future to be like
1 2 3 4 5
6
7
12. My leader shows enthusiasm about future possibilities
1 2 3 4 5
6
7
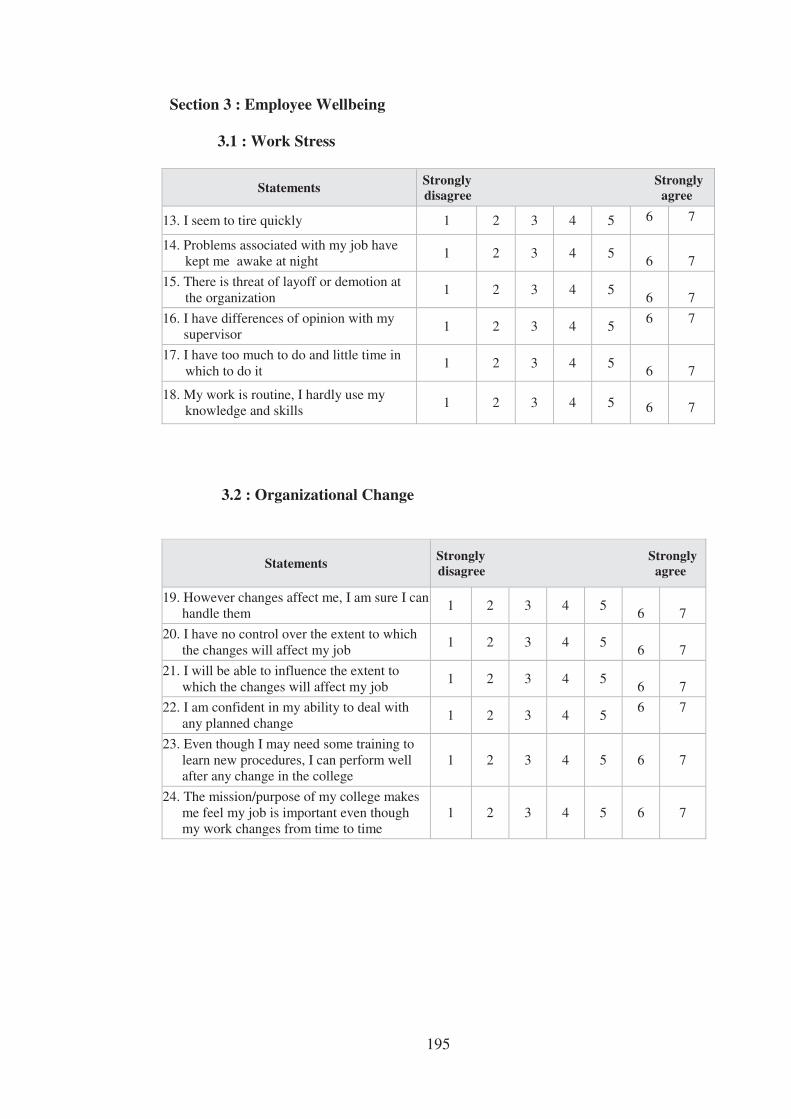
195
Section 3 : Employee Wellbeing
3.1 : Work Stress
Statements Strongly Strongly disagree agree
13. I seem to tire quickly 1 2 3 4 5 6 7
14. Problems associated with my job have kept me awake at night
1 2 3 4 5
6
7
15. There is threat of layoff or demotion at the organization
1 2 3 4 5
6
7
16. I have differences of opinion with my supervisor
1 2 3 4 5 6 7
17. I have too much to do and little time in which to do it
1 2 3 4 5
6
7
18. My work is routine, I hardly use my knowledge and skills
1 2 3 4 5
6
7
3.2 : Organizational Change
Statements Strongly Strongly disagree agree
19. However changes affect me, I am sure I can handle them
1 2 3 4 5
6
7
20. I have no control over the extent to which the changes will affect my job
1 2 3 4 5
6
7
21. I will be able to influence the extent to which the changes will affect my job
1 2 3 4 5
6
7
22. I am confident in my ability to deal with any planned change
1 2 3 4 5 6
7
23. Even though I may need some training to learn new procedures, I can perform well after any change in the college
1 2 3 4 5
6
7
24. The mission/purpose of my college makes me feel my job is important even though my work changes from time to time
1 2 3 4 5
6
7
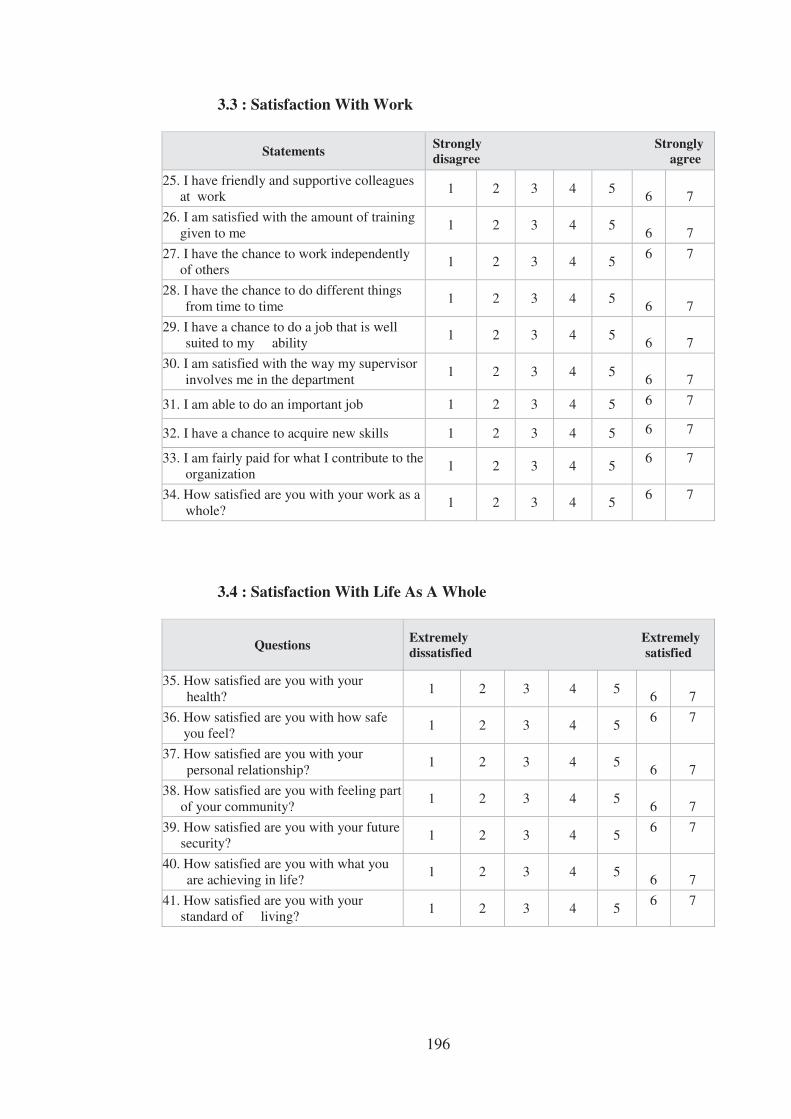
196
3.3 : Satisfaction With Work
Statements Strongly Strongly disagree agree
25. I have friendly and supportive colleagues at work
1 2 3 4 5
6
7
26. I am satisfied with the amount of training given to me
1 2 3 4 5
6
7
27. I have the chance to work independently of others
1 2 3 4 5 6 7
28. I have the chance to do different things from time to time
1 2 3 4 5
6
7
29. I have a chance to do a job that is well suited to my ability
1 2 3 4 5
6
7
30. I am satisfied with the way my supervisor involves me in the department
1 2 3 4 5
6
7
31. I am able to do an important job 1 2 3 4 5 6 7
32. I have a chance to acquire new skills 1 2 3 4 5 6 7
33. I am fairly paid for what I contribute to the organization
1 2 3 4 5 6 7
34. How satisfied are you with your work as a whole?
1 2 3 4 5 6 7
3.4 : Satisfaction With Life As A Whole
Questions Extremely Extremely dissatisfied satisfied
35. How satisfied are you with your health?
1 2 3 4 5
6
7
36. How satisfied are you with how safe you feel?
1 2 3 4 5 6
7
37. How satisfied are you with your personal relationship?
1 2 3 4 5
6
7
38. How satisfied are you with feeling part of your community?
1 2 3 4 5
6
7
39. How satisfied are you with your future security?
1 2 3 4 5 6 7
40. How satisfied are you with what you are achieving in life?
1 2 3 4 5
6
7
41. How satisfied are you with your standard of living?
1 2 3 4 5 6 7
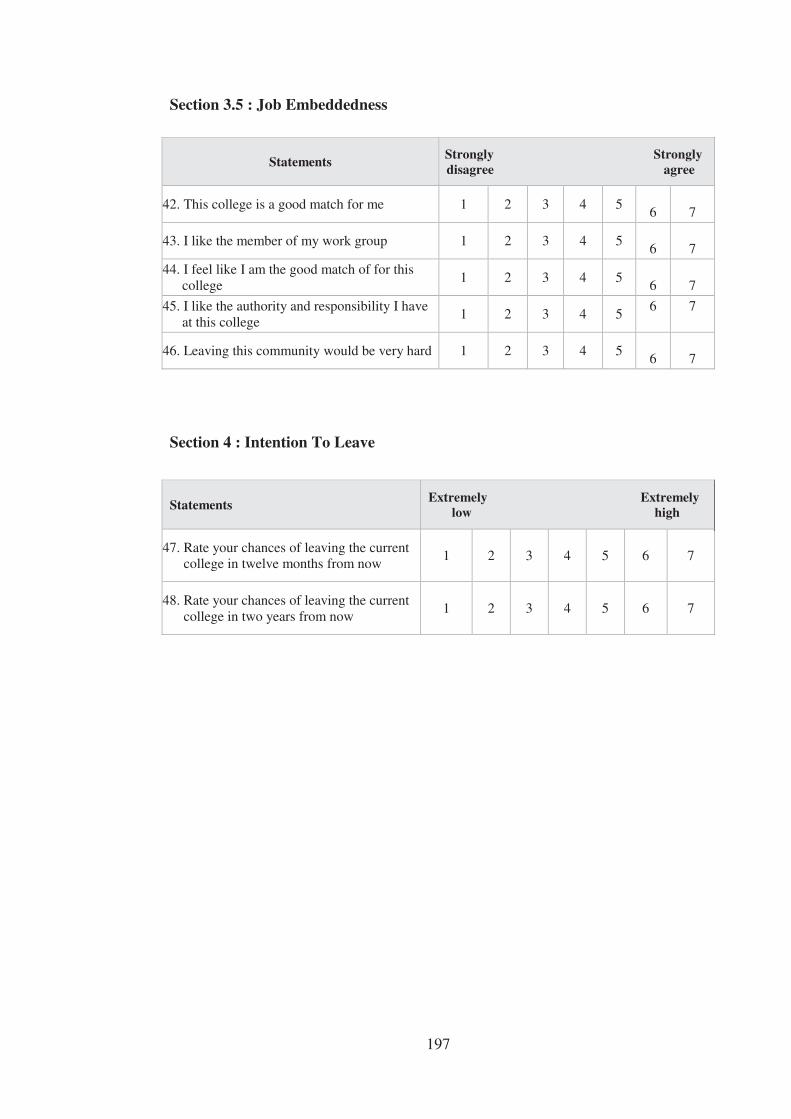
197
Section 3.5 : Job Embeddedness
Statements Strongly Strongly disagree agree
42. This college is a good match for me 1 2 3 4 5
6
7
43. I like the member of my work group 1 2 3 4 5
6
7
44. I feel like I am the good match of for this college
1 2 3 4 5
6
7
45. I like the authority and responsibility I have at this college
1 2 3 4 5 6
7
46. Leaving this community would be very hard 1 2 3 4 5
6
7
Section 4 : Intention To Leave
Statements Extremely Extremely low high
47. Rate your chances of leaving the current college in twelve months from now
1 2 3 4 5
6
7
48. Rate your chances of leaving the current college in two years from now
1 2 3 4 5
6
7
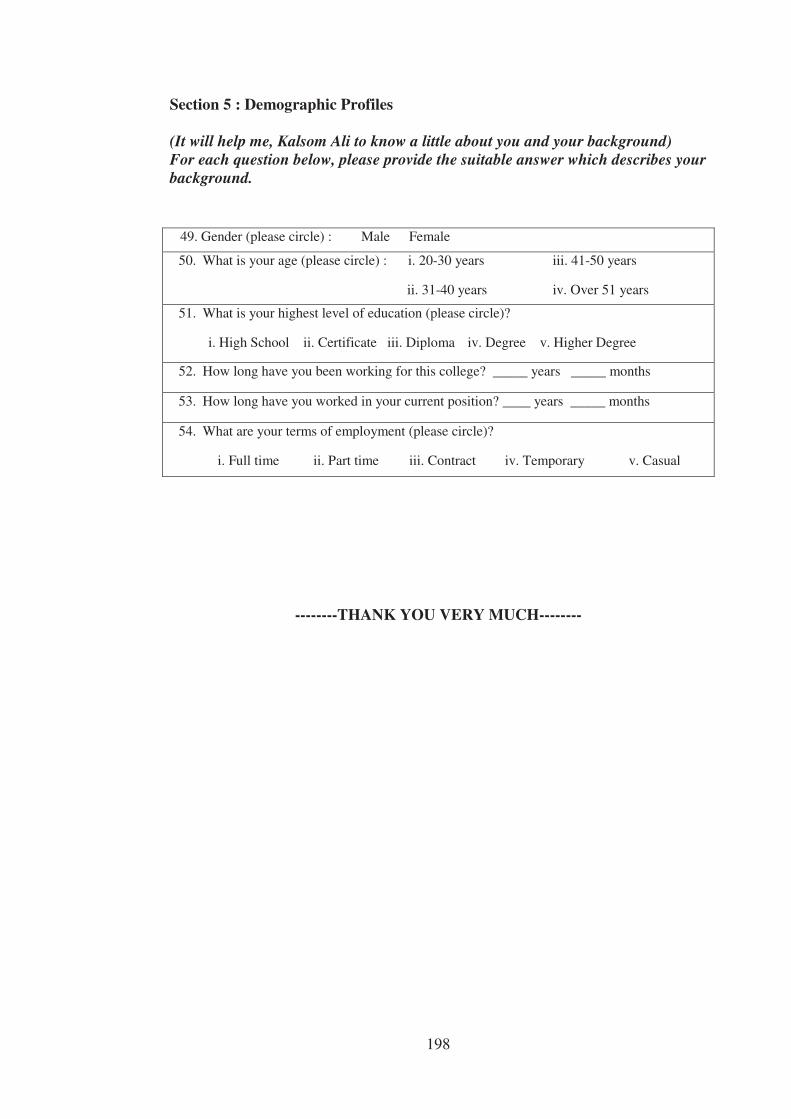
198
Section 5 : Demographic Profiles (It will help me, Kalsom Ali to know a little about you and your background) For each question below, please provide the suitable answer which describes your background.
--------THANK YOU VERY MUCH--------
49. Gender (please circle) : Male Female
50. What is your age (please circle) : i. 20-30 years iii. 41-50 years
ii. 31-40 years iv. Over 51 years
51. What is your highest level of education (please circle)?
i. High School ii. Certificate iii. Diploma iv. Degree v. Higher Degree
52. How long have you been working for this college? _____ years _____ months
53. How long have you worked in your current position? ____ years _____ months
54. What are your terms of employment (please circle)?
i. Full time ii. Part time iii. Contract iv. Temporary v. Casual
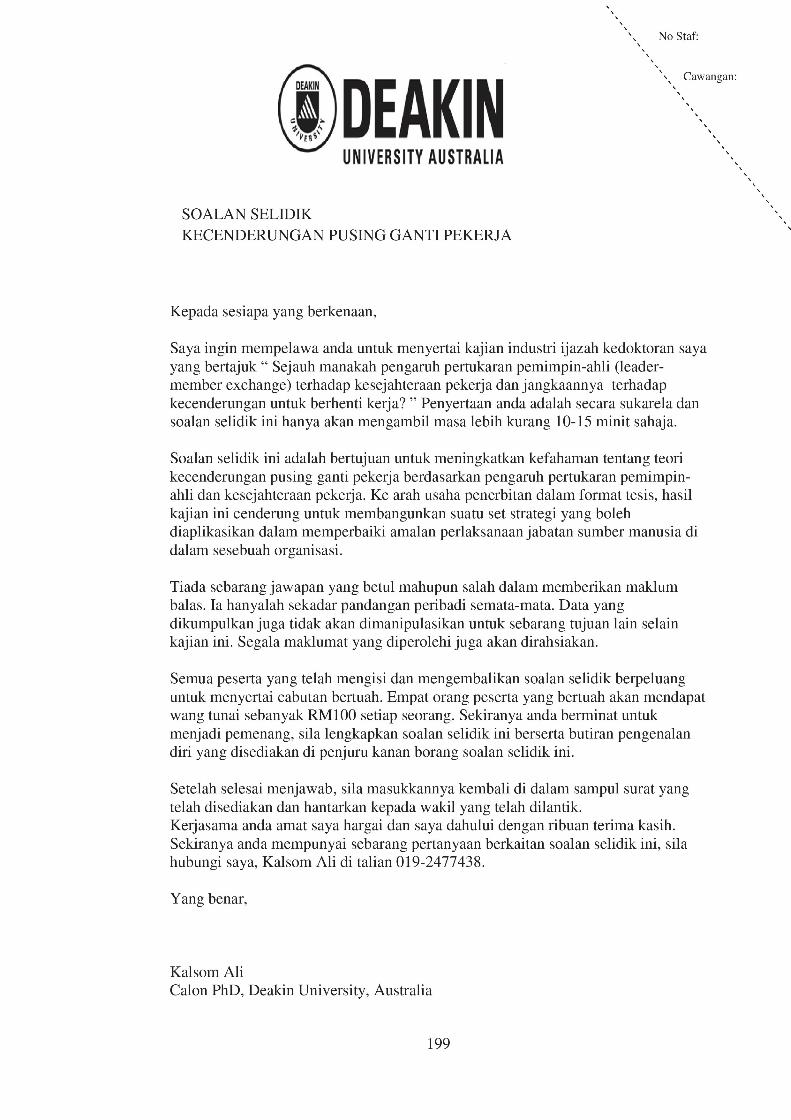
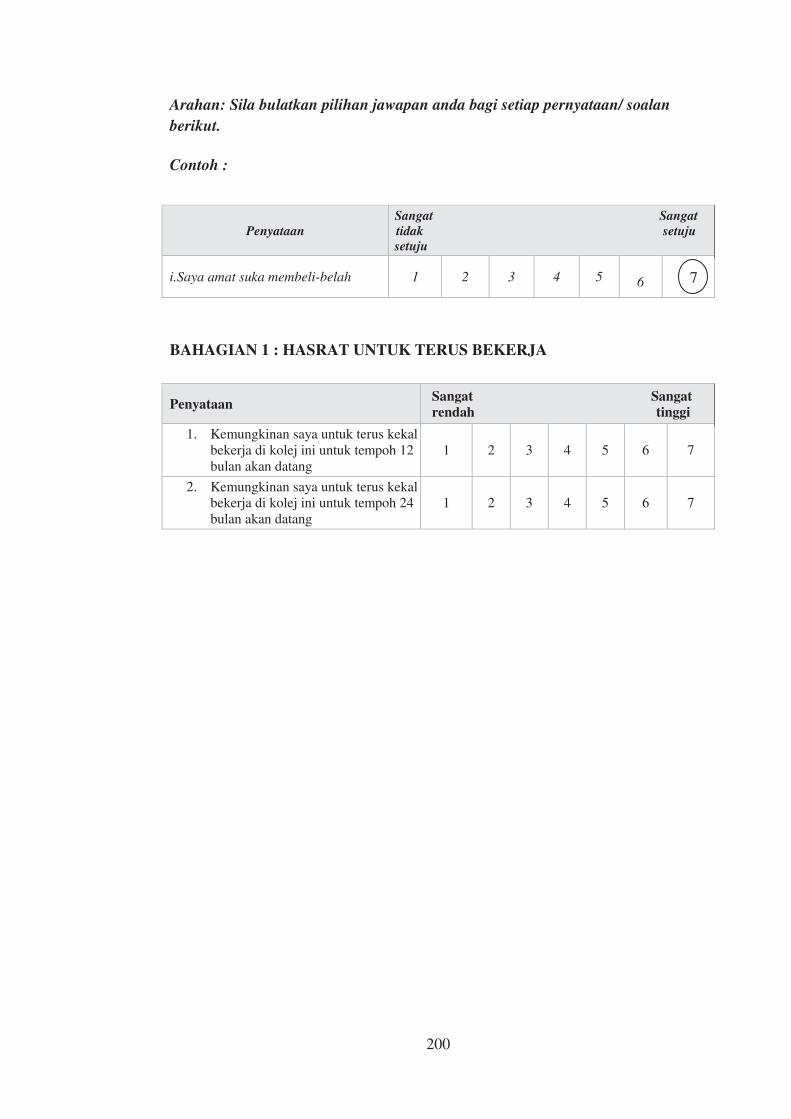
200
Arahan: Sila bulatkan pilihan jawapan anda bagi setiap pernyataan/ soalan berikut. Contoh :
BAHAGIAN 1 : HASRAT UNTUK TERUS BEKERJA
Penyataan Sangat Sangat tidak setuju setuju
i.Saya amat suka membeli-belah 1 2 3 4 5
6
7
Penyataan Sangat Sangat rendah tinggi
1. Kemungkinan saya untuk terus kekal bekerja di kolej ini untuk tempoh 12 bulan akan datang
1 2 3 4 5
6
7
2. Kemungkinan saya untuk terus kekal bekerja di kolej ini untuk tempoh 24 bulan akan datang
1 2 3 4 5
6
7
7
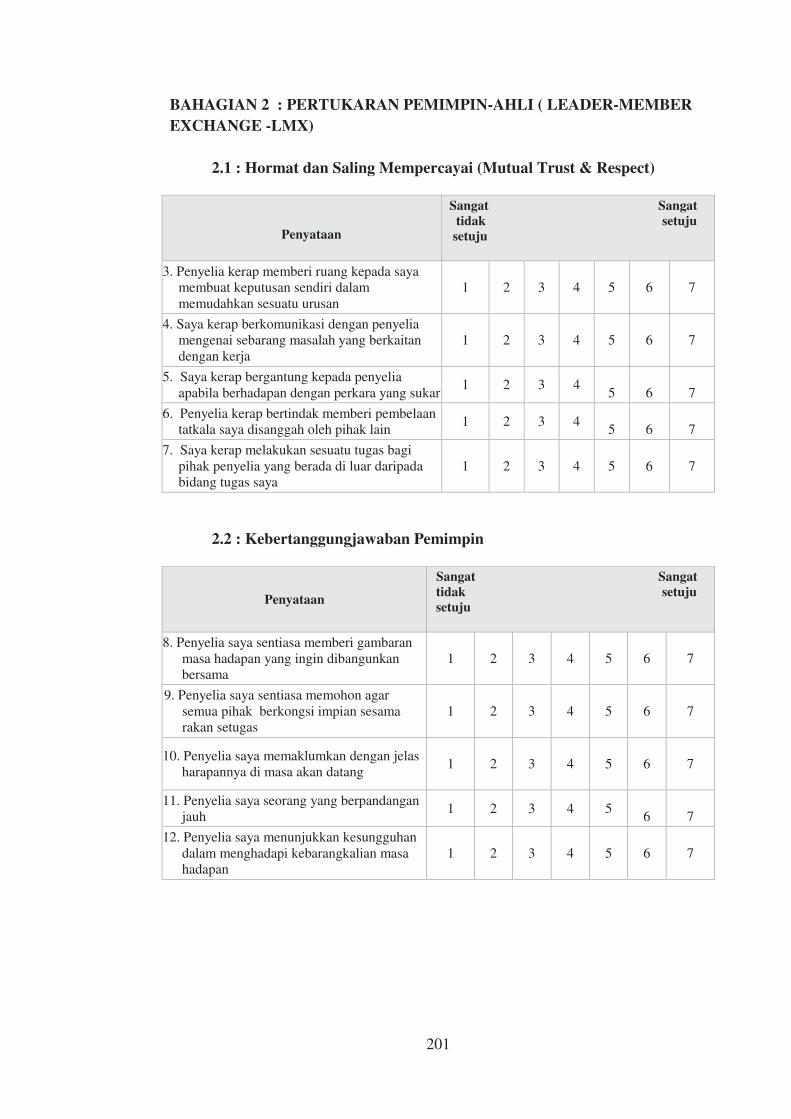
201
BAHAGIAN 2 : PERTUKARAN PEMIMPIN-AHLI ( LEADER-MEMBER EXCHANGE -LMX)
2.1 : Hormat dan Saling Mempercayai (Mutual Trust & Respect)
Penyataan
Sangat Sangat tidak setuju setuju
3. Penyelia kerap memberi ruang kepada saya membuat keputusan sendiri dalam memudahkan sesuatu urusan
1 2 3 4
5
6
7
4. Saya kerap berkomunikasi dengan penyelia mengenai sebarang masalah yang berkaitan dengan kerja
1 2 3 4
5
6
7
5. Saya kerap bergantung kepada penyelia apabila berhadapan dengan perkara yang sukar
1 2 3 4
5
6
7
6. Penyelia kerap bertindak memberi pembelaan tatkala saya disanggah oleh pihak lain
1 2 3 4
5
6
7
7. Saya kerap melakukan sesuatu tugas bagi pihak penyelia yang berada di luar daripada bidang tugas saya
1 2 3 4
5
6
7
2.2 : Kebertanggungjawaban Pemimpin
Penyataan
Sangat Sangat tidak setuju setuju
8. Penyelia saya sentiasa memberi gambaran masa hadapan yang ingin dibangunkan bersama
1 2 3 4 5
6
7
9. Penyelia saya sentiasa memohon agar semua pihak berkongsi impian sesama rakan setugas
1 2 3 4 5
6
7
10. Penyelia saya memaklumkan dengan jelas harapannya di masa akan datang
1 2 3 4 5
6
7
11. Penyelia saya seorang yang berpandangan jauh
1 2 3 4 5
6
7
12. Penyelia saya menunjukkan kesungguhan dalam menghadapi kebarangkalian masa hadapan
1 2 3 4 5
6
7
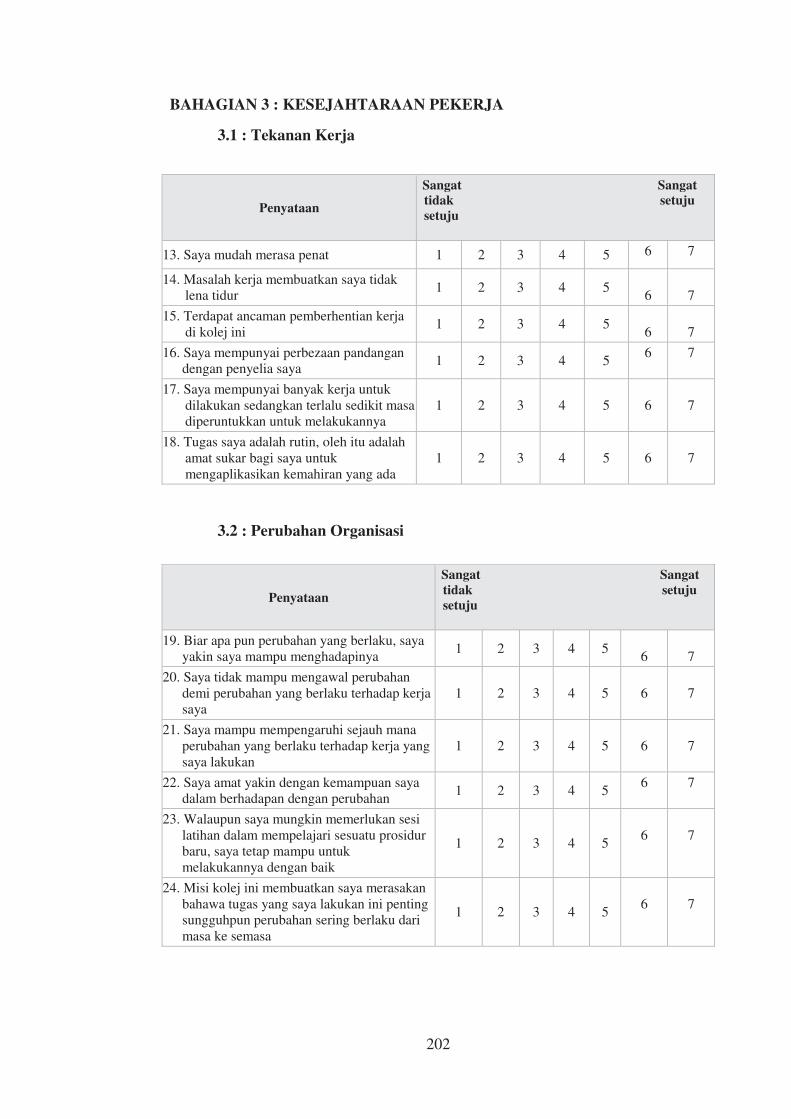
202
BAHAGIAN 3 : KESEJAHTARAAN PEKERJA
3.1 : Tekanan Kerja
Penyataan
Sangat Sangat tidak setuju setuju
13. Saya mudah merasa penat 1 2 3 4 5 6 7
14. Masalah kerja membuatkan saya tidak lena tidur
1 2 3 4 5
6
7
15. Terdapat ancaman pemberhentian kerja di kolej ini
1 2 3 4 5
6
7
16. Saya mempunyai perbezaan pandangan dengan penyelia saya
1 2 3 4 5 6 7
17. Saya mempunyai banyak kerja untuk dilakukan sedangkan terlalu sedikit masa diperuntukkan untuk melakukannya
1 2 3 4 5
6
7
18. Tugas saya adalah rutin, oleh itu adalah amat sukar bagi saya untuk mengaplikasikan kemahiran yang ada
1 2 3 4 5
6
7
3.2 : Perubahan Organisasi
Penyataan
Sangat Sangat tidak setuju setuju
19. Biar apa pun perubahan yang berlaku, saya yakin saya mampu menghadapinya
1 2 3 4 5
6
7
20. Saya tidak mampu mengawal perubahan demi perubahan yang berlaku terhadap kerja saya
1 2 3 4 5
6
7
21. Saya mampu mempengaruhi sejauh mana perubahan yang berlaku terhadap kerja yang saya lakukan
1 2 3 4 5
6
7
22. Saya amat yakin dengan kemampuan saya dalam berhadapan dengan perubahan
1 2 3 4 5 6
7
23. Walaupun saya mungkin memerlukan sesi latihan dalam mempelajari sesuatu prosidur baru, saya tetap mampu untuk melakukannya dengan baik
1 2 3 4 5
6
7
24. Misi kolej ini membuatkan saya merasakan bahawa tugas yang saya lakukan ini penting sungguhpun perubahan sering berlaku dari masa ke semasa
1 2 3 4 5
6
7
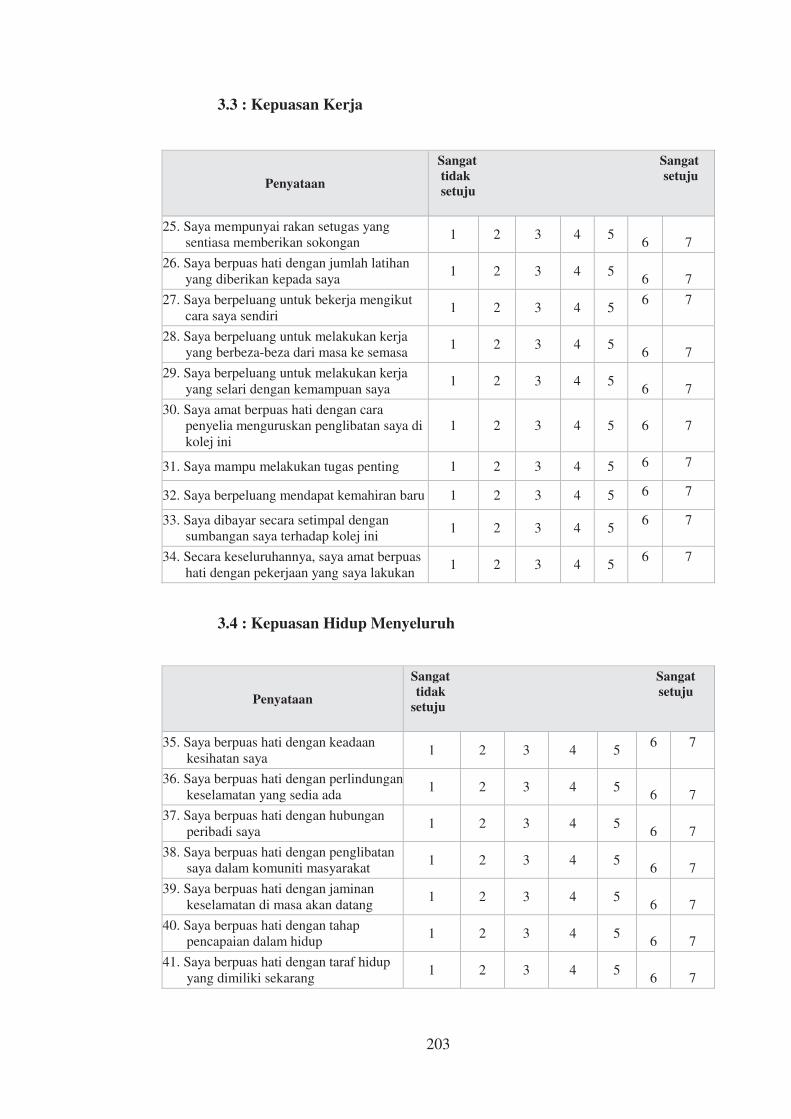
203
3.3 : Kepuasan Kerja
Penyataan
Sangat Sangat tidak setuju setuju
25. Saya mempunyai rakan setugas yang sentiasa memberikan sokongan
1 2 3 4 5
6
7
26. Saya berpuas hati dengan jumlah latihan yang diberikan kepada saya
1 2 3 4 5
6
7
27. Saya berpeluang untuk bekerja mengikut cara saya sendiri
1 2 3 4 5 6 7
28. Saya berpeluang untuk melakukan kerja yang berbeza-beza dari masa ke semasa
1 2 3 4 5
6
7
29. Saya berpeluang untuk melakukan kerja yang selari dengan kemampuan saya
1 2 3 4 5
6
7
30. Saya amat berpuas hati dengan cara penyelia menguruskan penglibatan saya di kolej ini
1 2 3 4 5
6
7
31. Saya mampu melakukan tugas penting 1 2 3 4 5 6 7
32. Saya berpeluang mendapat kemahiran baru 1 2 3 4 5 6 7
33. Saya dibayar secara setimpal dengan sumbangan saya terhadap kolej ini
1 2 3 4 5 6 7
34. Secara keseluruhannya, saya amat berpuas hati dengan pekerjaan yang saya lakukan
1 2 3 4 5 6 7
3.4 : Kepuasan Hidup Menyeluruh
Penyataan
Sangat Sangat tidak setuju setuju
35. Saya berpuas hati dengan keadaan kesihatan saya
1 2 3 4 5 6
7
36. Saya berpuas hati dengan perlindungankeselamatan yang sedia ada
1 2 3 4 5
6
7
37. Saya berpuas hati dengan hubungan peribadi saya
1 2 3 4 5
6
7
38. Saya berpuas hati dengan penglibatan saya dalam komuniti masyarakat
1 2 3 4 5
6
7
39. Saya berpuas hati dengan jaminan keselamatan di masa akan datang
1 2 3 4 5
6
7
40. Saya berpuas hati dengan tahap pencapaian dalam hidup
1 2 3 4 5
6
7
41. Saya berpuas hati dengan taraf hidup yang dimiliki sekarang
1 2 3 4 5
6
7
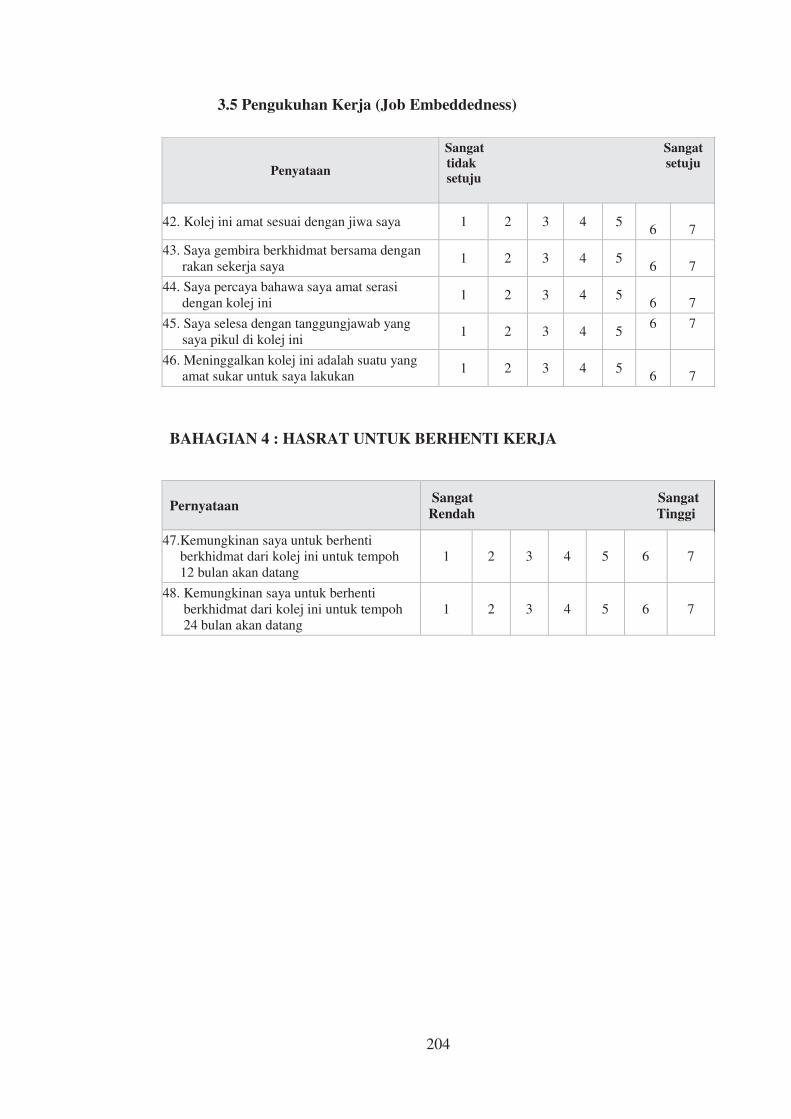
204
3.5 Pengukuhan Kerja (Job Embeddedness)
Penyataan
Sangat Sangat tidak setuju setuju
42. Kolej ini amat sesuai dengan jiwa saya 1 2 3 4 5
6
7
43. Saya gembira berkhidmat bersama dengan rakan sekerja saya
1 2 3 4 5
6
7
44. Saya percaya bahawa saya amat serasi dengan kolej ini
1 2 3 4 5
6
7
45. Saya selesa dengan tanggungjawab yang saya pikul di kolej ini
1 2 3 4 5 6
7
46. Meninggalkan kolej ini adalah suatu yang amat sukar untuk saya lakukan
1 2 3 4 5
6
7
BAHAGIAN 4 : HASRAT UNTUK BERHENTI KERJA
Pernyataan Sangat Sangat Rendah Tinggi
47.Kemungkinan saya untuk berhenti berkhidmat dari kolej ini untuk tempoh 12 bulan akan datang
1 2 3 4 5
6
7
48. Kemungkinan saya untuk berhenti berkhidmat dari kolej ini untuk tempoh 24 bulan akan datang
1 2 3 4 5
6
7
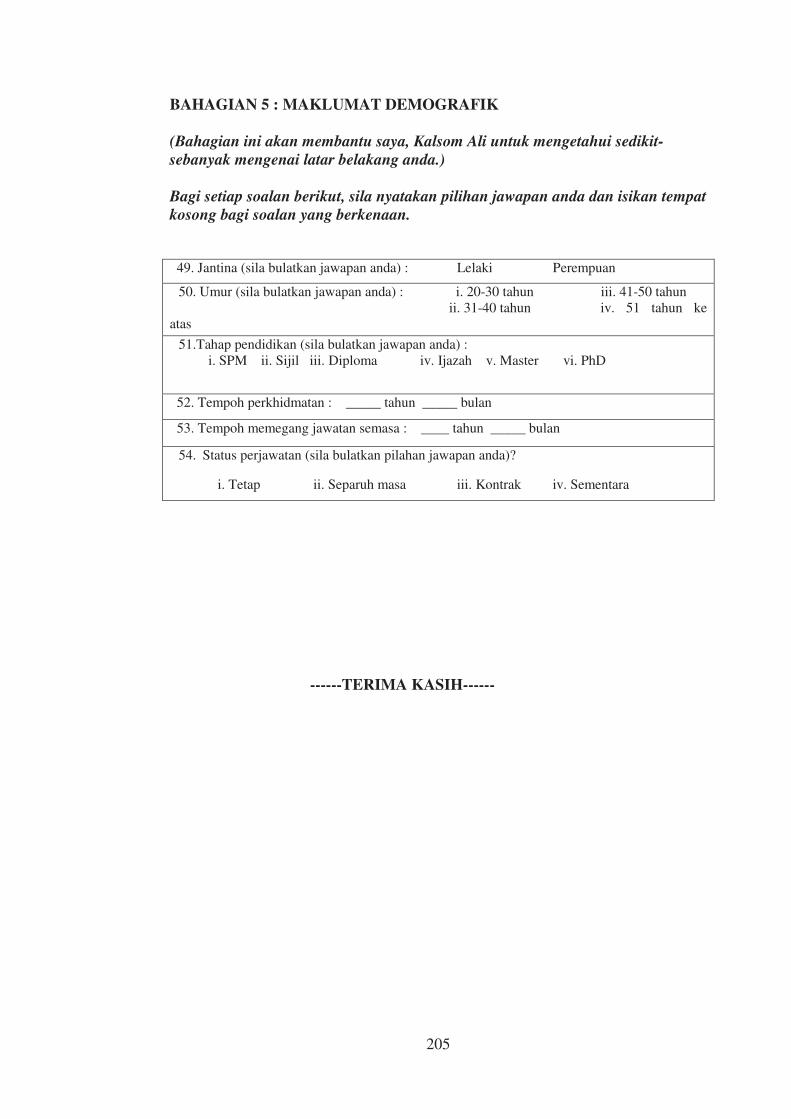
205
BAHAGIAN 5 : MAKLUMAT DEMOGRAFIK (Bahagian ini akan membantu saya, Kalsom Ali untuk mengetahui sedikit-sebanyak mengenai latar belakang anda.) Bagi setiap soalan berikut, sila nyatakan pilihan jawapan anda dan isikan tempat kosong bagi soalan yang berkenaan.
------TERIMA KASIH------
49. Jantina (sila bulatkan jawapan anda) : Lelaki Perempuan
50. Umur (sila bulatkan jawapan anda) : i. 20-30 tahun iii. 41-50 tahun ii. 31-40 tahun iv. 51 tahun ke atas
51.Tahap pendidikan (sila bulatkan jawapan anda) : i. SPM ii. Sijil iii. Diploma iv. Ijazah v. Master vi. PhD
52. Tempoh perkhidmatan : _____ tahun _____ bulan
53. Tempoh memegang jawatan semasa : ____ tahun _____ bulan
54. Status perjawatan (sila bulatkan pilahan jawapan anda)?
i. Tetap ii. Separuh masa iii. Kontrak iv. Sementara