Embed Size (px)
Citation preview
Minnesota State University, Mankato Minnesota State University, Mankato
Cornerstone: A Collection of Scholarly Cornerstone: A Collection of Scholarly
and Creative Works for Minnesota and Creative Works for Minnesota
State University, Mankato State University, Mankato
All Graduate Theses, Dissertations, and Other Capstone Projects
Graduate Theses, Dissertations, and Other Capstone Projects
2014
The Effects of Low-Level Ethanol Blends in 4-Stroke Small Non-The Effects of Low-Level Ethanol Blends in 4-Stroke Small Non-
Road Engines Road Engines
Chris Reek Minnesota State University - Mankato
Follow this and additional works at: https://cornerstone.lib.mnsu.edu/etds
Part of the Automotive Engineering Commons
Recommended Citation Recommended Citation Reek, C. (2014). The Effects of Low-Level Ethanol Blends in 4-Stroke Small Non-Road Engines [Master’s thesis, Minnesota State University, Mankato]. Cornerstone: A Collection of Scholarly and Creative Works for Minnesota State University, Mankato. https://cornerstone.lib.mnsu.edu/etds/364/
This Thesis is brought to you for free and open access by the Graduate Theses, Dissertations, and Other Capstone Projects at Cornerstone: A Collection of Scholarly and Creative Works for Minnesota State University, Mankato. It has been accepted for inclusion in All Graduate Theses, Dissertations, and Other Capstone Projects by an authorized administrator of Cornerstone: A Collection of Scholarly and Creative Works for Minnesota State University, Mankato.

The Effects of Low-Level Ethanol Blends in 4-Stroke Small Non-Road
Engines
By
Chris Reek
A Thesis Submitted in
Partial Fulfillment of the Requirements for the
Master of Science Degree in
Manufacturing Engineering Technology
Minnesota State University, Mankato
Mankato, Minnesota
May 2014

The Effects of Low-Level Ethanol Blends in 4-Stroke Small Non-Road Engines
Chris Reek This thesis has been examined and approved by the following members of the student’s committee.
________________________________ Dr. Gary Mead - Advisor
________________________________ Dr. Kuldeep Agarwal - Committee Member
________________________________ Dr. Bruce Jones - Committee Member

Abstract
Title: The Effects of Low-Level Ethanol Blends in 4-Stroke Small Non-Road Engines
Author: Chris Reek
Degree: Masters of Manufacturing Engineering Technology
University: Minnesota State University, Mankato 2014
Small Non-Road Engines (SNRE’s) abound in numbers and
are used daily by consumers and businesses alike.
Considering the atmosphere of change looming in the air
regarding alternative fuels, this particular engine
classification will also be affected by any change in
standardization of fuels. This body of research attempts to
address possible ways SNRE’s can change their operational
characteristics after being fueled by specific yet differing
fuels. These characteristics will be contrasted against blends
of ethanol with gasoline, from 0% ethanol to 20% ethanol,
run on test engines to determine patterns, if any, of these
characteristics. Topics include: materials compatibility,
engine longevity/durability, engine performance, emissions
characteristics, operational temperatures, engine oil
characteristics, and inspection of engines. These parameters

will be used to compare the effects of low-level blends of
ethanol with gasoline has on these particular SNRE’s.

Acknowledgements
Funding for this research was provided by the Minnesota
Corn Growers Association.
The author would like to thank those who helped this
research come to fruition:
• Dr. Gary Mead
• Dr. Bruce Jones
• Mr. Paul Steevens
• Mr. Al Wodtke
• Mr. Jon Olmstead
• Mr. David Besta

Table of Contents
List of Tables ........................................................................................................ 7 List of Figures ...................................................................................................... 7 Introduction .......................................................................................................... 8 Literature Review ............................................................................................... 10 Experimental Design ......................................................................................... 17 Engine Selection ............................................................................................................. 17 Engine Outfitting .............................................................................................................. 17 Sample Size .................................................................................................................... 18 Fuel assignment .............................................................................................................. 18 Aging ............................................................................................................................... 20 Oil Analysis ..................................................................................................................... 21 Performance .................................................................................................................... 21 Emissions ........................................................................................................................ 22 Post-Testing Inspection ................................................................................................... 22 Discussion of Results ....................................................................................... 24 Aging ............................................................................................................................... 24 Oil Analysis ..................................................................................................................... 25 Performance .................................................................................................................... 29 Temperatures .................................................................................................................. 32 Emissions ........................................................................................................................ 35 Disassembly .................................................................................................................... 39 Conclusion ......................................................................................................... 40 Future Research.................................................................................................42
References ......................................................................................................... 43 Appendix ............................................................................................................ 44 List of Test Equipment .................................................................................................... 44 Test Plan ......................................................................................................................... 45 Aging Procedure ............................................................................................................. 52 Performance Test Procedure .......................................................................................... 54 Hot Restart Test Procedure ............................................................................................ 56 Emissions Test Procedure .............................................................................................. 57 Dyno Calibration Procedure ............................................................................................ 61 Aging Notes ..................................................................................................................... 64 Disassembly Pictures ...................................................................................................... 65 Disassembly Measurements ........................................................................................... 68 General Pictures ............................................................................................................. 72

7
List of Tables
Table 1 Fuel Assignments……………………………………………………………18
Table 2 EPA Testing Guidelines………………………………………………….….20
Table 3 Summary of Emissions Results..............................................................36
List of Figures
Figure 1 Aging Layout…………………………………………………………………19
Figure 2 Oil Usage Throughout Lifetime…………………………………………….23
Figure 3 Iron Dilution in Crankcase Oil……..…………….…………………………24
Figure 4 Aluminum Dilution in Crankcase Oil………...…………………………….25
Figure 5 End of Life Compression…………………………………………………...26
Figure 6 Torque Throughout Lifetime………………………………………………..27
Figure 7 Horsepower Throughout Lifetime………………………………………….27
Figure 8 Hz Drop During Performance Test………………………………………..28
Figure 9 Exhaust Gas Temperature Throughout Lifetime…………………………29
Figure 10 Cylinder Head Temperature Throughout Lifetime……………………..30
Figure 11 Oil Temperature Throughout Lifetime……………..…………………….31
Figure 12 Hydrocarbon Emissions Throughout Lifetime…………………………..32
Figure 13 NOx Emissions Throughout Lifetime…………………………………….33
Figure 14 Carbon Monoxide Emissions Throughout Lifetime…………………….34
Figure 15 Carbon Dioxide Emissions Throughout Lifetime……………………….35

Introduction
This research is a small piece of a SNRE (Small Non-Road Engine) study on the
effects of ethanol/gasoline blends being used. The overall research project
carried out at Minnesota State University, Mankato consisted of many more
engines, and engine types, using various blends of ethanol and gasoline ranging
from E0 to E20.
The economic and environmental impact of offsetting fossil fuels with
corn/cellulosic-based ethanol is a topic of great debate. While this is an important
topic to regard before implementing any changes in fuel policy, this research will
not cover those issues.
This body of work examines trends in post combustion emissions, durability,
longevity, and performance of a specific engine type being operated on
intermediate ethanol blends (E0, E10, E15, E20).
Small Non Road Engines, or SNRE’s, are used on a massive scale. Millions of
SNRE’s are sold each year and are used for applications such as lawn mowers,
leaf blowers, ice augers, electrical generation, and pumping.
Due to the price point and general use of SNRE’s, engine development in this
category has been limited. Production numbers must be high to feed consumer
demand, while the price must be kept low to satisfy typical users. SNRE’s must
also be held to a high reliability standard like most products. SNRE’s are typically

9
subjected to extremely hard use; they are stored for long periods, usually with
lack of maintenance, and are expected to start every time and achieve full load.
Keep in mind that they must also be emissions compliant throughout their lifetime.
Other parts of the overall project address these issue.

10
Literature Review
A sizable amount of research has been done in this sector. The National
Renewable Energy Laboratory, or NREL, has summed up the situation nicely.
“The Energy Independence and Security Act of 2007 calls on the nation to
significantly increase its use of renewable fuels to meet its transportation energy
needs. The law establishes a new renewable fuel standard (RFS) that requires
the nation to use 36 billion gallons of renewable fuel in its vehicles by 2022.
Given that ethanol is the most widely used renewable fuel in the United States
and production is expected to grow steadily over the next several years,
ethanol—both from corn and from cellulosic feedstocks—will likely make up a
significant portion of the new renewable fuel requirements. The vast majority of
ethanol used in the United States is blended with gasoline to create E10—that is,
gasoline with up to 10% ethanol by volume. The remaining ethanol is sold in the
form of E85—a gasoline blend with as much as 83% ethanol that can be used
only in flexible-fuel vehicles (FFVs). Consumption of E85 is currently limited by
both the size of the flex-fuel vehicle fleet and the number of E85 fueling stations.
While U.S. automakers have committed to significantly ramping up production of
FFVs, only about 7% of the existing U.S. fleet is replaced each year. That means
a significant number of the non-FFVs in use today will remain in the vehicle stock
for many years to come.” (National Renewable Energy Laboratory, 2009)

11
In lieu of changing regulations pertaining to renewable fuel regulations, ethanol
will become a major factor in the general discussion regarding the United States’
fueling needs. The use of 10% ethanol, 85% ethanol, and blender pumps around
the nation may lead to more use in vehicles and equipment. The effects of the
additional fuel use shall need to be determined before widespread use should
take place.
Lawmakers in Minnesota have even taken the point of utilizing more renewable
fuel sources to the extent of proposing increased ethanol content in fuel.
“Minnesota Statute 239.791 Subd.1a requires that on August 30, 2013, gasoline
sold in the State of Minnesota shall contain at least 20% denatured ethanol by
volume. If on December 31, 2010, however, it is determined that 20% of the
State’s gasoline volume is ethanol, then this provision expires. If 20% volume
replacement is not achieved by 2010, then the 2013 requirement becomes
effective provided the United States Environmental Protection Agency (US EPA)
certifies E20 by December 31, 2010. In order to use E20 in non-Flex-Fuel
vehicles, it will be necessary that the US EPA certify E20 as a motor fuel through
a waiver under section 211(f) (4) of the Clean Air Act.” (Univeristy of Minnesota
Center for Diesel Research, 2008)
The EPA has granted a waiver for E15 to be used in vehicles from model year
2001 – 2006. The EPA declined to extend the E15 waiver for use in motorcycles,
heavy-duty vehicles, or non-road engines.

12
The fact that Minnesota is set on increasing the amount of ethanol contained at
the pumps warrants more research on the subject.
Minnesota lawmakers aren’t the only ones looking to increase ethanol content in
fuels. Growth Energy requested addition ethanol content be included at the pump.
“In March 2009 corn ethanol producers asked for help from the federal
government to expand their industry. Growth Energy, a consortium of ethanol
producers, petitioned the Environmental Protection Agency (EPA) to allow 50%
more ethanol in gasoline than is currently permitted, requesting approval for E15
fuel (a mixture of gasoline with 15% ethanol).” (Growth Energy 2009)
Considering the petition to increase the ethanol/gasoline ratio, research should
be conducted to evaluate the effects of additional low-level blends of ethanol on
the products they would be used on.
The shear amount of SNREʼs in use and producing post combustion emissions is
staggering. Changing the fuel they are burning to accomplish their desired tasks
may have dire affects on the quantity and make-up of those emissions.
“Hundreds of millions of non-road engines are used across the country, including
leaf blowers, line trimmers, chainsaws, lawn mowers, motor boats, generator
sets, and small tractors. For many small engines, ethanol fuels could also be
associated with increased emissions of hazardous air pollutants and ozone
precursors such as hydrocarbons and nitrogen oxides (American Lung

13
Association 2009; Sahu 2009). The DOE study reported that NOx emissions
increased by 50-75% for small engines operated on E10 and E15 ethanol blends
(DOE 2009) compared to E0... Air pollution with nitrogen oxides leads to
aggravation of respiratory disease and increased susceptibility to respiratory
infections. NOx also contributes to formation of ozone and particulate pollution,
which are associated with severe adverse respiratory effects (U.S. EPA 2008).”
(Naidenko, 2009)
Itʼs no doubt that altering the fuel that is used for combustion will inherently
change the exhaust emissions, both in amount and type. While many things will
affect this change, such as: lambda, compression ratio, combustion chamber
geometry, a vague pattern should arise pertaining to the engines general
emissions. Considering the volume of small engines in use today and their
fueling controls, they may be the items most effected by the change in fueling.
Part of NREL’s study included emissions sampling of some engines, here are
their results.
“Open-loop engines tested in this study exhibited the following trends in
emissions and temperatures with varying levels of ethanol.
• As ethanol levels increased, leaner engine operation was
observed in all of the tested engines, as indicated by decreased CO
emissions.
• Temperatures of both the exhaust and engine components increased

14
as ethanol levels increased.
• HC emissions generally decreased with increasing ethanol, although
increases in HC emissions occurred in some engines.
• NOx emissions increased with higher levels of ethanol in all engines;
however, combined NOx +HC emissions (which are regulated as such)
were tempered by decreasing HC emissions in most cases. Net changes of
HC + NOx with increasing ethanol ranged from –36% to +41% and were
engine-specific.
• CO emissions decreased with higher levels of ethanol.
• In the case of the 2-cylinder engine tested, temperatures and
emissions varied from cylinder to cylinder due to differences in the fuel:air
distribution between cylinders. Given this observation, multicylinder open-
loop engines may prove to be more sensitive to ethanol blends than single-
cylinder engines.
• With greater ethanol content, three handheld trimmers demonstrated
higher idle speed and experienced unintentional clutch engagement. The
increased speed was again caused by the fuel:air mixture enleanment,
which can be adjusted and mitigated in some engines.
• Residential and Commercial Class I and Class IV engines were aged to
full life.”
(National Renewable Energy Laboratory, 2009)
The National Renewable Energy Laboratory (NREL), conducted a very thorough
study on the effects of ethanol blends in small engines. They were able to

15
deduce trends based on emissions, temperatures, and operational variance.
Such research is an important building block in the effects of ethanol on SNRE’s.
Regarding an important trend deduced from the NREL study is that NOx
(Nitrogen Oxides) levels increase with ethanol content. More research goes on to
explain why.
“The creation of Nitrogen Oxides correlates with the maximum temperature
during the combustion, the duration of the combustion and the availability of
oxygen. The influence of the oxygen availability could be excluded by a constant
fuel-air ratio in the investigations. A tendency for NOx to decrease with
increasing percentage of alcohol is obvious... (Bertsh, et al., 2012)
This research suggests that if the fuel-air ratio is held constant, the NOx levels
actually decrease with higher ethanol content; making the claim that the fuel air
ratio is a significant variable in the formation of NOx.
While emissions are clearly effected by changes in ethanol content, the overall
performance of the machine may be just as important. Not only output power and
reliability, but temperatures should be considered as well.
“Small engines such as those in lawn mowers and lawn tractors, generators, line
trimmers, chainsaws, and other similar equipment are open-loop engines, in that
exhaust-sensing feedback is not used to control the fueling rate. Open-loop
engines are commonly air-cooled and customarily operate in the fuel- rich regime
to achieve cooler combustion temperatures. With a fixed fueling calibration,

16
[increased ethanol content leads] to a higher combustion temperature and hence
higher component temperatures (DOE 2009).” (Naidenko, 2009)
Considering that small engines usually employ open-loop fueling systems, they
are very susceptible to fuel type changes. While modern vehicles have the ability
to adjust fueling based on oxygen sensor feedback, small engines typically lack
that ability.
Performance may be affected so substantially that OEM’s may void their usual
warranties.
“Stale gas and ethanol-blended fuels are key contributors to engine issues and
lawn mower problems that include the engine not starting, rough running, rust
and corrosion and in many cases, failure. This damage to your lawn mower,
snow blower or other outdoor power product ultimately adds up to costly small
engine repair and voided engine warranties.” (Briggs and Stratton)
Small engine manufacturers have generally denounced ethanol use in engines
and some will claim to void warranties based on its use in their products. If the
EPA approves intermediate ethanol blends for commercial use, these
manufactures may still void warranties based on its use. To the consumer, this
may be a confusing issue to work around.

17
Experimental Design
Engine Selection
The engines used in this study were non-handheld Briggs and Stratton 525
series.
Engine specifications:
• 148cc displacement
• 4-stroke operation
• Flat or “L’ head design
• 5.25 ft-lb of torque (per SAE J1940)
Since this type of engine has been around for decades, and represents a wide
cross-section of engines in use, this engine type was deemed to be important to
include in the test.
An entire test outline can be found in the “Test Plan” portion of the appendix.
Engine Outfitting
Engine RPM and Runtime were monitored during aging and performance testing
with TTO brand hour meter/tachometer units.
18
The engines were outfitted with thermocouples to monitor temperatures in the
following locations:
• Intake Air
• Oil
• Cylinder Head
• Exhaust Gas
The engines were also outfitted with a more convenient oil drain tube to make oil
changes easier and faster while on the aging apparatus.
Sample Size
The sample size for the study was determined to be 12 engines, based on time
and budget constraints. A previous study with the same engine selection used 4
engines and did not produce enough data to form a conclusion.
During the entire testing lifecycle of the engines, the manufacturer’s operators’
manual was followed. The scheduled maintenance was followed to within 0.1
hours of the specified maintenance points.
Fuel assignment
Fuels for this research were E0, E10, E15 and E20. Fuels for emissions testing
were a combination of Ethanol and Tier 2 EEE certified test fuel, which were
splash blended, while the aging fuels were created by using ethanol and non-
oxygenated pump fuel.

19
All engines were broken in for 5hrs using E0. After initial break in, the engines
were then performance tested, emissions tested and compression tested on E0.
Immediately after initial E0 baseline testing, each engine was assigned a specific
blended fuel. The fuel assignments used for the aging process were E0, E10,
E15, or E20. Fuel assignment was based on initial E0 emissions testing to
determine AFR (air fuel ratio). After AFR was determined, the assigned fuel was
issued to a particular engine to replicate worst-case scenario. For example, the
leanest engine was issued E20 to increase the enleanment consequence of
running on more ethanol. Then engines were then tested immediately after fuel
assignment (7hrs), tested at their Midlife (62.5hrs), and tested at End of Life
(125hrs), then were returned to E0 to facilitate comparison at End of Life.
Fuel Assignment Schedule Engine Fuel Engine Fuel
1 E20 7 E15 2 E15 8 E10 3 E10 9 E0 4 E10 10 E20 5 E0 11 E0 6 E15 12 E20
Table 1
Table 1 shows the respective fuel assignments for each engine.
A full test schedule can be found in the appendix.

20
Aging
The test engines were aged to their emissions determination period (EDP), in this
case 125 hours. The aging cycle was as follows:
• 2 minutes running at high idle/ minimum load
• 2 minutes running at full engine load (2.25hp)
• 6 minutes at approximately half engine load (1hp)
During the aging cycle, the engines were attached to Winco brand generator
heads. The heads were then attached to electrical heaters with a timed-switching
interface to control the loading of the engine/generator unit. Figure 1 shows the
aging layout.
Figure 1

21
Crankcase Oil Analysis
The engine oil analysis consisted of weighing the oil to determine oil
consumption trends. At each oil change interval, a sample was sent in for
chemical analysis. The chemical analysis included:
• Wear Metals (Iron, Aluminum, Copper, Lead)
• Contaminant Metals (Silicon, Sodium, Potassium)
• Multi-Source Metals (Titanium, Molybdenum, Manganese, Boron)
• Additive Metals (Magnesium, Calcium, Phosphorus, Zinc)
• Contaminants (fuel, soot, water)
• Fluid Properties (viscosity, acid)
Performance
Performance of the engines was measured during the “Load Pickup” tests where
the engine was attached to a Winco generator head, which was electrically
attached to an adjustable load bank. The test was a modified version of SAE
J1444 (SAE International, 2009). Parameters recorded for comparison were Hz,
Volts, and Amps. Time was also recorded to indicate stabilization reactiveness.
Performance was also determined with the dynamometer during emissions
testing by directly measuring horsepower and torque.
22
Emissions
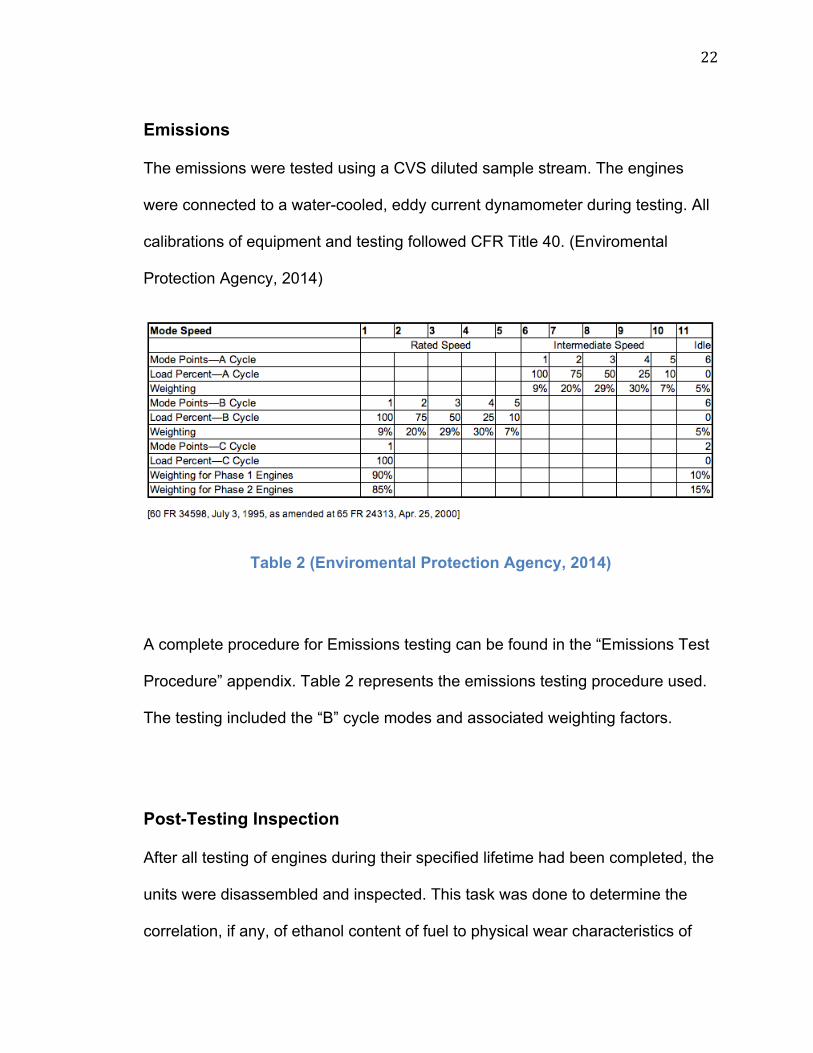
The emissions were tested using a CVS diluted sample stream. The engines
were connected to a water-cooled, eddy current dynamometer during testing. All
calibrations of equipment and testing followed CFR Title 40. (Enviromental
Protection Agency, 2014)
Table 2 (Enviromental Protection Agency, 2014)
A complete procedure for Emissions testing can be found in the “Emissions Test
Procedure” appendix. Table 2 represents the emissions testing procedure used.
The testing included the “B” cycle modes and associated weighting factors.
Post-Testing Inspection
After all testing of engines during their specified lifetime had been completed, the
units were disassembled and inspected. This task was done to determine the
correlation, if any, of ethanol content of fuel to physical wear characteristics of

23
engine internals. This inspection process consisted of physical measurements of
critical components and also a visual inspection to spot differences in engine
deposits on components most likely affected by altering fuel characteristics.

24
Discussion of Results
Aging
All engines successfully completed the specified aging process for the125 hour
EDP. While operating characteristics such as temperatures or engine power
were altered, no apparent differences of engine reliability, durability, or longevity
were noticed. Slight modifications or repairs were made to some engines in order
to complete the entire aging process. Details of all major repair activities during
the aging process can be found in the “Aging Notes” portion of the Appendix.
Presentation of findings will be primarily graphical, below is a general guideline
for graphical labels throughout this paper.
Graphing Schedules:
• Baseline E0: Baseline Testing all engines running E0 (5hrs)
• Initial Blend: Initial Blended fuel testing engines running assigned fuel
(7hrs)
• Midlife Blend: Midlife Blended fuel testing, engines running assigned fuel
(62.5hrs)
• EOL Blend: End of Life Blended fuel testing, engines running assigned
fuel (125hrs)
• EOL E0: End of Life E0 testing, all engines running E0 (127hrs)

25
Oil Analysis
Figure 2
Figure 2 shows each engine’s oil usage throughout its lifetime. The units of
measure were normalized to oil usage per hour, due to varying oil change
interval timelines. Oil usage was higher overall during the break in period, and
then continued to drop as time went on. The E15 engines showed slightly higher
oil usage than others throughout their lifetime.

26
No trending data or significant differences were apparent in most oil analysis
results. If the specific data showed no trending information, they were omitted
from graphical comparison. The oil samples sent in for analysis showed no
substantial trending information regarding the Following:
• Viscosity
• Fuel Contamination
• Soot Contamination
• Additive Metals
• Water Content
• Most Wear Metals
• Multi Source Metals
• Contaminant Metals

27
Figure 3
Although most of the oil samples showed no difference in properties between fuel
assignments, a few showed contamination differences. Figure 3 shows Iron
dilution in crankcase oil in ppm. As the engines aged, the E20 engines exhibited
higher amounts of Iron suspended in oil this could be attributed to sources such
as crankshaft journals and rings wearing.

28
Figure 4
Figure 4 shows Aluminum contamination amount in the crankcase oil. During the
break in period the engines exhibited higher aluminum content within the oil. This
can be attributed to the break in process of the engine internals such as piston-
skirt wear, cylinder wall wear, or bearing wear. The overall contamination
continues to drop as the engines age and show no substantial differences based
on fuel assignment.

29
Performance
Figure 5
Figure 5 shows the compression discrepancy at the End of Life test. The overall
range of compression results shows little variance (considering the consistency
of compression testing in general) although it is apparent that a particular E10
engine (BS-4) exhibited a loss of compression at midlife testing. This
compression drop will also be obvious on other results throughout the report.
Results of this engine will be included for statistical relevance.

30
Figure 6
Figure 7

31
Figures 6 and 7 show the maximum horsepower and torque, respectively,
tracked throughout each engines lifetime. The Horsepower of the E0 and E10
blends seems to drop on average though EOL, while the E15 and E20 show no
apparent change in power levels. Horsepower testing was done while coupled to
the dynamometer during emissions testing.
Figure 8
Figure 8 shows the test results from performance testing using SAE J1444.
Results show the stabilized frequency (Hz) drop during the test.

32
Temperatures
Temperatures were measured during the emissions testing procedure during
“Mode 1” when maximum engine output was being measured. Data was
gathered once thermal stability of less than .5 degree F per minute was reached.
Figure 9
Figure 9 displays the EGT measurements during the engines’ lifetime. Since
exhaust gas temperature readings can fluctuate during engine operation, even at
the same loading point in this application, the EGT measurements show little
trending information. The E0 and E10 blends show a general downward trend
throughout their lifetime, while E15 and E20 blends show an increase initially and
retain their original exhaust gas temperatures during aging.

33
Figure 10
Figure 10 describes the Cylinder Head temperatures as the engines were aged.
The measurement was taken at the cylinder head just under the sparkplug. The
“Initial Blended” portion of the graph represents the general trend seen during
testing. The temperatures generally increased with ethanol content, although the
E20 engines exhibited lower temps than the E15 Engines. This condition could
be attributed to an “over-enleanment” condition; or running a higher lambda. The
loss of compression on engine number 4 is also apparent in Figure 10, as
temperatures dropped substantially.
Additionally, the data shows E0 and E10 blends losing temperature as they are
aged, while the E15 and E20 blends show a lesser affect by engine hour
accumulation.

34
Figure 11
Figure 11 displays the Oil Temperature during the lifetime of the engines. The
data contained within this graph shows E0 and E10 blends losing temperature as
they are aged, while the E15 and E20 blends show a lesser affect by engine hour
accumulation.

35
Emissions
Figure 12
Figure 12 shows the HC emissions during the engines’ lifetime. The E0 and E10
engines show a general increase of HC emissions as engine hours are
accumulated. In the opposite regard, the E15 and E20 engines display in initial
reduction in HC emissions and exhibit that reduction throughout their lifetime.
Again, the loss of compression on engine 4 contributes to the massive increase
in HC emissions starting at “Midlife Blend” testing.

36
Figure 13
Figure 13 displays the NOx emissions during the engines’ lifecycle. Over the
lifetime of the engines, there is an apparent difference based on fuel assignment
and emissions. The E0 and E10 blends slowly reduce their NOx emissions, while
the E15 and E20 blends exhibit greater NOx emissions.
37
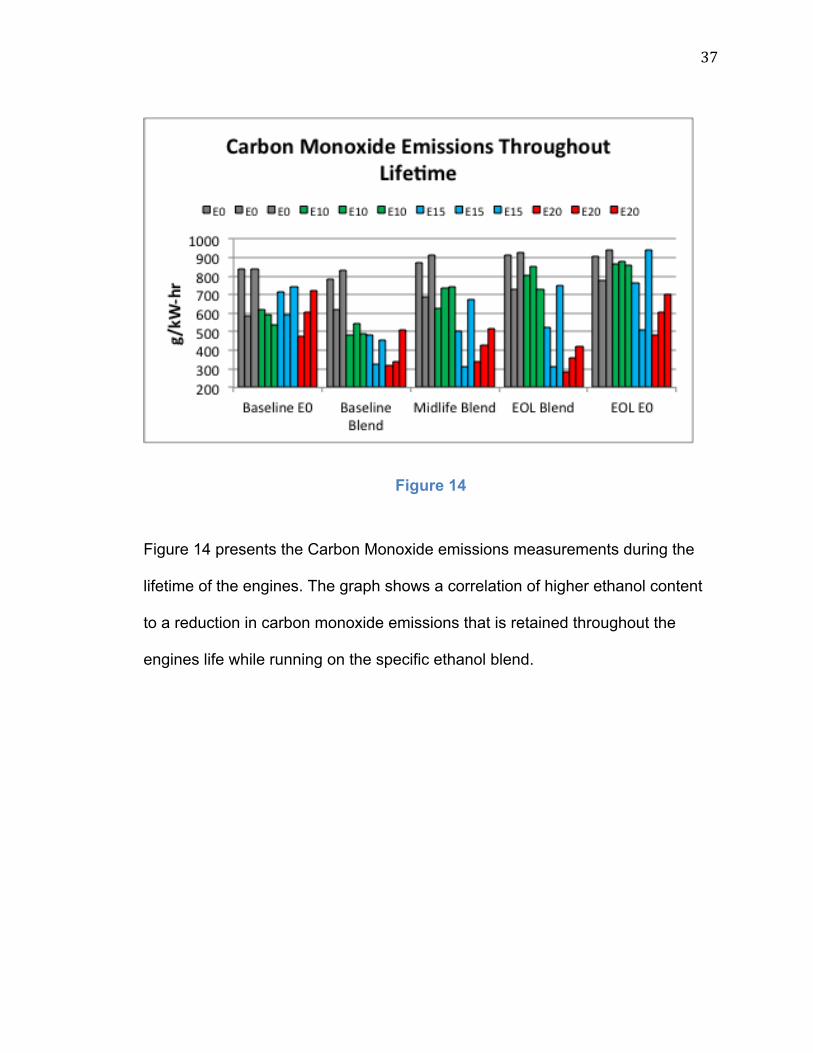
Figure 14
Figure 14 presents the Carbon Monoxide emissions measurements during the
lifetime of the engines. The graph shows a correlation of higher ethanol content
to a reduction in carbon monoxide emissions that is retained throughout the
engines life while running on the specific ethanol blend.

38
Figure 15
Figure 15 illustrates the Carbon Dioxide emissions through the lifetime of the
engines. The data collected shows no substantial trending information.
Table 3
!" #$%& "' "'()*#"+,-./ 012 342 302 02)0*#"+,-./ 052 42 362 62)07#"+,-./ 3(82 712 3992 62)(*#"+,-./ 72 912 3972 62
:;/<,./#"+,-./#=-#)>=??=%-?#';/<#@=A/B=>/

39
Table 3 shows the overall change in HC, NOx, CO, and CO2 emissions
throughout the engines’ lifetime. The values displayed represent the overall
differences in specific emissions where all of the Baseline E0 Tests were
averaged and compared to all of the Fuel Blend Tests. The E15 engines
displayed the largest change of HC emissions at an overall reduction of 26%.
The E15 engines also showed the greatest difference in NOx, exhibiting an
average increase of 57%. The E15 and E20 engines both showed a 33% and
35% reduction in CO emissions respectively. Throughout the lifetime of the units,
the CO2 emissions showed no significant change based on ethanol content.
Disassembly
Physical measurements of the dimensions of engine components were carried
out after all other testing had been completed. No apparent pattern developed in
wear amounts in relation to ethanol content of the engine’s assigned fuel.
Physical measurements can be found in the Disassembly Measurements portion
of the Appendix.
Visual inspection of the units also occurred during the tear down procedure. The
visual inspection revealed no apparent trends in discoloration, deposit type, or
amount. Photos of the visual inspection can be found in the “Disassembly
Pictures” portion of the Appendix.

40
Conclusion
Tests were carried out to illustrate the effects of low-level ethanol blends on 4-
Stroke, Small Non-Road Engines. The characteristics affected by an increase in
ethanol content included:
• NOx emissions were altered, on average, from baseline EO testing by:
o E0: -4%
o E10: 4%
o E15: 57%
o E20: 37%
• HC emissions were altered, on average, from baseline EO testing by:
o E0: 17%
o E10: 19%
o E15: -26%
o E20: 5%
• CO emissions were altered, on average, from baseline EO testing by:
o E0: -1%
o E10: -8%
o E15: -33%
o E20: -35%
• Cylinder Head temperatures increased as ethanol content climbed to 15%,
but fell at the E20 blend, due to over-enleanment.
41
• Oil temperatures temperatures increased as ethanol content climbed to
15%, but fell at the E20 blend, due to over-enleanment.
• Torque of the E15 and E20 units held at baseline values throughout the
units’ lifetime, while E0 and E10 steadily lost original torque.
• The E20 engines exhibited an increase of Iron dilution in engine
crankcase oil.
Many characteristics were unchanged based on ethanol content such as,
reliability, longevity, engine wear, engine deposits, and most crankcase oil
properties. While these results are documented on this specific platform, other
engines may respond to changes in ethanol content in a different manner.
Ethanol clearly had an effect on specific operational parameters of the engines
tested for this research. While the effects are limited to specific characteristics, it
is clear that in regards to the open-loop fueled engines in study, the engines are
not optimized for a broad mix of ethanol. They however, did display a tolerance
for low-level ethanol blends when longevity and durability are in question.

42
Future Research
Since this research only focused on a very specific application, more testing
should be carried out on different types of SNRE’s to gain a broad perspective on
the effects low-level ethanol blends have. Research should also be performed in
the arena of particulate matter, since changing the fuel structure my have
consequences in that regard.

43
References
Bertsh, M., Beck, K. W., Spicher, U., Kolmel, A., Dawin, U. C., Lochmann, H., et al. (2012). Influence of the Alcohol Type and Concentration in Alcohol-Blended Fuels on the Combustion and Emission of Small Two-Stroke SI Engines. SAE International.
Briggs and Stratton. (n.d.). Ethanol-Free Gas: Prevent Lawn Mower Problems with Small Engine Fuel. Retrieved June 1, 2014, from http://www.briggsandstratton.com/: http://www.briggsandstratton.com/us/en/shop/canned-fuel
Enviromental Protection Agency. (2014). Title 40 Part 90. EPA.
Frazier, R. S. Ethanol Gasoline Blends and Small Engines. Oklahoma Cooperative Extension Service. Oklahoma Cooperative Extension Service.
Naidenko, O. V. (2009). Ethanol-Gasoline Fuel Blends May Cause Human Health Risks and Engine Issues. Environmental Working Group. Environmental Working Group.
National Renewable Energy Laboratory. (2009). Effects of Intermediate Ethanol Blends on Legacy Vehicles and Small Non-Road Engines, Report 1 – Updated. NREL.
SAE International. (2008). J 1349. Standard.
SAE International. (2009). J 1444. Standard.
State of Minnesota. E20: The Feasibility of 20 Percent Ethanol Blends by Volume as a Motor Fuel. State of Minnesota.
Univeristy of Minnesota Center for Diesel Research. (2008). E20 Effects in Small Non-Road SI Engines. Technical, Minneapolis.

44
Appendix
List of Test Equipment • Briggs 525 series engines • Fluke Model 289 multimeter • Fluke Model 365 multimeter • National Instruments SCXI-1001 • National Instruments LabVIEW • Winco ULTB4000C/E • California Analytical Instruments 600 Series Emissions Bench • Magtrol 2WB65 Eddy Current Dynamometer • Omega Model HH-23A Thermocouple Reader • Simplex Swift-e Load Bank

45
Test Plan
Preparation:
1. Unpack and inspect engine for damage/issues
2. Record engine serial number and label engine appropriately
a. (NOTE: fuel is assigned after break-in)
3. Add oil to engine
a. Add 18-20 ounces of oil
i. Weight Oil and record in “Briggs Oil Spreadsheet”
4. Check/set spark plug gap to 0.030 in
a. Torque spark plug to 180 lb-in
5. Install thermocouples to read:
a. Cylinder head temperature
b. Exhaust gas temperature
c. Oil temperature
d. Intake air temperature
6. Install hour meter/tachometer
7. Perform Compression Test
Break-in:
8. Fill up all engines with PE0 (pump E 0 fuel)
a. (NOTE: all engines will be broke-in using PE0)
9. Connect each engine with a Winco Generator Head
10. Connect Winco Generators to the switch box
a. Plug in the switch board
11. Connect Space heaters to switch Box

46 12. Set timers to correct positions
a. (NOTE: timers should be set so that there is 0% load for 2 minutes, 50% load for 6 minutes and 100% for 2 minutes. This cycle will repeat until break-in is completed)
13. Follow manufacturer’s starting/warm up procedure
a. Verify idle and WOT rpm and temps
14. Break in for 5 hours following the correct cycle
a. Cycle= 0% load for 2 minutes, 50% load for 6 minutes, 100% load for 2 minutes
15. Record Engine RPM, Volts, Amps and temperatures every 30 minutes
Inspection:
16. Perform visual inspection
17. Check spark plug and note condition
18. Perform Compression Test
19. Perform Oil Change at 5 hours and for each engine:
a. Collect sample for Oil analysis
b. Record oil weight out and oil weight in, in “Briggs Oil Spreadsheet”
Initial Performance Test on PE0:
20. Perform “Briggs Performance Procedure”
21. Perform “Briggs Hot Restart Procedure”
Initial Emissions Test on TE0:
22. Drain PE0
23. Fill with TE0 (Test E 0 fuel)
24. Run engine at wide open throttle for 20 minutes or until thermally stable
a. NOTE: Thermal stability is reached when cylinder temperature does not change more than ___Degrees F for ___ minutes.
25. Record HP, Torque, RPM, and Temp data during warm-up
26. Perform “Briggs 6 Mode Emissions Procedure”
27. Drain TE0

47 Order Engines for Ethanol Blends:
28. Assign each engine its specific blend of ethanol
a. Determine 3 leanest engines and designate them for E20
b. Determine next 3 leanest engines and designate them for E15
c. Determine next 3 leanest engines and designate them for E10
d. Designate last 3 engines for E0
29. Label engine its assigned blend
Initial Emissions Test on Specific Ethanol Blend:
30. Drain TE0
31. Fill with correct blend of TE fuel
32. Run engine at wide open throttle for 20 minutes or until thermally stable
a. NOTE: Thermal stability is reached when cylinder temperature does not change more than ___Degrees F for ___ minutes.
33. Record HP, Torque, RPM, and Temp data during warm-up
34. Perform “Briggs 6 Mode Emissions Procedure”
35. Drain TE fuel from engine
Initial Performance Test on Specific Ethanol Blend:
36. Fill up correct engine with correct blend of PE
37. Perform “Briggs Performance Procedure”
38. Perform “Briggs Hot Restart Procedure”
Aging on Specific Blend:
39. Fill with correct blend of PE fuel
40. Couple engine with Winco generator head
41. Connect Winco Generators to the switch box
42. Set timers on switch box so the engines run at 0% load for 2 minutes, 50% load for 6 minutes and 100% load for 2 minutes.
a. Repeat the cycle
43. Follow manufacturer’s starting/warm up procedure

48 44. Check and Record engine data every hour
a. Temperatures at Max Load
i. Intake Air
ii. Oil Temp
iii. Cylinder Head
iv. Exhaust Gas
b. RPM at Max Load/ Mid Load/ No Load
c. Volts at Max Load/ Mid Load/ No Load
d. Amps at Max Load/ Mid Load/ No Load
45. Stop engine and check oil every 8 hours
*NOTE * If oil is needed make sure to weigh oil before adding any and make note of how much was added
46. Perform Oil Change at 55 hours and for each engine:
a. Collect sample for Oil analysis
b. Record oil weight out and oil weight in, in “Briggs Oil Spreadsheet”
47. Age units to 62.5 hours
Midlife Inspection of Units:
48. Visually inspect Engine, exhaust and fuel system
a. Leaks
b. discoloration
c. Broken/missing parts
49. Check oil and make note of condition/usage
50. Perform Compression Test
51. Inspect spark plug and note condition and gap of spark plug
Midlife Blended Performance Test:
52. Same as Initial Performance Test on Specific Ethanol Blend
Midlife Blended Emissions Test:
53. Same as Initial Emissions Test on Specific Ethanol Blend

49 Aging on Specific Blend:
54. Continue aging using process to 125 hours
a. NOTE: Perform Oil Change at 105 hours and for each engine:
i. Collect sample for Oil analysis
ii. Record oil weight out and oil weight in, in “Briggs Oil Spreadsheet”
End of life Inspection:
55. Visually inspect Engine, exhaust and fuel system
a. Leaks
b. Discoloration
c. Broken/missing parts
56. Check oil and make note of condition/usage
57. Perform Compression Test
58. Inspect spark plug and note condition and gap of spark plug
End of life Blended Performance Test:
59. Same as Initial Performance Test on Specific Ethanol Blend
d. NOTE: Name the file “BS?? End life blended performance Hz
End of life Blended Emissions Test:
60. Same as Initial Emissions Test on Specific Ethanol Blend
End of life E0 Emissions Test:
61. Same as Initial Emissions Test on TE0
End of life E0 Performance Test:
62. Same as Initial Performance Test on PE0
Visual Inspection of Engines
63. Visually inspect Engine, exhaust and fuel system
a. Leaks
b. Discoloration

50 c. Broken/missing parts
64. Check oil and make note of condition/usage
a. Collect Sample for Oil analysis
b. Record oil weight out in “Briggs Oil Spreadsheet”
65. Perform Compression Test
66. Inspect spark plug and note condition and gap of spark plug
Disassembly
67. Disassemble engine
68. Visually inspect
69. Take measurements
70. Take detailed pictures of each component
71. Fill out proper engine check sheet
72. Items to inspect include:
d. Head conditions
i. Inspect for cracks and/ or deposits
e. Cylinder wear
i. Inspect for cylinder scoring
f. Valves
i. Inspect for improper valve seating, burning, deposits, and stem wear/ galling
g. Pistons
i. Inspect for heat conditions, scoring, and deposits
h. Piston rings
i. Inspect for ring cracking use feeler gauge to measure ring groove, and any ring sticking in the piston grooves
i. Crank and crank bearings
i. Inspect for improper crankshaft run-out and abnormal wear on the bearings
j. Carburetor and internal components

51 i. Visually inspect the components for material properties
and residue
k. Overall gasket and seal inspection of all components present on engine

52
Aging Procedure
Prior to Starting
1. Make sure all thermo couples are plugged in 2. Power up Silver NI thermocouple box
a. Make sure it is plugged into Temperature computer’s USB port 3. Power up temp logging computer. (may have to click F1 if the computer
stays black) a. Click on Briggs Aging IV which is located on the desktop b. Click “Launch Labview” c. Click “No” to extend trial period d. Once Program loads, Click on “window” and select “Show Block
diagram”
i. e. On block diagram, double click on box labeled “DAQ Assistant”
i. f. Let it load and then click on “OK” g. Let it load again, then close out of “Block diagram” h. Click “Run”
i. 4. Set timers on sandwich box so the engines run at 100% load for 2 minutes,
50% load for 6 minutes and 0% load for 2 minutes. a. Repeat the cycle
5. Check Engine Oil before starting engines a. *NOTE * If oil is needed make sure to weigh oil before adding any
and make note of how much was added 6. Check and add Fuel if needed 7. Locate and Fill out “Briggs Test Conditions” 8. Fill out “Briggs Engine Log” (located on clipboard behind “Briggs Aging
Log”)

53 9. Turn on exhaust blower 10. Configure HVAC appropriately
Starting
11. Follow manufacturer’s starting/warm up procedure 12. Switch on Sandwich Box 13. Check engine data every hour and Record following data into “Briggs
Aging Log” a. Temperatures at Max Load
i. Intake Air ii. Oil Temp iii. Cylinder Head iv. Exhaust Gas
b. RPM at Max Load/ Mid Load/ No Load c. Volts at Max Load/ Mid Load/ No Load d. Amps at Max Load/ Mid Load/ No Load
14. Stop all engines and refuel when one runs out of fuel a. Start new “Briggs Test Conditions” b. Fill out “Briggs Engine Log”
15. Stop engine and check oil every 8 hours

54
Performance Test Procedure
1. This test can be performed after the unit has been aged for 5 hours and the post aging checks have been performed. This procedure is a modified version of SAE J1444.
2. This procedure is used in conjunction with the “Briggs Performance” recording sheet.
3. The unit must be at ambient temperature and cannot have been run for at least 4 hours.
4. Hook up thermocouple reader and verify that the thermocouples are reading correctly.
5. Plug the unit into the load bank. 6. Make sure the amp clamp (around 1 power wire to the load bank) and
voltmeter (one outlet on the unit) and frequency pickup (around 1 power wire to the load bank) are connected. Verify that the amps/volts/frequency are reading correctly.
7. Create a file for storing the frequency information. File name should be “BS1 initial performance Hz” for engine BS1 and “BS2 initial performance Hz” for BS2 etc. Start the VI for recording frequency. Start the engine - Cold engine – no load, move choke to closed position, turn ON ignition switch, pull cord, move choke to open once engine is warm enough to run smoothly.
8. Allow the engine to run for 1 minute with no load. Verify frequency/amps/volts.
9. Follow the loading procedure below while recording the amps/Hz/volts. The units will be checked at 4 load points – No Load, Max load 1750 watts, 3/4 load 1250 watts, 1/2 load 750 watts, ¼ load 500 watts.
10. For each step apply the load for 20 seconds. Use a stopwatch or timer to track times.
11. Record the volts and amps for each load point at approximately 10 seconds into each step.
12. After the last load point, record the temperatures, shutoff the unit and record the stop time.
13. Stop VI and save file. Loading sequence – 26 Load points – 20 seconds each

55
1. Max load 2. No load 3. Max load 4. No load 5. ¾ load 6. No load 7. ¾ load 8. No load 9. ½ load 10. No load 11. ½ load 12. No load 13. ¼ load 14. No load 15. ¼ load 16. No load 17. Max load 18. No load 19. ¼ load 20. ½ load 21. ¾ load 22. Max load 23. ¾ load 24. ½ load 25. ¼ load 26. No load
56
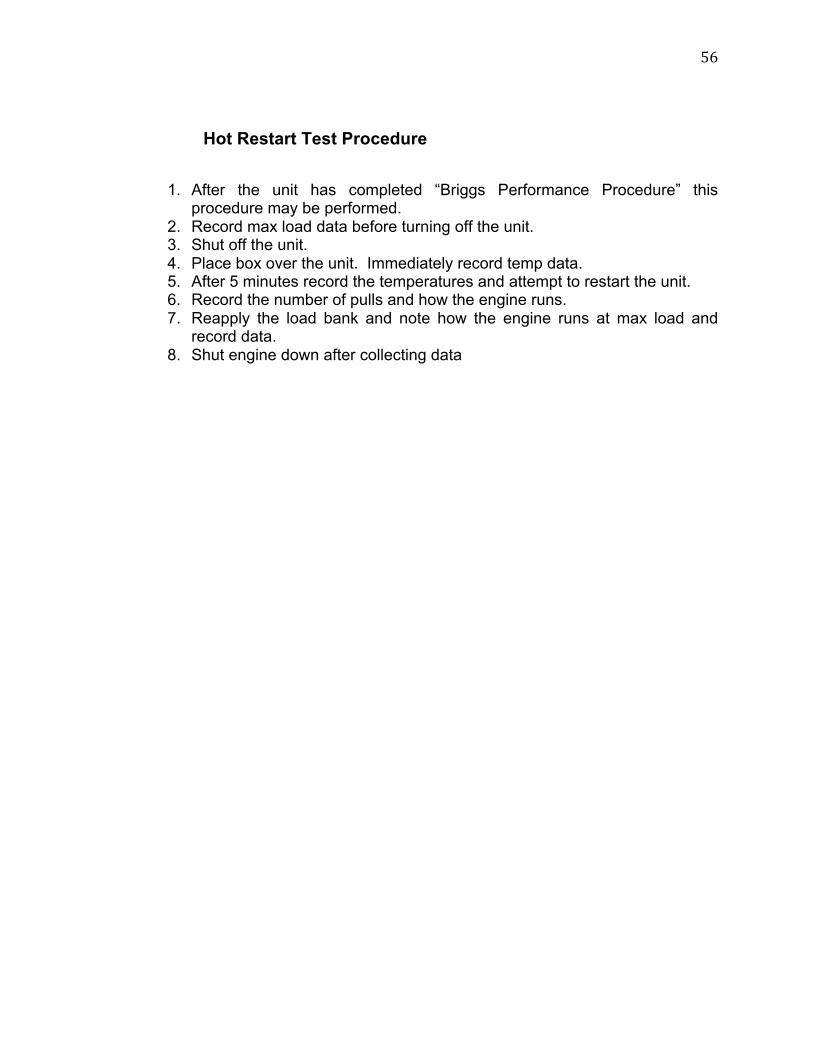
Hot Restart Test Procedure
1. After the unit has completed “Briggs Performance Procedure” this procedure may be performed.
2. Record max load data before turning off the unit. 3. Shut off the unit. 4. Place box over the unit. Immediately record temp data. 5. After 5 minutes record the temperatures and attempt to restart the unit. 6. Record the number of pulls and how the engine runs. 7. Reapply the load bank and note how the engine runs at max load and
record data. 8. Shut engine down after collecting data
57
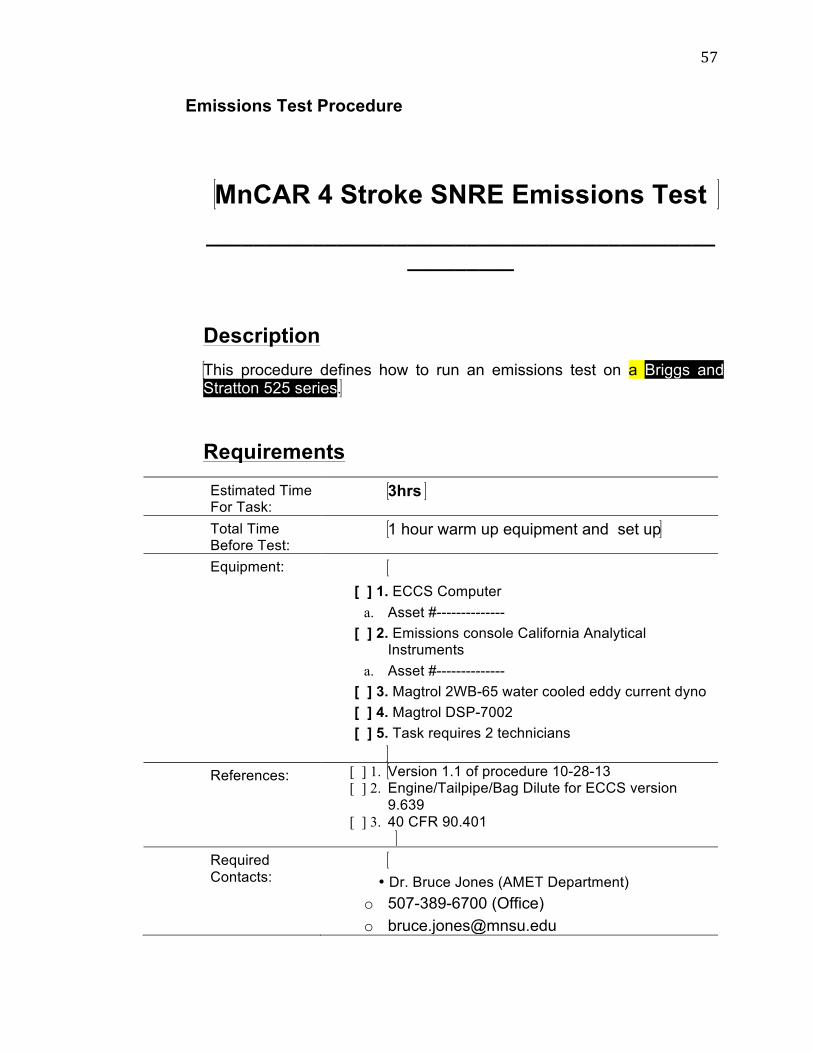
Emissions Test Procedure
MnCAR 4 Stroke SNRE Emissions Test ___________________________________________
_________
Description This procedure defines how to run an emissions test on a Briggs and Stratton 525 series.
Requirements Estimated Time For Task:
3hrs
Total Time Before Test:
1 hour warm up equipment and set up
Equipment: [ ] 1. ECCS Computer
a. Asset #-------------- [ ] 2. Emissions console California Analytical
Instruments a. Asset #--------------
[ ] 3. Magtrol 2WB-65 water cooled eddy current dyno [ ] 4. Magtrol DSP-7002 [ ] 5. Task requires 2 technicians
References: [ ] 1. Version 1.1 of procedure 10-28-13
[ ] 2. Engine/Tailpipe/Bag Dilute for ECCS version 9.639
[ ] 3. 40 CFR 90.401
Required Contacts:
• Dr. Bruce Jones (AMET Department)
o 507-389-6700 (Office) o [email protected]

58
• Mr. Paul Steevens (AMET Department) o 507-389-1176 (Office) Wissink Hall 220 o [email protected]
Calibrations Needed:
Zero and Span Emissions Bench Dyno Load cell
Set up
[ ] 4. Emission console needs to be warmed up 1 hour with FID(HC analyzer) on. [ ] 5. Calibrate Eddy Current dyno load cell- See calibration Procedure [ ] 6. Set up the engine to be tested on the Magtrol Dyno [ ] 7. Make all necessary connections in the dyno controller, and verify function [ ] 8. Determine Data Log file path on the Magtrol Computer
Procedure
[ ] 1. Computer log in: [ ] 2. ECCS [ ] 3. ECCS1234 [ ] 4. [ ] 5. Fill out MNCAR CORE log sheet [ ] 6. Turn on Emissions Console by opening right hand side lower door and
switching white circuit breaker CB1 and CD2 up. [ ] 7. Switch on each analyzer individually with the switch on the back side by
opening the back doors of the analyzer. [ ] 8. Turn on bottle number 26 zero air or if using the ZAG upstairs don’t turn
on 26 [ ] 9. Record pressures on clip boards for each tank as used [ ] 10. Turn on bottle number 23 FID fuel [ ] 11. Turn on bottle number 21 zero nitrogen [ ] 12. Turn on bottle number 22 for 100% O2 for ozone have extra bottle [ ] 13. To light the FID
A. When the analyzers startup they are at the Measurement window B. Go to diagnostic by pressing [F3] and see that oven is at 100C C. Push button [MAIN] to get to the Main menu, and then push [F8] to Ignite and watch the gas pressure build up and voltage climb to show gas is flowing. Not to exceed 8 volts, 9 is max D. From the analyzer main menu push [F3] for Diagnostics and see if burner temp climbs to 300-360 degrees C

59
[ ] 14. Wait 1 hour [ ] 15. -- [ ] 16. (Can be completed while waiting for bench warm up) Click on the ECCS
icon on the desktop [ ] 17. Select yes for PID loop control [ ] 18. Click “engine test results” shortcut on the desktop: create folder for tests [ ] 19. Copy the test folder address so it can be pasted later [ ] 20. Click on the “testing” drop down menu to log on: ECCS, ECCS [ ] 21. Click on the “testing” drop down menu and select “data logging” [ ] 22. Once in the “Bench Data Logging” window, deselect the “Engine” and
“Tailpipe” boxes [ ] 23. Click the “Parameters” button within the “Bench Data Logging” window [ ] 24. Paste the test folder address into the “data file path” location [ ] 25. Fill out the “Data File Name Prefix” for the desired name [ ] 26. Select the Sample Rate: 1 sample per second [ ] 27. Close “Parameters” window [ ] 28. --- [ ] 29. ZERO-SPAN [ ] 30. Turn all bottles on, the blue tape-marked on the pressure gauge
represents the bag dilute bench bottles, that need to be on [ ] 31. Under the main software window click on the “Bag/Dilute Bench”
analyzer to be adjusted. (HC, NOx, CO(l), C02, CO(h)) in grey bars [ ] 32. Once the Specific analyzer window is opened, check on the range to be
selected (the highest range first) [ ] 33. Click the Operation Button [ ] 34. In the “Operation Control” Window select span [ ] 35. Wait for the number in the selected analyzer to stabilize, keep an eye
on it to make sure that it is in fact stabilized. The number is in the main software window.
[ ] 36. Once the number is actually stabilized, click the “Set Virtual Span” button In the “Operation Control” Window
[ ] 37. Make sure that the number is still stabilized ( no longer going down or up)
[ ] 38. If stabilization does not occur, check the bottle is on, and pilot light is lit [ ] 39. In the “Operation Control” window select “standby” [ ] 40. In the “Operation Control” window select “zero” [ ] 41. Wait for the number in the selected analyzer to stabilize around
“0.00”, keep an eye on it to make sure that it is in fact stabilized. The number is in the main software window.
[ ] 42. Once the number is stabilized click “set virtual zero”. [ ] 43. Close the “Operation Control” Window [ ] 44. You have now Zero and Span calibrated ONE range on ONE given
analyzer, this process must be repeated for EVERY analyzer on EVERY range. (HC, NOx, CO(l), C02, CO(h)) or the ones that you need
[ ] 45. Repeat steps 32-43 until this task is completed, takes 30 minutes [ ] 46. –

60
[ ] 47. – Testing:
[ ] 48. Select proper critical flow venturi size: for the 4-Stroke SNRE’s :194cfm. Do this by changing the valves upstairs.
[ ] 49. Turn on the Exhaust Blower that pulls the sample, the switch is located on the south wall upstairs
[ ] 50. In the “Bench Data Logging” window enter in Technician name and file name.
[ ] 51. Start the engine, warm it until it reaches thermal stability at each Mode. Each test consists of:
• Ambient sample • Mode 1 sample • Ambient sample • Mode 2 sample • Ambient sample • Mode 3 sample • Ambient Sample • Mode 4 Sample • Ambient Sample • Mode 5 Sample • Ambient Sample • Mode 6 Sample
This will test will be repeated twice more [ ] 52. Click “Begin” to start Data Logging [ ] 53. Click “End” to stop Data Logging [ ] 54. Sample at each mode for 4 minutes [ ] 55. Record Zero and Span

61
Dynamometer Calibration Procedure
Magtrol Eddy Current Dynamometer Calibration Procedure
____________________________________________________
Description
This procedure defines how calibrate Magtrol 2WB-65 water cooled eddy current dynamometer..
Requirements
Estimated Time For Task:
30 minutes
Equipment:
[ ] 6. Magtrol 2WB-65 water cooled eddy current dyno
[ ] 7. Magtrol DSP-7002
[ ] 8. Magtrol Computer a) Asset #__________
[ ] 9. 4kg & 2kg calibrated weights
[ ] 10. Calibration arms
[ ] 11. String for hanging weights
References: [ ] 9. 40 CFR 90.401
Required Contacts:
Dr. Bruce Jones (AMET Department)
o 507-389-6700 (Office)
• Mr. Paul Steevens (AMET Department)
o 507-389-1176 (Office) Wissink Hall 220

62
Calibrations Needed:
Dynamometer load cell
Set up
[ ] 1. Retrieve weights, string, and calibration arms from tool box located under hysteresis dynamometer
[ ] 2. Boot up Magtrol computer
Procedure
[ ] 56. Computer log in:
[ ] 57. Username:
[ ] 58. Password:
[ ] 59. Plug dyno in.
[ ] 60. Ensure dyno communication cables are attached to rear of Magtrol DSP7000.
[ ] 61. Power up DSP7000 dyno controller.
[ ] 62. Start “M-Test 7” from the desktop.
[ ] 63. Select “Load Setup” under Startup tab.
[ ] 64. Select “EDDY CURRENT.MSF.”
[ ] 65. Switch to Configure Hardware tab.
[ ] 66. Select channel 1, then change “Display Torque” to N-M.
[ ] 67. Switch to Configure test tab.
[ ] 68. Change test type from “Manual” to “Calibration Display.”
[ ] 69. Under the Data Logging section click “Data” and find preferred output folder, then select “Current Folder.”
[ ] 70. Select “Save setup.”
[ ] 71. Select “Overwrite” when prompted.

63
[ ] 72. Switch to TEST tab.
[ ] 73. Thread calibration arms completely into threaded holes opposite each other on dynamometer.
[ ] 74. Torque reading should be within .01 N-M of 0. If more than .01 N-M out, use flat head screwdriver in hole marked “Zero” in blue box under dyno to bring number as close as possible to 0.
[ ] 75. Hang 2kg weight on portion labeled “N-M” on arm, starting with CW side. (CW when looking at dyno face).
[ ] 76. Click “Start test” on Magtrol software.
[ ] 77. Torque should read approximately 10 N-M with 2kg weight attached.
[ ] 78. If not within .01 N-M of 10, use flat head screwdriver inserted into hole labeled CW in blue box under dyno to dial number in as close as possible.
[ ] 79. Remove 2kg weight from CW arm and hang 4kg weight from same position on CW arm.
[ ] 80. Torque should now read within .01 N-M of 20 N-M. If not, adjust CW setting in blue box.
[ ] 81. Remove string and 4kg weight from CW side.
[ ] 82. Repeat process with 2kg and 4kg weights on CCW side, adjusting if necessary.
[ ] 83. When CCW side is calibrated, remove weight, string, and both calibration arms and return to toolbox under hysteresis dynamometer.

64
Aging Notes
• BS-2, running on E15, was showing signs of poor performance during the 30-31.7 hr. mark of aging. The engine would not achieve high idle, nor would it exhibit acceptable performance when loaded( half or full). Up until this point the engine exhibited acceptable and consistent performance. The engine was taken out of aging and the carb was inspected. The carb showed no signs of excessive buildup or sediment. The fuel passageways looked clear. Slight air was forced through some passageways (blowing on them), and the carb was reinstalled. The engine was placed back in aging and showed acceptable performance once again.
• BS-3 sheered the exhaust studs off at 15.3 hrs. The muffler was replaced with part number 394569S and an array of piping.
• BS-11 Leaked oil at 16.4 hrs. from the oil drain tube. • BS-11 Sheared coupler bolts at 20 hrs, coupled to genhead E, the
coupler was also damaged, and the engine stand weld broke. The exhaust studs stripped from the head. The stand was repaired, the coupler was replaced, the muffler was replaced with part number 394569S.
• BS-10 sheared a coupler bolt, and broke a coupler. At hour 29. • BS-1, at hour 34, backed the screw out of the throttle blade. The screw
ended up resting on the intake valve, while the throttle blade was stuck in the intake runner. A new screw was “locktited” in and was peened.
• BS-3 rounded the keyway on the PTO shaft. The keyway on the coupler was subsequently damaged as well. A new keyway was cut on the PTO shaft on the engine as well as the coupler.
• BS-2 lost all of its oil at 90.8 hours due to the oil drain braking while the engine was running. It was shut down before all oil was lost. Weighed-in oil amount = 526g. Engine was started up and seemed to operate normally.
• BS-4, during midlife testing (62.5hrs) seems to be substantially low on power. Also emissions show that it may be low on compression.

65
Disassembly Pictures Carburetors

66
Cylinder Head

67
Piston/Valves

68
Disassembly Measurements

69

70

71

72
General Pictures
Picture 1 shows the aging apparatus.
Picture 2 shows the engines on the aging apparatus and the load being
switched by the circuitry.

73
Picture 3 shows the engine being tested on the dynamometer.
Picture 4 shows a retrofitted muffler after the original had failed.