Embed Size (px)
Citation preview

Proceedings of the 6th International Conference of the Asian Academy of Applied Business (AAAB) 2013
1
THE EFFECTS OF MULTIPLE PERFORMANCE MEASURES USAGE ON SME‘S PERFORMANCE: EVIDENCE FROM THE MANUFACTURING SECTOR SMES IN SABAH
Kamiliah Sulimat Commerce Department Politeknik Kota Kinabalu
Sabah, Malaysia
Assoc. Prof. Dr. Rasid Mail Assoc. Prof. Dr. Raman Noordin
School of Business and Economics Universiti Malaysia Sabah
Sabah, Malaysia
Corresponding email: [email protected]
ABSTRACT
This study attempts to contribute to the body of knowledge in the area of performance measurement systems from developing country‘s perspective in general and Malaysia in particular. This study focuses on issues relating to multiple performance measures, which are conceptualized according to the Balanced Scorecard (BSC) framework. Specifically, this study aims to investigate empirically the extent of multiple performance measures usage in SME manufacturing sector in Sabah. The consequences of the performance were explored by investigating the effects of multiple performance measures usage on SME performance. The current research using a personally administered questionnaire of SME manufacturing companies listed in the SME Corporation Databases, year 2011. SME manufacturing companies located in Sabah with at least 5 employees and annual sales of at least RM250, 000 were selected. A total of 56 usable responses were gathered and used in the data analysis. From the survey, it apparent that majority of the SMEs in the manufacturing sector in Sabah are more concentrate on financial measures usage. The findings suggest that the use of innovation and learning measures is associated with SME‘s performance. Key words: Performance Measures, Balanced Scorecards, Multiple Performance Measures, SME, Sabah INTRODUCTION
Performance measurement has been an importance topic in the study of Management Control Systems (MCS). As a fundamental building block of Total Quality Management, performance measurement still remains an essential and much debated among researchers, academicians and practitioners. Neely, Gregory and Plats (1995) defined performance measurement as the process of quantifying the efficiency and effectiveness of action. Performance measurement is a continuous system for determining whether organisations meet objectives towards their pre established goals activities (Atkinson, Waterhouse and Wells, 1997). The role of performance measurement system is crucial for an organization as it functions in developing strategic plans, evaluating the organization‘s objectives achievement, and compensating managers (Ittner and Larcker, 1998).
The progress of the literature relating to the performance measurement consists of two main phases; in the late 1880s and went through the 1980s (Ghalayini and Noble, 1996). In the first phase,
Proceedings of the 6th International Conference of the Asian Academy of Applied Business (AAAB) 2013
2
organisations have always measured performance through the traditional financial performance measure such as profit, return on investment and productivity. In the late 1980s, the second phase started as a consequent changes in the world market. At that time, competition was more challenging and companies shifted their strategic priorities and implemented new technologies and philosophies of production management to sustain their resilient and competitiveness. As a result, the demand for development of new performance measurement systems is required since the limitations of the financial traditional measurement have been revealed from the implementation of these changes.
Review of the literature reveals that the criticism on traditional performance measures that was developed from costing and accounting systems have been increasing at that time (Johnson and Kaplan, 1987; Hayes and Abernathy, 1980; Hayes and Garvin, 1982; Kaplan and Norton, 1992; Atkinson et al., 1997). Ghalayini and Noble (1996: 77) found that the traditional performance measures was less applicable at that day‘s competitive market due to many limitations identified and quoted that the traditional performance measures ―...are based on outdated traditional cost management systems, lagging metrics, not related to corporate strategy, inflexible, expensive and contradict continuous improvement‖. Later, Neely (1999) suggested that there were seven main reasons that brought to the performance revolution at that time which were; the changing nature of work; increasing competition; specific improvement initiatives; national and international awards; changing organisational roles; changing external demands; and the power of information technology. As a result, many researchers suggested that the new performance measures approach should be implemented (e.g. Eccles, 1991; Ghalayini and Noble, 1996; Atkinson et al., 1997). In particular, Ghalayini and Noble (1996) agreed that managers, supervisors and operators should provided with on time information for daily decision making. For that purpose, it could be achieved by these measures which were flexible, primarily non-financial, and able to be changed as needed. Consequently, Kaplan and Norton (1992) introduced the concept of balanced Scorecard (thereafter refers as BSC) that recognises the limitation of traditional financial measures.
It is apparent from the performance measurement literature that the use of multiple performance
measures is important to organization‘s competitiveness. The multiple performance measures conceptualization from BSC is one of the tools for performance improvement, as part of a performance measurement framework. However, review of the literature shows that the BSC papers in leading small business journals or entrepreneurship are still limited (Gumbus and Lussier, 2006). Thus, motivated by current development in Malaysia as quoted the Message from YAB Prime Minister ‗…as the contribution of SMEs to the economy is still under-represented when compared with more developed economies‘ (SME Annual Report 2009/10, the research attempts to explore the multiple performance measures from Malaysian perspective. Particularly, in line with the background discussed above, the study is trying to investigate the extent of usage of multiple performance measures in SME manufacturing companies in Sabah, and whether it is related towards SMEs performance. Based on the underlying problems presented above, the study attempts to answer the following research questions: a) What is the extent of use of the multiple performance measures amongst SMEs in Sabah? b) What is the effect of multiple performance measures usage on SME‘s performance? Thus, to answer the research questions identified, the following research objectives are sought: a) To investigate the extent of multiple performance measures usage among SME in Sabah. b) To investigate the effect of multiple performance measures usage on SMEs performance.
The current research attempts to contribute to the current performance measurement systems from both theory and practical perspectives. Firstly, the attempts to investigate the extent of multiple performance measures usage and the performance consequences among SME‘s manufactures in Sabah will contribute to the empirical research literature from Malaysia‘s perspectives. Secondly, the attempts to investigate the extent on the usage of the multiple performance measures amongst SME in manufacturing sector in Sabah will provide some evidence for SME owners on the use of multiple performance measures. Finally, by exploring the performance consequences of multiple performance measures usage, suggestions

Proceedings of the 6th International Conference of the Asian Academy of Applied Business (AAAB) 2013
3
could arise to the ministries and agencies that involved in SME development programmes and training to assist SME towards improving their performance, growth and competitiveness.
Having discussed the above, this study attempts to contribute to the body of knowledge in the area of performance measurement systems from developing country‘s perspective in general and Malaysia in particular. This study focuses on issues relating to multiple performance measures, which are conceptualized according to the BSC framework. The BSC simplicity, generally accepted among practitioners and researchers, and it associates with the strategy (Kaplan and Norton, 1996a) are the reasons that lead to the selection of the BSC as a framework. Specifically, this study aims to investigate empirically the extent of multiple performance measures usage in SME manufacturing sector in Sabah. The performance consequences will be explored by investigating the effect of multiple performance measures usage on SME performance. LITERATURE REVIEW
In recent years, academicians and practitioners from various disciplines have long recognized the importance of performance measurement. In early performance management practices, such indicators of performance were highlighted. For example, Hopwood (1972) established three special evaluative styles used by senior managers in holding subordinates accountable for their performance named Budget-Constrained style, Profit-Conscious style and Non-Accounting style. At a time, performance measurement has become so topical (Neely, 1999). Research in performance measurement has been drawn from operations and production management to management accounting (Neely et al., 1995; Neely 2005). Performance measurement provides and associates related information for decision making to be viewed as the crucial tool of performance management (Bititci, Carrie and McDevitt, 1997). Likewise, quoted Lord Kelvin says ―If you cannot measure it, you cannot improve it‖ in their paper, Pavlov and Bourne (2011) pointed that performance measurement has become a strong element of performance management. In management accounting field, performance measurement has been an important topic in the study of Management Control Systems (MCS).
Kaplan and Norton (1992) introduced the BSC in 1992 at Harvard Business Review. According to them, they come out with a set of measures that accommodates top managers with ‗a quick but comprehensive view of the business‘ named ―balanced scorcecard‖ during a year-long research project with 12 companies at the leading edge.The BSC that integrated financial and non-financial measures looked at the organisations from customer perspective, internal business process perspective, innovation and learning perspective, and financial perspective (Kaplan and Norton, 1992). The concept of the BSC has evolved over the years from performance measurement system to strategic management system (Kaplan and Norton, 1996b). BSC did not only play a role as a measurement tool, however; it is also a management control system that effectively linked the strategic and operational activities of the company (Kaplan and Norton, 2001). The BSC introduced way to overcome the shortcomings of traditional financial measures that has a major impact, growing important among researchers, academician and practitioner. Marr and Schiuma (2003) stated that BSC seems to be the most influential concept in the business performance measurement based on the citation analysis. Over the years, researchers provided empirical evidence on the linkage between BSC and performance (e.g. Brewer and Speh, 2000; Hoque and James, 2000; Lipe and Salterio, 2000; Hoque, 2004; Hoque, 2005; Waal, Kourtit and Nijkamp, 2009; Ruzita Jusoh, Daing Nasir Ibrahim, Yuserrie Zainuddin, 2008; Mahfud Sholihin, Pike and Musa Mangena, 2010). In Malaysia, the companies that have adopted the BSC were limited (Ruzita Jusoh et al., 2008; Rozhan Othman, 2006). The study in among Malaysian manufacturers by Ruzita Jusoh et al. (2008) found that many Malaysian companies focused more on the use of financial measures rather than non-financial measures.
Despite the interest in the BSC, there has been a criticism in the BSC and it continues until recently. To mention a few, according to Norreklit (2000), BSC has problems with some of its key assumptions and relationships. Chan (2004) found that the use of BSC was limited based on the survey of municipal government in the USA and Canada. Johanson, Skoog, Backlund and Almqvist (2006) suggested that there
Proceedings of the 6th International Conference of the Asian Academy of Applied Business (AAAB) 2013
4
an essential for further debate and research on BSC after raising perceived dilemmas and its effect of implementation on the use of the BSC. Adding to the criticism, the study in German non-profit organizations revealed that the BSC is often used as a measurement tool and not as a management system (Greiling, 2010).
Up to date, BSC has gained the encouraging attention and widely used. In line with these developments, SMEs are not left out and many researchers were interested to look at the SME and BSC linkage. For example, some studies found that BSC which been designed in large organizations was possible to implement within SMEs context (Manville, 2007; Rickards, 2007). Andersen, Cobbold and Lawrie (2009) showed how BSC implementations in SMEs benefited to SMEs as large organizations. In the other hand, McAdam (2000) presented that SMEs faced number of problems when applied the BSC in SMEs as developed in large organizations. Fernandes, Raja, and Whalley (2006: 633) noted that ―... in implementing BSC, organization faced more behavioural and management related challenges than pure glitches such as number of KPI or formula for Economic Value Addition (EVA)‖. Despite widespread interest in non-financial measures, is not surprising when study by Sousa, Aspinwall, and Rodrigues (2006) shows that financial measures more widely used in SME. METHODOLOGY The current research focuses on SME in manufacturing sector including agro-based and Manufacturing-Related Services (MRS) in Sabah. SME in manufacturing companies with employees of more than 5 and annual turnover of more than RM250, 000 will be selected as the study‘s population. Manufacturing companies was chosen because it is apparent from the literature review that the use of performance system in this sector is generally common. The current research using a personally administered questionnaire of SME manufacturing companies listed in the SME Corporation Databases, year 2011. The target population of the current research was 140 SMEs. Out of 140 SMEs identified in the list, 26 SMEs could not be traced or no longer in business, thus leaving 114 as potential respondents. Questionnaires were personally sent to all the 114 respondents. Out of 114 respondents, 27 respondents were refused to participate in the survey immediately when approached for the first time. The two main reasons identified for the declination to participate were reluctance to release SME‘s information and lack of time. 31 respondents were not returned the questionnaires despite all the data collection procedures such as sending reminders and revisit the SMEs to increase the response rate. A total of 56 SMEs were interviewed and this had mad-up an overall response rate of 40 percent. All The 56 questionnaires were completed and used in the data analyses. The 56 responses may seem to be a small number, but current research response rate (40%) was higher if compared with previous research carried out in SME. For example, M. Sambasivan, Mohani Abdul and Yuzliani Yusop (2009) achieved a response rate of 19 percent in their research which also in the manufacturing SMEs in Malaysia. The common test of comparing early and late responses did not performed since the personally administered is applied for the current research (Armstrong and Overton, 1977). The final sample in this research consisted of 56 manufacturing SMEs operating in Sabah. Their general background is summarised in Table 1. Table 1: The General Characteristics of 56 Responding SMEs
Characteristics Categories Frequency Percent
Sample Profile Years in Operation Less than 5 year 11 19.6
5 to 15 years 22 39.3 More than 15 years 23 41.1
SME‘s Ownership Sole proprietary 19 33.9 Private limited 37 66.1

Proceedings of the 6th International Conference of the Asian Academy of Applied Business (AAAB) 2013
5
SME‘s Activity Animal Feed 1 1.8 Building Materials 3 5.4 Fertilizers 1 1.8 Food and Beverages 33 58.9 Furniture 2 3.6 Metal Products 6 10.7 Palm oil based products 1 1.8 Personal care products 1 1.8 Plastic Products 4 7.1 Transport Equipments 1 1.8 Wood and wood products 3 5.4
Average Annual Sales RM250, 000 & less than RM10 million 37 66.1 RM10 million & less than RM25 million 19 33.9 Full time employee 5 – 49 employees 35 62.5 50 – 149 employees 21 37.5 Quality System Held certified quality system 33 58.9 Not held certified quality system 23 41.1 Respondent Profile Position Owner 17 30.4 Manager 39 69.6 Experience Less than 2 year 9 16.1 2 – 4 years 13 23.2 5 – 7 years 13 23.2 More than 7 years 21 37.5
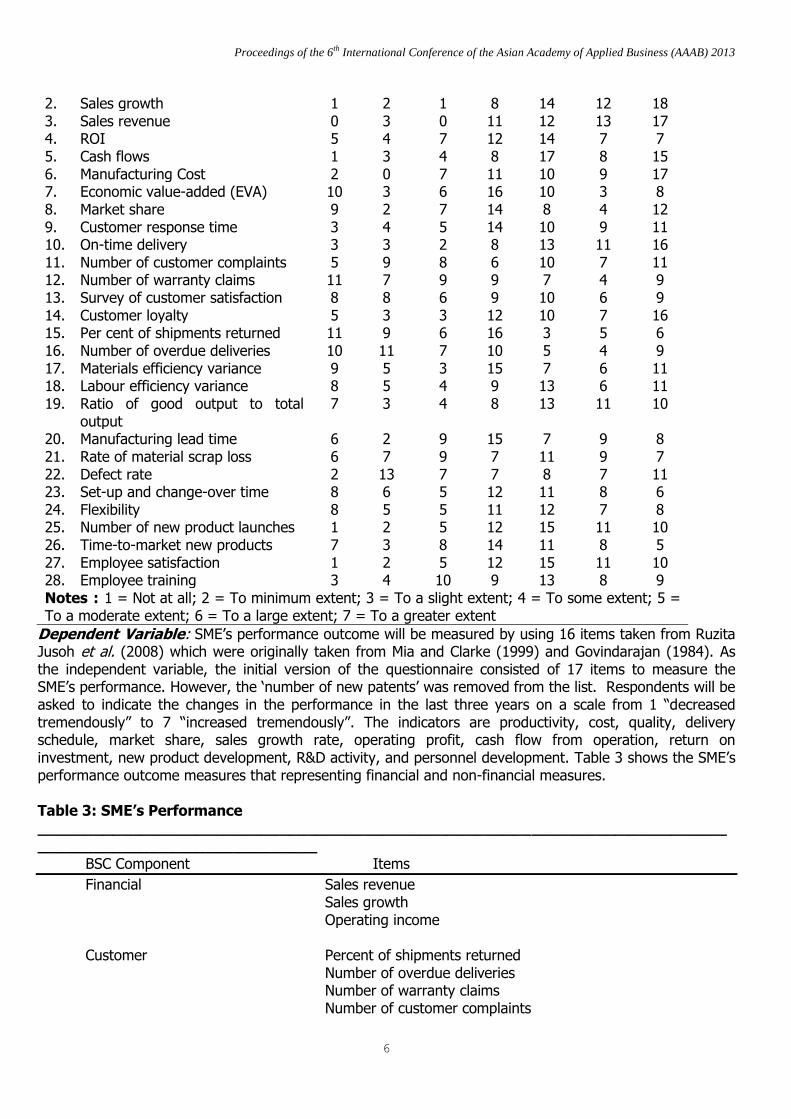
Measurement of Variables Independent Variable: Multiple performance measures usage that conceptualized from BSC will be measures by using a total of 28 performance measures representing financial and non-financial measures (Table 2). All of the items were taken from Ruzita Jusoh et al. (2008). Particularly, Ruzita Jusoh et al. (2008) referring to the work of Hoque et al. (2001) and Kaplan and Norton (1992). The initial version of the questionnaire consisted of 29 items. However, after taking the opinion from the respondents during the pilot study, the ‗number of new patents‘ was removed from the list since most of the targeted SMEs are not been able to patent their products for the time being. The items are considered as generic measures and commonly used by manufacturing firms. To investigate the extent of performance measures usage among SME, a seven-point Likert-type will be used. The scale ranging will be, 1 (Not at all); 2 (To minimum extent); 3 (To a slight extent); 4 (To some extent); 5 (To a moderate extent); 6 (To a large extent); and 7 (To a greater extent). Table 2: Frequency of Multiple Performance Measures Usage
No Performance Measures Frequency 1 2 3 4 5 6 7
1. Operating income 2 2 4 10 7 13 18
Proceedings of the 6th International Conference of the Asian Academy of Applied Business (AAAB) 2013
6
2. Sales growth 1 2 1 8 14 12 18 3. Sales revenue 0 3 0 11 12 13 17 4. ROI 5 4 7 12 14 7 7 5. Cash flows 1 3 4 8 17 8 15 6. Manufacturing Cost 2 0 7 11 10 9 17 7. Economic value-added (EVA) 10 3 6 16 10 3 8 8. Market share 9 2 7 14 8 4 12 9. Customer response time 3 4 5 14 10 9 11 10. On-time delivery 3 3 2 8 13 11 16 11. Number of customer complaints 5 9 8 6 10 7 11 12. Number of warranty claims 11 7 9 9 7 4 9 13. Survey of customer satisfaction 8 8 6 9 10 6 9 14. Customer loyalty 5 3 3 12 10 7 16 15. Per cent of shipments returned 11 9 6 16 3 5 6 16. Number of overdue deliveries 10 11 7 10 5 4 9 17. Materials efficiency variance 9 5 3 15 7 6 11 18. Labour efficiency variance 8 5 4 9 13 6 11 19. Ratio of good output to total
output 7 3 4 8 13 11 10
20. Manufacturing lead time 6 2 9 15 7 9 8 21. Rate of material scrap loss 6 7 9 7 11 9 7 22. Defect rate 2 13 7 7 8 7 11 23. Set-up and change-over time 8 6 5 12 11 8 6 24. Flexibility 8 5 5 11 12 7 8 25. Number of new product launches 1 2 5 12 15 11 10 26. Time-to-market new products 7 3 8 14 11 8 5 27. Employee satisfaction 1 2 5 12 15 11 10 28. Employee training 3 4 10 9 13 8 9 Notes : 1 = Not at all; 2 = To minimum extent; 3 = To a slight extent; 4 = To some extent; 5 = To a moderate extent; 6 = To a large extent; 7 = To a greater extent
Dependent Variable: SME‘s performance outcome will be measured by using 16 items taken from Ruzita Jusoh et al. (2008) which were originally taken from Mia and Clarke (1999) and Govindarajan (1984). As the independent variable, the initial version of the questionnaire consisted of 17 items to measure the SME‘s performance. However, the ‗number of new patents‘ was removed from the list. Respondents will be asked to indicate the changes in the performance in the last three years on a scale from 1 ―decreased tremendously‖ to 7 ―increased tremendously‖. The indicators are productivity, cost, quality, delivery schedule, market share, sales growth rate, operating profit, cash flow from operation, return on investment, new product development, R&D activity, and personnel development. Table 3 shows the SME‘s performance outcome measures that representing financial and non-financial measures. Table 3: SME’s Performance ________________________________________________________________________________________________________
BSC Component Items
Financial Sales revenue Sales growth Operating income Customer Percent of shipments returned Number of overdue deliveries Number of warranty claims Number of customer complaints

Proceedings of the 6th International Conference of the Asian Academy of Applied Business (AAAB) 2013
7
On-time delivery Customer response time Survey of customer satisfaction Internal Business Process Manufacturing lead time/cycle time Ratio of good output to total output Labour efficiency variance Flexibility Innovation and Learning Time-to-market new products Number of new product launches _______________________________________________________________________________________________ Source: Ruzita Jusoh et al. (2008)
FINDINGS Descriptive Analysis As been mentioned earlier, the first objective of this study is to investigate empirically the extent of multiple performance measures usage in SME manufacturing sector in Sabah. Thus, the descriptive statistics for all multiple performance measures was performed to see their frequencies of use (Table 2). As expected, the usage of financial measures such as sales revenue, sales growth, operating income and cash flows dominated the ‗to some extent‘ to ‗to a greater extent‘. Surprisingly, the usage of number of overdue deliveries; number of warranty claims and percent of shipments returned; number of customer complaints; and survey of customer satisfaction lead the range ‗not at all‘ to ‗to a slight extent‘; indicates that customer measures were not frequently used in responding SMEs.
Table 4 shows the descriptive statistics on minimum, maximum, means, and standard deviations values for all 28 performance measures. The rank in the table shows that the financial measures are the top three of the list while the customer measures are the bottom three. Descriptive Statistics on the four multiple performance measures usage presented in table 5. It shows that the financial measures had the highest mean value (4.8973), followed by innovation and learning (4.4152), internal business process (4.2701), and customer (4.2522). The results indicated that responding SMEs were putting a major weight on their financial measures. The results of the reliability analysis for the research are summarised in table 5. The cronbach‘s alphas values of all dimensions of multiple performance measures usage are higher than the minimum threshold (cronbach‘s alpha >0.7) suggested by Hair et al. (2006).
Table 4: Descriptive Statistics of Multiple Performance Measures Usage (before factor analysis)
Performance Measures Minimum Maximum
Mean Std. Deviation
Sales growth 1 7 5.50 1.452 Sales revenue 2 7 5.48 1.388 Operating income 1 7 5.30 1.683 Manufacturing Cost 1 7 5.18 1.630 On-time delivery 1 7 5.18 1.728 Cash flows 1 7 5.16 1.558 Employee satisfaction 1 7 4.98 1.458

Proceedings of the 6th International Conference of the Asian Academy of Applied Business (AAAB) 2013
8
Customer loyalty 1 7 4.86 1.911 Customer response time 1 7 4.70 1.736 Ratio of good output to total output
1 7 4.61 1.932
Employee training 1 7 4.52 1.727 Labour efficiency variance 1 7 4.36 2.022 ROI 1 7 4.34 1.740 Manufacturing lead time 1 7 4.32 1.810 Number of customer complaints 1 7 4.29 2.006 Market share 1 7 4.25 2.020 Defect rate 1 7 4.23 1.991 Materials efficiency variance 1 7 4.21 2.051 Flexibility 1 7 4.20 1.939 Rate of material scrap loss 1 7 4.16 1.905 Time-to-market new products 1 7 4.13 1.759 Set-up and change-over time 1 7 4.07 1.896 Survey of customer satisfaction 1 7 4.05 2.022 Number of new product launches 1 7 4.04 1.819 Economic value-added (EVA) 1 7 3.96 1.916 Number of warranty claims 1 7 3.75 2.074 Number of overdue deliveries 1 7 3.66 2.074 Percent of shipments returned 1 7 3.54 1.935
Table 5: Descriptive Statistics of Multiple Performance Measures Usage (before factor analysis)
Description Minimum Maximum
Mean Std. Deviation
Cronbach Alpha
Financial 1.50 7.00 4.8973 1.32612 0.912 Customer 1.00 7.00 4.2522 1.56097 0.922 Internal Business Process
1.00 7.00 4.2701 1.65278 0.945
Innovation and Learning 1.25 7.00 4.4152 1.31795 0.781 Overall BSC 1.54 7.00 4.4649 1.36616 0.970 Performance 3.38 6.31 4.6228 .59496 0.710
Correlation matrix for all variables is presented in table 6. The result shows that some of BSC dimensions are significantly correlated with each other.
Table 6: Correlation matrix
Description Financial Customer Internal Business Process
Innovation and Learning
Overall BSC
Performance
Financial 1.00 Customer 0.836** 1.00 Internal Business Process
0.791** 0.871** 1.00
Innovation and Learning
0.608** 0.677** 0.746** 1.00
Overall BSC 0.908** 0.953** 0.952** 0.785** 1.00 Performance 0.214 0.263 0.263 0.381** 0.263 1.00

Proceedings of the 6th International Conference of the Asian Academy of Applied Business (AAAB) 2013
9
.** Correlation is significant at the 0.01 level (2-tailed)
Hypothesis testing
In order to test the effect of the usage of four dimensions of BSC measures on SMEs performance, the following multiple regression was carried out.
Y = b0 + b1 X1 + b2 X2 + b3 X3 + b4 X4 +e
Where, Y = Performance; X1 = Financial measures; X2 = Customer measures; X3 = Internal business process measures; X4 = Innovation and learning measures; e= error term; b0 = the intercept; b1, b2, b3 and b4 = the regression coefficients for the four dimensions of the BSC measures.
The results displayed in table 7 suggest that only the innovation and learning have a positive effect towards performance (b=0.522, t=2.758, p=0.008). The model is significant and explains 19.6 percent of the performance variance. However, the results show that the usage of financial measures, customer measures and internal business process measures are not positively associated with SME‘s performance. Table 7: Regression analysis (Individual BSC measures and SME’s performance)
Description Beta t-value p-value
Financial 0.15 0.063 0.95 (not significant)
Customer 0.343 1.168 0.258 (not significant)
Internal Business Process -0.512 -1.768 0.083 (not significant)
Innovation and Learning R square= 0.196
0.522 F=3.113
2.758 Significant = 0.023
0.008 (significant)
The regression analysis to test the effect of overall BSC measures toward SME‘s performance was carried out (Table 8). The result revealed that the overall multiple performance measures usage is not associated with SME‘s performance. Table 8: Regression analysis (Overall BSC measures and SME’s performance)
Description Beta t-value p-value
Overall BSC measures R square= 0.069
0.263 F=4.001
2.000 Not significant = 0.051
0.051 (not significant)
DISCUSSION AND CONCLUSION The current research has investigated the extent of multiple performance measures usage and their effect on SME‘s performance. Based on the survey, majority of SMEs in the manufacturing sector in Sabah are more concentrate on the use of financial measures. The result with regard to highly usage in financial measures is consistent with the findings from Ruzita Jusoh et al. (2008) and Rozhan Othman (2006) which reported that many Malaysian companies are more focused on the use of financial measures as compared to non-financial measures. The result also consistent with the findings from the study by Sousa et al. (2006) that financial performance is widely used in SMEs. The regression results show that innovation and learning measures usage significantly contribute towards SME‘s performance. The results is consistent with Sim and Koh (2001) which reported that new product development and time to market new products are

Proceedings of the 6th International Conference of the Asian Academy of Applied Business (AAAB) 2013
10
associated with performance. However, the results demonstrate that there is no significant effect on financial, customer and internal business process measures usage towards SME‘s performance. Hence, the overall BSC usage was found to have no significant effect on SME‘s performance. The findings are in line with Perera, Harrison and Poole (1997) that found no relationship between the use of non-financial measures and financial performance. Likewise, Ittner et al. (2003) reported that almost no relationship between BSC and economic performance. However, the results should be noted of several limitations. The population is limited to the manufacturer in Sabah and the sample taken only from the SME Corporation databases. The low response rate also limits the statistical power of the statistical results. The performance instrument of the research was adapted from the common large firm performance measures and some of the performance instruments are quite limited in SMEs in Sabah. Future research should investigate larger sample size and concern more on BSC performance measures instrument in SME. REFERENCES Andersen, H., Cobbold, I. and Lawrie, G. 2009. Balanced Scorecard implementation in SMEs: Reflection in
literature and practice. 2GC Conference Paper - Balanced Scorecard implementation in SMEs. Armstrong, J. S. and Overton, T. S. 1977. Estimating non-response bias in mail surveys. Journal of
Marketing Research, 14 (3): 396-402. Atkinson, A.A., Waterhouse, J.H. and Wells, R.B. 1997. A Stakeholder Approach to Strategic Performance
Measurement. Sloan Management Review, 38 (3): 25-37. Bititci,U.S., Carrie, A.S. and McDevitt,L. 1997. Integrated performance measurement systems: an audit and
development guide. The TQM Magazine, 9 (1) : 46-53 Brewer, P.C. and Speh, T.C. 2000. Using the balanced scorecard to measure supply chain performance.
Journal of Business Logistics, 21 (1): 75-93. Chan, Y.C.L. 2004. Performance measurement and adoption of balanced scorecards: a survey of municipal
governments in the USA and Canada. International Journal of Public Sector Management, 17 (3): 204-21.
Definitions for Small and Medium Enterprises in Malaysia. 2005. Bank Negara Malaysia. Eccles, R.G. 1991. The Performance Measurement Manifesto. Harvard Business Review : 131-137. Fernandes, K.J., Raja, V. and Whalley, A. 2006. Lessons from implementing the balanced scorecard in a
small and medium size manufacturing organization. Technovation, 26: 623-634. Ghalayini, A.M. and Noble, J.S. 1996. The changing basis of performance measurement. International
Journal of Operations & Production Management, 16 (8): 63-80. Govindarajan, V. 1984. Appropriateness of accounting data in performance evaluation: an empirical
examination of environmental uncertainty as an intervening variable. Accounting, Organizations and Society, 9 (2): 125-35.
Greiling, D. 2010. Balanced scorecard implementation in German non-profit organisations. International
Journal of Productivity and Performance Management, 59 (6): 534-554.

Proceedings of the 6th International Conference of the Asian Academy of Applied Business (AAAB) 2013
11
Gumbus, A. and Lussier, R.N. 2006. Entrepreneurs Use a Balanced Scorecard to Translate Strategy into
Performance Measures. Journal of Small Business Management, 44 (3): 407-425. Hair, J.F., Black, W.C., Babin, B.J., Anderson, R.E and Tatham, R.L. 2006. Multivariate Data Aanalysis. 6th
edition. Prentice Hall International, Inc. Hayes, R.H. and Abernathy, W.J. 1980. Managing Our Way to Economic Downline. Harvard Business
Review, 54 (4): 67-77. Hopwood, A.G. 1972. Supplement. An empirical study of the role of accounting data in performance
evaluation. Journal of Accounting Research, 10 (3): 156-82. Hoque, Z. 2004. A contingency model of the association between strategy, environmental uncertainty and
performance measurement: impact on organizational performance. International Business Review, 13: 485–502.
Hoque, Z. 2005. Linking environmental uncertainty to non-financial performance measures and
performance: a research note. The British Accounting Review, 37: 471-481. Hoque, Z. and James, W. 2000. Linking Balanced Scorecard Measures to Size and Market Factors: Impact
on Organizational Performance. Journal of Management Accounting Research, 12: 1-17. Ittner, C.D. and Larcker, D.F. 1998. Innovations in performance measurement: trends and research
implications. Journal of Management Accounting Research, 10: 205-38. Johanson, U., Skoog, M., Backlund, A. and Almqvist, R. 2006. Balancing dilemmas of the balanced
scorecard. Accounting, Auditing & Accountability Journal, 19 (6): 842 – 857. Johnson, H.T. and Kaplan, R.S. 1987. Relevance Lost: The Rise and Fall of Management Accounting.
Harvard Business School Press, Boston, MA. Kaplan, R.S. and Norton, D.P. 1992. The Balanced Scorecard: Measures that Drive Performance. Harvard
Business Review, 70 (1): 71-77. Kaplan, R.S. and Norton, D.P. 1996. Using the Balanced Scorecard as a Strategic Management System.
Harvard Business Review, 74: 75-85. Kaplan, R.S. and Norton, D.P. 1996. Linking the Balanced Scorecard to Strategy. California Management
Review, 39 (1): 53-79. Kaplan, R.S. and Norton, D.P. 2001. The Strategy-focused Organization: How Balanced Scorecard
Companies Thrive in the New Business Environment. Harvard Business School Press, Boston, MA. Lipe, M.G. and Salterio, S.E. 2000. The Balanced Scorecard: Judgmental Effects of Common and Unique
Performance Measures. The Accounting Review, 75 (3): 283-208. Mahfud Sholihin., Pike, R., and Musa Mangena. 2010. Reliance on multiple performance measures and
manager performance. Journal of Applied Accounting Research, 11 (1): 24-42. Manville, G. 2007. Implementing a balanced scorecard framework in a not for profit SME. International
Journal of Productivity and Performance Management, 56 (2): 162-169.

Proceedings of the 6th International Conference of the Asian Academy of Applied Business (AAAB) 2013
12
Marr, B. and Schiuma, G. 2003. Business Performance Measurement- Past, Present and Future.
Management Decision, 41 (8): 680-687. McAdam, R. 2000. Quality models in an SME context: A critical perspective using a grounded approach.
International Journal of Quality & Reliability Management, 17 (3): 305-323. Mia, L. and Clarke, B. 1999. Market competition, management accounting systems and business unit
performance. Management Accounting Research, 10: 137-58. M. Sambasivan., Mohani Abdul. And Yuzliani Yusop. Impact of personal qualities and management skills of
entrepreneurs on venture performance in Malaysia: Opportunity recognition skills as a mediating factor. Technovation, 29: 798–805.
Neely, A. 1999. The performance measurement revolution: why now and what next?. International Journal
of Operations & Production Management, 19(2): 205 -228. Neely, A. 2005. The evolution of performance measurement research: developments in the last decade and
a research agenda for the next. International Journal of Operations & Production Management, 25 (12): 1264-1277.
Neely, A., Gregory, M. and Plats, K. 1995. Performance system measurement design: a literature review
and research agenda. International Journal of Operations and Production Management, 5 (4): 80-116.
Norekklit, H. 2000. The balance on the balanced scorecard— a critical analysis of some of its assumptions.
Management Accounting Research, 11: 65-88. Pavlov, A. and Bourne, M. 2011. Explaining the effects of performance measurement on performance: An
organizational routines perspective. International Journal of Operations & Production Management, 31 (1): 101-122.
Perera, S., Harrison, G. and Poole, M. 1997. Customer-focused manufacturing strategy and the use of
operations-based non-financial performance measures: a research note. Accounting, Organizations & Society, 22 (6): 557-72.
Rickards, R.C. 2007. BSC and benchmark development for an e-commerce SME. Benchmarking: An
International Journal, 14 (2): 222-250. Rozhan Othman. 2006. Balanced scorecard and causal model development: preliminary findings.
Management Decision, 44 (5): 690-702. Ruzita Jusoh., Daing Nasir Ibrahim. and Yuserrie Zainuddin. 2008. The performance consequence of
multiple performance measures usage: Evidence from the Malaysian manufacturers. International Journal of Productivity and Performance Management, 57 (2): 119-136.
Sim, K.L. and Koh, H.C. 2001. Balanced Scorecard: a rising trend in strategic performance measurement. Measuring Business Excellence, 5 (2): 18-26. SME Annual Report Report 2009/10. 2010. National SME Development Council.
Proceedings of the 6th International Conference of the Asian Academy of Applied Business (AAAB) 2013
13
Sousa, S.D., Aspinwall, E.M. and Rodrigues, A.G. 2006. Performance measures in English small and medium enterprises: survey results. Benchmarking: An International Journal, 13 (1/2): 120-134.
Waal, A., Kourtit, K. and Nijkamp, P. 2009. The relationship between the level of completeness of a
strategic performance management system and perceived advantages and disadvantages. International Journal of Operations & Production Management, 29 (12): 1242-1265.