Embed Size (px)
Citation preview
©20
13 N
atur
e A
mer
ica,
Inc.
All
righ
ts r
eser
ved.
NATURE NEUROSCIENCE ADVANCE ONLINE PUBLICATION 1
A R T I C L E S
When presented with a set of stimuli, some people may attend to, and therefore learn most about, concrete visual details, whereas others may attend to abstract semantic concepts associated with those stim-uli. Evidence suggests that such variations in attention and learning may reflect stable individual predispositions1–3. We hypothesize that the expression of these predispositions is modulated by global vari-ations in neural gain. Specifically, we propose that high gain focuses attention and learning on dimensions of the environment to which one is predisposed to attend, whereas low gain broadens attention, thereby weakening the constraint of prior dispositions on attention and learning.
By what mechanism can gain exert these effects on attention? Neural gain can be thought of as an amplifier of neural communication: when gain is increased, excited neurons become even more active and inhib-ited neurons become even less active4 (Fig. 1a). Existing evidence suggests that the locus coeruleus–norepinephrine (LC-NE) system serves to modulate neural gain throughout the brain5–10. We used a simple neural network model in which different neural representa-tions compete through mutual inhibition to demonstrate that apply-ing a high global level of gain to all network units can make strong neural representations even more dominant while further weakening weaker competing representations. Accordingly, we hypothesized that high gain results in processing that is more narrowly focused on the most strongly represented features of perceived information.
To test our hypotheses, we used a task that quantifies the degree of learning about perceptual versus semantic features of stimuli (Fig. 1b), together with a standard trait questionnaire that assesses predis-positions to attend to and learn about perceptual versus semantic dimensions of stimuli3. In general, we expected participants to exhibit better learning for the type of features (perceptual or semantic) to which they are predisposed. Notably, we hypothesized that this rela-tionship would be modulated by neural gain.
Although it is impossible to directly measure gain in human par-ticipants, pupil diameter, which is easily measured noninvasively, has
been suggested to track levels of neural gain5. Converging evidence suggests that baseline pupil diameter is correlated with tonic levels of LC-NE activity in rats, cats and monkeys5,11, as well as with human behaviors that are predicted to be associated with tonic LC-NE activity in a variety of experimental tasks and manipulations6,7,12,13. Although baseline pupil diameter between individuals can be used to monitor changes in gain in individuals, phasic pupil dilations normalized to baseline diameter are better suited for between-subject comparisons, as they are better dissociated from factors that can confound between-subject baseline measures. Because phasic responses are inversely related to baseline pupil diameter and tonic LC-NE activity5, pupil dilation responses provide an inverse measure of tonic gain.
To test neural predictions of our gain-modulation hypothesis concerning the relationship between pupil diameter and the match between individual predispositions and learning performance, we used functional magnetic resonance imaging (fMRI). First, increased gain implies that neural signals are enhanced, which in turn predicts that interactions between connected parts of the network should increase. Indeed, gain modulation has been proposed as a mechanism for flexible control of network functional connectivity14–16. This sug-gests that global fluctuations in neural gain should be associated with global fluctuations in the strength of functional connectivity and that these fluctuations in functional connectivity should correlate with changes in pupil diameter. To test these predictions, we measured the degree to which fluctuations in functional connectivity within brain areas were correlated between areas, as well as with changes in pupil diameter.
Second, our neural network modeling of the effect of gain on learn-ing suggested that the link between gain and focused learning should be mediated by a more tightly clustered pattern of neural interactions through which processing is selectively focused on particular input streams. In contrast, when gain in the model was low, widely dis-tributed interactions mediated the concurrent processing of multiple stimulus features. Accordingly, we predicted that within-participant
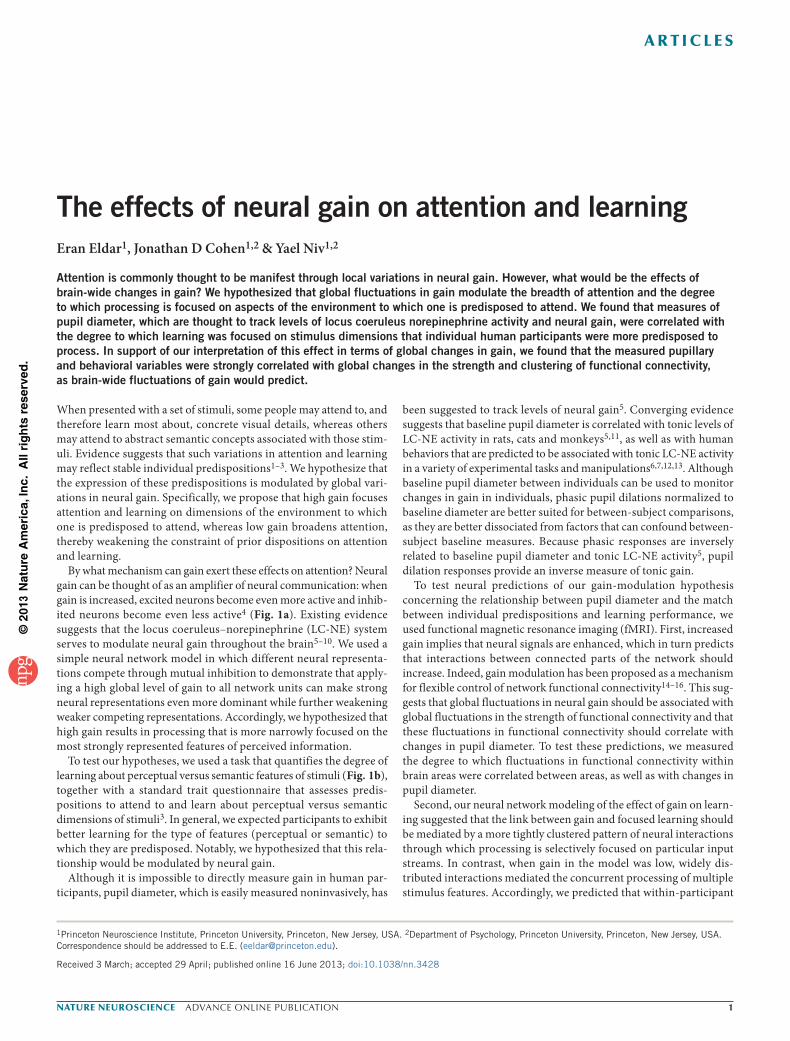
1Princeton Neuroscience Institute, Princeton University, Princeton, New Jersey, USA. 2Department of Psychology, Princeton University, Princeton, New Jersey, USA. Correspondence should be addressed to E.E. ([email protected]).
Received 3 March; accepted 29 April; published online 16 June 2013; doi:10.1038/nn.3428
The effects of neural gain on attention and learningEran Eldar1, Jonathan D Cohen1,2 & Yael Niv1,2
Attention is commonly thought to be manifest through local variations in neural gain. However, what would be the effects of brain-wide changes in gain? We hypothesized that global fluctuations in gain modulate the breadth of attention and the degree to which processing is focused on aspects of the environment to which one is predisposed to attend. We found that measures of pupil diameter, which are thought to track levels of locus coeruleus norepinephrine activity and neural gain, were correlated with the degree to which learning was focused on stimulus dimensions that individual human participants were more predisposed to process. In support of our interpretation of this effect in terms of global changes in gain, we found that the measured pupillary and behavioral variables were strongly correlated with global changes in the strength and clustering of functional connectivity, as brain-wide fluctuations of gain would predict.
©20
13 N
atur
e A
mer
ica,
Inc.
All
righ
ts r
eser
ved.
2 ADVANCE ONLINE PUBLICATION NATURE NEUROSCIENCE
A R T I C L E S
baseline pupil diameter would correlate throughout the experiment with the degree to which functional connectivity was clustered, as measured using graph-theoretic analysis17, and that the degree of clustering would, in turn, correlate with a bias in learning perform-ance toward the type of features that individual participants were predisposed to process.
RESULTSA model of neural gain and predispositions in learningFirst, to formalize our hypothesis about the effect of gain on atten-tion and learning, we constructed a simple neural network model of the task that learned a stimulus-reward relationship from examples (Fig. 1c,d). The input to the network consisted of two separate streams of information, each representing one dimension (for example, visual or semantic). One feature in each dimension was associated with a monetary reward and the other was not. We simulated a predisposi-tion to attend to one dimension more than to the other by making connection weights in one stream stronger than those in the other stream. We then examined the degree to which the network learned to associate the reward-predicting feature in each stream with a reward output as a function of both the predisposition of the network and the level of gain.
With low gain, inputs from both the strong and weak streams prop-agated to the subsequent layers (Fig. 1c) and the relationship with reward was learned for both types of features (that is, predisposition did not significantly bias learning; Fig. 1e). In contrast, when gain was high, inputs in the strong stream dominated representations in the middle layer (Fig. 1d) and learning of the input-reward relationship tended to proceed only on strongly represented features (that is, learn-ing was biased toward features that the network was predisposed to represent; Fig. 1e). Thus, the simulations indicate that increased gain can focus learning on those features that the network is predisposed
to represent. The simulations also revealed that gain affects com-munication patterns in the network: multiple input streams interact with lower gain (Fig. 1c), whereas weak input streams have less of an effect on other parts of the network with higher gain, with the result that network connectivity is more tightly clustered and separate subnetworks are formed (Fig. 1d).
Pupil responses and adherence to predispositionsTo test for the predicted relationship between pupil responses (as an index of neural gain) and the influence of attentional predisposi-tions on learning, we asked participants to choose between pairs of multidimensional images (comprised of visual and semantic features) and rewarded them according to their choices. Unbeknownst to the participants, one visual feature and one semantic feature predicted monetary reward in each stimulus set (Fig. 1b). For example, in one stimulus set, office-related images, but not food-related images (semantic features), yielded reward and, similarly, grayscale images, but not color images (visual features), yielded reward (rewards were additive so that a grayscale office-related image yielded twice the reward). Throughout 18 games, each with different semantic and vis-ual dimensions and unique stimuli, we measured participants’ visual and semantic performance separately using trials in which stimuli differed on either the visual or the semantic features, but not both.
In addition, we assessed each participant’s predisposition to process either the visual or semantic features using the Index of Learning Styles (ILS) questionnaire3. The ILS questionnaire contrasts a sens-ing learning style that indicates a predisposition to process and learn about sense-related data, such as visual features, with an intuitive learning style that indicates a predisposition to learn about abstract concepts, such as semantic categories.
We found that a more intuitive (and less sensing) learning style was correlated with better performance on the semantic trials than on the
Low gain
Reward
Featuresof type 1
Featuresof type 2
c
Featuresof type 1
Featuresof type 2
Reward
High gaindb Trial 1
Trial 2
a
Lowgain
Highgain
InhibitionNet input
Out
put
Excitation
Simulated learning
Type 1 feature Type 2 featureInput weights ratio
Neuralgain
20
0.1
Lear
ning
per
form
ance
Typ
e 2
feat
ure
Typ
e 1
feat
ure
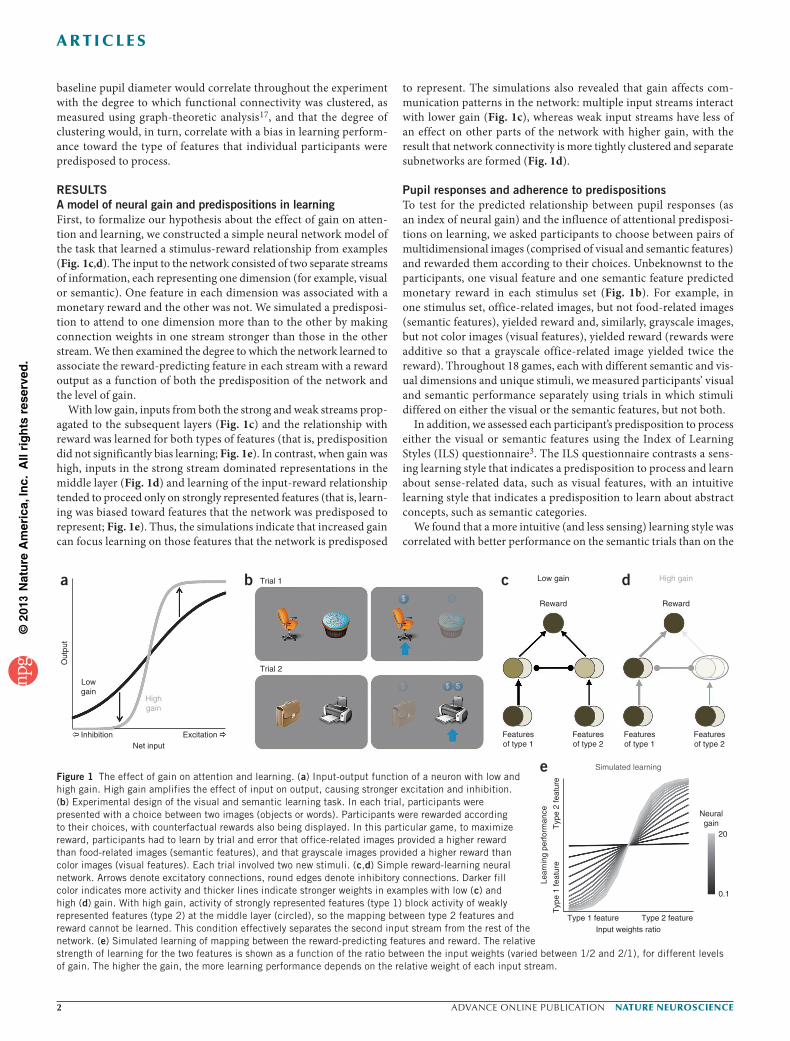
eFigure 1 The effect of gain on attention and learning. (a) Input-output function of a neuron with low and high gain. High gain amplifies the effect of input on output, causing stronger excitation and inhibition. (b) Experimental design of the visual and semantic learning task. In each trial, participants were presented with a choice between two images (objects or words). Participants were rewarded according to their choices, with counterfactual rewards also being displayed. In this particular game, to maximize reward, participants had to learn by trial and error that office-related images provided a higher reward than food-related images (semantic features), and that grayscale images provided a higher reward than color images (visual features). Each trial involved two new stimuli. (c,d) Simple reward-learning neural network. Arrows denote excitatory connections, round edges denote inhibitory connections. Darker fill color indicates more activity and thicker lines indicate stronger weights in examples with low (c) and high (d) gain. With high gain, activity of strongly represented features (type 1) block activity of weakly represented features (type 2) at the middle layer (circled), so the mapping between type 2 features and reward cannot be learned. This condition effectively separates the second input stream from the rest of the network. (e) Simulated learning of mapping between the reward-predicting features and reward. The relative strength of learning for the two features is shown as a function of the ratio between the input weights (varied between 1/2 and 2/1), for different levels of gain. The higher the gain, the more learning performance depends on the relative weight of each input stream.
©20
13 N
atur
e A
mer
ica,
Inc.
All
righ
ts r
eser
ved.
NATURE NEUROSCIENCE ADVANCE ONLINE PUBLICATION 3
A R T I C L E S
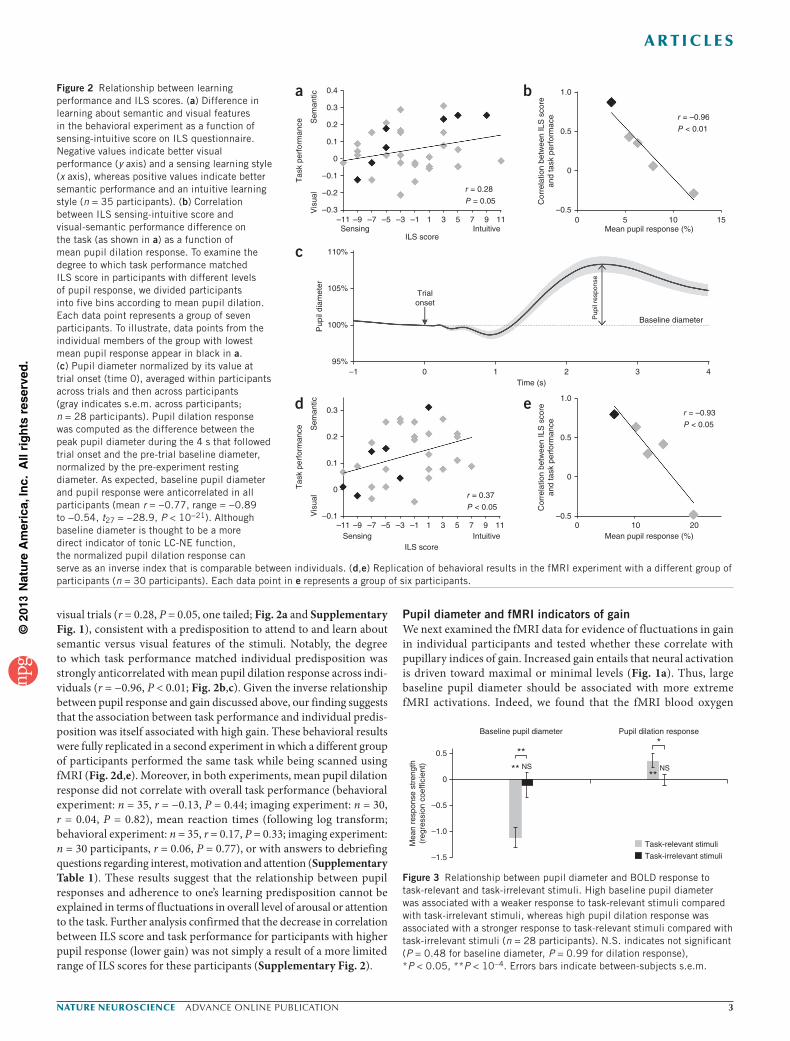
visual trials (r = 0.28, P = 0.05, one tailed; Fig. 2a and Supplementary Fig. 1), consistent with a predisposition to attend to and learn about semantic versus visual features of the stimuli. Notably, the degree to which task performance matched individual predisposition was strongly anticorrelated with mean pupil dilation response across indi-viduals (r = −0.96, P < 0.01; Fig. 2b,c). Given the inverse relationship between pupil response and gain discussed above, our finding suggests that the association between task performance and individual predis-position was itself associated with high gain. These behavioral results were fully replicated in a second experiment in which a different group of participants performed the same task while being scanned using fMRI (Fig. 2d,e). Moreover, in both experiments, mean pupil dilation response did not correlate with overall task performance (behavioral experiment: n = 35, r = −0.13, P = 0.44; imaging experiment: n = 30, r = 0.04, P = 0.82), mean reaction times (following log transform; behavioral experiment: n = 35, r = 0.17, P = 0.33; imaging experiment: n = 30 participants, r = 0.06, P = 0.77), or with answers to debriefing questions regarding interest, motivation and attention (Supplementary Table 1). These results suggest that the relationship between pupil responses and adherence to one’s learning predisposition cannot be explained in terms of fluctuations in overall level of arousal or attention to the task. Further analysis confirmed that the decrease in correlation between ILS score and task performance for participants with higher pupil response (lower gain) was not simply a result of a more limited range of ILS scores for these participants (Supplementary Fig. 2).
Pupil diameter and fMRI indicators of gainWe next examined the fMRI data for evidence of fluctuations in gain in individual participants and tested whether these correlate with pupillary indices of gain. Increased gain entails that neural activation is driven toward maximal or minimal levels (Fig. 1a). Thus, large baseline pupil diameter should be associated with more extreme fMRI activations. Indeed, we found that the fMRI blood oxygen
Figure 2 Relationship between learning performance and ILS scores. (a) Difference in learning about semantic and visual features in the behavioral experiment as a function of sensing-intuitive score on ILS questionnaire. Negative values indicate better visual performance (y axis) and a sensing learning style (x axis), whereas positive values indicate better semantic performance and an intuitive learning style (n = 35 participants). (b) Correlation between ILS sensing-intuitive score and visual-semantic performance difference on the task (as shown in a) as a function of mean pupil dilation response. To examine the degree to which task performance matched ILS score in participants with different levels of pupil response, we divided participants into five bins according to mean pupil dilation. Each data point represents a group of seven participants. To illustrate, data points from the individual members of the group with lowest mean pupil response appear in black in a. (c) Pupil diameter normalized by its value at trial onset (time 0), averaged within participants across trials and then across participants (gray indicates s.e.m. across participants; n = 28 participants). Pupil dilation response was computed as the difference between the peak pupil diameter during the 4 s that followed trial onset and the pre-trial baseline diameter, normalized by the pre-experiment resting diameter. As expected, baseline pupil diameter and pupil response were anticorrelated in all participants (mean r = −0.77, range = −0.89 to −0.54, t27 = −28.9, P < 10−21). Although baseline diameter is thought to be a more direct indicator of tonic LC-NE function, the normalized pupil dilation response can serve as an inverse index that is comparable between individuals. (d,e) Replication of behavioral results in the fMRI experiment with a different group of participants (n = 30 participants). Each data point in e represents a group of six participants.
a
c
d e
b0.4 1.0
Sem
antic
Vis
ual
Pup
il di
amet
er
Tas
k pe
rfor
man
ce
Sem
antic
Sensing Intuitive Mean pupil response (%)ILS score
Vis
ual
Tas
k pe
rfor
man
ce
Cor
rela
tion
betw
een
ILS
sco
rean
d ta
sk p
erfo
rman
ceC
orre
latio
n be
twee
n IL
S s
core
and
task
per
form
ace
0.3
0.2
0.1
0
–0.1
r = 0.28P = 0.05
r = –0.93P < 0.05
r = 0.37P < 0.05
r = –0.96P < 0.01
–11
–1 0 1Time (s)
2 3
Baseline diameterPup
il re
spon
se
4
–9Sensing Intuitive
ILS score
Trialonset
–7 –5 –3 –1 1 3 5 7 9 11
–0.2
–0.3
110%
0.5
0
0 5 10Mean pupil response (%)
15–0.5
105%
100%
95%
0.31.0
0.2
0.1
0
–0.1–11 –9 –7 –5 –3 –1 1 3 5 7 9 11 0 10 20
0.5
0
–0.5
Baseline pupil diameter
Mea
n re
spon
se s
tren
gth
(reg
ress
ion
coef
ficie
nt) NS
**
**
*0.5
NS
Pupil dilation response
0
–0.5
–1.0
–1.5
**
Task-relevant stimuliTask-irrelevant stimuli
Figure 3 Relationship between pupil diameter and BOLD response to task-relevant and task-irrelevant stimuli. High baseline pupil diameter was associated with a weaker response to task-relevant stimuli compared with task-irrelevant stimuli, whereas high pupil dilation response was associated with a stronger response to task-relevant stimuli compared with task-irrelevant stimuli (n = 28 participants). N.S. indicates not significant (P = 0.48 for baseline diameter, P = 0.99 for dilation response), *P < 0.05, **P < 10−4. Errors bars indicate between-subjects s.e.m.
©20
13 N
atur
e A
mer
ica,
Inc.
All
righ
ts r
eser
ved.
4 ADVANCE ONLINE PUBLICATION NATURE NEUROSCIENCE
A R T I C L E S
level–dependent (BOLD) signal was farther from the mean when baseline pupil diameter was large (mean absolute deviation from the mean = 8.36) than when it was small (mean absolute deviation = 8.02; t29 = 3.79, P < 10−4, paired t test comparing 10% of trials with highest pupil diameter to 10% of trials with lowest pupil diameter).
An additional prediction that stems from the assumed relation-ship between pupil diameter and gain is that the magnitude of pupil dilation in response to task-relevant stimuli should correlate with the magnitude of the BOLD response to task-relevant stimuli, but not to task-irrelevant stimuli5. To test this prediction, we included random, task-irrelevant, auditory stimuli that participants were instructed to ignore. As predicted, both low baseline pupil diameter and high pupil dilation response were associated with stronger BOLD responses to task-relevant stimuli, but not to task-irrelevant stimuli (baseline diameter: t27 = −5.04, P < 10−5; dilation response: t27 = 2.56, P < 0.05; Fig. 3).
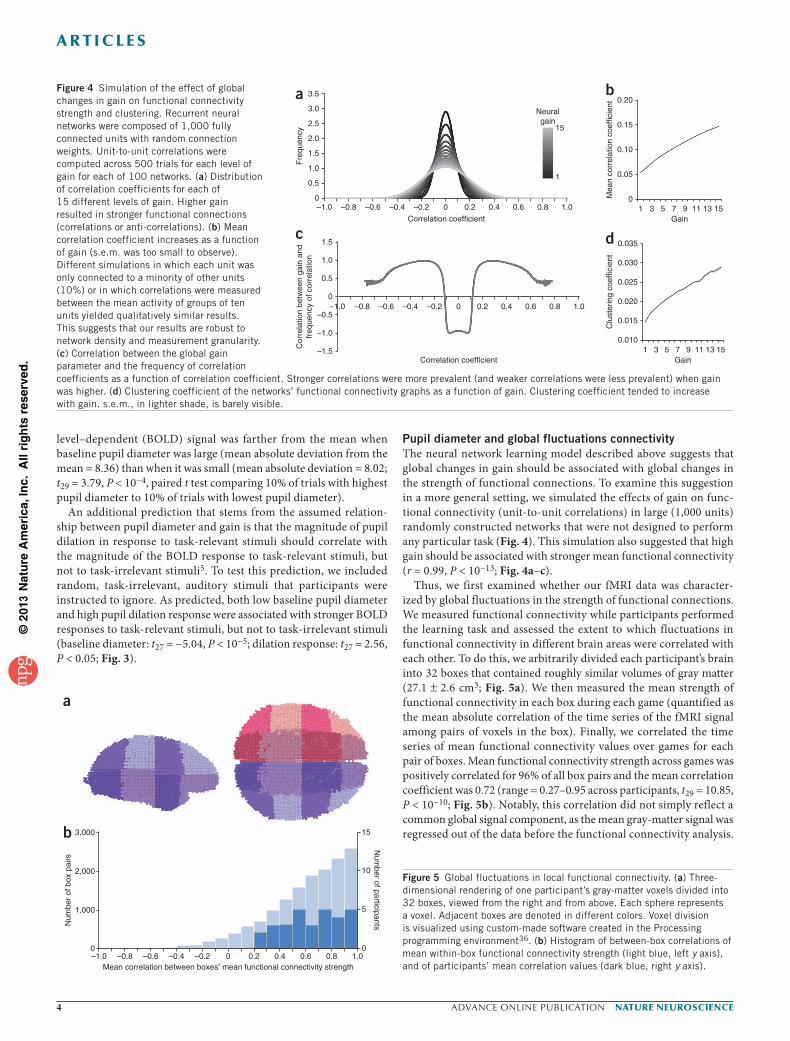
Pupil diameter and global fluctuations connectivityThe neural network learning model described above suggests that global changes in gain should be associated with global changes in the strength of functional connections. To examine this suggestion in a more general setting, we simulated the effects of gain on func-tional connectivity (unit-to-unit correlations) in large (1,000 units) randomly constructed networks that were not designed to perform any particular task (Fig. 4). This simulation also suggested that high gain should be associated with stronger mean functional connectivity (r = 0.99, P < 10−13; Fig. 4a–c).
Thus, we first examined whether our fMRI data was character-ized by global fluctuations in the strength of functional connections. We measured functional connectivity while participants performed the learning task and assessed the extent to which fluctuations in functional connectivity in different brain areas were correlated with each other. To do this, we arbitrarily divided each participant’s brain into 32 boxes that contained roughly similar volumes of gray matter (27.1 2.6 cm3; Fig. 5a). We then measured the mean strength of functional connectivity in each box during each game (quantified as the mean absolute correlation of the time series of the fMRI signal among pairs of voxels in the box). Finally, we correlated the time series of mean functional connectivity values over games for each pair of boxes. Mean functional connectivity strength across games was positively correlated for 96% of all box pairs and the mean correlation coefficient was 0.72 (range = 0.27–0.95 across participants, t29 = 10.85, P < 10−10; Fig. 5b). Notably, this correlation did not simply reflect a common global signal component, as the mean gray-matter signal was regressed out of the data before the functional connectivity analysis.
Figure 4 Simulation of the effect of global changes in gain on functional connectivity strength and clustering. Recurrent neural networks were composed of 1,000 fully connected units with random connection weights. Unit-to-unit correlations were computed across 500 trials for each level of gain for each of 100 networks. (a) Distribution of correlation coefficients for each of 15 different levels of gain. Higher gain resulted in stronger functional connections (correlations or anti-correlations). (b) Mean correlation coefficient increases as a function of gain (s.e.m. was too small to observe). Different simulations in which each unit was only connected to a minority of other units (10%) or in which correlations were measured between the mean activity of groups of ten units yielded qualitatively similar results. This suggests that our results are robust to network density and measurement granularity. (c) Correlation between the global gain parameter and the frequency of correlation coefficients as a function of correlation coefficient. Stronger correlations were more prevalent (and weaker correlations were less prevalent) when gain was higher. (d) Clustering coefficient of the networks’ functional connectivity graphs as a function of gain. Clustering coefficient tended to increase with gain. s.e.m., in lighter shade, is barely visible.
c
Cor
rela
tion
betw
een
gain
and
freq
uenc
y of
cor
rela
tion
Correlation coefficient
–1.0 –0.8 –0.6 –0.4 –0.2 0 0.2 0.4 0.6 0.8 1.0
1.5
–1.5
1.0
–1.0
0.5
–0.5
0
b0.20
0.15
0.10
0.05
0Mea
n co
rrel
atio
n co
effic
ient
Gain1 3 5 7 9 11 13 15
d 0.035
0.030
0.025
0.020
0.015
0.010
Clu
ster
ing
coef
ficie
nt
1 3 5 7 9 11 13 15Gain
3.5a3.0
2.5
2.0
1.5
Fre
quen
cy
Correlation coefficient
1.0
0.5
0–1.0 –0.8 –0.6 –0.4 –0.2 0 0.2 0.4 0.6
Neuralgain
15
1
0.8 1.0
3,000
2,000
Num
ber
of b
ox p
airs
Num
ber of participants
1,000
0–1.0 –0.8 –0.6 –0.4 –0.2
Mean correlation between boxes mean functional connectivity strength0.2 0.4 0.6 0.8 1.0
00
a
b
5
10
15
Figure 5 Global fluctuations in local functional connectivity. (a) Three-dimensional rendering of one participant’s gray-matter voxels divided into 32 boxes, viewed from the right and from above. Each sphere represents a voxel. Adjacent boxes are denoted in different colors. Voxel division is visualized using custom-made software created in the Processing programming environment36. (b) Histogram of between-box correlations of mean within-box functional connectivity strength (light blue, left y axis), and of participants’ mean correlation values (dark blue, right y axis).
©20
13 N
atur
e A
mer
ica,
Inc.
All
righ
ts r
eser
ved.
NATURE NEUROSCIENCE ADVANCE ONLINE PUBLICATION 5
A R T I C L E S
Thus, even though our measurements of functional connectivity in different boxes involved strictly disjoint brain areas, we found very strong correlations in fluctuations of these measurements throughout the brain.
Although this result is strongly suggestive of global modulation of neural signaling, it is nevertheless possible that global fluctuations in
local functional connectivity reflect correlated local instabilities of the MRI scanner. Such a confound could be dismissed if the measured fluctuations in functional connectivity were also to covary with the separately attained measures of baseline pupil diameter. Indeed, we found that when baseline pupil diameter was highest (indicative of high gain), high functional connectivity measurements were more
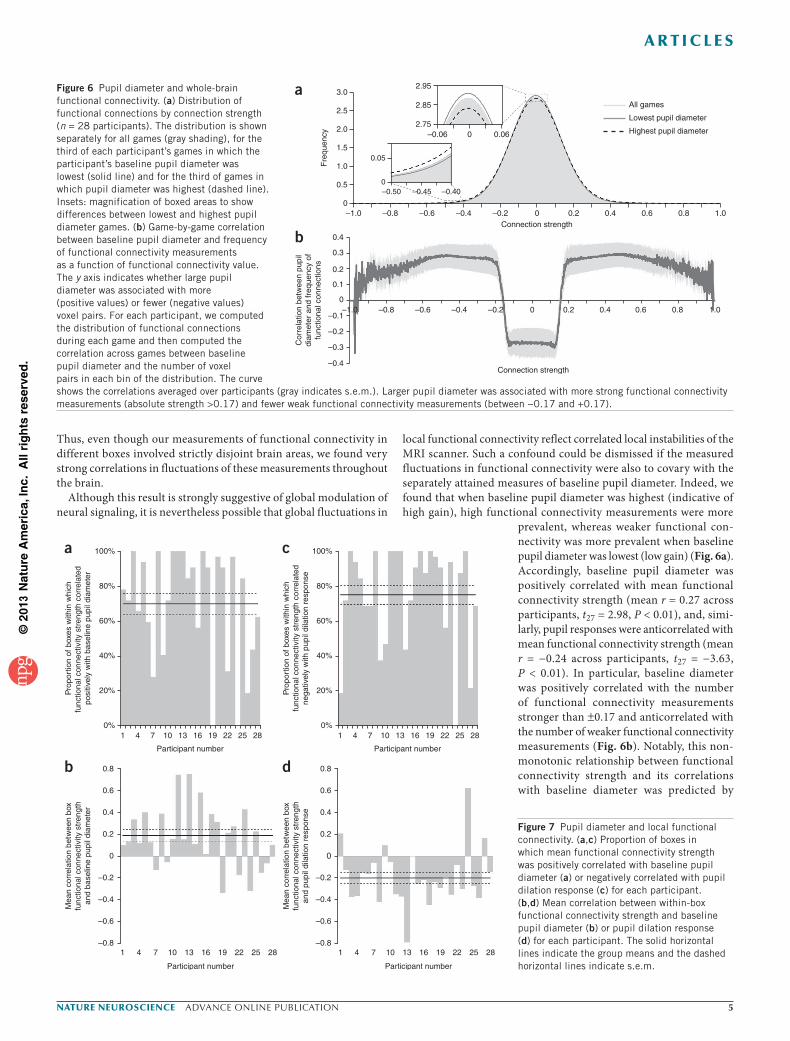
prevalent, whereas weaker functional con-nectivity was more prevalent when baseline pupil diameter was lowest (low gain) (Fig. 6a). Accordingly, baseline pupil diameter was positively correlated with mean functional connectivity strength (mean r = 0.27 across participants, t27 = 2.98, P < 0.01), and, simi-larly, pupil responses were anticorrelated with mean functional connectivity strength (mean r = −0.24 across participants, t27 = −3.63, P < 0.01). In particular, baseline diameter was positively correlated with the number of functional connectivity measurements stronger than 0.17 and anticorrelated with the number of weaker functional connectivity measurements (Fig. 6b). Notably, this non-monotonic relationship between functional connectivity strength and its correlations with baseline diameter was predicted by
Figure 6 Pupil diameter and whole-brain functional connectivity. (a) Distribution of functional connections by connection strength (n = 28 participants). The distribution is shown separately for all games (gray shading), for the third of each participant’s games in which the participant’s baseline pupil diameter was lowest (solid line) and for the third of games in which pupil diameter was highest (dashed line). Insets: magnification of boxed areas to show differences between lowest and highest pupil diameter games. (b) Game-by-game correlation between baseline pupil diameter and frequency of functional connectivity measurements as a function of functional connectivity value. The y axis indicates whether large pupil diameter was associated with more (positive values) or fewer (negative values) voxel pairs. For each participant, we computed the distribution of functional connections during each game and then computed the correlation across games between baseline pupil diameter and the number of voxel pairs in each bin of the distribution. The curve shows the correlations averaged over participants (gray indicates s.e.m.). Larger pupil diameter was associated with more strong functional connectivity measurements (absolute strength >0.17) and fewer weak functional connectivity measurements (between −0.17 and +0.17).
3.0a2.5
2.95
2.85
2.75–0.06 0.060
2.0
1.5
Fre
quen
cy
b
Cor
rela
tion
betw
een
pupi
ldi
amet
er a
nd fr
eque
ncy
offu
nctio
nal c
onne
ctio
ns
1.0
0.5
–1.0 –0.8 –0.6 –0.4 –0.2Connection strength
0.2
All games
Lowest pupil diameter
Highest pupil diameter
0.4 0.6 0.8 1.000
0.05
0–0.50 –0.40–0.45
0.4
0.3
0.2
0.1
–0.1–1.0 –0.8 –0.6 –0.4 –0.2 0.2 0.4 0.6 0.8 1.00
–0.2
–0.3
–0.4
0
Connection strength
Pro
port
ion
of b
oxes
with
in w
hich
func
tiona
l con
nect
ivity
stre
ngth
cor
rela
ted
posi
tivel
y w
ith b
asel
ine
pupi
l dia
met
er
100%
80%
60%
40%
20%
0%1 4 7 10 13 16 19 22 25 28
Participant number
a
Participant number
0.8
0.6
0.4
0.2
0
–0.2
–0.4
–0.6
–0.8
Mea
n co
rrel
atio
n be
twee
n bo
xfu
nctio
nal c
onne
ctiv
ity s
treng
than
d ba
selin
e pu
pil d
iam
eter
1 4 7 10 13 16 19 22 25 28
b
Pro
port
ion
of b
oxes
with
in w
hich
func
tiona
l con
nect
ivity
stre
ngth
cor
rela
ted
nega
tivel
y w
ith p
upil
dila
tion
resp
onse
100%
80%
60%
40%
20%
0%1 4 7 10 13 16 19 22 25 28
Participant number
c
Participant number
1 4 7 10 13 16 19 22 25 28
0.8
0.6
0.4
0.2
0
–0.2
–0.4
–0.6
–0.8
Mea
n co
rrel
atio
n be
twee
n bo
xfu
nctio
nal c
onne
ctiv
ity s
treng
than
d pu
pil d
ilatio
n re
spon
se
d
Figure 7 Pupil diameter and local functional connectivity. (a,c) Proportion of boxes in which mean functional connectivity strength was positively correlated with baseline pupil diameter (a) or negatively correlated with pupil dilation response (c) for each participant. (b,d) Mean correlation between within-box functional connectivity strength and baseline pupil diameter (b) or pupil dilation response (d) for each participant. The solid horizontal lines indicate the group means and the dashed horizontal lines indicate s.e.m.
©20
13 N
atur
e A
mer
ica,
Inc.
All
righ
ts r
eser
ved.
6 ADVANCE ONLINE PUBLICATION NATURE NEUROSCIENCE
A R T I C L E S
our simulation of the effects of gain on functional connectivity in randomly connected neural networks (Fig. 4b).
To verify that the relationship between functional connectivity and pupil diameter was not specific to particular brain regions, but rather was manifest throughout the brain, we examined this relationship separately in each of the 32 boxes. Functional connectivity strength was positively correlated with baseline pupil diameter in 70% of the boxes (22 of 32 boxes per participant on average; Fig. 7a) and the mean correlation coefficient was 0.19 (t27 = 3.19, P < 0.01; Fig. 7b). Notably, baseline pupil diameter was not correlated with the mean box fMRI signal (mean r = −0.004, t27 = −0.35, P = 0.73), indicating that the relationship with functional connectivity strength did not reflect pupil-related variations in signal strength. Furthermore, the relation-ship between baseline diameter and functional connectivity strength was fairly consistent throughout the brain: for every box, functional connectivity was positively correlated with baseline pupil diameter in at least half of the participants. As expected, functional connectivity strength was also anticorrelated with pupil dilation response in 75% of the boxes (Fig. 7c) and the mean correlation coefficient was −0.20 (t27 = −3.54, P < 0.01; Fig. 7d). Thus, our results suggest that the strength of functional connectivity fluctuates in a similar manner throughout the brain and that these fluctuations are tracked closely by both pupil diameter indices.
Pupil diameter, neural clustering and task performanceThe results of our learning neural network model also suggest that, with high gain, functional connectivity should be tightly clustered rather than evenly distributed. To examine this in a more general setting, we constructed a functional connectivity graph for each of the random 1,000-unit networks described above. Each of the graphs’ nodes represented a unit, and two units were connected by an edge if the correlation of activity between them was in the top 1% of all such correlations. The clustering coefficient18 of such a graph indicates the degree to which functional connectivity is tightly clustered in the network. As expected, higher gain was associated with higher cluster-ing coefficients (r = 0.99, P < 10−12; Fig. 4d).
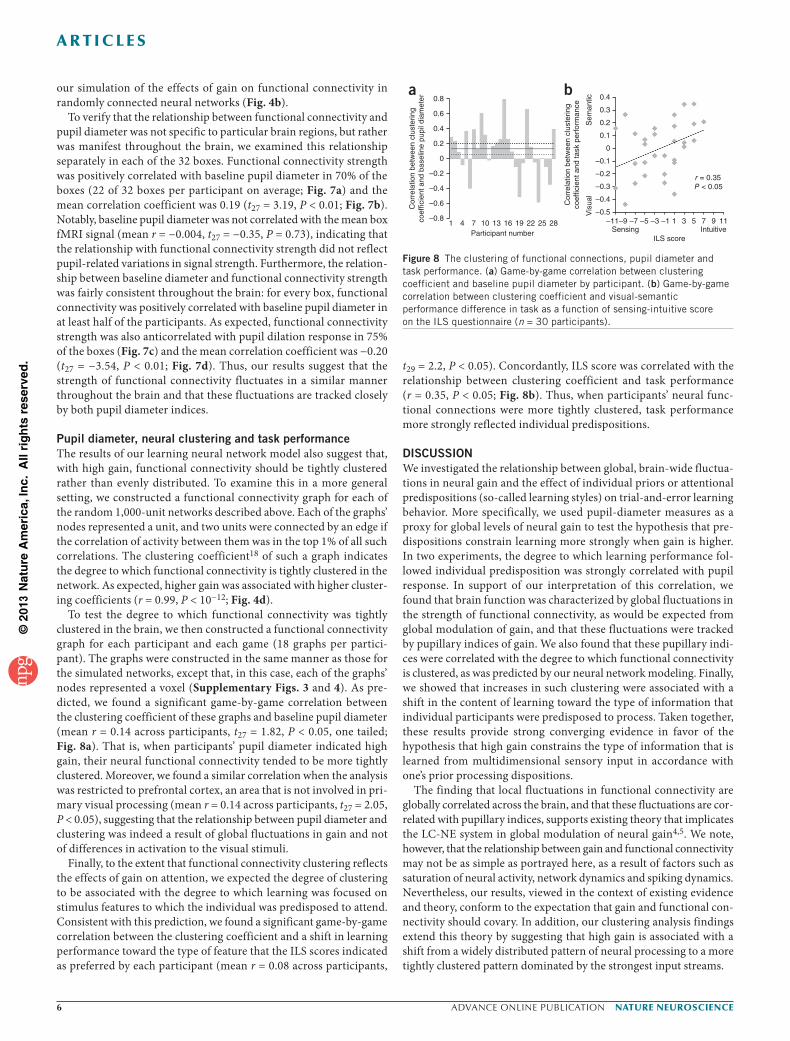
To test the degree to which functional connectivity was tightly clustered in the brain, we then constructed a functional connectivity graph for each participant and each game (18 graphs per partici-pant). The graphs were constructed in the same manner as those for the simulated networks, except that, in this case, each of the graphs’ nodes represented a voxel (Supplementary Figs. 3 and 4). As pre-dicted, we found a significant game-by-game correlation between the clustering coefficient of these graphs and baseline pupil diameter (mean r = 0.14 across participants, t27 = 1.82, P < 0.05, one tailed; Fig. 8a). That is, when participants’ pupil diameter indicated high gain, their neural functional connectivity tended to be more tightly clustered. Moreover, we found a similar correlation when the analysis was restricted to prefrontal cortex, an area that is not involved in pri-mary visual processing (mean r = 0.14 across participants, t27 = 2.05, P < 0.05), suggesting that the relationship between pupil diameter and clustering was indeed a result of global fluctuations in gain and not of differences in activation to the visual stimuli.
Finally, to the extent that functional connectivity clustering reflects the effects of gain on attention, we expected the degree of clustering to be associated with the degree to which learning was focused on stimulus features to which the individual was predisposed to attend. Consistent with this prediction, we found a significant game-by-game correlation between the clustering coefficient and a shift in learning performance toward the type of feature that the ILS scores indicated as preferred by each participant (mean r = 0.08 across participants,
t29 = 2.2, P < 0.05). Concordantly, ILS score was correlated with the relationship between clustering coefficient and task performance (r = 0.35, P < 0.05; Fig. 8b). Thus, when participants’ neural func-tional connections were more tightly clustered, task performance more strongly reflected individual predispositions.
DISCUSSIONWe investigated the relationship between global, brain-wide fluctua-tions in neural gain and the effect of individual priors or attentional predispositions (so-called learning styles) on trial-and-error learning behavior. More specifically, we used pupil-diameter measures as a proxy for global levels of neural gain to test the hypothesis that pre-dispositions constrain learning more strongly when gain is higher. In two experiments, the degree to which learning performance fol-lowed individual predisposition was strongly correlated with pupil response. In support of our interpretation of this correlation, we found that brain function was characterized by global fluctuations in the strength of functional connectivity, as would be expected from global modulation of gain, and that these fluctuations were tracked by pupillary indices of gain. We also found that these pupillary indi-ces were correlated with the degree to which functional connectivity is clustered, as was predicted by our neural network modeling. Finally, we showed that increases in such clustering were associated with a shift in the content of learning toward the type of information that individual participants were predisposed to process. Taken together, these results provide strong converging evidence in favor of the hypothesis that high gain constrains the type of information that is learned from multidimensional sensory input in accordance with one’s prior processing dispositions.
The finding that local fluctuations in functional connectivity are globally correlated across the brain, and that these fluctuations are cor-related with pupillary indices, supports existing theory that implicates the LC-NE system in global modulation of neural gain4,5. We note, however, that the relationship between gain and functional connectivity may not be as simple as portrayed here, as a result of factors such as saturation of neural activity, network dynamics and spiking dynamics. Nevertheless, our results, viewed in the context of existing evidence and theory, conform to the expectation that gain and functional con-nectivity should covary. In addition, our clustering analysis findings extend this theory by suggesting that high gain is associated with a shift from a widely distributed pattern of neural processing to a more tightly clustered pattern dominated by the strongest input streams.
0.4a b
0.3
0.2
0.1
0
Cor
rela
tion
betw
een
clus
terin
gco
effic
ient
and
bas
elin
e pu
pil d
iam
eter
Cor
rela
tion
betw
een
clus
terin
gco
effic
ient
and
task
per
form
ance
Sem
antic
Vis
ual
Sensing Intuitive
r = 0.35P < 0.05
ILS score
0.8
0.6
0.4
0.2
0
–0.2
–0.4
–0.6
–0.8
–0.2
–0.1
–0.3
–0.4
–0.5–11–9 –7 –5 –3 –1 1 3 5 7 9 111 4 7 10 13 16
Participant number19 22 25 28
Figure 8 The clustering of functional connections, pupil diameter and task performance. (a) Game-by-game correlation between clustering coefficient and baseline pupil diameter by participant. (b) Game-by-game correlation between clustering coefficient and visual-semantic performance difference in task as a function of sensing-intuitive score on the ILS questionnaire (n = 30 participants).

©20
13 N
atur
e A
mer
ica,
Inc.
All
righ
ts r
eser
ved.
NATURE NEUROSCIENCE ADVANCE ONLINE PUBLICATION 7
A R T I C L E S
Our results provide a neural-computational framework in which past findings concerning the relationship of stress and norepine-phrine levels to cognitive function can be understood. A large body of psychological research in humans suggests that stress (which is associated with high levels of norepinephrine) reduces the breadth of attention19,20. Another set of studies found that stress and nore-pinephrine shift rat and human behavior from a flexible mode of behavior to a more rigid habitual mode in which previously estab-lished stimulus-response associations are followed21–24. Stress and norepinephrine have also been linked to diminished performance in tasks requiring cognitive flexibility25,26. Our findings suggest an explanation of these previously observed phenomena in terms of the influence of the LC-NE system in globally modulating neural gain. Increased gain narrows attention by strengthening already strong neu-ral representations at the expense of competing weaker representa-tions. This, in turn, favors previously established patterns of behavior, which are subserved by well-established neural circuits and tend to form stronger representations.
We attempted to identify the effects of neural gain, a computational concept defined in terms of the input-output function of neural units, on behavior and on whole-brain fMRI metrics. This constitutes a promising approach by which low-level principles of neural function may be linked via computational modeling to system-level neural and behavioral phenomena. However, the disadvantage of our approach is that it necessarily relies on a broad set of assumptions. Specifically, in making our predictions, we assumed that changes in pupil diam-eter would track changes in neural gain. Furthermore, our fMRI pre-dictions were based on the assumption that the BOLD signal would reflect the neural effects of gain simulated by changes in firing rates in our computational models. This last assumption is particularly tenuous, as several studies have found dissociations between spiking activity and the BOLD signal specifically under conditions that are thought to involve changes in neuromodulation27–29. Nevertheless, we present a diverse set of behavioral and imaging results that precisely match the predictions made by our neural network simulations of the effect of gain on neural activity, connectivity and behavior. This set of converging results, in addition to evidence from past studies, provides substantial support for our underlying assumptions.
The focusing effect of neural gain on processing may at first glance seem to conflict with previous accounts suggesting that tonically high gain reduces task-focused attention5. However, although our find-ings suggest that increased gain focuses attention on predisposed dimensions of sensory stimuli, these need not be related to the task at hand. Rather, if distracting stimuli are salient enough to evoke strong neural representations, our theory predicts that high gain would be associated with increased attention to distracters and with reduced task-focused attention. Our findings also fit well with a previous sug-gestion30 that phasic norepinephrine responses, which are stronger in low gain states (low tonic LC-NE activity), facilitate behavioral flexibility in response to unexpected target stimuli.
Several of our results draw on graph-theoretic methods that have increasingly been used to analyze both structural and functional brain imaging data31,32. The strength of these methods lies in their ability to capture, by simple quantitative measures, characteristics of net-works that are comprised of a very large number of elements. Most previous studies employing graph-theoretic analyses have investigated stationary aspects of neural processing networks, but a few recent studies have begun to examine how measures of functional brain net-work topology vary with behavior33–35. The latter, however, analyzed relatively small networks (<120 nodes). In contrast, we used graph-theoretic measures to examine how the topology of high-resolution
whole-brain networks (>20,000 nodes) varies with behavior. Our results indicate that such an analysis can provide meaningful insights into the way sensory information is processed and learned.
In conclusion, our findings suggest that processing predispositions can influence learning, but that these priors are not always binding. Rather, brain-wide fluctuations in neural gain induce different modes of neural communication that modulate the breadth of attention and the extent to which processing and learning are constrained by prior dispositions. The adaptive value of modulating this aspect of process-ing in accord with situational variables is clear. The questions now are what drives these changes in gain and how does the brain determine what mode of processing is suitable at any given moment.
METHODSMethods and any associated references are available in the online version of the paper.
Note: Supplementary information is available in the online version of the paper.
ACKNOWLEDGMENTSWe thank N. Turk-Browne and P. Dayan for helpful comments on earlier versions of the manuscript. This research was funded by US National Institutes of Health grants R03 DA029073 and R01 MH098861, a Howard Hughes Medical Institute International Student Research fellowship to E.E. and a Sloan Research Fellowship to Y.N. The authors also wish to thank the generous support of the Regina and John Scully Center for the Neuroscience of Mind and Behavior in the Princeton Neuroscience Institute.
AUTHOR CONTRIBUTIONSE.E. and Y.N. designed the study with consultation from J.D.C. E.E. and Y.N. analyzed the data, and all of the authors contributed to discussion and interpretation of the findings and writing the manuscript.
COMPETING FINANCIAL INTERESTSThe authors declare no competing financial interests.
Reprints and permissions information is available online at http://www.nature.com/reprints/index.html.
1. Felder, R.M. & Silverman, L.K. Learning and teaching styles in engineering education. Eng. Educ. 78, 674–681 (1988).
2. Coffield, F., Moseley, D., Hall, E. & Ecclestone, K. Learning Styles and Pedagogy in Post-16 Learning: a Systematic and Critical Review (Learning and Skills Research Centre, London, 2004).
3. Felder, R.M. & Spurlin, J. Application, reliability and validity of the index of learning styles. Int. J. Eng. Educ. 21, 103–112 (2005).
4. Servan-Schreiber, D., Printz, H. & Cohen, J.D. A network model of catecholamine effects: gain, signal-to-noise ratio, and behavior. Science 249, 892–895 (1990).
5. Aston-Jones, G. & Cohen, J.D. An integrative theory of locus coeruleus–norepinephrine function: adaptive gain and optimal performance. Annu. Rev. Neurosci. 28, 403–450 (2005).
6. Gilzenrat, M.S., Nieuwenhuis, S., Jepma, M. & Cohen, J.D. Pupil diameter tracks changes in control state predicted by the adaptive gain theory of locus coeruleus function. Cogn. Affect. Behav. Neurosci. 10, 252–269 (2010).
7. Jepma, M. & Nieuwenhuis, S. Pupil diameter predicts changes in the exploration-exploitation trade-off: evidence for the adaptive gain theory. J. Cogn. Neurosci. 23, 1587–1596 (2011).
8. Waterhouse, B.D., Moises, H.C. & Woodward, D.J. Noradrenergic modulation of somatosensory cortical neuronal responses to lontophoretically applied putative neurotransmitters. Exp. Neurol. 69, 30–49 (1980).
9. Waterhouse, B.D., Moises, H.C., Yeh, H.H., Geller, H.M. & Woodward, D.J. Comparison of norepinephrine- and benzodiazepine-induced augmentation of Purkinje cell responses to gamma-aminobutyric acid (GABA). J. Pharmacol. Exp. Ther. 228, 257–267 (1984).
10. Waterhouse, B.D. & Woodward, D.J. Interaction of norepinephrine with cerebrocortical activity evoked by stimulation of somatosensory afferent pathways in the rat. Exp. Neurol. 67, 11–34 (1980).
11. Koss, M.C. Pupillary dilation as an index of central nervous system 2-adrenoceptor activation. J. Pharmacol. Methods 15, 1–19 (1986).
12. Einhäuser, W., Stout, J., Koch, C. & Carter, O.L. Pupil dilation reflects perceptual selection and predicts subsequent stability in perceptual rivalry. Proc. Natl. Acad. Sci. USA 105, 1704–1709 (2008).
13. Murphy, P.R., Robertson, I.H., Balsters, J.H. & O’Connell, R.G. Pupillometry and P3 index the locus coeruleus-noradrenergic arousal function in humans. Psychophysiology 48, 1532–1543 (2011).
©20
13 N
atur
e A
mer
ica,
Inc.
All
righ
ts r
eser
ved.
8 ADVANCE ONLINE PUBLICATION NATURE NEUROSCIENCE
A R T I C L E S
14. Salinas, E. Fast remapping of sensory stimuli onto motor actions on the basis of contextual modulation. J. Neurosci. 24, 1113–1118 (2004).
15. Salinas, E. & Bentley, N.M. Gain modulation as a mechanism for switching reference frames, tasks and targets. Coherent Behav. Neuronal Netw. 3, 121–142 (2009).
16. Haider, B. & McCormick, D.A. Rapid neocortical dynamics: cellular and network mechanisms. Neuron 62, 171–189 (2009).
17. Eguíluz, V.M., Chialvo, D.R., Cecchi, G.A., Baliki, M. & Apkarian, A.V. Scale-free brain functional networks. Phys. Rev. Lett. 94, 018102 (2005).
18. Luce, R.D. & Perry, A. A method of matrix analysis of group structure. Psychometrika 14, 95–116 (1949).
19. Easterbrook, J.A. The effect of emotion on cue utilization and the organization of behavior. Psychol. Rev. 66, 183–201 (1959).
20. Staal, M.A. Stress, Cognition, and Human Performance: a Literature Review and Conceptual Framework (NASA STI Program, 2004).
21. Dias-Ferreira, E. et al. Chronic stress causes frontostriatal reorganization and affects decision-making. Science 325, 621–625 (2009).
22. Schwabe, L. & Wolf, O.T. Stress-induced modulation of instrumental behavior: from goal-directed to habitual control of action. Behav. Brain Res. 219, 321–328 (2011).
23. Schwabe, L., Tegenthoff, M., Höffken, O. & Wolf, O.T. Concurrent glucocorticoid and noradrenergic activity shifts instrumental behavior from goal-directed to habitual control. J. Neurosci. 30, 8190–8196 (2010).
24. Schwabe, L., Höffken, O., Tegenthoff, M. & Wolf, O.T. Preventing the stress-induced shift from goal-directed to habit action with a -adrenergic antagonist. J. Neurosci. 31, 17317–17325 (2011).
25. Alexander, J.K., Hillier, A., Smith, R., Tivarus, M. & Beversdorf, D. Beta-adrenergic modulation of cognitive flexibility during stress. J. Cogn. Neurosci. 19, 468–478 (2007).
26. Campbell, H.L., Tivarus, M.E., Hillier, A. & Beversdorf, D.Q. Increased task difficulty results in greater impact of noradrenergic modulation of cognitive flexibility. Pharmacol. Biochem. Behav. 88, 222–229 (2008).
27. Maier, A. et al. Divergence of fMRI and neural signals in V1 during perceptual suppression in the awake monkey. Nat. Neurosci. 11, 1193–1200 (2008).
28. Sirotin, Y.B. & Das, A. Anticipatory haemodynamic signals in sensory cortex not predicted by local neuronal activity. Nature 457, 475–479 (2009).
29. Logothetis, N.K. What we can do and what we cannot do with fMRI. Nature 453, 869–878 (2008).
30. Dayan, P. & Yu, A.J. Norepinephrine and neural interrupts. in Advances in Neural Information Processing Systems 18 (eds. Weiss, Y., Schölkopf, B. & Platt, J.) 243–250 (MIT Press, Cambridge, Massachusetts, 2006).
31. Bullmore, E. & Sporns, O. Complex brain networks: graph theoretical analysis of structural and functional systems. Nat. Rev. Neurosci. 10, 186–198 (2009).
32. Bullmore, E. & Sporns, O. The economy of brain network organization. Nat. Rev. Neurosci. 13, 336–349 (2012).
33. Bassett, D.S. et al. Dynamic reconfiguration of human brain networks during learning. Proc. Natl. Acad. Sci. USA 108, 7641–7646 (2011).
34. Kitzbichler, M.G., Henson, R.N., Smith, M.L., Nathan, P.J. & Bullmore, E.T. Cognitive effort drives workspace configuration of human brain functional networks. J. Neurosci. 31, 8259–8270 (2011).
35. Nicol, R.M. et al. Fast reconfiguration of high-frequency brain networks in response to surprising changes in auditory input. J. Neurophysiol. 107, 1421–1430 (2012).
36. Reas, C. & Fry, B. Processing: a Programming Handbook for Visual Designers and Artists (MIT Press, Cambridge, Massachusetts, 2007).
©20
13 N
atur
e A
mer
ica,
Inc.
All
righ
ts r
eser
ved.
NATURE NEUROSCIENCEdoi:10.1038/nn.3428
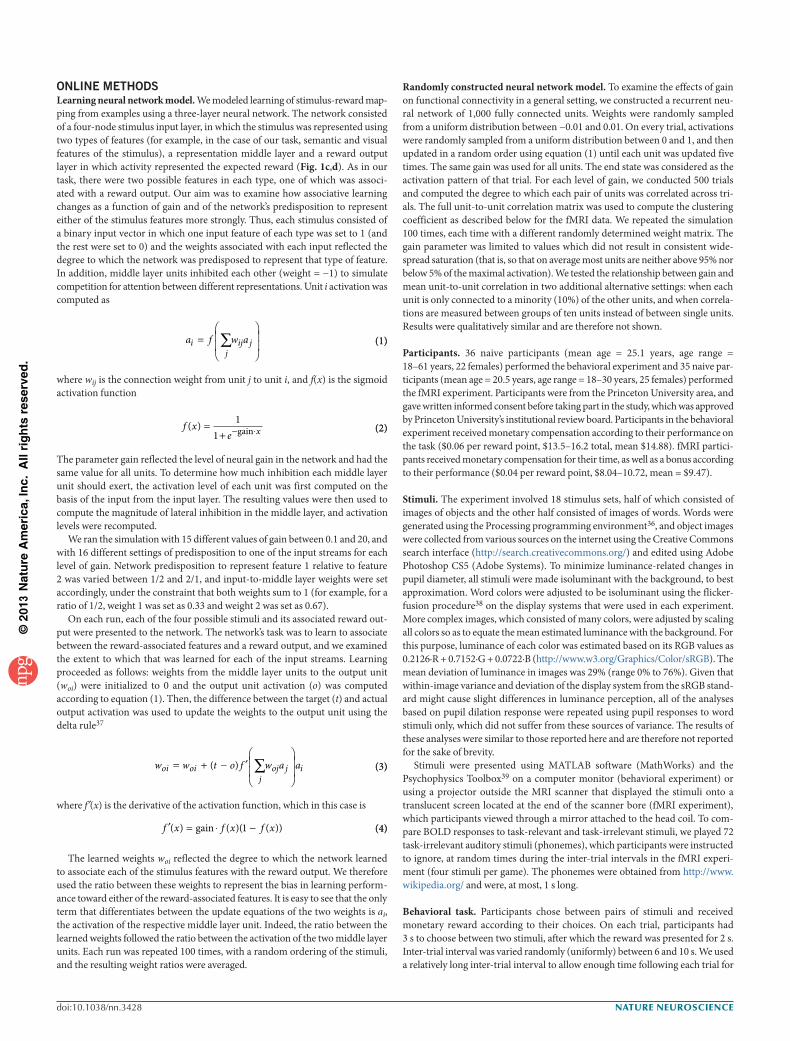
ONLINE METHODSLearning neural network model. We modeled learning of stimulus-reward map-ping from examples using a three-layer neural network. The network consisted of a four-node stimulus input layer, in which the stimulus was represented using two types of features (for example, in the case of our task, semantic and visual features of the stimulus), a representation middle layer and a reward output layer in which activity represented the expected reward (Fig. 1c,d). As in our task, there were two possible features in each type, one of which was associ-ated with a reward output. Our aim was to examine how associative learning changes as a function of gain and of the network’s predisposition to represent either of the stimulus features more strongly. Thus, each stimulus consisted of a binary input vector in which one input feature of each type was set to 1 (and the rest were set to 0) and the weights associated with each input reflected the degree to which the network was predisposed to represent that type of feature. In addition, middle layer units inhibited each other (weight = −1) to simulate competition for attention between different representations. Unit i activation was computed as
a f w aij
ij j
where wij is the connection weight from unit j to unit i, and f(x) is the sigmoid activation function
f xe x( ) 1
1 gain
The parameter gain reflected the level of neural gain in the network and had the same value for all units. To determine how much inhibition each middle layer unit should exert, the activation level of each unit was first computed on the basis of the input from the input layer. The resulting values were then used to compute the magnitude of lateral inhibition in the middle layer, and activation levels were recomputed.
We ran the simulation with 15 different values of gain between 0.1 and 20, and with 16 different settings of predisposition to one of the input streams for each level of gain. Network predisposition to represent feature 1 relative to feature 2 was varied between 1/2 and 2/1, and input-to-middle layer weights were set accordingly, under the constraint that both weights sum to 1 (for example, for a ratio of 1/2, weight 1 was set as 0.33 and weight 2 was set as 0.67).
On each run, each of the four possible stimuli and its associated reward out-put were presented to the network. The network’s task was to learn to associate between the reward-associated features and a reward output, and we examined the extent to which that was learned for each of the input streams. Learning proceeded as follows: weights from the middle layer units to the output unit (woi) were initialized to 0 and the output unit activation (o) was computed according to equation (1). Then, the difference between the target (t) and actual output activation was used to update the weights to the output unit using the delta rule37
w w t o f w a aoi oij
oj j i( )
where f (x) is the derivative of the activation function, which in this case is
f x f x f x( ) ( )( ( ))gain 1
The learned weights woi reflected the degree to which the network learned to associate each of the stimulus features with the reward output. We therefore used the ratio between these weights to represent the bias in learning perform-ance toward either of the reward-associated features. It is easy to see that the only term that differentiates between the update equations of the two weights is ai, the activation of the respective middle layer unit. Indeed, the ratio between the learned weights followed the ratio between the activation of the two middle layer units. Each run was repeated 100 times, with a random ordering of the stimuli, and the resulting weight ratios were averaged.
(1)(1)
(2)(2)
(3)(3)
(4)(4)
Randomly constructed neural network model. To examine the effects of gain on functional connectivity in a general setting, we constructed a recurrent neu-ral network of 1,000 fully connected units. Weights were randomly sampled from a uniform distribution between −0.01 and 0.01. On every trial, activations were randomly sampled from a uniform distribution between 0 and 1, and then updated in a random order using equation (1) until each unit was updated five times. The same gain was used for all units. The end state was considered as the activation pattern of that trial. For each level of gain, we conducted 500 trials and computed the degree to which each pair of units was correlated across tri-als. The full unit-to-unit correlation matrix was used to compute the clustering coefficient as described below for the fMRI data. We repeated the simulation 100 times, each time with a different randomly determined weight matrix. The gain parameter was limited to values which did not result in consistent wide-spread saturation (that is, so that on average most units are neither above 95% nor below 5% of the maximal activation). We tested the relationship between gain and mean unit-to-unit correlation in two additional alternative settings: when each unit is only connected to a minority (10%) of the other units, and when correla-tions are measured between groups of ten units instead of between single units. Results were qualitatively similar and are therefore not shown.
Participants. 36 naive participants (mean age = 25.1 years, age range = 18–61 years, 22 females) performed the behavioral experiment and 35 naive par-ticipants (mean age = 20.5 years, age range = 18–30 years, 25 females) performed the fMRI experiment. Participants were from the Princeton University area, and gave written informed consent before taking part in the study, which was approved by Princeton University’s institutional review board. Participants in the behavioral experiment received monetary compensation according to their performance on the task ($0.06 per reward point, $13.5–16.2 total, mean $14.88). fMRI partici-pants received monetary compensation for their time, as well as a bonus according to their performance ($0.04 per reward point, $8.04–10.72, mean = $9.47).
Stimuli. The experiment involved 18 stimulus sets, half of which consisted of images of objects and the other half consisted of images of words. Words were generated using the Processing programming environment36, and object images were collected from various sources on the internet using the Creative Commons search interface (http://search.creativecommons.org/) and edited using Adobe Photoshop CS5 (Adobe Systems). To minimize luminance-related changes in pupil diameter, all stimuli were made isoluminant with the background, to best approximation. Word colors were adjusted to be isoluminant using the flicker-fusion procedure38 on the display systems that were used in each experiment. More complex images, which consisted of many colors, were adjusted by scaling all colors so as to equate the mean estimated luminance with the background. For this purpose, luminance of each color was estimated based on its RGB values as 0.2126·R + 0.7152·G + 0.0722·B (http://www.w3.org/Graphics/Color/sRGB). The mean deviation of luminance in images was 29% (range 0% to 76%). Given that within-image variance and deviation of the display system from the sRGB stand-ard might cause slight differences in luminance perception, all of the analyses based on pupil dilation response were repeated using pupil responses to word stimuli only, which did not suffer from these sources of variance. The results of these analyses were similar to those reported here and are therefore not reported for the sake of brevity.
Stimuli were presented using MATLAB software (MathWorks) and the Psychophysics Toolbox39 on a computer monitor (behavioral experiment) or using a projector outside the MRI scanner that displayed the stimuli onto a translucent screen located at the end of the scanner bore (fMRI experiment), which participants viewed through a mirror attached to the head coil. To com-pare BOLD responses to task-relevant and task-irrelevant stimuli, we played 72 task-irrelevant auditory stimuli (phonemes), which participants were instructed to ignore, at random times during the inter-trial intervals in the fMRI experi-ment (four stimuli per game). The phonemes were obtained from http://www.wikipedia.org/ and were, at most, 1 s long.
Behavioral task. Participants chose between pairs of stimuli and received monetary reward according to their choices. On each trial, participants had 3 s to choose between two stimuli, after which the reward was presented for 2 s. Inter-trial interval was varied randomly (uniformly) between 6 and 10 s. We used a relatively long inter-trial interval to allow enough time following each trial for
©20
13 N
atur
e A
mer
ica,
Inc.
All
righ
ts r
eser
ved.
NATURE NEUROSCIENCE doi:10.1038/nn.3428
the pupil dilation response to evolve40. To minimize inter-subject variability, all participants encountered the same stimulus sets in the same order. For the same reason, as well as to speed up learning, participants were presented with both the reward for their choice above the chosen stimulus, and (slightly dimmed) the reward that they could have received if they had chosen the other stimulus (Fig. 1b). No stimulus appeared more than once.
Participants were instructed that stimuli had some properties that predict reward. They then underwent a short training session with a few example trials before starting the task. Unbeknownst to the participants, each stimulus set had one visual feature (bright background, blurry texture, etc.) and one semantic feature (food, sea related, etc.) that was rewarded, and these differed from game to game. For example, in a particular game, choosing a grayscale image or an image of food led to reward while choosing a color image or of office equipment did not. Rewards for the two features were additive, such that choice of a stimulus that possessed both rewarding features resulted in two reward points.
Each of the first two trials included one stimulus that possessed the rewarding visual and semantic features, and therefore yielded two reward points, and one stimulus that possessed neither of the rewarding features, and therefore yielded no reward. In the following ten trials, stimuli differed on either the visual (five trials) or the semantic (five trials) dimension, but not both. These trials allowed us to measure performance on the visual and semantic dimensions separately. Performance was computed as the proportion of trials in which the more highly rewarding stimulus was chosen. One fMRI participant was excluded from the analysis due to lack of cooperation, as evidenced by performance that was lower than chance and frequent eye closing. Performance of all other participants was better than chance. Following completion of the task, participants completed the ILS questionnaire3. Finally, participants filled out a standard debriefing question-naire in which they were asked to rate on a scale of 1 to 5 how interesting they found the experiment, how motivated they were to earn as much as possible, and, in the imaging experiment, how difficult it was for them to maintain attention during the task.
Eye tracking. A desk-mounted ASL model 504 eye-tracker (Applied Science Laboratories) was used to measure participants’ left pupil diameter at a rate of 60 samples per s while they were performing the behavioral task with their head fixed on a chinrest. An ASL Long Range Optics unit was used to measure pupil diameter during the fMRI experiment. Pupil diameter data were processed to detect and remove blinks and other artifacts. At the beginning of the experi-ment, a measurement of pupil diameter at rest was taken for a period of 45 s. All subsequent pupil dilation responses were normalized by the pre-experiment resting pupil diameter. For each trial, baseline pupil diameter was computed as the average diameter over a period of 1 s before the beginning of the trial (at the end of the inter-trial interval, at which point pupil activity from the trial itself should have subsided). Pupil dilation response was computed as the difference between the peak diameter recorded during the 4 s following trial onset and the preced-ing baseline diameter (Fig. 2c). Baseline pupil diameter and dilation response measurements in which more than half of the samples contained artifacts were considered invalid and excluded from the analysis. Only participants with at least 30 valid trials were included in the across-participant analysis of mean pupil dila-tion (n = 35 for the behavioral experiment, n = 30 for the imaging experiment). Only participants for whom at least six games included six valid trials each were included in the game-by-game analysis of baseline pupil diameter (n = 28 for the imaging experiment).
fMRI data acquisition and preprocessing. Functional (EPI sequence, 34 slices covering whole cerebrum, resolution = 3 × 3 × 3 mm with 1-mm gap, repetition time = 2.0 s, echo time = 30 ms, flip angle = 90°) and anatomical (MPRAGE sequence, 256 matrix, repetition time = 2.5 s, echo time = 4.38 ms, flip angle = 8°, 1 × 1 × 1-mm resolution) images were acquired using a 3T Allegra MRI scanner (Siemens). Data were processed using MATLAB and SPM8 (Wellcome Trust Centre for Neuroimaging, University College London). Functional data were motion corrected, and low-frequency drifts were removed with a temporal high-pass filter (cutoff of 0.0078 Hz). Data from four participants whose head moved by more than 2 mm or 2° were excluded from further analysis, leaving 30 participants. Images were normalized to Montreal Neurological Institute (MNI) coordinates. No spatial smoothing was applied. Brains were segmented into gray matter, white matter and cerebrospinal fluid. Mean gray matter, white matter and
cerebrospinal fluid fMRI signals and movement parameters were regressed out of functional data. Cerebrum and frontal lobe MNI coordinates provided with xjView (http://www.alivelearn.net/xjview8/) were used to restrict analysis to gray matter in these areas.
To further validate the results of the regional and whole-brain functional con-nectivity analyses, we repeated these analyses with alternative preprocessing in which stimulus and outcome presentation events (convolved with SPM’s canoni-cal hemodynamic response function) were regressed out of the data, mean gray matter signal was not regressed out, and the analysis was restricted to voxels that were activated in response to task stimuli or outcomes (P < 0.001 uncorrected), as determined by a general linear model that included regressors for stimulus and outcome presentation and for movement parameters. Results were qualitatively similar to the original analysis (Supplementary Figs. 5–7).
General linear model analysis. Two general linear models were used to compare the way the fMRI BOLD signal response to task-relevant and task-irrelevant stimuli varied with baseline pupil diameter and pupil dilation response. Each model included regressors for task-relevant stimuli onset, task-irrelevant stimuli onset, and, for each of these, a parametric regressor that reflected the trial-to-trial variability of either the baseline pupil diameter or the pupil dilation response. In addition, regressors that reflect head movement parameters were included in both models.
Regional functional connectivity analysis. To divide gray matter voxels into uni-formly sized regions, we partitioned each brain recursively into 32 boxes. First, the median x coordinate was used to split all voxels into two boxes. Then, each of the resulting subsets of voxels was divided by its median y coordinate into two boxes. The same procedure was then repeated recursively with the median z coordinates, with the median x coordinates and, finally, with the median y coordinates, result-ing in 32 boxes of voxels. Mean functional connectivity strength was measured for each box in each game as the mean absolute correlation between all voxel pairs in the box. We then computed the across-games correlations of boxes’ mean functional connectivity strength, both between the boxes, and with the baseline pupil diameter and the pupil dilation response.
Whole-brain functional connectivity analysis. To assess pupil-diameter related changes in global functional connectivity, we first computed a full voxel-to-voxel correlation matrix (21,386–29,254 voxels per participant) for each of the 18 games for each participant, using the time series of all cerebral gray matter voxels. We then constructed a 2,000-bin histogram of correlation (connectivity) strengths using the values of each matrix. Game-by-game correlation between the pupil measurements and the number of functional connections were then computed for each bin separately to assess whether there were fewer or more connec-tions of this strength when gain increased (as assessed by pupil measurements). We also calculated the correlation between the pupil measurements and the mean functional connection strength.
Functional-connectivity clustering analysis17. For each functional-connectivity correlation matrix, we constructed a functional connectivity graph in which each voxel was represented by a vertex and two vertices were connected if the absolute value of the correlation between their respective voxels was in the top 0.05% of all voxel-voxel correlations. The 0.05% threshold was chosen so as to limit comput-ing time to an acceptable level, resulting in 233,929 to 431,794 connections per graph. To quantify the degree to which functional connectivity was clustered, we computed each graph’s clustering coefficient18, defined as the number of closed triplets of vertices divided by the number of all connected triplets of vertices. The same analysis was repeated for frontal lobe gray matter voxels alone. Images of connectivity graphs were produced using custom-made software in the Processing programming environment36.
Statistical analysis. Statistical analysis was carried out using MATLAB. All corre-lations values reported are Pearson correlation coefficients. Averaging of correla-tion coefficients was preceded by Fisher r-to-z transformation and followed by Fisher’s z-to-r transformation, so as to mitigate the problem of the non-additivity of correlation coefficients41. Group-level significance of within-participant correlations was tested statistically by converting the correlation coefficients to z values, and then using a t test to determine whether the mean of this set of
©20
13 N
atur
e A
mer
ica,
Inc.
All
righ
ts r
eser
ved.
NATURE NEUROSCIENCEdoi:10.1038/nn.3428
values is significantly different from 0. Significance of across-participant Pearson correlation coefficients was computed using the Student’s t distribution. All tests were two tailed except where indicated otherwise.
37. McClelland, J.L. & Rumelhart, D.E. Explorations in Parallel Distributed Processing: A Handbook of Models, Programs and Exercises (MIT Press, Cambridge, Massachusetts, USA, 1988).
38. Lambert, A., Wells, I. & Kean, M. Do isoluminant color changes capture attention? Percept. Psychophys. 65, 495–507 (2003).
39. Brainard, D.H. The psychophysics toolbox. Spat. Vis. 10, 433–436 (1997).40. Hoeks, B. & Levelt, W.J.M. Pupillary dilation as a measure of attention: a quanti-
tative system analysis. Behav. Res. Methods Instrum. Comput. 25, 16–26 (1993).
41. Fisher, R.A. On the “probable error” of a coefficient of correlation deduced from a small sample. Metron 1, 3–32 (1921).
Supplementary material
The effects of neural gain on attention and learning Eran Eldar, Jonathan D. Cohen, Yael Niv
0.5 0.6 0.7 0.8 0.90
2
4
6
8
10
12
Num
ber o
f par
ticip
ants
Success rate
VisualSemantic
a
0.5 0.6 0.7 0.8 0.90
2
4
6
8
10
Num
ber o
f par
ticip
ants
Success rate
VisualSemantic
b
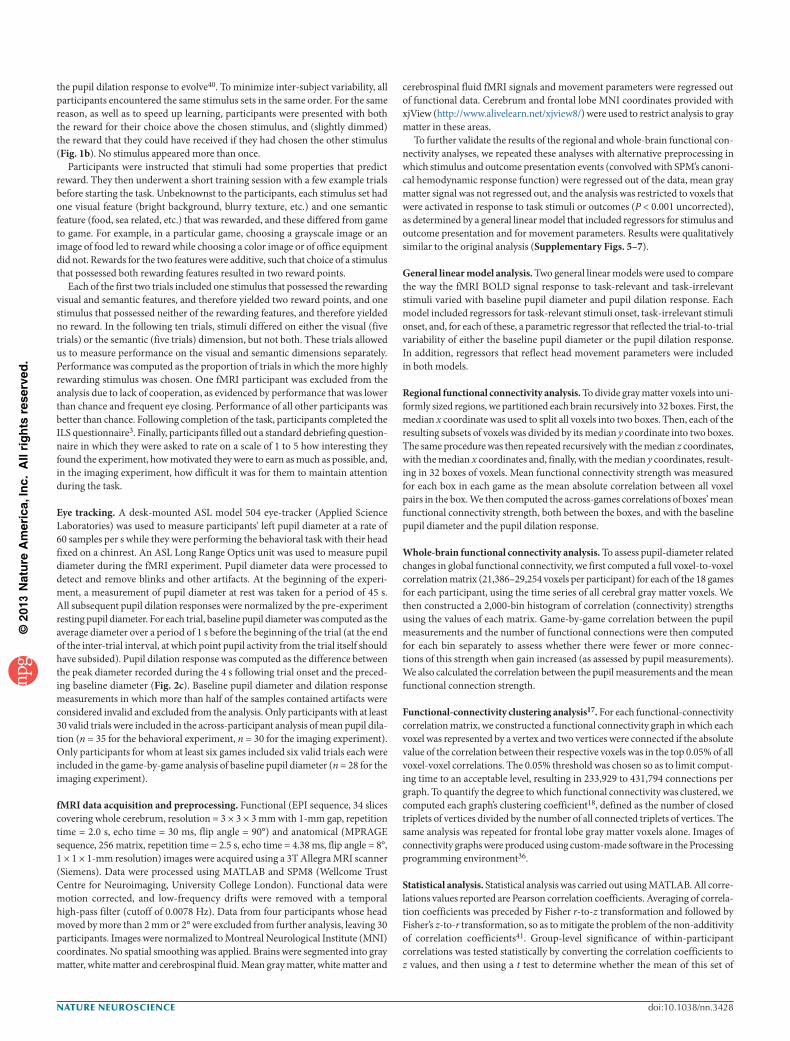
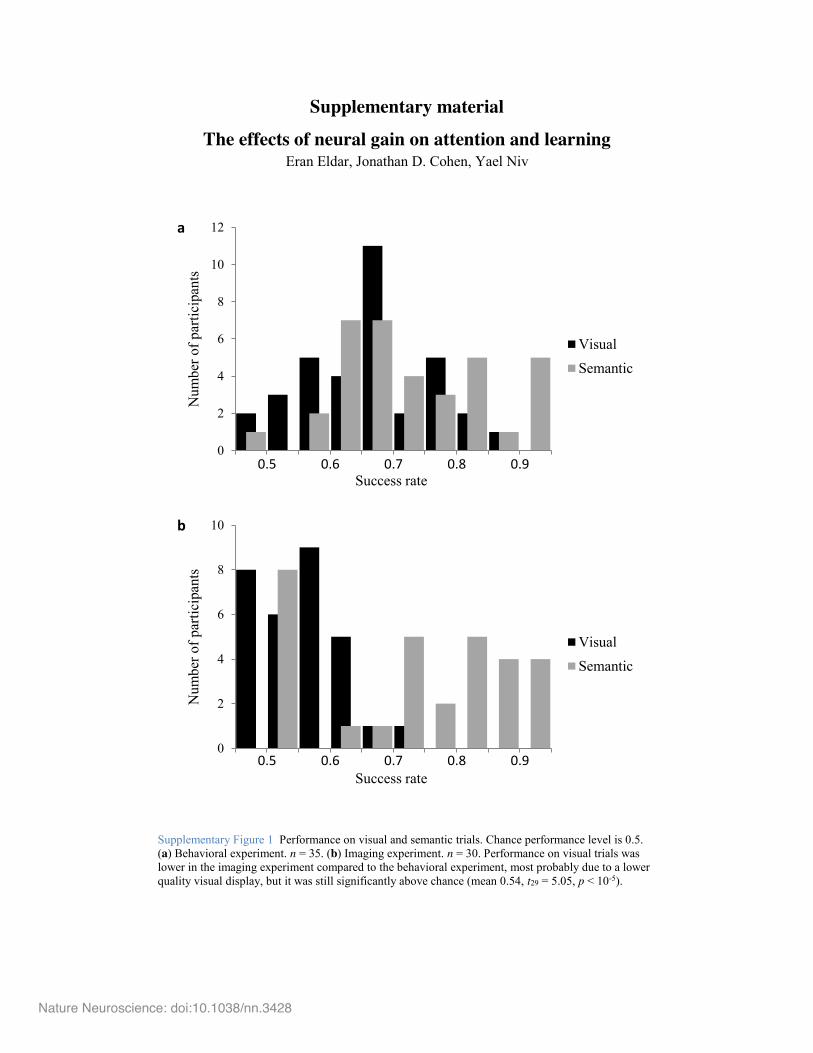
Supplementary Figure 1 Performance on visual and semantic trials. Chance performance level is 0.5. (a) Behavioral experiment. n = 35. (b) Imaging experiment. n = 30. Performance on visual trials was lower in the imaging experiment compared to the behavioral experiment, most probably due to a lower quality visual display, but it was still significantly above chance (mean 0.54, t29 = 5.05, p < 10-5).
Nature Neuroscience: doi:10.1038/nn.3428
-0.3
-0.2
-0.1
0
0.1
0.2
0.3
0.4
-11 -9 -7 -5 -3 -1 1 3 5 7 9 11
Vis
ual-s
eman
tic p
erfo
rman
ce
ILS sensing-intutive score
a
0
5
10
15
20
25
0 10IL
S sc
ore
rang
e
Mean pupil response (%)
r = -0.85p = 0.07
b
-0.5
0
0.5
1
0 5 10 15
Cor
rela
tion
betw
een
ILS
scor
e an
d vi
sual
-sem
antic
per
form
ance
Mean pupil response (%)
r = -0.96p < 0.005
c
-0.3
-0.2
-0.1
0
0.1
0.2
0.3
0.4
-11 -9 -7 -5 -3 -1 1 3 5 7 9 11
Vis
ual-s
eman
tic p
erfo
rman
ce
ILS sensing-intutive score
d
0
5
10
15
20
25
0 10
ILS
scor
e ra
nge
Mean pupil response (%)
e
-0.5
0
0.5
1
0 5 10 15
Cor
rela
tion
betw
een
ILS
scor
e an
d vi
sual
-sem
antic
per
form
ance
Mean pupil response (%)
r = -0.93p < 0.05one tailed
f
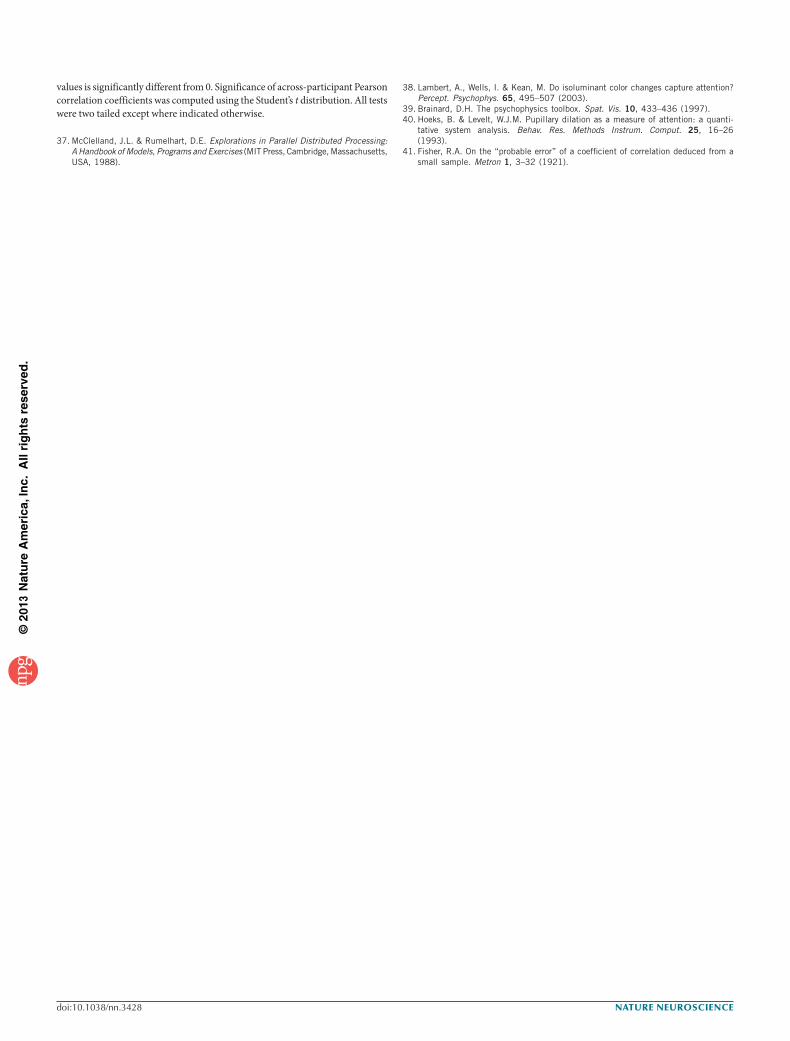
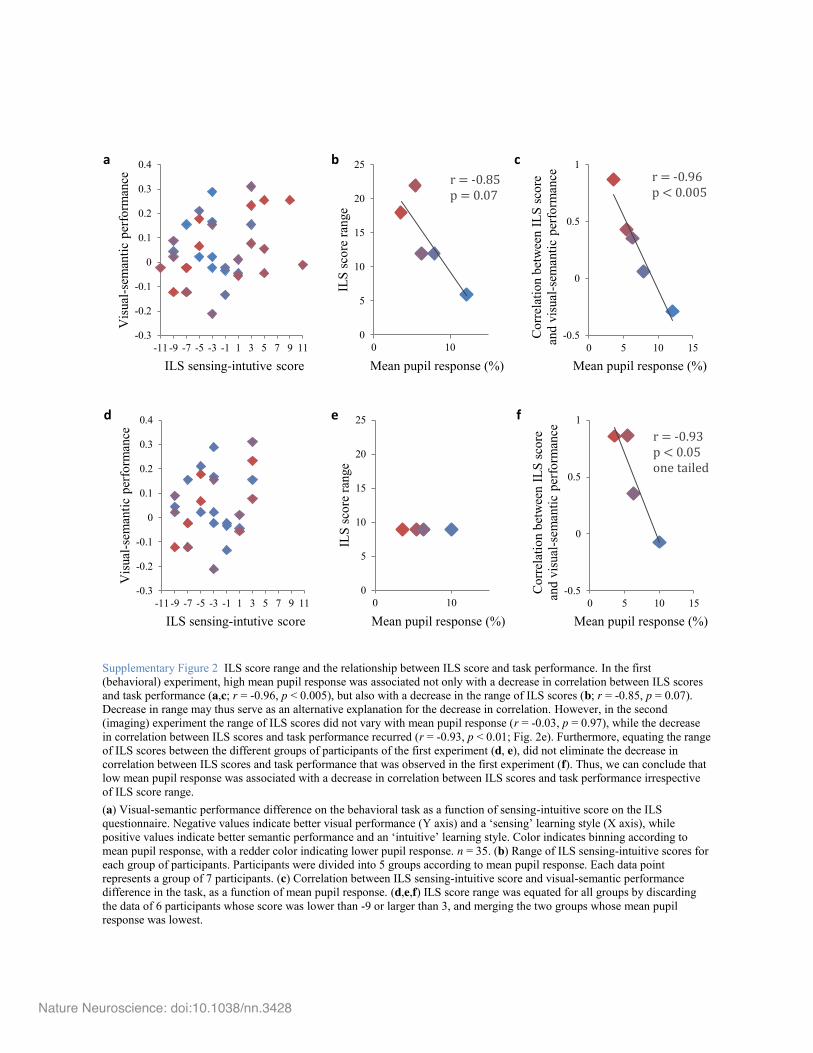
Supplementary Figure 2 ILS score range and the relationship between ILS score and task performance. In the first (behavioral) experiment, high mean pupil response was associated not only with a decrease in correlation between ILS scores and task performance (a,c; r = -0.96, p < 0.005), but also with a decrease in the range of ILS scores (b; r = -0.85, p = 0.07). Decrease in range may thus serve as an alternative explanation for the decrease in correlation. However, in the second (imaging) experiment the range of ILS scores did not vary with mean pupil response (r = -0.03, p = 0.97), while the decrease in correlation between ILS scores and task performance recurred (r = -0.93, p < 0.01; Fig. 2e). Furthermore, equating the range of ILS scores between the different groups of participants of the first experiment (d, e), did not eliminate the decrease in correlation between ILS scores and task performance that was observed in the first experiment (f). Thus, we can conclude that low mean pupil response was associated with a decrease in correlation between ILS scores and task performance irrespective of ILS score range. (a) Visual-semantic performance difference on the behavioral task as a function of sensing-intuitive score on the ILS questionnaire. Negative values indicate better visual performance (Y axis) and a ‘sensing’ learning style (X axis), while positive values indicate better semantic performance and an ‘intuitive’ learning style. Color indicates binning according to mean pupil response, with a redder color indicating lower pupil response. n = 35. (b) Range of ILS sensing-intuitive scores for each group of participants. Participants were divided into 5 groups according to mean pupil response. Each data point represents a group of 7 participants. (c) Correlation between ILS sensing-intuitive score and visual-semantic performance difference in the task, as a function of mean pupil response. (d,e,f) ILS score range was equated for all groups by discarding the data of 6 participants whose score was lower than -9 or larger than 3, and merging the two groups whose mean pupil response was lowest.
Nature Neuroscience: doi:10.1038/nn.3428
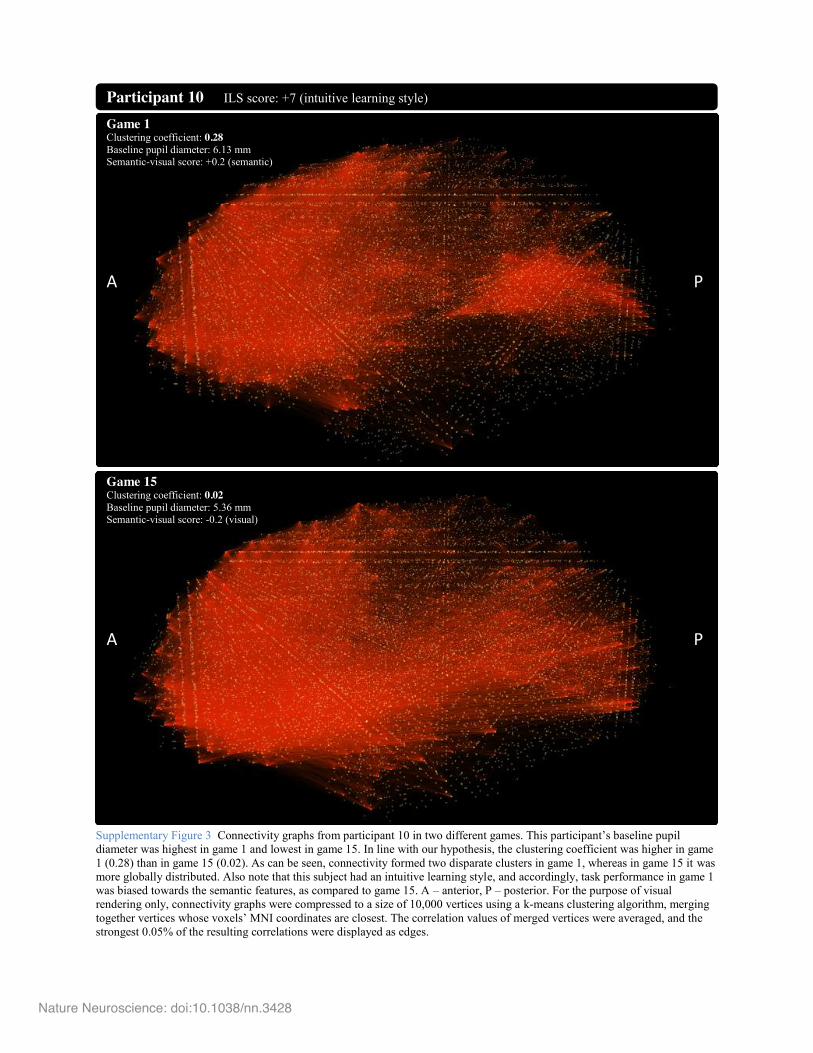
Supplementary Figure 3 Connectivity graphs from participant 10 in two different games. This participant’s baseline pupil diameter was highest in game 1 and lowest in game 15. In line with our hypothesis, the clustering coefficient was higher in game 1 (0.28) than in game 15 (0.02). As can be seen, connectivity formed two disparate clusters in game 1, whereas in game 15 it was more globally distributed. Also note that this subject had an intuitive learning style, and accordingly, task performance in game 1 was biased towards the semantic features, as compared to game 15. A – anterior, P – posterior. For the purpose of visual rendering only, connectivity graphs were compressed to a size of 10,000 vertices using a k-means clustering algorithm, merging together vertices whose voxels’ MNI coordinates are closest. The correlation values of merged vertices were averaged, and the strongest 0.05% of the resulting correlations were displayed as edges.
Game 15 Clustering coefficient: 0.02 Baseline pupil diameter: 5.36 mm Semantic-visual score: -0.2 (visual)
A P
Game 1 Clustering coefficient: 0.28 Baseline pupil diameter: 6.13 mm Semantic-visual score: +0.2 (semantic)
A P
Participant 10 ILS score: +7 (intuitive learning style)
Nature Neuroscience: doi:10.1038/nn.3428
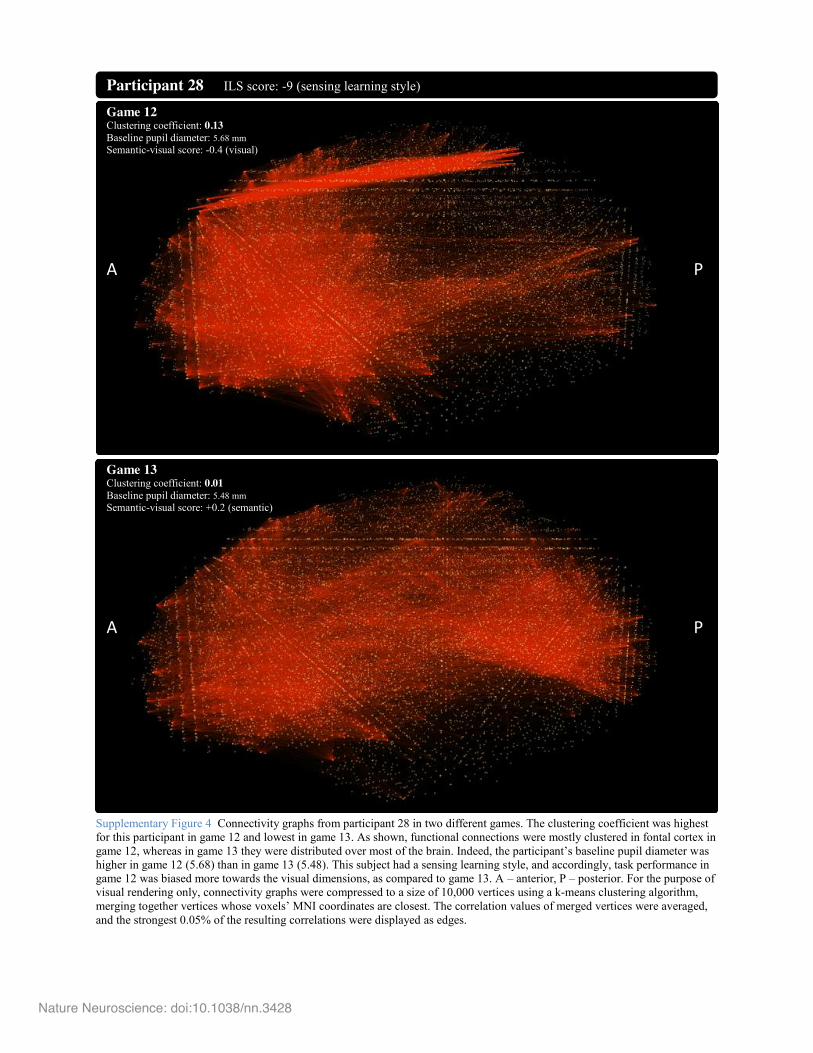
Supplementary Figure 4 Connectivity graphs from participant 28 in two different games. The clustering coefficient was highest for this participant in game 12 and lowest in game 13. As shown, functional connections were mostly clustered in fontal cortex in game 12, whereas in game 13 they were distributed over most of the brain. Indeed, the participant’s baseline pupil diameter was higher in game 12 (5.68) than in game 13 (5.48). This subject had a sensing learning style, and accordingly, task performance in game 12 was biased more towards the visual dimensions, as compared to game 13. A – anterior, P – posterior. For the purpose of visual rendering only, connectivity graphs were compressed to a size of 10,000 vertices using a k-means clustering algorithm, merging together vertices whose voxels’ MNI coordinates are closest. The correlation values of merged vertices were averaged, and the strongest 0.05% of the resulting correlations were displayed as edges.
Game 13 Clustering coefficient: 0.01 Baseline pupil diameter: 5.48 mm Semantic-visual score: +0.2 (semantic)
A P
Game 12 Clustering coefficient: 0.13 Baseline pupil diameter: 5.68 mm Semantic-visual score: -0.4 (visual)
A P
Participant 28 ILS score: -9 (sensing learning style)
Nature Neuroscience: doi:10.1038/nn.3428
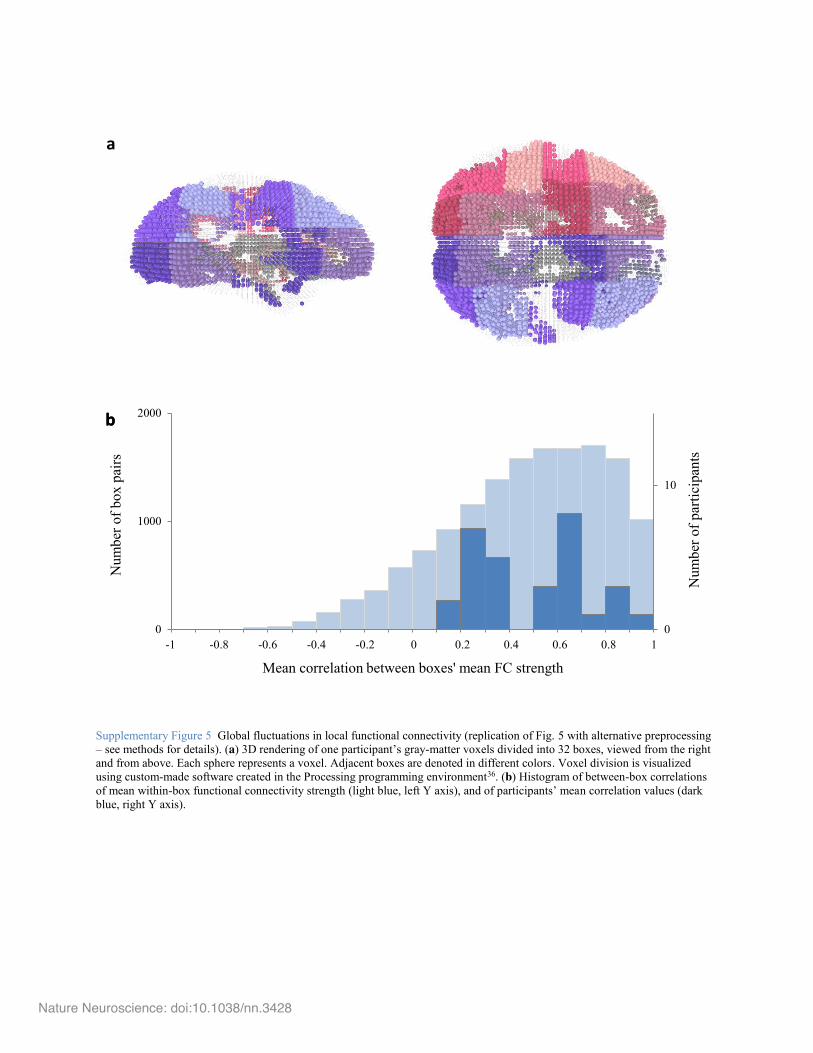
Supplementary Figure 5 Global fluctuations in local functional connectivity (replication of Fig. 5 with alternative preprocessing – see methods for details). (a) 3D rendering of one participant’s gray-matter voxels divided into 32 boxes, viewed from the right and from above. Each sphere represents a voxel. Adjacent boxes are denoted in different colors. Voxel division is visualized using custom-made software created in the Processing programming environment36. (b) Histogram of between-box correlations of mean within-box functional connectivity strength (light blue, left Y axis), and of participants’ mean correlation values (dark blue, right Y axis).
0
10
0
1000
2000
Num
ber o
f par
ticip
ants
Num
ber o
f box
pai
rs
Mean correlation between boxes' mean FC strength
bb
10.80.60.40.20-0.2-0.4-0.6-0.8-1
a
Nature Neuroscience: doi:10.1038/nn.3428
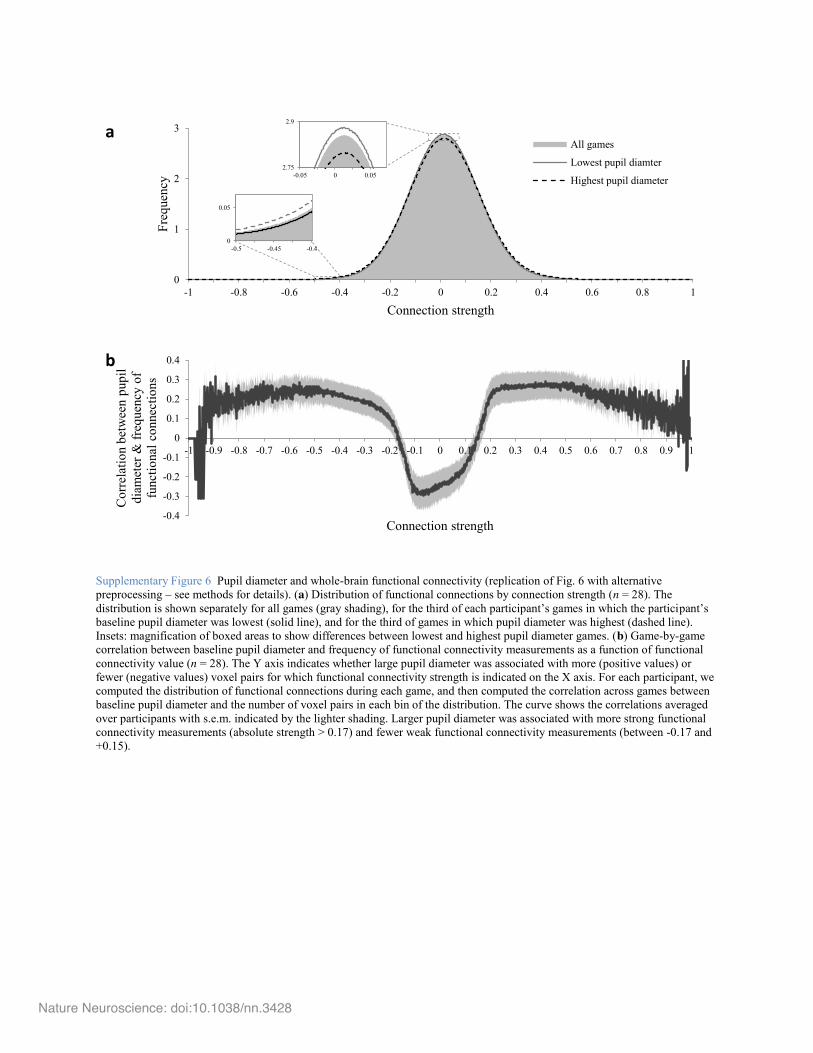
Supplementary Figure 6 Pupil diameter and whole-brain functional connectivity (replication of Fig. 6 with alternative preprocessing – see methods for details). (a) Distribution of functional connections by connection strength (n = 28). The distribution is shown separately for all games (gray shading), for the third of each participant’s games in which the participant’s baseline pupil diameter was lowest (solid line), and for the third of games in which pupil diameter was highest (dashed line). Insets: magnification of boxed areas to show differences between lowest and highest pupil diameter games. (b) Game-by-game correlation between baseline pupil diameter and frequency of functional connectivity measurements as a function of functional connectivity value (n = 28). The Y axis indicates whether large pupil diameter was associated with more (positive values) or fewer (negative values) voxel pairs for which functional connectivity strength is indicated on the X axis. For each participant, we computed the distribution of functional connections during each game, and then computed the correlation across games between baseline pupil diameter and the number of voxel pairs in each bin of the distribution. The curve shows the correlations averaged over participants with s.e.m. indicated by the lighter shading. Larger pupil diameter was associated with more strong functional connectivity measurements (absolute strength > 0.17) and fewer weak functional connectivity measurements (between -0.17 and +0.15).
0
1
2
3
-1 -0.8 -0.6 -0.4 -0.2 0 0.2 0.4 0.6 0.8 1
Freq
uenc
y
Connection strength
All games
Lowest pupil diamter
Highest pupil diameter
a
-0.4
-0.3
-0.2
-0.1
0
0.1
0.2
0.3
0.4
-1 -0.9 -0.8 -0.7 -0.6 -0.5 -0.4 -0.3 -0.2 -0.1 0 0.1 0.2 0.3 0.4 0.5 0.6 0.7 0.8 0.9 1
Cor
rela
tion
betw
een
pupi
l di
amet
er &
freq
uenc
y of
fu
nctio
nal c
onne
ctio
ns
Connection strength
b
2.75
2.9
-0.05 0 0.05
0
0.05
-0.5 -0.45 -0.4
Nature Neuroscience: doi:10.1038/nn.3428
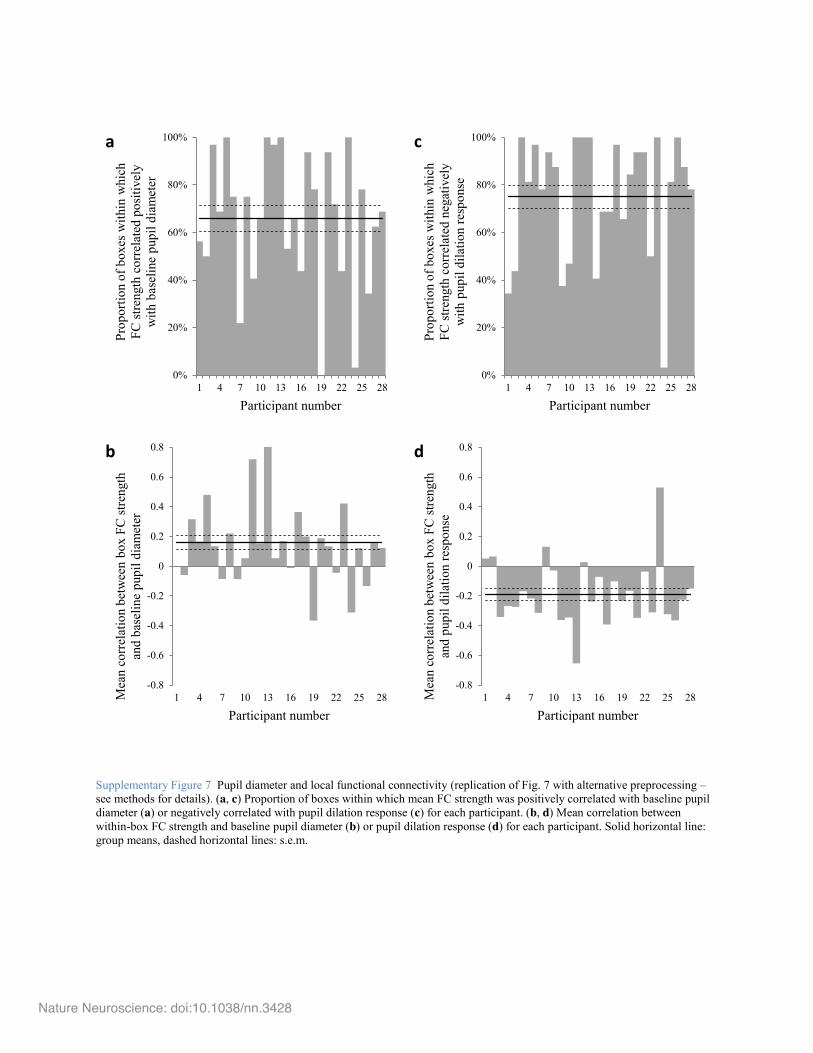
Supplementary Figure 7 Pupil diameter and local functional connectivity (replication of Fig. 7 with alternative preprocessing – see methods for details). (a, c) Proportion of boxes within which mean FC strength was positively correlated with baseline pupil diameter (a) or negatively correlated with pupil dilation response (c) for each participant. (b, d) Mean correlation between within-box FC strength and baseline pupil diameter (b) or pupil dilation response (d) for each participant. Solid horizontal line: group means, dashed horizontal lines: s.e.m.
0%
20%
40%
60%
80%
100%
1 4 7 10 13 16 19 22 25 28
Prop
ortio
n of
box
es w
ithin
whi
ch
FC st
reng
th c
orre
late
d po
sitiv
ely
with
bas
elin
e pu
pil d
iam
eter
Participant number
a
0%
20%
40%
60%
80%
100%
1 4 7 10 13 16 19 22 25 28
Prop
ortio
n of
box
es w
ithin
whi
ch
FC st
reng
th c
orre
late
d ne
gativ
ely
with
pup
il di
latio
n re
spon
se
Participant number
c
-0.8
-0.6
-0.4
-0.2
0
0.2
0.4
0.6
0.8
1 4 7 10 13 16 19 22 25 28Mea
n co
rrel
atio
n be
twee
n bo
x FC
stre
ngth
an
d ba
selin
e pu
pil d
iam
eter
Participant number
b
-0.8
-0.6
-0.4
-0.2
0
0.2
0.4
0.6
0.8
1 4 7 10 13 16 19 22 25 28Mea
n co
rrel
atio
n be
twee
n bo
x FC
stre
ngth
an
d pu
pil d
ilatio
n re
spon
se
Participant number
d
Nature Neuroscience: doi:10.1038/nn.3428
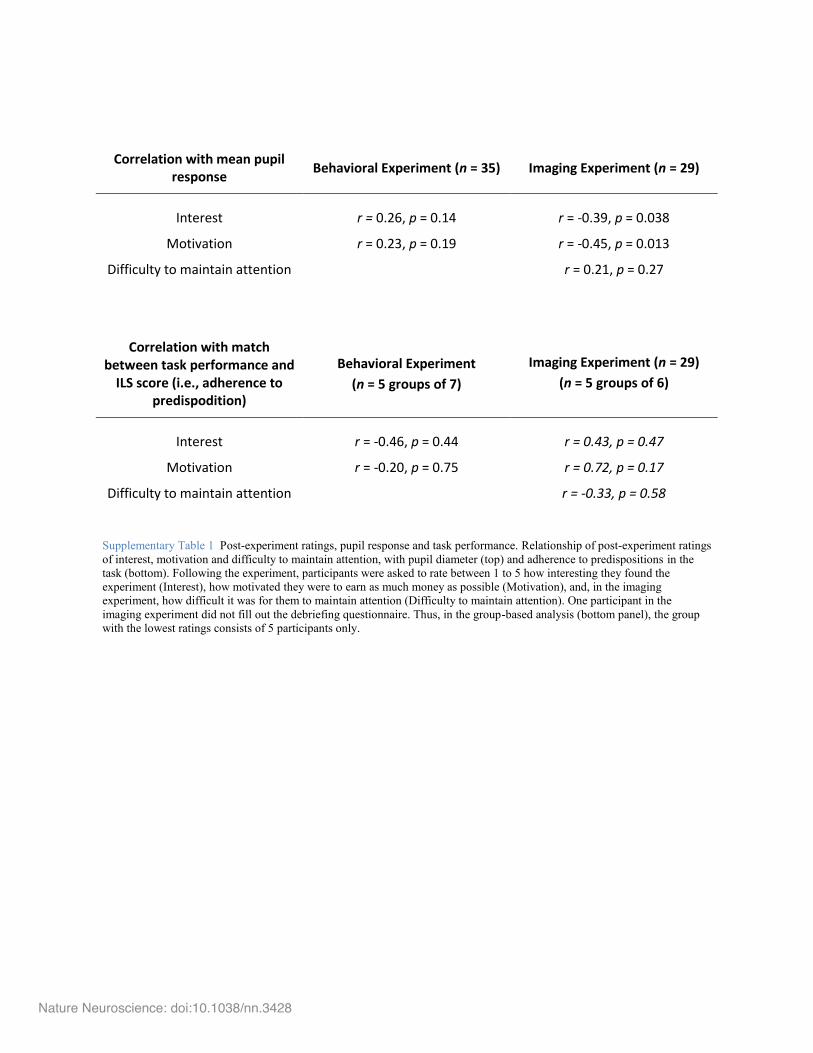
Correlation with mean pupil response
Behavioral Experiment (n = 35) Imaging Experiment (n = 29)
Interest r = 0.26, p = 0.14 r = -0.39, p = 0.038
Motivation r = 0.23, p = 0.19 r = -0.45, p = 0.013
Difficulty to maintain attention r = 0.21, p = 0.27
Correlation with match between task performance and
ILS score (i.e., adherence to predispodition)
Behavioral Experiment
(n = 5 groups of 7)
Imaging Experiment (n = 29)
(n = 5 groups of 6)
Interest r = -0.46, p = 0.44 r = 0.43, p = 0.47
Motivation r = -0.20, p = 0.75 r = 0.72, p = 0.17
Difficulty to maintain attention r = -0.33, p = 0.58
Supplementary Table 1 Post-experiment ratings, pupil response and task performance. Relationship of post-experiment ratings of interest, motivation and difficulty to maintain attention, with pupil diameter (top) and adherence to predispositions in the task (bottom). Following the experiment, participants were asked to rate between 1 to 5 how interesting they found the experiment (Interest), how motivated they were to earn as much money as possible (Motivation), and, in the imaging experiment, how difficult it was for them to maintain attention (Difficulty to maintain attention). One participant in the imaging experiment did not fill out the debriefing questionnaire. Thus, in the group-based analysis (bottom panel), the group with the lowest ratings consists of 5 participants only.
Nature Neuroscience: doi:10.1038/nn.3428