Embed Size (px)
Citation preview

The Effects of Renewable Portfolio Standards on Renewable Energy Sources
Adrienne Ohler
Washington State University [email protected]
Selected Paper prepared for presentation at the American Agricultural Economics
Association Annual Meeting, Portland, OR, July 29-August 1, 2007.
Copyright 2007 by Adrienne Ohler. All right reserved. Readers may make verbatim
copies of this document for non-commercial purposes by any means, provided that this
copyright notice appears on all such copies.
2
Abstract
Renewable Portfolio Standard (RPS) programs have experienced increased popularity at the state level with twenty-three states adopting policies. Policy makers implement these programs in the hopes of stimulating renewable energy generation and lessening the state’s reliance on nonrenewable sources, by requiring utility companies to provide a specified amount of electricity from renewable sources. I examine the use of renewable energy sources caused by the implementation of these programs, and determine how these renewable source markets interact in an RPS setting. Analysis performed on RPS programs indicates an increase in wind energy generation, suggesting that RPS programs are an effective method to increasing generation and reliance on wind energy. Results do not indicate that the renewable energy sources of wind, solar/photovoltaic, and geothermal, compete with one another to provide the lowest cost energy. This may be due to the infancy of the programs with economies of scale yet to be reached.
3
Introduction
Many scientists have come to agree that our increasing energy demands and
outdated energy technology production, such as coal plants and reliance on fossil fuels,
are a large part of this global warming problem. Environmental awareness programs
have helped spurn a favorable political climate for “green” policies that encourage
protection of the environment and natural resources. One area that has gained more
attention is the encouragement and development of renewable energy technologies.
Policies that deal with this topic include renewable energy tax credits, tradable energy
credits, grants for research, and obligatory generation standards. Increasing renewable
energy reduces the reliance on sources which are polluting and environmentally
hazardous, such as coal, oil, and nuclear energy.
One commonly used program in the United States that encourages renewable
energy has been the Renewable Portfolio Standard (RPS), currently enacted in twenty-
three states. RPS programs require utility companies and electricity providers to supply a
specified amount of electricity generated from renewable sources. Often the RPS
program has a credit option which allows trading among firms, so the specified amount is
reached by the industry as a whole rather than by each firm. Because these programs are
relatively new, it is important to consider their impacts on renewable generation as well
as what renewable sources are most affected. This study examines the effects of RPS
initiatives on renewable electricity generation, and analyzes how the different renewable
sources interact in markets with RPS regulations.
This paper is organized in the following way. Section 2 reviews the
implementation and importance of RPS programs in the United States. In section 3, I

4
build a model to examine how RPS programs have affected renewable energy generation.
A review of the data collection process, data caveats, and analysis of the trends in the
time series follows. The econometric models developed to analyze the data are discussed
in section 5. Results and interpretation are presented in Section 6. I conclude with
research suggestions and policy implications.
Review of Renewable Portfolio Standards in the United States
US citizens have become increasingly concerned with the pollution caused by
fossil fuels. With global warming and climate change becoming a hot topic in political
spheres, state and local governments have begun to address these environmental issues
and concerns. Furthermore, the war in Iraq brought increased awareness about the US
economy’s dependence on foreign oil. Darmstadter (1992) examines how countries
control energy use and how that control can affect the lack of conservation. Concerns
about pollution, global warming, and foreign affairs have turned many people’s attention
toward renewable energy sources, and Darmstadter discusses the uncertainty of how
much renewable energies would rise if fossil-fuels prices reflected their social cost. For
hundreds of years people have tried to capture energy from wind, water, and solar energy
for the purposes of cooking or generating power. Switching electricity generation from
non-renewable sources to renewable ones would decrease the amount of pollution and
hazardous materials created, decrease the US economy’s reliance on foreign oil, and
reduce the global impact on climate change.

5
Table 1. Rules, Regulations and Policies for Renewable Energy
State PBF Disclosure Rebates Grants Loans Production
Incentive
RPS
Alabama 4-U 1-S 1-S, 1-U 1-U
Alaska 2-S 1-U
Arizona 6-U 1-U 1-S
Arkansas
California 1-S 1-S 3-S, 19-U, 2-L
1-L 1-U, 1-S 1-S 1-S
Colorado 1-L 1-S 4-U, 1-L 3-U, 1-L 1-L 1-S, 1-L
Connecticut 1-S 1-S 1-S 5-S 4-S 1-P 1-S
Delaware 1-S 1-S 1-S 2-S 1-S
Florida 1-S 1-S, 2-U 1-S 1-U 1-U
Georgia 3-U 4-U 1-U
Hawaii 3-U 2-U, 1-L 1-S
Idaho 2-P 1-S
Illinois 1-S 1-S 1-S 3-S, 1-P 1-S
Indiana 4-U
Iowa 1-S 3-U 1-S 2-S 1-S
Kansas 1-S
Kentucky 1-P, 6-U 1-P, 3-U
Louisiana 1-S
Maine 1-S 1-S 1-S 1-S 1-S
Maryland 1-S 1-S, 1-L 2-S 1-S
Massachusetts 1-S 1-S 1-S, 1-U 3-S 2-S, 1-U 1-S, 1-P 1-S
Michigan 1-S 1-S 4-S
Minnesota 1-S 1-S 1-S, 18-U 3-U 3-S, 1-U 1-S, 3-U 2-S
Mississippi 3-U 1-S 1-U
Missouri 3-U 1-S 1-S 1-L
Montana 1-S 1-S 1-U 2-P, 1-U 1-S 1-S
Nebraska 3-U 1-S
Nevada 1-S 1-S 1-S 1-S
New Hampshire 2-U 1-S
New Jersey 1-S 1-S 2-S 1-S 1-S 1-S
New Mexico 1-U 1-S
New York 1-S 1-S 3-S, 2-U 1-S 2-S 1-S
N. Carolina 1-S 1-U, 1-P
North Dakota
Ohio 1-S 1-S 2-S 2-S
Oklahoma
Oregon 1-S 1-S 2-S , 6-U 2-P, 1-S 1-S, 5-U
Pennsylvania 1-S 1-S 3-S, 4-L 2-S, 5-L, 1-U
1-S
Rhode Island 1-S 1-S 1-S, 1-U 1-P 1-S
S. Carolina 1-S, 2-U 5-U
South Dakota
Tennessee 1-S 1-S 1-U
Texas 1-S 6-U 1-S, 1-L
Utah
Vermont 1-S 1-S 1-S 1-U 1-U 1-S
Virginia 1-S
Washington 1-S 8-U 2-P 6-U 3-U, 1-S 1-S
West Virginia
Wisconsin 1-S 1-S, 2-U 2-S, 1-U 1-U 2-U 1-S
Wyoming 1-S, 1-U
Totals 18 24 142 53 78 27 28
S = State/Territory L = Local U = Utility P = Private
Database of State Incentives for Renewables and Efficiency (http://www.dsireusa.org/)
6
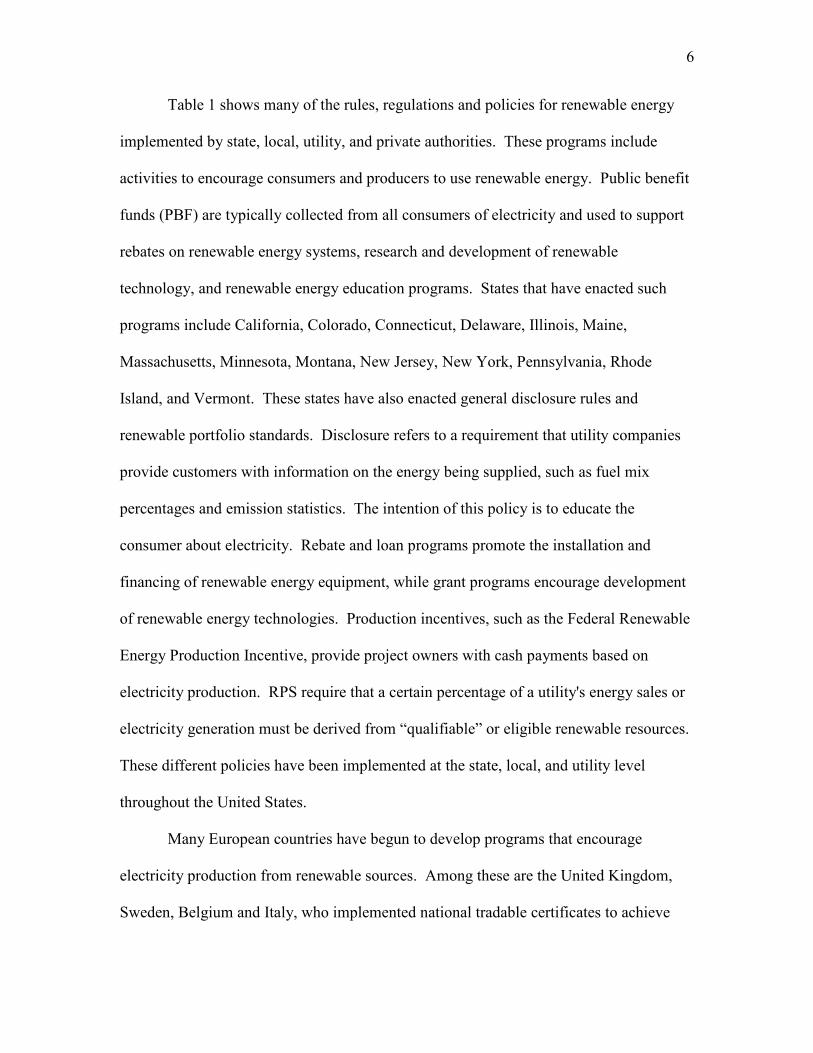
Table 1 shows many of the rules, regulations and policies for renewable energy
implemented by state, local, utility, and private authorities. These programs include
activities to encourage consumers and producers to use renewable energy. Public benefit
funds (PBF) are typically collected from all consumers of electricity and used to support
rebates on renewable energy systems, research and development of renewable
technology, and renewable energy education programs. States that have enacted such
programs include California, Colorado, Connecticut, Delaware, Illinois, Maine,
Massachusetts, Minnesota, Montana, New Jersey, New York, Pennsylvania, Rhode
Island, and Vermont. These states have also enacted general disclosure rules and
renewable portfolio standards. Disclosure refers to a requirement that utility companies
provide customers with information on the energy being supplied, such as fuel mix
percentages and emission statistics. The intention of this policy is to educate the
consumer about electricity. Rebate and loan programs promote the installation and
financing of renewable energy equipment, while grant programs encourage development
of renewable energy technologies. Production incentives, such as the Federal Renewable
Energy Production Incentive, provide project owners with cash payments based on
electricity production. RPS require that a certain percentage of a utility's energy sales or
electricity generation must be derived from “qualifiable” or eligible renewable resources.
These different policies have been implemented at the state, local, and utility level
throughout the United States.
Many European countries have begun to develop programs that encourage
electricity production from renewable sources. Among these are the United Kingdom,
Sweden, Belgium and Italy, who implemented national tradable certificates to achieve
7
targets adopted by member states of the European Union under the Renewables
Directive. Australia and Japan have also developed RPS programs for wholesale
electricity suppliers. (Palmer and Burtraw 2005). These initiatives aboard provide
support to the claim that there exists a movement towards encouraging the generation of
electricity from renewable sources.
Growing support by voters in the United States for programs that encourage
resource sustainability has motivated policy changes. One of the most common policies
for encouraging renewable energy generation in US state government is the RPS. In his
analysis of renewable energy, Darmstadter (2004) suggests enacting a national RPS. His
basis for this policy change is centered on the encouragement of stimulating renewable
and sustainable energy sources, and the benefits of reduced environmental damage. RPS
initiatives require electricity companies to provide a certain percentage of electricity that
is derived from renewable resources. The RPS is a market-driven policy that ensures that
the public benefits from renewable sources, such as wind, solar, and geothermal energy.
It does this by requiring that a minimum amount of renewable energy is included in the
portfolio of electricity resources serving a state.
The supply of electricity starts with different sources generating electricity.
Utility companies include investor-owned, publicly owned, cooperatives, and Federal
utilities, which produce electricity placed on a regional grid system. Most electricity
supplied to customers comes from the same grid system. There exists a level of demand
that is constant throughout the year, while seasons cause variability in the demand. This
constant level of demand requires a baseload of production that is often filled by coal or
nuclear power plants. Electricity from renewable sources is typically variable upon

8
weather, and helps to fill the seasonal demand rather than the baseload capacity. If a
utility company is not able to meet the demands of its customers, then it may purchase
electricity from other generating sources or utilities. Since all energy is placed on the
same grid system, the supply of electricity to the consumer is uninterrupted.
Table 2. RPS program details by State through 2003
State Beginning and Last Specified Requirements
Accepts Existing Capacity
Out-of-State Supply
Credit Trading
Arizona 0.2-1.1% of sales, 2001-2007 No Solar only Yes
California +1% of sales per year, to 20.0% by 2017 Yes Yes No
Connecticut 6.5-10.0% of generation, 2003-2010 Yes Yes Yes
Hawaii 9.0% of sales by 2010 Yes NA No
Illinois 15.0% of sales by 2020 NS No No
Iowa 105 megawatts (no set date) No NS No
Maine 30.0% of sales by 1999 Yes Yes Yes
Massachusetts 1.0-4.0% of sales, 2003-2009 No Yes Yes
Minnesota 1,125 megawatts wind by 2010+ 125 megawatts biomass No Yes No
Nevada 5.0-15.0% of sales, 2003-2013;5% of requirements must be solar Yes Yes Yes
New Jersey 3.0-6.5% of sales, 2001-2008 Yes Yes Yes
New Mexico 5.0-10.0% of sales, 2006-2011 Yes Yes Yes
Pennsylvania Individual agreements with five utilities NS NS NS
Texas 400-2,000 megawatts, 2003-2009 No Yes Yes
Wisconsin 0.5-2.2% of sales, 2001-2011 Yes Yes Yes
Source: Petersik 2003.
When a state implements an RPS, then a utility company must produce or
purchase a specified percentage or amount of electricity from renewable sources. The
RPS rules and requirements can vary from state to state. Table 2 shows the breakdown of
the different RPS programs in the United States. The goals for required levels range from
1.1% to 30% of sales, while Texas and Iowa require a specific megawatt amount. Most
states accept renewable energy from existing capacity, except Arizona, Iowa,
Massachusetts, Minnesota, and Texas. Arizona and Illinois are the only two states that
do not allow out-of-state supplies, although Arizona does allow solar energy to be

9
imported. Minnesota and California are the only two states that do not have credit
trading programs between firms to encourage efficiency. Arizona gives additional credits
for solar produced energy.
Table 3. Eligible Renewable Sources by State
State
Bio-mass
Geo-thermal
Hydro- electric
Landfill Gas
Municipal Solid Waste
Ocean or Tidal Solar Wind
Arizona Yes Yes No Yes NS No Yes Yes
California Yes Yes Small only Yes Yes Yes Yes Yes
Connecticut Yes No Small only Yes Yes Yes Yes Yes
Hawaii Yes Yes Yes Yes Yes Yes Yes Yes
Illinois NS NS NS NS NS NS Yes Yes
Iowa Yes NS Small only Yes Yes NS Yes Yes
Maine Yes Yes Small only Yes Yes Yes Yes Yes
Massachusetts Yes No No Yes No Yes Yes Yes
Minnesota Yes No Small only Yes Yes No Yes Yes
Nevada Yes Yes Small only Yes No No Yes Yes
New Jersey Yes Yes Small only Yes No Yes Yes Yes
New Mexico Yes Yes Small only Yes No No Yes Yes
Pennsylvania Yes Yes No Yes No Yes Yes Yes
Texas Yes Yes Yes Yes No Yes Yes Yes
Wisconsin Yes Yes Small only Yes No Yes Yes Yes
NS=Not Specified Source: Petersik 2003.
Table 3 shows the eligible renewable sources for each of the states through 2003.
While all states allow biomass, landfill gas, solar, and wind, most only allow small
hydroelectric sources if it is allowed at all. Small hydroelectric refers typically refers to
plants smaller than 5 to 30 megawatts; however Wisconsin and Maine accept plants up to
60 and 100 megawatts. A few states that do not have access to geothermal availability,
such as Connecticut, Massachusetts, and Minnesota, do not consider it in their RPS
programs. California, Connecticut, Hawaii, Iowa, Maine, and Minnesota are the only
states to allow municipal solid waste (MSW). Ocean and tidal sources are allowed by
10
most states, however this source of energy is relatively small and as of 2003 no
commercial operations used these resources.
The RPS allows for a market-driven approach to the production of renewable
electricity. Non-renewable sources are often cheaper to produce than renewable sources,
because they fail to fully capture the cost of pollution externalities. Darmstadter (2003)
believes that renewable energy cannot exist in the market without subsidization. To
justify the need for the subsidies, he considers the distortions of externalities from fossil
fuels and nuclear power. However, he further suggests that policies such as tradable
credits for meeting RPS requirements are beneficial because they induce a trading
mechanism to hedge prices. The requirement for utilities to meet a standard amount of
renewable electricity encourages a separation between the two sources of energy. Thus,
renewable energies do not have to compete for market share with non-renewable sources.
However, with most RPS programs, competition for market share among renewable
energy encourages the production of the cheapest forms of renewable energy. The cost
of producing electricity from renewable sources varies by the form from which it is
derived. Wind, geothermal, and landfill gas are typically the least expensive, while solar
and hydroelectric sources have very costly initial start-up as well as expensive
maintenance (Darmstadter 2003). Depending on location, some prices have been in the
range of 3 to 5.5 cents per kilowatt hour, while the cost of solar has remained much
higher around 84 cents per kilowatt hour. Coal and combined-cycle gas (CCG) averaged
around 4 cents per kilowatt hour. Thus, RPS programs allow for the private market to
increase competition, efficiency, and innovation in the renewable energy sector to deliver

11
renewable energy at the lowest possible cost. Tradable credits help to further this
competition.
Palmer and Burtraw (2005) also compare policies meant to encourage the use of
renewable resources. They develop a model that predicts future generation under
different policies, and find RPS programs to be more cost-effective at increasing
renewable generation than a renewable energy production credit (REPC). However, a
REPC is more likely to lower electricity prices, while a cap-and-trade policy is the most
cost-effective. They further examine which policies are the most effective at reducing
carbon emissions. They find RPS to be less effective at decreasing emission than a direct
tax. Although RPS programs help reduce carbon emission, the increase in renewable
energy displaces mostly natural gas which is less polluting than coal. While the price of
electricity and the renewable credits are expected to increase under an RPS, generation
from both coal and natural gas sources should decrease. They conclude that RPS
programs are superior to the alternative policies.
Comparing policies, technology subsidies and production tax credits encourage
renewable energy generation but not in such a competitive framework as RPS. In a non-
competitive setting, renewable energy is not necessarily produced in the least expensive
form. These policies will help to encourage current renewable energy generation as well
as affect investments in the long run. Through these instruments, renewable energy can
enter the electricity market with non-renewable energy sources. Madlener, and Stagl
(2005) compares feed-in tariffs, that provide a required level of revenue from selling
renewable electricity, to tradable green certificates of a RPS and bidding schemes. They
find that using socio-ecological economically differentiated feed-in tariffs ensures
12
constant technological diversity and investment among renewable energy, but they point
out the trade-off between encouraging diversity and the guarantee of a quota achievement
as in the RPS. This shows that RPS may not be the best policy for encouraging a
diversity of investment in renewable technology.
Previous researchers have predicted different impacts from RPS programs.
Bernow (1997) examines the impact of a national RPS, comparing several different
scenarios and base cases. He finds that under a national RPS of 4%, wind will account
for nearly one-third renewable generation not including hydroelectricity by 2010, while
geothermal and MSW will account for greater than 25%. Biomass and solar are expected
to share 10% and 4% of renewable generation. Palmer and Burtraw (2005) predict that
with a RPS program between 5%–10% renewable energy will be mostly met by
geothermal and biomass sources, while higher levels (10%-20%) will induce wind
generation to become a major component. Macauley et al (2002) finds wind-power to be
the most likely to increase in capacity because of its low operating cost and large
potential for technological advancements. However, renewable development will also be
dependent on the growth of CCG technology.
This study examines if states with RPS programs have experienced an increased
amount of renewable energy generation, and if these programs result in the sort of
resource use voters intend. Analysis is performed on the generation of wind energy and
RPS programs, as well as its interaction with other renewable energy generation, such as
solar/ photovoltaic, and geothermal sources.
Model for Wind Energy Production
Since RPS programs have grown in popularity, I examine the impact they have on
13
renewable generation. These programs intend to stimulate renewable energy through
competitive markets, and this study examines how well RPS programs have performed.
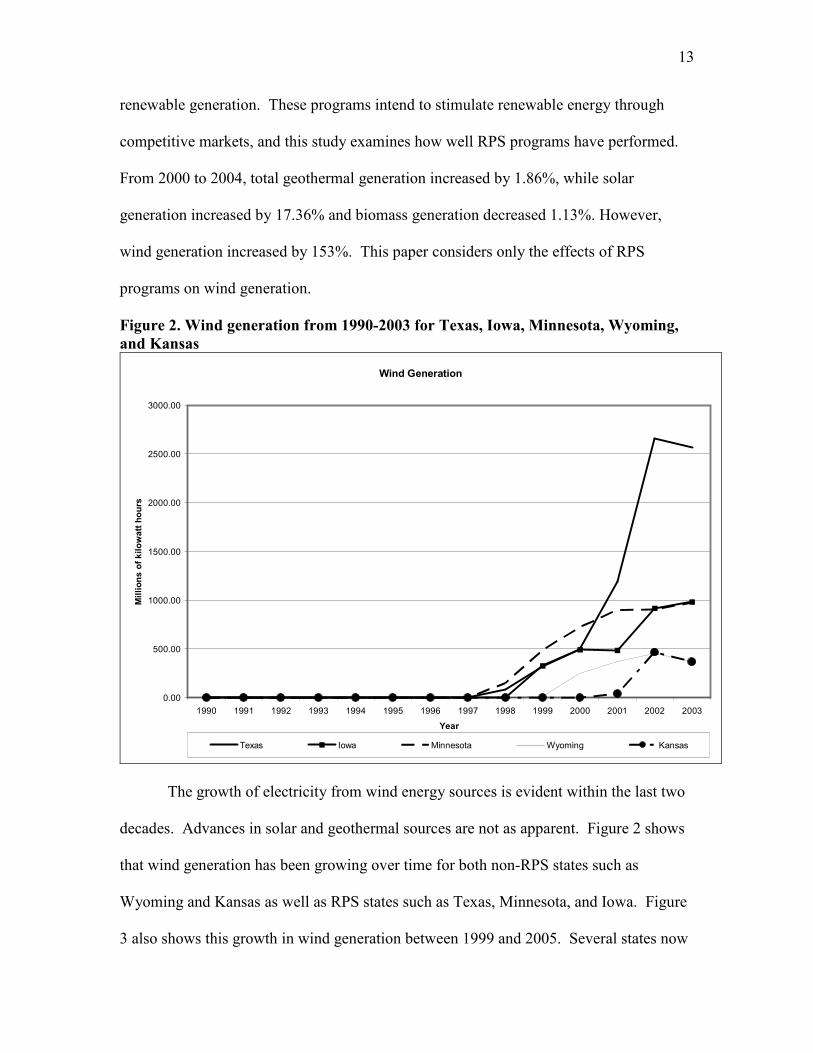
From 2000 to 2004, total geothermal generation increased by 1.86%, while solar
generation increased by 17.36% and biomass generation decreased 1.13%. However,
wind generation increased by 153%. This paper considers only the effects of RPS
programs on wind generation.
Figure 2. Wind generation from 1990-2003 for Texas, Iowa, Minnesota, Wyoming,
and Kansas
Wind Generation
0.00
500.00
1000.00
1500.00
2000.00
2500.00
3000.00
1990 1991 1992 1993 1994 1995 1996 1997 1998 1999 2000 2001 2002 2003
Year
Millions of kilowatt hours
Texas Iowa Minnesota Wyoming Kansas
The growth of electricity from wind energy sources is evident within the last two
decades. Advances in solar and geothermal sources are not as apparent. Figure 2 shows
that wind generation has been growing over time for both non-RPS states such as
Wyoming and Kansas as well as RPS states such as Texas, Minnesota, and Iowa. Figure
3 also shows this growth in wind generation between 1999 and 2005. Several states now
14
Figure 3. United States Wind Power Capacity in 1999 and 2006
Source: Department of Energy – National Renewable Energy Laboratory.
http://www.eere.energy.gov/windandhydro/windpoweringamerica/wind_installed_capacity.asp
have a much larger capacity to generate wind then in 1999. RPS states with notable
increases are again Texas, Iowa, Colorado, and Minnesota. However, some states

15
without RPS programs have also had increased capacity, such as Oregon, Wyoming, New
Mexico, Kansas, and Oklahoma.
The trends of solar and geothermal are not distinctly growth oriented. These
substitutes for wind energy compete in the renewable energy market and the impacts of
RPS programs are unclear by looking at time trends. Figure 4 captures the solar
generation for three states with and without RPS programs. Virginia is the only state
among the three without an RPS program. While Texas has seen increased generation of
solar energy, Virginia and Arizona have experienced declines. This may be due to
differences in public policies, such as solar subsidies or credit trading.
Figure 4. Solar Generation for Texas, Virginia, and Arizona
Solar Generation
-100
0
100
200
300
400
500
600
1990 1991 1992 1993 1994 1995 1996 1997 1998 1999 2000 2001 2002 2003
Year
Thousands of kilowatt hours
Texas Virginia Arizona
Figure 5 captures geothermal trends for Utah, Nevada, and Hawaii states. Hawaii
is the only state of the three with an RPS program. Utah appears to provide consistent
levels of electricity from geothermal sources, while Nevada has provided decreasing
amounts. These figures and trends demonstrate the impact RPS programs have had on

16
wind capacity and generation. Other sources, such as solar and geothermal energy appear
to have been impacted less.
Figure 5. Geothermal Generation for Utah, Nevada, and Hawaii
Geothermal Generation
0.00
200.00
400.00
600.00
800.00
1000.00
1200.00
1400.00
1600.00
1800.00
1990 1991 1992 1993 1994 1995 1996 1997 1998 1999 2000 2001 2002 2003
Year
Millions of kilowatt hours
Utah Nevada Hawaii
Observing the market for wind allows for the examination of interactions and
competition between potential renewable sources. Furthermore, over the last decade
wind generation has made substantial gains while solar and geothermal sources growth
have not been as noticeable. The model for the quantity of wind energy can be viewed as
an inverse supply function of electricity. A typical supply function from economic theory
examines price as a function of the amount produced and price of substitutes with
equation 1 demonstrating this function.
(1) Psupply
=f(Qsupply
, Psubstitutes
).
Inverting the supply function allows for analysis of the quantity produced. Equation 2
expresses this inverted supply function for the quantity of wind energy generated.

17
Including substitutes in the function allows for analyzing the interaction of renewable
sources.
(2) Wind=g(price electricity, price of alternative renewable
generation, price of non-renewable generation, size of market,
policy and regulation).
The amount of electricity generated is a function of the price received for
production. As the price increases, the benefits from investing in capital, building
turbines and producing wind energy become greater. Given an increasing supply
function, more electricity can be supplied at a higher price. Because wind energy
produces a relatively small share of electricity consumed, endogeneity from quantity
affecting price is not considered.
The prices of substitute goods also affect the quantity produced. Electricity is
homogeneous once produced from either renewable or non-renewable sources. These
alternative sources provide acceptable substitutes and competition for wind energy
generation. Thus, wind energy generation is a function of the cost of generating
electricity from both renewable and non-renewable sources. The demand or size of the
electricity market also affects the quantity supplied. Larger markets generate more
electricity due to a higher demand, while smaller markets have to meet a lower demand
and require a smaller baseload or capacity for electricity. The electricity demand is
smaller in Rhode Island than in California, thus affecting the amount that needs to be
supplied.
Finally, policies and regulations can encourage or discourage the use and
ultimately the generation of electricity from wind energy. Kumbaroglu, Madlener, and
Demir (2004) find that investment in renewable energy technology is only possible
18
through policy and governmental promotion. The EPACT and RPS policies are
considered to have a positive impact on wind generation because it encourages reliance
on renewable energy sources. EPACT encourages wind through production tax credits,
while RPS encourages wind through competition and guaranteed market share for
renewable energy (EIA).
Although input and factor cost are sometimes considered when examining cost
functions, I make the assumption that input costs are constant throughout the analysis.
This allows for a simpler model when analyzing the impacts of policy on RPS and the
competition among renewable energy. Including these factors would account for any
investment or technology developments that may have impacted renewable generation.
Potential future research for this project would include input costs and technology
developments, and examine their effect with RPS programs.
Data Collection and Caveats
While some states such as Iowa, Massachusetts, and Minnesota enacted RPS
legislation in the 1990s, other states such as Illinois, Montana, Vermont, and Washington
have endorsed programs only in the last two years. This contrast between states and
legislation dates provides a natural study of RPS and its effect on renewable energy
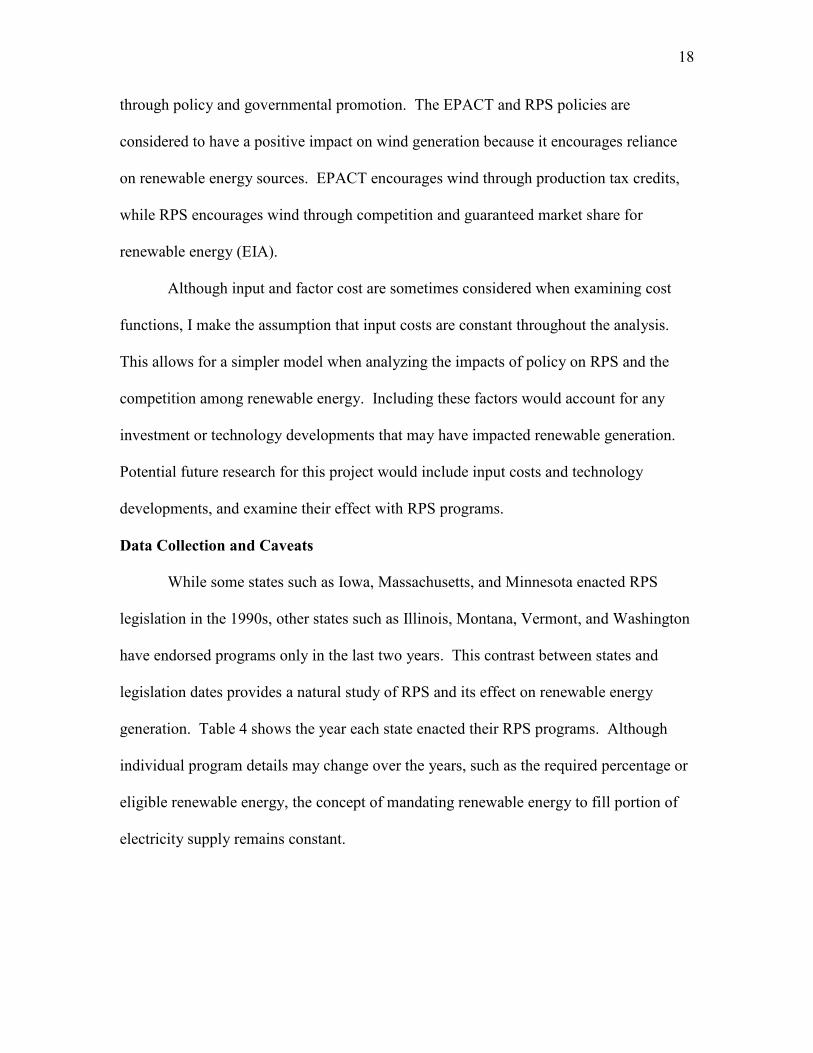
generation. Table 4 shows the year each state enacted their RPS programs. Although
individual program details may change over the years, such as the required percentage or
eligible renewable energy, the concept of mandating renewable energy to fill portion of
electricity supply remains constant.
19
Table 4. Year RPS legislation was enacted by State
State Year
Enacted State Year
Enacted
Arizona 2001 Montana 2005
California 2002 Nevada 1997
Colorado 2004 New Jersey 2001
Connecticut 1999 New Mexico 2002
Delaware 2005 New York 2004
Hawaii 2004 Pennsylvania 2004
Illinois 2005 Rhode Island 2004
Iowa 1991 Texas 1999
Maine 1999 Vermont 2005
Maryland 2004 Washington 2006
Massachusetts 1997 Wisconsin 1999
Minnesota 1997
Source: Rabe 2006.
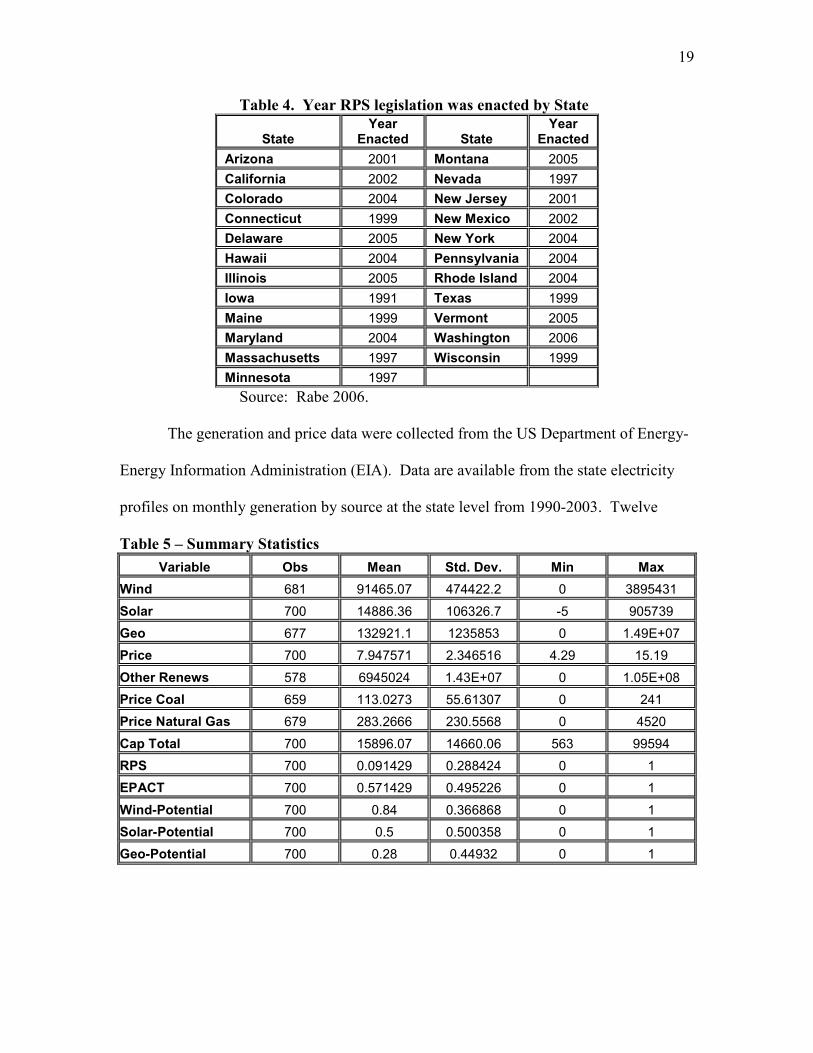
The generation and price data were collected from the US Department of Energy-
Energy Information Administration (EIA). Data are available from the state electricity
profiles on monthly generation by source at the state level from 1990-2003. Twelve
Table 5 – Summary Statistics
Variable Obs Mean Std. Dev. Min Max
Wind 681 91465.07 474422.2 0 3895431
Solar 700 14886.36 106326.7 -5 905739
Geo 677 132921.1 1235853 0 1.49E+07
Price 700 7.947571 2.346516 4.29 15.19
Other Renews 578 6945024 1.43E+07 0 1.05E+08
Price Coal 659 113.0273 55.61307 0 241
Price Natural Gas 679 283.2666 230.5568 0 4520
Cap Total 700 15896.07 14660.06 563 99594
RPS 700 0.091429 0.288424 0 1
EPACT 700 0.571429 0.495226 0 1
Wind-Potential 700 0.84 0.366868 0 1
Solar-Potential 700 0.5 0.500358 0 1
Geo-Potential 700 0.28 0.44932 0 1
20
states in this study enacted legislation before 2003: Arizona, California, Connecticut,
Iowa, Maine, Massachusetts, Minnesota, Nevada, New Jersey, New Mexico, Texas, and
Wisconsin. Table 5 shows the summary statistic for each variable.
Electricity price data were collected from the state profiles. Price is the average
retail price of electricity over all sectors (residential, commercial, and industrial) in each
state. Measured in 2005 cents per kilowatt hours from 1990-2003, prices ranged from
$4.29 for Washington in 1992 to $15.19 for Hawaii in 2000. Price accounts for the
increasing marginal cost of electricity produced.
No price data existed for renewable sources, so generation data by source were
collected and analyzed in place of prices. Renewable electric power net generation is
captured by the variables Wind, Solar, Geothermal, and Other Renewables, which are
measured in thousands of kilowatt hours. This paper only examines the interaction
between wind, solar/ photovoltaic, and geothermal heat pump sources. From table 2,
solar and wind are eligible renewable sources in all states with RPS programs, while
geothermal is eligible for states that have the potential to capture geothermal energy.
Hydroelectric plants, however, are not analyzed because only a small number of states
allow a particular form of hydroelectric power. Furthermore, the supply of energy from
biomass is not analyzed under the RPS programs because of their damage to the
environment. Biomass includes energy from landfill gas, wood, wood waste, agricultural
by-products, straw, tires, fish oils, paper pellets, tall oil, sludge waste, digester gas,
methane, and waste alcohol. Nevertheless, the impacts from these two sources as
substitutes are accounted for in the model through the Other Renewables variable, which

21
includes hydroelectric, municipal solid waste (MSW), landfill gas, wood and wood
waste, and other waste.
Price data for coal and natural gas were collected to account for the price of
substitutes from non-renewable sources. Price of Coal and Price of Natural Gas captures
electric power fuel price for coal and natural gas, which is measured in cents per million
Btu. Price of Coal ranges from $0 in California to $2.41 in Maine, and averaged $1.13
million Btu. Price of Natural Gas averaged $2.83 for a million Btu. Natural gas,
nuclear, and hydroelectric plants generate a majority of the electricity in California
making a Price of Coal of $0 not unusual. In states where other resources generate a
majority of the electricity for the state, the Price of Natural Gas is often $0.
Total Capacity for each state is the power industries’ ability to produce electricity
from all sources. The electric power industry capability measured in megawatts for the
total electric industry averaged about 15,900 megawatts. Rhode Island had the lowest
capacity in 1990 with 563 megawatts. Texas had the highest capacity in 2003 at 99,594
megawatts.
Policies and regulations can encourage or discourage the use and ultimately the
generation of electricity from wind energy. The RPS and EPACT variables control for
policy developments over the period. The RPS variable is used to capture the effect of
policy and RPS programs. This binary variable indicates whether a state had a
mandatory RPS law on the books for each year. A one indicates a state with an RPS.
Between 1990 and 2003 twelve states adopted RPS policies, with Iowa starting in 1991.
EPACT is a binary variable that accounts for the years when the federal government’s
22
Energy Policy Act supported wind generation through production tax credits. This policy
was enacted in 1992, but was not supported past 1999.
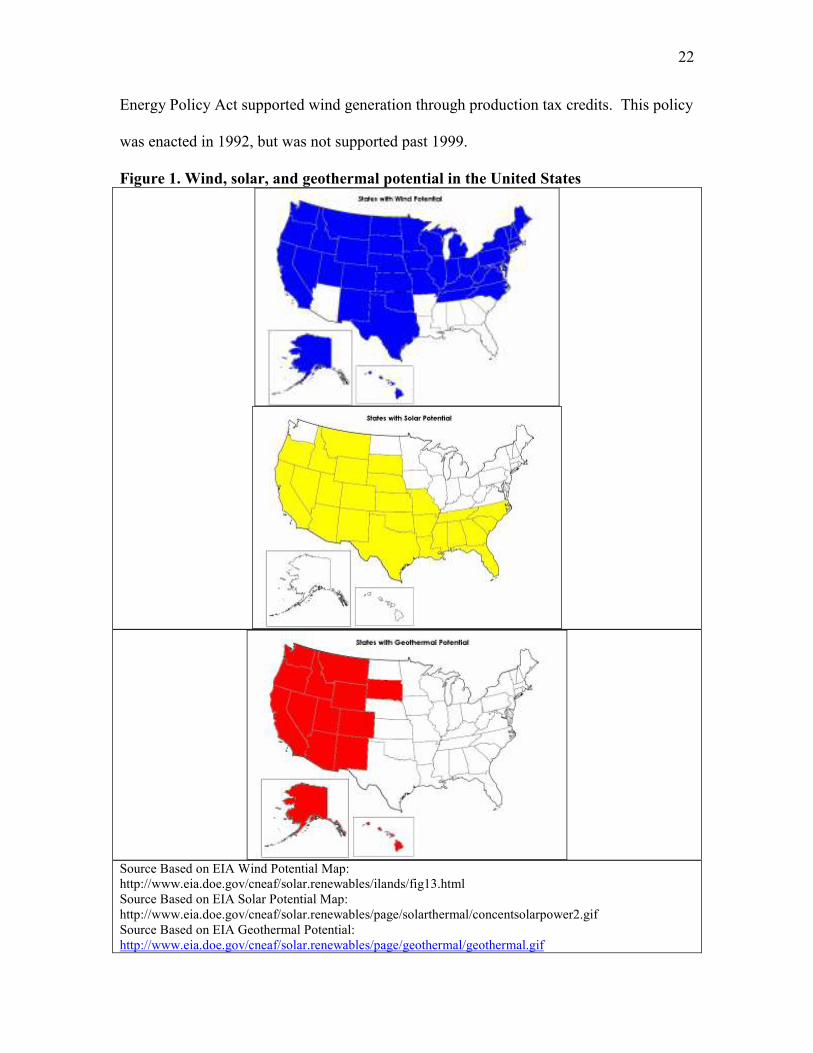
Figure 1. Wind, solar, and geothermal potential in the United States
Source Based on EIA Wind Potential Map: http://www.eia.doe.gov/cneaf/solar.renewables/ilands/fig13.html Source Based on EIA Solar Potential Map: http://www.eia.doe.gov/cneaf/solar.renewables/page/solarthermal/concentsolarpower2.gif Source Based on EIA Geothermal Potential: http://www.eia.doe.gov/cneaf/solar.renewables/page/geothermal/geothermal.gif
23
Wind Potential, Solar Potential, and Geothermal Potential are each dummy
variables that account for whether a state has the potential to produce renewable energy.
Figure 1 shows the wind, solar, and geothermal potential in the United States. Although
all states may have some potential, only states with high potential are noted. Wind has 42
states with potential, while solar and geothermal have 25 and 14 states with potential.
The lack of price data for renewable energy creates a problem for evaluating them
as substitutes. Instead, quantity or generation data is available. Because of the functional
relationship between price and quantity of a good, generation data is used in place of
price data without much loss to the theoretical analysis. Further problems exist with data
that the EIA does not disclose for the purpose of keeping confidential generation
information of individual firms. These observations that are not released are missing for
the wind, geothermal, other renewables, price of coal, and price of natural gas. However,
they make note that some amount of energy is produced by a firm. If a number is
released, then clearly at least two firms are producing energy. Because of the missing
data, these observations are dropped from the analysis without much loss to the data set.
Econometric Model for Estimating Wind Generation
The supply of wind energy generated is a function of several factors, including
price of electricity, prices of substitutes, size of the market, and public policy. The data
collected is dynamic panel data, which implies a simple OLS model will be biased and
inconsistent due to autocorrelation between observations. An Arellano-Bond model
accounts for the dynamics of the data while still allowing for economic interpretation of
changes in variables (Arellano and Bond 1991). The Arellano-Bond model corrects for
autocorrelation between observations in the panel by differencing the variables and

24
including a lagged difference of the dependent variable. This GMM approach accounts
for the dynamic process in the data as well as considering each state as a panel. This type
of model also accounts for panel-specific correlations, so variations due to group
characteristics are considered in the structure of the model. The equation used to
examine the interactions, between RPS programs and renewable energy sources, is shown
in the wind model (equation 3).
(3) ∆Windit=β0+β1L.∆Windit-1 +β2∆Priceit+β3∆Solarit+ β4∆Geothermalit +
β5∆Other Renewablesit + β6∆Price of Coalit +β7∆Price of
Natural Gasit +β8∆Total Capacityit +β9RPSit +β10EPACTit
+β11Wind Potentialit +∆εit
This model captures the impact of RPS programs on wind generation. By
including the first differences to account for dynamics, equation 3 analyzes the effect
RPS has on the change in wind from one year to the next. The estimated coefficient for
this parameter is expected to be positive. Including Other Renewables, Price of Coal,
and Price of Natural Gas controls for other substitutes in the market, while Total
Capacity controls for the size of the market. EPACT and Wind Potential control for other
policy and technology impacts.
Furthermore, this model examines the interaction between different renewable
sources. Specifically, it analyzes the effect of changes in Solar and Geothermal on
changes in wind generation. Because of its small share in the electricity market, other
sources of energy both renewable and non-renewable can have a large impact on wind
energy. These sources are in competition with wind suppliers and should be considered
substitute goods. Thus, wind energy generation is a function of renewable and non-
renewable source generation. All renewable energy variables are expected to be
competitors in the renewable energy sector. Thus, the sign of their coefficients are
25
expected to be negative, because of the substitutability from one to another. Sources that
provide cheaper energy with a lower cost of initial investment or technology development
will be more competitive in the industry.
Examining the renewable energy market, it is possible that the amount of wind
produced affects solar and geothermal generation. Because of this possible endogeneity,
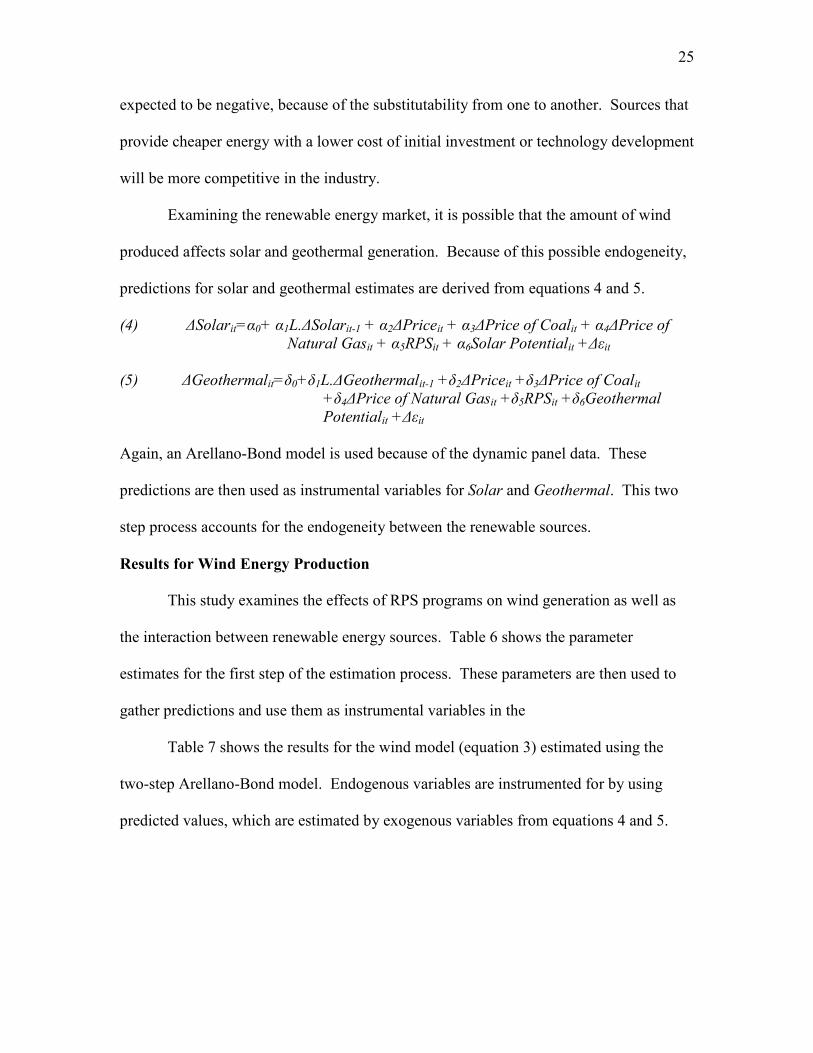
predictions for solar and geothermal estimates are derived from equations 4 and 5.
(4) ∆Solarit=α0+ α1L.∆Solarit-1 + α2∆Priceit + α3∆Price of Coalit + α4∆Price of
Natural Gasit + α5RPSit + α6Solar Potentialit +∆εit
(5) ∆Geothermalit=δ0+δ1L.∆Geothermalit-1 +δ2∆Priceit +δ3∆Price of Coalit
+δ4∆Price of Natural Gasit +δ5RPSit +δ6Geothermal
Potentialit +∆εit
Again, an Arellano-Bond model is used because of the dynamic panel data. These
predictions are then used as instrumental variables for Solar and Geothermal. This two
step process accounts for the endogeneity between the renewable sources.
Results for Wind Energy Production
This study examines the effects of RPS programs on wind generation as well as
the interaction between renewable energy sources. Table 6 shows the parameter
estimates for the first step of the estimation process. These parameters are then used to
gather predictions and use them as instrumental variables in the
Table 7 shows the results for the wind model (equation 3) estimated using the
two-step Arellano-Bond model. Endogenous variables are instrumented for by using
predicted values, which are estimated by exogenous variables from equations 4 and 5.

26
Table 6. Parameter estimates for equations 4 and 5 used to calculate instrumental
variables for Solar and Geothermal
∆Solar ∆Geothermal
Number of observations 548 Number of observations 522
Number of groups 50 Number of groups 50
Wald chi2(7) 555.91 Wald chi2(7) 92.89
Coef. Std. Err. Coef. Std. Err.
L.∆Solar 0.6876*** 0.036987 L.∆Geothermal -0.2318*** 0.038605
∆Total
Capacity 1.704*** 0.582142 ∆Total Capacity -1.08204 4.535193
∆Price of
Coal -133.49*** 44.00156 ∆Price of Coal -217.518 220.272
∆Price of
Natural Gas -4.612 4.165907
∆Price of
Natural Gas -45.490** 20.49119
∆Price 896.938 2674.526 ∆Price -104435.8*** 13400.27
RPS -2266.85 1763.585 RPS 228.451 9230.906
Solar
Potential -1933.957*** 615.9989
Geothermal
Potential 603.388 3963.65
Constant -151.176 596.0608 Constant -12221.09*** 3081.979
*,**,*** represent 10%, 5%, and 1% significance levels, respectively.
The estimated coefficient for changes Price is negative, but not statistically
significant which contradicts the hypothesis above. As price increases, there is more
opportunity for profit, and wind energy will increase its production. The results do not
indicate that positive changes in prices will affect the change in wind generation in a
positive way. Due to wind’s small market share, this result may signal that wind is not
yet affected by price, or that technological developments have changed the cost of
production.
The positive coefficients for Solar -IV, and Geothermal-IV are again not as
expected but the positive coefficient provide some evidence that renewable energy
sources are not yet in competition with each other due to the infancy of RPS programs.
27
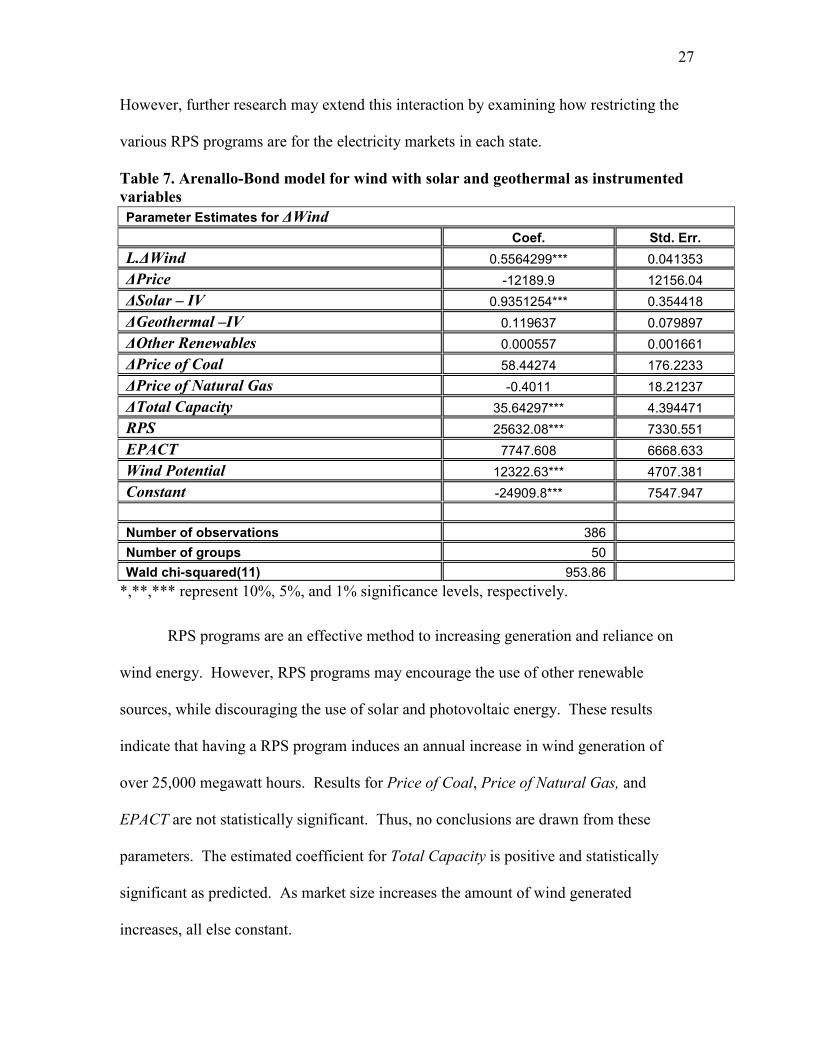
However, further research may extend this interaction by examining how restricting the
various RPS programs are for the electricity markets in each state.
Table 7. Arenallo-Bond model for wind with solar and geothermal as instrumented
variables
Parameter Estimates for ∆Wind
Coef. Std. Err.
L.∆Wind 0.5564299*** 0.041353
∆Price -12189.9 12156.04
∆Solar – IV 0.9351254*** 0.354418
∆Geothermal –IV 0.119637 0.079897
∆Other Renewables 0.000557 0.001661
∆Price of Coal 58.44274 176.2233
∆Price of Natural Gas -0.4011 18.21237
∆Total Capacity 35.64297*** 4.394471
RPS 25632.08*** 7330.551
EPACT 7747.608 6668.633
Wind Potential 12322.63*** 4707.381
Constant -24909.8*** 7547.947
Number of observations 386
Number of groups 50
Wald chi-squared(11) 953.86
*,**,*** represent 10%, 5%, and 1% significance levels, respectively.
RPS programs are an effective method to increasing generation and reliance on
wind energy. However, RPS programs may encourage the use of other renewable
sources, while discouraging the use of solar and photovoltaic energy. These results
indicate that having a RPS program induces an annual increase in wind generation of
over 25,000 megawatt hours. Results for Price of Coal, Price of Natural Gas, and
EPACT are not statistically significant. Thus, no conclusions are drawn from these
parameters. The estimated coefficient for Total Capacity is positive and statistically
significant as predicted. As market size increases the amount of wind generated
increases, all else constant.

28
The RPS coefficient is positive and statistically significant. This result supports
the hypothesis suggesting that RPS programs are an effective method to increasing
generation and reliance on wind energy. Results indicate that having a RPS program
increases the changes in wind generation from year t to year t+1 by over 25,000
megawatt hours. Wind Potential is also statistically significant indicating that areas with
higher potential generate more electricity from wind than areas with low or no potential.
Conclusion
Environmental awareness has increased in the United States over the last decades.
This awareness is evident in the number of governmental policies at the federal, state, and
local levels aimed at protecting the air, water, and land we use. The Renewable Portfolio
Standard program has become common among state governments because it encourages
reliance on renewable energy to generate electricity. These programs use competition
and market incentives promote increased production of electricity from renewable
sources. This paper examines the impact of RPS programs on wind energy generation, as
well as the interaction and possible competition between wind, solar, and geothermal
energy sources.
This analysis finds that RPS programs do affect wind electricity generation in a
positive way. Policy implications for these RPS programs include review and revision of
policies to encourage sources that are both sustainable, renewable, and help to reduce
environmental damage. However, more research is needed to examine the effects of RPS
programs on other renewable energy sources, such as landfill gases, hydroelectric
sources, and other biomass energies.
29
Results of this analysis also indicate that solar and geothermal sources are not
negatively affecting wind generation. This implies that among these three renewable
sources, competition is not prevalent. This may be due to the infancy of the RPS
programs, or the residual effects of other government programs, such as production
credits or subsidies, that do not encourage competition.
Further research includes the addition of variables that control for developments
and changes in technology. Clearly, policy changes help to encourage the use of
renewable energy sources, but including technology will control for any innovative
techniques that could reduce the cost of producing renewable energy. Potential future
research for this project would include input costs and examine their effect with RPS
programs. Also, including input costs would be critical for this additional analysis.
RPS programs separate renewable and non-renewable energy markets to
encourage sustainability but still maintain competition to create efficiency. Further
discussion can be extended by examining this separation and possibility in encouraging
other “green” initiatives in such areas as recycling vs. waste disposal, public vs. private
transportation, and fuel efficient vs. low efficient vehicles.

30
References
Arellano, Manuel, and Stephen Bond. “Some Tests of Specification for Panel Data: Monte Carlo Evidence and an Application to Employment Equations.” Review of Economic Studies. 58.2 (Apr. 1991): 277-297.
Bernow, Stephen, William Dougherty, and Max Duckworth. “Quantifying the Impacts of
a National Tradable Renewables Portfolio Standard.” The Electricity Journal (May 1997).
Darmstadter, Joel. “Stimulating Renewable Energy: A Green Power Initiative.” New
Approaches to Energy and the Environment. Resources for the Future. (2004): 28-33.
Darmstadter, Joel. “Energy Transitions.” Global Development and the Environment:
Database of State Incentives for Renewables and Efficiency. Financial Incentives for
Renewable Energy http://www.dsireusa.org/summarytables/financial.cfm?&CurrentPageID=7&EE=1&RE=1 (Accessed May 8, 2007).
Database of State Incentives for Renewables and Efficiency. Renewable Portfolio
Standards. http://www.dsireusa.org/documents/SummaryMaps/RPS_Map.ppt (Accessed May 10, 2007).
Database of State Incentives for Renewables and Efficiency. Rules, Regulations, &
Policies for Renewable Energy
http://www.dsireusa.org/summarytables/reg1.cfm?&CurrentPageID=7&EE=1&RE=1 (Accessed May 8, 2007).
Department of Energy - National Renewable Energy Laboratory. Installed U.S. Wind
Capacity.
http://www.eere.energy.gov/windandhydro/windpoweringamerica/wind_installed_capacity.asp (Accessed May 17, 2007).
Energy Information Administration. Electricity Net Generation From Renewable
Energy. http://www.eia.doe.gov/cneaf/solar.renewables/page/trends/table11.html (Accessed May 10, 2007).
------------. Geothermal Potential.
http://www.eia.doe.gov/cneaf/solar.renewables/page/geothermal/geothermal.gif (Accessed May 15, 2007).
-----------. Legislation Affecting the Renewable Energy Marketplace.
http://www.eia.doe.gov/cneaf/solar.renewables/page/legislation/impact.htm (Accessed April 10, 2007).
31
------------. Solar Potential.
http://www.eia.doe.gov/cneaf/solar.renewables/page/solarthermal/concentsolarpower2.gif (Accessed May 15, 2007).
------------. Wind Potential.
http://www.eia.doe.gov/cneaf/solar.renewables/ilands/fig13.html (Accessed May 15, 2007).
Kumbaroglu, Gurkan, Reinhard Madlener, and Mustafa Demir. “A Real Options
Evaluation Model for the Diffusion Prospects of New Renewable Power Generation Technologies.” Centre for Energy Policy and Economics. Working Paper (Sept. 2004).
Macauley et al. “Measuring the Contribution to the Economy of Investments in
Renewable Energy: Estimates of Future Consumer Gains.” Resources for the Future. (Feb. 2002).
Madlener, Reinhard, and Sigrid Stagl. “Sustainability-guided promotion of renewable
electricity generation.” Ecological Economics. 53 (2005): 147-167. Palmer, Karen, and Dallas Burtraw. “Cost-Effectiveness of Renewable Electricity
Policies.” RFF DP 05-01 (Jan. 2005). Petersik, Thomas. “State Renewable Energy Requirements and Goals: Status Through
2003.” Energy Information Administration. http://www.eia.doe.gov/oiaf/analysispaper/rps/index.html (Accessed May 9, 2007).
Rabe, Barry G. “Race to the Top: The Expanding Role of U.S. State Renewable
Portfolio Standards.” Pew Center on Global Climate Change (June 2006). http://www.pewclimate.org/docUploads/RPSReportFinal%2Epdf (Accessed May 9, 2007).