Embed Size (px)
Citation preview

University of Tennessee, Knoxville University of Tennessee, Knoxville
TRACE: Tennessee Research and Creative TRACE: Tennessee Research and Creative
Exchange Exchange
Masters Theses Graduate School
8-2011
The Effects of Roasting Time and Temperature on the Antioxidant The Effects of Roasting Time and Temperature on the Antioxidant
Capacity of Cocoa Beans from Dominican Republic, Ecuador, Capacity of Cocoa Beans from Dominican Republic, Ecuador,
Haiti, Indonesia, and Ivory Coast Haiti, Indonesia, and Ivory Coast
Whitney Leigh Harrington [email protected]
Follow this and additional works at: https://trace.tennessee.edu/utk_gradthes
Part of the Food Chemistry Commons, Food Processing Commons, and the Other Food Science
Commons
Recommended Citation Recommended Citation Harrington, Whitney Leigh, "The Effects of Roasting Time and Temperature on the Antioxidant Capacity of Cocoa Beans from Dominican Republic, Ecuador, Haiti, Indonesia, and Ivory Coast. " Master's Thesis, University of Tennessee, 2011. https://trace.tennessee.edu/utk_gradthes/976
This Thesis is brought to you for free and open access by the Graduate School at TRACE: Tennessee Research and Creative Exchange. It has been accepted for inclusion in Masters Theses by an authorized administrator of TRACE: Tennessee Research and Creative Exchange. For more information, please contact [email protected].

To the Graduate Council:
I am submitting herewith a thesis written by Whitney Leigh Harrington entitled "The Effects of
Roasting Time and Temperature on the Antioxidant Capacity of Cocoa Beans from Dominican
Republic, Ecuador, Haiti, Indonesia, and Ivory Coast." I have examined the final electronic copy of
this thesis for form and content and recommend that it be accepted in partial fulfillment of the
requirements for the degree of Master of Science, with a major in Food Science and Technology.
John R. Mount, Major Professor
We have read this thesis and recommend its acceptance:
Svetlana Zivanovic, David A. Golden
Accepted for the Council:
Carolyn R. Hodges
Vice Provost and Dean of the Graduate School
(Original signatures are on file with official student records.)
The Effects Of Roasting Time and Temperature On The Antioxidant Capacity Of Cocoa Beans From Dominican Republic, Ecuador, Haiti,
Indonesia, and Ivory Coast.
A Thesis Presented for the Master of Science
Degree The University of Tennessee, Knoxville
Whitney Leigh Harrington
August 2011
ii
Copyright © 2011 by Whitney Leigh Harrington All rights reserved.

iii
ACKNOWLEDGEMENTS
Pursuing my graduate degree has been a rewarding experience and I
know I would not be where I am without the help of many people. I would like to
thank my parents and sister for always believing in me. Without them I would not
be the strong independent woman that I am. I would also like to thank my fiancé,
Carl, for always pushing me to be better and to work harder.
My research would not have been possible without the help of my advisor,
Dr. John R. Mount. Thank you for your advice, encouragement and patience. I
would also like to thank Dr. Michael D. Wilcox and Musu Flomo for supplying the
cocoa beans, which were a key part of my research.

ABSTRACT
Roasting is an important processing step for developing cocoa flavor,
color, and aroma. Cocoa beans contain polyphenolic compounds, which can be
desirable antioxidants. Oxygen Radical Absorbance Capacity (ORAC) values
can be used as an indicator of health benefits of antioxidants in foods. ORAC
values measure total antioxidant capacity of different foods by measuring
antioxidant scavenging activity against peroxyl radical induced by 2,2’-azobis (2-
amidinopropane) dihydrochloride (AAPH). This measurement of total antioxidant
capacity gives a complete assessment during which the inhibition time and
inhibition degree are measured as the reaction comes to a completion. ORAC
values were determined as Trolox Equivalents (TE). Cocoa beans were also
measured for antioxidants using Total Phenolics assay and DPPH assay and
measured as gallic acid equivalents (GAE). Cocoa beans from the Ivory Coast
were roasted at varying times (10-40 minutes) and temperatures (100ºC -190ºC).
It was determined that cocoa beans from the Ivory Coast, roasted at 130ºC for 30
minutes resulted in an ORAC value of 522,789 µmol (micromoles) TE/g, GAE
value of 2.46 mg/L as determined by Total Phenolics, and GAE value of 1.48
mg/L as determined by DPPH assay. The analyzed values tended to decrease
at the highest temperatures and times of roasting. Cocoa beans from different
countries were roasted at 130ºC for 30 minutes and antioxidants were analyzed.
It was determined that Dominican Republic and Ecuador had the highest TE
values (487,913 and 463958 µmol (micromoles) TE/g respectively). GAE
differed and Total Phenolic assay found Haiti had the highest GAE (3.26 mg/L)
and DPPH assay found Ivory Coast and Dominican Republic had the highest
(0.623 and 0.610 mg/L respectively). If an acceptable flavor, color, and aroma of
cocoa can be developed at a roasting temperature closer to 130ºC than to
160ºC, then a greater antioxidant content should occur in dry cocoa powder.

ii
TABLE OF CONTENTS
Chapter Page CHAPTER I ........................................................................................................... 2 Literature Review .................................................................................................. 2
Cocoa Beans ..................................................................................................... 3 The Chocolate Process ..................................................................................... 5
Fermentation.................................................................................................. 5 Drying............................................................................................................. 7 Roasting......................................................................................................... 7
Standards .......................................................................................................... 8 Health Benefits ................................................................................................ 10 Processing Cocoa Beans ................................................................................ 12 Antioxidant Capacity Assay ............................................................................. 14
Oxygen Radical Absorbance Capacity (ORAC)........................................... 15 DPPH ........................................................................................................... 17 Folin-Ciocalteu ............................................................................................. 17 Gallic Acid .................................................................................................... 18
Antioxidant Content in Cocoa .......................................................................... 20 Differences Among Cocoa Beans from Different Countries ............................ 21 Intended Research .......................................................................................... 22 L* a* b* Values ................................................................................................ 22
CHAPTER II ........................................................................................................ 24 Materials and Methods........................................................................................ 24
Ivory Coast Cocoa Beans................................................................................ 24 Processing....................................................................................................... 24
Sample Collection ........................................................................................ 24 Roasting Procedure ..................................................................................... 24 Removing the Shell...................................................................................... 25
Lipid Extraction ................................................................................................ 26 Procyanidin Fraction........................................................................................ 26 Phenolics Fraction ........................................................................................... 27 Chemical Reagents ......................................................................................... 28
Phosphate Buffer ......................................................................................... 28 Trolox (6-hydroxy-2, 5, 7, 8-tetramethylchroman-2-carboxylic acid)............ 29 Fluorescein Solution .................................................................................... 30 2, 2’ –Azobis (2-amidino-propane) dihydrochloride (AAPH) ........................ 30 Gallic Acid .................................................................................................... 31 Folin-Ciocalteu ............................................................................................. 31 Sodium Carbonate ....................................................................................... 31 1,1-diphenyl-2-picrylhydrazyl (DPPH).......................................................... 31
ORAC Assay Procedure.................................................................................. 32 Procedure .................................................................................................... 32 Calculations ................................................................................................. 34

iii
Data Analysis ............................................................................................... 36 Folin-Ciocalteu Assay Procedure .................................................................... 36
Procedure .................................................................................................... 36 Calculations ................................................................................................. 37 Data Analysis ............................................................................................... 38
DPPH Assay Procedure .................................................................................. 38 Procedure .................................................................................................... 38 Calculations ................................................................................................. 39 Data Analysis ............................................................................................... 40
Cocoa Beans From Different Countries........................................................... 40 Sample Collection............................................................................................ 41
L* a* b* Values............................................................................................. 41 Roasting....................................................................................................... 41
Lipid Extraction ................................................................................................ 42 Procyanidin Fraction........................................................................................ 42 Phenolic Fraction............................................................................................. 43 Chemical Reagents ......................................................................................... 43 ORAC Assay Procedure.................................................................................. 43
Procedure .................................................................................................... 43 Calculations ................................................................................................. 43 Data Analysis ............................................................................................... 43
Folin-Ciocalteu Assay Procedure .................................................................... 44 Procedure .................................................................................................... 44 Calculations ................................................................................................. 44 Data Analysis ............................................................................................... 44
DPPH Assay Procedure .................................................................................. 44 Procedure .................................................................................................... 44 Calculations ................................................................................................. 44 Data Analysis ............................................................................................... 45
CHAPTER III ....................................................................................................... 46 Results and discussion ....................................................................................... 46
Effects of Roasting Ivory Coast Cocoa Beans at Different Times and Temperatures on the Antioxidant Capacity ..................................................... 46
ORAC........................................................................................................... 46 Total Phenolics ............................................................................................ 48 DPPH ........................................................................................................... 50
Effects of Roasting Time and Temperature on Cocoa Beans from Different Countries ......................................................................................................... 51
L* a* b* Values............................................................................................. 51 ORAC........................................................................................................... 53 Total Phenolics ............................................................................................ 53 DPPH ........................................................................................................... 54
CHAPTER IV....................................................................................................... 56 Conclusions and Recommendations................................................................... 56 LIST OF REFERENCES ..................................................................................... 59

iv
APPENDIX .......................................................................................................... 66 VITA .................................................................................................................. 100
v
LIST OF TABLES
Table Page Table 1: Average Moisture Loss1 of Cocoa Beans from the Ivory Coast Roasted
at Different Times and Temperatures .......................................................... 67 Table 2: Mean1 Trolox Equivalent2 Values as determined by ORAC Assay3 for
Ivory Coast Cocoa Beans Roasted at Different Times and Temperatures .. 76 Table 3: Mean1 Gallic Acid Equivalent2 Values as determined by Total Phenolics3
Assay for Ivory Coast Cocoa Beans Roasted at Different Times and Temperatures............................................................................................... 78
Table 4: Mean1 Gallic Acid Equivalent2 Values as determined by DPPH3 Assay for Ivory Coast Cocoa Beans Roasted at Different Times and Temperatures..................................................................................................................... 80
Table 5: Average Moisture Loss1 of Cocoa Beans From Dominican Republic, Ecuador, Indonesia, Haiti, and Ivory Coast roasted at 130°C for 30 minutes...................................................................................................................... 82
Table 6: Mean1 L*, a*, b* Values of Unroasted Cocoa Beans from Dominican Republic, Ecuador, Indonesia, Haiti, and Ivory Coast.................................. 83
Table 7: Mean1 Trolox Equivalents Values2 of Cocoa Beans from Different Countries as Determined by ORAC Assay. ................................................. 85
Table 8: Mean1 Gallic Acid Equivalents2 Values of Cocoa Beans From Different Countries as Determined by Total Phenolic3 Assay .................................... 87
Table 9: Mean1 Gallic Acid Equivalent2 Values of Cocoa Beans From Different Countries as Determined by DPPH3 Assay ................................................. 89
vi
LIST OF FIGURES Figure Page Figure 1: Convection Oven Temperatures of Ivory Coast Cocoa Beans Roasted
at Different Times and Temperatures .......................................................... 68 Figure 2: Example of Sample Measurements from ORAC Assay....................... 69 Figure 3: Example of Normalized Sample Measurements from ORAC assay.... 70 Figure 4: Example of a Trapezoid Used to Calculate AUC From ORAC Assay . 71 Figure 5: Example of Sample Measurements and Blank Measurements from
ORAC Assay................................................................................................ 72 Figure 6: Example of Trolox Measurements from ORAC Assay......................... 74 Figure 7: Mean Trolox Equivalent Values as determined by ORAC Assay for
Ivory Coast Cocoa Beans Roasted at Different Times and Temperatures .. 75 Figure 8: Mean Gallic Acid Equivalent1 Values as determined by Total Phenolics
Assay2 for Ivory Coast Cocoa Beans Roasted at Different Times and Temperatures............................................................................................... 77
Figure 9: Mean Gallic Acid Equivalent Values1 as determined by DPPH2 Assay for Ivory Coast Cocoa Beans Roasted at Different Times and Temperatures..................................................................................................................... 79
Figure 10: Average Convection Oven Temperatures of Cocoa Beans from Different Countries ....................................................................................... 81
Figure 11: Mean1 Trolox Equivalents2 Values as Determined by ORAC Assay for Cocoa Beans Roasted at 130°C for 30 Minutes .......................................... 84
Figure 12: Mean1 Gallic Acid Equivalent Values as determined by Total Phenolics Assay for Roasted Cocoa Beans From Dominican Republic, Ecuador, Haiti, Indonesia, and Ivory Coast.................................................. 86
Figure 13: Mean1 Gallic Acid Equivalent Values as determined by DPPH Assay for Roasted Cocoa Beans From Dominican Republic, Ecuador, Haiti, Indonesia, and Ivory Coast. ......................................................................... 88
Figure 14: Micro-plate Layout for ORAC............................................................. 90
2
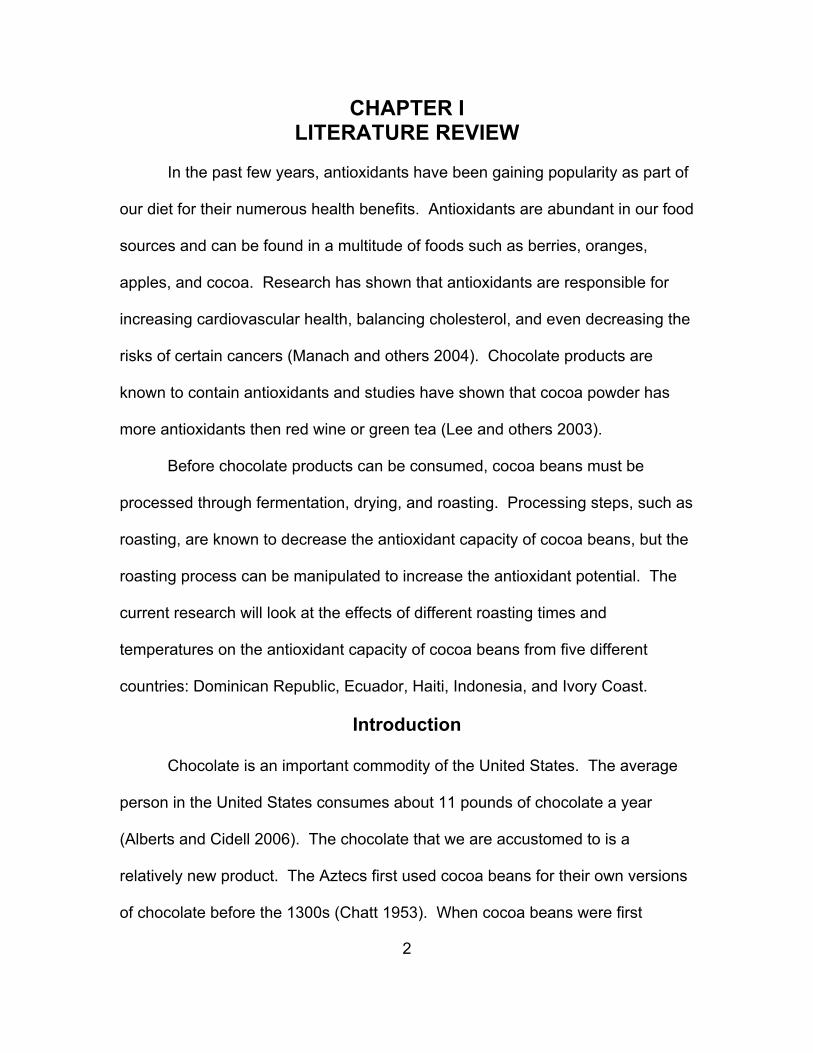
CHAPTER I LITERATURE REVIEW
In the past few years, antioxidants have been gaining popularity as part of
our diet for their numerous health benefits. Antioxidants are abundant in our food
sources and can be found in a multitude of foods such as berries, oranges,
apples, and cocoa. Research has shown that antioxidants are responsible for
increasing cardiovascular health, balancing cholesterol, and even decreasing the
risks of certain cancers (Manach and others 2004). Chocolate products are
known to contain antioxidants and studies have shown that cocoa powder has
more antioxidants then red wine or green tea (Lee and others 2003).
Before chocolate products can be consumed, cocoa beans must be
processed through fermentation, drying, and roasting. Processing steps, such as
roasting, are known to decrease the antioxidant capacity of cocoa beans, but the
roasting process can be manipulated to increase the antioxidant potential. The
current research will look at the effects of different roasting times and
temperatures on the antioxidant capacity of cocoa beans from five different
countries: Dominican Republic, Ecuador, Haiti, Indonesia, and Ivory Coast.
Introduction
Chocolate is an important commodity of the United States. The average
person in the United States consumes about 11 pounds of chocolate a year
(Alberts and Cidell 2006). The chocolate that we are accustomed to is a
relatively new product. The Aztecs first used cocoa beans for their own versions
of chocolate before the 1300s (Chatt 1953). When cocoa beans were first

3
introduced to Europe, the only product that was associated with cocoa was a
fatty chocolate liquid, which was prepared with cocoa beans, sugar, and spices.
The cocoa press was invented in 1828, which allowed cocoa butter (fat) to be
removed from the bean. This produced a cocoa powder with 23 percent fat. In
the 1840’s, Fry and Cadbury produced the first chocolate bars and in 1876, milk
chocolate was invented in Switzerland. In 1909, Milton Hershey started the
Hershey Chocolate Company, and since then, chocolate manufacturing has had
roots in the United States (Minifie 1989).
Today, there are three main types of chocolate: milk chocolate, white
chocolate, and dark chocolate. The FDA has a standard of identity for milk and
white chocolate. The FDA states that milk chocolate must contain no less than
10% chocolate liquor, and the finished product cannot have less than 3.39% milk
fat or less than 12% total milk solids. White chocolate must not contain less than
20% of cacao fat (by weight) and when finished, white chocolate must not
contain less than 3.5% (by weight) of milk-fat or 14% of total milk solids. The
FDA does not have a standard of identity for dark chocolate because it is usually
used to describe semisweet and bittersweet chocolate (Code of Federal
Regulations 2010).
Cocoa Beans Cocoa beans come from the seeds of the cacao trees, which are native to
the tropical forests of the Amazon. Cacao trees produce 20 to 30 pods a year,
and each of these pods contain 25 to 40 seeds that are surrounded by a
mucilaginous pulp. Each pod produces about 1.5 ounces of fermented and dried

4
cocoa beans (Chatt 1958). The cacao tree has specific growth requirements
such as semi-shade, warmth, and high humidity. These strict growth
requirements account for 75% of the cocoa beans being cultivated within eight
degrees of the equator. These locations, such as the Ivory Coast and Indonesia,
offer the perfect climate for cocoa beans to thrive (International Cocoa Assoc
2010).
Cocoa beans are in the genus Theobroma and species Cacao. There are
over 22 species of Theobroma, but Theobroma cacao is the most common.
Within the species Theobroma cacao, there are different varieties and the
varieties Criollo and Forastero are the most commercially available (Minifie
1989). There is also a hybrid of the Criollo and Forastero called Trinitarios.
The Criollo cocoa beans give a delicate chocolate flavor and are typically
grown in Ecuador. When the Criollo cocoa pods are ripe, they are still soft and
have an oval shape. The Criollo cocoa beans have a higher economic value
then Forastero cocoa beans. The higher value is associated with the cocoa
beans unique flavor characteristics and the fact that this variety is more rare.
When the Criollo cocoa beans are properly processed then they are worth more
than other cocoas (Dand 1996).
The Forastero are mainly grown in West Africa and Brazil and produce
stronger cocoa flavor then Criollo cocoa beans. The Forastero cocoa beans are
also smaller and have a darker color then the Criollo. The cocoa pods also differ.
When the Forastero pods are ripe, they are hard and have a more rounded
shape like a melon (Dand 1996).

5
Trinitarios are a cross between Forastero and Criollo cocoa beans, though
they are typically classified as Forastero. This variety is a product of
manipulation from man and is not found in the wild. This variety was developed
because the Criollo cocoa beans are vulnerable to many diseases, but also
intolerant to droughts. The Trinitarios are produced on a cocoa tree that is less
vulnerable to diseases and produces higher yields (Dand 1996).
The Chocolate Process
Fermentation Fermentation is a vital step in developing specific volatile fractions such as
alcohols, esters, and fatty acids. Fermentation is also responsible for the
development of chocolate flavor and aroma precursors such as amino acids and
reducing sugars (Counet and others 2002). Studies have shown that
unfermented cocoa beans do not contain the aroma precursors that are present
in the fermented cocoa beans (Knapp 1937).
Once the cocoa pod is harvested from the tree, it is cracked open and the
beans and pulp are removed and placed into wooden fermenting boxes. The
initial introduction of microorganisms, which is necessary for the fermentation to
take place, comes from the microorganisms on the hands of the farmers and the
skins of the pods. The main function of the microorganisms during fermentation
is to produce acids and alcohols that will penetrate the cocoa bean and start the
chemical reactions that will form the precursors of chocolate flavor (Dand 1996).
Once the beans are placed in wooden fermenting boxes, they are covered
with banana leaves and left in the forest to ferment. The fermentation length

6
varies depending on the variety of the cocoa beans. Forastero beans are left to
ferment for five to six days, while Criollo beans only ferment for one to three days
(Afoakwa 2008). The pulp inside of the cocoa bean is 85% water and 11% sugar,
with a pH of 3.5, which is from citric acid. The anaerobic conditions, low pH, and
high sugar content, offers an ideal conditions for naturally present yeast to
convert sugar from the cocoa beans into alcohol (Dand 1996).
During the fermentation process, lactic acid and acetic acid increase. The
increases in lactic acid are from lactic acid bacteria, which thrive in anaerobic
conditions and convert sugar to lactic acid. The increase in acetic acid comes
from acetic acid bacteria, which produce acetic acid from the alcohol and organic
sugars (Dand 1996). As the fermentation process continues, the heat increases
(up to 122°F), which causes the pulp to liquefy and drain off (Minifie 1989). The
combination of heat and acid prevents germination, an undesirable characteristic
from occurring in cultivated cocoa beans. During the bean death process, the
cell membranes also begin to degrade, which causes enzymes to spread
throughout the bean. These enzymes later play an important role in roasting
(Hoskin 1994).
During fermentation there are also significant color changes that occur.
Unfermented Forastero beans are originally a slate gray color and become
purple/brown during fermentation, and then a rich dark brown once the
fermentation is complete. Unfermented Criollo beans are a slate gray and then
becomes a light brown after fermentation (Minifie 1989).

7
Drying Once fermentation is completed, the beans must be dried. If cocoa beans
are not properly dried after fermentation, mold can develop, which will cause
unpleasant flavors. Drying is also needed to develop the cotyledon (the embryo)
of the seeds into nibs. During fermentation, the cotyledon gains moisture and
during drying, the texture changes from a wet mass to a brittle structure known
as the nib (Minifie 1989). Most cocoa beans are dried in the sun and are covered
during the night or rainstorms. During drying the beans are spread two inches
deep and are periodically raked to expose new beans. In areas of the world that
are too humid for sun drying, artificial dryers must be used, but these have been
known to cause smoky off-flavors (Minifie 1989). Once the beans are dried, they
are packed in 140 lb bags and are then transported to buyers.
Roasting Once the cocoa beans are sold, they must be roasted before further
processing can occur. Roasting is necessary to develop flavor, color, and aroma
of chocolate. During roasting, flavor precursors that have developed during
fermentation interact to produce the desired chocolate flavor (Ramli and others
2006). The flavors produced during roasting come from a combination of 400-
500 compounds (Dimick 1983). These compounds include aldehydes and
pyrazines, which are formed during roasting, through the Maillard reaction and
Strecker degradation of amino acids and sugars (Heinzler and Eichner 1992).
The Maillard reaction is a non-enzymatic browning reaction that requires
an amino acid and a reducing sugar, such as glucose or fructose. The ideal

8
conditions for the Maillard reaction to occur are high temperatures and low
moisture content and these conditions can be found in roasting (Fennema 1996).
The Strecker degradation occurs when carbonyl derivative from the
Maillard reaction reacts with free amino acids in the food product. This causes a
degradation of amino acids to aldehydes, ammonia, and carbon dioxide. The
aldehydes that are produced contribute to the aroma. Strecker degradation of
each specific amino acid produces a unique aldehyde with a unique aroma
(Fennema 1996).
Standards Grading standards for cocoa beans are hard to regulate, especially when
the countries that produce the beans and the countries that consume the beans
are different. In recent years, the Federation of Cocoa Commerce (FCC) and
Cocoa Merchants Association of America (CMAA) have developed standards for
sellers and buyers to follow. According to the standards set by FCC, there are
two grades; good fermented cocoa beans and fair fermented cocoa beans.
Good fermented cocoa beans need to have less than 5% mold, 5% slate, and
less than 1.5% of foreign matter. Fair fermented cocoa beans need to have less
than 10% mold, 10% slate, and less than 1.5% foreign matter. These standards
are determined by the cut test (Trading and shipping 2011).
The cut test was developed by the International Office of Cocoa and
Chocolate (Dand 1996). It uses a points system, which gives or subtracts points
for the dimensions, color, odor, and absence of imperfections in the beans. It is
a relatively quick test that does not require a lot of training or equipment. The cut

9
test gives an evaluation of the cocoa beans and this evaluation is used to infer
certain quality aspects of the cocoa (Dand 1996). The FDA uses the cut test to
determine if imports of cocoa beans are of a high enough standard to enter the
country.
The evaluation is conducted by thoroughly mixing a sample of cocoa
beans. The beans are then divided into a pile of about 300 randomly selected
cocoa beans. The cocoa beans are then cut lengthwise through the middle and
examined. The beans are then separated into groups of different defects such
as mold, slaty, insect damage, germination, or flatness. If the bean has more
than one defect, only one is chosen. The defects are then recorded as a
percentage of the overall bean count (Minfie 1989). Definitions of the different
defects that are found in cocoa beans can be found in the appendix on page 99.
In countries that produce cocoa beans, local traders and sellers are
responsible for preparing the beans for export. In these countries, traders,
buyers, and brokers work together to export cocoa beans. They also work
together to agree on the quality of the cocoa beans being sold (Cocoa story
2011).
Cocoa beans are an important source of income for many countries that
produce the product, but the availability of cocoa beans is dependent on climate
changes, and the yields can vary depending on the year. Since cocoa beans are
such an important commodity, the governments of these countries are heavily
involved in cocoa production and exports and some governments have
established international treaties with countries that buy their products. One

10
example, the Treaty of Lomé, was established to prevent the European Union
from levying import duties on cocoa imports from a number of producer
countries. These treaties have been established to stabilize the price of cocoa
by including long-term price agreements in the treaties between producers and
consuming countries. These treaties do not always work, and in the early 1990s,
some West African nations privatized their raw cocoa production process (Cocoa
story 2011).
Health Benefits Chocolate is primarily viewed as a dessert with lots of sugar and fat, but it
is gaining popularity as a nutritionally dense product. Cocoa beans contain
polyphenolic compounds, which can be further classified as flavonoids and these
flavonoids contain subgroups of flavanols and procyanidins (Othman 2007).
Flavonoids are composed of two aromatic rings linked by an oxygenated
heterocycle and are subdivided into thirteen different classes, which are
determined by the degree of hydroxylation and oxidation of the rings (Steinberg
and others 2003). The classes of flavonoids that are most commonly found in
cocoa beans are flavan-3-ols, catechins, epicatechins, and proanthocyanidins.
Proanthocyanidins have been found to compose 12% to 48% of the dry weight of
the cocoa beans (Bravo 1998). Studies have also found that chocolate products
have a stronger total flavan-3-ol concentration (per weight basis) than most other
plant based foods and beverages that contain flavan-3-ols (Hammerstone and
others 2000).

11
Though processing decreases the flavonoid content in chocolate products,
a significant amount of the compounds can still be found in chocolate and
especially in cocoa powder, which can contain as much as 10% flavonoids on a
dry-weight basis. Dark chocolate also has a higher amount of flavonoids,
compared to milk chocolate, because more cocoa bean liquor is used to make
dark chocolate, so it contains more flavonoids (Steinberg and others 2003).
Flavonoids are important because they offer potential cardiovascular health
benefits, antioxidant protections, and help balance cholesterol in the body
(Steinberg and others 2003). Flavonoids have also been found to contain anti-
allergy, anti-viral, anti-inflammatory, and anti-carcinogenetic properties (Yao and
others 2004).
Polyphenolic compounds have gained attention in health and nutrition
because of their antioxidant capacity (Adamson 1999). A study conducted by
Adamson and coworkers used HPLC to separate and quantify procyanidins in
cocoa. The quantified information was correlated to the antioxidant capacity of
the samples as measured by Oxygen Radical Absorbance Capacity (ORAC),
which can be used as an indicator of health benefits of procyanidins in foods
(Adamson 1999). Researchers found that procyanidin content in cocoa samples
are the primary contributors to the antioxidant capacity in cocoa. The study
found that the procyanidin content in cocoa correlated with their high ORAC
values, which may help explain some health benefits of chocolate (Adamson
1999). Though cocoa beans are known to have polyphenolic compounds, the
total content varies depending on the country of origin. For example, cocoa

12
liquor from Ecuador has a total polyphenolic compound content of 4.11%, while
beans from the Ivory Coast contain 3.13% (Natsume 2000).
Processing Cocoa Beans There are many different ways to roast cocoa beans and much of it
depends on the bean being roasted and the type of chocolate product that is
being made (International Cocoa Assoc 2010). Cocoa beans that are not
roasted have a bitter, acidic, astringent, and nutty flavor (Afoakwa and others
2008). By roasting the cocoa beans, the acidity is decreased by reducing the
concentration of volatile acids, such as acetic acid (Ramli and others 2006).
Cocoa beans are normally roasted whole, which loosens their shell. The shell is
then easily removed during the winnowing process, leaving only the cocoa nib.
Winnowing is the process of blowing air to cause the lighter portion of the cocoa
bean (the shell) to be blown away, leaving the heavier nibs.
Cocoa beans can be roasted in a conventional oven (Arlorio and others
2008), a Barth automatic gas roaster (Rohan and Stewart 1967), or a convection
oven. Convection heating is the most common method of roasting cocoa beans
(Krysiak 2006). In addition to roasting methods, the times and temperatures that
the beans are heated also vary. Studies, which looked at roasting times and
temperatures of cocoa beans, varied from a low of 70ºC, up to, a high of 180ºC,
and with times ranging from five minutes to forty-five minutes.
A study conducted by Krysiak roasted 200 g of Ivory Coast cocoa beans in
a convection oven, which was set to 110ºC, 135ºC, and 150ºC. The cocoa
beans were roasted for 15 minutes and 20 minutes. The study concluded that

13
the ratio of anthocyanins to yellow and brown pigments in the cocoa bean was
dependent on the roasting condition, and the color continued to drop as the
roasting temperature increased (Krysiak 2006). This is an important study for the
intended research because it showed a decrease in one type of antioxidants as
the temperature increased.
Another study conducted by Rohan and coworkers roasted cocoa beans
in a Barth automatic gas roaster at a temperature of 182ºC for a maximum of 28
minutes. The cocoa beans were removed at five-minute increments (5, 10, 15
etc) until 28 minutes had passed (Rohan 1965). The research concluded that
during roasting there were early loses of amino acids and their degradation
followed a linear line with the time spent in the oven (Rohan 1965).
A third study roasted 100 g of cocoa beans for thirty minutes, but
manipulated the temperature of the convection oven to 70ºC, 100ºC, 125ºC, and
150ºC (Reineccius 1972). The researchers concluded that the pyrazine content
increased as the temperature increased (Reineccius 1972). Though the total
pyrazine content increased, the specific type and amount of pyrazines varied
depending on carbon, nitrogen, and pH. This led researchers to believe that in
cocoa beans, both chemical and physical conditions influence the rate of
pyrazine accumulation during roasting (Reineccius 1972).
A fourth study conducted by Ramli and coworkers roasted cocoa beans at
120°C, 130°C, 140°C, 150°C, 160°C, and 170°C for 20, 30, 40, and 50 minutes.
Among other things, the study was measuring the pyrazine compounds using
HPLC. It concluded that there is a linear correlation between roasting

14
temperature and pyrazine compound formation. They found that cocoa beans
roasted 160°C for 40 minutes produced the highest amount tetramethylpyrazine
and cocoa beans roasted at 140°C for 40 minutes produced the highest amount
of trimethylpyrazine. This study is important because it illustrates the importance
of roasting cocoa beans and that the flavor compounds from pyrazines are
increased during roasting temperatures (Ramli and others 2006).
Antioxidant Capacity Assay Antioxidants have been of great interest to the food industry because of
their effectiveness in preventing rancidity in foods. They are also of interest to
the medical fields because they are known to protect the human body against
damage from reactive oxygen species (ROS) (Halliwell and others 1995).
Antioxidants can be defined as “any substance that, when present at low
concentrations compared to those of an oxidizable substrate, significantly delays
or prevents oxidation of that substrate (Halliwell 1990).” A compound may show
antioxidant properties by inhibiting the formation of ROS or by scavenging free
radicals (Halliwell and others 1995).
Antioxidants can deactivate radicals by two major mechanisms, Hydrogen
Atom Transfer (HAT) and Single Electron Transfer (SET). Both tests have the
same end results, but the mechanisms differ (Prior and others 2005). The HAT
method measures the ability of an antioxidant to supply free radicals by hydrogen
donation, while the SET method detects the capability of a potential antioxidant
to transfer an electron to reduce a compound (Wright and others 2001). In this

15
study, three different antioxidant assays were used to detect the antioxidant
capacity: ORAC, DPPH, and Folin-Ciocalteu.
Oxygen Radical Absorbance Capacity (ORAC) ORAC measures the total antioxidant capacity of different foods by
measuring the antioxidant scavenging activity against peroxyl radical induced by
2,2’-azobis (2-amidinopropane) dihydrochloride (AAPH) at 37ºC (Ou 2001,
Ortega 2008, and Miller 2006). The ORAC assay is based on the free radical
damage to a fluorescent probe (Fluorescein). The damage to the Fluorescein
causes a decrease in the fluorescent intensity. It is assumed that the decrease
in fluorescent intensity is an indicator of the amount of radical damage. When
antioxidants are present the free radical damage is decreased, which can be
measured by the preservation of the fluorescent values.
The protection from the antioxidants in the samples can be quantified by
calculating the area under the curve (AUC) from the experimental sample. The
AUC is a relative value, which means the initial reading of the raw data from the
ORAC machine is considered 1 and all of the other raw data points range from 0
to 1. The AUC is then calculated as the sum of many trapezoids under the
curves.
When the AUC of the phosphate blanks are subtracted from the sample,
the values (Net AUC) are the protections that are provided by the antioxidants in
the experimental samples (Held 2005). By comparing the net values to known
standards (Trolox), the equivalents can be calculated and compared to different
experimental samples. In the ORAC assay, the assay is run until completion, so

16
the values are a combination of the inhibition time and inhibition percentage of
free radical damage by the antioxidant that is reported as a single quantity (Ou
2001). Foods with higher ORAC values indicate that they are more effective at
neutralizing free radicals, which in turn slows down the oxidative processes and
free radical damages (Fennema 1996).
The chemical Fluorescein (FL; 3’6’-dihydroxyspiro[isobenzofuran-
1[3H],9’[9H]-xanthen]-3-one) is used as a stable fluorescent probe. The probe
reaction with peroxyl radicals and causes a loss of fluorescence over time (Prior
and others 2005). The ORAC assay follows the reactions of the antioxidants
over an extended time (> 30 minutes). This time period helps accounts for
possible effects of secondary antioxidant products.
There are some limitations to using the ORAC assay. The assay as
described above is only capable of measuring hydrophilic antioxidants. This test
does not take into account lipophilic antioxidants. The ORAC assay can be
changed to account for hydrophilic and lipophilic antioxidants, but that method
was not used for this experiment. Another limitation is that the ORAC assay
reaction is temperature sensitive, so the temperature must be controlled and kept
at 37°C (Prior and others 2005).
There are benefits though to using the ORAC assay. The ORAC assay
gives a controllable source of peroxyl radicals that mimic reactions of
antioxidants in food and physiological systems. The assay is also easily
automated through micro-plate readers. A machine called the Fluostar Optima
can be used to run the ORAC assay. The Fluostar Optima is a micro-plate

17
reader that can perform a multitude of applications for fluorescence intensity,
time-resolved fluorescence, and absorbance.
DPPH 1,1-diphenyl-2-picrylhydrazly (DPPH) is a stable free radical that can be
used to estimate the activity of antioxidants by measuring their scavenging ability
(Sánchez-Moreno 2002 and Molyneux 2003). When DPPH, a purple radical,
comes in contact with antioxidants, it receives a proton and converts to a light
yellow/colorless protonated DPPH molecule. Through this color change, the
free-radical scavenging ability can be determined through spectrophotometry
(Shahidi and Wanasundara 1997).
The reduction of the DPPH in the presence of phenolic compounds is a
popular assay among food scientists. The DPPH has a stable absorbance over
a wide pH range and resists oxidation (Nenadis and Tsimidou 2002). This assay
is commonly used because it is a stable, simple, and easily reproduced (Katsube
and others 2004).
The radical form of DPPH has an absorption band around 515 nm, which
disappears when it is reduced by an antiradical compound (Brand-Williams and
others 1994). The reactions of the DPPH assays are based on the decrease of
the absorbance of the radical solution. The reaction is: DPPH + HA DPPH-H
+ A (Nenadis and Tsimidou 2002).
Folin-Ciocalteu The Folin-Ciocalteu reagent is used in the colorimetric assay of phenolic
and polyphenol antioxidants. This reagent measures the amount of the

18
substance being tested that is needed to inhibit the oxidation of the reagent
(Singleton and others 1999, Vinson and others 2005). This reagent will also react
with any reducing substance, so the reagent measures the total reducing
capacity of a sample, not only the phenolic compounds (Ikawa and others 2003).
In the assay, total polyphenols are measured by the Folin-Ciocalteu oxidation-
reduction colorimetric method, with gallic acid as a standard (American Chemical
Society 1999). The total phenolic content is then expressed in Gallic Acid
Equivalents (GAE) (Kahkonen and others 1999). The Folin-Ciocalteu assay is
not a complete assessment of the quantity and quality of the phenolic
compounds in extracts, which is why other antioxidant assays are used
(Singleton and Rossi 1965).
Gallic Acid Gallic acid (GA 3,4,5-trihydroxybenzoic acid) is a naturally occurring
polyphenol that is found in plants such as gallnuts, sumac, tea leaves, grapes,
strawberries, and lemons (Senapathy and others 2011). As with other
antioxidants, gallic acid has been found to have cytotoxicity against cancer cells,
and anti-inflammatory and antimutagenic properties (Senapathy and others 2011,
Lu and others 2006). Gallic acid is used as a food additive to help prevent
oxidation (Lu and others 2006). In the United States, the average intake of gallic
acid is about 1 g/day and toxicological studies have been conducted that show
the “no-observed-adverse-effect-level” (NOAEL) of gallic acid is at least
120mg/kg/day for rats (Lu and others 2006).

19
Polyphenols Over the past years, many researchers and food manufacturers have
become more interested in polyphenols. This interest stems from polyphenol’s
antioxidant properties and the data showing they may play a role in the
prevention of a variety of diseases such as cancer, cardiovascular, and
neurodegenerative diseases (Manach and others 2004). There are thousands of
molecules that have a polyphenol structure, which is characterized as having
several hydroxyl groups on aromatic rings. The polyphenol compounds can be
classified into different groups based on the number of phenol rings and the
structural elements that bind the rings together (Manach and others 2004). One
of the classes, flavonoids consists of two aromatic rings that are bound together
by three carbon atoms. These carbon atoms form an oxygenated heterocycle,
which can be further divided into subclasses: flavonols, flavones, isoflavones,
flavanones, anthocyanins, and flavanols (catechins and procyanthocyanidins
(Manach and others 2004).
Flavanol compounds exist in monomer forms (catechins/epicatechins) and
polymer forms (procyanthocyanidins). Catechins (two isomers in the trans
configuration) and epicatechin (two isomers in the cis configuration) are the main
flavonols found in fruits, and epicatechins have been found to be very stable in
heat as long as the pH was acidic (Zhu and others 1997). Proanthocyanidins, or
condensed tannins, are dimmers, oligomers, and polymers of catechins that are
bound together between C4 and C8 (Guyot and others 1998). These

20
proanthocyanidins are responsible for the bitterness in chocolate (Santos-Buelga
and Scalbert 2000).
Antioxidant Content in Cocoa Cocoa is known to contain a large amount of flavonoids (Adamson and
others 1999) and many studies have been conducted that look at the phenolic
compounds in more detail. A study, which looked at the phenolic and
anthocyanin content in cocoa beans, found that phenolic compounds ranged
from 67 mg of Epicatechin Equivalents (ECE) to 149.2 mg of ECE in fresh picked
beans to 102.3 mg of ECE to 139.6 mg of ECE in beans that had been fermented
for one day. In the same study, HPLC was used to isolate specific compounds in
cocoa beans. The results showed that Catechins and Epicatechins were the
predominant polyphenolic compounds. The compound Epicatechin made up 2%
to 4% of the dry mass of defatted cocoa powder and Catechins made up 0.05%
to 0.1% of the defatted cocoa powder (Niemenak and others 2006).
Another study was conducted that looked at the phenolic compounds and
antioxidant capacity of cocoa powder, tea, and red wine. The study found that
cocoa powder contains more total phenolics, with 611 mg of Gallic Acid
Equivalents (GAE) and more flavonoids, with 564 mg of Epicatechin Equivalents
(ECE) then black tea (124 mg of GAE and 34 mg ECE), green tea (165 mg of
GAE and 47 mg ECE), and red wine (340 mg of GAE and 163 mg of ECE). The
researchers also found that cocoa powder had the highest overall antioxidant
capacity as measured by Vitamin C Equivalent Antioxidant Capacity (VCEAC).
Overall it was found that the antioxidant capacity of cocoa powder is four to five

21
times more powerful then black tea, two to three times more powerful then green
tea, and two times more powerful then red wine (Lee and others 2003).
Differences Among Cocoa Beans from Different Countries Many factors can account for the variances among cocoa beans from
different countries. These factors such as climate, bean maturity, fermentation,
and variety can contribute to the flavor and aroma of the final product. A study
conducted by Zoumas and others found that the theobromine and caffeine
content in cocoa liquor vary depending on the country of origin. Chocolate liquor
from Haiti contains 1.26% theobromine and 0.105% Caffeine, for a 16.8 to 1 ratio
of theobromine to caffeine ratio. Ecuador liquor contains 1.07% theobromine and
0.234% Caffeine, for a 4.6 to 1 ratio of theobromine to caffeine ratio. Dominican
Republic liquor has 1.57% theobromine and 0.177% caffeine, for an 8.9 to 1 ratio
of theobromine to caffeine ratio (Zoumas and others 1980). The variation in the
Theobromine and caffeine content can be caused by difference in the maturity of
the harvest cocoa bean, the degree of fermentation, and the genetic make-up of
the specific cocoa beans. (Zoumas and others 1980)
Another study evaluated cocoa beans from Ecuador, Dominican Republic,
Ivory Coast, and Indonesia on properties such as pH, and volatile and nonvolatile
acids. After evaluation, Ecuador was classified as having a high pH (5.50 –
5.80), while Ivory Coast, Indonesia, and Dominican Republic beans were
classified as having a medium pH (5.20 – 5.49). The study pointed out that even
though Indonesia and Dominican Republic were classified as having a medium
pH, the values had high mean standard deviation. This information leads

22
researchers to conclude that the cocoa beans from Dominican Republic and
Indonesia went through a very short fermentation period (Jinap and Dimick
1990). The researchers also pointed out that Indonesia cocoa beans were less
acidic and this could be contributed to the beans being washed before
fermentation. Some cocoa growers in Indonesia practice this method (Forsyth
and Quesnel 1957).
Intended Research The intended research will study the effects of roasting time and
temperature on the antioxidant capacity of cocoa beans from five different
countries. The cocoa beans originate from the Dominican Republic, Ecuador,
Haiti, Indonesia, and Ivory Coast. The optimal roasting time and temperature of
will first be determined through trial runs with cocoa beans from Ivory Coast. The
Ivory Coast beans will be roasted at different set temperatures and removed at
specified times. The beans will then have their shells removed, leaving their
nibs. The nibs will be crushed and the lipids will be extracted. The defatted nibs
will be analyzed for antioxidants using ORAC, Total Phenolics Assay, and DPPH
Assay. It is hypothesized that the optimal antioxidant capacity will be from cocoa
beans roasted at the lowest time and temperature and that cocoa beans from the
Ecuador will have the highest antioxidant capacity.
L* a* b* Values The L* a* b* values were developed to give a standardized color scale that
could be used to easily compare color values. The color scale is known as a

23
uniform color scale. In this color scale, the differences between points plotted in
the color space correspond to visual differences between the colors plotted. In
the scale the L* values range from zero to one hundred, where zero is black and
100 represents white, or a reflecting diffuser. The a* and b* can be positive or
negative numbers, but do not have specific numerical ranges. The ranges
depend of the color being measured. When a* is a positive number, it is
measuring red/magenta. When b* is a positive number it is measuring yellow.
When a* is a negative number it is measuring green and when b* is negative, it is
measuring blue. The a* and b* values for each sample reading can be multiplied
together to measure how brown in color a sample is (HunterLab 2008).

24
CHAPTER II MATERIALS AND METHODS
Ivory Coast Cocoa Beans The first objective of the experiment was to determine an optimal roasting
time and temperature of cocoa beans from the Ivory Coast. The Ivory Coast
cocoa beans were roasted at different times and temperatures and then the
roasted cocoa beans were analyzed for antioxidants by ORAC assay, Total
Phenolics Assay, and DPPH assay. Through statistical analysis, the optimal
roasting time and temperature was determined and then applied to the second
objective of the experiment.
Processing
Sample Collection Unroasted Cocoa beans were selected based on their quality. Samples of
cocoa beans were chosen that were free of holes and cracks in the shell, were a
good color, and were not flat. Once the cocoa beans were chosen from the large
sample bags they were sorted into groups for roasting and these groups were
separated into three reps for roasting. Each rep, for each roasting time and
temperature, contained 20 g of cocoa beans.
Roasting Procedure The cocoa beans were then placed in between two mesh trays. These
trays allowed for air to circulate around the cocoa beans, but prevented them
from moving around in the oven. The cocoa beans were placed in a convection
oven (Blodgett, Ann Arbor MI) that was preheated to the appropriate roasting

25
temperature, either 100°C, 130°C, 160°C, or 190°C. The temperature within the
oven was measured to assure the correct temperatures were obtained. The
beans were then placed in the oven and left to roast for 10, 20, 30, or 40
minutes. The oven door was only opened once to remove the beans. This
ensured that heat was not loss during the roasting process. Every roasting time
and temperature was repeated two more times for a total of three replications.
The average temperature in the oven at the different roasting temperatures can
be found in figure 1 of the appendix.
When the beans were done roasting at each time and temperature, they
were removed from the oven and left to cool at ambient temperature (20°C -
25°C). Once the beans were cool, they were weighed again in order to measure
the moisture loss. The average moisture loss for Ivory Coast cocoa beans
roasted at different times and temperatures can be found in table 1 of the
appendix. After the weight had been recorded, the beans were placed in freezer
bags and labeled with the oven temperature, roasting time, and rep. The cocoa
beans were placed into a freezer and kept at -2°C until needed.
Removing the Shell In order for the cocoa beans to be analyzed, the shell was removed from
the nib as described. The cocoa beans were removed from the freezer and
placed on a wooden cutting board. The beans were then gently tapped with a
rolling pin, which cracked the shell open. The shell was easily removed and
discarded. If there were any shell pieces left in the nib pile, the nibs were
winnowed, and the light shell was blown away. The nib was then crushed on the

26
cutting board with the rolling pin. The crushed nibs were stored in the freezer
and kept at -2°C until needed for analysis.
Lipid Extraction The lipid extraction performed on the cocoa nibs was adapted from a
procedure by Adamson et al (1999). The previously crushed cocoa nibs were
weighed with a digital scale (Denver Instrument) and the nibs were transferred to
a 150 mL beaker. Next, forty-five milliliters of hexane (Fisher Scientific, Fair
Lawn, NJ) was added to the glass beaker, which contained the cocoa nibs. The
beaker was placed on a stir plate with a magnetic stir bar, and mixed on high for
one-hour under the fume hood. The hexane was poured out and the cocoa nibs
were drained over Miracloth™ (Calbiochem La Jolla, CA). The cocoa nibs were
added back into the beaker, and another 45 mL of hexane was added and the
process was repeated two more times. The cocoa nibs were then left to air dry
for at least 24 hours. Once the cocoa nibs were completely dried, they were
reweighed and the percent of lipid loss was calculated. If less than 20% of the
lipids had been removed, the cocoa nibs were extracted with hexane two more
times to ensure proper lipid removal. The defatted cocoa nibs were stored in a
clean vial (Greiner Bio-One, Frickenhausen), which was labeled with the time,
temperature, and rep, and was stored in a -2°C freezer until it was analyzed.
Procyanidin Fraction After lipid extraction was complete, the procyanidin fraction was collected
according to the procedure of Adamson et al (1999). One gram of defatted and

27
dried cocoa nib was placed in a 25 mL beaker and 7 mL of methanol (Fisher
Scientific Fair Lawn, NJ), 2.95 mL of deionized water, and 0.05 mL formic acid
(Acros Organics, New Jersey) was added to the breaker for a 70:29.5:0.5 ratio.
The beaker with the solution was placed on a stir plate along with a magnetic stir
bar, and mixed for two hours at room temperature underneath a fume hood.
After two hours, the liquid portion was drained through Miracloth™ and poured
into a 50 mL centrifuge tube (Fisher Scientific Suwanee, GA). The liquid was
centrifuged (Sorvall RC 5B Plus, Duluth, GA) at 5000 rpm for 10 minutes. The
supernatant was taken up by a plastic pipette and deposited in a clean vial. The
vial of supernatant was stored in a -2°C freezer until it was analyzed for ORAC
using a Fluostar Optima (BMG Labtech, Durham, NC).
Phenolics Fraction The phenolic fractions were collected as described by Folin and Ciocalteu
with slight modifications (Folin and Ciocalteu 1927). One gram of defatted and
dried cocoa nib was placed in a 25 mL beaker and extracted with 5 mL of
ethanol. The beaker was placed on the stir plate, with a magnetic stir bar, and
mixed for one hour. After one hour, the solution was poured over Miracloth™ into
a graduated cylinder and the ethanol volume was measured. If it was less than
the original five milliliters, more ethanol was added to bring all of the solutions to
the same original volume. The ethanol solution was then poured into a 50 mL
centrifuge tube and centrifuged at 3000 rpm for 15 minutes. The supernatant
was collected with a plastic pipette and deposited in a clean vial. The vial was

28
labeled with the roasting time, temperature, and rep, and was stored in a -2°C
freezer until it was analyzed.
Chemical Reagents
Phosphate Buffer To make the phosphate buffer solution, 10.21g of KH2PO4 (Acros
Organics, New Jersey) was added to a 1000 mL volumetric flask. The flask was
filled to volume (1000mL) with DI water and the solution was placed on a stir
plate with a magnetic stir bar, and mixed until the monopotassium phosphate
was dissolved. This produced a 75 mM monopotassium phosphate solution.
Next, 13.06g of K2HPO4 (Fisher Scientific, Fair Lawn, NJ) was added to a
1000mL volumetric flask. The flask was filled to volume (1000mL) with DI water
and the solution was placed on a stir plate with a magnetic stir bar and mixed
until the dipotassium phosphate was dissolved. This produced a 75 mM
dipotassium phosphate solution.
To make the phosphate working solution, 800mL of the 75 mM
dipotassium phosphate solution was added to a 1000mL beaker. The beaker
was placed on a stir plate with a magnetic stir bar in the beaker and set to stir on
low. A pH electrode (Fisher Scientific) was placed into the beaker and the
monopotassium phosphate solution was slowly added to the 75 mM dipotassium
phosphate solution (about 200 mL) until a pH of 7.4 was reached. The buffer
solution was stored in an amber glass bottle at 2.7°C (37° F) until it was ready to
be used. The write up for the phosphate buffer can be found in the appendix on
page 91.

29
Trolox (6-hydroxy-2, 5, 7, 8-tetramethylchroman-2-carboxylic acid) The Trolox solution was prepared by adding 25 mg of Trolox (Acros
Organics, New Jersey) to 100 mL of working phosphate buffer. The solution was
then mixed on a stir plate, using a magnetic stir bar until the Trolox was
dissolved. This gave a 1mM solution of Trolox. The solution was then diluted
with 100mL of working phosphate buffer (0.05mM Trolox). The final solution was
divided into 1.5 mL Eppendorf tubes, with 1.5 mL of solution being added to
each. The solution was stored at -85°C until it was needed for the ORAC
analysis.
When the Trolox solution was ready to use for the ORAC assay, one tube
was removed from the freezer and left to thaw at room temperature. The Trolox
solution was used to make a Trolox working solution, which served as the
standards for the ORAC assay. To make the Trolox working solution, 1 mL of
Trolox solution was removed from the tube and added to a 25 mL flask that
contained 9mL of phosphate buffer to make a 50 µm solution. Two milliliters were
then removed from the first flask and added to a 10 mL flask that contained 2 mL
of phosphate buffer to make a 25 µm solution. Two milliliters were then removed
from the second flask and added to a 10 mL flask that contained 2 mL of
phosphate buffer to make a 12.5 µm solution. Two milliliters were then removed
from the third flask and added to a 10 mL flask that contained 2 mL of phosphate
buffer to make a 6.25 µm solution. The write-up for the Trolox solution can be
found in the appendix on page 93.

30
Fluorescein Solution The Fluorescein stock solution was prepared by adding 22.5 mg of
Fluorescein (Acros Organics, New Jersey) to 50 mL of working phosphate buffer.
The solution was then mixed on a stir plate, using a magnetic stir bar. Fifty
micro-liters of the Fluorescein solution and ten milliliters of phosphate buffer (75
mM) were put into a 10 mL centrifuge tube and vortexed to make the final stock
solution. Then, 1.5 mL of the final stock solution was placed into 1.8 mL
Eppendorf tubes and stored at -2° C until used.
The Fluorescein working solution was made fresh each day before
running the ORAC analysis. A tube of Fluorescein stock solution was removed
from the freezer and left to thaw at room temperature. Then, 800 µl of the stock
solution was added to a 50 mL of the phosphate buffer. The solution was placed
into a water bath at 37°C until needed. The write-up for the Fluorescein solution
can be found in the appendix on page 92.
2, 2’ –Azobis (2-amidino-propane) dihydrochloride (AAPH) AAPH (Sigma-Aldrich, St Louis) solution was prepared right before each
ORAC analysis. Right before the start of the ORAC assay, 0.108 g of AAPH
(from the refrigerator at 4°C) was added to five milliliters of room temperature
phosphate buffer. This produced an AAPH solution containing 79.6 µmol/mL.
The 20µl of AAPH aliquot into each well gives a 1.6 µmol AAPH per micro-plate
well. The write-up for the AAPH solution can be found in the appendix on page
94.

31
Gallic Acid To make the Gallic Acid solution, 50 mg of Gallic Acid (Sigma Aldrich, St.
Louis, MO) was added to a 100 mL volumetric flask and 3 mL of ethanol (Acros
Organics, New Jersey) was added to aid in dissolving the solution. The flask
was then filled to volume (100 mL) with DI water. The solution was poured into a
storage bottle and stored in the refrigerator for up to nine days. This solution was
used as the gallic acid standards for the Folin-Ciocalteau and DPPH Assays. The
write-up for the Gallic Acid solution can be found in the appendix on page 95.
Folin-Ciocalteu To make the Folin-Ciocalteu solution, 12.5 mL of 2N Folin-Ciocalteu
(Sigma Aldrich St. Louis, MO) was added to a 100 mL volumetric flask. The flask
was then filled to volume (100 mL). The solution was poured into a storage
bottle and kept at room temperature (up to two months). The write-up for the
Folin-Ciocalteu solution can be found in the appendix on page 96.
Sodium Carbonate To make the Sodium Carbonate solution, 12.4 g of Na2CO3 (Fisher, Fair
Lawns NJ) were dissolved into 100 mL of DI water. The solution was then
poured into a storage bottle and kept at room temperature (up to two months)
until it was used for the Folin-Ciocalteu assay. The write-up for the Sodium
Carbonate can be found in the appendix on page 97.
1,1-diphenyl-2-picrylhydrazyl (DPPH) The DPPH solution was prepared by dissolving 4mg of DPPH (Sigma
Aldrich, St. Louis MO) in 100 mL of methanol. The solution was put on a stir

32
plate with a magnetic stir bar, and set to medium until the DPPH was dissolved in
the methanol. The solution was poured into a storage bottle and kept in the
refrigerator for up to two days. The write-up for the DPPH can be found in the
appendix on page 98.
ORAC Assay Procedure
Procedure Cocoa bean samples were analyzed based on hydrophilic oxygen radical
absorbance capacity (H-ORAC). The procedure was based on the method of
Prior and coworkers, with slight modifications (Prior and others 2005).
One sample of Trolox solution and one sample of Fluorescein solution
were removed from the freezer the night before the ORAC analysis was run. On
the day of the procedure, the cocoa samples were removed from the freezer. To
start the procedure, the water bath was heated to 37°C. Next, the Fluostar
Optima was turned on and the temperature control was set to 37°C. The
Fluorescein working solution was made and stored in a 50 mL centrifuge tube
and the centrifuge tube was place into the water bath that was now heated to
37°C. The Fluorescein working solution was kept in the water bath until it was
ready to be used. The Fluorescein working solution procedure can be found in
the appendix on page 92.
Next, the Trolox working solution was made. The Trolox working solution
was diluted to make four solutions: 50 µm, 25 µm, 12.5 µm, and 6.25 µm. These
dilutions were used as the Trolox standards. Twenty micro-liters of each

33
standard of Trolox were aliquoted into separate wells. The Trolox working
solution procedure is can be found in the appendix on page 93.
Next, the cocoa sample that contained the procyanidin fraction was diluted
to a 1:1000. Ten micro-liters of the procyanidin fraction were placed into 9.99 mL
of phosphate buffer. Twenty micro-liters of the diluted procyanidin fraction were
aliquoted into the micro-plate. Every cocoa sample was analyzed four times in
the micro-plate. An example of the micro-plate can be found in figure 15 of the
appendix.
Once all of the samples were in the micro-plate, the Fluorescein working
solution was removed from the water bath and 200µl were placed into the top left
well of the plate. The plate was then placed into the Fluostar Optima machine so
it could warm up. While the plate was warming up, the AAPH solution was
made. The Fluorescein working solution and AAPH solution were placed in the
Fluostar Optima where they were used to prime pumps one and two,
respectively. Pump one injected 200 µl of Fluorescein and pump two injected
20 µl of AAPH solution. An example of the micro-plate layout is found in figure
14 of the appendix.
Each of the cocoa samples were measured four times and the Trolox
standards were measured two times. These measurements were used to
produce the Fluorescent measurements at each cycle time (minutes). The 48-
well micro-plates were analyzed in the Fluostar Optima fluorescence micro-plate
reader, with two automated injectors, an incubator, and Fluostar Optima software

34
version 2.20R1 (BMG Lab Technologies, Inc. Durham, NC). A total of 32 cycles
were run, and each cycle lasted 83 seconds, for a total run time of 84 minutes.
Calculations ORAC calculations were based on previous work by Prior and coworker
(Prior and others 2005). ORAC measurements are reported in Trolox equivalents
to indicate the amount of Trolox required for the same number of antioxidants as
the sample being measured. First, the appropriate wells of the micro-plate are
filled with a phosphate buffer solution. Next, AAPH is added to the phosphate
buffer, which will begin to decompose the phosphate buffer if no antioxidants are
present. To determine the amount of phosphate that has decomposed, routine
measurements at the emitted wavelength of the phosphate buffer solution are
obtained. Samples that contain antioxidants retain the phosphate buffer solution
for an extended period of time due to the protective properties of the
antioxidants.
Figure 2 illustrates the measurements values taken directly from a
Fluostar Optima for a sample containing antioxidants, buffer solution, and AAPH.
To account for small differences in phosphate buffer concentrations from sample
runs, all measurements are scaled relative to the maximum phosphate buffer
measurements. In all cases, the maximum concentration of phosphate buffer
occurs at the beginning of the procedure after the solution has been thoroughly
mixed throughout the well and before the AAPH begins to decompose the buffer.
With most sample runs, the buffer solution reaches its peak concentration around
cycle four. After scaling, all measurements have values between 0 to 1, which

35
indicates the percent of phosphate buffer solution remaining in the well. Figure 3
illustrates the same sample as figure 2, but with scaled measurement values.
Scaling of the measurements values takes care of the small changes in
phosphate buffer solution, but does not account for the small differences in the
AAPH solution that is injected during in the runs. To normalize the samples
between runs with the different concentrations of AAPH solution, several blanks
are measured along with the samples. Each blank contains only phosphate
buffer solution and AAPH and this value gives the amount of unprotected
phosphate buffer that decomposes over time. Figure 5 shows the measurements
taken for a sample with cocoa nibs in a phosphate buffer solution and
measurements taken of a blank sample without any cocoa nibs. To determine
the difference in phosphate decomposed with and without the antioxidants, the
area under the blank’s curve is subtracted from the area under the sample with
antioxidants’ curve. To determine the area under the curves, a series of
trapezoids placed side-by-side are used. Figure 4 illustrates the area under a
sample’s curve separated into a series of trapezoids and the formula is shown in
equation 1 of the appendix.
To determine the amount of Trolox Equivalents in the sample, the
sample’s fluorescent-minutes are compared to that of Trolox. Measurements
using the same procedure as above were taken of several different Trolox
concentrations. Figure 6 shows the fluorescent-minutes of several
concentrations of Trolox. A linear regression line was fit to the data points to
form a least-squares solution equation. That equation can then be used to

36
determine the exact amount of Trolox required for a given fluorescent-minutes
value.
Data Analysis The fluorescent-minute values and Trolox Equivalents were calculated in
Microsoft Excel (Version 12.2.8). A completely randomized design, with 3
replicates per treatment was used to compare four roasting temperatures, with 4
roasting times. Trolox Equivalent values were analyzed by analysis of variance,
which was conducted using mixed models and run with SAS 9.2. (2002-2008)
Folin-Ciocalteu Assay Procedure
Procedure Before the Folin-Ciocalteu assay was run, the samples of phenolics
fraction from the cocoa nibs were removed from the freezer. A water bath was
heated to 40°C and the Folin-Ciocalteu solution, the Sodium Carbonate solution,
and the gallic acid solution were made according to the procedures mentioned
previously.
Four 10mL tubes were used to make the gallic acid standards. The first
standard contained 200 µl of gallic acid solution, the second contained 500 µl of
gallic acid solution, the third 1000µl of gallic acid solution, and the fourth 2000µl
of gallic acid solution. The tubes were then filled to volume (10mL) with D.I.
water. These concentrations produced standards with 0.01 mg/mL Gallic Acid
Equivalents, 0.025 mg/mL GAE, 0.05 mg/mL GAE, and 0.1 mg/mL GAE

37
respectively. Once the standard concentrations were made, they were placed to
the side until further use.
The test tubes were then prepared for the Folin-Ciocalteu Assay. Four
test tubes were labeled S1, S2, S3, and S4 and used for the gallic acid
standards. These four test tubes each received one milliliter of 200 µl (S1),
500 µl (S2), 1000 µl (S3), or 2000µl (S4) of gallic acid standard. Other test tubes
were labeled with the sample being tested and received 200µl of the respective
phenolics fraction. Then seven milliliters of D.I. water and then one milliliter of
Folin-Ciocalteu solution were added to each tube. The tubes were left to sit for
three minutes and then one milliliter of Sodium Carbonate was added to the tube.
The tubes were vortexed and put in a water bath that was heated to 40°C and left
for 30 minutes.
While the test tubes were heating in the water bath, the
Spectrophotometer (Thermo Spectronic, Genesys 2) was turned on and set to
725 nm. After 30 minutes, the samples were removed from the water bath. The
samples were then poured into cuvettes and read at an absorbency of 725 nm.
Calculations Total Phenolic values were reported as Gallic Acid Equivalents (GAE). To
calculate GAE the sample’s gallic acid concentration needed to be found from
the linear regression line of the standard gallic acid concentrations. The gallic
acid standards and their absorbance values were plotted and a linear regression
line was found. The absorbance values of the samples were plugged into the
equation and used to solve for the gallic acid concentration. The value from the
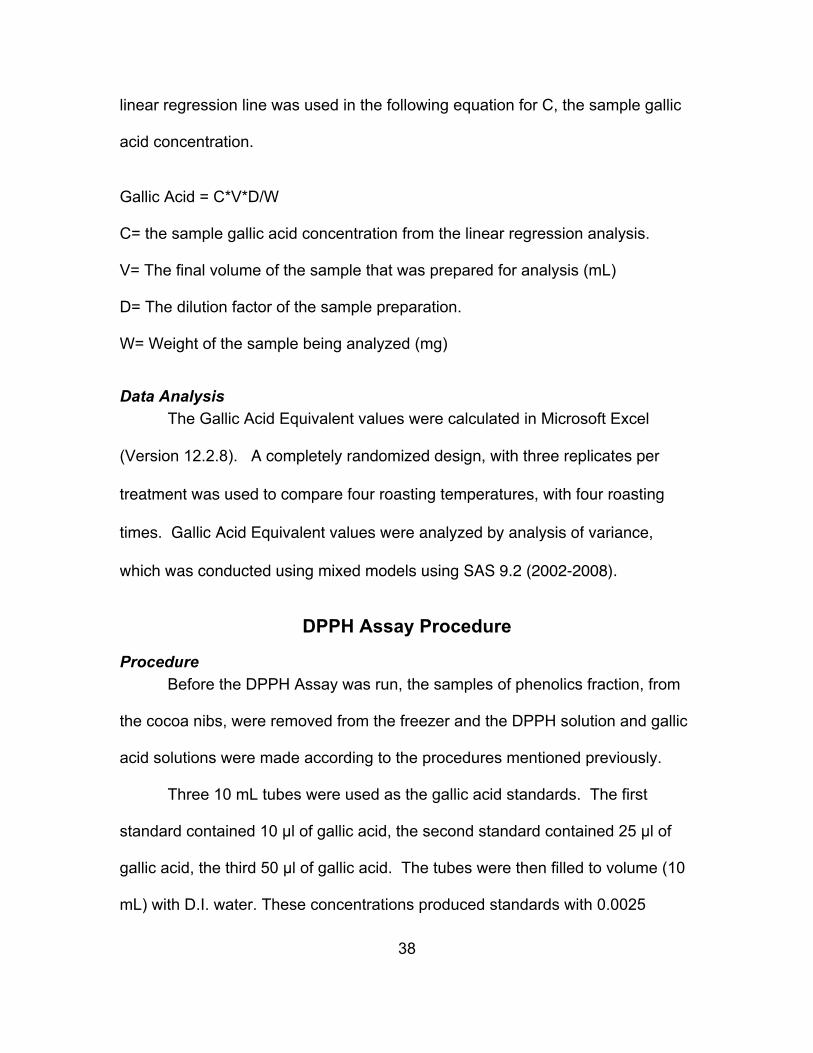
38
linear regression line was used in the following equation for C, the sample gallic
acid concentration.
Gallic Acid = C*V*D/W
C= the sample gallic acid concentration from the linear regression analysis. V= The final volume of the sample that was prepared for analysis (mL)
D= The dilution factor of the sample preparation.
W= Weight of the sample being analyzed (mg)
Data Analysis The Gallic Acid Equivalent values were calculated in Microsoft Excel
(Version 12.2.8). A completely randomized design, with three replicates per
treatment was used to compare four roasting temperatures, with four roasting
times. Gallic Acid Equivalent values were analyzed by analysis of variance,
which was conducted using mixed models using SAS 9.2 (2002-2008).
DPPH Assay Procedure
Procedure Before the DPPH Assay was run, the samples of phenolics fraction, from
the cocoa nibs, were removed from the freezer and the DPPH solution and gallic
acid solutions were made according to the procedures mentioned previously.
Three 10 mL tubes were used as the gallic acid standards. The first
standard contained 10 µl of gallic acid, the second standard contained 25 µl of
gallic acid, the third 50 µl of gallic acid. The tubes were then filled to volume (10
mL) with D.I. water. These concentrations produced standards with 0.0025

39
mg/mL GAE, 0.00625 mg/mL GAE, and 0.0125 mg/mL GAE respectively. Once
the standard concentrations were made, they were placed to the side until further
use.
Test tubes were then prepared for the DPPH Assay. Three test tubes
were labeled with an S1, S2, or S3 and were used for the gallic acid standards
that were to be run in the spectrophotometer. One milliliter was removed from
the test tube with 0.0025 mg/mL GAE and added to a new test tube labeled S1.
This was repeated for the 0.00625 mg/mL GAE, and 0.0125 mg/mL GAE, which
were labeled S2 and S3 respectively. Blank test tubes were then labeled with
the sample that was being analyzed. The test tubes for the cocoa samples
received 500 µl of the phenolics fraction of the cocoa samples that was being
tested. Then one milliliter of DPPH was added to each test tube. The test tubes
were wrapped in foil and a stir bar was placed into each. The test tubes were
then placed on a stir plate and mixed at room temperature for 30 minutes. While
the samples were mixing, the spectrophotometer was set to 517 nm. When the
samples were done mixing, the solutions from the test tubes were poured into
cuvettes and the absorbency was read at 517 nm. This procedure was repeated
two more times, for an average of three values for each rep.
Calculations DPPH values were reported as Gallic Acid Equivalents (GAE). To
calculate GAE, the sample’s gallic acid concentration needed to be found from
the linear regression line of the standard gallic acid concentrations. The gallic
acid standards and their absorbance values were plotted and a linear regression

40
line was found. The absorbance values of the samples were plugged into the
equation and used to solve for the gallic acid. The value from the linear
regression line was used in the following equation for C, the sample gallic acid
concentration.
Gallic Acid = C*V*D/W
C= the sample gallic acid concentration from the linear regression analysis. V= The final volume of the sample that was prepared for analysis (mL)
D= The dilution factor of the sample preparation.
W= Weight of the sample being analyzed (mg)
Data Analysis The Gallic Acid Equivalent values were calculated in Microsoft Excel
(Version 12.2.8). A completely randomized design, with three replicates per
treatment was used to compare four roasting temperatures, with four roasting
times. Gallic Acid Equivalent values were analyzed by analysis of variance,
which was conducted using mixed models using SAS 9.2 (2002-2008).
Cocoa Beans From Different Countries The second objective was to determine the antioxidant capacity of cocoa
beans from different countries. Once the applied roasting time and temperature
was decided, the treatment was applied to cocoa beans from five different
countries. The cocoa beans were from Dominican Republic, Ecuador, Indonesia,
Haiti, and Ivory Coast. The cocoa beans were then analyzed for antioxidant
capacity by the ORAC assay, Total Phenolics assay, and DPPH assay.

41
Sample Collection Unroasted cocoa beans were selected based on their quality. For each
country, samples of beans were chosen that were free of holes and cracks in the
shell, were a good color, and were not flat. Once the cocoa beans were chosen
from the large sample bags they were sorted into groups for roasting. These
groups were separated into reps for roasting. Each rep, for each country,
contained 50 g of cocoa beans that were then roasted in the oven.
L* a* b* Values Before the cocoa beans were roasted, L* a* b* values were measured
using a Hunter Miniscan Spectrophotometer. Twenty grams of unroasted cocoa
beans from each country were separated into groups and the shells were
removed. The nibs from the different countries were then broken into pieces and
placed into separate sample cups. The sample cups were completely filled with
nib, making sure the center of the nib was placed face up for analysis.
The sample cup, with the cocoa nibs from the specific country, was placed
under the Spectrophotomter and the L* a* b* values were measured. This
process was repeated two more times for a total of three reps from a country and
the process was repeated for each country.
Roasting The cocoa beans were roasted in the same convection oven and on the
same mesh trays as previously mentioned. Once the oven was preheated to
130°C, the beans from the different countries were placed in the oven and left to
roast for 30 minutes. The oven door was only opened once during each roasting,

42
to remove the cocoa beans. This ensured that heat was not loss during the
roasting process. The roasting time and temperature was repeated two more
times for each country, for a total of three reps. The average temperature in the
oven for each country can be found in figure 10 of the appendix.
When the beans were done roasting, they were removed from the oven
and left to cool. Once the beans were cool, they were weighed again in order to
measure the moisture loss. The average moisture loss for the cocoa beans from
Dominican Republic, Ecuador, Indonesia, Haiti, and Ivory Coast roasted at
different times and temperatures is seen in table 5 of the appendix. After the
weight had been recorded, they were labeled with the country or origin, and rep,
and placed into a freezer, kept at -2°C, until needed.
In order for the cocoa beans to be analyzed for antioxidants the shell
needed to be removed from the nib. The nib was removed the same was as
previously described. The nib was then crushed on the cutting board with the
rolling pin. The nibs were stored in the freezer, and kept at -2°C until further
analyzed.
Lipid Extraction The lipid extraction was performed the same way as previously described.
Procyanidin Fraction The procyanidin fraction was performed the same way as previously
described. After the procyanidin fraction was collect, the vial was labeled with
the country, rep and was stored in a -2°C freezer until it was analyzed.

43
Phenolic Fraction The phenolic fractions were collected as previously described. After the
phenolics were collected from the sample, the vial was labeled with the country,
rep and was stored in a -2°C freezer until it was analyzed.
Chemical Reagents All of the chemical reagents were made as previously described in the first
material and methods section.
ORAC Assay Procedure
Procedure Cocoa bean samples were analyzed based on hydrophilic oxygen radical
absorbance capacity (H-ORAC). The procedure was performed as previously
described and was based on the method of Prior and coworkers with slight
modifications (Prior and others 2005).
Calculations The calculations were performed as previously described in the first
material and methods.
Data Analysis The fluorescent-minute values and Trolox Equivalents were calculated in
Microsoft Excel (Version 12.2.8). A completely randomized design, with three
replicates per treatment, was used to compare five countries. Trolox Equivalent
values were analyzed by analysis of variance, which was conducted using mixed
models and run with SAS 9.2. (2002-2008)
44
Folin-Ciocalteu Assay Procedure
Procedure The Folin-Ciocalteu procedure was performed as previously described in
the first material and methods.
Calculations The Gallic Acid Equivalence was calculated as previously described in the
first material and methods.
Data Analysis The Gallic Acid Equivalent values were calculated in Microsoft Excel
(Version 12.2.8). A completely randomized design, with three replicates per
treatment, was used to compare five countries. Gallic Acid Equivalent values
were analyzed by analysis of variance, which was conducted using mixed models
using SAS 9.2 (2002-2008).
DPPH Assay Procedure
Procedure The DPPH assay was performed as previously described in the first
material and methods section.
Calculations The Gallic Acid Equivalent values were calculated in Microsoft Excel
(Version 12.2.8). A completely randomized design, with three replicates per
treatment, was used to compare five countries. Gallic Acid Equivalent values
were analyzed by analysis of variance, which was conducted using mixed models
using SAS 9.2 (2002-2008).

45
Data Analysis The Gallic Acid Equivalent values were calculated in Microsoft Excel
(Version 12.2.8). The values were then analyzed using SAS 9.2 (SAS 2002-
2008).

46
CHAPTER III RESULTS AND DISCUSSION
Effects of Roasting Ivory Coast Cocoa Beans at Different Times and Temperatures on the Antioxidant Capacity
ORAC Roasted Ivory Coast cocoa beans had Trolox Equivalent (TE) values that
ranged from a low of 38,402 TE µmol/g to a high of 533,349 TE µmol/g. Figure 7
and table 2 show the TE values as determined by Oxygen Radical Absorbance
Capacity (ORAC). The cocoa beans roasted at 100°C for 40 minutes had the
highest measured TE value of 533,349 TE µmol/g. This value was statistically
the same as cocoa beans roasted at 100°C 10 minutes, 20 minutes, and 130°C
30 minutes. The cocoa beans roasted at 190°C for 40 minutes had the lowest
Trolox Equivalent value of 38,402 TE µmol/g. This value was statistically the
same as cocoa beans roasted at 190°C 20 minutes and 30 minutes.
Cocoa beans roasted at 130°C for 30 minutes were chosen as the
roasting temperature and time to apply to cocoa beans from different countries.
The cocoa beans roasted at 130°C for 30 minutes had a TE value of 522,789 TE
µmol/g. Since this value was statistically the same as the highest ORAC value,
the higher roasting temperature of 130°C was selected over the roasting
temperature of 100°C. The lower temperature would usually not be used since it
may not develop the flavor characteristics typical for cocoa powder.
R2 values are used to indicate how well the linear regression line fits the
original data points. The R2 values from the ORAC standard curves ranged from
0.968 to 0.998 indicating that the linear regression was the best fitting model.
47
Different ORAC values were expected for the different heat treatments
because heat can be used to create antioxidants and also destroy them if the
temperature becomes too high. The ORAC values varied considerably across
the different temperatures and they did not react in the same way (i.e. some
started high and decreased, while others slowly increased with the time in the
oven).
Overall the highest antioxidant values were reached when cocoa beans
were roasted at 100°C for 40 minutes, which was the lowest temperature that
cocoa beans were roasted. Previously discussed literature roasted cocoa beans
at the low temperatures of 70°C, 110°C, 120°C and 182°C. So, 100°C was a low
temperature, especially compared to 182°C.
Flavor was not evaluated during this research, but in the future, research
can be conducted to determine if the characteristic flavors and aromas of
chocolate are still developed during a low roasting temperature for a long time
(40 minutes). If so, more antioxidants can be available to consumers.
The Trolox Equivalent values for the cocoa beans roasted at the varying
temperatures and times did not have a uniform decrease or increase as shown in
figure 7. The initial heating temperature was more than 20°C below the roasting
temperatures due to the opening of the door to place the beans into the oven.
This variation in temperature may have caused some of the variation in the
ORAC values. The cocoa beans roasted at 100°C and 190°C have TE values
that are statistically the same at 10 minutes at a 10% significance level.

48
There were many different factors that needed to be considered when
running the ORAC assay. First, the instrument is known to be temperature
sensitive. The temperature is automatically set in the instrument, but the
machine is constantly adjusting to keep the correct temperature. The
Fluorescein and AAPH solutions were made before each ORAC assay, so there
was room for human error when the solutions were being diluted with phosphate
buffer. Also, the blank that were used to calculate the net AUC were taken as an
average and applied across the samples. For future research, the blanks should
be calculated with each sample because the first readings of the phosphate
buffer are dependent on the first injection of Fluorescein and APPH into the
wells.
Total Phenolics When Total Phenolics Assay was used to calculate the Gallic Acid
Equivalents (GAE) for Ivory Coast cocoa beans roasted at different times and
temperatures, the values ranged from 1.60 mg/L GAE up to 5.45 mg/L GAE.
Cocoa beans roasted at 100°C for 40 minutes had the highest antioxidants
detected, with 5.45 mg/L GAE. The Cocoa beans roasted at 190°C for 20
minutes had the lowest value with 1.60 mg/L GAE. Figure 8 and table 3 show the
GAE values as determined by Total Phenolics assay.
Cocoa beans roasted at 100°C for 40 minutes were statistically the same
as 100°C 10 minutes, 30 minutes, 130°C 10 minutes, 20 minutes, 160°C 20
minutes, and 190°C 10 minutes at a 10% significance level. Cocoa beans
roasted at 190°C for 20 minutes were statistically the same as 100°C 10 minutes,

49
20 minutes, 30 minutes, 130°C 10 minutes, 30 minutes, 40 minutes, 160°C 10
minutes, 20 minutes, 30 minutes, 40 minutes, and 190°C for 20 minutes, 30
minutes, and 40 minutes at a 10% significance level.
The gallic acid equivalent of cocoa beans roasted at 130°C for 30 minutes
was 2.49 mg/L GAE. These cocoa beans were statistically the same as cocoa
beans roasted at 100°C 10, 20, 30 minutes, 130°C, 160°C, and 190°C for 20, 30,
and 40 minutes.
This assay had data that was similar to the ORAC assay data. The Total
Phenolics assay found the highest amount of antioxidants in the same sample
(100°C for 40 minutes) and the lowest amount of antioxidants in the same
sample (190°C for 20 minutes). The data that was statistically similar did vary
though. This could be explained by the same values that were used for the Total
Phenolics assay, so more differences were found versus the large values from
the ORAC assay.
This assay measures the amount of substance being tested that is needed
to inhibit the oxidation of the reagent. The Folin-Ciocalteu reagent that was used
measures the total reducing capacity of a sample. In addition to polyphenols, the
Total Phenolic assay also determines other reducing compounds. These other
compounds react to determine the overall antioxidant capacity. So, overall the
Total Phenolic assay is able to detect more antioxidants then the DPPH assay,
which could account for the higher gallic acid equivalents values. This assay is
not a complete assessment of the quantity of antioxidants, which is why other
assays, such as ORAC, are used.

50
DPPH When DPPH Assay was used to calculate the Gallic Acid Equivalents
(GAE) for Ivory Coast cocoa beans roasted at different times and temperatures,
the values ranged from 0.520 mg/L GAE up to 1.50 mg/L GAE. Figure 9 and
table 4 show the GAE values as determined by DPPH assay.
Cocoa beans roasted at 100°C for 30 minutes had the highest antioxidant
concentration with 1.50 mg/L GAE and cocoa beans roasted at 190°C for 20
minutes had the lowest antioxidant concentration with 0.502 mg/L GAE.
Statistically, cocoa beans roasted at 100°C, 130°C, and 160°C for 10 minutes, or
20 minutes and cocoa beans roasted at 190°C for 10 minutes and 30 minutes
were all statistically the same at a 10% significance level.
For the lowest antioxidant concentration (0.520 mg/L GAE), cocoa beans
roasted at 160°C for 30 minutes and 40 minutes, and cocoa beans roasted at
190°C for 20 minutes and 40 minutes were all statistically the same at a 10%
significance level.
The gallic acid equivalent of cocoa beans roasted at 130°C for 30 minutes
was 1.48 mg/L GAE. These cocoa beans were statistically the same as cocoa
beans roasted at 100°C, 130°C, and 160°C for 10 minutes, 20 minutes, 30
minutes, and 190°C for 10 minutes and 30 minutes.
The DPPH assay had data that was similar to the ORAC assay data, but
did not find the same high concentrations of antioxidants. The assay found the
lowest concentration of antioxidants in the same sample (190°C for 20 minutes),
but DPPH found 100°C for 30 minutes had the highest concentration of

51
antioxidants. This data was statistically the same at a 10% significance level as
100°C 40 minutes, which is what the ORAC assay determined was the highest
concentration of antioxidants.
The DPPH assay showed lower gallic acid equivalent values then the
Total Phenolics assay. The cocoa beans roasted at the lowest temperatures,
100°C and 130°C had the highest gallic acid equivalent values and were
statistically the same at a 10% significance level. A study by Lee et al. found
that DPPH might under estimate antioxidant capacity as compared to other
assays. These low antioxidant estimates are thought be from interruptions in the
absorbance by other compounds.
Effects of Roasting Time and Temperature on Cocoa Beans from Different Countries
L* a* b* Values When L* was measured the values ranged from a low of 17.66 (Ivory
Coast) to a high of 21.69 (Dominican Republic). Cocoa beans from Dominican
Republic had statistically different L* values then cocoa beans from Ecuador,
Indonesia, Haiti, and Ivory Coast. This statistically different L*, which was higher
than the other countries, means that the cocoa beans from the Dominican
Republic were closer to white on the L* a* b* scale
The a* values ranged from a low of 4.80 (Haiti) to a high of 7.36
(Indonesia). When a* was measured, cocoa beans from Dominican Republic
and Ivory Coast were statistically the same as every other country. Cocoa beans
from Indonesia were statistically the same as Ecuador, Dominican Republic and
52
Ivory Coast. Haiti was statistically the same as Ivory Coast and Dominican
Republic. All of the a* values were positive which meant the cocoa beans had
more of a red/magenta color to them. This red/magenta could have been caused
by some of the purple beans, which were less fermented then others. Since the
highest a* value was from Indonesia, the Indonesia cocoa nibs had the most
magenta color to them according to the Hunter Spectrophotometer.
The b* values ranged from a low of 3.54 (Haiti) to a high of 7.27
(Indonesia). When b* was measured, cocoa beans from Haiti, Dominican
Republic, and Ecuador were statistically the same at a 10% significance level.
For the highest value, Indonesia, Ecuador, and Ivory Coast were statistically the
same at a 10% significance level. All of the b* values were positive which meant
they were more of a yellow color instead of blue. Indonesia had the highest b*
value, so it had the most yellow color detected out of all of the countries. Haiti
had the lowest b* value, so it had the least amount of yellow color when
compared to the countries.
The a* and b* values were multiplied together to get an a*b* value that
represented how brown the sample was. The values ranged from a low of 17.35
(Haiti) to a high of 53.80 (Indonesia). The cocoa beans from Haiti had the lowest
value and were therefore the lightest brown. Cocoa beans from Indonesia had
the highest value and were the darkest brown. At a 10% significance level,
cocoa beans from Ecuador, Ivory Coast, and Indonesia were statistically the
same. Cocoa beans from Dominican Republic, Ecuador, Haiti, and Ivory Coast

53
were also statistically the same at a 10% significance level. The average L* a* b*
values can be found in table 6 of the appendix
ORAC When Oxygen Radical Absorbance Capacity Assay was used to calculate
the Trolox Equivalents for cocoa bean from different countries roasted at 130°C
for 30 minute, the ORAC assay found that Trolox Equivalent values ranged from
190,423 TE µmol/g to 487,913 TE µmol/g. Cocoa beans from Dominican
Republic had the highest Trolox Equivalent values reported and the data showed
that cocoa beans from Dominican Republic were statistically the same as
Ecuador. Ivory Coast had the lowest Trolox Equivalent value and was
statistically different from all other countries. As previously mentioned, the
ORAC assay is a measurement of total antioxidant capacity and it measures the
antioxidant reactions to completion, which gives a better overall assessment of
the quantity of antioxidants. Figure 11 and table 7 show the TE values as
determined by Oxygen Radical Absorbance Capacity assay.
Total Phenolics When Total Phenolics assay was used to calculate the Gallic Acid
Equivalents for cocoa beans from different countries roasted at 130°C for 30
minutes, the values ranged from a low of 0.783 mg/L GAE to a high of 3.264
mg/L GAE. The cocoa beans from Haiti had the highest value of 3.264 mg/L
GAE and the cocoa beans from Ivory Coast had the lowest value of 0.783 mg/L
GAE.

54
Haiti, which had the highest value, was statistically different from all other
countries. Cocoa beans from Dominican Republic and Indonesia were
statistically the same at a 10% significance level. Ivory Coast and Ecuador were
statistically the same at a 10% significance level.
The data from Total Phenolics assay showed the same results for
the highest antioxidant capacity as the ORAC assay. The data found that cocoa
beans from Haiti had the highest antioxidant capacity and the data was
statistically different from all of the other countries. The Total Phenolics assay
the found that Ivory Coast cocoa beans have the lowest antioxidant capacity.
This data is different from the ORAC assay because the ORAC assay found that
Ivory Coast cocoa beans were statistically the same as the highest antioxidant
capacity found in Haiti and Dominican Republic. Figure 12 and table 8 show the
GAE values as determined by Total Phenolics assay.
DPPH When DPPH assay was used to calculate the Gallic Acid Equivalents for
cocoa beans from different countries roasted at 130°C for 30 minutes, the values
ranged from a low of 0.600 mg/L GAE to a high of 0.623 mg/L GAE. The cocoa
beans from Indonesia had the lowest value of 0.600 mg/L GAE and the cocoa
beans from Ivory Coast had the highest value of 0.623 mg/L GAE. Cocoa beans
from Indonesia, Haiti, Ecuador, and Dominican Republic were statistically the
same at a 10% significance level. Cocoa beans from Ivory Coast and Dominican
Republic were statistically the same at 10% significance level.
55
The data from DPPH assay was slightly different from the Total Phenolics
assay and ORAC assay. DPPH assay found Ivory Coast had the highest
antioxidant capacity. For ORAC, the Ivory Coast cocoa beans reported the
lowest antioxidant capacity, and were statistically different from all other
countries. The Total Phenolics assay also found Ivory Coast to have the lowest
antioxidant capacity. Figure 13 and table 9 show the GAE values as determined
by DPPH assay.

56
CHAPTER IV CONCLUSIONS AND RECOMMENDATIONS
The results and conclusions from this study can only hold true for the
cocoa beans that were used for the experiment. Different growing conditions,
fermentation practices, and storage conditions all affect the cocoa beans. Each
of the cocoa beans from their respective countries were grown, cultivated,
fermented, dried, and stored independently. Also, literature has shown that some
countries such as Dominican Republic are known to under ferment their cocoa
products. The cocoa beans were stored and roasted under similar conditions in
the UT Food Science pilot plant. These different variables can all contribute to
the total antioxidant capacity.
The research found that Ivory Coast cocoa beans roasted at 100°C for 40
minutes had the highest concentration of antioxidants when measured by the
ORAC assay and Total Phenolics assay and cocoa beans roasted at 100°C for
20 minutes had the highest concentration of antioxidants when measured with
DPPH assay. When cocoa beans from the different countries were measured,
for antioxidants, the ORAC and Total Phenolics assay found that cocoa beans
from Haiti had the highest concentration. The DPPH assay found that Indonesia
had the highest antioxidant concentration. The differences of antioxidant capacity
shown in the different countries can be results of many different factors.
Cocoa beans are plant products and contain natural polyphenol
compounds, and specifically flavonoids, so antioxidants are present before any
processing occurs. Cocoa beans are expected to show antioxidant capacity and

57
roasting may increase the antioxidant capacity through the process of Maillard
reaction.
The antioxidants detected by the ORAC assay, Total Phenolic Assay, and
DPPH assay, are thought to be in part from the Maillard reaction. The Maillard
reaction occurs during high temperatures such as roasting and baking. During
the Maillard reaction, aldoses and ketoses are heated along with amines, which
cause reactions to occur. These reactions produce compounds, which are
responsible for flavor, aroma, and color of cocoa. These compounds have been
shown to possess antioxidant activity.
A possible reason for the increase in gallic acid equivalents for the Total
Phenolics assay may be explained by a study conducted by Ikawa and
coworkers (2003). This study showed that the Folin-Ciocalteu reagent reacts
with some nitrogen compounds and can give higher antioxidant readings. The
Maillard reaction requires amines to continue its process, so amines are present
in roasted cocoa beans. These amines may add to the overall reducing capacity
of the test.
Overall, the ORAC assay and Folin-Ciocalteu assay produced the most
similar results for the antioxidant capacity of the different countries. The ORAC
assay and the Folin-Ciocalteu assay are best used for predicting the overall
antioxidant capacity of a sample. This could help explain why similar results
were seen. The Folin-Ciocalteu assay is easier to run, takes less time, and
requires fewer chemicals, then the ORAC assay, but the ORAC assay is more
comprehensive and takes into account antioxidant reactions as they come to a

58
completion, instead of measuring them at a specific time in the
spectrophotometer.
Future Research
For future research, it is suggested that more control be put into the cocoa
bean process. The cocoa beans were given for the research experiment, but no
history is known, except for the country of origin. More research can also be
conducted that would look at the sensory properties of the different roasted
cocoa beans. If research shows that the characteristic chocolate flavor and
aroma is present in the cocoa beans roasted at low temperatures then greater
antioxidant contents may be available in cocoa products.

59
LIST OF REFERENCES

60
Adamson GE, Lazarus SA, Mitchell AE, Prior RL, Cao G, Jacobs PH, Kremers BG, Hammerstone JF, Rucker RB, Ritter KA, Schmitz HH. 1999. HPLC method for the quantification of procyanidins in cocoa and chocolate samples and correlation to total antioxidant capacity. Journal of Agricultural and Food Chemistry 47(10):4184-4188.
Afoakwa EO, Paterson A, Fowler M, Ryan A. 2008. Flavor formation and
character in cocoa and chocolate: a critical review. Critical reviews in food science and nutrition. 48(9):840-857.
Alberts HC and Cidell JL. 2006. Chocolate consumption, manufacturing, and
quality in Western Europe and the United States. Geography. 91(3):218-226.
American Chemical Society. 1999. Phenol Antioxidant Quantity and quality in
foods: cocoa, dark chocolate, and milk chocolate. Journal of Agriculture and Food Chemistry. 47(12): 4821-4824.
Arlorio M, Locatelli M, Travaglia F, Coisson JD, Del Grosso E, Minassi A,
Appendino G, and Martelli A. 2008. Roasting impact on the contents of clovamide (N-caffeoyl-L-DOPA) and the antioxidant activity of cocoa beans (Theobroma cacao L.). Journal of Food Chemistry. 106: 967-975.
Brand-Williams W, Cuvelier ME, Berset C. 1994. Use of a free radical method to
evaluate antioxidant activity. Food Science and Technology. 28(1):25-30. Bravo L. 1998. Polyphenols: chemistry, dietary sources, metabolism, and
nutritional significance. Nutritional Review. 56(11):317-333. Chatt E.M. 1953. Cocoa: cultivation, processing, analysis. New York: Inter-
science publishers. Cocoa Story: Cultivation, Trade, and Transport. European Cocoa Association. Date Accessed. 4 Apr. 2011. Website: http://www.eurococoa.com/en/x/ 145/cultivation-trade-and-transport. Code of Federal Regulations Title 21. U.S. Food and Drug Administration. Date Accessed. 13 September. 2010. Website: http://www.accessdata.fda.gov/ scripts/cdrh/cfdocs/cfcfr/CFRSearch.cfm?CFRPart=163&showFR=1 Counet C., Callemien D., Ouwerx C., and Collin S. 2002. Use of gas
chromatography-olfactometry to identify key odorant compounds in dark chocolate. Comparison of samples before and after conching. Journal of Agriculture and Food Chemistry. 50(8): 2385-2391.

61
Dand, R. 1996. The international cocoa trade, second edition. New York: Woodhead publishing limited.
Dimick, P.S. 1983. Development of flavor in chocolate. Proceedings Towards
Better Acceptance of Malaysian Cocoa. Mardi, Serdang, Malaysia, 15–21. Fennema OR. 1996. Food Additives. Food Chemistry, Third Edition. New York:
Taylor and Francis. 768-823. Folin O. and Ciocalteu V. 1927. On Tyrosine and Tryptophan
Determination in Proteins. J. Biol. Chem. 73: 627-650. Forsyth W.G.C. and Quesnel V.C. 1957. Variations in cocoa preparation. Sixth
Meeting and InterAmerican Cacao Cinnuttee, Bahia, Brazil. p. 157. Guyot S, Marnet N, Laraba D, Sanoner P, Drilleau J-F. 1998. Reversed-phase
HPLC following thiolysis for quantities estimation and characterization of the four main classes of phenolic compounds in different tissue zones of a French cider apple variety (Malus domestica Var. Kermerrien). Journal of agriculture and food chemistry. 46: 1698-16705.
Halliwell B. 1990. How to characterize a biological antioxidant. Free Radical
Research Communications. 9:1-32. Halliwell B, Aeschbach R., Loliger J, Aruoma OI. 1995. The Characterization of
Antioxidants. Food Chemistry Toxicology. 33(7): 601-607.
Hammerstone JF, Lazarus SA, and Schmitz HH. 2000. Procyanidin content and variation in some commonly consumed foods. Journal of Nutrition.130(8):2086-2092.
Heinzler, M. and Eichner, K. 1992. The role of amodori compounds during cocoa processing – formation of aroma compounds under roasting conditions. Z. Lebensm.-Unters.-Forsch. 21: 445–450.
Hoskin JC. 1994. Sensory properties of chocolate and their development.
American Journal of Clinical Nutrition. 60(6): 1068-1070. HunterLab. 2008. CIE L* a* b* color scale. Applications Notes 8(7):1-4. Ikawa M, Schaper TD, Dollard CA, Sasner JJ. 2003. Utilization of Folin-Ciocalteu
phenol reagent for the detection of certain nitrogen compounds. Journal of Agriculture and Food Chemistry. 51(7): 1811–1815.

62
Jinap S and Dimick PS. 1990. Acidic characteristics of fermented and dried cocoa beans from different countries of origin. Journal of Food Science. 55(2): 547-550.
Kahkonen M, Hopia AI, Vuorela HJ, Rauha JP, Pihlaja K, Kujala TS, Heinonen
M. 1999. Antioxidant activity of plant extracts containing phenolic compounds. Journal of Agriculture Food Chemistry. 47(10): 3954-3962.
Katsube T, Tabata H, Ohta Y, Yamasaki Y, Anuurad E, Shiwaku K, Yamane Y.
2004. Screening for antioxidant activity in edible plant products: comparison of low-density lipoprotein oxidation assay, DPPH radical scavenging assay, and Folin-Ciocalteu assay. Journal of Agricultural and Food Chemistry. 52(8):2391-2396.
Knapp, AW. 1937. Cocoa Fermentation. London: John Ball, Sons and Curnow
Ltd. Krysiak W. 2006. Influence of roasting conditions on coloration of roasted cocoa
beans. Journal of Food Engineering. 77(3): 449-453. Lee KW, Kim YJ, Lee HJ, and Lee CY. 2003. Cocoa has more phenolic
phytochemicals and higher antioxidant capacity than teas and red wine. Journal of agricultural and food chemistry. 51(25): 7292-7295.
Lu Z, Nie G, Belton PS, Tang H, and Zhao B. 2006. Structure–activity
relationship analysis of antioxidant ability and neuroprotective effect of gallic acid derivatives. Neurochemistry International. 48(4): 263-274.
Manach C, Scalbert A, Morand C, Remesy C, Jimenez L. 2004. Polyphenols:
food sources and bioavailability. The American journal of clinical nutrition. 79(5): 727-747.
Miller KB, Stuart DA, Smith NL, Lee CY, McHale NL, Flanagan JA, Ou B, Hurst
WJ. 2006. Antioxidant activity and polyphenol and procyanidin contents of selected commercially available cocoa-containing and chocolate products in the United States. Journal of Agricultural and Food Chemistry 54(11): 4062-4067.
Minifie BW. 1989. Chocolate, cocoa, and confectionary: science and technology,
third edition. New York: Van Nostrand Reinhold. Molyneux P. 2003. The use of the stable free radical diphenylpicrylhydrazyl
(DPPH) for estimating antioxidant activity. 211-219.

63
Natsume M, Osakabe N, Yamagishi M, Takizawa T, Nakamura T, Miyatake H, Hatano T, Yoshida T. 2000. Analyses of polyphenols in cacao liquor cocoa, and chocolate by normal-phase and reversed-phase HPLC. Bioscience, Biotechnology, Biochemistry 64(12): 2581-2587.
Nenadis N and Tsimidou M. 2002. Observations of the estimation of scavenging
activity of phenolic compounds using rapid 1,1-Diphenyl-2-picrylhydrazyl (DPPH•) tests. Journal of the American Oil Chemists' Society. 79(12):1191-1195.
Niemenak N, Rohsius C, Elwers S, Ndoumou DO, and Lieberei R. 2006.
Comparative study of different cocoa (Theobroma cacao L.) clones in terms of their phenolics and anthocyanins contents. Journal of Food Composition and Analysis. 19(6): 612-629.
Ortega N, Romero M, Macia A, Reguant J, Angles N, Morello J, Motilva M. 2008.
Obtention and characterization of phenolic extracts from different cocoa sources. Journal of Agricultural and Food Chemistry 56(20): 9621-9627.
Othman A, Ismail A, Ghani NA, Adenan I. 2007. Antioxidant capacity and
phenolic content of cocoa beans. Journal of Food Chemistry 100: 1523-1530.
Ou B, Hampsch-Woodill M, Prior RL. 2001. Development and validation of an
improved oxygen radical absorbance capacity assay using fluorescein as the fluorescent probe. Journal of Agricultural and Food Chemistry. 49(10) 4619-4626.
Prior RL, Cao G, Martin A, Sofic E, McEwen J, O’Brien C, Lischner N, Ehlenfeldt
M, Kalt W, Krewer G, and Mainland CM. 1998. Antioxidant capacity as influenced by total phenolic and anthocyanin content, maturity, and variety of Vaccinium species. Journal of Agricultural Food Chemistry. 46: 2686-2693.
Prior RL, Wu X, and Schaich K. 2005. Standardized methods for the
determination of antioxidant capacity and phenolics in foods and dietary supplements. Journal of Agricultural and Food Chemistry. 53 (10): 4290-4302.
Ramli N, Hassan O, Said M, Samsudin W, Idris NA. 2006. Influence of roasting
conditions on volatile of roasted Malaysian cocoa beans. Journal of food processing and preservation. 30:280-298.

64
Reineccius GA, Keeney PG, Weissberger W. 1972. Factors Affecting the concentration of pyrazines in cocoa beans. Journal of Agricultural and Food Chemistry 20(2):202-206.
Rohan TA, Stewart T. 1965. The precursors of chocolate aroma: changes in the
free amino acids during roasting of cocoa beans. British Food Manufacturing Industries Research Association: 202-205.
Sánchez-Moreno C. 2002. Review: Methods used to evaluate the free radical
scavenging activity in foods and biological systems. Food Science and Technology International. 8(3):121-137.
Santos-Buelga C, Scalbert A. 2000. Proanthocyanidins and tannin-like
compounds: nature, occurrence, dietary intake, and effects on nutrition and health. Journal of science foods and agriculture. 80:1094-1117.
Senapathy JG, Jayanthi S, Viswanathan P, Umadevi P, and Nalini N. 2011.
Effect of gallic acid on xenobiotic metabolixing enzymes in 1,2-dimethyl hydrazine induced colon carcinogenesis in Wistar rats- A chemopreventive approach. Food and Chemical Toxicology. 49(4): 887-892.
Shahidi F. and Wanasundara UN. 1997. Measurement of lipid oxidation and
evaluation of antioxidant activity. In: Shadidi F. Natural antioxidants. Chemistry, health effects, and applications. Champaign, Il: Aocos Press. P 379-396.
Singleton VL, Orthofer R, Lamuela-Raventos RM. 1999. Analysis of total phenols
and other oxidation substrates and antioxidants by means of Folin-Ciocalteu reagent. Methods in Enzymology. 299:152-178.
Singleton VL and JA Rossi. 1965. Colorimetry of total phenolics with
phosphomolybdic-phosphotungstic acid reagents. American Journal of Enology and viticulture. 16(3):144-158.
Steinberg FM, Bearden MM, Keen CL. 2003. Cocoa and chocolate flavonoids:
Implications for cardiovascular health. Journal of the American dietetic association. 103(2):215-223.
Trading and shipping cocoa beans. International Cocoa Organization. Date Accessed. 4 Apr. 2011. Website: http://www.icco.org/about/shipping.aspx. Vinson J, Zubik L, Bose P, Samman N, Proch J. 2005. Dried fruits: excellent in
vitro and in vivo antioxidants. Journal of the American College of Nutrition 24(1): 44–50.

65
Wright JS, Johnson ER, and DiLabio GA. 2001. Predicting the activity of
phenolic antioxidants: Theoretical method, analysis of substituent effects, and application to major families of antioxidants. Journal of American Chemical Society. 123: 1173-1183.
Yao LH, Jiang YM, Shi J, Tomas-Barberan FA, Datta N, Singanusong R, Chen
SS. 2004. Flavonoids in food and their health benefits. Plant Foods for Human Nutrition. 59:113-122.
Zhu QY, Zhang AQ, Tsang D, Huang Y, Chen ZY. 1997. Stability of green tea
catechins. Journal of agriculture and food chemistry. 45:4624-4628. Zoumas B.L. Kreiser W.R., and Martin R.A. 1980. Theobromin and caffeine
content of chocolate products. Journal of Food Science. 45: 314-316.

66
APPENDIX
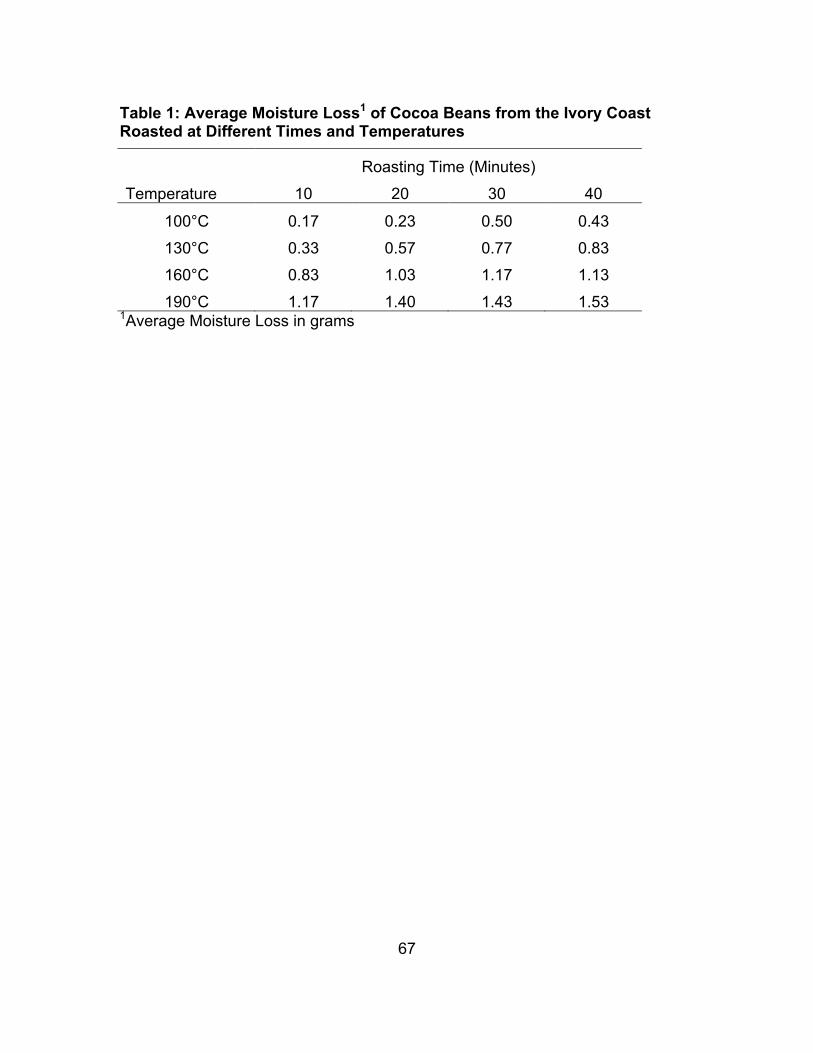
67
Table 1: Average Moisture Loss1 of Cocoa Beans from the Ivory Coast Roasted at Different Times and Temperatures
Roasting Time (Minutes)
Temperature 10 20 30 40
100°C 0.17 0.23 0.50 0.43
130°C 0.33 0.57 0.77 0.83
160°C 0.83 1.03 1.17 1.13
190°C 1.17 1.40 1.43 1.53 1Average Moisture Loss in grams

68
Figure 1: Convection Oven Temperatures of Ivory Coast Cocoa Beans Roasted at Different Times and Temperatures

69
Figure 2: Example of Sample Measurements from ORAC Assay

70
Figure 3: Example of Normalized Sample Measurements from ORAC assay

71
Figure 4: Example of a Trapezoid Used to Calculate AUC From ORAC Assay

72
Figure 5: Example of Sample Measurements and Blank Measurements from ORAC Assay

73
Equation 1: Equation to Calculate AUC from ORAC Assay

74
Figure 6: Example of Trolox Measurements from ORAC Assay

75
Figure 7: Mean Trolox Equivalent Values as determined by ORAC Assay for Ivory Coast Cocoa Beans Roasted at Different Times and Temperatures

76
Table 2: Mean1 Trolox Equivalent2 Values as determined by ORAC Assay3 for Ivory Coast Cocoa Beans Roasted at Different Times and Temperatures
Roasting Time (Minutes)
Temperature 10 20 30 40
100°C 494516a 419194ab 311701bcd 533349a
130°C 272150cd 263857cde 522789a 318775bcd
160°C 352547bc 236852cde 208072de 217694de
190°C 281073cd 130750ef 65896f 38402f 1 Means followed by the same letter are not significantly different from one another at α = 0.10. 2 Trolox Equivalents = µmol/g of defatted cocoa nib 3 Oxygen Radical Absorbance Capacity n= 3 replications, each measured 4 times.

77
Figure 8: Mean Gallic Acid Equivalent1 Values as determined by Total Phenolics Assay2 for Ivory Coast Cocoa Beans Roasted at Different Times and Temperatures 1 Gallic Acid Equivalents = mg/L 2 Assay used to measure the total reducing capacity of a sample

78
Table 3: Mean1 Gallic Acid Equivalent2 Values as determined by Total Phenolics3 Assay for Ivory Coast Cocoa Beans Roasted at Different Times and Temperatures
Roasting Time (Minutes)
Temperature 10 20 30 40
100°C 4.01abcd 2.98bcd 3.42abcd 5.45a
130°C 2.97abcd 3.96abc 2.49cd 2.16bcd
160°C 1.76d 2.83abcd 1.76d 1.82d
190°C 4.08ab 1.60d 2.01bcd 1.70d 1 Means followed by the same letter are not significantly different from one another at α = 0.10. 2 Gallic Acid Equivalents = mg/L 3 Assay used to measure the total reducing capacity of a sample n= 3 replications

79
Figure 9: Mean Gallic Acid Equivalent Values1 as determined by DPPH2
Assay for Ivory Coast Cocoa Beans Roasted at Different Times and Temperatures 1 Gallic Acid Equivalents = mg/L 2 Assay used to measure the activity of antioxidants

80
Table 4: Mean1 Gallic Acid Equivalent2 Values as determined by DPPH3 Assay for Ivory Coast Cocoa Beans Roasted at Different Times and Temperatures
Roasting Time (Minutes)
Temperature 10 20 30 40
100°C 1.50a 1.41ab 1.50a 1.48ab
130°C 1.43ab 1.49a 1.48ab 1.30abc
160°C 1.08abc 1.23abc 0.99bcd 0.90cd
190°C 1.33abc 0.52d 1.02abc 0.88cd 1 Means followed by the same letter are not significantly different from one another at α = 0.10. 2 Gallic Acid Equivalent = mg/L 3 Assay used to measure the activity of antioxidants n= 3 replications
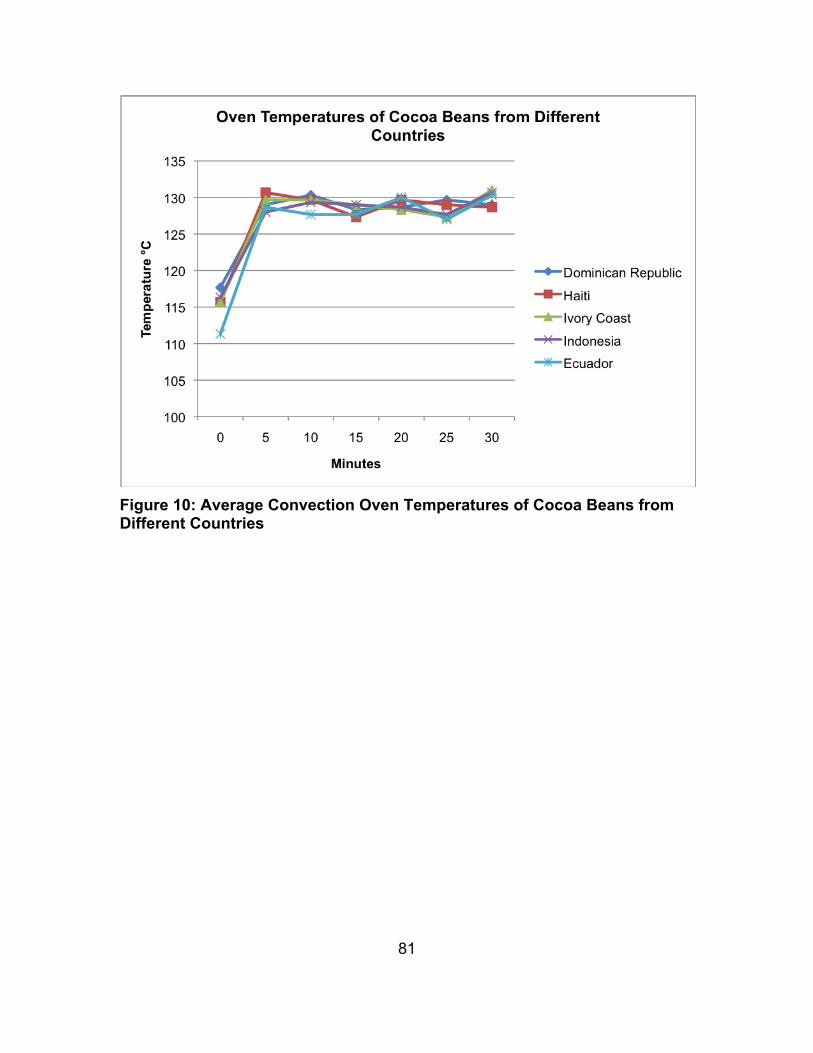
81
Figure 10: Average Convection Oven Temperatures of Cocoa Beans from Different Countries

82
Table 5: Average Moisture Loss1 of Cocoa Beans From Dominican Republic, Ecuador, Indonesia, Haiti, and Ivory Coast roasted at 130°C for 30 minutes.
Countries
Dominican Republic Ecuador Indonesia Haiti Ivory Coast
1.57 1.73 1.76 2.03 1.76 1 Average Moisture Loss in grams

83
Table 6: Mean1 L*, a*, b* Values of Unroasted Cocoa Beans from Dominican Republic, Ecuador, Indonesia, Haiti, and Ivory Coast.
Country L* a* b*
ab*
Dominican Republic 21.69a 5.98ab 4.83bc
29.80b
Ecuador 18.96b 6.65a 5.57abc
38.12ab
Haiti 17.84b 4.80b 3.54c
17.35b
Indonesia 19.53b 7.36a 7.27a
53.80a
Ivory Coast 17.66b 5.84ab 5.81ab
34.23ab
1Means in the same column, followed by the same letters do not significantly differ at a 5% level of probability. n=3 replications

84
Figure 11: Mean1 Trolox Equivalents2 Values as Determined by ORAC Assay for Cocoa Beans Roasted at 130°C for 30 Minutes 1Means followed by the same letters do not significantly differ at a 10% level of probability. 2 Trolox Equivalents = µmol TE/g of defatted cocoa nib

85
Table 7: Mean1 Trolox Equivalents Values2 of Cocoa Beans from Different Countries as Determined by ORAC Assay.
Countries Dominican
Republic Ecuador Haiti Indonesia Ivory Coast
µmol TE/g 487913a 463958ab 416251b 285499c 190423d
1 Means followed by the same letter are not significantly different from one another at α = 0.10. 2 Trolox Equivalents = µmol TE/g of defatted cocoa nib n= 3 replications measured 4 times each

86
Figure 12: Mean1 Gallic Acid Equivalent Values as determined by Total Phenolics Assay for Roasted Cocoa Beans From Dominican Republic, Ecuador, Haiti, Indonesia, and Ivory Coast. 1 Means labeled as the same letter are not significantly different from one another at α = 0.10.

87
Table 8: Mean1 Gallic Acid Equivalents2 Values of Cocoa Beans From Different Countries as Determined by Total Phenolic3 Assay
Countries Dominican Republic Ecuador Haiti Indonesia Ivory Coast
2.338b 1.335cd 3.264a 1.703d 0.783bc 1 Means followed by the same letter are not significantly different from one another at α = 0.10. 1Gallic Acid Equivalents = mg/L 2 Assay used to measure the total reducing capacity of a sample n= 3 replications
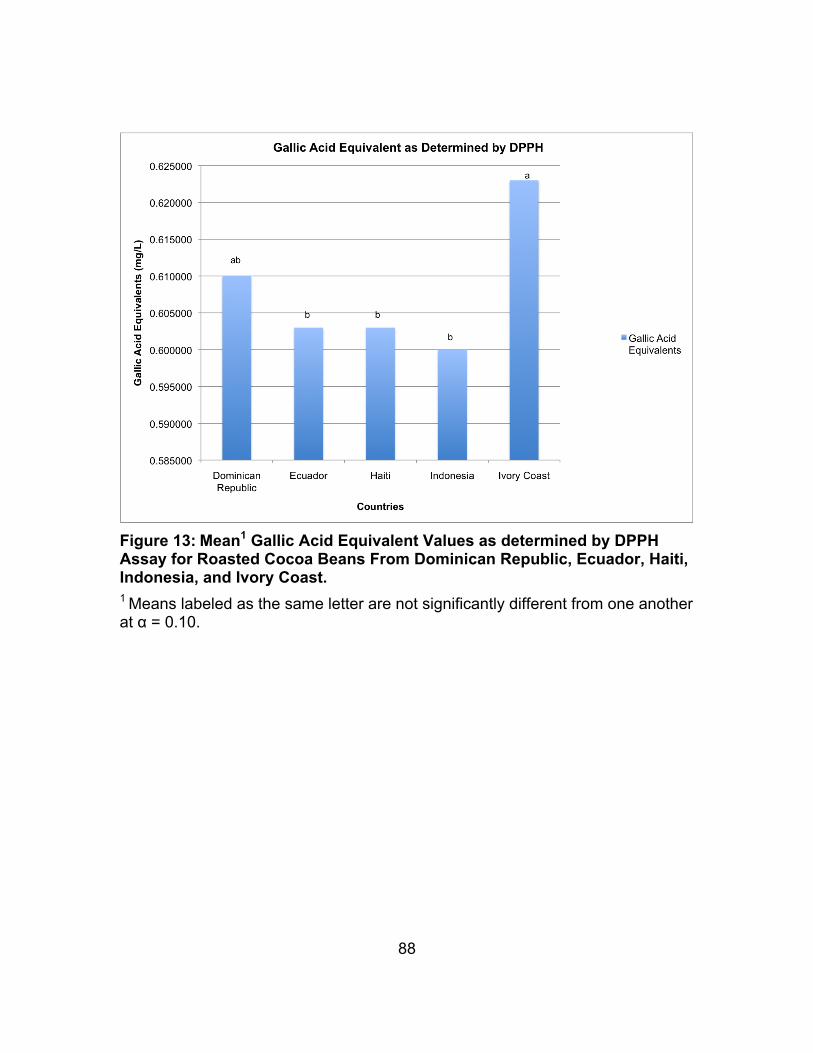
88
Figure 13: Mean1 Gallic Acid Equivalent Values as determined by DPPH
Assay for Roasted Cocoa Beans From Dominican Republic, Ecuador, Haiti, Indonesia, and Ivory Coast. 1 Means labeled as the same letter are not significantly different from one another at α = 0.10.

89
Table 9: Mean1 Gallic Acid Equivalent2 Values of Cocoa Beans From Different Countries as Determined by DPPH3 Assay
Countries Dominican Republic Ecuador Haiti Indonesia Ivory Coast
0.610ab 0.603b 0.603b 0.600b 0.623a 1 Means followed by the same letter are not significantly different from one another at α = 0.10. 2 Gallic Acid Equivalents = mg/L 3 Assay used to measure the activity of antioxidants n= 3 replications

90
P B B B B B B B
B S1 X1 X5 X9 X13 S4
B
B S2 X2 X6 X10 X14 S3 B
B S3 X3 X7 X11 X15 S2
B
B S4 X4 X8 X12 X16 S1 B
B B B B B B B B
Figure 14: Micro-plate Layout for ORAC P= Fluorescein Working Solution B= Buffer X1 to X4 = Sample 1 S1= 50 µm Trolox X5 to X8 = Sample 2 S2= 25 µm Trolox X9 to X12 = Sample 3 S3= 12.5 µm Trolox X13 to X16 = Sample 4 S4= 6.25 µm Trolox

91
Phosphate Buffer Solution Solution #1 1) Weigh out 10.21 g of Monopotassium Phosphate
2) Put into a 1000 mL flask
3) Add 700 mL of DI water and magnetic stir bar. Stir on a stir-plate until the
phosphate is dissolved
4) Remove the stir bar and fill the flask with 300mL of DI water
Solution #2
1) Weigh out 13.06 g of Dipotassium Phosphate
2) Put into a 1000 mL flask
3) Add 700 mL of DI water and magnetic stir bar and stir on a stir plate until the
phosphate is dissolved
4) Remove the stir bar and fill the flask with 300 mL of DI water
Buffer Solution
1) Pour 800 mL of Solution #2 in a 1000mL beaker
2) Put stir bar into the beaker and place on a stir plate
3) Start reading pH
4) Slowly pour about 200mL of Solution #1 into the beaker
Slowly add more solution #1 until the pH reads 7.4

92
Fluorescein Solution
1) Weigh out 0.0225g of Fluorescein
2) Pour 50 mL of Phosphate buffer into a 150mL beaker
3) Mix Fluorescein and phosphate buffer on a stir plate
4) Remove 50 µl (0.05 mL) a put in a centrifuge tube
5) Add 10 mL of Phosphate buffer to centrifuge tube and vortex
6) Aliquot 1.5 mL into Eppendorf tubes
7) Store Eppendorf tubes in -20°C until needed
Fluorescein Working Solution
1) Remove tubes from the freezer the night before
2) Turn on the water bath and heat to 37°C
3) Pipette 0.8 mL of Fluorescein in to 50 mL of phosphate buffer into a
centrifuge tube
4) Keep the Fluorescein working solution warm until ready for use
5) Pipette 200 µl into first well before warming the plate

93
Trolox Standard
1) Weigh out 0.025 g of Trolox
2) Put Trolox in a 250 mL beaker
3) Pour 100 mL of Phosphate Buffer pH 7.4 in the beaker
4) Mix with a stir bar until Trolox is dissolved (1 mM Trolox)
5) Dilute with 100 mL of Phosphate Buffer (0.05 mM Trolox)
6) Aliquot 1.5 mL in 1.5 mL Eppendorf tubes
7) Store in the freezer chest (-85°C)
Trolox Working Solution: 1) Remove one tube of Trolox the night before
2) Take 1 mL of Trolox and add it to 9 mL of phosphate buffer = 50 µm (S1)
3) Remove 20 µl and aliquot into S1 position
4) Remove 2 mL from S1 and add 2 mL of phosphate buffer = 25 µm (S2)
5) Remove 20 µl and aliquot into S2 position
6) Remove 2 mL from S2 and add 2 mL of phosphate buffer = 12. 5µm (S3)
7) Remove 20 µl and aliquot into S3 position
8) Remove 2 mL from S3 and add 2mL of phosphate buffer = 6.25 µm (S4)
9) Remove 20 µl and aliquot into S4 position

94
AAPH Solution Store AAPH in the refrigerator (4°C) until ready to use
1. Bring 5 mL of phosphate buffer to room temperature
2. Dissolve 0.108 g of AAPH into phosphate buffer and put into a centrifuge tube
3. Use the solution to prime pump two of the Fluostar Optima

95
Gallic Acid Write-Up Store in the refrigerator for up to nine days
1. Measure out 0.05 g Gallic acid and put into a 100 mL volumetric flask
2. Add 3 mL of ethanol to dissolve the gallic acid
3. Fill the flask to volume with D.I water (100 mL)

96
Folin-Ciocalteu Write-Up Will stay fresh for a few months
1. Pour 12.5 mL of 2N Folin-Ciocalteau into a 100 mL volumetric flask
2. Fill the flask to volume (100 mL) with DI water
3. Store the solution in an amber bottle.
97
Sodium Carbonate Write-Up
Will stay fresh for a few months
1. Dissolve 12.4 g of Na2CO3 in 100 mL of DI Water
2. Mix on a stir plate until everything is dissolved
3. Store in an amber bottle

98
DPPH Write-Up Dissolve 0.004 g of DPPH in 100 mL of methanol
Cover the flask with foil and stir until dissolved
Keep the solution covered with foil to prevent light from getting to it
99
Definitions of Faults in cocoa beans detected by cut-test Moldy Bean- A cocoa bean on the internal parts of which mold is visible to the naked. Slaty Bean- A cocoa bean which shows a slaty color over half or more of the surface. Insect Damaged Bean- A cocoa bean the internal parts of which contain insects at any stage of development, or have been attacked by insects which have caused damage visible to the naked eye. Germinated Bean- A cocoa bean the shell of which has been pierced, slit, or broken by the growth of the seed germ. Flat Bean- A cocoa bean of which two cotyledons are so thin that it is not possible to obtain a cotyledon surface by cutting.

100
VITA Whitney Leigh Harrington was born in Roanoke Virginia on March 20th and
is the daughter of Terry and Marcia. She grew up in Roanoke Virginia and
attended Northside High School. After graduation, she attended Virginia
Polytechnic Institute and State University (Virginia Tech) where she received her
B.S. degree in Human Nutrition, Food, and Exercise in May 2009. In 2011, she
graduated from University of Tennessee with a M.S. degree in Food Science and
Technology.