Embed Size (px)
Citation preview

Louisiana State UniversityLSU Digital Commons
LSU Master's Theses Graduate School
2010
The effects of self-assessment on student learning ofmathematicsDaniel James HotardLouisiana State University and Agricultural and Mechanical College, [email protected]
Follow this and additional works at: https://digitalcommons.lsu.edu/gradschool_theses
Part of the Physical Sciences and Mathematics Commons
This Thesis is brought to you for free and open access by the Graduate School at LSU Digital Commons. It has been accepted for inclusion in LSUMaster's Theses by an authorized graduate school editor of LSU Digital Commons. For more information, please contact [email protected].
Recommended CitationHotard, Daniel James, "The effects of self-assessment on student learning of mathematics" (2010). LSU Master's Theses. 2946.https://digitalcommons.lsu.edu/gradschool_theses/2946

THE EFFECTS OF SELF-ASSESSMENT ON STUDENT LEARNING
OF MATHEMATICS
A Thesis
Submitted to the Graduate Faculty of the
Louisiana State University and
Agricultural and Mechanical College
in partial fulfillment of the
requirements for the degree of
Master of Natural Sciences
in
The Interdepartmental Program in Natural Sciences
by
Daniel J. Hotard
B.S., Louisiana State University, 2007
August 2010

ii
ACKNOWLEDGEMENTS
I would like to thank Dr. James Madden who served as my advisor as well as my
instructor not only in this Masters program, but in my undergraduate work as well. I would also
like to thank my wife Claire, whose insight and moral support made this thesis possible.

iii
TABLE OF CONTENTS
ACKNOWLEDGMENTS ………………………………………………………………………..ii
LIST OF TABLES ……………………………………………………………………………….iv
LIST OF FIGURES ………………………………………………………………………………v
ABSTRACT ……………………………………………………………………………………..vi
CHAPTER 1. SELF-ASSESSMENT: THEORY & PRACTICE…………………………..……1
1.1 Formative vs. Summative Assessment ……………………………………………….1
1.2 Theoretical Arguments for Self-Assessment …………………………………………3
1.3 Studies of Self-Assessment and Rubric Use ………………………………………….5
1.4 How to Use Self-Assessment (Techniques and Difficulties) ………………………....6
1.5 Summary……………………………………………………………………………..10
CHAPTER 2. RESEARCH QUESTIONS AND SETTING ...…………………………………12
2.1 The Mathematics: What Was Taught ……………………………………………...13
2.1.1 Unit 5: Systems of Equations, Matrices, and Systems of Inequalities …...13
2.1.1 Unit 6: Measurement ……………………………………………………..14
CHAPTER 3. METHODS AND MATERIALS ……….............................................................16
3.1 Subjects ……………………………………………………………………………...16
3.2 Materials …………………………………………………………………………….16
3.3 Procedures …………………………………………………………………………..17
3.4 Data Analysis ………………………………………………………………………..20
CHAPTER 4. RESULTS ……………………………………………………………………….21
CHAPTER 5. CONCLUSION …………………………………………………………………25
REFERENCES ………………………………………………………………………………….28
APPENDIX A: RUBRICS AND SELF-SCORING SHEETS ………………………………....30
APPENDIX B: PRETEST AND POSTTEST DATA FOR BOTH UNITS...………………….51
APPENDIX C: ASSESSMENTS ...…………………………………………………………….53
VITA …………………………………………………………………………………………….66

iv
LIST OF TABLES
1. Experimental Design …………………………………………………………………………18
2. Learning Gains by Treatment Groups ………………………………………………………..21
3. Pretest and Posttest Data for Both Units……………………………………………………...51

v
LIST OF FIGURES
1. Unit 5 Pretest and Posttest ………………………………………………………………..….21
2. Unit 6 Pretest and Posttest …………………………………………………………………...22
3. Students with Complete Data ………………………………………………………………..22
4. Students with Complete Data and Transposed Line …………………………………………23

vi
ABSTRACT
Self-assessment can be defined as students judging their own work, based on evidence
and explicit criteria, for the purpose of improving future performance. Many researchers agree
that implementation of student self-assessment in the classroom is an important tool for
improving academic performance and self-efficacy.
In this thesis, I investigated the effects of student self-assessment on learning gains of 81
alternative high school Algebra I students. This study took place over the course of two units of
instruction. Classes were divided into two groups. One group of students utilized rubrics to self-
assess their own work for the first unit, while the other group did not. During the second unit,
treatments for both groups were switched. Pretest and posttest data for both units was collected.
Student learning gains under each treatment were compared using a paired t-test. Mean learning
gains under both treatments were also examined using a two-sample t-test for comparing two
population means. In all cases, no significant difference was found.
1
CHAPTER 1. SELF-ASSESSMENT: THEORY & PRACTICE
This thesis concerns the effects of self-assessment on student learning of mathematics. In
this chapter, self-assessment is defined, and theoretical arguments for the use of self-assessment
are presented. In addition, several studies on the effectiveness of self-assessment are analyzed,
and suggested techniques for using self-assessment in the classroom are examined. Challenges
to implementing self-assessment effectively are also discussed, as well as methods for
overcoming these obstacles.
1.1 Formative vs. Summative Assessment
In education, there are two types of assessment: formative assessment, also called
assessment-for-learning, and summative assessment, also known as assessment-of-learning
(Stiggins, Arter, Chappuis, & Chappuis, 2007). Black, Harrison, Lee, Marshall & Wiliam (2004)
explain the distinction as follows:
Assessment for learning is any assessment for which the first priority in its design
and practice is to serve the purpose of promoting students’ learning. It thus differs
from assessment designed primarily to serve the purposes of accountability, or of
ranking, or of certifying competence. An assessment activity can help learning if
it provides information that teachers and their students can use as feedback in
assessing themselves and one another and in modifying the teaching and learning
activities in which they are engaged. Such assessment becomes ―formative
assessment‖ when the evidence is actually used to adapt the teaching work to
meet learning needs. (p. 10)
This thesis concerns assessment-for-learning.
Stiggins, et al. (2007) state that there are three questions students must answer when
dealing with assessment for learning: (1) ―Where am I going?‖ (2) ―Where am I now?‖ and (3)
―How can I close the gap?‖ (p. 41). Teachers can help students answer the first question by
revealing learning expectations to students in easy-to-understand language and by providing a
range of poor- to good-quality work to students. To answer the second question, teachers should

2
provide practice relying on descriptive feedback students can use to improve their work as well
as encouraging students to monitor their progress day-to-day. To assist students with closing the
gap between where they are now and where they are going, teachers should show students how
to improve one attribute at a time and how to reflect on changes in their work and their academic
capabilities (Stiggins, 2008, p. 220). Stiggins (2008) argues for the emotional benefits of
assessment for learning in terms of students feeling in control of their own learning success.
However, despite the arguments for good use of formative assessment, Black, et al.
(2004) stressed the need for improvement in the use of such assessment. Black and his coauthors
identify three main problems: ―1) the assessment methods that teachers use are not effective in
promoting good learning, 2) grading practices tend to emphasize competition rather than
personal improvement, and 3) assessment feedback often has a negative impact, particularly on
low-achieving students, who are led to believe that they lack ―ability‖ and so are not able to
learn‖ (p. 9). In response to these problems, these authors propose improvements under four
headings: ―questioning, feedback through grading, peer- and self-assessment, and the formative
use of summative tests‖ (p.11). These improvements, according to their studies, produced an
effect size of approximately 0.3 standard deviations. Black, et al. concluded that ―such
improvements, produced across a school, would raise a school in the lower quartile of the
national performance tables to well above average‖ (p. 11). One of these headings, self-
assessment, is of particular interest to many researchers. According to Stiggins, et al. (2007),
―Periodic articulation about their understanding of quality and about their own strengths and
weaknesses is essential to students’ ability to improve. Self-assessment is a necessary part of
learning, not an add-on that we do if we have time or the ―right‖ students. Struggling students
are the right students‖ (p. 242).

3
1.2 Theoretical Arguments for Self-Assessment
Rolheiser and Ross (2001) have this to say about the current educational environment:
[O]ne of the most challenging shifts in conceptions of assessment is related to the
changing role of the teacher and the changing educational environment. The
context for educators is changing rapidly and dramatically. It is more complex
and volatile…In such a shifting context our outcomes for students have
sufficiently changed and traditional assessment practices are no longer adequate.
(Rolheiser and Ross, 2001)
In today’s educational environment, many students lack what researchers refer to as self-
regulation. Zimmerman (1989) defines self-regulation as ―the self-directive process by which
learners transform their mental abilities into academic skills. Learning is viewed as an activity
that students do for themselves in a proactive way rather than as a covert event that happens to
them in reaction to teaching‖ (p. 2). Zimmerman describes the self-regulatory process in three
phases: the forethought phase (before the learning effort), the performance phase (during the
learning), and the self-reflection phase (after the learning effort) (p. 4). It is in this self-reflection
phase that students make self-judgments and form opinions about the cause of their performance
(Zimmerman, 1989, p. 5). According to Zimmerman,
Attributing a poor score to limitations in fixed ability can be very damaging
motivationally because it implies that efforts to improve on a future test will not
be effective. In contrast, attributing a poor math score to controllable processes,
such as the use of the wrong solution strategy, will sustain motivation because it
implies that a different strategy may lead to success. (p. 5)
Many researchers are turning to self-assessment as a means of harnessing this self-
reflection phase to improve student learning. Researchers generally agree that self-assessment,
or self-evaluation, can be defined as students judging their own work, based on evidence and
explicit criteria, for the purpose of improving future performance (McMillan and Hearn, 2008, p.
40; Rolheiser and Ross, 2001). Zimmerman states that close self-monitoring, along with other

4
high-quality self-regulatory processes, can enhance motivation of beginners in a new discipline
(p. 3). Further, Zimmerman asserts the goal of a teacher should be to empower students to
become self-aware of their own strengths and limitations in learning (p. 2).
Rolheiser and Ross (2001) provide a detailed layout of the effects of self-assessment on
student achievement:
When students evaluate their performance positively, self-evaluations encourage
students to set higher goals…and commit more personal resources or effort…to
them. The combination of goals…and effort…equals achievement... A student's
achievement results in self-judgment…, such as a student contemplating the
question, "Were my goals met?" The result of the self-judgment is self-
reaction…, or a student responding to the judgment with the question, "How do I
feel about that?" Goals, effort, achievement, self-judgment, and self-reaction all
can combine to impact self-confidence…in a positive way.
Rolheiser and Ross base their confidence in self-evaluation on four arguments. They claim
student learning will improve because ―(i) self-evaluation will focus student attention on the
objectives measured, (ii) the assessment provides teachers with information they would
otherwise lack, (iii) students will pay more attention to the assessment, and (iv) student
motivation will be enhanced.‖ Black and Wiliam (1998) also emphasize the importance of self-
assessment, claiming that it allows students to ―understand the main purposes of their learning
and thereby grasp what they need to do to achieve‖ (p. 143). McMillan and Hearn (2008) agree,
claiming that student self-assessment promotes ―intrinsic motivation, internally controlled effort
…and more meaningful learning‖ (p. 40). Also, McMillan and Hearn assert that self-assessment
promotes a mastery goal orientation in which the focus is on improving knowledge,
understanding, and skill, as opposed to a performance goal orientation in which the greater focus
is on the final score or grade (p. 43). When used with other self-regulatory skills such as goal-
setting and generating strategies for more learning, McMillan and Hearn claim that self-

5
assessment will lead to improved student performance with meaningful motivation (p. 48).
Stiggins (2008) also promotes self- and peer-assessment as a means of better engaging students.
Bring students into the actual scoring process, thus spreading the work over more
shoulders! Form scoring teams, one for each exercise on a test. Have them
develop scoring criteria under your watchful eye. Offer them advice as needed to
generate appropriate criteria. Than have them actually score some essays, which
you double check. Discuss differences in scores assigned. Students find this kind
of workshop format very engaging. (p. 151)
Interestingly, Stiggins, et al. (2007) claim that while all students benefit from self-assessment,
―the largest gains accrue to the lowest achievers‖ (p. 37).
1.3 Studies of Self-Assessment and Rubric Use
Having examined the theoretical arguments, the question of empirical evidence arises.
Several studies of the effectiveness of student self-assessment have been undertaken. One such
study by Olina and Sullivan (2002) investigated the effect of teacher- and self-evaluation on
student learning and self-efficacy of 189 Latvian high school students and their 6 teachers in
science classrooms. Using ratings of student projects, posttest scores, student attitude surveys,
and teacher attitude surveys, Olina and Sullivan compared the learning gains of three groups of
students: a teacher-evaluation condition, a self-plus-teacher evaluation condition, and a no-
evaluation condition. The results were interesting. Students in the teacher- and self-plus-
teacher-evaluation groups outperformed students in the no-evaluation group, as expected.
However, the effect produced on student attitudes provides great evidence for the benefits of
self-assessment. Although students in the no-evaluation group reportedly enjoyed conducting
experiments more than the other students, Olina and Sullivan report that ―students in the self-
plus-teacher evaluation group had greater confidence about their ability to independently conduct

6
experiments in the future than the other two groups‖ (p. 19). This lends credibility to theories of
self-assessment leading to greater student self-efficacy.
Another notable study was conducted by Andrade, Wang, Du, and Akawi (2009) on the
relation between long- and short-term rubric use (including self-assessment) and self-efficacy for
writing by 268 elementary and middle school students. Although average self-efficacy ratings of
all condition groups increased over time, Andrade, et al. reported a greater increase in self-
efficacy of girls in the treatment group (using rubrics to check their work) than in the control
group. The effect of the rubrics on self-efficacy of boys appeared to be statistically insignificant.
To explain these results, the authors relied on research on attribution theory stating:
[G]irls tend to be more concerned with mastering a writing task than do boys,
who, on average, tend to be more concerned with showing someone else that they
are capable. Our findings regarding the differences in increases in self-efficacy
after self-assessment may reflect these different achievement goals: Girls may
derive more satisfaction and confidence from self-generated evidence of progress
on a writing assignment than do boys, who seek confirmation of progress from
others, including perhaps their teachers and peers. (Andrade, et al., 2009, p. 296) Thus, the researchers concluded, self-assessment shielded female students from ―potentially
debilitating effects of negative adult feedback‖ (p. 296). This may have led girls to attribute
shortcomings to effort, not inherent ability, which allowed them to see how they could improve.
This, in turn, led to increased self-efficacy ratings. ―The boys in the study, however, might have
been less influenced by the presence of the rubric because they placed less value on their own
feedback‖ (p. 296).
1.4 How to use Self-Assessment (Techniques and Difficulties)
Several researchers offer advice on how teachers can involve students in the assessment
process. Stiggins (2008) offers an array of ways students can be involved in this. According to
Stiggins, students can:

7
–Take the test and receive the grade.
–Be invited to offer the teacher comments on how to improve the test.
–Suggest possible assessment exercises.
–Actually develop assessment exercises.
–Assist the teacher in devising scoring criteria.
–Create the scoring criteria on their own.
–Apply scoring criteria to the evaluation of their own performance.
–Come to understand how assessment and evaluation affect their own academic
success.
–Come to see how their own self-assessment relates to the teacher’s assessment
and to their own academic success. (p. 23)
Rolheiser and Ross (2001) claim that self-evaluation must be taught to students in four stages.
First, students should be involved in defining the criteria by which their performance will be
judged. Second, students should be taught how to apply those criteria to their own work. Third,
students should be provided with feedback on their own self-evaluations. Finally, teachers
should work with students to develop goals and action plans (Rolheiser & Ross, 2001).
Although by its very definition self-assessment places a great deal of the assessment
work load on the students’ shoulders, experts agree there are responsibilities of the teacher in this
process. McMillan and Hearn (2008) claim that in order to use self-assessment effectively,
teachers must ―pass the evaluative responsibilities to their students by scaffolding and modeling
goal setting, evaluation, strategy adjustment, and reflection‖ (p. 44). Rolheiser and Ross (2001)
agree, stating that ―[s]tudents harbor misconceptions about the self-evaluation process (e.g., the
role that evidence plays).‖ Because of this, Rolheiser and Ross argue that students should be
taught how to accurately evaluate their own work. ―Simply requiring self-evaluation is unlikely
to have an effect on achievement.‖
For all of the cited benefits to student learning afforded by self-assessment, there are new
difficulties introduced into the classroom with it. Many teachers first attempting self-assessment

8
may be tempted to believe the greatest hardship will be one of student academic dishonesty.
However, this is very often not the case. Rolheiser and Ross (2001) argue that:
Many teachers, parents, and students believe that if students have a chance to
mark their own work they will take advantage, giving themselves higher scores
regardless of the quality of their performance. We have found that students,
especially older ones, may do this if left to their own devices. But, when students
are taught systematic self-evaluation procedures, the accuracy of their judgment
improves.
Instead, Black, et al. (2004) states that when teaching students to effectively self-assess, ―the first
and most difficult task is to get students to think of their work in terms of a set of goals‖ (p. 14).
Once students convert to this way of thinking, ―they begin to develop an overview of that work
that allows them to manage and control it for themselves‖ (p. 14). Another difficulty researchers
cite is that ―pupils can assess themselves only when they have a sufficiently clear picture of the
targets that their learning is meant to attain‖ (Black and Wiliam, 1998, p. 143). Thus, if students
do not understand learning objectives, the effectiveness of self-assessment is diminished. A
further complication of self-assessment is that it takes time for students, in particular low-
achieving students, to develop the skill (Black, et al., 2004, p.14). A teacher in one of the
schools Black, et al. (2004) studied had the following to say about self-assessment:
The kids are not skilled in what I am trying to get them to do. I think the process
is more effective long term. If you invest time in it, it will pay off big dividends,
this process of getting the students to be more independent in the way that they
learn and to take the responsibility themselves. (p. 14)
In order to overcome the obstacles and effectively implement self-assessment in their
classrooms, teachers must utilize what Rolheiser and Ross (2001) describe as ―[t]houghtfully
designed self-evaluation procedures that provide students with explicit criteria at an appropriate
level of generality, that provide for student involvement in assessment decision-making, that
elicit student cognitions about their performance, that ground student goal setting in accurate

9
data, and that are integrated with sensitive instruction.‖ Further, the assessments themselves
should be of high quality. According to Stiggins (2008),
Quality classroom assessments display four significant design features: (1) they
rely on assessment methods capable of reflecting the targets in question; (2) they
are built of quality ingredients (test items, scoring schemes, etc); (3) they sample
achievement with enough tasks to lead to a confident conclusion about student
mastery; and (4) they are constructed and used in ways that minimize distortion in
results due to bias (p. 75).
Another important aspect of quality self-assessment classroom practice is usually the presence of
a well-written rubric. According to Andrade, et al., a rubric is ―a document that articulates the
expectations for an assignment by listing the criteria, or what counts, and describing levels of
quality from excellent to poor‖ (p. 287). McMillan and Hearn (2008) claim that ―[p]roviding
evaluation criteria through rubrics, models, or anonymous exemplars helps students concretely
understand outcomes and expectations. They then begin to understand and internalize the steps
necessary to meet the goals‖ (p. 45). However McMillan and Hearn also warn that ―not all
rubrics are equal: to promote learning they should indicate levels of proficiency, not just scores
for grades‖ (p. 45). In addition, McMillan and Hearn claim that in order for self-assessment to
be fully effective, students should be given the opportunity to make adjustments to their work
before it is graded (p. 46). Finally, teachers should be wise to avoid conditions that drive out
intrinsic motivation and instead create classroom climates that promote it. According to
Stiggins, et al. (2007),
Intrinsic motivation to learn is supported when the learner meets the following
criteria:
-Has a sense of control and choice
-Gets frequent and specific feedback on performance
-Encounters tasks that are challenging, but not threatening
-Is able to self-assess accurately
-Encounters learning tasks related to everyday life
10
The following conditions tend to drive out intrinsic motivation:
-Coercion
-Intimidation
-Rewards or punishments linked to evaluative judgments
-Comparing one student to another
-Infrequent or vague feedback
-Limitation of personal control
-Responsibility without authority (p. 39)
Stiggins (2008) cites five possible factors in grades: Achievement, Aptitude, Effort,
Compliance, and Attitude (p. 271). Students need to know which of these influences their grades
and what they can do to improve performance. Also, Stiggins lists five possible reasons why a
student might not have learned the necessary material in the first place: 1. The student was
lacking in prerequisites for the learning objectives. 2. The teacher did not adequately understand
the learning target, and so could not convey it well. 3. Instructional methods and/or materials
were inadequate. 4. The student lacked the confidence and/or motivation to strive for success.
5. Something beyond teacher and student control (such as a death in the family) interfered with
learning (p. 48). When one or more of these situations occur, students (not just teachers) must be
prepared to diagnose the problem and work to fix it. According to Zimmerman (1989),
―Although teachers also need to know a student's strengths and limitations in learning, their goal
should be to empower their students to become self-aware of these differences. If a student fails
to understand some aspect of a lesson in class, he or she must possess the self-awareness and
strategic knowledge to take corrective action‖ (p. 2). Student self-assessment is a vehicle to this
self-awareness.
1.5 Summary
This thesis concerns the use of self-assessment as a type of formative assessment or
assessment for learning. Researchers claim that self assessment enhances motivation of

11
beginners in a new area of study (Zimmerman, 1989, p. 3), focuses student attention on learning
objectives and the assessments used to measure them (Rolheiser and Ross, 2001), and promotes a
mastery goal orientation in which the focus is on improving knowledge, understanding, and skill
(McMillan and Hearn, 2008, p.43). Several studies on self-assessment and rubric use document
positive effects on student self-efficacy (Olina and Sullivan, 2002), (Andrade, et al., 2009).
Challenges to the effective implementation of self-assessment include changing students’ views
of their work to that of a set of goals (Black, et al., 2004, p.14), ensuring students have a clear
understanding of the learning objectives (Black and Wiliam, 1998, p.143), and allowing enough
time for students to adequately develop self-assessment abilities (Black, et al., 2004, p.14). In
order to effectively implement self-assessment in their classrooms, teachers must develop self-
assessment procedures that provide students with explicit criteria for evaluating their work, that
involve students in the decision-making process, that encourage students to think about the
quality of their performance, that manifest realistic goal setting, and that are integrated with the
instruction (Rolheiser and Ross, 2001).

12
CHAPTER 2. RESEARCH QUESTIONS AND SETTING
Research findings on the positive benefits of self-assessment prompted me to investigate
the potential benefits of self-assessment on student learning in my own Algebra I classroom.
Poor student academic performance, as well as the current national focus on standardized testing
led me to the following research question for this study: Does the use of self-assessment
enhance the short-term learning gains of students in mathematics, as measured by standardized
multiple-choice and constructed-response tests?
During the period of this study, I worked in an alternative high school for over-aged
students. This school was established in 2008 to serve students who were at least two years
behind grade level. By providing students the opportunity to take more classes and earn more
credits each school year than they would at a regular high school, this school offered students the
opportunity to graduate earlier than what would have otherwise been possible. Total school
enrollment at the time of this study numbered fewer than 250 students. Over 95% of the students
in the school (and 100% of the students in my classes) were African-American.
Challenges I faced with my students prior to this study included limited student
motivation to achieve academic success and a lack of attention to assignment completion. While
most students did attempt class assignments, I noticed that they were much more concerned with
getting a passing grade than with mastering the content. As stated in the previous chapter, it is
precisely these mindsets and habits that many researchers claim can be overcome by the use of
self-assessment. Thus I sought to teach my students to utilize rubrics to self-assess their own
work. In doing so, I hoped that student attention and motivation would increase, which would, in
turn, lead to higher test scores on district-mandated Edusoft Unit Tests.

13
2.1 The Mathematics: What Was Taught
This research project took place over the course of two units of study in Algebra I. The
first unit, Unit 5 of the Louisiana Comprehensive Curriculum, introduced students to systems of
equations, operations on matrices, and systems of inequalities. The second unit—Unit 6—dealt
with measurement topics. Students were taught how to identify the correct unit of measurement
for a given situation. They were also introduced to the concepts of accuracy, precision, absolute
error, relative error, and significant digits.
2.1.1 Unit 5: Systems of Equations, Matrices, and Systems of Inequalities
Necessary prerequisites to successful completion of this unit were proficiency in
evaluating expressions using the correct order of operations, graphing on a coordinate plane,
solving linear equations and inequalities in one and two variables, identifying and analyzing
slope of a line and the y-intercept of a line, and evaluating expressions and functions written in
function notation using substitution (Comprehensive Curriculum Algebra I, p.216). Students had
been instructed in these topics prior to the start of this unit.
The first day of instruction began with the following real-world situation:
Sam left for work at 7:00 a.m. walking at a rate of 1.5 miles per hour. One hour
later, his brother, James, noticed that he had forgotten his lunch. He leaves home
walking at a rate of 2.5 miles per hour. When will he catch up with Sam to give
him his lunch? (Comprehensive Curriculum Algebra I, p.230)
Students had different ideas on how to solve this problem, but the method devised by most
students (with some coaching from the teacher) was to set up a table and graph of the situation.
This was used to begin a discussion of systems of two linear equations, in which the solution is
the point of intersection of the two lines. On the first day, graphing was emphasized. In
subsequent classes, students were taught to solve problems using substitution and elimination
(linear combination) methods. All lessons were introduced and supplemented with real-world

14
problems. Students were also given step-by-step instruction on how to solve problems using
each solution method.
After students had sufficient time to practice solving systems of two linear equations,
they were then introduced to matrices. The ultimate goal in the use of matrices in this unit was
to use technology (specifically, graphing calculators) to solve systems of equations by using
multiplication of inverse matrices. Unfortunately, due to time constraints, none of the classes
were able to complete this lesson. However, students were still taught how to model data in a
matrix as well as how to perform addition, subtraction, scalar multiplication (multiplying a
matrix by a number), and matrix multiplication (multiplying a matrix by a matrix). Again, all
topics were introduced with real-world examples.
Finally students were taught to graph systems of linear inequalities. Students were
instructed in shading the region of the graph that satisfies all constraints—the solution to the
system of inequalities.
Overall, students seemed to like the real-world scenarios used to introduce each topic.
These scenarios made the mathematics seem relevant to them. The most common complaint
students had was the amount of work needed to find the solutions to the systems of equations
problems. Many students commented that the easiest parts of the unit were the lessons on
matrices.
2.1.1 Unit 6: Measurement
Prerequisites needed to understand topics in this unit included proficiency in the use of
rulers, clocks, scales, and other measurement instruments; conversion factors; rational number
computation; formulas for perimeter, area, volume, and circumference of geometric shapes; and
rounding to a given place value (Comprehensive Curriculum Algebra I, p.265). Unlike in Unit 5,

15
prerequisites for this unit had not been taught previously in this course due to the different nature
of the topics. However, students had been taught these topics in years prior to enrollment in
Algebra I. Prerequisites for this unit were therefore reviewed quickly in class.
During this unit, students were first taught how to choose the correct unit of measurement
for a given situation. This was done initially by having the students measure different objects in
the classroom using different types of rulers and meter sticks. Other types of measurements were
then discussed. This led students to the understanding that the size of the unit must be
comparable to the size of the object being measured.
Much of the remaining portion of the unit dealt with terminology. Students worked with
their teacher to define accuracy, precision, absolute error, relative error, and significant digits.
Actual measurements and kinesthetic activities were then used to enhance understanding. For
example, during the lesson on accuracy, students recorded the time shown on their watches when
directed, while the teacher recorded the official U.S. time shown on the website www.time.gov.
Recorded times were then compared to determine which watch was the most accurate.
Computation problems were also utilized in most lessons.
Although paper and pencil assignments were used in both units, due to the nature of the
topics being taught, instruction in the second unit utilized more hands-on activities than in the
prior unit. Nearly every lesson in Unit 6 incorporated some type of kinesthetic measurement
activity for the students. Thus, some students seemed to be more engaged in the activities
utilized in this unit than in Unit 5. Also, many students who had formerly been struggling with
algebraic concepts in prior units felt as though they had a fresh start in the measurement unit.

16
CHAPTER 3. METHODS AND MATERIALS
3.1 Subjects
Five classes of eighty-one over-aged alternative high school students participated in the
study. All of the students were enrolled in Algebra I and were taught by the same teacher. Some
students had taken and failed Algebra I previously, while others were enrolled in the course for
the first time. Many of the students in this study had a high-absentee rate. Discipline problems
were frequent, and several students were placed in In-School-Suspension during portions of the
study. Class size ranged from five students to 21 students.
3.2 Materials
The pre- and post-tests administered during the study were district-mandated Edusoft
Unit Tests for Units 5 and 6 of Algebra I. Edusoft is a standards-based testing system designed
and operated by the Riverside Publishing Company (Riverside Publishing). Each test was
written by teachers and content trainers in the district. The Unit 5 test consisted of 10 multiple-
choice items and one 4-point constructed-response item, for a total of 14 possible points. The
test assessed students’ ability to solve and graph systems of equations, graph systems of
inequalities, and perform operations on matrices. The Unit 6 test consisted of 14 multiple-choice
questions and one 4-point constructed-response item. However, due to a mistake in the wording
of one of the multiple-choice items, this multiple-choice item was declared invalid and given a 0-
point value. Thus, students could score a maximum of 17 points on this test. The Unit 6 Test
assessed students’ knowledge of accuracy and precision, absolute and relative error, and
significant digits, as well as their ability to choose the most appropriate unit of measurement for
a given situation. For the constructed-response items on both tests, the test-specific district
rubrics were used to score student responses. These tests were chosen as the measurement

17
instruments for this study primarily for reasons of convenience: Edusoft testing was required by
the district, and no suitably better measurement instrument was available.
We now discuss the intervention, which consisted of assigned self-assessment tasks for
students. For each unit of study, 4-point rubrics were developed for each formative assessment
(classwork and homework assignments). These rubrics were designed to imitate rubrics used to
score students’ constructed-responses on district-mandated Edusoft Unit Tests. Each rubric
contained a point total for each problem or activity. Rubrics for assignments where more than 4
points were attainable also contained a scale for converting student scores into a 4-point score.
Rubrics for more detailed assignments also contained an answer key. For shorter assignments,
the teacher usually wrote the solution on the board for students. A self-scoring sheet was created
for each unit of study. These self-scoring sheets listed every classwork and homework
assignment, along with a blank area for students to record their scores for each assignment
completed. A generic math rubric detailing a description of each score was also used. This was
retrieved from the website http://math.about.com/library/blrubric1.htm.
3.3 Procedures
The Algebra I classes in this study were organized into a block schedule with classes
meeting every other day. For the first unit of study, three A-day classes were taught to self-
assess their work, while two B-day classes were maintained as the control group. This was
reversed in the second unit of study, in which B-day classes utilized self-assessment, and A-day
classes performed as the control group. This design allowed all classes to complete one unit
using self-assessment and one unit with no self-assessment, thus exposing all students to the
treatment and allowing the researcher to compare each student’s learning gains under both
treatments. This presented a risk of carry-over effect, as students in the A-day classes could have

18
used self-assessment skills acquired from the first unit of study to assist them in the second unit,
in which they were considered the control group. I argue however that this did not happen to a
significant degree, as shall be discussed later. A diagram summarizing the experimental design
is shown below.
Table 1 Experimental Design
Unit 5: Systems of Equations,
Systems of Inequalities, and
Matrices Unit 6: Measurement
A-Day
Classes
Self-Assessment (Experimental
Group)
No Self-Assessment (Control
Group)
B-Day
Classes No Self-Assessment (Control Group)
Self-Assessment (Experimental
Group)
Students in the control group continued with the same classroom procedures they had
been following all year. In the control group, formative assignments—both classwork and
homework—were checked for completion by the teacher. If students had any questions about
the material after the assignments were checked, the teacher would answer their questions, but
students were not asked to score their work or correct their mistakes. Only unit tests and quizzes
were checked for correctness. These were graded by the teacher.
Students in the self-assessment group completed the same classwork and homework
assignments as students in the control group. However, students in the self-assessment group
were given a self-scoring sheet at the beginning of the unit listing the activities and assignments
they would be doing. On the due date of each assignment, the teacher would work out the
problems and project the rubric for that assignment on the board. Students were asked to score
their work based on the 4-point rubric. They were then instructed to record each of their scores
on their self-scoring sheet. The teacher repeatedly emphasized the need for students to study and
practice the skills where they earned low scores (0 – 2). In addition, a generic rubric explaining

19
the meaning of each number score was repeatedly shown to students. The teacher also explained
to the students that assignments were still checked for completion and that student scores
recorded on the self-scoring sheets did not influence the students’ grades; these were only to be
used as a guide for studying and self-monitoring.
An important note should be made about the use of rubrics in the study. Often, most (and
sometimes all) of the students in a class would not complete a given assignment. Thus the use of
rubrics to self-assess student work was occasionally delayed until at least a few of the students
finished the assignment. In most cases, this meant that not every assignment on the self-scoring
sheet was completed in every class.
At the beginning of each unit, students in both groups were given the district-mandated
Edusoft test for that unit as a pretest. The teacher explained to students that the purpose of the
pretest was to determine what they did not yet know, and that their grade would not be
negatively impacted by a low score on the pretest. At the end of the unit, students were given the
same test as a post-test. Students were given a grade for this based on how many problems they
answered correctly. In all cases, and the multiple-choice items were scored electronically using
the Edusoft digital scanner, and the constructed-response items were scored by the teacher using
the district-created rubric for that test. Thus, it should be noted that scoring of the constructed-
response items was not blind.
In the first unit of study, Unit 5, students were taught how to solve systems of linear
equations by graphing, using substitution, and using elimination, as well as how to graph and
solve systems of linear inequalities. The unit also included a section on addition, subtraction,
and multiplication of matrices. Unit 6 dealt with measurement topics including accuracy,
precision, absolute error, relative error, computations with significant digits, and choosing the

20
most appropriate unit of measurement. In short, the two units dealt with completely different
topics. Thus it was assumed that students’ success or failure to meet the objectives of one unit
would not drastically influence the outcome of the other unit.
All activities in both units were taken from the Louisiana Comprehensive Curriculum.
There were no significant differences between the treatment groups as to the time spent on each
unit. For all classes, Unit 5 comprised five weeks of study, while Unit 4 was completed in four
weeks.
3.4 Data Analysis
Students’ learning gains for each unit were calculated by subtracting students’ pretest
scores from students’ posttest scores. Students’ performance data was first graphed and analyzed
visually. Further analysis of data from students who completed all four assessments was carried
out using a paired t-test to compare each student’s learning gains while utilizing self-assessment
to his or her learning gains while not utilizing self-assessment. In addition, a two-sample t-test
for comparing two population means was employed. This allowed the experimenter to utilize
data from students who completed assessments for at least one unit, thus increasing the sample
size. Data was also analyzed using a permutation test. However, the results of the permutation
test were the same as the t-test. Thus, because the t-test is more familiar to most readers, only
these results were reported.

21
CHAPTER 4. RESULTS
The mean learning gains, standard deviations, and sample sizes for each treatment group
for each of the two units of study are shown in the table below. In all cases the mean self-
assessment learning gains were lower than the mean non-self-assessment learning gains.
Table 2 Learning Gains by Treatment Groups
Graphical displays of pretest and posttest data for each unit of study are shown below. It
should be noted that on all graphs, larger circles indicate two identical data points. Aside from a
few outliers, in both cases there seem to be no major noticeable visual differences between the
self-assessment group and the control group.
Figure 1 Unit 5 Pretest and Posttest
0 10 20 30 40 50 60 70 800
10
20
30
40
50
60
70
80
Pretest (Percentage Correct)
Pos
ttes
t (P
erce
ntag
e C
orre
ct)
Control Group
Self-Assessment Group
Unit 5 Learning Gains Unit 6 Learning Gains
Self-Assessment
M = 8.79%
SD = 14.91%
n = 13
M = 6.42%
SD = 11.75%
n = 22
Non-Self-
Assessment
M = 10.51%
SD = 17.15%
n = 17
M = 7.84%
SD = 14.92%
n = 21
Post
test
(P
erce
nta
ge
Corr
ect)
Pretest (Percentage Correct)
Control Group
o Self-Assessment Group

22
Figure 2 Unit 6 Pretest and Posttest
A major obstacle to the completion of this study was a very high absentee rate among the
students. Of the 81 students enrolled in the studied classes, only 30 completed the pretest and
posttest for Unit 5 (13 in the self-assessment group and 17 in the control group), and 43
completed both assessments for Unit 6 (22 in the self-assessment group and 21 in the control
group). Of these, only 18 completed pretests and posttests for both units. A graphical display of
the learning gains of each of these 18 students under both conditions is shown below.
Figure 3 Students with Complete Data
0 10 20 30 40 50 600
10
20
30
40
50
60
Pretest (Percentage Correct)
Post
test
(P
erc
enta
ge C
orr
ect)
Control Group
Self-Assessment Group
-10 0 10 20 30 40-10
0
10
20
30
40
50
Self-Assessment Learning Gains (Percentage)
Non-S
elf-A
ssessm
ent
Learn
ing G
ain
s (
Perc
enta
ge)
Self-Assessment Learning
Gains (Percentage)
Non-S
elf-
Ass
essm
ent
Lea
rnin
g
Gai
ns
(Per
centa
ge)
Pretest (Percentage Correct)
Post
test
(P
erce
nta
ge
Corr
ect)
Control Group
o Self-Assessment Group
Self-Assessment in Unit 5
o Self-Assessment in Unit 6
23
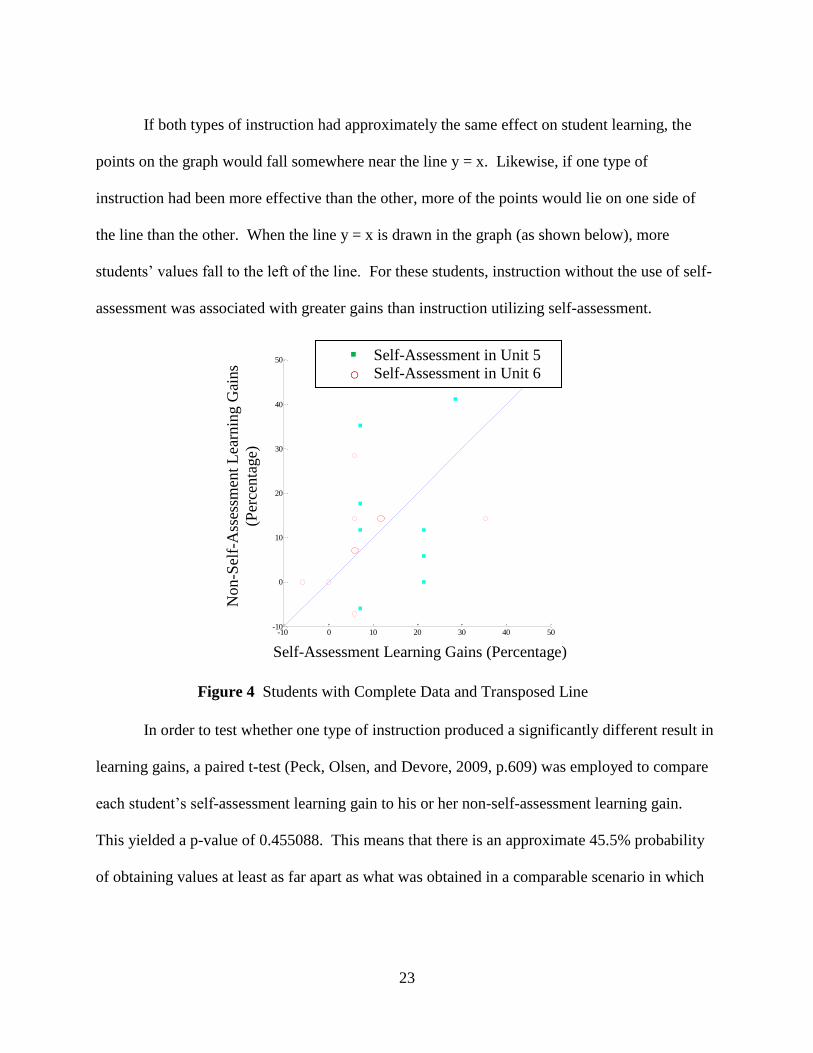
If both types of instruction had approximately the same effect on student learning, the
points on the graph would fall somewhere near the line y = x. Likewise, if one type of
instruction had been more effective than the other, more of the points would lie on one side of
the line than the other. When the line y = x is drawn in the graph (as shown below), more
students’ values fall to the left of the line. For these students, instruction without the use of self-
assessment was associated with greater gains than instruction utilizing self-assessment.
Figure 4 Students with Complete Data and Transposed Line
In order to test whether one type of instruction produced a significantly different result in
learning gains, a paired t-test (Peck, Olsen, and Devore, 2009, p.609) was employed to compare
each student’s self-assessment learning gain to his or her non-self-assessment learning gain.
This yielded a p-value of 0.455088. This means that there is an approximate 45.5% probability
of obtaining values at least as far apart as what was obtained in a comparable scenario in which
-10 0 10 20 30 40 50-10
0
10
20
30
40
50
Self-Assessment Learning Gains (Percentage)
Non-S
elf-A
ssessm
ent
Learn
ing G
ain
s (
Perc
enta
ge)
Self-Assessment in Unit 5
Self-Assessment in Unit 6
Non-S
elf-
Ass
essm
ent
Lea
rnin
g G
ain
s
(Per
centa
ge)
Self-Assessment Learning Gains (Percentage)
Self-Assessment in Unit 5
o Self-Assessment in Unit 6

24
there really is no difference between the two treatments. Due to this large p-value, there is no
evidence from this sample of 18 students that either method of instruction was more effective.
However, the small sample size used for the paired t-test leads one to suspect that the
results of this test may not be totally conclusive. Thus, in order to obtain a measurement from a
larger sample of students, the experimenter utilized data from all students who completed
pretests and posttests for at least one unit of study. In total, the experimenter collected data from
35 students who used self-assessment (13 in the first unit of study and 22 in the second) and 38
students who did not (17 in the first unit; 21 in the second). A two-sample t-test for comparing
population means (Peck, et al., 2009, p.587) was employed to determine if the mean learning
gain for one treatment was significantly higher than the mean learning gain for the other. This
yielded a p-value of 0.303458. Again, this means that there is an approximate 30.35%
probability of obtaining values at least as far apart as what was obtained in a comparable
scenario in which there really is no difference between the two treatments. Thus, because a high
p-value was also obtained for this test, there is no evidence that either method of instruction was
more effective than the other.

25
CHAPTER 5. CONCLUSION
This study examined the effects of the use of self-assessment on student learning of
mathematics as measured by improvement on multiple-choice and constructed response tests.
Despite the positive benefits cited in the research, this study yielded no conclusive evidence to
suggest that the use of self-assessment and rubrics enhances student learning of Algebra I topics.
Several possible reasons for these results are cited. First of all, prior to this study (and during
this study in other classes), students had been taught regularly using non-self-assessment-focused
instruction. Thus, the use of self-assessment—as well as the expectations that accompanied it—
was a change with which students may not have been totally comfortable. It may be that the
short time period allowed for this study (5 weeks for the first unit and 4 weeks for the second)
may not have been enough to elicit the full effect of self-assessment on student learning. This
would be in agreement with much of the literature presented earlier (Black, et al., 2004, p.14).
Another potentially limiting factor of the effects of self-assessment in this study could
have been poor student attendance. Many students in both treatment groups were absent from
school or were assigned to In-School-Suspension during portions of instruction. This could have
limited the effects of either type of instruction on many students’ learning. This would also
account for many of the zero or negative learning gains displayed by some of the students.
A third limitation facing the experimenter in this study was student rate of assignment
completion. Often use of rubrics to self-assess was delayed or, in a few instances, some rubrics
were not used at all because few (or sometimes none) of the students in a class completed a
homework assignment by the due date, or they did not finish a classwork assignment in time to
score it with a rubric on the day of completion.

26
In addition to the dilemmas described above, another possibility remains. It is possible
that self-assessment may in fact have had a positive impact on students’ learning. However,
instruction in how to use self-assessment and the act of rubric grading took time out of the class
period. Thus the non-self-assessment classes had time to work more problems and examples in
class which may have balanced out the lack of self-assessment. If this were true, the question of
the possibility of carry-over of self-assessment skills from one unit to the next still remains. As
stated earlier, it is the opinion of the experimenter that students did not seem to carry effects of
one unit of study over into the other (there do not seem to be any statistically significantly
different effects to carry over). However, one possible scenario still remains untested: Self-
assessment takes time away from instruction while it is being taught, thus potentially negating
any positive effects during that unit, but its positive effects—if they exist—may carry over to
(and be measurable in) future units. This could be tested in a future similar study in which at
least one class uses no self-assessment at all. Other classes could utilize self-assessment on one
unit of study, and then none on the next. The learning gains of the two groups on the second unit
in which no one was instructed in self-assessment could then be compared. Other possible future
studies could examine the effects of self-assessment over a longer period of time with larger and
more diverse samples.
A more general conclusion can also be drawn. Teachers are often told by administrators,
politicians, researchers, and ―experts‖ in education that if they will only change their teaching
methods and incorporate certain instructional techniques then students will learn more and test
scores will automatically increase, regardless of their circumstances. It is the finding not only of
this thesis but of many documented studies that this is not always true (Barrett, 2009, p16; Ford,
2009, p.19; Richard, 2010, p.36). In all of these studies, the researchers provided theoretical and

27
anecdotal evidence for treatment benefits. However, in all of these cases, no statistically
significant improvement in test scores was found. This is not to suggest that there are not certain
―best practices‖ in teaching, or that it does not matter how a teacher delivers instruction.
However, to expect immediate positive results on standardized tests as a result of a change in
instructional techniques—and to hold teachers accountable for such result—may not be realistic.
This may be due in part to a failure of standardized testing to detect certain learning gains in
students such as motivation, interest in further study, and the desire to apply curriculum content
to situations outside of the classroom. It is also conceivable that for some students, areas outside
of an individual teacher’s control far outweigh anything the teacher can do in the classroom in
terms of gains accrued on a classroom assessment. Most likely, however, is that it may take a
great deal of time for positive learning gains to register on test scores as a result of changes in the
makeup of a classroom setting.
28
REFERENCES
Andrade, H. L., Wang, X., Du, Y., and Akawi, R. L. (2009). Rubric-referenced self-assessment
and self-efficacy for writing. The Journal of Educational Research, 102 (4): 287-301.
Barrett, A. (2009). Integrated Technology: Does it Affect Learner Outcomes?. Masters Thesis.
Louisiana State University, Baton Rouge.
Black, P., Harrison, C., Lee, C., Marshall, B., & Wiliam, D. (2004). Working Inside the Black
Box: Assessment for Learning in the Classroom. Phi Delta Kappan, 86 (1): 9-21.
Black, P., & Wiliam, D. (1998). Inside the black box: Raising standards through classroom
assessment. Phi Delta Kappan, 80 (2): 139-148.
Ford, D. (2009). The Use of the Online Tutorial and Assessment System, MathXL, in Teaching
of Algebra I. Masters Thesis. Louisiana State University, Baton Rouge.
Louisiana State Department of Education. Comprehensive Curriculum Algebra I Revised (2008).
McMillan, J. H., and Hearn, J. (Fall 2008). Student self-assessment: The key to stronger
student motivation and higher achievement. Educational HORIZONS, 87: 40-49.
Olina, Z. & Sullivan, H.J. (2002). Effects of teacher and self-assessment on student
performance. Paper presented at the Annual Convention of the American Educational
Research Association, April 1-5, 2002, New Orleans, LA.
Peck, R., Olsen C., & Devore, J. (2009). Introduction to statistics & data analysis. Belmont,
California: Brooks/Cole, Cengage Learning.
Richard, V. (2010). Project Explorations and Student Learning in Geometry. Masters Thesis.
Louisiana State University, Baton Rouge.
Riverside Publishing: Houghton Mifflin Harcourt. Edusoft Assessment Management System.
Retrieved June 28, 2010, from
<http://www.riversidepublishing.com/products/edusoft/index.html>.
Rolheiser, C., & Ross, J. A. (2001). ―Student Self-Evaluation: What Research Says and
What Practice Shows.‖ Retrieved December 28, 2009, from
<http://www.cdl.org/resource-library/articles/self_eval.php>.
Russell, D. Generic Math Rubric. Retrieved December 28, 2009, from
<http://math.about.com/library/blrubric1.htm>.
Stiggins, R., Arter, J., Chappuis, J., & Chappuis, S. (2007). Classroom assessment for student
learning. Upper Saddle River, New Jersey: Pearson Education, Inc.

29
Stiggins, R. (2008). An introduction to student-involved assessment FOR learning. Upper Saddle
River, New Jersey: Pearson Education, Inc.
Zimmerman, B. J. (1989). Becoming a self-regulated learner: An overview. In Theory into
Practice. Retrieved December 23, 2009, from
<http://www.sfu.ca/~sbratt/SRL/Becoming%20a%20selfregulated%20learner%20an%20
overview.pdf>.

30
APPENDIX A: RUBRICS AND SELF-SCORING SHEETS
Self-Scoring Sheet Name: __________________
Unit 5: Systems of Equations, Matrices, and Systems of Inequalities:
Assignment How I did (0-4):
Classwork #1: Graphing System of Equations
Worksheet Problems
Homework #1: Graphing System of Equations
(Workbook p.137 #1-3)
Classwork #2: Battle of the Sexes Questions
Homework #2: Solving word problems with Systems
of Equations (Workbook p.138 #5-6)
Classwork #3: Substitution Problems
Homework #3: Solving Systems of Equations with
Substitution (Workbook p.139 #1-3)
Classwork #4: Elimination Problems
Homework #4: Solving Systems of Equations with
Elimination (Workbook p.143 #1-3)
Operations on Matrices
Graphing Systems of Linear Inequalities
(Workbook p.152 #1-3)
Average

31
Rubric: Classwork #1: Graphing System of Equations Worksheet Problems
2) Solve each of the following systems of equations by graphing.
A. y = -x + 3 B. 2x + 2y = 2
y = x + 1 Answer: (1, 2) -3x + 3y = -9 Answer: (2, -1)
A. (2 possible points)
1 point if one line is graphed correctly
2 points if both lines are graphed correctly and point of intersection is correctly labeled.
B. (2 possible points)
1 point if one line is graphed correctly
2 points if both lines are graphed correctly and point of intersection is correctly labeled.

32
Rubric: Homework #1: Graphing System of Equations (Workbook p.137 #1-3)
1. (2 possible points)
1 point if one line is graphed correctly
2 points if both lines are graphed correctly and point of intersection is correctly labeled.
2. (2 possible points)
1 point if one line is graphed correctly
2 points if both lines are graphed correctly and point of intersection is correctly labeled.
3. (2 possible points)
1 point if one line is graphed correctly
2 points if both lines are graphed correctly and point of intersection is correctly labeled.
Scale:
4 6 points
3 4-5 points
2 2-3 points
1 1 point
0 0 points

33
Rubric: Classwork #2: Battle of the Sexes Questions
Guiding Questions
1. Describe what the point of intersection on the graph tells you.
It is the year that men and women swim the 100-meter freestyle in the same amount of time.
2. According to the graph, is there ever a year that women and men swim the 100- meter
freestyle in the same time? If so, what year and what time will they swim?
They will swim the race in 39.1 seconds in the year 2049.
3. Write the equation in slope intercept form that describes the time it takes men to swim the 100-
meter freestyle in a given year. _y = -0.167x + 64.06___________
4. Write the equation in slope intercept form that describe the time it takes women to swim the 100-
meter freestyle in a given year. _y = -0.255x+77.23____________
5. How much faster are the women and the men each year?
The men are 0.167 seconds faster each year, and the women are 0.255 seconds faster each year.
1. 1 point for the correct answer
2. (2 points)
1 point for the correct number of seconds and 1 point for the correct year
3. 1 point for the correct answer
4. 1 point for the correct answer
5. 1 point for the correct answer

34
Scale:
4 6 points
3 4-5 points
2 2-3 points
1 1 point
0 0 points

35
Rubric: Homework #2: Solving word problems with Systems of Equations
(Workbook p.138 #5-6) 5. (2 possible points)
1 point if one line is graphed correctly
2 points if both lines are graphed correctly and point of intersection is correctly labeled.
6. (2 possible points)
1 point if one line is graphed correctly
2 points if both lines are graphed correctly and point of intersection is correctly labeled.

36
Rubric: Classwork #3: Substitution Problems
1. y = x – 4 2. 2c – d = -2
4x + y = 26 4c + d = 20
1. (2 possible points)
1 point if substitution is used correctly and the correct value of one variable is found.
2 points if the correct values of both variables are found.
2. (2 possible points)
1 point if substitution is used correctly and the correct value of one variable is found.
2 points if the correct values of both variables are found.
37
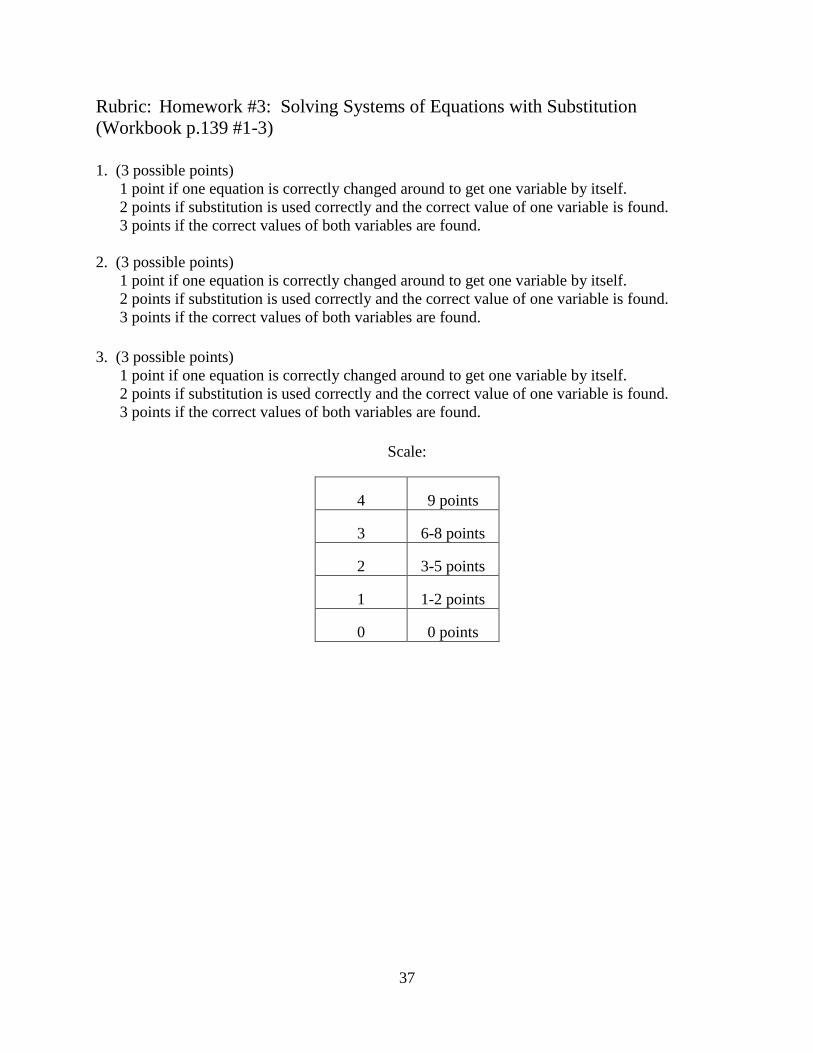
Rubric: Homework #3: Solving Systems of Equations with Substitution
(Workbook p.139 #1-3)
1. (3 possible points)
1 point if one equation is correctly changed around to get one variable by itself.
2 points if substitution is used correctly and the correct value of one variable is found.
3 points if the correct values of both variables are found.
2. (3 possible points)
1 point if one equation is correctly changed around to get one variable by itself.
2 points if substitution is used correctly and the correct value of one variable is found.
3 points if the correct values of both variables are found.
3. (3 possible points)
1 point if one equation is correctly changed around to get one variable by itself.
2 points if substitution is used correctly and the correct value of one variable is found.
3 points if the correct values of both variables are found.
Scale:
4 9 points
3 6-8 points
2 3-5 points
1 1-2 points
0 0 points

38
Rubric: Classwork #4: Elimination Problems
1. 2x + y = 4 2. x – y = 0
x – y = 2 -3x – y = 2
1. (2 possible points)
1 point if elimination is used correctly and the correct value of one variable is found.
2 points if the correct values of both variables are found.
2. (2 possible points)
1 point if elimination is used correctly and the correct value of one variable is found.
2 points if the correct values of both variables are found.

39
Rubric: Homework #4: Solving Systems of Equations with Elimination
(Workbook p.143 #1-3)
1. (2 possible points)
1 point if elimination is used correctly and the correct value of one variable is found.
2 points if the correct values of both variables are found.
2. (2 possible points)
1 point if elimination is used correctly and the correct value of one variable is found.
2 points if the correct values of both variables are found.
3. (2 possible points)
1 point if elimination is used correctly and the correct value of one variable is found.
2 points if the correct values of both variables are found.
Scale:
4 6 points
3 4-5 points
2 2-3 points
1 1 point
0 0 points

40
Rubric: Operations on Matrices
A) Add
2- 0
4 7
5 4-
3 1=
B) Subtract
34 12- 8
72 6 9-
11- 4 3
12 9 7
6- 0 4
4 5- 2
=
C)
23 23
87 9
2
No Solution
D) Multiply
1.2 4 8
5 1 0 -4
5
=
A) (2 possible points)
2 points if answer is completely correct Scale:
1 point for 1 or 2 computational errors
B) (2 possible points)
2 points if answer is completely correct
1 point for 1 or 2 computational errors
C) (1 possible point)
1 point for the correct answer
D) (2 possible points)
2 points if answer is completely correct
1 point for 1 or 2 computational errors
4 7 points
3 5-6 points
2 3-4 points
1 1-2 points
0 0 points

41
Rubric: Graphing Systems of Linear Inequalities (Workbook p.152 #1-3) 1) (4 possible points)
1 point for each line correctly graphed Scale:
1 point for correct shading
2) (3 possible points)
1 point for each line correctly graphed
1 point for correct shading
3) (5 possible points)
1 point for each line correctly graphed
1 point for correct shading
4 12 points
3 9-11 points
2 5-8 points
1 1-4 points
0 0 points

42
Measurement Self-Scoring Sheet
Name:________________________
Activity: How I did (0 – 4)
Which Unit of Measurement?
Accuracy Exercises
Precision Worksheet
Accuracy vs. Precision
Absolute and Relative Error
Significant Digits
Calculations with Significant Digits
Overall (Average Score):

43
Rubric: Which Unit of Measurement?
1 point for each correct answer
Identify the most appropriate unit of measurement to use in order to measure the following:
1. How much water a pan holds Cups, Pints, Liters
2. Weight of a crate of apples Pounds, Kilograms
3. Distance from New Orleans to Baton Rouge Miles, Kilometers
4. How long it takes to run a mile Minutes
5. Length of a room Feet, Yards, Meters
6. Weight of a Boeing 727 Tons, Kilograms
7. Weight of a t-bone steak Ounces, Grams
8. Thickness of a pencil Millimeters, Inches (Fractions)
9. Weight of a slice of bread Ounces, Grams
Scale:
4 9 points
3 6-8 points
2 3-5 points
1 1-2 points
0 0 points

44
Rubric: Accuracy Exercises: Determine if it is possible to get an accurate measure from the information given.
1 point each
1. Jordan measures a piece of wood to be 4 ½ feet long. Is his measurement accurate?
Not enough information
2. Jerry bought a 5-pound bag of sugar. When he got home he measured the bag on a scale that
he had calibrated with a 5-pound weight. The bag actually weighed 4.75 pounds. Which
measurement is more accurate?
4.75 pounds was more accurate because the scale was calibrated with a 5-pound weight.
3. Alex checked the time on his watch at exactly 3:52:04. The time on the world universal
website was exactly the same. Is his watch accurate?
Yes, his watch is accurate
4. Trevor measured the temperature outside to be 82.67 degrees. Joey also measured the
temperature at the same time and got 83.04. Whose measurement is more accurate?
Not enough information
5. When is it possible to know if a measurement is accurate?
We can know a measurement is accurate only if we know the true value of the item being
measured.
Scale:
4 5 points
3 3-4 points
2 2 points
1 1 point
0 0 points

45
Rubric: Precision: 1 point each
1. Ruler 1: 4 inches
2. Ruler 2: 4 ½ inches
3. Ruler 3: 4 ¼ inches
4. Ruler 4: 4 3/8 inches
5. Ruler 5: 4 5/16 inches
2 points: (one point for correct answer and one point for correct explanation):
Ruler 5 is the most precise. It has the most subdivisions (tick marks).
Scale:
4 7 points
3 5-6 points
2 3-4 points
1 1-2 point
0 0 points
46
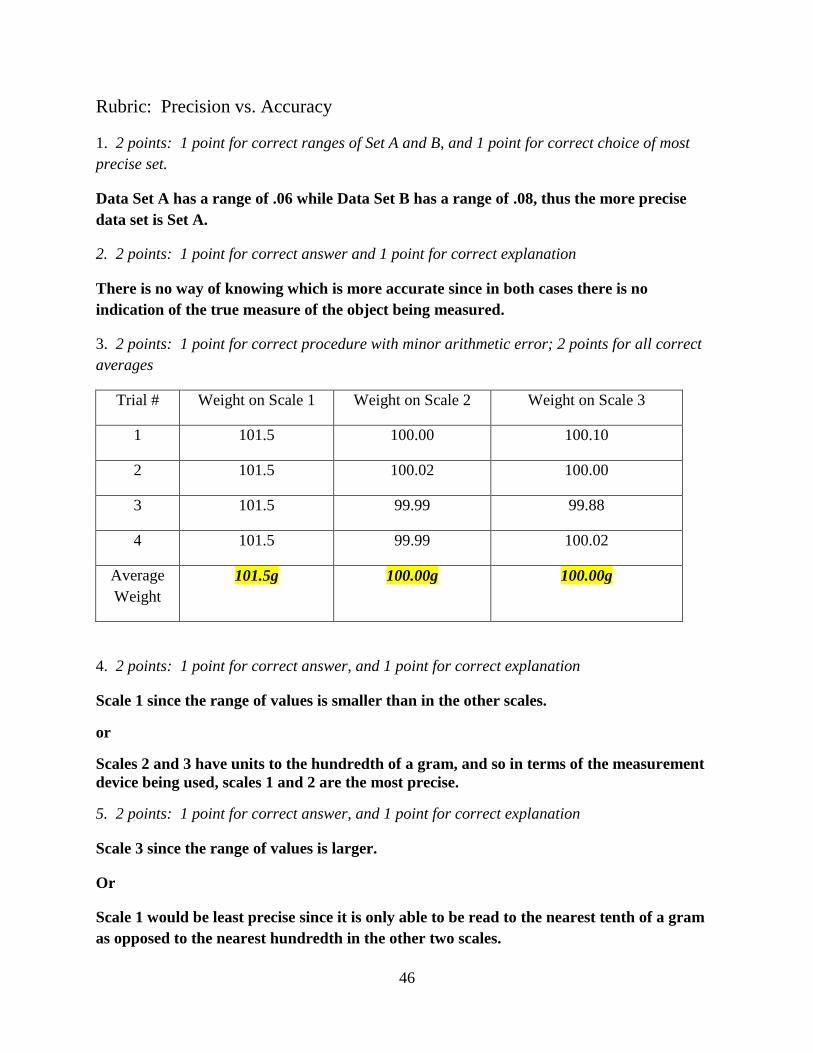
Rubric: Precision vs. Accuracy
1. 2 points: 1 point for correct ranges of Set A and B, and 1 point for correct choice of most
precise set.
Data Set A has a range of .06 while Data Set B has a range of .08, thus the more precise
data set is Set A.
2. 2 points: 1 point for correct answer and 1 point for correct explanation
There is no way of knowing which is more accurate since in both cases there is no
indication of the true measure of the object being measured.
3. 2 points: 1 point for correct procedure with minor arithmetic error; 2 points for all correct
averages
Trial # Weight on Scale 1 Weight on Scale 2 Weight on Scale 3
1 101.5 100.00 100.10
2 101.5 100.02 100.00
3 101.5 99.99 99.88
4 101.5 99.99 100.02
Average
Weight
101.5g 100.00g 100.00g
4. 2 points: 1 point for correct answer, and 1 point for correct explanation
Scale 1 since the range of values is smaller than in the other scales.
or
Scales 2 and 3 have units to the hundredth of a gram, and so in terms of the measurement
device being used, scales 1 and 2 are the most precise.
5. 2 points: 1 point for correct answer, and 1 point for correct explanation
Scale 3 since the range of values is larger.
Or
Scale 1 would be least precise since it is only able to be read to the nearest tenth of a gram
as opposed to the nearest hundredth in the other two scales.

47
6. 2 points: 1 point for correct answer, and 1 point for correct explanation
If we look at the average weights to be the weight given by each scale, then both Scale 2 and
Scale 3 are equally accurate.
7. 2 points: 1 point for correct procedure with minor arithmetic error; 2 points for all correct
averages
Trial # Group 1 (g) Group 2 (g) Group 3 (g) Group 4 (g)
1 1.01 3.863287 10.13252 2.05
2 1.03 3.754158 10.13258 0.23
3 0.99 3.186357 10.13255 0.75
Average Weight 1.01 3.601267 10.13255 1.01
8. 1 point for correct answer
Group 1 data represents both an accurate and precise measurement.
9. 2 points: 1 point for correct answer, and 1 point for correct explanation
Group 3 had the least accurate answer for the weight of the paper clip since its average
value is farthest from the actual value of the paper clip.
10. 2 points: 1 point for correct answer, and 1 point for correct explanation
Group 4 had an accurate weight (if the average is used) but was not precise at all because
the numbers are not close together.
Scale:
4 19 points
3
13-18
points
2 7-12 points
1 1-6 point
0 0 points

48
Rubric: Absolute and Relative Error
1. (1 point for each correct answer)
a. │500 cm – 507 cm│= 7 cm
b. │150 calories – 154.37 calories│= 4.37 calories
c. │2.4 MV – 2.1 MV│= 0.3 MV
or
│2.4 MV – 2.7 MV│= 0.3 MV
d. Shortest: 72 inches – 2.25 inches = 69.75 inches
Longest: 72 inches + 2.25 inches = 74.25 inches
e. 5/8 in – 1/32 in = 19/32 in
5/8 in + 1/32 in = 21/32 in
2. (1 point for each correct answer)
a. 7 cm / 507 cm x 100 = 1.38%
b. 4.37 calories / 154.37 calories x 100 = 2.83%
c. 0.3 MV / 2.1 MV x 100 = 14.29%
And
0.3 MV / 2.7 MV x 100 = 11.11%
d. 2.25 in / 69.75 in x 100 = 3.23%
And
2.25 in / 74.25 in x 100 = 3.03%
e. (1/32) / (19/32) x 100 = 5 5/19% or 5.26%
And
(1/32) / (21/32) x 100 = 4 16/21% or 4.76%
3. (1 point for the correct answer and 1 point for a correct explanation)
Measure A was the best because it had the smallest relative error.
Scale:
4 17 points
3
11-16
points
2 6-10 points
1 1-5 points
0 0 points

49
Rubric: Significant Digits
2 points each—1 point for correct number of significant digits and 1 point for correct explanation
1. 302 Number of Significant Digits: 3
Why?
The 3 and 2 are digits from 1-9, and the 0 is between significant digits
2. 500 Number of Significant Digits: 1
Why?
The 5 is significant because it is a digit from 1-9. The zeros are not significant
because they are just placeholders.
3. 31.02 Number of Significant Digits: 4
Why?
The 3, 1, and 2 are digits from 1-9, and the zero is between significant digits
Or
The 3, 1, and 2 are digits from 1-9, and the zero is to the right of both the decimal and a
significant digit
4. 31.020 Number of Significant Digits: 5
Why?
The last zero is to the right of both the decimal and a significant digit, and the other digits are
significant for the same reason as problem 3.
5. 0.000021 Number of Significant Digits: 2
Why?
The 2 and 1 are significant because they are digits from 1-9. The zeros are not significant
because they are just placeholders.
Scale:
4 10 points
3 7-9 points
2 4-6 points
1 1-3 points
0 0 points
50
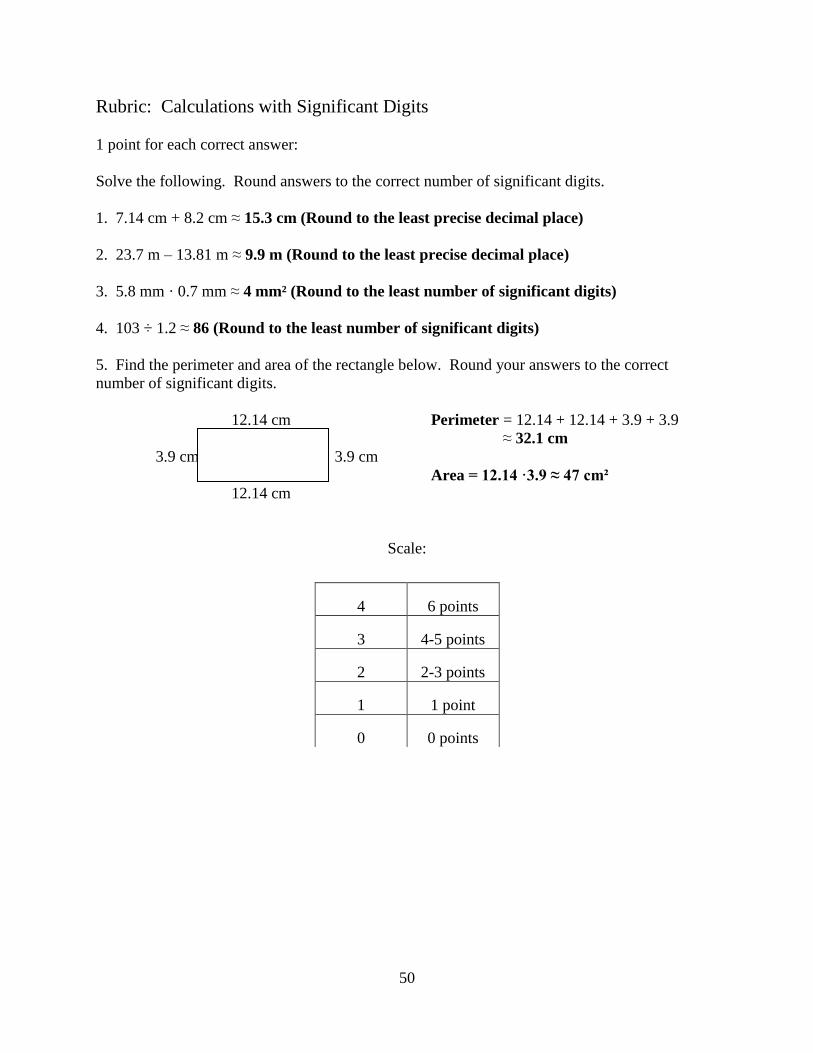
Rubric: Calculations with Significant Digits
1 point for each correct answer:
Solve the following. Round answers to the correct number of significant digits.
1. 7.14 cm + 8.2 cm ≈ 15.3 cm (Round to the least precise decimal place)
2. 23.7 m – 13.81 m ≈ 9.9 m (Round to the least precise decimal place)
3. 5.8 mm · 0.7 mm ≈ 4 mm² (Round to the least number of significant digits)
4. 103 ÷ 1.2 ≈ 86 (Round to the least number of significant digits)
5. Find the perimeter and area of the rectangle below. Round your answers to the correct
number of significant digits.
12.14 cm Perimeter = 12.14 + 12.14 + 3.9 + 3.9
≈ 32.1 cm
3.9 cm 3.9 cm
Area = 12.14 ·3.9 ≈ 47 cm²
12.14 cm
Scale:
4 6 points
3 4-5 points
2 2-3 points
1 1 point
0 0 points

51
APPENDIX B: PRETEST AND POSTTEST DATA FOR BOTH UNITS
Table 3 Pretest and Posttest Data for Both Units
A-Day Self-Assessment Self-Assessment No Self-Assessment
No Self-
Assessment
Student
Unit 5 Pretest
(Possible 14)
Unit 5 Posttest
(Possible 14)
Unit 6 Pretest
(Possible 17)
Unit 6 Posttest
(Possible 17)
1 3 5 2
2 4 5 4
3 3
6 8
4 6 2 2
5
5 8
6 1 2 2 8
7
2 5
8 3
3 1
9 5
4 6
10
2
11 4 6
12 2 5 2 4
13 2 6 3 10
14 2 1
6
15
2
16 5 8 7 8
17
4 1 2
18 4 5 4 3
19
2 6 4
20 8 3 3
21 3 4 5 7
22
23 3 6
24 3 5 2
25 0 1 3 6
26 5 3
27 4
28 1 4
29 4
30 6 3 4
31 2 2 2
32 5 9
33 4 7 2 2
34 2 2 0
35 2 5
(table continued)

52
B-Day No Self-Assessment No Self-Assessment Self-Assessment Self-Assessment
Unit 5 Pre (of 14) Unit 5 Post (of 14) Unit 6 Pre (of 17) Unit 6 Post (of 17)
36 3 10 12
37 6 3 5
38 4 8 7 8
39 5 4 9
40 3 5 3 5
41 4 4 3 3
42 5 5 6
43 2 2 3
44
45 6 1
46
47 5 6 1 2
48 4 3 5 6
49
50 7
51 5 7 4
52 3 3 6 5
53 2 2 4
54
55 3 9 7
56 5 4 4
57 4
58
1 4
59
60 8 5 8
61 3 5 5 7
62 5 5
63 1 6
64
65 1 3 6 7
66 7 5
67 3
68 7 3
69 1 7 7
70 5 3 9
71 3 5 5
72
73 3 1 2
74 5 5 4
75 2 6
76 1 2 4 5
77 3 4 3
78 2 2
79 3 3 3
80 4 6 2 8
81 5

53
APPENDIX C: ASSESSMENTS

54

55

56

57

58

59

60

61

62

63

64

65

66
VITA
Daniel Hotard was born in 1985 in Gretna, Louisiana. He graduated from Louisiana
State University with a Bachelor of Science in mathematics with a concentration in secondary
education in May 2007. Daniel has taught math in alternative middle and high schools in East
Baton Rouge Parish for the past three years. He has been enrolled in the Louisiana State
University Master of Natural Sciences program from 2008 to 2010.