Embed Size (px)
Citation preview

Loyola University Chicago Loyola University Chicago
Loyola eCommons Loyola eCommons
Master's Theses Theses and Dissertations
1978
The Effects of Self Focused Attention on the MMPI Validity Scales The Effects of Self Focused Attention on the MMPI Validity Scales
Bruce Pfau Loyola University Chicago
Follow this and additional works at: https://ecommons.luc.edu/luc_theses
Part of the Psychology Commons
Recommended Citation Recommended Citation Pfau, Bruce, "The Effects of Self Focused Attention on the MMPI Validity Scales" (1978). Master's Theses. 2999. https://ecommons.luc.edu/luc_theses/2999
This Thesis is brought to you for free and open access by the Theses and Dissertations at Loyola eCommons. It has been accepted for inclusion in Master's Theses by an authorized administrator of Loyola eCommons. For more information, please contact [email protected].
This work is licensed under a Creative Commons Attribution-Noncommercial-No Derivative Works 3.0 License. Copyright © 1978 Bruce Pfau
THE EFFECTS OF SELF FOCUSED ATTENTION
ON THE MMPI VALIDITY SCALES
by
Bruce Pfau
A Thesis Submitted to the Faculty of the Graduate
School of Loyola University of Chicago in
Partial Fulfillment of the Requirements
for the Degree of
Master of Arts
March
1978
ACKNOWLEDGEMENTS
The author wishes to thank the members of his thesis
committee, Dr. Frank Kobler and Dr. Alan DeWolfe, for their
help in designing, analyzing and interpreting this study.
VITA
The author, born October 3, 1953, is the son of Harvey
Pfau and Renee (Horowitz) Pfau of Bethpage, New York.
He completed his elementary and secondary education
within the Bethpage, New York public school system at the
Charles Campagne Elementary School, the John F. Kennedy
Junior High School and the Bethpage High School. Upon grad
uation from high school he was awarded a New York State
Regents Scholarship.
The author pursued his undergraduate studies at: Tufts
College of Tufts University in Medford, Massachusetts. He
graduated magna cum laude with a B.S. in Psychology. As an
undergraduate he was President of the Tufts University chap
ter of Psi Chi.
Currently, the author is enrolled as a doctoral candi
date in clinical psychology at Loyola University of Chicago
where he has been pursuing his graduate training since Sep
tember of 1975. During the summer of 1976, he received an
appointment of Clerk in Clinical Psychology at Chicago Lake
side Veterans Administration Hospital. During the academic
year 1976-1977, the author received an appointment as Clini
cal Psychology Extern at the David T. Siegel Institute of
Michael Reese Hospital and Medical Center, Chicago. He is
currently appointed at David T. Siegel Institute as an Ad
vanced Clinical Psychology Extern. He has recently received
an internship appointment at Nassau County Medical Center
for the 1978-1979 academic year.
..
Pfau iv
TABLE OF CONTENTS
Paqe ACKNOWLEDGEMENTS. . . . . • • • • • . • . • • • • . • . . . . • . • . . • . . • • • . • • ii
VITA. . . . • . . . . . . . . . . . . . . . . . . . . . . . . . . . . . . . . . . . . . . . . . . . . iii
LIST OF TABLE;S . ..••.•.•••.•......•••..... ·• • • . . . • • . . . • vi
LIST OF APPENDICES. . • • . . • • . . • • • • • . • • • . • • . • • . . . • • • • . • • viii
INTRODUCTION AND STATEMENT OF THE PROBLEM............ 1
REVIEW OF THE RELATED LITERATURE..................... 6
Evidence of a Self Report-Behavior Discrepancv.... 6 Explanations of the Self Report-Behavior
Discrepancy. . . . . . . . . . . . . . . . . . . . . . . . . . . . . . . . . . . . . 10 Attempts to.Control the Influence of Response Sets 19 Self Focused Attention and Self Report Validity... 27 The Theory of Objective Self Awareness............ 30
EXPERIMENTAL RATIONALE AND HYPOTHESES................ 35
METHOD. • • • • • • • • • • • • .• • • • • • • • • • • • • • • • • • • • • • • • • • • • • • • • • • 4 2
Subjects . .................................... ~ . . . . 42 Measures.......................................... 42 Procedure.- .............................. ·. . . . . . . . . . 4 4
RESULTS AND FINDINGS .•.•.•..•..•.. ,; . . . . . • . . • • . . . • . • • . 4 8
Validity Indicators. . . . . . . . . . . . . . . . . . . . . . . . . . . . . . . 4 8 Time to Complete the MMPI ••...•.•.•..•. ~·········! 50 Negative Affect (Self Report Follow-up Schedule
Scores) . . . . . . . . . . . . . . . . . . . . . . . . . . . . . . . . . . . . . . . . . 51 Frequency of Noticing and Strength of Reaction
to the Self Focusing Stimuli ......•. •·. • . . . • . . . . . 55 Intercorrelations Among the Major Study Variables. 57 Other MMPI Scales . ........... ·· . . . . . . . . . . . . . . . . . . . . 57 Sex Differences.. . . . . . . . . . . . . . . . . . . . . . . . . . . . . . . . . . 61
Pfau
TABLE OF CONTENTS (continued)
DISCUSSION OF THE RESULTS AND FINDINGS •••••••••.•••••
The Validity Indicators •••.•••. Time to Complete the MMPI •. Negative Affect ••••••.•.•• Similarities vs. Differences in
Gr·oups • ..••...••••
. . . . the
Other MMPI Scales. Sex Differences ••••
. . . . . . . Sununary ........ . . . . . . .
. . . . . . . . . . . . . . . . High OSA . . . . . . . . . . . . ...
. . . . .
v
Page 62
62 72 73
74 75 76 78
REFERENCES ••.•••.•.•••••••••••••.••..•• • • • • • • • • • • 81
APPENDIX A . .....••••..•..•• _. . . . • . . . . • • . • . • • . • • • • • 91
APPENDIX B •.••.•..••••••••••..•••...••.•••••••••••• •. 93
APPENDIX C. . . . . . . . . . . . . . . . . . . . . . . . . . . . . . . . . . . . . . . . . . . 95
APPENDIX D • •••••••••••••••••••••••••••••. . . . . . . . . . . 97
APPENDIX E • •••....•.••.••••.•••••..•••.••• . . . . . . . . . . 99
Pfau vi
LIST OF TABLES
Table Page
1. Analysis of Variance of K~Scale Scores for Mirror, Description and Control Groups .••..•.•• 48
2. Analysis of Variance ·of F-Scale Scores for Mirror, Description and Control Groups •••••••.. 49
3. Analysis of Variance of F minus K Index Scores for Mirror, Description and Control Groups •.••. 49
4. Group Means and Standard Deviations for K-Scale, F-Scale and F minus K Index Scores ••••••••••••• 50
5. Analysis of Variance of Time to Complete the MMPI.for Mirror, Description and Control Groups 51
6. Group Means and Standard Deviations for Time to Complete the MMPI . •..•.•.•..•..••.. _ • . . . . . • . . . . • 51
7. Analysis of Variance of Total Negative Affect Scores for ~1irror, Description and Control Groups. . . . . . . . . . . . . . . . . . . . . . . . . . . . . . . . . . . . . . . . . 52
8. Analysis of Variance of Anxiety Scores (SRFS Item la) for Mirror, Description and Control Groups. 53
9. Analysis of Variance of Unhappiness Scores (SRFS Item lb) for Mirror, Description and Control Groups. . . . . . . . . . . . . . . . . . . . . . . . . . . . . . . . . . . . . . . . . 53
10. Analysis of Variance of Room Unpleasantness Scores (SRFS Item 2) for Mirror, Description and Control Gtoups ................................. 53
11. Analysis of Variance of Task Difficulty Scores (SRFS Item 3) for Mirror, Description and Control Groups . . . . . . . . . . . . . . . . . . . . . . . . . . . . . . . . . . 54
12. Group Means and Standard Deviations for All Negative Affect Scores •.••••••••••••••••••••••• 54
13. Analysis of Variance of Frequency of Noticing Self Focusing Stimuli (SRFS Item 4) for Mirror and Description Groups ••••••••••••••••••••••••. 56
Pfau
LIST OF TABLES (continued)
Table
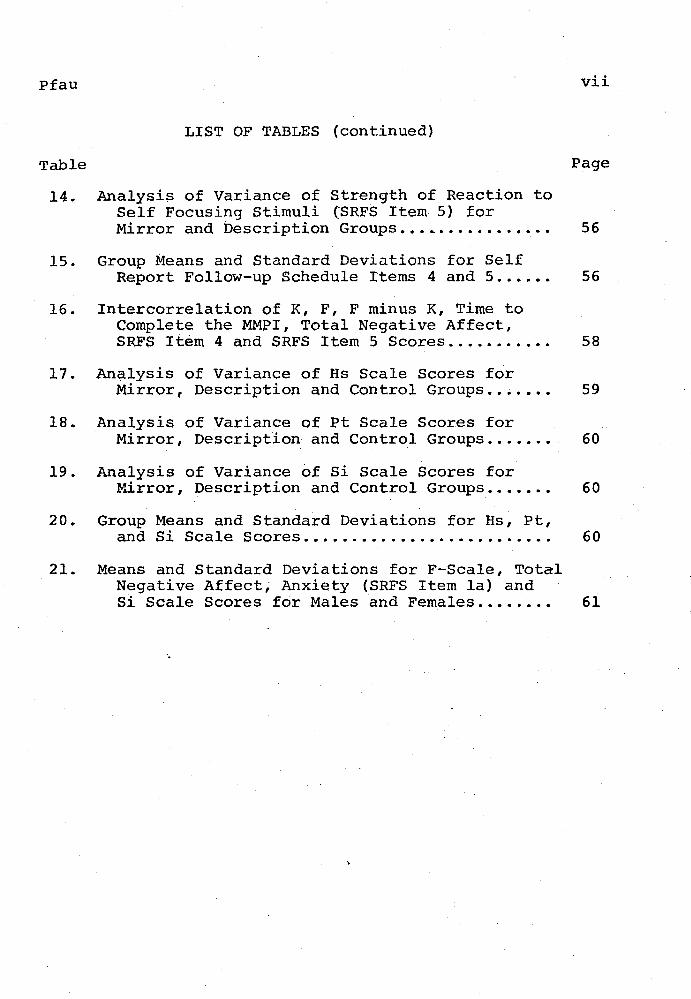
14. Analysis of Variance of Strength of Reaction to Self Focusing Stimuli (SRFS Item 5) for
vii
Page
Mirror and Description Groups ••. ,............ 56
15. Group Means and Standard Deviations for Self Report Follow-up Schedule Items 4 and 5...... 56
16. Intercorrelation of K, F, F minus K, Time to Complete the MMPI, Total Negative Affect, SRFS Item 4 and SRFS Item 5 Scores........... 58
17. Analysis of Variance of Hs Scale Scores for Mirror, Description and Control Groups....... 59
18. Analysis of Variance of Pt Scale Scores for Mirror, Description and Control Groups....... 60
19. Analysis of Variance of Si Scale Scores for Mirror, Description and Control Groups....... 60
20. Group Means and Standard Deviations for Hs, Pt, and Si Scale Scores.......................... 60
21. Means and Standard Deviations for F-Scale, Total Negative Affect; Anxiety (SRFS Item la) and Si Scale Scores for Males and Females........ 61
·.
•
Pfau viii
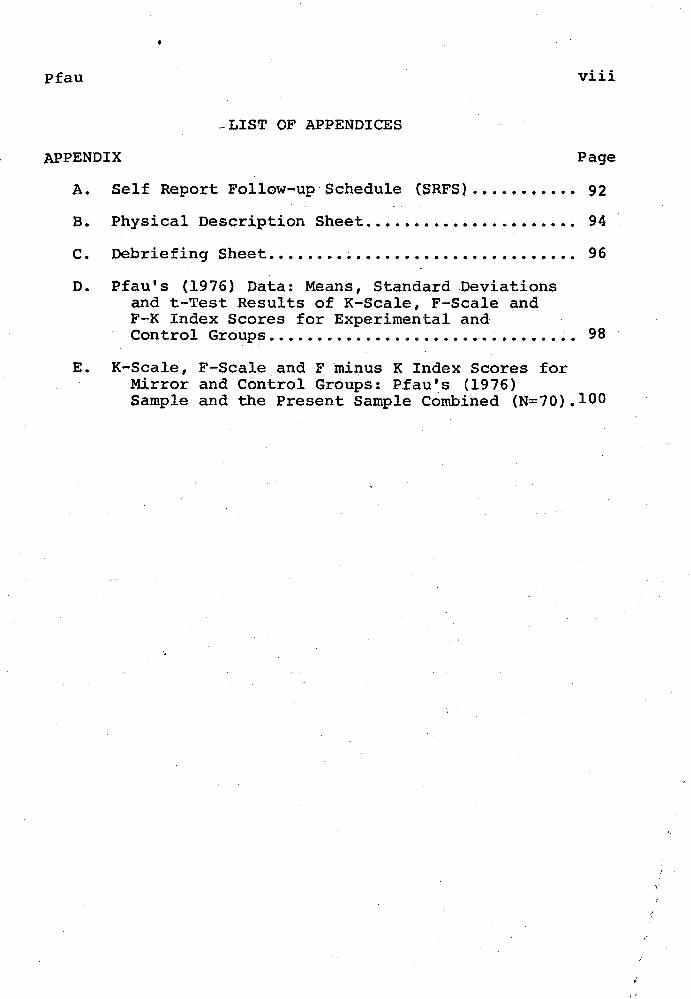
-LIST OF APPENDICES
APPENDIX Page
A. Self Report Follow-up Schedule (SRFS) ••••••••••• 92
B.
c.
D.
E.
Physical Description Sheet •.•••.•••••••••••••••• 94
Debriefi~g Sheet. . . . . . . . . . . . . . . . . . . . . . . . . . . . . . . . 96
Pfau's (1976} Data: Means, Standard .Deviations and t-Test Results of K-Scale, F-Scale and F-K Index Scores for Experimental and Control Groups. . . . . . . . . . . . . . . . . . . . . . . . . . . . . . . . 98·
K-Scale, F-Scale and F minus K Index Scores for Mirror and Control Groups: Pfau's (1976} Sample and the Present Sample Combined {N=70).100
,.
INTRODUCTION AND STATEMENT OF THE PROBLEM
Questionnaires, attitude scales and personality inven-
tories have long been popular methods of data collection in
clinical and. social psychology. While these instruments
have varied in construction, conte.nt and purpose, their basic
format is generally the same: they ask subjects to describe
themselves by endorsing statements which reflect their atti
tudes, feelings and behavior. The validity of self report
measures, as these tests have collectively been called, is
therefore dependent on the accuracy of a subject's self des-
cription. At first glance, this may appear to be an issue of
little practical significance. The assumption here is that
the responder is in the best possible position to describe
his own experience and report it accurately. However, closer
examination of this issue leads one to que_stion this assump-
tion. Self report measure validation research has repeatedly ·.
shown that subjects' verbal descriptions of themselves are
frequently not consistant with their actual behavior.
Many investigators have proposed that the inconsistancy
found between self report and behavior is attributable to the
responders' test taking attitudes. A variety of test taking
attitudes have been identified and have been referred to col-
lectively as "response sets .. or "response styles". For pres--
ent purposes, a response set may be defined as the consistent ,.
,I
..
Pfau 2
tendency to select test responses with_some common property
other than the one related to the substantive variable the
test is intended to measure {Fiske, 1971}. One frequently
noted response set has been referred to as "acquiescence" or
the tendency to answer "True" or "Yes" to ·an agree-disagree
item regardless of content. The response set considered by
many to pose the most serious threat to ·the validity of self
report measures has been·called "faking".
As the label su9gests quite readily, faking refers to
a responder's tendency to dissimulate when completing a self
report measure; it is his tendency to distort, falsify or·
otherwise present a picture of himself that is inconsistant
with how he actually feels, thinks and b~haves. While all
faking involves distortion of the truth, the e·xtent and na
ture of this distortion may vary. One responder may con
sciously falsify·his self description in order to present an
overtly favorable or unfavorable picture of h~mself. Such
would be the case where an ambitious job applicant attempts
to impress a prospective employer by falsifying an occupa
tional interest scale; or, where a draft dodger attempts to
appear maladjusted on a personality inventory in order to
avoid conscription. Another responder may dissimulate in a
less deliberate and extreme fashion. Rather than conscious
ly lying, he presents a mildly self serving picture of his
personality; he gives himself the benefit of the doubt or
Pfau
ignores some of his weaknesses and faults. This form of
faking may have less to do with the responder's conscious
attempts to deceive another than it does with unconscious
attempts to "deceive" himself. Or, it may represent, as
some suggest, the responder's natural tendency to present
3
a "socially desirable" picture of himself, one that is con
sistant with the culture's generally accepted standards of
behavior.
Since the problem of faking was first noted attempts
have been made to take distortion in self description into
account when -interpreting self report data. In general,
there have been two approaches to this problem: the "clini
cal approach" and the "psychometric approach". The clinical
approach relies on the test interpreter's intuitive skill to
identify a faked record. As with other aspects of assess
ment, the success of this approach depends largely on the
acumen of the individual clinician. The psychometric ap
proach relies not so much on the test interpreter, as on the
test itsel'f to take distortion into account. Proponents of
this·approach have attempted to construct and incorporate
directly into the body of tests "validity scales" which not
only identify, but systematically correct for the influence
of distortion. Additionally, they have attempted to make
faking more difficult by including in tests only questions
whose purpose is not easily discernible and whose response
alternatives are equally socially desirable.
Pfau 4
While they differ in the ways they take distortion
into account, both the clinical and psychometric approaches
share the assumption that the responder's tendency to dis
tort his self description is, more or less, fixed and un
changeable. This assumption has led most researchers to
investigate more efficient methods of monitoring, or imped
ing the faker. Less work has been directed at developing
strategies that would reduce a test taker's tendency to
fake, or increase his tendency to tell the truth. Recent
research by Pryor, Gibbons and Wicklund (1975) and Pfau
(1976) suggests, however, that such strategies can be devel-
oped -- that a subject's tendency to fake may be reduced by
manipulating simple environmental stimuli. Their work,
based on Duval and Wicklund's (1972) theory of "objective
self awareness", shows that when test takers are stimulated
to focus attention on themselves, they become more objec-·
tive and produce self reports more consistant with their
actual behavior. In short, these results suggest that self
report measure validity is enhanced by conditions which
foster self focused attention.
The present study will examine the effects of self
focused attention on the degree of frankness and honesty
with which college aged subjects complete a widely used
self report personality inventory, the Minnesota Multi
phasic Personality Inventory. The MMPI is a convenient
pfau 5
instrument for present purposes because it contains valid
ity scales which measure the extent to which a sUbject
fakes good or bad. Self focused attention will be promoted
in one of the experimental groups by seating subjects be
fore a large mirror while they complete the MMPI. Self
focused attention will be promoted in a second experimental
. group by seating subjects before a description of their
physical characteristics. A control.· group will complete
the test under normal conditions. The major hypothesis is
that subjects who are stimulated to focus attention on them
selves will answer the MMPI in a more frank and honest man
ner than subjects who are not so stimulated. It is assumed
that these effects will be reflected in the subjects' va
lidity scale scores.
,.
•'
REVIEW OF THE RELATED LITERATURE
Evidence of a Self Report - Behavior Discrepancy
Attitude versus Behavior. Social psychologists and
sociologists interested in the attitude-behavior relation
ship have known for some time now that what people say about
themselves on questionnaires is not always consistent with
how they actually behave. In his classic study, La Piere
(1934) demonstrated that restaurant and hotel managers'
actual ethnic restriction practices differed greatly from
their staterr,ents of restriction policy. La Piere accompa
nied a Chinese couple on a trip across the country and ob
served their attempts to gain food and lodging at a variety
of establishments. Of the 251 establishments visited, only
one refused to accomodate the couple. Six months later,
La Piere sent questionnaires to the managers of these same
establishments asking among other questions, "Will you ac
cept members of the Chinese race as guests in your esta
blishment?". Surprisingly, only one manager answered this
question affirmatively. Noting the striking difference be
tween attitude and behavior, La Piere concluded:. "Only a
verbal reaction to an entirely symbolic situation can be.
secured by the questionnaire. It may indicate what the
responder would actually do when confronted with the situ
ation symbolized in the question but there is no assurance
that it will". 6
•'
Pfau 7
Since 1934 a number of studies examining attitudes
and behavior toward specific ethnic groups have confirmed
La Piere's findings (Kutner, Williams and Yarrow, 1952;
Lohman and Reitzes, 1952; and Minard, 1952). Further re
search has shown the attitude-behavior inconsistency not to
be restricted to the area of ethnic prejudice. Freeman and
Ataov (1960) found no relationship between college students'
attitudes toward cheating on examinations and their actual
cheating behavior. Henry (1959) showed that teachers' des
criptions of their classroom.behavior were freque~tly un
related to their actual teaching practices. Hassinger and
McNamara (1957) found that people's ;statements about health
practices often bore no relationship to their actual health
practices. Similar discrepancies between self report and
behavior have been noted by investigators examining the re
lationship between attitudes toward alcohol and drinking
behavior (Warriner, 1958); attitudes:toward handicapped
people and hiring of the handicapped (Schletzer, 1961) and_
attitudes toward child reari~g and actual child rearing
practices (Zunich, 1962). Wicker (1969) reviewed thirty
four studies that examined the relationship between attitu
dinal measures (questionnaires) and direct behavioral re
ferent measures. Evaluating the results, he reported:
Pfau 8
Taken as a whole, these studies suggest that it is considerably more likely that attitudes will be unrelated or only slightly related to overt behaviors than that attitudes will be related to actions. Product moment correlation coefficients relating these two kinds of responses are rarely above .30 and often near zero. Only rarely can as much as 10% of the variance in overt behavioral measures be accounted for by attitudinal data. In studies in which data are dichotomized, substantial proportions of subjects show attitude-behavior discrepancies. This is true even when subjects scoring at the extremes of attitudinal measures are compared on behavioral indices.· (Wicker, 1969, p. 75)
Self Description of Personality versus Behavior.
Many writers in the field of clinical psychology (Allport,
1937, 1942; Bernreuter, 19~0; Kelly, Miles and Terman,
1936; Rosensweig, 1934, 1938; and Strong, 1943) have also
cautioned that a person's account of himself on a person-
ality questionnaire .may not be consistent with his actual
behavior. In fact, several studies have demonstrated a
direct discrepancy be·tween questionnaire and behavioral
measures of personality.
In their review of psychological test validation re
search, Campbell. and Fiske (1959) pointed out that self
report measures of personality traits often fail to show
convergent validity, discriminant validity or both. Apply-
ing the multi-trait multi-method matrix to Borgatta's
(1954) data, they found that the correlation between self
ratings and peer ratings of "Popularity" and "Expansiveness"
were .19 and .08 respectively. For these same traits the
correlations between self ratings and behavioral measures
Pfau 9
(observation of group interaction and role playing) did not
exceed ."26. Becker (1960) employed the multi-trait multi
method matrix to refute Sheier and Cattell's (1958) claim
that questionnaire and behavioral measures of the same per
sonality traits ·are strongly related. Correlations of .106
and -.245 were found between questionnaire and behavioral
measures of two of the four traits examined. Correlations
between the measures were higher for the other two traits,
but in these ca·ses adequate discriminant validity could not
be demonstrated.
·Katkin (1965) found that subjects' scores on the
Taylor Manifest Anxiety Scale, a self report measure.of
anxiety, were not related to physiological measures of anx
iety such as galvanic skin response, heart rate and respi
ration. Similar results were reported by Martin (1961),
Raphelson (1957) and Rosenstein (1960). Of course, the
lack of relationship between questionnaire and physiological
measures of anxiety must be viewed in light of the fact the
physiological ~easures themselves frequently do not corre
late significantly (Lacey, 1967).
Cooke (1966) found that behavioral measures of fear
and self report measures of fear such as the Fear Survey
Schedule and the Bendig Emotionality Scale did not correlate
significantly. Most of the correlations between self report
and behavioral measures in Cooke's study·were below .10.
Liebowitz (1968) examined the relationship between a self
Pfau 10
report measure .of fl<Jgression, the Buss-Durkee Hostility In-
ventory (BD) and a behavioral measure of ~9gression, the
Buss Aggression Machine (BAM) • The BAM is of a free response
device which allows a subject to believe that he is actually
inflicting pain on another human being. Tl:le level of pain
inflicted is_ graduated with the subject choosing which level
to administer. Liebowitz found that the correlations-be-
tween performance on the BAM and scores on the subscales of
the BD ranged from .02 to .30. The correlation between BAM
performance and total BD score was only .23. None of:these
cor~elations were significant. As Mischel (1968) points out:
"The phrase 'personality coefficient' might be coined to
describe the correlation between .20 and .30 which is found
persistently when virtually any personality dimension in-
ferred from a questionnaire is related to almost any conceiv-
able external criterion involving ·responses sampled in a
different medium -- that is not by another questionnaire. ·.
Generally, such correlations are too low to have value for
most individual assessment purposes beyond_.gross screening
decisions. Moreover, the obtained net'tvork of relationships.
often are. too diffuse to be comprehensible theoretically."
Explanations-of the Self Report-Behavior Discrepancy
Several explanations have been offered to account for
the discrepancy often fo~nd between self ~eport and behavior.
Tededeshi and Lindskold (1976) suggest thatverbal and
Pfau 11
motor (actual) behavior are often subject to different re
inforcement contingencies. One may be positively reinforced
for making the statement "I like to go to parties", but
punished for actually going. This discrepancy in reinforce
ment histories, they feel, leads to the subsequent discrep
ancy found in responses. Several authors (Allen, 1958;
Cattell, 1957; Nunnelly, 1959; and Vernon, 1964)· have sug
gested that it may be a subject's self ignorance -- his
lack of awareness of P,ow.he actually feels or behaves -
that accounts for the discrepancy between his self report
and his behavior. According to this view, subjects simply
do not have sufficient information to answer the questions
posed by self report measures. Their subsequent guessing
introduces random error to questionnaire variance .and, thus,
lowers the instrument's validity.
Response Sets. Of the many explanations offered to
account for the discrepancy between self report and behavior
the most influential and controversial one has revolved
around the concept of response sets or response styles. A
response set refers to a test taker's consistent tendency
to endorse responses with some common property other than
the one related to the substantive variable the test is
supposed to measure (Fiske, 1971). Put another way, re
sponse sets refer to response ~onsistencies irrespective of
intended stimulus differences (Mischel, 1968).
pfau 12
One of the response sets that has received quite a
bit of attention in the literature has been called "acqui
escence". Acquiescence refers to the subject's tendency to
respond "True" or "Yes" more often than "False" or "No" on
true-false yes-no items where he is in doubt. In a series
of studies, Cronbach (1941, 1942, 1946) offered several
lines of evidence to document the existence of acquiescence.
After analyzing the scores of students on ten academic true
false tests, Cronbach found that: 1) the majority of stu
dents had an excess of "true" responses; 2) when students
guessed on an i tern, they were likely to respond '1 true 11;
3) the split half reliability coefficients of the. items
keyed false were almost always higher than that of the
items keyed true and often higher than that of the entire
test; 4} the correlations between scores achieved on the
true keyed items and the false keyed items were invariably
low; and 5) individual differences in the tendency to re
spond true when in doubt were relatively stable. Cronbach
reasoned that the tendency to acquiesce reduced the valid
ity of the true keyed items and thus of the test itself.
Numerous investigators {Bass, 1955; Chapman and Bock,
1958; Chapman and Campbell, 1957; Christie, Havel and Sei
denberg, 1958; Cohn,. 1953; Jackson, Messick and Solley,
1957; Leavitt, Hax and Roche, 1955; Messick and Jackson,
1957, 1958; and Zuckerman, Norton and Sprague, 1958) have
Pfau 13
demonstrated that acquiescence influences "authoritarianism"
scores achieved on the California F Scale. Each of these
investigators compared scores on the original form of the
test with scores on specially constructed alternate forms.
The original form consisted of only true keyed items. The
various alternative forms were rewritten so that the con
tent of the questions remained the same, but the keying be
came reversed. In all of the studies significant asymmet
ries were found between scores on the two forms.
Damarian and Messick (1965) .reviewed fourteen factor
analytic studies of response style influence in self report
variance. They found that relatively pure acquiescence
factors eme~ged in ten of the fourteen studies. In each of
the four remaining studies two slightly different acquies
cence factors appeared. Bass (1955) and Messick and Jackson
(1958, 1961) claim that in personality inventories with
agree-disagree formats such as the MMPI, the California F
Scale or the California Psychological Inventory, much of
the principle variance may be accounted for by acquiescence
rather than specific item content.
In contrast to the above findings, several studies
have found no substantial evidence for the existence of an
acquiescent response set. Lichtenstein and Bryan (1965)
found mean correlations of .74 to .79 between standard sub
scales and specially constructed reversed keyed subscales
Pfau 14
of the MMPI. These correlations generally approximated the
test-retest reliabilities of the standard subscales. Simi
lar results were reported by Rorer and Goldberg (1965a,
1965b). Block (1965) compared the factor structure of a
standard and balanced form of the MMPI. On the balanced
form some of the true keyed items were deleted so that only
scales with equal numbers of true and false keyea items re
mained. In this way the possible effects of acquiescence
were controlled on the balanced form. Contrary to the ear
lier reported findings of Jackson and Messick (1961), Block
found no differences between the factor structures of the
two forms.
Perhaps even more than acquiescence the response set
that has received most attention in the literature has been
referred to as "faking". In a. general sense, faking refers
to a test taker's tendency to deviate from complete honesty
and frankness when describing himself on a questionnaire.
Specifically, it may refer to several quantitatively and
qualitatively different response styles. ·For example, a
responder may fake "good" or "bad", intentionally or unin
tentionally. Thus, faking may be as blatant as the-malin
gerer's attempt to look sick on a psychiatric personality
inventory, or as innocuous as the normal person's tendency
to give himself the "benefit of the doubt" when making self
appraisals. While very little work has been done examini~g
the actual rate of occurrence of faking on self report mea-
Pfau 15
sures, much research has shown that these measures can in
deed be·faked.
Weman (1952) had subjects complete measures of "self
confidence" under two role playing conditions. In the first
condition they were asked to fill out the test as if they
had been unemployed for some time and were applying for a
job with a large firm. In the second condition they were
instructed to fill out the test as if they were applying for
a job in a small town library. The results showed self con
fidence scores to be much higher in the "big firm" condi
tion. Longstaff (1948) showed that when asked to do so,
students could fake either .interest or aversion to several
of the occupations surveyed by the Strong Vocational In
terest Blank and the Kuder Personal Preference Inventory.
Dunnette, McCartney, Carlson and Kirchner (1962) had sales
position applicants complete the.Adjective Checklist under
directions to answer honestly and directions to. "fake good".
Significant differences were found between the two groups
of scores for personality dimensions such as Sales Effect·
iveness, Cooperativeness and Conscientiousness. Addition
ally, the investigators found that validity coefficients
were greatly reduced when faked scores were correlated with
behavioral measures of sales effectiveness.
Research on questionnaire fakeability has not been
limited to the area of personnel selection. In an early
study of personality inventory fakeability~ Ruch (1942)

Pfau 16
showed that college students could distort their responses
to the Bernreuter Personality Inventory in such a way as to
achieve "extroversion" scores falling in the 98th percen
tile. This was in contrast to the 50th percentile scores
achieved when the test was completed truthfully. Kelly,
Miles and Terman {1936) demonstrated that the Terman-Miles
Masculinity-Femininity Test could be faked in either direc
tion~ Ellis (1946) reviewed forty-two studies which exam
ined either actual or simulated faking on personality ques
tionnaires. Thirty-six of these studies found that sub
jects were capable of faking or actually did fake their
test records. More recently, Meridith {1968) had subjects
complete the 16 Personality Factor Test under standard in
structions, instructions to produce a good impression and
instructions to produce a bad impression. Highly s~gnifi
cant 4ifferences (p( .001) were found between the standard
instruction qondition and both experimental conditions for
thirteen personality dimensions.
The overriding tendency of most people to "fake good"
on personality questionnaires has received particular atten
tion in the literature. Edwards (1953, 1957) contends that
when completing self report measures, people tend to endorse
responses which are "socially desirable'' whether the content
of these responses applies to them or not. He offers sev
eral lines of evidence to support this claim. In his first
•'
Pfau 17
study Edwards (1953) had judges rate a group of personality
questionnaire items on a nine point scale of social desir
ability. Ratings ranged from "highly socially desirable"
to "highly socially undesirable". The items were then ad
ministered to a group of subjects. The correlation between
the mean social desirability rating for each item and the
proportion of subjects endorsing that item was computed and
found to be .87. Subsequent studies using a variety of
test items reported similar results {Cowen and Tongas, 1959;
Edwards, 1959; Hanley, 1956; Kenny, 1956; Taylor, 1959).
It has also been found that scales constructed specifically
to measure a person's tendency to endorse socially desirable
responses correlate highly with measures of various.person
ality traits. Edwards (1957) constructed such a scale by
obtaini~g judges' ratings of 150 MMPI items. He then se
lected 39 i terns that showed perfect interjud.ge reliability
and high discrimination power for inclusion in the Social
Desirability Scale (SD). Correlations between SD scores
and scores on various other MMPI scales were found to be
quite high. For example, SD scores correlated -.84 with
scores on the Taylor Manifest Anxiety Scale, -.90 with
scores on Drake's Social Introversion Scale, -.73 with
scores on Navian's Dependency Scale, and -.75 with scores
on Cook's Hostility Scale. Merrill and ~eathers (1956)
computed the correlations between SD scores and scores on
•'
Pfau 18
the ten clinical scales of the ~illPI. SD was found to cor
relate -.52 with Hypochondriasis, -.85 with Psychasthenia,
-.77 with Schizophrenia, -.61 with Depression and -.50 with
Psychopathic Deviate. In light of the above findings, Mer
rill and Heathers concluded that much of the variance in
personality scale scores is accounted for by the subjects'
tendency to endorse socially desirable responses and not by
the psychological traits the scales were supposed to mea
sure. Edwards and Diers {1962) offered factor analytic data
to support this position. Their results showed that the
first order factor loadings of the MMPI scales were linearly
related to the correlations between the scales and the
Social Desirability Scale. In fact, the lowest correlation
found between the factor loadings and the SD X Scale score
r's was .96. Additionally, it was found that the first
order factor loadings of the MMPI scales could be predicted
from the proportion of items in the scale keyed for socially ·
desirable responses. Jackson·and Messick (1962) also pre
sent factor analytic data that shows a pervasiva social de
sirability factor in the MMPI. Edwards (1967) concluded
from the above data: ''~ •• scores on various personality ·
trait scales are correlated with scores on the SD scale to
the degree to which they are measuring the same common per
sonality trait I believe the SD scale to.be measuring: the
tendency to give socially desirable responses in self des
cription."
Pfau 19
Attemgts to Control the Influence of Response Sets
Numerous attempts have been made to reduce the influ-
ence that response sets have on self report measures. These
attempts can be divided into attempts to prevent the influ-:..· >- ...... ---
ence of response sets and attempts to correct for the influ-
ence of response sets. Preventive measures have included
attempts t? increase item subtlety, ·thereby making them more
difficult to fake (Fordyce and Rozynko, 1957; Weiner, 1948),
attempts to construct response choices of equal social de-
sirability, thus controlling for the SD factor (Edwards,
1957) and attempts to balance the true-false keying of
items, thereby making them less prone to the influences of
acquiesc~nce (Messick and Jackson, 1958) • Each of these
methods has been shown to have some degree of success in
preventing response set influence, though none of them seems
to be totally effective (Fiske, 1971}.
Rather than attempting to prevent the influence of
response sets, Rosensweig (1934) called for the development
of procedures that would monitor and correct for response
style bias. "Might it not be more effective to recognize
at the outset that such tests (self reports) have certai~
limitations that can never be completely circumvented and
then go on to the measurement of these limiting factors
themselves, thus obtaining information b~ which a correc
tion may be applied to the subject's answers."
Pfau 20
Attempts to measure and c01:rect for response set bias
have varied in their degree of psychometric sophistication.
Psychodynamically oriented writers have suggested relying
on the test interpreter's clinical judgement, both for iden
tification and correction of test score variance attribut
able to response sets. Combs, Soper and Cowen (1963) and
Parker (1966), for example, argue that personality inven-·
tories should be interpreted as reflections of a person's
"public self" concept rather than as an accurate description
of typical behavior. The success of these intuitive pro
cedures may vary with the skill o£ the individual clinician
and are, therefore, not always reliable.
More notable than simple intuitive methods have been
attempts to construct scales that quantify response set in
fluence. Scores obtained on these scales.have been used to
correct or suppress the bias attributable to response sets
and have thus been referred to as "suppressor variables".
A suppressor variable may be defined as a variable which is
signif-icantly correlated with trait scale -scores but not
correlated with the criterion for which the trait scale
score is valid (Dicken, 1963). The validity of trait scores
can thus be improved by subtracting that portion of score
variance which is not associated with the criterion. Sev
eral methods have been employed for developing suppressor
variables. Cady (1923) constructed his Consistancy Scale by
'""
pfau 21
using a repeated item format and measuring the number of
times subjects contradicted themselves. These contradic
tions or inconsistancies were assumed to be mediated by the
subject's attempts to fake. Consistancy Scale scores once
obtained were then subtracted from the subject's Adjustment
score on the Woodworth Psychoneurotic Inventory. Hartshorne
and May (1928} devel~ped their Lie Scale by compiling a list
of ideal personality traits, traits so ideal that almost no
honest person could claim to possess them. For e~ample, the
scale consisted of items suc:::h as "I ne_ver put off till to
morrow what I ought to do today". The number of ideal
traits a subject endorsed was assumed to be an index of the
degree to which he faked good on the rest of his record.
Humm and Wadsworth (1935) , employing their Temperament Scale,
used the nurober of abnormalities subjects disclaimed as an
index of faking good. Ruch (1942) constructed an "Honesty"
scale for the Bernreuter Personality +nventory consisting of
those items which showed shifts in response when answered
under standard and fake ideal instructions.
T~e MMPI Validity Scales. Perhaps the most well known
of all the validity scales that have been developed have·
been the four constructed for use in the Minnesota Multi
phasic Personality Inventory. Three of these, the Cannot
Say (?) Scale, the L-Scale and the F-Scale were incorporated
in the original form of the test by Hathaway and McKinley
pfau 22
(1943). The fourth, the K-Scale, was added later by Meehl
and Hathaway {1946). The Cannot Say (?) Scale score is
simply the total number of items the responder does not
answer, omits, or double marks. The authors regard the
Cannot Say Scale as a gross measure of evasiveness, defen
siveness or confusion but they do not attribute to it formal
psychometric properties. .The extent to which Cannot Say
scores affect profile validity is seen as an all or none
proposition. Scores below 30 have b~en shown not to affect
the validity of the clinical scales and are designated .. OK".
Scores above 30 have been shown to have a negative effect on
clinical scale validity and are thus considered to invali
date the entire profile. It should be noted that the modal
score for Cannot Say as· determined by Tamkin and Scherer
(1957) was zero even among psychiatric patients.·
The L-Scale fashioned after· Hartshorne and May's
{1928) Lie Scale was designed to detect intentional efforts
to evade answering the test honestly. It consists of fif
teen items that present personality characteristics which
are highiy socially desirable but rarely possessed by any
individual. Normal subjects were found to obtain L scores
between 3 and 5 with only 2-3% obtaining scores of 10 or
above. Clear evidence exists that as L scores increase the
number of clinical scales with T-scores above 70 decreases
(Hathaway and Meehl, 1951). However, while the L-Scale has
Pfau 23
been shown to effectively detect the naive, deliberate faker,
it is relatively insensitive to the more sophisticated modes
of faking good such as endorsement of plausible socially
desirable traits (Meehl and Hathaway, 1946}.
The F-Scale, alternatively labeled the "frequency" or
"infrequency" scale, consists of sixty-four items which were
found to be rarely answered in the keyed direction. Thus,.
the F-Scale was designed to detect highly unusual or atypical
response patterns. Average raw F scores were found to range
between 2 and 4 with only 3 percent of normal subjects scor
ing above 12. Elevated F scores have been associated with a
number of factors which tend to decrease the validity of a
subject's test record: errors in recording of answers, read
ing difficulties, perceptual difficulties and disorientation.
(Dahlstrom, Welsch and.Dahlstrom, 1972). Additionally,
elevated F scores have often been associated with "faked bad"
records. Meehl and Hathaway {1946) found that 96 percent of
a group of simulated faked bad MMPI profiles had F scores
above 15. Marks and Seeman (1963) pointed out that elevated
F scores were often obtained by genuinely disturbed respon
dents who exaggerated the degree of their disturbance as a
"cry for help". As might be expected, Hathaway and Meehl
(1951) demonstrated that as F scores increase, the number of
MMPI. clinical scales above a T-score of 70 also increases.
Pfau 24
The three validity scales discussed above were designed
to detect more or less gross forms of test distortion. Clin
ical experience with the MMPI showed, however, that subtle
forms of defensiveness or faking good could significantly al-
ter a test profile and go undetected by the Cannot Say, L and
F scales. Also, while these scales provided an index of test
distortion as yet no formula had been developed to systemati-
cally correct for the influence this distortion had on the
rest of the test record. The K-Scale or "correction scale"
was constructed in an attempt to remedy this problem. Meehl
and Hathaway {1946) began construction by compiling the test
records of fifty known patients who had normal MMPI profiles.
These "false negative" profiles were then compared with a
group of "true negative" records, that is, normal profiles
obtained by normal subjects. Item analys~s led to the iden-. . .
tification of twenty-two items which differentiated the two
groups. Subsequent research with the L6 scale, as these
twenty-two items came to be called, showed that the scale was
bipolar: high scores indicated that the respondent was faking
good; low scores indicated that he was faking bad. A problem
arose, however, in that severe depressives and schizophrenics,
"true positives", also obtained low L6 scores. To reduce the
likelihood that these true positive records would be inter-
pret~d as mere exaggerations of psychopathology, eight addi
tional items that differentiated schizophrenics and depres-
Pfau 25
sives from the general population were added to the L6 • The
resultant thirty item scale was labeled K.
Originally, Meehl and Hathaway proposed that the K-Scale
be used like the other three validity scales. That is, they
proposed that K be used as an indicator of response style dis
tortion, the clinician using his judgement to assess the de
gree to which this distortion affected the rest of the test
profile. Later, however, they developed a psychometric for
mula for employing the K-Scale as a correction score or sup
pressor variable. To do this, two groups of "borderline"
MMPI profiles were compiled, one group obtained by normals,
one group obtained by patients. A borderline profile, as the
name suggests, was a test record which did not fit definitively
in either the normal or abnormal category. Operationally,
these were profiles with at least one clinical scale above a
T-score of 65, but with no scale above a T-score of 80. Meehl
and Hathaway then determined which weights of K, when added to
the clinical scales, significantly differentiated th~ clinical
and normal groups. Their results indicated that this differ
entiation took place when the total raw K score was added to
the Psychasthenia and Schizophrenia scales and when .SK, .• 4K
and .2K was added to the Hypochondriasis, Psychopathic Deviate
and Hypomania scales, respectively.
· Validation research on the K-Scole _has yielded contra
dictory findings~ As mentioned earlier, Meehl and Hathaway
..
Pfau 26
(1946) found that K could be used to differentiate the bor
derline profiles of normals ·and patients. In a separate
experiment, these authors obtained a group of forty-four
profiles, half from normals and half from patients, and
attempted to sort them using K scores alone. Any profile
with a K-Scale T-score above 50 was classified abnormal;
profiles with K-Scale T-scores below 50 were classified nor
mal. Using this procedure, 85 percent of the profiles were
sorted correctly. Hathaway and Meehl (1951) and Hathaway
and Monachesi (1961) found that K .scores were negatively
correlated with the number of clinical scales above a T-score
of 70. This correlation was computed, of course, without
adding the K correction to any of the clinical scales. In
contrast to these positive results, Hunt et. al. {1948) and
Silver and Sines (1962) found no diffe.rential diagnostic
utility in using the K correction.
Several investigators have attempted to construct
validity scales or indexes in addition to the four f~rmally
presented in the MMPI. Cofer, Chance and Judson (1949) de
signed the Mp Scale to detect both faked goo~ and faked bad
records. Gough (1954) developed the Ds Scale to detect
attempts by normals to feign psychoneurosis. Osborn (1970)
constructed the Moderator or Mo Scale to identify MMPI pro
files frequently associated with undependable clinical
judgements. Perhaps the most notable of all the additional
Pfau 27
MMPI validity indicators has been the F minus K Index de
veloped by Gough (1947). Gough proposed that the difference
between raw F and K scores could be used as both an index of
faking good and faking bad. After analyzing a large sample
of MMPI profiles, he found this difference- ranged from -28
to +25, with the median being approximately -9. Most nor
mals were found to have F-K scores between -2 and -19.
Gough suggested that F-K scores higher than +9 and lower
than -7 indicated malingering and self-enhancement, respec
tively. Several investigators have demonstrated the effec
tiveness of the F-K index in identifying faked bad records
{Anthoney, 1971; Branca and Podolnich, 1961; Gough, 1947;
Hunt, 1948). Its effectiveness as an indicator of faking
good has not been shown conclusively. Drasgow and Barnette
(1957), Exner, McDowell, Pabst, Stackman and Kirk {1963),
Gough (1950) and Hunt (1948) found that while faked good
records generally yielded negative F-K scores, so did the
records of many normals, especially college students. Be
cause of this it was difficult to establish efficient cut
ting scores when using F-K to identify faked_ good records.
Self Focused Attention and Self Report Validity
As can readily be seen from the review above, a great
deal of work has been directed at monitoring, preventing or
correcting the influence response sets have on self report
measures. For the most part, these efforts have centered
Pfau 28
upon modifying the self report instruments themselves; i.e.,
balancing the number of true and false items, employing re
sponses of equal social desirability, or developing validity
indicators and suppressor variables. Almost no work has
been directed toward the development of procedures which
might foster a lessening in a respondent's tendency to em
ploy response styles. Put another way, relatively few meth
ods have been developed that promote a subject's frank and
honest disclosure on self report measures. The absence of
work in this area seems to have resulted from the generally
accepted belief that a person's tendency to distort his self
descriptions is, for the most part, unchangeable. Recent
work by Pryor, Gibbons and Wicklund (1975) and Pfau (1976)
has called the validity of this assumption into question,
however. Based on Duval and Wicklund's (1972) theory of
"objective self awareness", these workers.found that sub
jects who complete self report measures under conditions
which foster self focused attention -- that is, conditions
which tend to direct the respondent's attention toward his
own physical and psychological attributes rather than to the
external environment -- produce more honest and valid des
criptions of their personalities and behavior.
Pryor, Gibbons and Wicklund {1975) had a group of
college aged subjects complete a face valid self report
measure of "sociability". The scale consisted of sixteen ,.
pfau 29
items such as "I have a difficult time making new friends"
and the like. Half of the subjects completed the test while
seated before a large mirror (High Objective Self Awareness
Condition-OSA). The other half completed the test under
normal conditions (Low OSA) . The mirror was assumed to pro
mote self focused attention in the subjects seated before
it. A·few days after completing this test, subjects were
asked to return ostensibly to participate in another experi
ment. At that time they were seated in a cubical with an
other student who was actually a confederate of the experi
menters. Two behavioral measures of sociability were ob
tained: the confederate rated each subject on a six point
scale of sociability and a tape recording of the interaction
allowed for a measure of the number of words spoken by the
subject. These two overt measures of sociability were con
verted to ·z-scores, combined, and correlated with self
report scores. For the control group (Low OSA} this corre
lation was .16 while for the mirror group (High OSA) it was
• 62. · These correlations differed significantly (p ( • 05}
and the results supported the hypothesis that self report
validity can be improved by conditions which foster self.
focused attention •. Subjects in the High OSA group seemed
to offer more accurate accounts of their actual behavior.
In a somewhat different study, Pfa~ (1976} had two
groups of college students complete the Minnesota Multi-
Pfau 30
phasic Personality Inventory (MMPI). As in the Pryor,
Gibbons and Wicklund (1975) study above, the experimental
or High OSA group completed the test while seated in front
of a large, conspicuous mirror; the control or Low OSA
group completed it under normal conditions. Validity in
dices of the two groups.were compared with the following
results: the mirror group had significantly lower K-Scale
scores (p( .05), significantly higher F-Scale scores (p(.05)
and significantly higher Gough F minus K indices (p( .01).
These differences appeared to {ndicate that the High OSA
subjects were less prone to fake good and more prone to
admit to some of their faults and weaknesses. In other
words, subjects in the mirror condition seemed to produce
more valid MMPI protocols.
The Theory of Objective Self Awareness
As stated earlier, the two studies cited above were
based on.Duval and Wicklund's (1972) theory of "objective
self awareness". At the core of this theory are two impor
tant concepts. The first of these is the concept of "objec
tive self awareness" itself. Objective self awareness is
viewed as a state in which a person takes himself to be an
object of attention and evaluation. Self focused attention
is assumed to be a necessary component of objective self
awareness. The second concept is that of "intra-self dis
crepancy". Intra-self discrepancy is assumed to exist when
Pfau 31
a person engages in two contradictory behaviors or holds two
contradictory opinions. More importantly, intra-self dis-
crepancy exists when a person's actual behavior is perceived
by him to be deviating from his standards of correctness or
his aspirations. Thus, intra-self discrepancy is a state of
psychological incongruence. It is important to note that a
within self discrepancy may be positive or negative. When
positive, a person's actual b~havior has exceeded his aspi-
rations. When negative, actual behavior has fallen short
of aspirations. Given the existence of multiple intra-self
discrepancies across multiple self related dimensions, self
focused attention will result in attention being directed
toward the most salient of these discrepancies. Thus; the
straight A student who has just failed an important exam
will, when focusing attention on himself, .be struck by the
salient negative discrepancy between behavior and standards
on the dimension of achievement.
With these core concepts clarified, the most concise
explication.of the theory of objective setf awareness is
offered by Wicklund (1975):
The theory of objective self-awareness as it stands presently is this: Conscious attention is viewed as dichotomous, having the property of being directed either towarq the self or toward the environment. The direction of attention is guided by events that force attention inward, such as reflections of the self, and events that pull attention outward, such as distracting stimuli outside the self. Under objective self-awareness the person will experience either negative or positive affect, depending on whether attention is directed
Pfau 32
toward a negative or a positive discrepancy. The degree of affect is a joint function of the proportion of attention (over a time interval) focused on the discrepancy and the size of the discrepancy.
The initial reaction to the onset of objective selfawareness is postulated to be self-evaluation. If the salient discrepancy is negative, the person will be increasingly cognizant of that discrepancy, owing to selffocused attention. In terms of operations, the discrepancy will loom· larger. The converse should hold for positive discrepancies: The onset of objective selfawareness will create a heightened positive self-evaluation on the salient positive discrepancy.
In trying to anticipate whether a person's discrepancy on some specified trait will be positive or negative, an atheoretical guideline will be useful. From all available evidence, especially in the area of achievement motivation, it is a reasonable assumption that virtually all naturally occurring discrepancies are negative. They can be rendered positive by a recent success experience, but it is also likely that the impact of such successes will dwindle with time. This ·is because aspirations rise and eventually surpass the individual's recently a.ttained successes, re-creating negative discrepancies.
Finally, there are two possible reactions to selffocused attention in addition to the initial reaction of self-evaluation. The first is of the nature of an avoidance or approach response. If the discrepancy in focus is positive, the person will welcome stimuli that bring on the objective state, and will tend to seek out self-focusing circumstances. If the salient discrepancy is negative; there will be an active avo$-dance of such stimuli, including efforts to create pistractions. Further, and only in the case of negative discrepancies, an inescapable objective self-awareness will result in attempted discrepancy reduction. (p. 237-238)
Several lines of evidence reviewed by Wicklund (1975)
lend support to the theoretical formulations presented above.
Ickes, Wicklund and Ferris (1973) showed that both positive
and negative real-ideal self discrepancies were perceived as
larger by a group of High OSA subjects who were exposed to
,.
Pfau 33
tape recordings of their own voice or their mirror image.
They found additio~ally that a group of High OSA subjects
scored significantly lower than controls on a measure of
self esteem. Duval, Wicklund and Fine (1974) found that
subjects with a negative intra-self discrepancy remained in
a mirrored room for shorter periods of time than subjects
with positive discrepancies. The tendency to_avoid states
of objective self awareness by engaging in distractions or
nervous habits such as smoking or hand tapping has been
shown by Liebling, Seiber and Shaver (1974) and Dittman and
Llewellyn (1969) respectively.
When viewed in the context of objective self awareness
theory, the earlier documented inconsistancy between behav
ior and self report may be seen as a reflection of a nega
tive discrepancy between a respondent's real self and ideal
self. Using this paradigm the results of the Pryor, Gibbons
and Wicklund (1975) and the Pfau (1976) studies may be ex
plained in the following way: Subjects in both the High OSA
and Low OSA conditions were stimulated to focus attention on
themselves due to the nature of the task they were asked to
complete (i.e.: answer questions about their personaliti~s).
Thus, -for any particular test item, at least a moment of
self focused attention and objective self awareness was in
duced. This moment of objective self awareness resulted in .
the recognition of a negative discrepancy between the sub-
Pfau 34
ject's real and ideal status on the personality dimension or
behavior in question. The negative affect associated with
the recognition of the negative intra-self discrepancy moti
vated all subjects to escape objective self awareness. This
was relatively easy for the Low OSA control group subjects;
they could merely turn their attention away from the dis
crepancy and answer the question on the basis of their
ideals. (It seems likely that these ideals would be more or
less consistent with societal standards, hence the social
desirability factor.) The High OSA subjects being constantly
induced to focus attention on themselves could not escape
objective self awareness as readily. To reduce the negative
affect, they were compelled to reduce the discrepancy be
tween their verbal report and their actual behavior. Be
cause the dimensions tapped by personality test items are
often relatively inflexible in nature (i.e.: dominance,
introversion, extroversion) the chances that a subject's
.actual status could be improved or brought up to ideal stan-
dards quickly enough to reduce the discrepancy were quite
small. High OSA subjects could, therefore, only reduce
their intra-self discrepancies by making their verbal report
more consistent with their actual behavior.
EXPERIMENTAL RATIONALE AND HYPOTHESES
The present study will attempt to replicate and fur
ther elaborate the results of Pfau (1976). Thus, the study
will examine the effects of self focused attention on the
MMPI performance of college aged subjects. More specifi
cally, the study will examine the effects of self focused
attention on subjects' self report honesty as reflected by
the MMPI validity scales. In accordance with Duval and
Wicklund's (1972) theory of objective self awareness, the
major hypothesis will be that subjects who are stimulated
to focus attention on themselves will become more objective
in their self evaluations and will complete the MMPI in a
more frank and truthful manner than subjects who are not
stimulated to focus attention on themselves. Because col
lege aged groups have generally been found to present overly
favorable pictures·. of their personalities (Dahlstrom, Welsh
& Dahlstrom, 1972), self focused attention_ should lead, in
.their case, to a reduction in the tendency to fake good._
The validity indic~tors of major concern will be .the
K-Scale, the F-Scale and the F minus K Index. The K-Scale
will be assumed to measure defensiveness or faking good.
It is hypothesized that K scores will be lower for self
focused subjects. The F-Scale ~ill be assumed to measure
subjectJ willingness to admi.t to their faults, weaknesses
35
Pfau 36
and less socially desirable characteristics. It is hypo
thesized that F scores will be higher for self focused sub
jects. The F minus K Index will be assumed to yield a net
total of faking good. It is hypothesized that F-K scores
will be higher for self focused subjects.
No specific hypotheses will be made concerning the
L-Scale. This for two reasons •. First, it is assumed that
college aged subjects will show very little variability on
a measure of deliberate lying. That is, almost all subjects
are expected to achieve very low L scores. It is assumed
that rather than consciously lying, subjects will fake good
in a more subtle fashion best monitored by the K-Scale.
Second, if a small number of subjects do set out to delib
erately falsify their MMPI, it is doubtful that the promo
tion of self focused attention will stop them. Assuming
that these deliberate liars are randomly distributed between
experimental and control groups, no differences in L scores
should be seen. It might be noted in this regard that Pfau
(1976) while finding differences in the K-and F scores of a
self focused attention group and a ·control group, found no
differences in their L scores.
Like the Pryor, Gibbons, and Wicklund (1975) experi
ment and the Pfau (1976) experiment, the present study will
employ a mirror to promote self focused attention in one of
the experimental groups. This group will be referred to as
Pfau 37
the High Objective Self Awareness Mirror group (High GSA
Mirror). In addition, with hopes of increasing the gener
alizability of the findings and meeting the criterion of
multi-operationalism, a second self focused attention-high
objective self awareness condition will be employed. In
this condition self focused attention will be stimulated by
a handwritten description of subjects' physical character
istics. The description will include only relatively ob
jective data such as height, weight, eye color and hair
color. Like the mirror, the physical descriptions will be
placed directly in the subjects' line of sight. Subjects
in this condition will be referred to as the High Objective
Self Awareness Description_ group (High GSA-Description).
In addition to the two High OSA experimental groups, a con
trol group, not presented with any self focusing stimuli,
will be employed. Subjects in this condition will be·re
ferred to as the Low Objective Self Awareness Control group
. (Low GSA-Control).
That self focused attention and objective self aware
ness will be stimulated by the mirror and physical descrip
tion is predicated on the theoretical proposition that a~y
stimuli, symbol or reflection that reminds a person of his
objective status on a.ny self related dimension will cause
the person to shift attention toward himself and increase
his objective awareness of his status on all self related
Pfau 38
dimensions (Wicklund, 1975). In this study it is assumed
that the mirror and description will remind subjects of
their objective status on physical dimensions and, thus,
increase their objective awareness of their status on per
sonality dimensions.
In accordance with Duval and Wicklund's (1972) theory,
it is assumed that objective self awareness leads people to
recognize and then reduce their negative intra-self dis
crepancies. In the present study, it is, therefore, postu
lated that High OSA· .Mirror and Description subjects will
recognize and then reduce the discrepancy between their
idealized self report and their actual behavior. {This
process will, of course, be the one assumed to mediate High
OSA subjects' honest completion of the MMPI.) Consistent
with the theory of objective self awareness, it is hypo
thesized that rec~gnition of negative intra-self discrep
ancies will lead High OSA subjects to experience increased
states of negative affect. While takil1g the MMPI, High OSA
subjects are expected to feel more anxious, less happy,
experience their environment as more unpleasant and their
task as more difficult than Low OSA controls. These eff~cts
will be assumed to be reflected in subjects' scores on
several semantic differential scales administered after they
complete the MMPI. The semantic differe11tial, developed by
Osgood and his associates {Osgood, Suci and Tannenbaum,
Pfau 39
1957) presents subjects with a seven point scale anchored
at the extremes with bipolar adjectives (e.g., good-bad,
strong-weak, active-passive}. Subjects are asked to rate
a particular stimulus object by checking a point along the
scale continuum. Factor analytic studies, summarized by
Osgood (1962), have shown that semantic differential scales
generally load on one of three factors: the "evaluative"
(good-bad). factor, the "potency" (strong-weak) factor and
the "activity" (active-passive) factor. Numerous studies
have demonstrated the overall validity, reliability and
usefulness of the semantic differential (Nunnally, 1961;
Osgood, 1962; Osgood et. al., 1957.) It is recognized that
semantic differential scales.are self report measures and
therefore vulnerable to faking. All subjects, experimental
and control, will therefore complete these scales under con
ditions .that foster self focused attention (in front of a
mirror) in hopes that more valid reports will .be elicited.
Recognition and reduction of.negative intra-self dis
crepancies are expected to have one further side effect that
can be easily measured. The mental operations associated
with discrepancy reduction should take a certain amount of
time. It is therefore hypothesized that the High OSA Mirror
and Description subjects will take more time to complete ·
their MMPI's than Low OSA controls. , .
. •
Pfau 40
To recapitulate, the major hypotheses to be tested by
this study are:
1. Subjects in the High OSA Mirror and Description
groups will complete the MMPI in a more frank and
objective manner than Low OSA controls. High OSA
subjects will fake good less than Low OSA controls.
These effects will be reflected in the validity
scale scores of subjects in the following manner:
a) High OSA subjects will have lower K-Scale
scores than controls.
b) High OSA subjects will have higher F-Scale
scores than controls.
c) High OSA subjects will have higher F minus K
Index scores than controls.
2. High OSA subjects will take more·time to complete
the MMPI than Low OSA controls.
3. High OSA subjects will experience more negative
affect while completing the MMPI than Low OSA . .
controls. Semantic differential scales will show
High OSA subjects to be more anxious, less.happy,
experience their environment as more unpleasant!
and their task as more difficult than Low OSA
controls.
Pfau 41
4. There will be no differences between the validity
scales scores, the time taken to complete the MHPI
or the negative affect scores of subjects in the
different High OSA conditions. That is, no differ
ences are expected between the High OSA Mirror and
the High OSA Description group.
METHOD
Subjects.
The subjects were 66 undergraduate volunteers from
introductory psychology classes. Twenty-nine were males~
37 were females. Six subjects, one from Condition I (High
OSA-Mirror), two from Condition II (High OSA-Description)
and three from Condition III (Low OSA-Control) were deleted
from the study sample because they evidenced significant
psychopathology. The criterion for deletion, established
before the start of the experiment was one or more MMPI
clinical scales over a T-score of 80 without the addition
of the K correction. The ages of the 60 subjects that re
mained in the study sample ranged from 17 to 22 with their
mean age being 18.27 and the standard deviation being 0.45.
Measures.
A. Booklet Form-R of the Minnesota Multiphasic Personality
Inventory (MMPI) .
B. Self Report Follow-up Schedule (Pfau, 1978 see Appendix A).
The Self Report Follow-up Schedule (SRFS) consists of six .
seven point semantic differential scales. It was designed
for use in thfs experiment as a measure of subjects'. af
fective state while taking the MMPI.
42

pfau 43
Twelve MMPI scale scores were obtained for each subject: L,
F, K, Hs (Hypochondriasis), D (Depression), Hy (Hysteria),
Pd (Psychopathic Deviate), Pa (Paranoia), Pt (Psychasthenia),
Sc (Schizophrenia), Ma (Mania) and Si (Social Introversion).
In addition, Gough F minus K Index scores were computed.
Five measures of negative affect were obtained from
the semantic differential scales contained in items 1 through
3 on the Self Report Follow-up Schedule. Each subject was
scored for his report of anxiety while taking the MMPI (Item
la), his report of unhappiness while taking the MMPI (Item
lb), his rating of testi~g room unpleasantness (Item 2) and
his rating of task difficulty (Item 3). Scores on these.
items could range from one to seven with seven representing
the extreme negative affect pole on each scale. A "total
negative affect" score was also obtained for each subject by
computing the sum of his scores on items la, lb, 2 ·and 3.
Thus, total negative affect scores could range from a low of
4 to a high of 28.
Subjects in Condition I (High OSA-Mirror} and Condi
tion II (High OSA-Description) also received scores for their
report of noticing the self focusing stimuli presented to
them {i.e.: the mirror or the physical description) and the
str~ngth of their.reaction to the self focusing stimuli.
These measures were obtained from Items 4 and 5 on the Self
Report Follow-up Schedule. The keying of the semantic dif-
pfau 44
ferential scales of Items 4 and 5 was opposite that of the
other scales in the Schedule. Thus, for these two items 7
represented the "noticed frequently" and "reacted strongly"
poles of the continuum; 1 represented the "noticed infre
quently" and "reacted hardly at all" poles.
In addition to the scores mentioned above, the time
in minutes to complete the MMPI was recorded for all sub
jects.
Procedure.
Subjects were stratified by sex and randomly assigned
to one of three conditions. Conditions I and II were ijigh
Objective Self Awareness experimental conditions; Condition
III was a Low OSA control condition. Twenty subjects were
assigned to each condition. Eight,males and 12 females wer~
in Condition I (High OSA-Mirror); 10 males and 10 females
were in Condition II (High OSA-Description); eight males and
12 females were in Condition III (Low OSA-Control).
All subjects were asked to complete the MMPI with the
following verbal instructions: "This is a personality ques
tionnaire. I would like you to answer questions 1 through
399 and tell me when you are done. I will be in room 1036
down the hall where you checked in. There is no identifyi~g
information on your answer sheet, so all the results are
anonymous and confidential. I will not be able to report to
you the results of your test.'' After givi~g these instruc-
pfau 45
tions, the experimenter left the room. All subjects com
pleted the MMPI while seated at a desk in a small, comfort
able room.
The differences between the conditions were as follows.
In Condition I (High OSA-Mirror) subjects completed the MMPI
while seated before a large conspicuous mirror. The mirror
was a two-way vision mirror built directly into the wall of
the room. The way the lighting was arranged, subjects could
see only their own reflections and nothing in .the adjoining
room.
In Condition II (High OSA-Description) subjects com
pleted the MMPI while seated before a la~ge handwritten des
cription of their physical characteristics. This descript~on
included height, weight, age, hair color, eye color, sex and
race (Appendix B) • The description information was obtained
verbally from the subjects by the experimenter. The experi
menter recorded the information in bold letters on the phys~
ical description sheet and then tacked the sheet to a board
directly in front of the subject. No explanation for this
procedure was offered to the subjects. If a subject re
quested an explanation· (which surprisingly occurred only a
few times), he was told that everythi~g would be explained
after the experiment was over. After the physical descrip
tion was affixed in front of the subject, he was given the
standard instructions and asked to complete the MMPI.
pfau 46
In Condition III (Low OSA-Control) subjects completed
the ~~PI under normal conditions without being presented
with a mirror or a physical description.
It should be noted that subjects in all three condi
tions completed the .HHPI in almost identical rooms. That
is, all the rooms contained a two way mirror. In Condi
tions II and III the mirror was covered completely with
heavy wrapping paper and subjects were seated with their
backs to it. Subjects in Condition II had only the physical
description in their line of sight. Subjects in Condition
III had a blank wall in front of them.
After completing the MMPI all subjects reported to
another room where the experimenter was located. At this
point, the time subjects took to complete the MMPI was re
corded unobtrusively. Subjects were seated at a large table
in front of a large mirror similar to those in the other
rooms. The experimenter also was seated at this table per
pendicular to the subjects. Subjects were then asked to
complete the Self Report Follow-up Schedule which was en
titled only with the university's code name for the experi
ment (i.e.: Experiment Arizona). Subjects in Experimental
Conditions I and II completed all the it.ems: 1 through 5.
For subjects in Condition I (High OSA-Mirror), items 4 and
5 had the words "physical description" blacked out so these
items read "How frequently did you notice the mirror in
pfau 47
front of you? 11 and "Ho-w did you react to the presence of
the mirror?" respectively. For subjects in Condition II
(High GSA-Description) items 4 and 5 had the word 11 mirror"
blacked out so the items read "How frequently did you notice
the physical description in front of you?" and "Hov-1 did you
react to the presence of the physical description? .. respec
tively. Subjects in Condition III (Low OSA-Control) were
asked to complete only items 1 through 3.
After completing the Self Report Follow-up Schedule
subjects were given a Debriefing Sheet (Appendix C) to read.
The Debriefing Sheet explained the rationale of the experi
ment and contained relevant information regarding the MMPI.
After they had read the Debriefing Sheet any further ques
tions subjects had were answered. They were then thanked
and released.
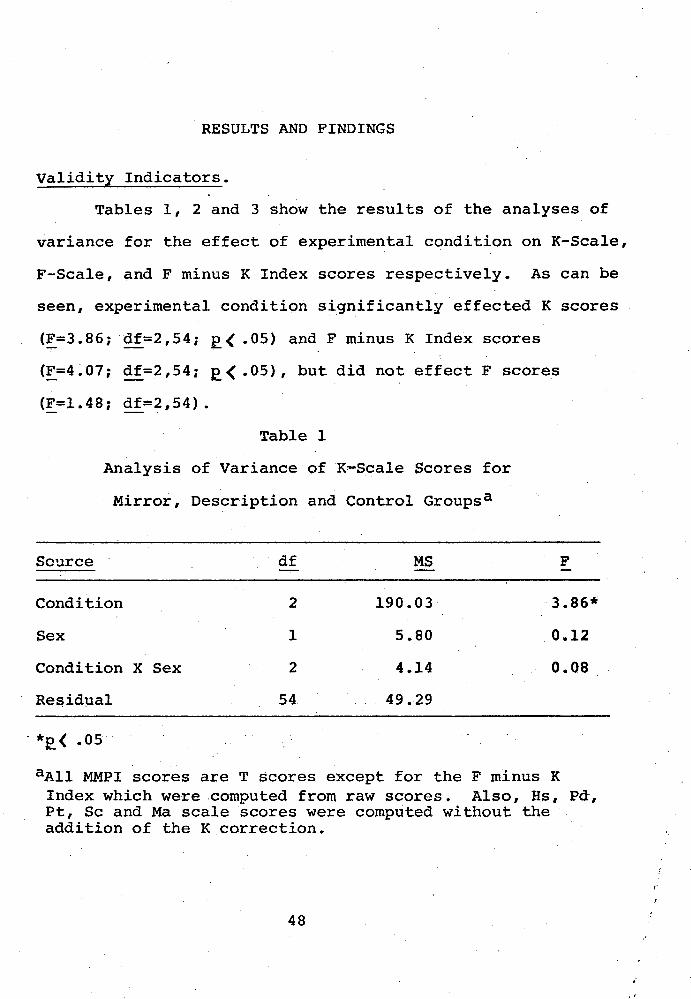
RESULTS AND FINDINGS
Validity Indicators.
Tables 1, 2 and 3 show the results of the analyses of
variance for the effect of experimental condition on K-Scale,
F-Scale, and F minus K Index scores respectively. As can be
seen, experimental condition significantly effected K scores
(F=3. 86; df=2, 54; E.< . 05) and F minus K Index scores
(F=4.07; df=2,54; p( .05), but did not effect F scores
(F=l.48; df=2,54).
Table 1
Analysis of Variance of K~scale Scores for
Mirror, Description and Control Groupsa
Source df MS F
Condition 2 190.03 3.86*
Sex 1 5.80 0.12
Condition X Sex 2 4.14 0.08
Re~id-ual 54 49.29
· *e_( .OS
aAll MMPI scores are T scores except for the F minus K Index which were computed from raw scores. Also, Hs, Pd, Pt, Sc and Ma scale scores were computed without the addition of the K correction.
48
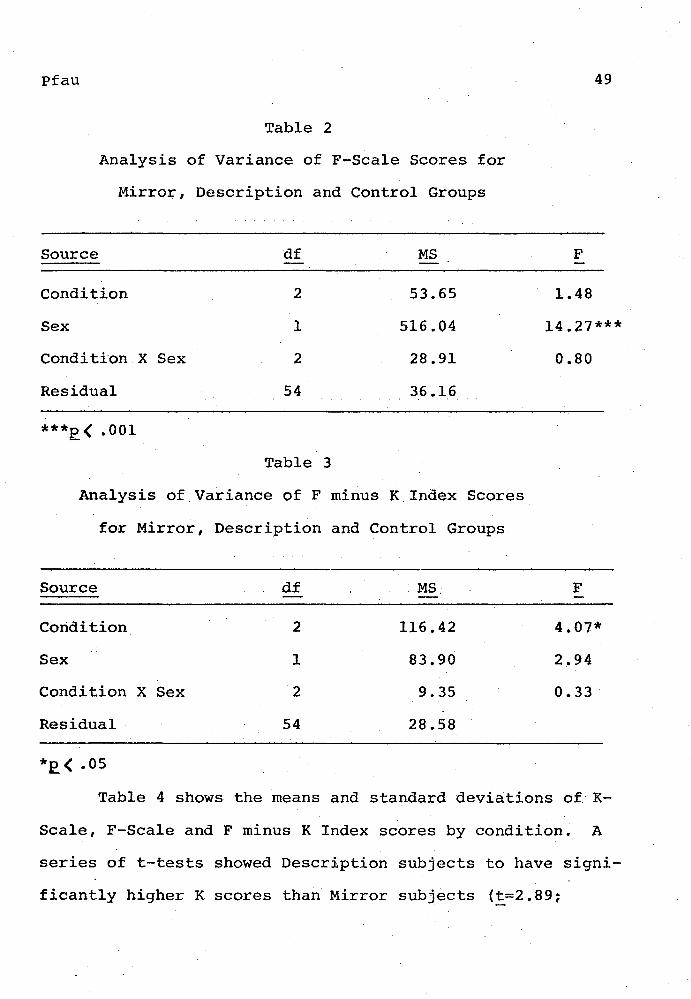
Pfau
Table 2
Analysis of Variance of F-Scale Scores for
Mirror, Description and Control Groups
Source
Condition
Sex
Condition X Sex
Residual
***p < .001
df
2
1
2
54
Table 3
MS
53.65
516.04
28.91
36.16
Analysis of Variance of F minus K Index Scores
for Mirror, Description and Control Groups
Source
Condition
Sex
Condition X Sex
Residual
*p < .05
df
2
1
2
54
MS.
116.42
83.90
9.35
28.58
49
F
1.48
14.27***
0.80
F
4.07*
2.94
0.33
Table 4 shows the means and standard deviations of·K
Scale, F-Scale and F minus K Index scores by condition. A
series of t-tests showed Description subjects to have signi
ficantly higher K scores than Mirror subjects (t=2.89;
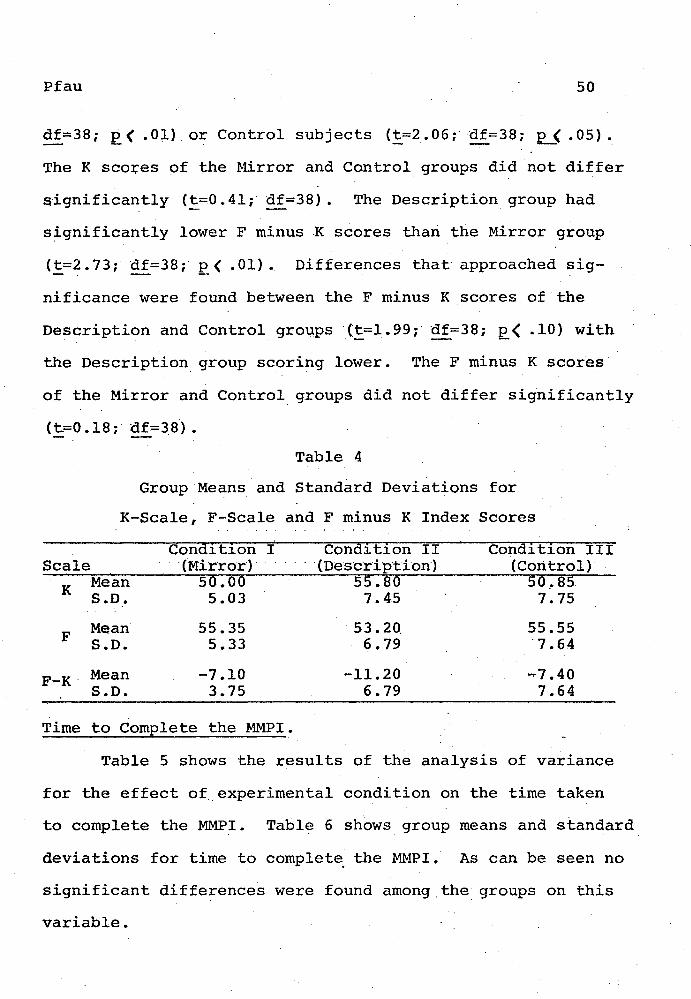
Pfau 50
df=38; p < .01) or Control subjects (t=2.06; df=38; E._{ .05).
The K sco~es of the Mirror and Control groups did not differ
significantly (t=0.41;· df=38). The Description group had
significantly lower F minus K scores than the Mirror group
(!_=2. 7 3; df=38; p ( . 01) . Differences that· approached sig-
nificance were found. between the F minus K scores of the
Description and Control groups ·(t=l.99;" df=38; p( .10) with . .
the Description. group scoring lower. The F minus K scores
of the Mirror and Control groups did not differ significantly
(t=O.l8; df=38).
Table 4
Group Means and Standard Deviations for
K-Scale, F-Scale and F minus K Index Scores
Condition I Condition II Condition III Scale · (Mir·ror·) · · ·(Description·) (Control)
K Mean 50.00 55.80 50 .• 85 S.D. 5.03 7.45 7.75
F Mean 55.35 53. 20. 55.55 S.D. 5.33 6.79 "7.64
F-K Mean -7.10 -11.20 -7.40 S.D. 3.75 6.79 7.64
Time to Complete the MMPI.
Table 5 shows the results of the analysis of variance
for the effect ofexperimental condition on the time taken
to complete the MMPI. Table 6 shows group means and standard
deviations for time to complet~ the ~~PI. As can be seen no
significant differences were found among.the groups on this
variable.
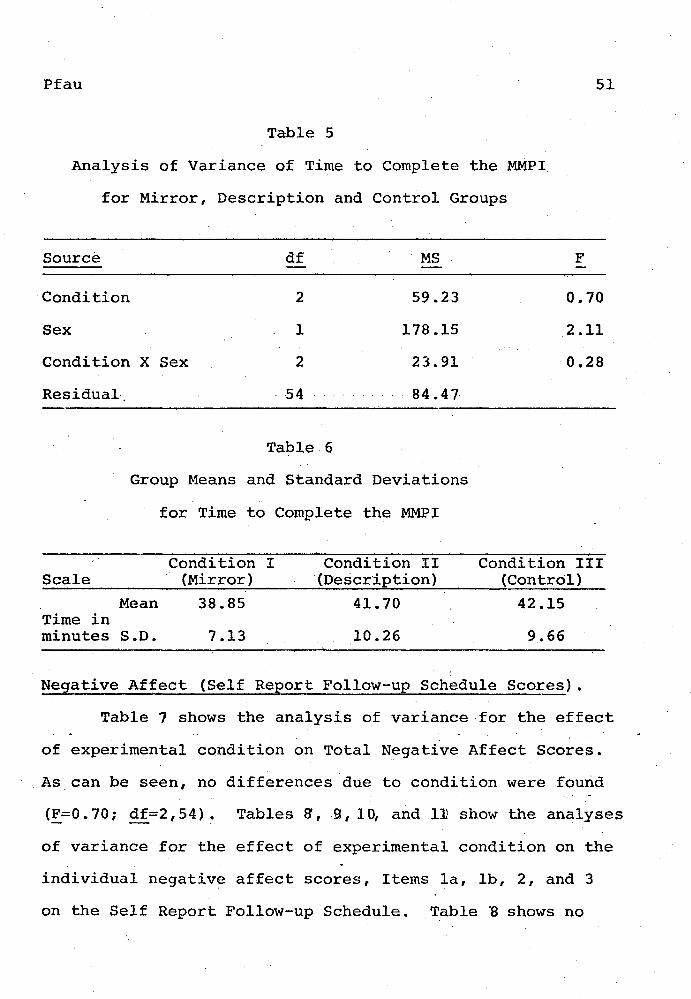
Pfau 51
Table 5
Analysis of Variance of Time to Complete the MMPI
for Mirror, Description and Control Groups
Source df MS F
Condition
Sex
Condition X Sex
2
1
2
54
59.23
178.15
23.91
84.47
0.70
2.11
0.28
Residual-
Table.6
Group Means and Standard Deviations
for Time to Complete the MMPI
Condition I Condition II Condition III Scale (Mirror) ·{Description) (Control)
Mean 38.85 41.70 42.15 Time in minutes S.D. 7.13 10.26 9.66
Negative Affect (Self Report Follow-up Schedule Scores).
Table 7 shows the analysis of variarice for the effect
of experimental condition on Total Negative Affect Scores.
As can be seen, no differences due to condition were fourid
(F=O. 70; df=2, 54) • Tables 8', 9, 10, and 112 show the analyses
of variance for the effect of experimental condition on the
individual negative affect scores, Items la, lb, 2, and 3
on the Self Report Follow-up Schedule. Table ·a shows no

Pfau 52
differences among the. groups an Item la, report of anxiety
while taking the MMPI {F=l.S8; ~f.=2,54). Table 9 shows
no differences among the. groups on Item 1b, report of un
happin~ss while taking the MMPI (F=l.l7; df=2,54). Table 10
shows no differences amo~g the. groups on Item 2, ratings of
testing room unpleasantness (F=0.29; d~=2). Table 11 shows
no differences among the groups on Item 3, rati~gs of task
difficulty (F=2.95; df=2,54), Table 12 shows the means and
standard deviations for negative affect scores by condition.
Table 7
.Analysis of Variance of Total Negative Affect Scores
for Mirror, Description and Control Groups
Source df . MS F
Condition 2 12.83 1.50
Sex 1 33.45 3.91*
Condition X Sex 2 19.64 2.30
Residual 54 8.55
*p < .05
·~
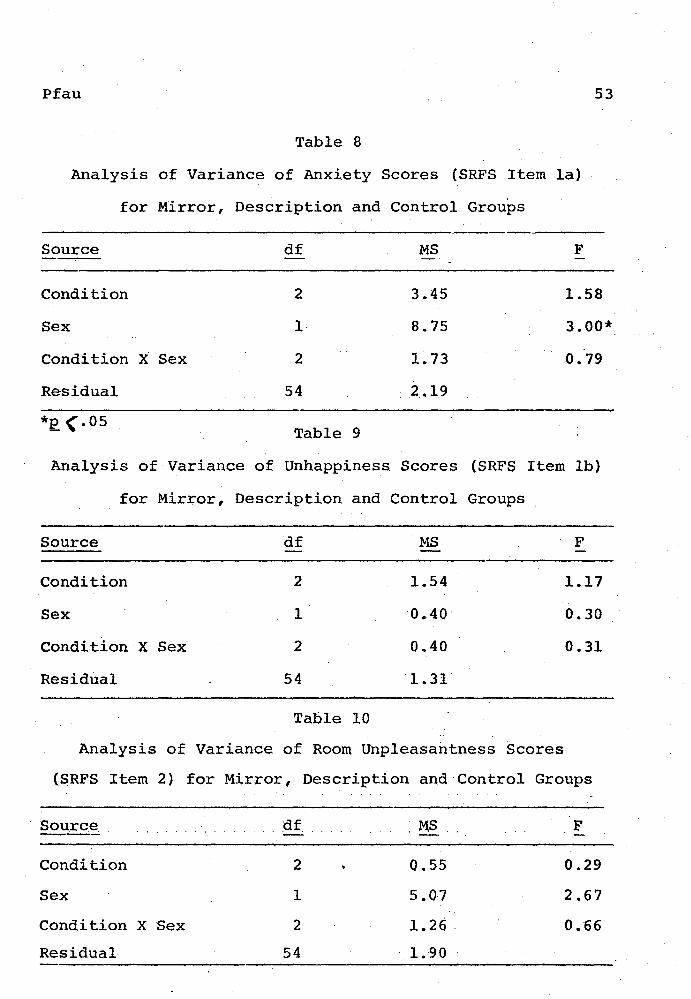
Pfau 53
Table 8
Analysis of Variance of Anxiety Scores (SRFS Item la)
for Mirror, Description and Control Groups
--------------------------------------------------Source df MS F -----
Condition 2 3.45 1.58
Sex 1 8.75 3.00*
Condition X Sex 2 1.73 0.79
Residual 54 2.19
*:e_(.05 Table 9
Analysis of Variance of Unhappiness Scores (SRFS Item lb}
for Mirror, Description and Control Groups
Source
Condition
Sex
Condition X Sex
Residual
df
2
1
2
54
Table 10
MS
1.54
0.40
0.40
1.31-
F
1.17
0.30
0.31
Analysis of Variance of Room Unpleasantness Scores
(SRFS Item 2) for Mirror, Description and Control Groups
Source ....... df MS F --- -Condition 2 0.55 0.29
Sex 1 5.0-7 2.67
Condition X Sex 2 1.26 . 0.66
Residual 54 1.90

Pfau 54
Table 11
Analysis of Variance of Task Difficulty Scores {SRFS Item 3}
for Mirror, Description and Control Groups
Source df MS
Condition 2 2.49
Sex 1 0.00
Condition X Sex 2 2.82
Residual 54 0.84
Table 12
Group Means and Standard Deviations
All Negative Affect Scores
Cond1.t1.on I Cond1t1.on II .(Description)
9.05 Scale {Mirror)
Mean 10.15 Total Nega-tive Affect S.D.
Anxiety Item la
Unhappiness Item lb
Mean
S.D.
Mean
S.D.
Room Mean Unpleasant-ness Item 2 S.D.
Task Diffi- Mean culty Item 3
S.D.
2.98
2.20
1.45
3.50
1.19
2.50
1.19
1.95
1.10
3.10
1.95
1.28
3.30
1.23 .
2.30
1.59
1.50
0.76
F
2.95
0.00
3.35
for
Cond1.t1.on III (Control) 10.40"
3.10
2.70
1.78
2.95
1.05
.2.55
1.36
2.20
0.95
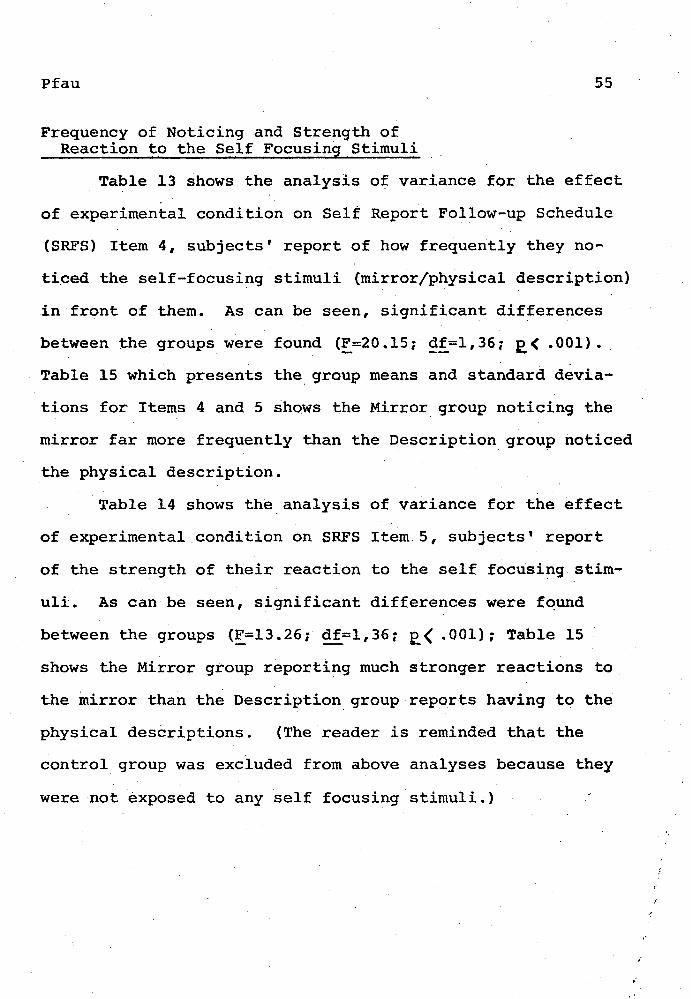
Pfau
Frequency of Noticing and Strength of Reaction to the Self Focusing Stimuli
55
Table 13 shows the analysis of variance for the effect
of experimental condition on Self Report Follow-up Schedule
(SRFS) Item 4, subjects' report of how frequently they no
ti.ced the self-focusing stimuli (mirror/physical description)
in front of them. As can be seen, significant differences
between the groups were found (!_=20.15; ~f=l,36; e< .001).
Table 15 which presents the. group means and standard devia
tions for Items 4 and 5 shows the Mirror. group noticing the
mirror far more frequently than the Description. group noticed
the physical description.
Table 14 shows the analysis of variance for the effect
of experimental condition on SRFS Item.S, subjects' report
of the strength of their reaction to the self focusing stim-
uli. As can be seen, significant differences were found
between the groups (F=13.26; d£=1,36; E_( .001); Table 15
shows the Mirror group reporting much stronger reactions to
the mirror than the Description group reports having to the
physical descriptions. (The reader is reminded that the
control group was excluded from above analyses because they
were not exposed to any self focusing stimuli.)
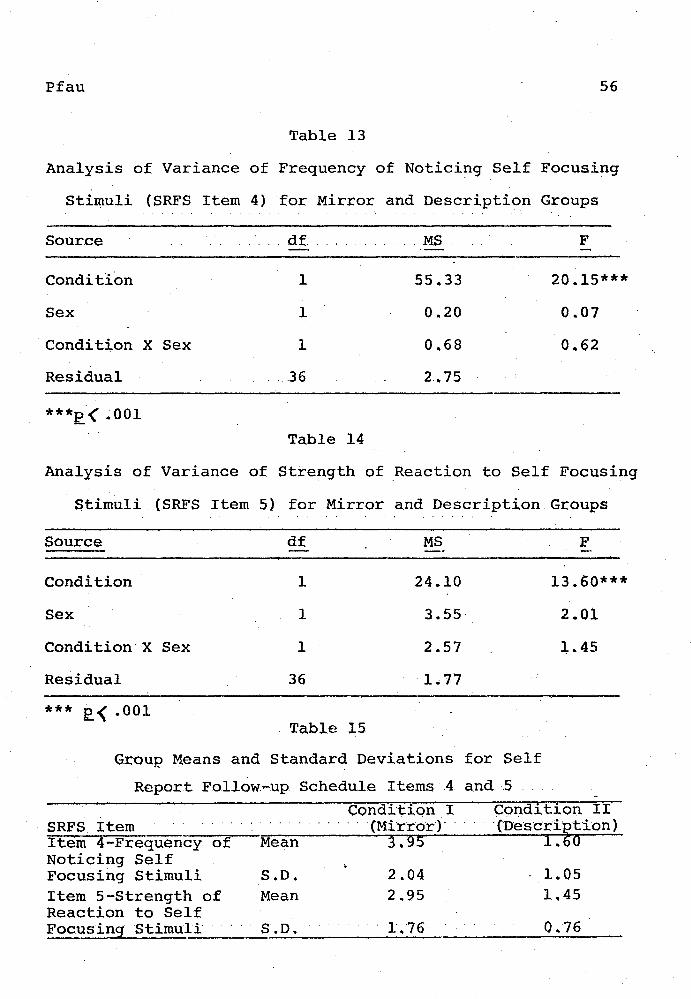
Pfau 56
Table 13
Analysis of Variance of Frequency of Noticing Self Focusing
Stillluli (SRFS Item 4) for Mirror and Description Groups
Source .· ... df .. : MS F
condition 1 55.33 20.15***
Sex 1 0.20 0.07
Condition X Sex 1 0.68 0.62
Residual . 36 2 .• 75
Table 14
Analysis of Variance of Strength of .Reaction to Self Focusing
Stimuli (SRFS Item 5) for Mirror and Description Groups
Source df MS F -
Condition 1 24.10 13.60***
Sex 1 3.55 2.01
Condition X Sex 1 2.57 ],..45
Residual 36 ·1.77
*** p < .001 Table 15
Group Means and Standard Deviations for Self
Report Follow~up Schedule Items .4 and .5
SRFS Item Item 4-Frequency of Noticing Self Focusing Stimuli Item 5-Strength of Reaction to Self Focusing Stimul_i_· __
Mean
S.D. Mean
S.D.
Condition.! · · · · · · · (Mirr·or·) · ·
3.95
2.04 2.95
1'.76
CondJ..tJ..on II ·cnesc·riti·ion)
1. 0
1.05 1.45
0.76
Pfau 57
Intercorrelations Amon2 the Major Study Variables
Table 16 shows the intercorrelations of K-Scale ,· F
Scale, F minus K Index, Total Negative Affect, time to com-
plete ·the MMPI, SRFS Item 4 and SRFS Item 5 scores.
~ -. . . . ..
Other MMPI ScaTes
Analyses of variance for the effect of experimental
condition on each MMPI clinical scales (Hs, D, Hy, Pd, Pa,
Pt, Sc, Ma and Si) and the L-Scale were conducted. No dif-
ferences due tc, condition were found for L, D, Hy, Pd, Pa,
Sc or Ma scale scores. Significant differences due to ex
perimental condition were found for the Hs, Pt, and Si scale
scores. The results of the analyses of variance for t;.he
effect_of experimental condition on Hy, Pt, and Si scores
are presented in Tables 17, 18, and 19 respectively. Table
20 shows the means and standard deviations for these scores
by condition.
A series of.t-tests showed the Description group to
have significantly lower Hs scores the Mirror group (t=:=3. 33;
df=38.; e_( • 01) or the Control group (t=2. OS; df=38; e_ ( .• OS) •
Hs scores of the Mirror and Control groups did not differ
significantiy (t=0.95; df=38).
,.
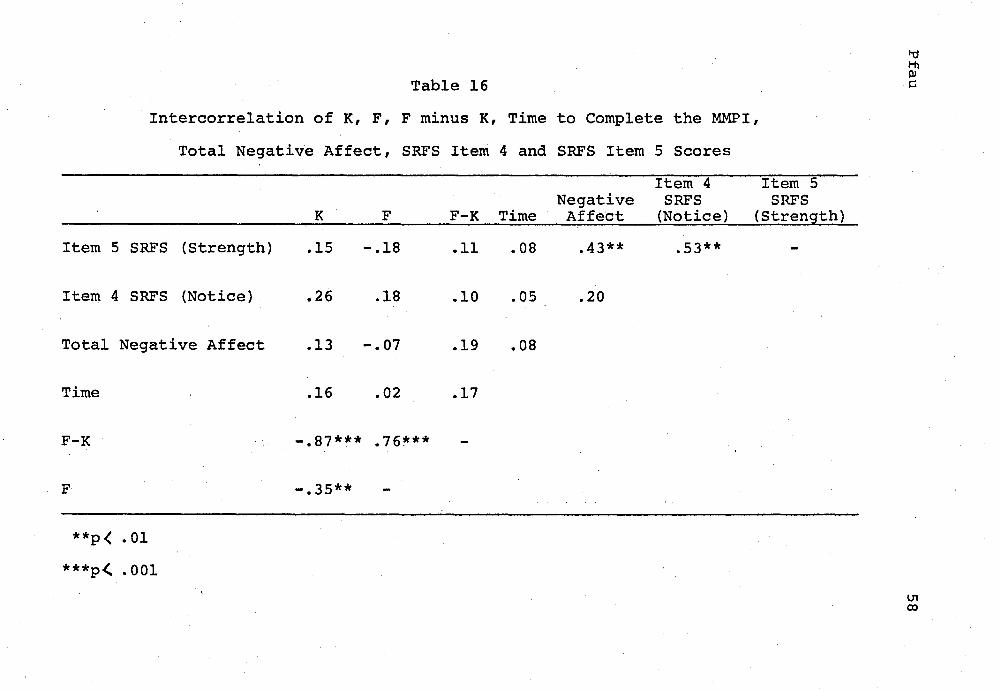
Table 16
Intercorrelation of K, F, F minus K, Time to Complete the MMPI,
Total Negative Affect, SRFS Item 4 and SRFS Item 5 Scores
Item 5 SRFS (Strength}
Item 4 SRFS (Notice)
Total Negative Affect
Time
F-K
F
**p< .01
***p<. . 001
K F
.15 -.18
.26 .18
.13 -. 07
.16 .02
-.87*** .76***
-.35**
Item 4 Negative SRFS
F-K Time Affect (Notice}
.11 .08 .43** .53**
.10 .OS .20
.19 .08
.17
Item 5 SRFS
(Strength}
V1 (X)
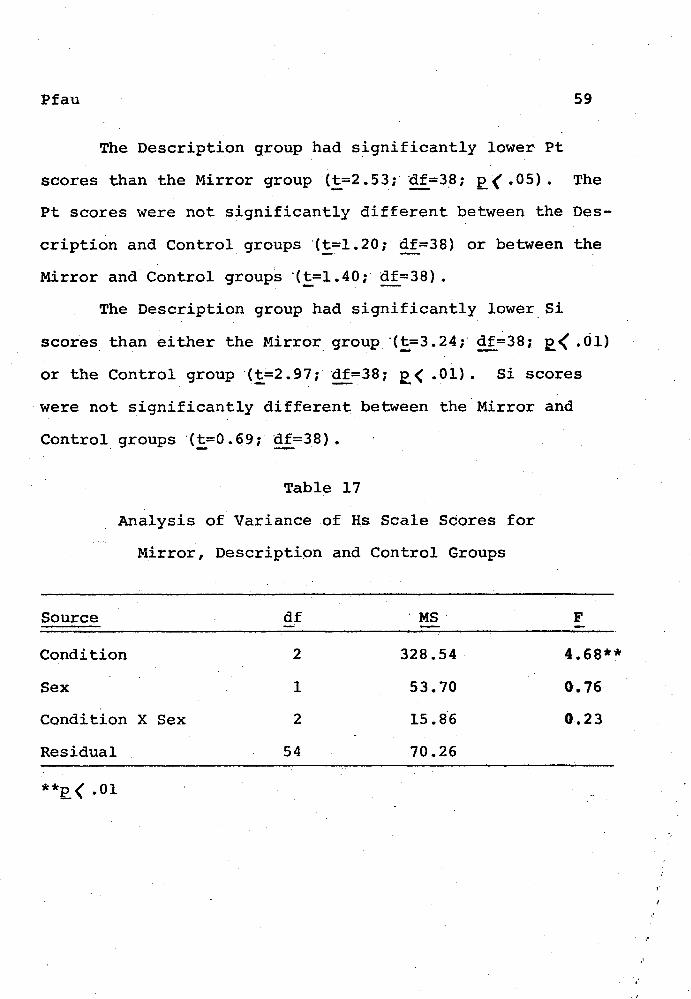
Pfau 59
The Description group had significantly lower Pt
scores than the Mirror group ·<~=2 .53;" "df=3.8; e. (.OS). The
Pt scores were not significantly different between the Des
cription and Control groups ·(~=1.20 ;" df=38) or between the
Mirror and Control groups "(!_=1.40;" df=38).
The Description group had significantly lower Si
scores than either the Mirror group ·(~3.24;- df,.;,38; E.< .01)
or the Control group ·(t'=2. 97; df=38 ;- 12. ( • 01) • Si scores
were not significantly different between the Mirror and
Control groups ·(!_=0. 69 ;" ~=38) •
Table 17
Analysis of Variance of Hs Scale Scores for
Mirror, Description and Control Groups
Source df . MS ·
Condition 2 328.54
Sex 1 53.70
Condition X Sex 2 15.86
Residual 54 70.26
**p < .01
F
4.68**
0.76
0.23
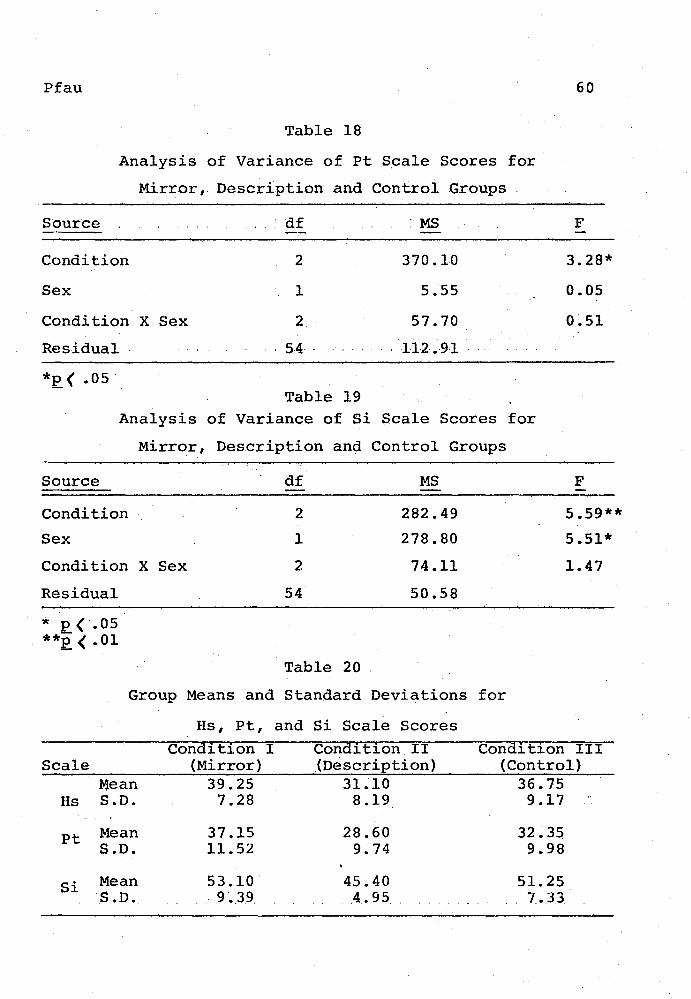
Pfau
Table 18
Analysis of Variance of Pt S~ale Scores for
Mirr.or, Description and Con.tr.ol Groups
s·ource df : MS
Condition 2 370.10
Sex 1 5.55
Condition X Sex 2 57.70
Residual 5-4- 1-12-.-91
Table 19
Analysis of Variance of Si Scale Scores for
Mirror, Des.cription and Control Groups
Source df MS
Condition 2 282.49
Sex 1 278.80
Condition X Sex 2 74.11
Residual 54 50.58
* p < ·.o5 **E: < .o1
Table 20
Group Means and Standard Deviations for
Hs, Pt, and Si Scale Scores Condition I Condition II Condition
60
F
3.28*
0.05
0.51
F
5.59**
5.51*
1.47
III Scale (Mirror) (Description) (Control)
Mean 39.25 31.10 36.75 Hs S.D. 7.28 8.19 9.17
Pt Mean 37.15 28.60 32.35 S.D. 11.52 9.74 9.98
Si Mean 53.10 45.40 51.25 S.D. .. 9 .•. 39. 4.95 .. 7 .• 33
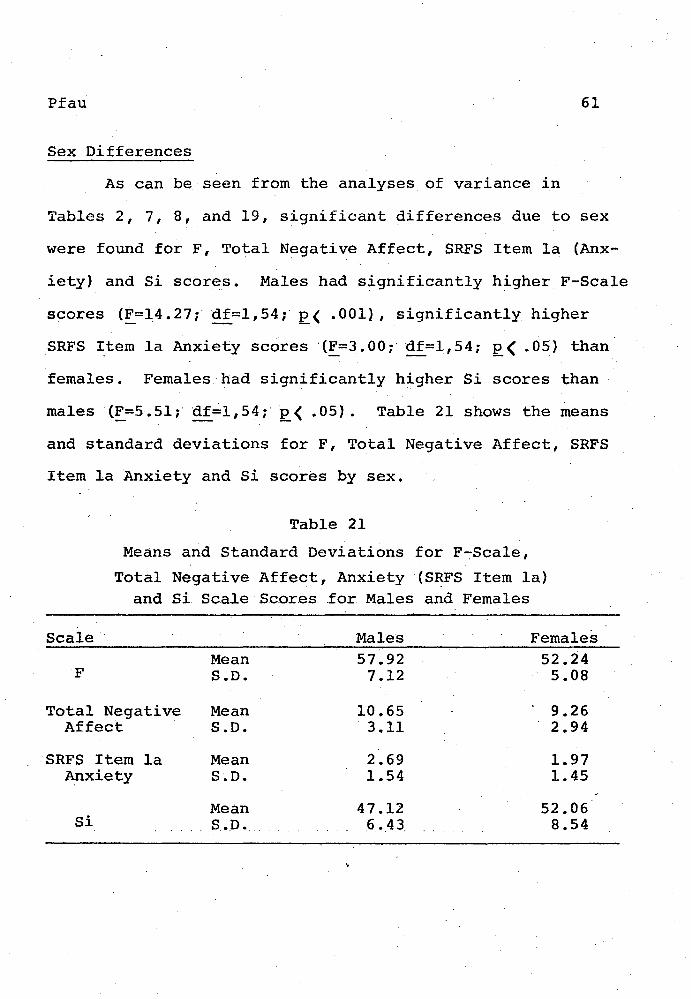
Pfau 61
Sex Differences
As can be seen from the analyses of variance in
Tables 2, 7, 8, and 19, significant differences due to sex
were found for F, Total Negative Affect, SRFS Item la (Anx
iety) and Si scores. Males had s~gnificantly higher F-Scale
scores (F=14. 27; df=l, 54;' p ( . 001) , significantly higher
SRFS Item la Anxiety scores '(F=3.00;" df=1,54; p( .05} than
females. Females had significantly higher Si scores than
males ·(F=S·.Sl;· df;l,54;' p ( .OS). Table 21 shows the means
and standard deviations for F, Total Negative Affect, SRFS
Item la Anxiety and Si scores by sex.
Table 21
Means and Standard Deviations for F~Scale,
Total Negative Affect, Anxiety (SRFS Item la) and Si. Scale Sc.or.es .for Males and Females
Scale Males Females Mean 57.92 52.24
F S.D. 7.12 5.08
Total Negative Mean 10.65 9.26 Affect S.D. . 3.11 2.94
SRFS Item la Mean 2.69 1.97 Anxiety S.D. 1.54 1.45
Mean 47.12 52.06 Si . s . .D •. 6 •. 43 . 8.54
DISCUSSION OF THE RESULTS AND FINDINGS
The Validity Indicat·o·rs
The results failed to confirm Hypothesis 1 which
stated that subjects in the High·osA conditions, the Mirror
and Description groups, would complete the·MMPI in a more
frank .and objective manner than subjects in the Low OSA
control group. The H~gh·osA Mirror group achieved K-Scale,
F-Scale, and F minus K Index scores that were essentially
the same as those of the Low OSA control group. The High
OSA Description group, while achieving F-Scale scores no
different than those of the Mirror and control groups,
· achieved significantly higher K-Scale scores and signifi
cantly lower F minus K scores than either of the other two
. groups. This finding is in direct contrast to Hypothesis 1
and appears to indicate that rather than being more frank
and objective in their completion of the MMPI, the Descrip
tion group was actually less honest and more defensive than
the Mirror or control. groups.
The.finding that the Mirror group did not differ from
controls on any validity scale scores fails to corroborate
the results of Pfau (1976) who found-that High OSA Mirror
subjects had lower K, higher F, and higher F minus K. scores
than Low OSA controls. Comparfson of Pfau's {1976) results
(Appendix D) with the results of the present study shown in
62
Pfau 63
Table 4 reveals that the .Hirror groups in both experiments
had essentially the same K-Scale, F-Scale and F minus K
Index scores. It is the validity scale scores of the con-
trol groups of the two studies that differ markedly and
consistently. Pfau's (1976) control group seemed to fake
good more than the control group in the present study: their
K scores were higher ·(t=l.76;' df=33; p( .10), their F scores
were lower (t=l.72;' df=38; p( .10), and their F minus K
scores were significantly lower (t=2.30;' df=33;- E_( .OS) than
those of the controls in this study. Thus, it is the differ-
ences between the two studies' control groups and not differ-
ences between their Mirror groups that seems to account for
their disparate results.
The question now becomes: what differences in the ex-
perimental methods of the two studies might have contributed
to the demonstrated control group differences. No explana.
tion seems readily apparent. The experimental procedures of
the two studies, at least insofar as they were applied to
the Mirror and Control groups, were essentially the same.
Both experiments employed volunteer undergraduate psychology
students from LoyolaUniversity of Chicago as subjects, re-. ..
ducing the likelihood that the studies' samples differed on
any important demographic variables. Both experiments were
carried out in the same labora~ory, reducing the likelihood
that extraneous environmental variables might have differed
Pfau 64
significantly. The fact that the studies were carried out
within 18 months of each other reduces the likelihood that
the socio-political tenor of the youth subculture had
changed to the extent that it might affect subjects' scores
on a test like the MMPI.
The only salient differences between the two studies
are these: 1) Pfau's (1976) subjects completed the MMPI as
par·t of a psychol~gical· test battery which also included
the Rorschach and TAT. Subjects in the present study com
pleted only the MMPI. 2} Pfau's (1976) subjects were aware
prior to volunteering that their experiment would involve
taking a number of personality tests which would be admin
istered by clinical psychology. graduate students. Subjects
in the present experiment had no prior knowledge of the type
of psychological experiment for which they had volunteered.
3) Pfau's (1976) subjects volunteered for an expe~iment they
knew would last three hours. Subjects in the J?iesent study
volunteered for an experiment they knew would last only one
hour.
It is not intuitively obvious how any of these selec
tion differences might account for Pfau's (1976) control
group being more "defensive" than the present study's con
trol group. In fact, examining these selection differences
in isolation might lead one to·expect the present study's
controls to be more defensive. Present controls had a per-
Pfau 65
sonality test "~prung" on them; this could conceivably in-
crease their anxiety and defensiveness, especially if they
had expected a different type of task. Pfau's (1976) con-
trols knowingly volunteered to take not one, but a battery
of psychological tests. It seems likely, therefore, that
highly defensive subjects never would have volunteered for
Pfau's (1976) experiment in the first place and were thus
pre-selected out of the study sample. The subjects who did
volunteer seem more likely to have been unusually open and
self disclosing, than defensive and constricted. Of course,
the possibility does exist that Pfau's (1976} sample con-
sisted of many highly defensive, overly self confident
people who volunteered to take a battery of personality
tests to exhibit just hm,:r "well adjusted" they were. This
type of test taking attitude might engender a faked good
protocol and could conceivably account for the validity
scale configuration differences noted between the two
control groups.*
*The reader might note that even when Pfau's (1976} sample and the present sample were combined, the Mirror group did not differ significantly from the control group with respect to K, F or F minus K scores (see Appendix E).
Pfau 66
The finding that the High OSA Desc~iption group faked
good to a greater extent than either the Mirror or control
groups fs also difficult to explain. One could simply as
sume that Duval and Wicklund's (1972) theory of objective
self awareness is amiss; and, that self focused attention
has no effect on self report validity, but the~ one would
have to explain why the K and F minus K scores ot the Des
cription group were not simply the same as those of the
other two groups. Alternately, one m~ght assume the theory
of objective self awareness to be valid, but postulate that
the physical description placed before the Description sub
jects was simply not a salient enough stimulus to promote .
self focused attention. Some evidence to support that this
might have been the case is presented in Table 15 which shows
Description subjects reporting that they noticed the physi
cal descriptions less frequently and reacted to them less
strongly than the Mirror. group noticed or reacted to the
mirror. However, even if one assumed these reports to be
accurate and accepted that the physical descriptions. were
lacking in saliency, one would still be left with explaining·
why Description subjects did not have K and F minus K scores
similar to those of controls.
The issue of stimulus saliency bri~gs another expla
nation to mind. Perhaps, rather than being a less potent
self focusing stimulus than the mirror, the physical des-
Pfau 67
cription was even more potent. It has been assumed, thus
far, that the relationship between self focusing stimuli
potency and the degree of self focused attention is linear
and continuous:.the more potent the self focusing stimulus,
the more self focused attention it promotes. It may be,
however, that the relationship between stimulus saliency or
potency and the degree of self focused attention is neither
linear or continuous. It is possible that low-salient stim
uli promote very little self focused attention, moderately
high salient stimuli promote a good deal of self focused
attention, but that very high salient stimuli promote even
less self focused attention than low salient stimuli. A
clinical example serves to illustrate this relationship.
A psychotherapist has very little chance of promoting self
exploration in a client if he does not challenge or confront
the client at all. His chances of promo~ing self explora
tion in the client become greater if he chal_lenges and con
fronts the client to a moderate degree. However, if the
therapist challenges or confronts the client too soon or
too strongly, rather than overcoming the resistance, he may
cause the client to become even more defensive than i.f he
had said nothing at all. Thus, it may be that the physical
description made Description subjects so self conscious
that they became more defensive than they wou.ld have been
if they, like the control subjects, were presented with no
self focusing stimuli at all.
Pfau 68
Some evidence may be adduced to support this formula
tion~ First, an examination of the experimental procedure
shows that, at least on the face of things, Description
subjects were presented with a far more salient self focus
ing stimulus than the Mirror group. Before completing the
MMPI,Description. subjects were asked their he~ght, weight,
eye color, hair color, age, sex and race. They then watched
as the exper~menter recorded this information in unusually
bold print and affixed the physical description sheet in
front of them without any explanation of purpose. Assuming
the usual level of suspiciousness in psychology experiment
participants, it is hard to believe that these subjects did
not notice or wonder about the physical descriptions in
front of them. It seems more likely that they thought the
experimenter was engaging in some type of.ruse or deception,
and that this made them uncomfortable and self conscious.
Mirror subjects, on the other hand, were asked no unusual
questions and probably had little idea that the mirror in
front of them was even part of the experimental manipulation.
After all, the mirror, rather than being an unusual or con
spicuous addition, seemed to be a permanent fixture of the
laboratory environment that was only coincidentally in their
visual field. Given these procedural differences, it is ·
not unreasonable to assume different degrees ~f suspicious
ness, self consciousness and defensiveness between the
Mirror and Description groups.
Pfau 69
Of course, the data presented in Table 15 seem, on
the surface, to contradict the argument that the physical
description made subjects so self conscious that they became
more defensive in their completion of the MMPI. This data
shows Description subjects reporting that they hardly noticed
or reacted to the physical description at all. On a seven
point scale (one representing the "noticed infrequently" and
"reacted hardly at all" pole of the continuum, seven repre
senting the "noticed frequently" and ''reacted strongly"
pole), Description subjects attained a group mean of 1.60
and a standard deviation of 1.05 for their frequency of
noticing the physical description and a mean of 1.45 and a
standard deviation of 0.76 for the strength of their reaction
to the description. The extremity and lack of variability
in these scores coupled with the saliency_ of the experimental
_procedure surrounding the use of the physical descriptions
leads one to suspect that Description subjects simply were
not reporting accurately about their reaction to·the physical
descriptions. (It is h~rdly necessary at·this point tore
mind the reader that self reports are often inaccurate.) To
use another clinical analogue, it appears that Description
subjects employed the defense mechanism of reaction forma
tion: rather than reporting that the physical descriptions
affected them greatly, (as the validity scale results indi
cate) they reported not having been affected at all.
Pfau 70
One more important point should be noted. The hypo
thesis that High OSA subjects would fake good less than Low
OSA controls was predicated on the assumption that college
aged populations do, indeed, have a tendency to fake_ good.
It was assumed, in other words, that under·normal conditions
the subjects employed in this study would have higher K
Scale scores than F-Scale scores. The basis for this assump
tion comes not only from clinical lore, but from research
(Exner et. al., 1963; Gough, 1950; Hunt, 1948). Dahlstrom,
Welsh and Dahlstrom (1972) state explicitly in the MMPI
Handbook that college students_ generally achieve F scores
comparable to those of the general population, but achieve
K scores that are higher by almost one standard deviation.
Thus, it was surprising to find that in the present study
F-Scale scores were higher than K-Scale scores for the Mirror
. group, the control group and the study sample taken as a
whole. The Mirror group had a mean F score of 55.35 and a
mean K score of 50.00. The control group had a mean F score
of 55.55 and a mean K score of 50.85. The study sample of
60 subjects had a mean F score of 54.70 and a mean K score
of 52 •. 22. Only the Description group had mean F lower than
mean K. Their mean F score was 53.20 and their mean K score
was 55.80. In short, it appears that the college students
employed as subjects in this study were more likely to fake
bad than fake good.
Pfau 72
their negative intraself discrepancies (i.e.: their faults}.
The finding that a normal group, college aged or otherwise,
had a tendency to admit to these negative discrepancies
represents a_ gap in the theory rather than a confirmation
of it.
Time to Complete the MMPI
The results failed to confirm Hypothesis 2 which
stated that the High OSA groups would take more time to
complete the MMPI than the Low OSA control_ group. As can
be seen from Tables 5 and 6, almost no differences at .all
were found amo~g the three groups on their time taken to
complete the test.
Hypothesis 2 was, of course, predicated on the assump
tion that the Mirror and Description groups would be. stimu
lat~d to become objectively self aware anq complete their
MMPI's in a more frank and honest manner than controls.
This increased objectivity, it was thought, would be medi
ated by the process of discrepancy reduction. It was fur
ther thought that the mental operations associated with
discrepancy reduction would take time. However,_ given the
results discussed in the previous section, it would be fal
lacious to assume that either of the High OSA_ groups actu
ally experienced increased states of objective self aware
ness or undertook any intrapsychic processes that might be
likened to discrepancy reduction. Thus, while it may be
,.
Pfau 73
true that objective self awareness increases the time that
subjects take to complete self report measures, the present
results preclude any direct confirmation or disconfirmation
of this, formulation. What can be said is that subjects who
fake_ good (the Description_ group) seem to take no less time
to complete self report measures than subjects who answer
more honestly.
Negative Affect
The results failed to confirm Hypothesis 3 which stated
that subjects in the High OSA_ groups would experience more
negative affect while taking the MMPI than Low OSA controls.
The results contained in Tables 7, 8, 9, 10, and 11 show no
differences among the three groups for d~gree of total neg
ative affect experienced, d~gree of anxiety experienced,
degree of unhappiness experienced, ratings of environment
unpleasantness or rati~gs of task difficulty.
Like Hypothesis 2,.Hypothesis 3 was predicated on the
assumption that objective self awareness would be heightened
in the Mirror and Description groups. It·would then follow,
accoroing to OSA theory, that subjects in these_ groups woulQ.
experience the negative affect associated with the rec~gni
tion of negative intraself discrepancies. Given that we
have no reason to believe that objective self awareness was
heightened in either the Mirror or Description group, the
finding that no differences were found amo~g any of the
Pfau 74
study groups on the degree of negative affect experienced
should come as no surprise. While states of objective self
awareness m~ght lead to increased experience of negative
affect, the present results preclude any direct confirmation
or disconfirmation of this formulation. Again, what can be
said is· that· subjects who fake good on self report measures
like the MMPI seem to experience no_ greater or lesser
degrees ·of ne~ative affect than subjects who complete the
measures in a more frank and objective manner.
Similarities vs. Differences in the High OSA Groups
In essence, the results failed to confirm Hypothesis 4
which stated that there would be no differences between the
validity scale scores, the time taken to complete the MMPI,
and the negative affect scores of the two High OSA groups.
As has a-lready been noted, the Mirror arid Description groups
differed significantly on two of the three validity indica
tors examined. Description subjects had higher K scores and
lower F minus K Index scores than Mirror subjects. That ho
differences were found between these ·two groups on their
time taken to complete the MMPI and their negative affect
scores is mitigated by the finding that neither group di.f
fered significantly from the control group on these measures.
Thus, in terms of time taken to complete the MMPI and degree ,
of negative affect experienced, the. two High OSA groups were
no more similar to each other than they are to the ·Low OSA
control group.
Pfa~ 75
Other MMPI Scales
S~gnificant differences due to ex~erimental co~dition
were found for three of the nine MMPI clinical scales exam
ined: Hs, Pt and Si. Description subjects scored signifi
cantly lower than Mirror subjects on Hs, Pt and Si, and
significantly lower than control subjects on Hs and Si. No
differences were found between the Mirror and control groups
on any of the scales. Thus, for the clinical scales where
differences were found, a similar pattern of group mean
scores emerged: Description subjects scored lower than
either the Mirror or control groups whose scores were essen-
tially the same (see Tables 17 through 20).
Given that the Description group has been shown to be
more defensive than either of the other two groups, it is
not surprising that some of their clinical scale scores
would be lower. It will be remembered that several inves-
tigators have found a negative correlation between K-Scale
scores and clinical scale scores {Goldberg, 1969; Hathaway
and Meehl, 1951; Hathaway and Monachesi, 1961).
~ More difficult to explain is why significant differ
ences were found among the groups on Hs, Pt and Si and not
on the other clinical scales. One explanation might be ·that
this was simply due to chance. Given the number· of statis
tical comparison~ conducted in.this study, the probability
Pfau 76
that some clinical scales would show differences across
experimental condition was greatly· increased. It should be
noted in this regard that Goldberg (1969) has found robust
positive correlations between the Hs, Pt, and Si scale
scores of college groups. Thus, the fact that differences
were found among t~e three groups on any one of these scales
increases the likelihood that differences would be found on
all -of them.
It seems possible also that these three MMPI scales
would load heavily on a "self focused attention" factor.
Hs could be construed as a measure of concern with the phys
ical structures of the self, Pt as a measure of preoccupa
tion with the mental operations of the self and Si, of
course, as a measure of social introversion. The positive
intercorrelation of these three scales noted above is con
sistent with this formulation. Thus, theDescription group's
low saores on these scales might reflect the fact that they
experienced less self focused attention than the Mirror or
control 9roup.
Sex Differences
Large differences were found between the sexes for-·
several study variables. Table-21 shows that males had
significantly higher_F scores, Total Negative Affect scores
and SRFS Item la Anxiety scores than females. Females had
higher Si scores than males. -·
Pfau 77
That males had higher F scores and lmV'er Si scores
than females is consistent with the findings of Fasching-
bauer {1972) and Goldberg (1969} who found similar differ-
ences between the sexes on these scales for college aged
groups. Why males reported experiencing more negative
affect and anxiety while taking the MMPI is less clear. It
may be that males actually did experience more negative
· aff~ct than females or that they were simply less inhibited
in reporting it.
It must be remembered when viewing these results that
no a priori hypotheses were made concerning sex differences.
Given the number of statistical comparisons conducted in
this study, the probability that chance alone might have
accounted for the sex differences found greatly increases.
It should be remembered also that the Description
. group included only ten female subjects; this compared to
the twelve found iri the other two groups. Given that fe-
males achieved significantly lower F scores than males, it
seems.possible that the Description groups mean F-Scale
score was an overestimate. Had the number of females been
' equal among the. groups, the F score of the Description
group {which was already the lowest of the three. groups)
may have been even lower, perhaps significantly lower than
those of the Mirror and control groups.. These results
would have then been consistent with the pattern of results
Pfau 78
found for the other validity scales. Namely, they would
show the Description group to have faked bad less than the
Mirror or control groups.
Summary
Response sets have long been recognized as a chief
perturbation t?.self r~port measure validity. Faking, es
pecially faking good, has been identified as the most trou
blesome response style of all. Psychometric procedures
have been developed to correct for the portion of test vari
ance attributable to fakinggood response style bias. Few
procedures have been developed to reduce a respondent's
tendency to fake good.
Recent work by. Pryor, Gibbons and Wicklund (1975) and
Pfau (1976} has shown that subjects complete self report
measures more honestly when they are stimulated to focus
attention on themselves. This work was based on Duval and
Wicklund's (1972) theory of objective self· awareness which
posits that when a person is presented with a symbol or
reflection of himself {~~g., a mirror), his attention is
shifted inward and his self evaluations become more objec
tive •
. In the present study, the MMPI was administered to
three college aged groups of subjects. In the two experi
mental conditions subjects completed the test under condi-
Pfau 79
tions which were assumed to foster self focused attention.
One group ·completed the test in front of a.mirror, the other
completed it in front of a handwritten description of their
physical-characteristics. A control group completed the
test under normal conditions. It was hypothesized that the
expe~imental groups would fake good less than the control
. group. These results were assumed to be reflected in the
validity scale scores of the three groups. Experimental·
groups were expected to achieve higher F-Scale scores, lower
K-Scale scores and h~gher F minus K Index scores than con
trols. Three corollary hypotheses were also put forth. The
first stated that completing the test in an honest and frank
manner would take more time than completing it in the usual,
faking good, manner. Thus it was expected that tile experi
mental groups would take more time to complete the test than
the· control group·. The second stated that completing the
test in an honest and frank manner would cause subjects to
confront their faults and weaknesses. Thus it was expected
that the experimental group would experience more negative
affect while completing the test than the control group.
The third stated that the two experimental_ groups would not
differ in terms of their validity scale scores, their time
taken to complete the test, or their degree of negative
affect .. ,.
Pfau 80
The results failed to confirm any of the hypotheses.
Validity scale scores of the Mirror experimental group and
the co~trol group did not differ significantly. The Des-·
cription experimental group_ had significantly higher K
Scale scores and significantly lower F minus K Index scores
than either the control group or the Mirror experimental
. group. · Thusr in direct contrast to expectation, the Des
cription group actually faked_ good to a greater extent than
the control group. The F Scale scores of the Description
and control groups did not differ significantly. No differ
ences were found among the groups on their time taken to
complete the :ltlMPI. No differences were found among the
groups o~ the degree of negative affect experienced while
taking the MMPI.
In sum, the results failed to support the formulation
of objective self awareness theory that self report validity
is enhanced by conditions which stimulate self focused
attention.
REFERENCES
Allen, R.M. Personality assessment procedures: Psychometric, projective and other approaches. New York: Harper & Row, 1958.
Allport, G.W. Personality: A psychological interpretation. New York: Holt, 1937.
Allport, G.W. The use of personal documents in psychological science. New York: Social Sc~ence ResearCh Counc~l Bullet~n No. 49, 1942.
Anthoney, N.C. Comparison of clients' standard, exaggerated, and matching MMPI profiles. Journal of Consulting and Clinical Psychology, 1971, 36, 100-103.
Bass, B.M. Authoritarianism or acquiescence? Journal of Abnormal and Social Psychology, 1955, 51, 616-623.
Becker, w.c. The matching of behavior ratings and questionnaire personality factors. Psychological Bulletin, 1960, 57, 201-211.
Berg, I.A. Response set in personality assessment. Chicago: Aldine Publishing Company, 1967.
Bernreuter, R.G. Validity of the personality inventory. Personnel Journal, 1933, 11, 383-386.
Borgatta, E.F. Analysis of social interaction and sociometric perception. Sociometry, 1954, 17, 7-32.
Branca, A.A. and Podolnick, E.E. Normal, hypnotically induced and feigned anxiety as reflected in and detected by the MMPI. Journal of Consulting Psychology, 1961, 25, 165-170.
Cady, V.M. The estimation of juvenile incorrigibility. Journal of Delinquency Monographs, 1923, No. 2.
Campbell, D.T. and Fiske, D.W. Convergent and discriminant validation by the multi-trait multi-method matrix. Psychological Bulletin, 1959, 56, 81-105.
Cattell, R.B. Personality and motivation: Structure and measurement. ·New York: Harcourt, Brace & Jovanov~ch, 1957.
81
Pfau 82
Cattell, R.B. Personality and mood by questionnaire. San Francisco: Jessey-Bass, 1973.
Cattell, R.B. and Dreger, R.M. Handbook of modern personality theory. Washington, D.C.: Hemisphere Publishing, 1977.
Chapman, L.J. and Bock,· R.D. Components of variance due . to acquiescence and content in the F-scale measure of authoritarianism. Psychological Bulletin, 1958, 55,
.328-333.
Chapman, L.J. and Campbell, D.T. Response set in the F-scale. Journal of Abnormal and Social Psychology, 1957, 54, 129-132.
Christie, R., Havel, J., and Seidenberg, B. Is the F-scale irreversible? Journal of Abnormal and Social Psychology, 1958, 56, 143-1 ,.
Cofer, C.N., Chance, J.E., and Judson, A.J. A study of malingering on the MMPI. Journal of Psychology, 1949, 27, 491-499.
Cohn,. T. S. The relationship of the F _scale to a response set to answer positively. American Psychologist, 1953, 8, 335 (Abstract).
Combs, A.W., Soper, D.W. and Courson; C.C. The measurement of self concept and self report. Educational and Psychological Measurement, 1963, 33, 493-500.
Cooke, G. The efficacy of two desensitization procedures: An analogue study. Behavior Research and Therapy, 1966, 4, 17-24.
Cowen, E.L. and Tongas, P. The social desirability of trait descriptive terms: Applications to a self-con<;:ept inventory. Journal of Consulting Psychology, 1959, 23, 361-:365.
Cronbach, L.J. An experimental comparison of the multiple true-false and multiple multiple-choice tests. Journal of Educational Psychology, 1941, 32, 533-543.
Cronbach, L.J. Studies of acquiescence as a factor in the true-false test. Journal of Educationa·l Psycho!"ogy, 1942, 33, 401-415.
Pfau 83
Cronbach, L~J. Response sets and test validity. Educational and Psychological Measurement, 1946, 6, 475-494.
Dahlstrom, W.G., Welsh, G.S., and Dahlstrom, L.E. An MMPI handbook (volume I}. Minneapolis: University of M~nnesota Press, 1972.
Damarian, F .. and Messick, s .J .. Reseonse strles as personality variables: A theoretical ~ntegrat~on of multivar~ate research. Pr~nceton, New Jersey: Educational Test~ng Serv~ce Research Bulletin, 1965, 65-100.
Deutscher, I. Words and deeds: Social sciences and social ·policy. Social Problems, 1966, 13(3), 235-254.
Dicken, C. Good impression, social desirability and acquiescence as suppressor variables. Educational and Psychological Measurement, 1963, 23, 699-720.
Dittman, A .. T. and Llewellyn, L.G. Body movement and speech rhythm in social conversation. Journal of Personality and Social Psychology~ 1969, 11, 98-106.
Drasgo, J. and Barnette, W.L. F-K in a motivated group. Journal of Consulting Psychology, 1957, 21, 399-40"!.
Dunnette, M.D., McCartney, J., Carlson, H.C., and.Kirchner, W .. K. A study of faking behavior on a forced choice self description checklist. Personnel Psychology, 1962, 15, 13-24.
Duval, S .. and Wicklund, R.A. A theory of objective self awareness. New York: Academic Press, 1972.
Duval, S .. , Wickl~nd, R.A., and Fine, B. Unpublished manuscript, cited in S. Duval and R.A. Wicklund, A theory of objective self. awareness. New York: Academic Press, 1972. .
Edwards, A.L. The relationship between the judged desirability of a trait and the probability that the trait will be endorsed. Journal of App·lied Psychology, 1953, 371 90-93 •
Edwards, A.L. The· social desirability varia.ble ·in ·person-· ality assessment and ·research. New York: Dryden, 1957 ..
Pfau 84
Edwards, A.L. Social desirability and the description of others. Journal of Abnormal and Social·Psychology, 1959, 59, 434-436.
Edwards, A.L. The social desirability variable: A review. In I. Berg (Ed.) Response set in personality assessment. Chicago: Aldine, 1965.
Edwards, A.L. and Diers, C.J. Social desirability and the factorial interpretation of the MMPI. Educational and Psychological Measurement, 1962, 22, 501-509.
Ellis, A. The validity of personality questionnaires. Psychological Bulletin, 1946,. 43, 385-400.
Exner , J. E • , Kirk, L. · the MMPI. 91-94.
McDowell, E., Pabst, J., Stackman, w., and On the detection of willful falsification in
Journal .of Consulting Psychology, 1963, 27,
Faschingbauer, T.R. A short written form of the group ~1PI. Doctoral Dissertation, University of North Carolina, 1972 I (DAI I 1973, 34 I 409B) •
Fiske, D.W. Measuring the concepts of personality. Chicago: Aldine, 1971.
Freeman, ~.c. and Ataov, T. Invalidity of indirect and direct measures of attitudes toward cheating. Journal of Personality, 1960, 28, 443-447.
Goldberg, L.R. Student personality characteristics and optimal college learning conditions. Oregon Research Institute Monographs, 1969, 9, No. 1.
Gough, H.G. Simulated patterns on the MMPI. Journal of Abnormal and Social Psychology, 1947, 42, 215-225.
Gough, H.G. The F minus K dissimulation index for the MMPI. Journal of Consulting Psychology, 1950, 14, 408-413.
Gough, H.G. Some common misconceptions about neuroticism. Journal of Consulting Psychology, 1954, 18, 287-292.
Hanley, c. Social desirability and responses to items from three MMPI scales: D, Sc, and K. Journal of Applied Psychology, 1956, 40, 324-328.
Pfau 85
Hassinger, E. and McNamara, R.L. Stated op1n1on and actual practice in health behavior in a rural area. The Midwest Sociologist, 1957, May, 93-97.
Hartshorne, H. and May, M.A. Studies in deceit. New York: Macmillan, 1928.
Hathaway, S.R. and McKinley, J.C. Minnesota Multiphasic Personality Inventory. Minneapolis: University of Minnesota Press, 1943.
Hathaway, S.R. and Meehl, P.E. An atlas for the clinical use of the MMPI. Minneapolis: Un1vers1ty of Minnesota Press, 1951.
Hathaway, S.R. and Monachesi, E.D. An atlas of juvenile MMPI profiles. Minneapolis: Univers1ty of M1nnesota Press, 1961.
Henry, J. Spontaneity, initiative, and creativity in suburban classrooms. American Journ·a·l of Orthopsychiatry, 1959, 29, 266-279.
Hunt, H.F. The effect of deliberate deception on MMPI performance. Journal of Consulting Psychology, 1948, 12, 396-402.
Hunt, H.F., Carp, A., Cass, W.A., Winder, C.L., and Kantor, R.E. A study of the differential diagnostic efficiency of the MMPI. Journal of Consulting Psychology, 1948, 12, 331-336.
Ickes, W.J., Wicklund, R.A., and Ferris, C.B. Objective self awareness and self esteem. Journal of Experimental Social Psychology, 1973, 9, 202-219.
Jackson, D.N. and Messick, S.J. Response-styles on the MMPI: Comparison of clinical and normal samples. Journal of Abnormal and Soci·al Psychology, 1962, 65, 285--299.
Jackson, D.N., Messick, S.J., and Solley, C.M. How "rigid" is the "authoritarian"? Journal of Abnormal and Social Psychology, 1957, 54, 137-140.
Katkin, E.S. The relationship-between manifest anxiety and two indices of autonomic response to stress. Journal of Personality and Social Psychology, 1965, ·- 2, 324-333.
Pfau
Kelly, E.L., Miles, C.C., influence one's score test of personality. 4, 206-215.
and Terman, L.C. Ability to on a typical pencil and paper Journal of Personality, 1936,
86
Kenny, D.T. The influence of social desirability on discrepancy measures between real self and ideal self. Journal of Consulting Psychology, 1956, 20, 3~5-318.
Kutner, B.C., Wilkins, c., and Yarrow, P.R. Verbal attitudes and overt behavior involving racial prejudice. Journal of Abnormal and Social Psychology, 1952; 47, 649-652.
Lacey, J.I. Somatic response patterning and stress: Some revisions of activation theory. In M.H. Appley and R. Trumbill (Eds.), Psychological Stress. AppletonCentury-Crofts, 1967.
LaPiere, R.T. Attitudes vs. actions. Social Forces, 1934, 13, 2-30-237.
L~avitt, H.J., Hax, .H., and Roche, J .H. "Authoritarianism" and agreement with things authoritative. Journal of Psychology, 1955, 40, 215-221.
Lichtenstein, E. and Bryan, J.H. Acquiescence and the MMPI: An item reversal approach. Journal of Abnormal Psychology, 1965, 70, 290-293.
Liebling, B.A., Seiler, M., and Shaver, P. Self awareness and cigarette-smoking behavior. Journal of Experimental Social Psychology,.i974, 10, 325-332.
Liebowitz, G. Comparison of self report and behavioral techniques of assessing aggression. Journal of Consulting and Clinical Psychology, 1968, 32; 21-25.
Lohman,. J.P. and Reitze, n.c. Note on race relations in a mass society. American Journal of Sociology, 1952, 58, 240-246.
Longstaff, H.P. Fakeability of the Strong Interes·t Blank · and the Kuder Preference Record. Journal of Applied
Psychology, 1948, 32, 360-369.
Marks, P .A., and Seeman, W. The actuarial description of personality: an atlas for use w1th the MMPI. Balt1more: Williams and Wilkens, 1963.
Pfau
Martin, B. The assessment of anxiety by physiological behavioral measures. Psychological Bulletin, 1961, 58, 234-255.
87
Meehl, P.E. and Hathaway, S.R. The K factor as a suppressor variable in the MMPI. Journal of Applied Psychology, 1946, 301 525-564 •
Meridith, G.M. Stereotypic desirability profiles for the 16PF questionnaire. Psychological Reports, 1~68, 23, 1173-1174.
Merrill, R.M. and Heathers, L.B •. The relation of the. MMPI to the EPPS on a college counseling center sample. journal of Consulting Psychology, 1956, 20, 310~314.
Messick, S.J. and Jackson, D.N. Authoritarianism or acquiescence iri Bass's data. Journal of Abnormal and Social Psychology, 1957, 54, 424-426.
Messick, S.J. and Jackson, D.N. The measurement of authoritarian attitudes. Educational and Psychological Measurement, 1958, 18, 241-253.
Messick, S.J. and Jackson, D.N. Acquiescence and the factorial interpretation of the MMPI. Psychological Bulletin, 1961, 58, 299-304.
Minard, R.D. Race relationships in the Pochahontas coal field. Journal of Social Issues, 1952, 8, 29-44.
Mischel, W. Personality and Assessment, New York: Wiley, 1968, 1~103. .
Nunnal·ly, J. C. prediction.
Tests and measurement, assessment and New York: McGraw Hill, 1959.
Nunnally, J.C. Popular conceptions of mental health: Their development and change. New York: Holt, 1961..
Osborne, D.A. validity. 486-490.
A moderator variable approach to MMPI Journal of Clinical Psychology, 1970, 26,.
Osgood, C.E. Studies on the generality of affective meaning systems. American.Psychologist, 1962, 17, 10-28.
Pfau 88
Osgood, C.E., Suci, G.J., and Tannenbaum, P.H. The measur7me~t of meanin~. Urbana, Illinois: University
· of Ill~no~s Press, 19 7.
Parker, J. The relationship of self report to inferred self· concept. Educational and Psychological Measurement, 1966, 26, 691-700.
Pfau, B.N. The effects of self focused attention of the MMPI validity scales, the F minus K index and the
_D scale. UnpUblished manuscript, Loyola University of Chicago, 1976.
Pryor, J.B., Gibbons, F.X. and Wicklund, R.A. Untitled manuscript reported in Wicklund, R.A. Objective self awareness. In L. Berkowitz (Ed.,} Advances in experimental social psychology, V.8, p. 257. New York: ·Academic Press, 1975.
Raphelson, A.C. The relationship among imaginative, direct verbal, and physiological measures of anxiety in an achievement situation. Jqurnal of Abnormal and Social Psychology'· 1957, 54, 13-18.
Rorer, L.G. and Goldberg, L.R. Acquiescence on the MMPI?, Educational and Psychological Measurement, 1965, 25.,
. Sb!-817. (a}
Rorer, L.G. and Goldberg, L.R. Acquiescence and the vanishing variance· component. Journal of Applied Psychology, 1965, 49, 422-430. (b)
Rosenstein, A.J. Psychometric versus physiological anxiety and serial learning. Journal of Personality, 1960, 28, 279-292.
Rosensweig, s. A suggestion for rndking verbal personality tests more valid. Psychological Review, 1934, 41, 400-401.
Rosensweig, s. tests with Journal of 476-488.
A basis for the improvement of personality special reference to the M-F battery. ·· Abnormal and Social Psychology, 1938, 33,
, .
. •
Pfau
Ruch, F.L. A technique for detecting attempts to fake performance on a self inventory type of personality test. In Q. McNemar and M.A.Merrill (Eds.) Studies in personality, New York: McGraw-Hill, 1942.
89
Scheier, I.H. and Cattell, R.B. Confirmation of objective test.factors and assessment of their relation to questionnaire factors: A factor analysis of 113 rating, questionnaire and objective test measurements of personality. Journal of Mental Science, 1958, 104,. 608-624.
Schletzer, V.M. Attitudinal barriers to em~loyment. Minnesota Studies in Vocational Rehabil~tation: XI, ·Industrial Relations Center, Bulletin 32, University .of Minnesota, Minneapolis, 1961.
Silver, R.J. and Sines, L.K. Diagnostic efficiency of; the ~I with and without the. K correction, Journal of Clinical Psychology, 1962, 18, 312-314.
Strong, E.K. Vocational interests'of men and women. Stanford: Stanford Un~versity Press, 1943.
Taylor, J.B. Social desirability and MMPI performance: The individual case. Journal of Consulting Psychology, 1959, 23, 514-517.
Tamken, A.S. and Schere, I.w· •. Wh~t is· measured by the "Cannot Say" scale of the group MMPI?. Journal of Consulting Psychology, 1957, 21, 370-371.
Tedeschi, J.T. and Lindskold, S. Social psychology: Interdependence, interaction and influence. New York: Jo:q.n Wiley and Sons, 1976, pp. 208-209.
Vernon, P.E. Personality assessment: A critical survey. London: Methuen, 1964.
Warriner, C.K. morality. 165-168.
The nature and functions of official American Journal of Sociology, 1958, 64,
Weiner, D.N. Subtle. and obvious keys for the MMPI. Journal of Consulting. Psychology, 1948, 12, 164-170.
Welsh, G.S. and Dahlstrom. Basic readings on the MMPI in psychology and medicine. Minneapolis: University of Minneapolis Press, 1956.

Pfau 90
Wessman, A.G. Faking personality test scores in a simulated employment situation. Journal of Applied Psychology, 1952, 36, 112-113.
Wicker, A.W. Attitudes versus actions: the relationship of verbal dnd overt behavioral responses to attitude objects. Journal of Social Issues, 1969, 25, 41-78.
Wicklund, R.A. Objective self awareness. -In Berkowitz, L. (Ed .. ) Advances in Experimental Social Psychology, val. 8, 233-275, New York: Academic Press, 1975.
Zuckerman, M., Norton; J. and Sprague, D.S. Acquiescence and extreme sets and their role in tests of authori-· tarianismand parental attitude. Psychiatric Research Reports, 1958, 10, 28-45.
Zunich, M. Relationship between maternal behavior and attitudes toward children. Journal of Genetic Psychology, 1962, 155-165.
APPENDIX A
91
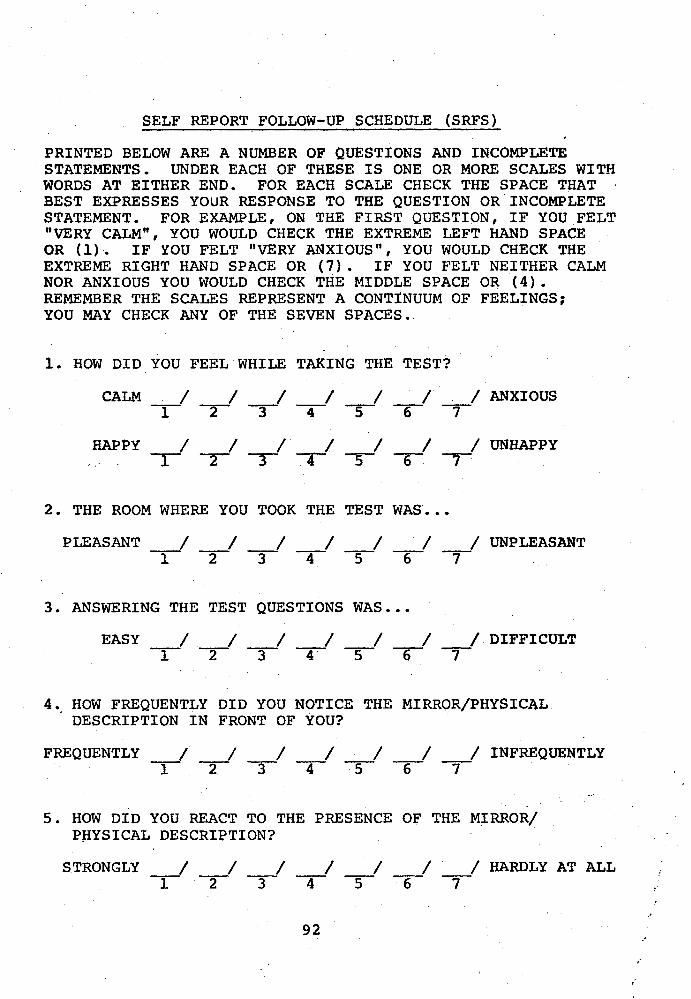
SELF REPORT FOLLOW-UP SCHEDULE (SRFS)
PRINTED BELOW ARE A NUMBER OF QUESTIONS AND INCOMPLETE STATEMENTS. UNDER EACH OF THESE IS ONE OR MORE SCALES WITH WORDS AT EITHER END. FOR EACH SCALE CHECK THE SPACE THAT BEST EXPRESSES YOUR RESPONSE TO THE QUESTION OR INCOMPLETE STATEMENT. FOR EXAMPLE, ON THE FIRST QUESTION, IF YOU FELT "VERY CALM", YOU WOULD CHECK THE EXTREME LEFT HAND SPACE OR (1). IF YOU FELT "VERY ANXIOUS", YOU WOULD CHECK THE EXTREME RIGHT HAND SPACE OR (7). IF YOU FELT NEITHER CALM NOR ANXIOUS YOU WOULD CHECK THE MIDDLE SPACE OR (4). REMEMBER THE SCALES REPRESENT A CONTINUUM OF FEELINGS; YOU MAY CHECK ANY OF THE SEVEN SPACES ..
1. HOW DID YOU FEEL WHILE TAKING THE TEST?
CALM I I I I I I . / ANXIOUS -r -r -3- -4- -5- -6- -7-
HAPPY I I I I I I I UNHAPPY ,-- -r -3- -r -5- -r -r
2. THE ROOM WHERE YOU TOOK THE TEST WAS •••
PLEASANT _I I _I I I I _I UNPLEASANT 1 -2- 3 -4- -5- -6- 7
3. ANSWERING THE TEST QUESTIONS WAS •••
EASY I I _I I I I I DIFFICULT -r -2- 3 "T -5- -6- -7-
4 •. HOW FREQUENTLY DID YOU NOTICE THE MIRROR/PHYSICAL DESCRIPTION IN FRONT OF YOU?
FREQUENTLY _/ I I I I I I INFREQUENTLY 1 -r -3- -4- -5- -6- -7-
5. HOW DID YOU REACT TO THE PRESENCE OF THE MIRROR/ P~YSICAL DESCRIPTION?
STRONGLY _/ ___/ / / / / / HARDLY AT ALL 1 2 -3- -4- -5- -6- -7-
92

APPENDIX B
93
.. -. ____ - _._·__;_ ____ .· .... - ..: . ..-· .• - ..... :.L. ·-· .... ::...... ____: .. ~ ... ~.-,:...· ~-·.:.....;· ·------I . I ,
l' I
I PHYSICAL DESCRIPTION SHEET .,
\
---;,~>··- ··---.. --. --· -......-------~--
•-'

APPENDIX C
95
•'

DEBRIEFING SHEET
The test you just completed was the Minnesota Multiphasic Personality Inventory, known to psychologists everywhere as the MMPI. The MMPI yields a personality profile on ten dimensions: Hypochondriasis, Depression, Hysteria, Psychopathy, Masculinity-Femininity, Paranoia, Psychasthenia, Schizophrenia, Hypomania and Social Introversion. Also included in the test are four "validity scales". These scales measure the extent to which a person lies or stretches the truth. They may indicate that a person is "faking good", trying to look healthier than he actually is, or, they may indicate that a person is "faking bad", trying to look more disturbed than he actually is. College students generally fake good to some degree.
This experiment is examining the effects of self focused attention on t.he MMPI validity scales. By self focused attention I mean a sense of self consciousness. I have promoted this sense of self consciousness by placing some subjects in front of mirrors or written descriptions of their physical attributes. If you were not seated in front of a mirror or a description you were a control subject. According to a social psychologist named Nicklund, self consciousness promotes a state of heightened objectivity concerning the self. My hypothesis is simply that the people who were stimulated to become self conscious will be more objective while filling out the ~~WI and will fake good less.
Please rest assured that all the test data is completely confidential and anonymous. Your forms have been identified by numbers and not names for this purpose. They have been identified by numbers to make collation of the data more systematic. THIS IS A STUDY OF GROUP DIFFERENCES AND SO I WILL NOT EXAMINE AND AM NOT CONCERNED WirrH ANY SUBJECT'S INDIVIDUAL TEST PROFILE OR PERSONALITY.
If you have any questions about the experiment, please do not hesitate to call me at 338-5958. I will be pleased to answer any theoretical question I am able to about the experiment or the ~~iPI. I CANNOT AND WILL NOT DISCUSS ANYONE'S MJ:1PI PROFILE WITH THEH OR ANYONE ELSE, HOv1EVER. If you wish to know the results of this study please call-me in January.
Thank you very much for your help. I really appreciate it.
Sincerely,
96 Bruce Pfau

APPENDIX D
97
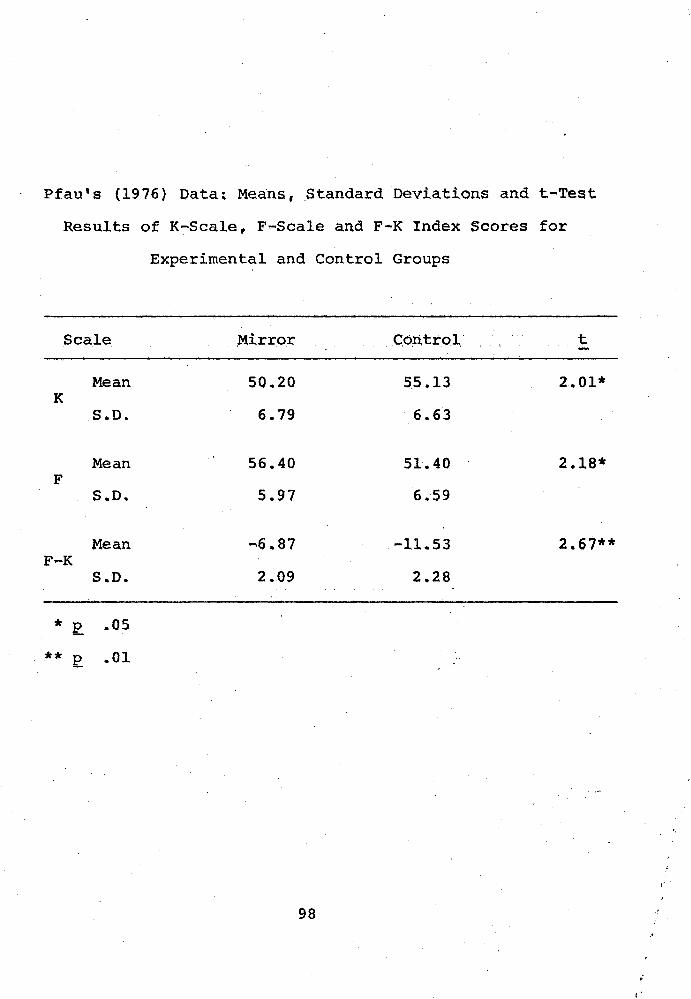
Pfau's (1976) Data~ Mea·ns, .Standard Deviations and t-Test
Results of K-Scale, F-Scale and F-K Index Scores for
Experimental and Control Groups
Scale .Mirror c.o.n tr:o 1. · t
Mean 50.20 55.13 2.01* K
S.D. 6.79 6.63
Mean 56.40 51.40 2.18* F
S.D .. 5.97 6 .·59
Mean ...6 .. 87 -11 .. 53 2.67** F-K
S.D • 2.09 2.28
* E. .. 05
** E. .01
98
t'

APPENDIX E
99
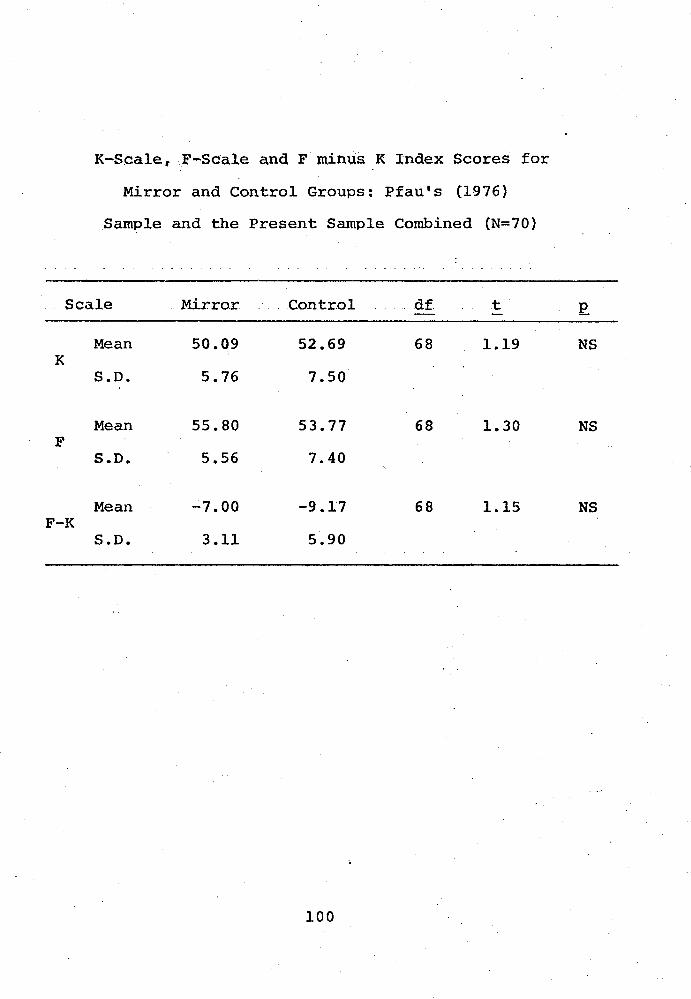
K-Scale, F-Scale and F minus K Index Scores for
Mirror and Control Groups: Pfau•s (1976)
Sample and the Present Sample Combined (N=70)
Scale Mirror Control df t
Mean 50.09 52.69 68 1.19 K
S.D. 5.76 7.50
Mean 55.80 53.77 68 1.30 F
S.D. 5.56 7.40
Mean ...;7.00 -9.17 68 1.15 F-K
S.D. 3.11 5.90
100
p
NS
NS
NS
APPROVAL SHEET
The thesis submitted by Bruce Pfau has been read and approved by the following committee:
Dr. Frank J. Kobler Professor, Psychology, Loyola
Dr. Alan S. DeWolfe Professor, Psychology, Loyola
The final copies have been examined by the director of the thesis and the signature which appears below verifies the fact that any necessary changes have been incorporated and that the thesis is now given final approval by the Committee with reference to content and form.
The thesis is therefore accepted in partial fulfillment of the requirements for the degree of Master of Arts.
DirecterrSigiiatllre