Embed Size (px)
Citation preview

* -i TDR-63-383
SEP 2 9 1978
The Effects of the Accuracy of Atmospheric
Data on the Structural Design Loadsof a Typical Launch Vehicle
20 APRIL 1964
Prepared by
J. S. FIEILD and D. E. HIARGIS
Prepared for COMMANDER SPACE SYSTEMS DIVISION
UNITED STATI'ES AIR FORCE
Ingle'wood, California
This document contains
blank pages that werenot filmed.
-k PI II :) P1,UA• Ic. 1) i *, i F' ( )1 M,,( I ( '( )AN I C( )S D1\ o ( ) NCONTRACT NO. AF 04(695)-269
"r : U..-' *.
- ; , ~..a'_ " * J. R :
-. I -L
ABSTRACT
This report documents the effects of simulated inaccuracies
of meteorological data on the structural loads of two types of
launch vehicles. The effects of inaccuracies ranging from
4. 10% to - 10% of atmospheric density, atmospheric temper-
ature, windspeed, wind shear and wind shear length were
studied. The twolaunch vehicles used were a liquid propellant
boosted vehicle and a relatively small solid propellant boosted
vehicle.
i_-
hi
,'

CONTENTS
I. INTRODUCTION ............................... 1
II. SUM M ARY ................................... 3
Effects on q (Dynamic Pressure)............................3
Effects on a (Angle-of-Attack) ...................... 3
Effects on Bending Moment ........ ........................ 3
Effects on Launch Risk ......... ........................... 5
III. METHOD OF ANALYSIS ......... .......................... 7
Nominal Inputs ......... ... ................................ 7
Atmospheric Data Dispersions ...................... 7
Six-Degree -of-Freedom Trajectory Simulation ............... 10
Six-Degree-of-Freedom Structural Loads Program ............ 10
Limitations and Assumptions ....................... 10
IV. PRESENTATION OF RESULTS ...................... 11
V. CONCLUSIONS ................................ 23
APPENDIX A. TRAJECTORY SIMULATIONS ................ 25
APPENDIX B. WIND CRITERIA ........................ 31
APPENDIX C.. TERMS AND SYMBOLS .................... 43
-vii -
• "- •' -"••,,•'':-• M Y ,"••V ,-,r % ,r,'.%, •€,-, -<-• ;• •-",.,•'%N ,P a'••:-

i~- -, '771i .
FIGURES
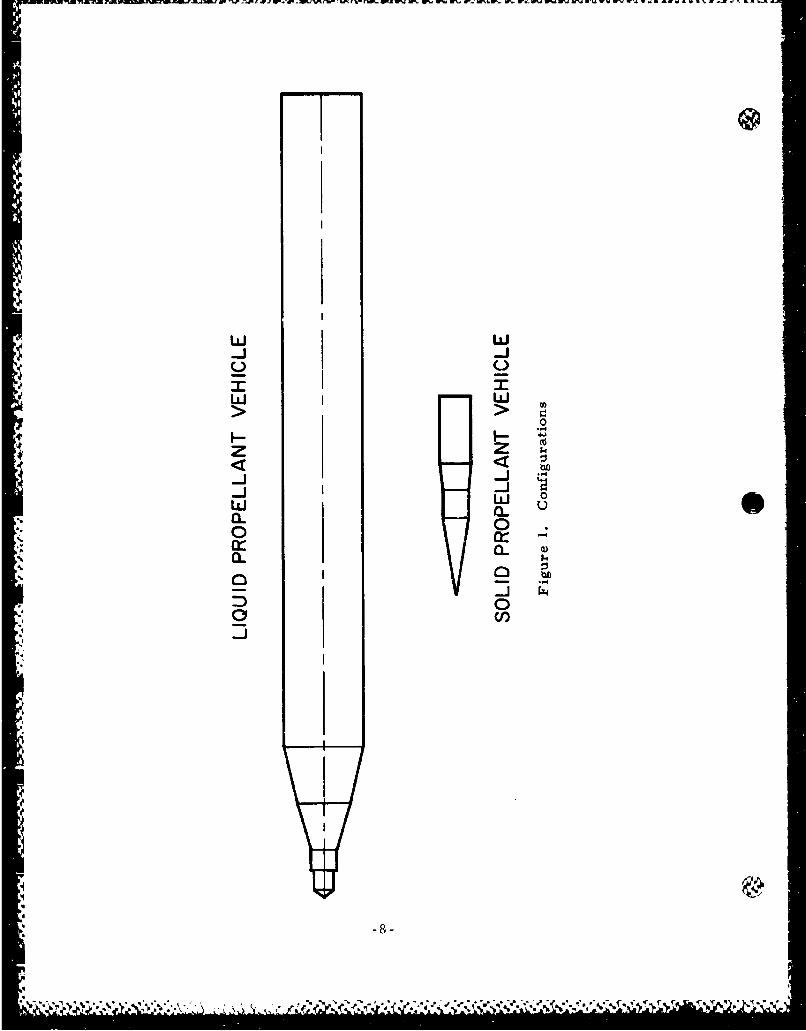
I. Configurations .. ................. ...... ..... 8
2. Design Wind Profiles ............ .......................... 9
3. Effects of Dispersions on Dynamic Pressure (q) ............. 12
4. Effects of Dispersions on Angle-of-Attack (a) .......... .... 13
5. Dispersions, Percent Change in Equivalent Axial Load . . . 14
6. Dispersions, Solid Propellant Booster ....... .............. 15
7. Dispersions, Liquid Propellant Booster .................... 16
8. Dispersions, Percent Change in Moment ....... ............. 17
9. Dispersions, Solid Propellant Booster ...................... 18
10. Dispersions, Liquid Propellant Booster ..................... 19
11. Atmospheric Dispersions vs Deviation in Launch Risk .... 20
12. Design Wind Velocity Envelope ........ ................... 33
13. Design Wind Shear Envelope, 1000-ft Shear Layer ...... 34
14. Design Wind Shear Envelope, 3000-ft Shear Layer ...... 35
15. Design Wind Shear Envelope, 5000-ft Shear Layer 36
16. Design Wind Profiles, Peak Altitude at 34, 000-ft ........... 37
17. Design Wind Profiles, Peak Altitude at 36, 000-ft ....... 38
18. Design Wind Profiles, Wind Velocity Dispersion .... ....... 39
-viii -
Report No.
SSD-TDR-63-383 TDR-269(4304)-6
THE EFFECTS OF THE ACCURACY OF ATMOSPHERIC
DATA ON THE STRUCTURAL DESIGN LOADS
OF A TYPICAL LAUNCH VEHICLE
This technical documentary report has been reviewed and is approved forpublication and dissemination. The conclusions and findings containedherein do not necessarily represent an official Air Force position.
For Space Systems Division For Aerospace Corporation:Air Force Systems Command:
Major I.E. Bekius, SSOWSSD Staff Meteorologist Associate Direc 6r
Engineering Sciences Subdivision
AEROSPACE CORPORATIONEl Segundo, California
%
S~-Lii -

Report No.SSD-TDR-63-383 TDR-269(4304)-60
THE EFFECTS OF THE ACCURACY OF ATMOSPHERIC
DATA ON THE STRUCTURAL DESIGN LOADS
OF A TYPICAL LAUNCH VEHICLE
Prepared by
J.S. Field and D.E. Hargis
AEROSPACE CORPORATIONI, El Segundo, California
Contract No. AF 04(695)-269
20 April 1964
Prepared for
COMMANDER SPACE SYSTEMS DIVISIONUNITED STATES AIR FORCE
Inglewood, California
FIGUR'ES (Continued)
19. Design Wind Profiles, Whid Shear Di~persion .. .. .. ...... ...... 40
20. Design Wind Profiles, Shear Length Dispersion .. .. .. .... ...... 41
TABLE
1. A Scumm-ary of Deviations in Structu~ral Loads Due to+10% Dispersions in Measured Atmospheric Data .. .. .. .... ..... 4

I. INTRODUCTION
A perturbation analysis has been conducted on certain standard atmospheric
parameters to determine the effects of errors in measurement on the struc-
tural design loads of a launch vehicle. The nominal atmosphere and basic
wind profiles used as standard data in this report were obtained from the
U.S. Standard Atmosphere l95& and the USAF Climatic Center Project 4501
report, MMRBM Design Climatology, dated 12 April 1963.
The procedure consisted of first determining a crit;cal altitde and wind
direction by flying several trajectories using a nominal atmosphere and
various basic wind profiles. Having thus established the critical altitude and
wind direction, other trajectories were flown for basic 1%, 5%, and 10% risk
wind profiles taken from the Project 4501 report. The effect of errors in
measurement of atmospheric data were determined by dispersing individual
0parameters from the basic 5% risk wind profile. The parameters dispersed
were ai: density, air temperature, wind velocity, wind shear, and wind'S
shear length. The paramreters were dispersed ±5% and ±10% from the ',
nominal values. Smooth curves were faired in bet.veen these noints.
Curves are presented showing the percentage changes in equivalent axial load
and bending moments due to individual dispersions. Curves yielding the
change in launch risk versu-, the various dispersions are also presented.
- 1-',
II. SUMMARY
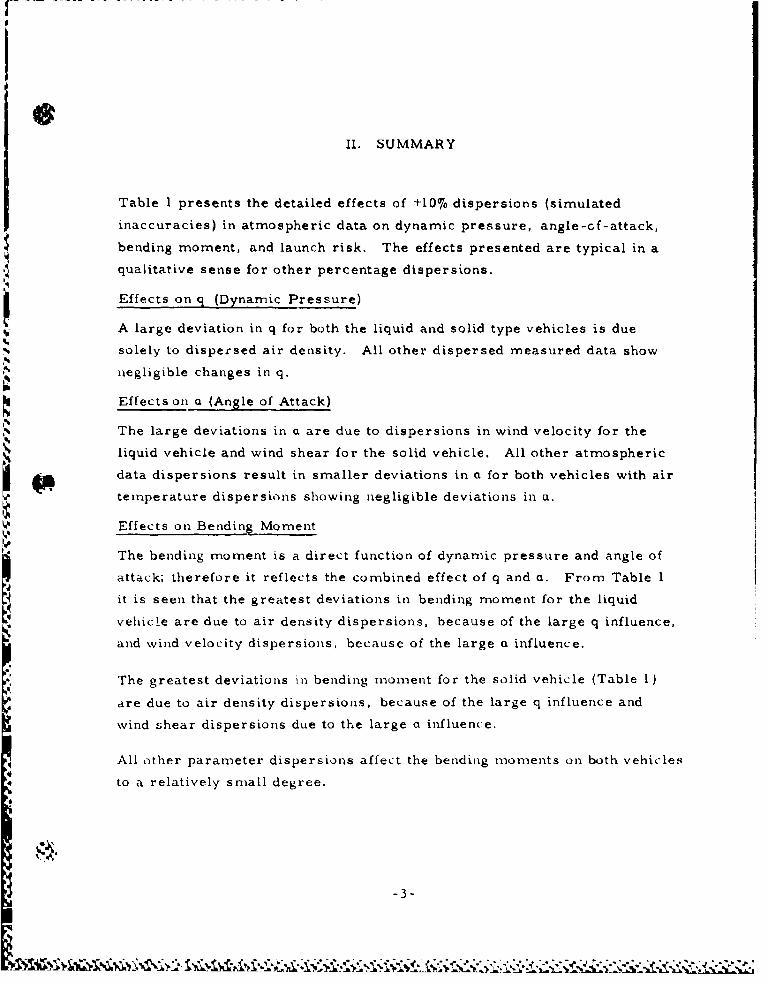
Table 1 presents the detailed effects of +10% dispersions (simulated
inaccuracies) in atmospheric data on dynamic pressure, angle-of-attack,
bending moment, and launch risk. The effects presented are typical in a
qualitative sense for other percentage dispersions.
Effects on g (Dynamic Pressure)
A large deviation in q for both the liquid and solid type vehicles is due
solely to dispersed air density. All other dispersed measured data show
negligible changes in q.
Effects on a (Angle of Attack)
The large deviations in a are due to dispersions in wind velocity for the
liquid vehicle and wind shear for the solid vehicle. All other atmospheric
data dispersions result in smaller deviations in a for both vehicles with air
temperature dispersions showing negligible deviations in a.
Effects on Bendin Moment
The bending moment is a direct function of dynamic pressure and angle of
attack; therefore it reflects the combined effect of q and a. From Table I
it is seen that the greatest deviations in bending moment for the liquid
vehicle are due to air density dispersions, because of the large q influence,
and wind velocity dispersions, because of the large a influence.
The greatest deviations in bending moment for the solid vehicle (Table 1)
are due to air density dispersions, because of the large q influence and
wind shear dispersions due to the large a influence.
All other parameter dispersions affect the bending moments on both vehicles
to a relatively small degree.
-3-

Table 1. A Summary of Deviations in Structural Loads Due to +10%Dispersions in Measured Atmospheric Data. Percent
Deviations from Nominal for a Sidewind Peakingat 35, 000 Feet
Liquid Vehicle
Deviations A Bending ARisk ofata Aq M &a M) Moment (%) Launch (%)
Dispersed
Air Density 9.34 -1.17 8.0 0.92
Air Temperature 0.08 -0.06 -2.0 -0.26
Wind Velocity 0.05 9.24 8.0 0.92
Wind Shear 0.04 2. 36 2.6 0. 32
Wind Shear Length 0.05 2.68 2.5 0.32
Solid Vehicle
Deat q (9 A Bending ARisk of
Moment (%) Launich (76) PAir Density 8.20 -2.07 6.0 0.75
Air Temperature -0.24 0.09 -0.5 -0.05
Wind Velocity 0.1I 2.01 2,2 0.30
Wind Shear 0 7.40 7.3 0.85
Wind Shear Length 0 3. 72 3. 5 0.45
"-4-

- . -- -- -
Effects on Launf:h Riskt
The greatest deviations in launch risk for liquid and solid v'ehiclcs are due to
dispersions in the same parameters that affect bending moments; that is, air
density and wind velocity for the liquid, and air density and wind shear for
the solid.
* \. *~' ~ '** *.,*,** *** ,,*..~~~,* -, . -ecv

III. METHOD OF ANALYSIS
Nominal Inputs
The method of analysis may be described by first discussing the nominal
inputs. Two different types of vehicles were chosen. The first was a small,
high velocity, solid-propelled vehicle. The second was a much larger and
slower liquid-propelled vehicle. These two vehicles are shown in Figure 1.
The basic trajectories chosen were the mission trajectories for each vehicle.
These trajectories differ greatly because of the different missions and thedissimilarities in vehicle configuration and performance.
The basic wind profile was the same for each vehicle to permit the effect of
the same dispersions in this wind profile on the response and structural
loading of each vehicle to be measured. The basic wind profile chosen is
described in Figure 2. The critical wind direction and altitude for the wind
peak were determined, and was coincidentally a side wind peaking at 35,000
feet for each vehicle. The wind risk was arbitrarily chosen as the five per-
cent profile. The nominal atmosphere used was the same for both vehicle
trajectories to permit the effect of the same dispersion in this atmosphere on
the response and structural load of each vehicle to be measured. The nominal
atmosphere used was "U.S. Standard Atmosphere, 196Z."
Atmospheric Data Dispersions
The atmospheric data that determine the structural loading of a vehicle are
air density and air temperature, which are reflected in the nominal atmos-
phere; and wind velocity, wind shear, and wind shear depth, which are
reflected in the basic wind profile. All of the preceding data are coupled in
their effects on dynamic pressure and angle of attack. In turn, the rigid body
axial load and bending moment on the vehicle structure are primarily direct
functions of dynamic pressure and angle of attack. Therefore, by dispersing
the preceding atmospheric data, we also vary the loads on the vehicle and
-7
.; .- -.• :• '•. ., .:. ".,""- " '" "". "'"". ."" , "".. " - . - . . ,' . .- ." . ., - • - "----.7-.-,
w w
w
-J°w w
co
z z k~.
I 0
' 0:-.-
a...
0 w i
* -8-
-~~ ~ bei'''

- 0w o In
00
cr CEc 0 EH H 0- 0
W :LLJW 0.
ti 0
0- to
(00 0 0-0
4C~Z
1-4 J SG~snOHL"3oiirz

measure the effect of the dispersion (or simulated inaccuracy in measured
data) on the loads.
Six -Degree -of- Freedom Trajectory Simulation
A six-degree-of-freedom trajectory simulation was utilized for each vehicle,
inputting the nominal atmospnere, the basic five percent risk side wind
profile, and the basic "no-wind" trajectory program for each vehicle. Then
a series of trajectories was run for each vehicle, where air density, air
temperature, wind velocity, wind shear and wind shear length were dispersed
+5 and ±10 percent, one at a time. These trajectories are listed in Appendix
A. The effects of the dispersions on the trajectory were obtained directly
from the trajectory simulation.
Six -Degree -of-Freedom Structural Loads Program
The output of the trajectory program was then coupled to a six-degree-of-
freedom loads prograrnwhere the effects on axial load, bending moment, and
equivalent axial load were measured. Plots were then made for each vehicle,
showing the deviations in load for each dispersion in atmospheric data. The
deviation in launch risk from the 5 percent basic wind profile is also shown
for each dispersion. This was done by relating changes in structural loading
to changes in wind profile risk by running one and ten percent risk wind pro-
files with no dispersions.
Limitations and Assumptions
Concerning the limitations and assumptions of this study, the loads outputs
are entirely rigid body loads; therefore gust and other dynamic effects were
not consiaered. However, since rigid body loads are the major portion of
total loads and are directly related to the atmospheric data that was dispersed,
this omission is justified. Furthermore, the results of the study may not
necessarily be applicable directly to all other solid and liquid propelled
vehicles, due to differences in nominal trajectories, wind profiles, control
systems, configurations, etc.
-10-
IV. PRESENTATION OF RESULTS
Several six-degree-of-freedom wind trajectories were simulated for both a
solid propellant boosted vehicle and a liquid propellant boosted vehicle.
Load parameters from the dispersed atmospheric wind trajectories were
utilized in a computer program to investigate the relative change in load as
each atmospheric parameter was dispersed. The results of the investigation
are presented in Figures 3 through 13.
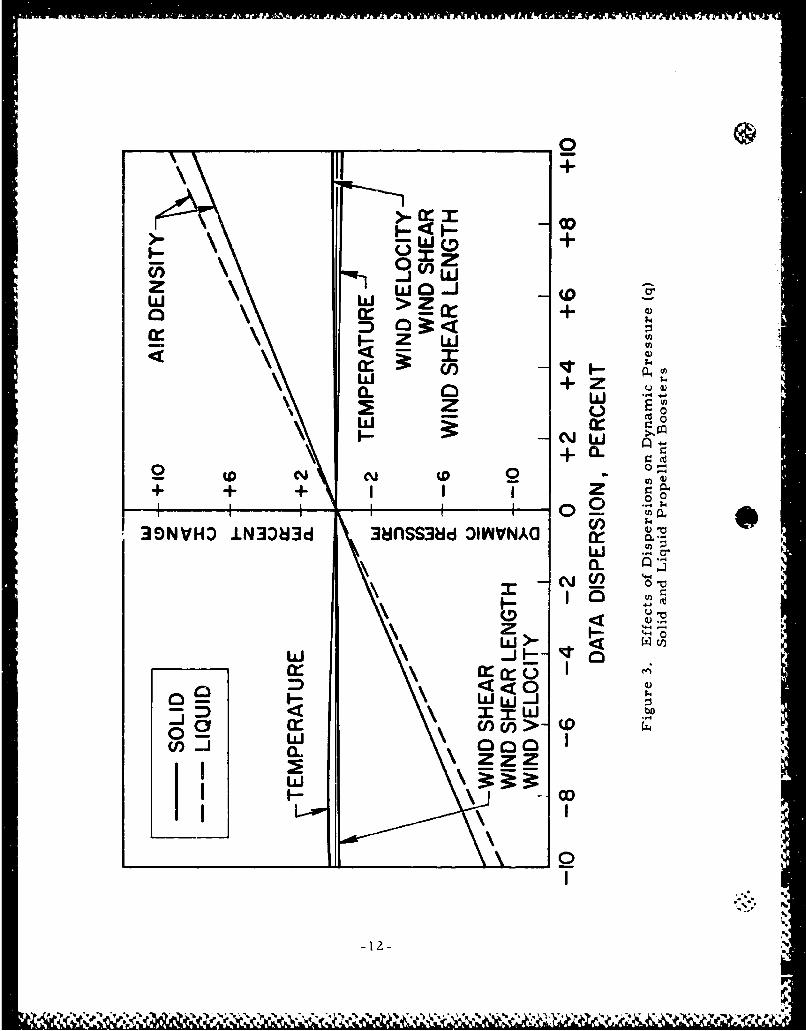
Figures 3 and 4 show respectively the percentage change in dynamic pressure
and angle-of-attack with respect to the percentage changes in atmospheric
data. As would be expected, the atmospheric density has the greater effect
on dynamic pressure, while the wind shear and wind velocity have greater
effects on the angle-of-attack.
e @Figure 5 presents the percentage change in equivalent axial load
(P = P + ZM/r) and the corresponding risk wind percent for dis-EQ AXIAL
persions on atmospheric density, wind velocity, temperature, wind shear
length (scale of distance), and wind shear for both solid propellant and liquid
propellant boosted vehicles. In Figure 5 the arrows demonstrate how a per-
cent change in structural load and percent risk wind is determined from a
given dispersion in an atmospheric parameter. It should be noted that density,
temperature, and wind velocity dispersions produce greater changes in the
equivalent axial load for the liquid propellant boosted vehicle than for the solid
propellant boosted vehicle, while dispersions on shear and shear length
produce the greater changes in load on the solid propellant boosted vehicle.
This can also be seen from Figures 3 and 4 since dynamic pressure and angle
of attack have a direct effect on the magnitude of the loads. A possible
explanation of this phenomena would be that density, temperature, and wind
velocity are parameters that directly affect the relative velocity and dynamic
pressure of the vehicle; thus, changes in these parameters would affect the
slower moving vehicle (in this case the liquid propellant vehicle) more than
-.11 -
w +0UZ
z -A (Di W>z
CA n'. +l-r 3.4
+ Li
a. N0 0
u 00
0.
30VH 443 ~ 8nS8 IVV~ rLi0- 4
zdE( 0~
00J 10-4 WiW -
X WIi0 cr~~- >
w co
a. z4.
w%* r
-12- ,Go

'I co+
0
0Z I Ir
Z~~ U)z i
c 0 ~ w CD w 'SL
, z a~ 2z Cf) w w+ z %
0
30NVHD 1N33OlM3d \ )13VJ.IV.403-19NV z "o20 m
00
-l 3-Q

L) U
irr
000
F- z

WW~ W~n in~n~treJ W - ~rsvwA rr, WVrwr n .anrar----------------I-
I-I
z
(,.®0
a-toz
a)
C,,
(IVO-l IVIXV .LN3ivAIflO3 NI 30NVHD) IN3083dN N
+ + -
+ a.
o (Z
\ wclLi
OD
@ ,,\
-• • •,• ,,,' ,.- -, ,. . .,•, -.- , - .... ,., , ..,. , . .,- . - .- . . . , _ _., . ... . - .. . . ; .. .. - .. ,- .. - . , - . . .

0w0-
0
0: 4
+ + I
-J +
0:
0
W
6- V
-1O-

u.ioIIle
S 0
I'rz z z<4(0. I -- t
z, LA- - +i IX (no cr
0- w ~ t
Zfl cf c
I AI,,-
_ 00
V CL
-17D
0:3VIOW N
/INNV40WNI 9NVH IN3H0.
LD V. 1+,
OD+
o 2
0.
ozwCL
* OD

(D Zwuw
ar-
00
II ci Ta.
%ZA~ ~~~ ___________
.. ___________________________
-19-
z0 0 w
OF w
cn-
0-
Ln >
>
ILJJ
0~*
0 c0a to
I 01
to - 0 N M
IN3383d .LN30ý3d
Q13SV380NI a3SV38030
-20-
the faster traveling vehicle. Shear and shear length, however, are parameters
which would be morediroctly related to the control system response; therefore
the faster moving vehicle (solid propellant boosted vehicle) would have less
time to respond to these changes. This results in greater changes of load on
the solid propellant boosted vehicle.
Figures 6 and 7 present the percentage changes in both equivalent axial load
and the related risk wind for solid and liquid propellant boosted vehicles,
respectively. While Figure 5 shows the relative comparisons between the
solid propellant boosted vehicle and the liquid propellant boosted vehicle ior
each independently dispcrsed parameter. Figures 6 and 7 show the relative
magnitudes of each dispersed parameter for the vehicle investigated.
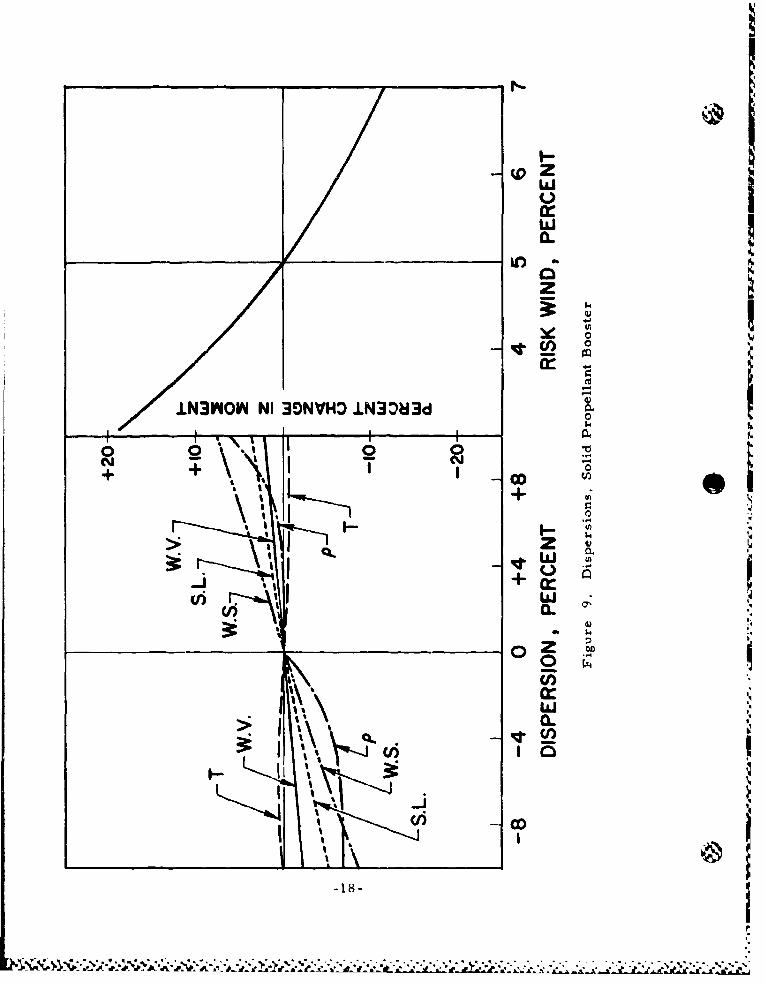
Figures 8 through 10 present similar illustrations of the percentage change in
bending moment as the various atmospheric parameters are dispersed. As
would be expected from the relation PE0 - PAXIAL +ZM/r, the percent
change in bending moment is much greater than the percent change in equiva-
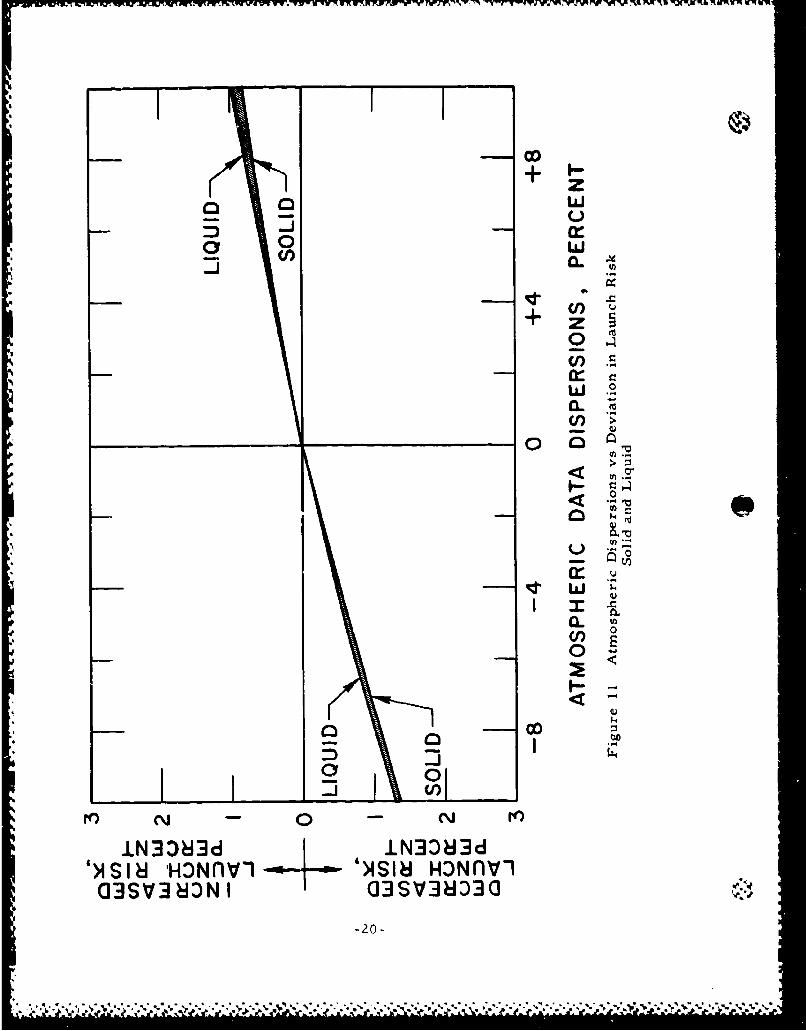
lcnt axial load. For comparative purposes, Figure 1 I shows more directly
tht, change in launch risk for the solid and liqutid propellant boosted vehicles
as a function of atmospheric dispersions. This figure presents an envelope
of maximum effect on launch risk due to all atmospheric parameter dispersions
investigated.
4%
-4 •
V. CONCLUSIONS
This investigation has taken two totally different vehicle configurations to
establish the relative percentage changes in the loads and launch risk as a
function of errors in measurement of atmospheric data. The study has shown
that, although the individually dispersed parameters affected the configurations
differently, the envelope of maximum effect on launch risk, as shown in
Figure 11, was nearly the same for both the solid and liquid propellant
vehicles. Since only two configurations were investigated, it can not be said
with confidence that all vehicles would show the same effects experienced by
these two vehicles. However, for preliminary design purposes, it is felt that
the appropriate figures in this paper, for either a solid or liquid propellant
vehicle, may be used to estimate changes in structural load and launch risk
due to assumed instrumentation errors.
As previously indicated, the accuracy of atmospheric data measurements
does have a noticeable effect on the percentage change in loads and launch
risk. The most important parameters were the air density and the wind
velocity for the liquid propellant boosted vehicle; and, the air density and
wind shear for the solid propellant boosted vehicle. The air density, how-
ever, can be measured with an error of less than 0.5% in the altitude range
of interest. This, therefore, leaves wind velocity, in the case of the liquid
propellant boosted vehicles, and wind shear, in the case of the solid propel-
lant boosted vehicles as the predominant problem areas with regard to
accuracy. For example, if 10 percent accuracies on wind shear and wind
velocity are the best measurements that can be obtained, a vehicle should be
designed for a 4 percent risk criteria rather than a 5 percent risk criteria
to account for the data measurement inaccuracies if 5 percent was the
original design philosophy.
-23-
It would be of interest in future studies to investigate additional vehicle
configurations to determine whether they fall in the bandwidth determined by
this investigation. Also, additional perturbations such as gust effects may be
worth considering in any future investigations. Finally, increased payload
weight capability, as a function of the accuracy of atmospheric data measure-
ments, could be investigated as an outcome of this study.
Se
4C
-24-
PIL-
APPENDIX A
TRAJECTORY SIMULATIONS
-25-
...........
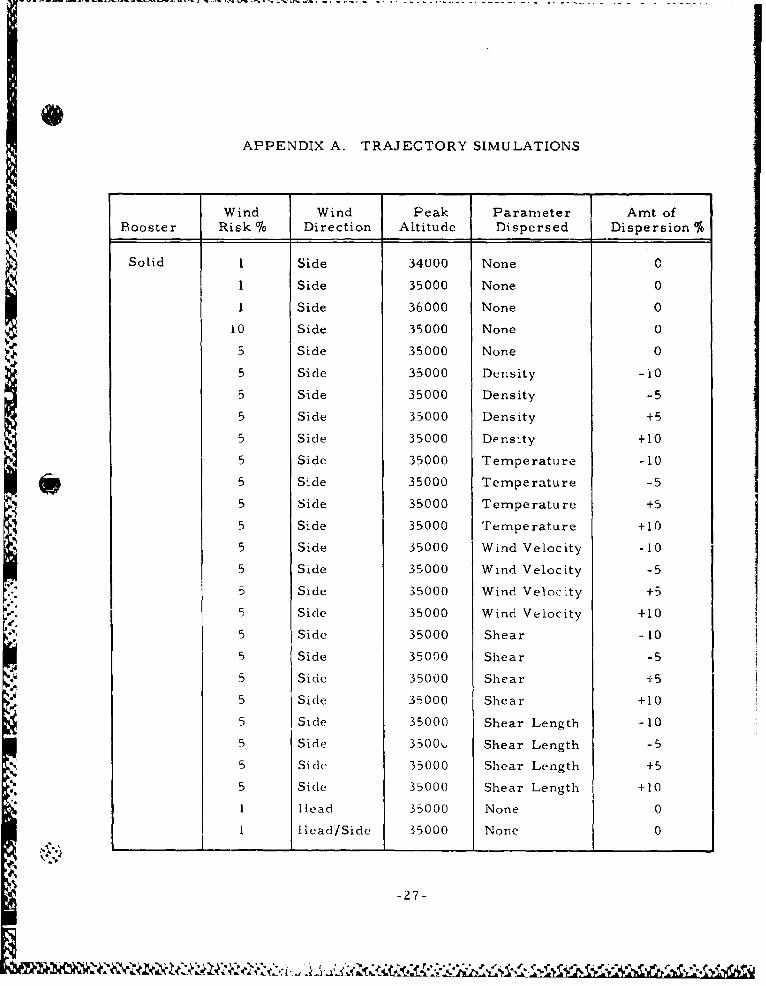
APPENDIX A. TRAJECTORY SIMULATIONS
Wind Wind Peak Parameter Amt ofBooster Risk % Direction Altitude Dispersed Dispersion 91o
Solid 1 Side 34000 None 0
1 Side 35000 None 0
1 Side 36000 None 0
10 Side 35000 None 0
5 Side 35000 None 0
5 Side 35000 Density -10
5 Side 35000 Density -5
5 Side 35000 Density +5
5 Side 35000 Density +10
5 Side 35000 Temperature -10
5 Side 35000 Temperature -55 Side 35000 Temperature +5
5 Side 35000 Temperature +10
5 Side 35000 Wind Velocity -10
5 Side 35000 Wind Velocity -5
5 Side 35000 Wind Velocity +5
5 Side 35000 Wind Velocity +10
5 Side 35000 Shear -V10
5 Side 35000 Shear -5
5 Side 35000 Shear +5
5 Side 35000 Shear +10
5 Side 35000 Shear Length -10
5 Side 35000 Shear Length -5
5 Side 35000 Shear Length +5
5 Side 35000 Shear Length +10
S Siead 35000 None 0
1 Head/Side 35000 None 0
-27-

APPENDIX A. TRAJECTORY SIMULATIONS (Continued)
Wind Wind Peak Parameter Amt ofBooster Risk 0/0 Direction Altitude Dispersed Dispersion %
Solid 1 Side/Tail 35000 None 0
1 Tail 35000 None 0
5 Head 35000 None 0
5 Head/Side 35000 None 0
5 Side/Tail 35000 None 0
5 Tail 35000 None 0
10 Tail 35000 None 0
5 Tail 35000 None 0
5 Tail 35000 Density - 10
5 Tail 35000 Density -5
5 Tail 35000 Density +5
5 Tail 35000 Density +10
5 Tail 35000 Temperature -10
5 Tail 35000 Temperature -5
5 Tail 35000 Temperature +5
5 Tail 35000 Temperature +10
5 Tail 35000 Wind Velocity -10
5 Tail 35000 Wind Velocity -5
5 Tail 35000 Wind Velocity +5
5 Tail 35000 Wind Velocity +10
5 Tail 3500C Shear -10
5 Tail 35000 Shear -5
5 Tail 35000 Shear +5
3 Tail 35000 Shear +105 Tail 35000 Shear Length -10
S5 Tail 35000 Shear Length -5
3 Shear Length +5
'F 5 Tail 35000L,
-28-
IEh!
*~?*~**~ U~ ~ * * S ~

APPENDIX A. TRAJECTORY SIMULATIONS (Continued)
Wind Wind Peak Parameter Amt ofBooster Risk 1 Direction Altitude Dispersed Dispersion %
Solid 5 Tail 35000 Shear Length +10
Liquid 5 Side 35000 None 0
10 Side 35000 None 0
5 SidCe 35000 Density -10
5 Side 35000 Dersity +10
5 Side 35000 Temperature -10
5 Side 35000 Temperature +10
5 Side 35000 Wind Velocity -10
5 Side 35000 Wind Velocity +10
5 Side 35000 Shear -10
5 Side 35000 Shear +10
Side 35000 Shear Length -10
5 Side 35000 Shear Length +10
a.-29
-29 -

g
APPENDIX B
WIND CRITERIA
-31 -

ONE PERCENT RISK80 ... FIVE PERCENT RISK
TEN PERCENT RISK
NON DISPERSEDIj. ,, [
0 60
0 40
0040P
.00
20 o 1-
40 120 200 280 360
V, 9WIND VELOCITY (FPS)
Figure 1Z. Dt sign Wind Vlocity Enwvlopc
3 3,-33- 4.r
It "

0 ON PE T RIS
80 ONE PERCENT RISKFIVE PERCENT RISKTEN PERCENT RISK
I- NON DISPERSEDIL
o 60
z
S0c 0.020 0.040 0.060 0.0800 4
WIND SHEAR, sec-I-
4 'i~urv ] 3. Du.sign Wind Shtar EnvelopL'1 000 Fiit Shear Laytr
a P *o
* L
-34-

80ONE PERCENT RISK
---- FIVE PERCENT RISK--------- TEN PERCENT RISK
NON DISPERSED', ~I--
"U 60LLo
z '
~400
I-I
Zj ' 000-•
0
= 0 0.2 000\.6
2O (I-JJ
I-
I !r
0e0.020 0.040 0.060 1
WIND SHEAR, sec-
F igur, 14. Design Wind Shcar Env, lupc,30UU Feet Shear Layer
Q w'%4-
S4.
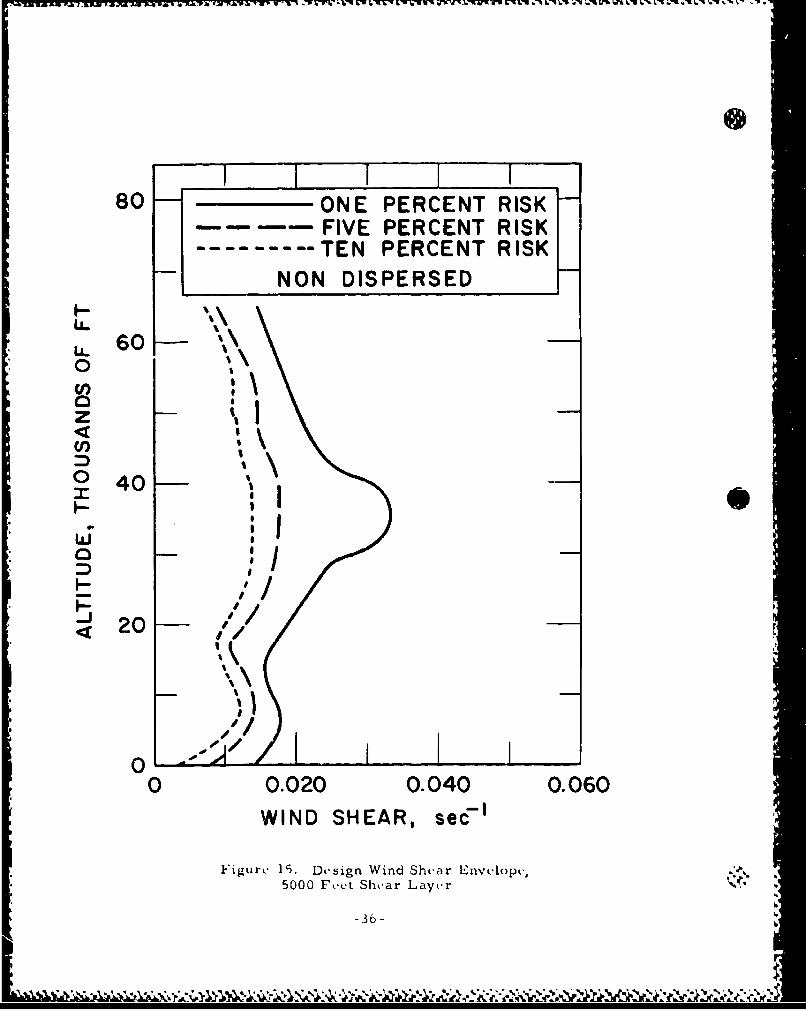
80 ONE PERCENT RISK-- FIVE PERCENT RISK
- ------- TEN PERCENT RISK
NON DISPERSED
LL '6060
o 40
wI* I
~20
0 -
0 0.020 0.040 0.060
WIND SHEAR, sed-1
Figure 1S. Design Wind Shar Eive ,'IOpK,5000 Fe•t Shear LayL.r
-36-
I-.

A ~ rr u n uk-. U- . -
0 1 1 1(1
z Z w 0zN
w 00
a- 0IJ CL w )
LLJLLJ rL(J
z ý wc 0>
*~~ LAIZ%;'
ww
0 0 00
J-4 -40 SONvsflOHJ. '3afliii-v
-37-

0~0.
z~~ z (f4'1
cr. 0rLL
0 - 0~j 0
0-
out
00
0 0
o38-
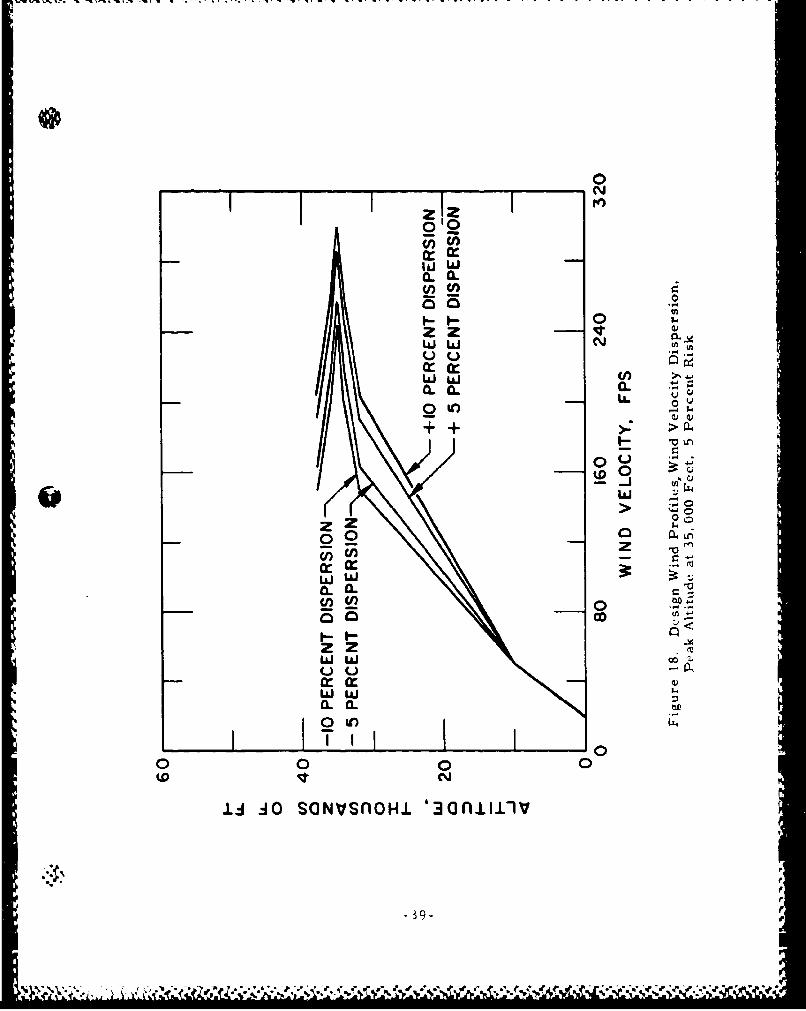
00
02IAJ La
000
cr,. cr
CL CLLL.
00
w00
Z Z I.
00 0 a f
zzz
0. 00N0
CL a.
-39-.
.SIN.
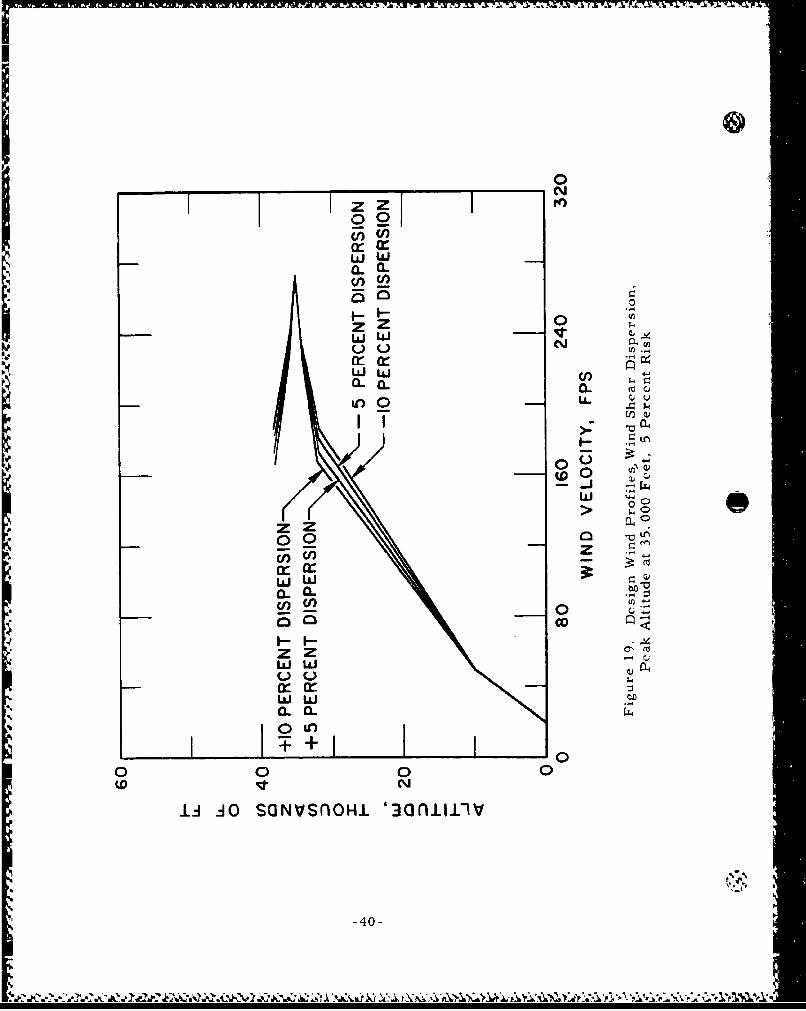
_ 0
CYC
LiJ WZa. 0-
Y)C/ -1
Z Z 0
I-H-
a- a. --
0 00 0 .TN>
Ii .~ SGN~flO-IJ.')GfIIL1
-40-

jjcni
~~re)
z z0wwu
w LLI c
IVLL
00
z z00 oOFo/ Fn
WLLJ L
00 C50N0
P~~r Ir *. -
w
APPENDIX C
TERMS AND SYMBOLS
-43-
V
Air Density - (p)
Air Temperature - (T, degress Rankine)
Angle of Attack - (a)
Axial Load - (PAXIAL)
Basic Trajectory - the no wind trajectory of the vehicle reflecting non-
dispersed inputs such as atmosphere, aerodynamics. weight. etc.
Basic Wind Profile - the wind profile on which dispersions are made.
Pending Moment - (M)
Critical Altitude - that altitude at which the equivalent axial load is a
maximum for a particular vehicle station, when the vehicle is flown
lhrough a basic trajectory and wind profile.
Dispersions - the perturbations made on the basic wind profile in terms of
velocity, wind shear or wind shear length, or to the nominal atmosphere
in terms of density or temperature to simulate inaccuracies in data
n-easurement s.
Dynamic Pressure - (q)
1 2q - pva (1)
Equivalent Axial Load - (PEQ
P2MPEQ PAXIAL + 2)
where
r is radius of vehicle at pertinent station.
Head Wind - a wind blowing from a zero degree azimuth, where the "no wind"
velocity of the vehicle is from a 1800 azimuth.
-45-
Launch Risk - the probability of exceeding a structural load on the vehicle.
(This probability is equal to the wind risk used to obtain the loads.)
Nominal Atmosphere - the atmosphere on which dispersions are made.
Relative Air Velocity - (v a), the velocity of the vehicle center of gravity
relative to the air mass.
Side Wind - a wind blowing from a 900 or 2700 azimuth, where the "no wind"
velocity of the vehicle is from a 1800 azimuth.
Tail Wind - a wind blowing from a 1800 azimuth where the "no wind" velocity
of the vehicle is from a 1800 azimuth.
Wind Risk - the probability of exceeding a particular wind profile.
Wind Shear - the change in wind velocity over a predetermined altitude band.
Wind Shear Length - the altitude band over which the wind shear is determined.
-46-
I-

DISTRIBUTION
Internal
N.N. Au A.G. Norern
Major E. J. Bekius (SSOW) L. Ondrups
L.P. Felton C. Pel
J.S. Field (10) W.F. Radcliffe
E.R. Fleming P. Robertson
1. Getting J. Rossoff
D.E. Hargis (10) G. Smith
T. lura W.P. Targoff
R.F. Johnson A. Victor
A. Mager J.G. Wilder
H.G. Maier Audrey S. Lawin
SM. J. McNeil AOCRC (18 plus Vellum)
B. Moss
External
Defense Documentation Center Lockheed Missile and Space CompanyCameron Station Sunnyvale, CaliforniaAttn: TISIA C. J. Van Der MaasAlexandria. Virginia 22314 (20)
Space Technology LaboratoriesNorton Air Force Base One Space ParkCapt. K. Pitchford (BSD-BSOW) Redondo Beach, California
Curtis KilianAutonctics, Inc. Sol Lutwak1695 Crescent Wil PorterAnaheim, California1-I. Leve
Hughes Aircraft GormpanyP.O. Box 90919Los Angeles 9. California
Robert SandellMail Station A680
-l