Embed Size (px)
Citation preview
The Effects of the Subprime Crisis on the Latin American Financial Markets: An Empirical Assessment
No 2010
The Effects of the Subprime Crisis on the Latin American Financial Markets: An Empirical Assessment
_____________
Gilles Dufrénot
Valérie
Anne Péguin-Feissolle
2010 – 11 July
DO
CU
ME
NT
DE
TR
AV
AIL
The Effects of the Subprime Crisis on the Latin American Financial Markets: An Empirical Assessment
_____________
Gilles Dufrénot
Valérie Mignon
Feissolle
CEPII, WP No 2010-11 The Effects of the Subprime Crisis on the Latin American Financial Markets
2
TABLE OF CONTENTS
Non-technical summary ........................................................................................................... 3
Abstract .................................................................................................................................... 4
Résumé non technique ............................................................................................................. 5
Résumé court ............................................................................................................................ 5
Introduction .............................................................................................................................. 7
1. Data and stylized facts on the volatility of LAC’s stock markets in the aftermath of the subprime crisis .............................................................................................................. 10
1.1. Some empirical facts ..................................................................................................... 10
1.2. Evidencing the regime-dependent characteristic of volatility ...................................... 11
2. Time-varying probability Markov-switching models ................................................... 12
2.1. Motivation and main characteristics ............................................................................. 12
2.2. Definition ...................................................................................................................... 13
2.3. Estimation and methodological issues .......................................................................... 14
3. Main results ................................................................................................................... 16
3.1. Two polar cases: Brazil and Mexico ............................................................................. 16
3.2. The other Latin American countries ............................................................................. 18
3.3. What can explain the observed differences between the Latin American countries? .. 19
4. Conclusion .................................................................................................................... 20
References .............................................................................................................................. 21
Appendix ................................................................................................................................ 23
List of working papers released by CEPII ............................................................................. 38
CEPII, WP No 2010-11 The Effects of the Subprime Crisis on the Latin American Financial Markets
3
THE EFFECTS OF THE SUBPRIME CRISIS ON THE LATIN AMERICAN FINANCIAL MARKETS : AN EMPIRICAL ASSESSMENT
NON-TECHNICAL SUMMARY
The aim of this paper is to answer the following question: can the considerable rise in the volatility of the Latin American countries’ (LAC) equity markets in the aftermath of the 2007/2008 crisis be explained by the worsening financial environment in the US markets? While it may be thought obvious at first sight, the answer to this question is not straightforward. Indeed, some countries experienced a situation of financial decoupling with respect to the US markets, while others seem to have been strongly affected. More specifically, due to the disastrous consequences of the financial crises they faced during the decades of 1990 and 2000, LAC’s policymakers adopted measures aiming at insulating their markets from external shocks. Firstly, they adopted macroeconomic policies to avoid future crises due to flawed fundamentals. Secondly, there was a passionate debate among the policymakers regarding the opportunity of adopting measures such as capital controls as a management tool in times of crises. Mexico and Argentina opted for a total liberalization, while Brazil, Chile and Colombia chose to adopt capital controls during the years preceding the 2007 crisis. The question of financial decoupling is still a debated issue in Latin America.
The modeling strategy adopted is based on regime-switching volatility models, and aims at investigating whether a financial stress in the US markets increases the likelihood of a financial turbulence in the LAC markets. Compared to the previous ones, the time-varying probability Markov-switching model has the advantage of being helpful in investigating whether the impact of the financial stress indicators is nonlinear, with an influence differing between crisis and non-crisis episodes. Crisis and non-crisis regimes are identified endogenously, and the switch from one regime to the other can happen at any time. In other words, contrasting with structural break models, the time of the changes is not forced a priori, and we do not separate, ex ante, the sample into two parts with respect to a given time.
Considering daily data from January 2004 to April 2009, we find that financial stress was unequally transmitted from the US market to the various LAC’s equity market volatility: Mexico and Chili are the countries for which the interdependencies with the United States are the most important, while Brazil, Colombia and Peru seem to be more sensitive to the volatility of the regional financial markets. Moreover, the transmission mechanism is evidenced to be nonlinear since the pass-through in the crisis regime is stronger than in the calm period expanding from 2004 to 2006.
CEPII, WP No 2010-11 The Effects of the Subprime Crisis on the Latin American Financial Markets
4
ABSTRACT
The aim of this article is to answer the following question: can the considerable rise in the volatility of the LAC stock markets in the aftermath of the 2007/2008 crisis be explained by the worsening financial environment in the US markets? To this end, we rely on a time-varying transition probability Markov-switching model, in which “crisis” and “non-crisis” periods are identified endogenously. Using daily data from January 2004 to April 2009, our findings do not validate the “financial decoupling” hypothesis since we show that the financial stress in the US markets is transmitted to the LAC’s stock market volatility, especially in Mexico.
JEL Classification: C13, C22, G01, G15. Key Words: Stock markets, volatility, financial stress, regime-switching, Markov-
switching model.
CEPII, WP No 2010-11 The Effects of the Subprime Crisis on the Latin American Financial Markets
5
LES EFFETS DE LA CRISE DES SUBPRIMES SUR LES MARCHES FINANCIERS
D’A MERIQUE LATINE : UNE INVESTIGATION EMPIRIQUE
RESUME NON TECHNIQUE
L’objet de cet article est de répondre à la question suivante : dans quelle mesure le fort accroissement constaté de la volatilité sur les marchés financiers des pays d’Amérique latine suite à la crise de 2007/2008 peut-il s’expliquer par la dégradation de l’environnement financier sur les marchés américains ? Bien que la réponse à cette interrogation puisse sembler évidente à première vue, tel n’est pas le cas. En raison des conséquences désastreuses des crises qu’ils ont connues dans les années 1990 et 2000, les décideurs politiques d’Amérique latine ont en effet cherché à isoler leurs économies des chocs extérieurs. Ils ont mené des politiques macroéconomiques visant à améliorer leurs fondamentaux et à renforcer leur capacité de réaction aux chocs extérieurs. De plus, alors que certains (Mexique, Argentine) ont opté pour une libéralisation totale de leur économie, d’autres, le Brésil, le Chili et la Colombie, ont conservé des instruments de contrôle des capitaux.
La stratégie de modélisation que nous retenons est basée sur les modèles de volatilité à changement de régime et vise à tester si des tensions financières aux Etats-Unis accroissent la probabilité d’un épisode de turbulence sur les marchés d’Amérique latine. Comparé aux modèles antérieurs, le modèle Markov-switching à probabilités de transition variables permet d’appréhender si l’impact des indicateurs de tension financière est non linéaire, avec une influence différant suivant les périodes de crise et de calme. Les régimes de crise et de calme sont identifiés de façon endogène, et le passage d’un régime à l’autre peut apparaître à tout moment. En d’autres termes, contrairement aux modèles plus traditionnels de rupture structurelle, la date du changement de régime n’est pas imposée a priori.
Utilisant des données quotidiennes sur la période janvier 2004 - avril 2009, nous montrons que la crise financière américaine n’a pas affecté de façon homogène la volatilité des marchés financiers des pays d’Amérique latine : le Mexique et le Chili sont les pays pour lesquels les interdépendances avec les Etats-Unis sont les plus fortes, la Colombie, le Pérou et le Brésil semblant plus réagir à l’environnement financier régional. Le mécanisme de transmission est en outre non linéaire, au sens où l’influence du marché américain est plus importante durant la période de crise que durant la période de calme des années 2004 à 2006.
RESUME COURT
L’objet de cet article est de répondre à la question suivante : dans quelle mesure le fort accroissement constaté de la volatilité sur les marchés financiers des pays d’Amérique latine suite à la crise de 2007/2008 peut-il s’expliquer par la dégradation de l’environnement financier sur les marchés américains ? A cette fin nous recourons à un modèle à changement
CEPII, WP No 2010-11 The Effects of the Subprime Crisis on the Latin American Financial Markets
6
de régime à probabilités de transition variables dans lequel les périodes de crise et de calme sont identifiées de façon endogène. Utilisant des données quotidiennes sur la période janvier 2004 - avril 2009, nos résultats vont dans le sens d’un rejet de l’hypothèse d’un découplage financier puisque la dynamique de la volatilité sur les marchés financiers des pays d’Amérique latine n’est pas indépendante de la situation financière des Etats-Unis, tout particulièrement dans le cas du Mexique.
Classification JEL : C13, C22, G01, G15. Mots-clefs : marchés financiers, volatilité, crise financière, changement de régime,
modèle Markov-switching.
CEPII, WP No 2010-11 The Effects of the Subprime Crisis on the Latin American Financial Markets
7
THE EFFECTS OF THE SUBPRIME CRISIS ON THE LATIN AMERICAN FINANCIAL
MARKETS : AN EMPIRICAL ASSESSMENT ♦
Gilles Dufrénot*
Valérie Mignon**
Anne Péguin-Feissolle***
INTRODUCTION
The aim of this paper is to examine whether the subprime crisis that started in August 2007 has played a role in the financial turmoil that has characterized the Latin American countries’ (LAC) stock markets at the end 2008 and beginning 2009. While such influence may be thought as obvious at first sight, we show that this was not necessarily the case. Indeed, some countries experienced a situation of financial decoupling with respect to the American markets, while others seem to have been strongly affected. The modeling strategy adopted—based on regime-switching volatility models—refers to the vast literature on early warning systems of financial crises, and aims at investigating whether a financial stress in the US markets increases the likelihood of a financial turbulence in the LAC markets. Our findings support the idea of heterogeneity among the LAC markets, in the sense that the 2007/2008 subprime crisis did not equally affect all the countries, despite the fact that high volatility of the equity prices was observed everywhere. This is in accordance with the two views that have been at the centre of the policy debate in Latin America regarding the vulnerability of the financial markets to the subprime crisis.
On the one hand, one may claim that the LAC’s banking and financial sectors showed resilience to the crisis and put forward the thesis of a financial decoupling with respect to the rest of the world (see Powell and Martinez (2008) and Pereira Valadao and Gico Jr. (2009) among others). Although the countries initiated vast liberalization reforms of their financial markets, they still had a low market capitalization, a weak financial depth and the banking intermediation represented almost 90% of the non-financial corporate financing before the crisis. The spectacular development of market capitalization was the fact of only a few big companies. Furthermore, many domestic banks remained solvent and profitable, had healthy capital adequacy ratios and median return on equity. Above all, the domestic banks held few of the “toxic assets” that triggered the subprime crisis. According to this view, the crisis in the LACs was essentially the consequence of a factor that is not related to a “financial channel”, namely the precipitous decline in prices of raw materials which reversed the growth rates of
♦ We would like to thank Agnès Bénassy-Quéré and Gunther Capelle-Blancard for helpful comments and suggestions.
* CEPII and DEFI, University of Aix-Marseilles, France. University of Aix-Marseilles, Les Milles (Château Lafarge),
Route des Milles, 13290, Les Milles, France. Tel: +33 4 42 93 59 60, Fax: + 33 4 42 38 95 85, Email: [email protected]. **
EconomiX-CNRS, University of Paris Ouest and CEPII, Paris, France. University of Paris Ouest, 200 avenue de la République, 92001 Nanterre cedex, France. Tel: + 33 1 40 97 58 60, Fax: +33 1 40 97 77 84, Email: [email protected]. ***
GREQAM-CNRS, Marseilles, France. Centre de la Charité, 2 rue de la Charité, 13236, Marseilles Cedex 02, France. Tel: +33 4 91 14 07 70, Fax: +33 4 91 90 02 27, Email: [email protected].
CEPII, WP No 2010-11 The Effects of the Subprime Crisis on the Latin American Financial Markets
8
the last five years.1 So, a downward movement in the terms of trade was the dominant factor
of the economic collapse (IMF (2008), Powell and Martinez (2008) and Pereira Valadao and Gico Jr. (2009)).
On the other hand, one can think about the influence of financial factors, given the degree of integration between the LAC’s financial markets and the United States’. Empirical papers studying the co-movements across stock markets report increasing correlations during the past five years, especially since 2007 (see Gonzalez-Hermosillo and Hesse (2009)). Studies by the IMF (2008) also point to spillover effects from the US financial markets to the LAC’s through different channels (equity market channel, market risk premium, global credit, etc.). Besides, there are cross-border effects implying that LAC financial markets are integrated with advanced economies. Indeed, many LAC have endured the sharp decrease in the US liquidity market (a typical example is Mexico), have suffered from funds withdrawals (as foreign banks transferred resources to their central offices), and the equity markets accumulate losses that threat the life of some companies (examples are Chile and Colombia).
We do not examine in this paper the question as whether the financial stress in the US during the subprime crisis propagated to the LAC through real or financial channels. Recent studies show that these channels were in fact intertwined (for an illustration, see Paiva (2009)). We rather concentrate on the financial linkage and examine empirically the link between the US subprime crisis and the volatility of the LAC stock markets. There are several motivations to focus our attention on volatility. First, volatility of equity prices is usually viewed as an indicator of financial stress for the different segments of financial markets. Secondly, over the last ten years, the volatility of LAC financial markets has become a key determinant for explaining the risk-taking behaviors of investors, especially the substitution in their portfolios between different categories of securities (corporate and government bonds). Thirdly, as volatility tends to decline (resp. increase), it releases (resp. augments) risk budgets of financial firms and encourages (resp. discourages) position-taking. In particular, during the subprime crisis, the observed changes in volatility determined adjustments in domestic balance sheets and leverage conditions.
We thus aim at answering the following question: can the considerable rise in the volatility of the LAC equity markets in the aftermath of the 2007/2008 crisis be explained by the worsening financial environment in the US markets? As previously explained, the answer to this question is not straightforward. Indeed, due to the disastrous consequences of the financial crises they faced during the decades of 1990 and 2000, LAC’s policymakers adopted measures aiming at insulating their markets from external shocks. Firstly, they adopted macroeconomic policies to avoid future crises due to flawed fundamentals.
2 Secondly, there
was a passionate debate among the policymakers regarding the opportunity of adopting measures such as capital controls as a management tool in times of crises. Mexico and Argentina opted for a total liberalization, while Brazil, Chile and Colombia chose to adopt capital controls during the years preceding the 2007 crisis. The question of financial decoupling is still a debated issue in Latin America.
1 In this paper we focus our attention on the “financial channel” and on testing the financial decoupling hypothesis.
While interesting, the question as whether the LAC equity markets were affected by the subprime crisis through raw materials or real channels is beyond the scope of the paper. 2 The IMF economic outlook for LAC in 2007 and 2008 show that these countries had good economic fundamentals
during the subprime turmoil.
CEPII, WP No 2010-11 The Effects of the Subprime Crisis on the Latin American Financial Markets
9
To choose the financial variables that could have affected the LAC equity price volatility, we refer to the literature
3 suggesting that several adverse spillover effects may explain the
transmission of the global crisis to the LAC’s financial sectors: (i) the slowdown in total lending by foreign parent banks to their local affiliates due to liquidity constraints in interbank markets (credit crunch transmission channel), (ii) sudden stop effects implied by liquidity risks in the international markets and inducing withdrawals of liabilities owed to nonresidents, (iii) the lack of access to foreign borrowing, (iv) the losses associated with foreign exchange derivative positions, and (v) banks’ exposure to stock market fluctuations. As the global crisis originated in the financial markets of the industrialized countries, these channels are expected to be closely tied with financial stress indicators, particularly those reflecting market and liquidity risks: ABCP (asset-backed commercial papers) and CDS (collateralized debt obligations) spreads, bank funding liquidity, stock market liquidity, and also spillover effects stemming from arbitrage between advanced and emerging markets. In this paper, we use these variables as indicators of the financial stress prevailing in the US markets.
Our study relies on a sample of five countries, namely Brazil, Chile, Colombia, Mexico, and Peru. Our main contribution lies in the empirical approach retained. Several econometric models have been used in the empirical literature to address the following question: do periods of high volatility identified by the models coincide with periods that are identified by the policymakers as episodes of financial turmoil? Recent studies have looked at this issue during the subprime crisis (Frank et al. (2008), Berglof et al. (2009), Gonzalez-Hermilloso and Hesse (2009), Rose and Spiegel (2009)). In terms of model specification, many of them rely on VAR models, multivariate GARCH models, or time-varying common factor models. In this paper, we re-examine this issue using a more powerful econometric tool, namely a time-varying transition probability Markov-switching model (TVPMS). Compared to the previous ones, this model has the advantage of being helpful in investigating whether the impact of the financial stress indicators is nonlinear, with an influence differing between crisis and non-crisis episodes. Crisis and non-crisis regimes are identified endogenously, and the switch from one regime to the other can happen at any time. In other words, contrasting with structural break models, the time of the changes is not forced a priori, and we do not separate, ex ante, the sample into two parts with respect to a given time.
Considering daily data from 2004 to mid 2009, we find that financial stress—defined by several indicators of impaired financial liquidity and risk during the years 2007/2008—was unequally transmitted from the US market to the various LAC’s equity market volatility.
4 The
transmission mechanism is evidenced to be nonlinear since the pass-through in the crisis regime is stronger than in the calm period expanding from 2004 to 2006. Unprecedented spikes in the US stock market volatility, the ABCP and CDS spreads, and the banking funding liquidity, elevated the volatility of equity markets in the LAC beyond levels reached before 2007. On the whole, our findings play against the hypothesis of a “financial decoupling”, in the sense that the dynamics of volatility in the LAC equity was not insulated from the financial stress in the US markets.
The rest of the paper is organized as follows. Section 2 presents the data and some stylized facts on the volatility of the LAC’s equity markets. They suggest both the presence of an asymmetric dynamics and co-movements with the financial stress indicators in the US markets. In Section 3, methodological concerns relating to TVPMS models are outlined. In
3 See IMF (2008) and Berkmen et al. (2009).
4 Daily data are likely to be more revealing than lower frequency data for an analysis of financial sector soundness.
CEPII, WP No 2010-11 The Effects of the Subprime Crisis on the Latin American Financial Markets
10
Section 4, we estimate and comment the different TVPMS models. Finally, Section 5 concludes.
1. DATA AND STYLIZED FACTS ON THE VOLATILITY OF LAC’ S STOCK MARKETS IN THE
AFTERMATH OF THE SUBPRIME CRISIS
We investigate the links between the financial markets of the US and five Latin American countries for which we have a complete database: Brazil, Chile, Colombia, Mexico, and Peru. To this end, we use daily data for the following series: (1) equity market indices for the five considered Latin American countries. To ensure that our results are not specific to a particular stock price series, two equity indices are considered for each country. On the one hand, we rely on the S&P/IFCI price indices, that are subsets of S&P/IFCG indices,
5 and measure the
returns of stocks that are legally and practically available to foreign investors. On the other hand, we use the following stock market indices: (i) BOVESPA price index for Brazil, (ii) Chile INTER10 price index for Chile, (iii) IGBC price index for Colombia, (iv) BOLSA price index for Mexico, and (v) LIMA SE price index for Peru; (2) ABCP and CDS spreads from which we derive indicators of, respectively, funding liquidity and financial institution’s default risk; (3) US S&P 500 stock market index whose squared returns act as a proxy of the US market volatility; (4) index of the US market liquidity.
6 Data are extracted from
Datastream and span the period from January 2004 to April 2009.
1.1. Some empirical facts
INSERT FIGURE 1 ABOUT HERE
Figure 1 summarizes preliminary evidence regarding the squared returns of the stock indices,7
by highlighting a huge increase in volatility during the year 2008. The figures also show higher volatility before the onset of the subprime crisis period (“local” peaks). Moreover, the highly leptokurtic distributions of the squared returns suggest a non-constant and time-dependent volatility. To account for these characteristics, we estimate alternative GARCH-type models to see whether they capture a phenomenon of volatility clustering. Figure 2 shows the graphs of the volatility derived from a simple GARCH model.
INSERT FIGURE 2 ABOUT HERE
The GARCH specification puts forward the existence of changing regimes in the volatility of stock markets. Indeed, in September 2008, the stock returns volatility increases strongly in the five countries. The collapse of Lehman Brothers entailed a wave of stress on LAC stock markets. However, the countries show some peculiarities, which are revealed by the different graphs.
5 S&P/IFCI indices typically cover a high percentage of the stocks in the S&P/IFCG indices.
6 The complete description of data is given in Appendix 1. For Colombia, many data on the S&P/IFCI equity index
were lacking, so for this country we only consider the IGBC stock index series. The series are transformed into first-difference since the unit root tests show that they are I(1) (results available upon request to the authors). 7 Similar patterns are obtained with the S&P/IFCI indices, but have not been reported here to save space.
CEPII, WP No 2010-11 The Effects of the Subprime Crisis on the Latin American Financial Markets
11
Consider first the case of Brazil. During the crisis, the volatility increases at exceptional levels and reaches a maximum around 45
8 at the beginning of October 2008. However, this peak of
volatility is not long-lasting, because the volatility falls once after (achieving levels close to 5). The crisis thus induced a sudden increase in volatility, but of low duration, in the Brazilian stock market. Turning to Chile, the movements of volatility are a little bit different. We indeed notice a surge in October 2008, but also a strong increase at the beginning of the year. The market underwent a situation of stress before the collapse of the world stock markets. We also observe that the amplitude of the volatility is not the same as in Brazil, because, in non-crisis periods, the volatility varies between 0.5 and 2 depending upon whether the market is in a phase of low or high volatility. From the year 2008, the volatility increases, until reaching a peak around 15 in October, and then decreases smoothly at levels comparable to those preceding the year 2008.
Regarding Colombia, the pattern exhibits differences in comparison with the other countries. This country experienced a very sudden acceleration of its volatility during the months of May and June 2006, achieving a level of 70. This period was characterized by a strong fall of the stock market returns. Indeed, a 10% fall in the index forced the stock market authorities in Bogota to suspend their operations for the first time of their history. After this period, the volatility stabilizes near 2. A second period of stress appears at the beginning of 2008, but of much weaker intensity, since the volatility reaches “only” a level of 23. Finally, like the other countries, Colombia underwent the effects of the fall of the world stock markets in October 2008, and its volatility increased quickly. Like Colombia, Mexico experienced a situation of financial stress on its stock market during the month of June 2006, but in a much lesser proportion (its volatility was only near 8). However, the volatility increased at the end of the years 2007 and 2008.
Finally, Peru underwent episodes of exceptional volatility during the financial crisis, particularly after the fall of Lehman Brothers: the volatility reaches a level equal to 125 in October 2008, increasing the risk of variations of the short-term returns. A strong period of volatility also appears at the end of the year 2007 till the middle of 2008, caused by the important phase of stress during which the stock market decreased by 70 %.
1.2. Evidencing the regime-dependent characteristic of volatility
We estimate alternative linear and nonlinear GARCH-family models to investigate whether the squared returns show time-varying dynamics in the volatility of stock returns. In particular, we are interested in detecting asymmetric dynamics, regime-dependent behaviors, smooth and rapid transition from low (resp. high) to high (resp. low) volatility, and highly persistent volatility regimes during a period that includes the months of the subprime crisis. Tables A1 and A2 in Appendix 2 display the values of the information criteria corresponding to the different estimated models.
9 They show an overwhelming evidence that the models that
account for regime-dependent volatility uncover the data better than the others. For the S&P/IFCI series, both the LSTGARCH and ESTGARCH nonlinear models indeed yield the
8 These figures regarding the level of volatility are given only for comparison purposes across countries (they have no
unit). 9 The estimated GARCH models are the following: GARCH, Exponential GARCH (EGARCH), Power GARCH
(PGARCH), Logistic and Exponential Smooth Transition GARCH (LSTGARCH and ESTGARCH), Asymmetric Nonlinear Smooth Transition GARCH (ANST-GARCH) and Quadratic GARCH (QGARCH). To avoid too many tables, and because this paper focuses on alternative regime-dependent models, the estimates are not reported but are available upon request to the authors.
CEPII, WP No 2010-11 The Effects of the Subprime Crisis on the Latin American Financial Markets
12
lowest values of the information criteria and the highest maximum likelihood. For the other stock returns series, the LSTGARCH model is also the best specification for Colombia, Mexico and Peru, while the Q-GARCH and EGARCH models fit better the squared returns of Brazil and Chile.
The nonlinear GARCH models provide evidence that we should rely on regime-dependent volatility models to account for the properties of the squared returns. However, regarding our main objective—testing the hypothesis of a link between the degradation of US financial markets and the volatility of the LAC stock markets—using autoregressive models is not enough. Indicators of financial stress in the US markets can be considered as “common factors” to the LAC countries, explaining why we observe “explosion” of volatility at the same dates in the five equity markets (2006 for Colombia and Mexico, 2007 and 2008 for all the countries). These common factors are, for instance, the ABCP and CDS spreads, the US market liquidity, or the interbank market rates. Figures 3 through 6 show that these variables exhibit a high variability during the periods of increasing volatility in the equity markets in the five Latin American countries.
INSERT FIGURES 3 THROUGH 6 ABOUT HERE
Common markets factors are not easily handled in standard GARCH-family models10
because they imply strong restrictions for the conditions of stationarity and non-negativity of the variance (see for instance Hwang and Satchell (2005)). Alternative models have thus been suggested in the literature, such as factor models which have been found very successful.
11
These models are however not suited for our goal. Indeed, we do not seek to discriminate between countries’ volatility changes induced respectively by idiosyncratic and common components. We focus on components related to worldwide variables and want to see how they affect the volatility regime. We accordingly consider an alternative framework—time-varying probability Markov-switching model—to investigate whether the regime-dependent property of the volatility can be explained by the financial stress indicators in the US market.
2. TIME -VARYING PROBABILITY MARKOV -SWITCHING MODELS
2.1. Motivation and main characteristics
We estimate time-varying probability Markov-switching (TVPMS) models in order to account for changes in volatility regimes. We consider “ordinary” regimes characterized by low variations of the price indices, and identify “crisis” or “turbulent” regimes when they manifest with large price deviations (high volatility). The TVPMS models are more suited for our analysis than other early warning systems or signal extraction models (logit/probit models, event analysis, signal approach) for the following reasons.
First, a financial crisis is not predictable ex ante. The signal approach requires an ex ante definition of a threshold level above which one considers that a crisis is triggered. Similarly, the logit/probit analysis requires the definition of a crisis dummy, with possible misspecifications. One advantage of the TVPMS model is that we let the model determine endogenously which days correspond to low and high volatility.
10
Such models are called GARCHX models. 11
See, among many others, Engle et al. (1990), Campbell et al. (2001), Connor et al. (2006), Clements and Collet (2008).
CEPII, WP No 2010-11 The Effects of the Subprime Crisis on the Latin American Financial Markets
13
Secondly, the TVPMS model can be considered as the autoregressive representation of a probabilistic nonlinear GARCH model, and is thus more general than a usual deterministic nonlinear GARCH model. This model mimics the volatility as resulting from a learning phenomenon with investors making a Bayesian inference on the process that governs volatility changes. The volatility dynamics is time-varying, with the volatility today being influenced by its past level according to the value taken by a third variable. The latter is unobserved, and the way in which regime shifts from low to high volatility occur is not known with certainty. For instance, regarding the numerous factors that usually affect the equity price volatility in the LAC (economic policies, speculation, contagion channels stemming from trade or financial linkages), we cannot say a priori that the turmoil in the American financial markets was the root cause of the observed increased volatility of the LAC equity markets during 2008. The only thing we can say is that this may have been the case with a given likelihood. The TVPMS model precisely tries to evaluate this likelihood.
Thirdly, since we are looking for changes in volatility regimes that are associated with the crisis, the kind of underlying regime change is assumed to happen only occasionally and to take the form of discrete events. Such changes are not adequately captured by standard nonlinear GARCH models since the latter assume that changes occur continuously over the sample
2.2. Definition
We consider an endogenous variable (t = 1, …, T) which “visits” two regimes: a high volatility regime corresponding to crisis periods, and a low volatility regime capturing non-crisis or “normal” periods. The occurrence of a regime is referred by an unobserved state variable that takes two values: 1 if the observed regime is 1 and 2 if it is regime 2.
12
is conditioned by , , , . At any time , the regime that will be observed at time t is not known with certainty. We thus introduce a probability P of occurrence of given the past regime. We assume, for purpose of simplicity, that is a first-order Markov chain with transition probabilities:
⁄ , , , ⁄ , , (1)
where is a vector of predetermined “transition” variables that govern the transition from one regime to the other (see Kim et al (2008)).
Assuming a Probit specification13 for the occurrence of on , we have:
1, ′2, ′!, (2)
where " . . $0,1. We accordingly define the transition probabilities as follows:
12
We do not discuss here the question as whether the number of states is equal to or different from 2. The interested reader may refer to Hamilton (1991), Hansen (1992), and Garcia (1998). 13
Any functional form of the transition probabilities that maps the transition variables into the unit interval would be a valid choice for a well-defined log-likelihood function: logistic or Probit family of functional forms, Cauchy integral, piecewise continuously differentiable variables. We consider here the Normal law because this choice is common wisdom in the applied literature (see Kim et al. (2008)).
CEPII, WP No 2010-11 The Effects of the Subprime Crisis on the Latin American Financial Markets
14
1 &⁄ , '( ) a+ z-′b+/ Φ)a+ z-′b+/ 2 &⁄ , '( ) a+ z-′b+/ 1 0 Φ)a+ z-′b+/!, (3)
where Φ is the standard Normal cumulative distribution function.
Consider a k×1 vector xt of exogenous variables influencing the endogenous variable yt. We define the time-varying probability Markov-switching (TVPMS) model as:
1′2 34, 5 6 '789 '( 1′2 34, 5 6 '789 '( !, (4)
where 4 : . . $0,1 and ;4< " $0,Σ, Σ =1 >> 1? and @8A4, BC 0, D6 E 0. The usual probabilistic properties for the ergodicity and the invertibility of (4) applies if we assume that , 1 FG are covariance-stationary.
14
The above model can be generalized to a higher number of states (see Kim et al. (2008)) and encompasses several classes of Markov-switching models previously proposed in the literature. It is very similar to the time-varying probability models introduced by Goldfeld and Quandt (1973), Diebold et al. (1994), Filardo (1994), but it is more general by assuming that the two processes εt and ηt are correlated (> E 0) and that the variances across regimes are not the same. When ( 0, the model reduces to the constant probability model proposed by Goldfeld and Quandt (1973) and Hamilton (1989).
In our case, the endogenous variable yt will consist in the changes in the volatility of equity markets for each considered LAC, and the variables in zt will be different stress indicators in the US financial markets (see infra). The exogenous variable will consist of the first lag of the endogenous variable. Therefore, we shall examine the dynamics of volatility in the LAC’s stock markets when they are influenced by the US financial stress indicators.
2.3. Estimation and methodological issues
The above model is estimated via the maximum likelihood (henceforth ML) method with relative minor modifications to the nonlinear iterative filter by Hamilton (1989). We define the following vectors: Ω HI, JI’ the vector of observations of x and z up to time t, K , , … , ’ the vector of observations of the endogenous variable, and M )2, 3, , , 2, 3, , ,>/’ the vector of parameters.
The conditional likelihood function of the observed data K is defined as
NM ∏ Ω⁄ , K; MQR (5)
where
Ω⁄ , K; M ∑ ∑ ⁄ , &,Ω, K; M(TU , & Ω⁄ , K; M. (6)
The weighting probability in (6) is computed recursively by applying Bayes’ rule:
14
See Hamilton (1989).
CEPII, WP No 2010-11 The Effects of the Subprime Crisis on the Latin American Financial Markets
15
, & Ω⁄ , K; M T( & Ω⁄ , K; M ⁄ &, & Ω⁄ , K; M T( & Ω⁄ , K; M (7)
We also have
ΩV⁄ , K; M Ω⁄ , K; M WXY ΩY⁄ ,ZY[\;] ∑ ⁄ , &,Ω, K; M(U , & Ω⁄ , K; M (8)
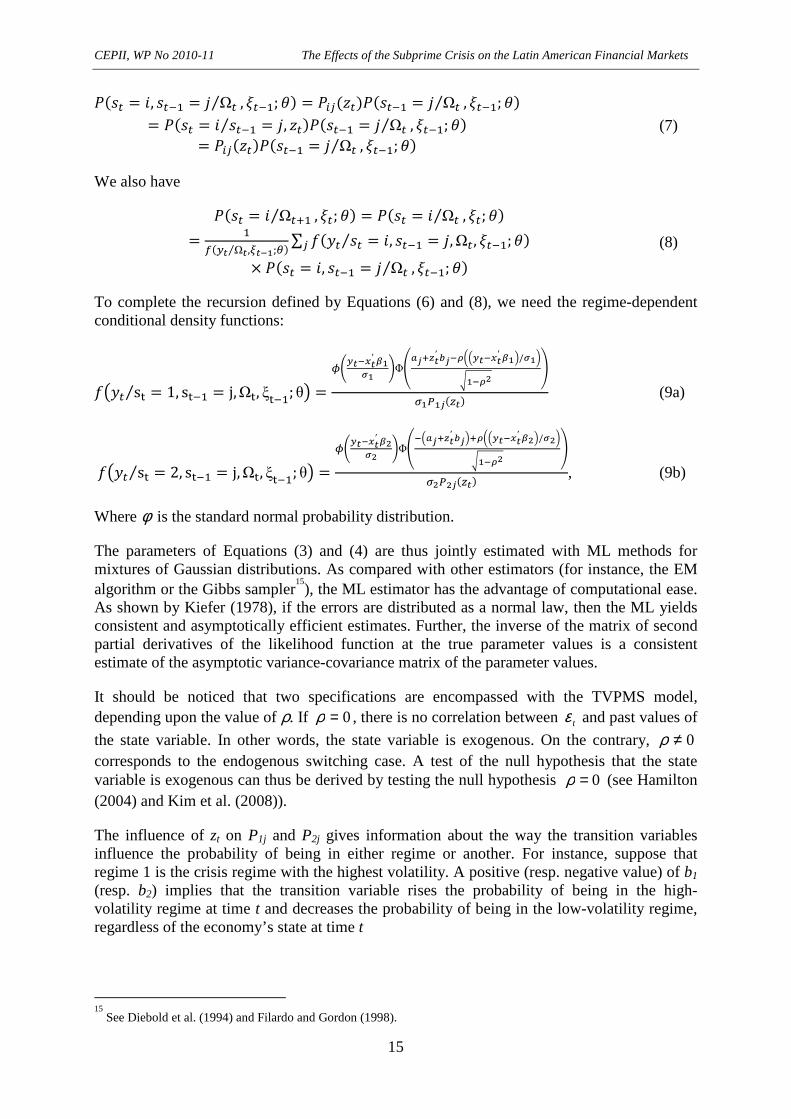
To complete the recursion defined by Equations (6) and (8), we need the regime-dependent conditional density functions:
) s-⁄ 1, s- j,Ω-, ξ-; θ/ `abY[cY′ d\e\ fΦghijkY′ li[mnobY[cY′ d\p/e\rs\[mt u
v\w\ixY (9a)
) s-⁄ 2, s- j,Ω-, ξ-; θ/ `abY[cY′ dtet fΦg[ohijkY′ lipjmnobY[cY′ dtp/etrs\[mt u
vtwtixY , (9b)
Where φ is the standard normal probability distribution.
The parameters of Equations (3) and (4) are thus jointly estimated with ML methods for mixtures of Gaussian distributions. As compared with other estimators (for instance, the EM algorithm or the Gibbs sampler
15), the ML estimator has the advantage of computational ease.
As shown by Kiefer (1978), if the errors are distributed as a normal law, then the ML yields consistent and asymptotically efficient estimates. Further, the inverse of the matrix of second partial derivatives of the likelihood function at the true parameter values is a consistent estimate of the asymptotic variance-covariance matrix of the parameter values.
It should be noticed that two specifications are encompassed with the TVPMS model, depending upon the value of ρ. If 0=ρ , there is no correlation between tε and past values of
the state variable. In other words, the state variable is exogenous. On the contrary, 0≠ρ corresponds to the endogenous switching case. A test of the null hypothesis that the state variable is exogenous can thus be derived by testing the null hypothesis (see Hamilton (2004) and Kim et al. (2008)).
The influence of zt on P1j and P2j gives information about the way the transition variables influence the probability of being in either regime or another. For instance, suppose that regime 1 is the crisis regime with the highest volatility. A positive (resp. negative value) of b1 (resp. b2) implies that the transition variable rises the probability of being in the high-volatility regime at time t and decreases the probability of being in the low-volatility regime, regardless of the economy’s state at time t
15
See Diebold et al. (1994) and Filardo and Gordon (1998).
0=ρ
CEPII, WP No 2010-11 The Effects of the Subprime Crisis on the Latin American Financial Markets
16
3. MAIN RESULTS
The results of the estimation of our TVPMS models are contained in Tables 1a through 5.16
The endogenous variable is the changes in volatility for each Latin American market. Various transition variables are considered that aim at representing financial characteristics such as market liquidity, funding liquidity, default risk and attitudes towards risk.
17 To proxy these
concepts, the following six transition variables are used:18 (i) ABCP spreads, which is an
indicator of funding liquidity conditions in the ABCP market segment, (ii) an indicator of bank funding liquidity, (iii) the volatility of the S&P 500 stock index, which acts as a proxy for market volatility, (iv) the CDS spreads acting as a measure of bank’s default risk, (v) a proxy for overall US market liquidity conditions, and (vi) a measure of the volatility of the LAC stock returns, defined, for each country i, by the mean of the volatility of the other j LAC ( ji ≠ ).
The significance of time variation is captured by the coefficients , , and . The regime-switching parameters are y, y, 2, 2, 3 and 3. For all the regressions, the model with endogeneity is retained, since the null hypothesis of no correlation between 4 and is always rejected (> E 0).
3.1. Two polar cases: Brazil and Mexico
3.1.1. Brazil
Because the endogenous variable is the first-difference of the squared returns (changes in volatility), the model dichotomizes into regimes that exhibit peaks (the volatility decreases hugely after achieving very high levels) and no peaks (changes in volatility are not very important). Consider first the case of the Brazilian S&P/IFCI series. In Table 1a, we see that the estimate of the mean volatility change in regime 1 (y) is statistically not significant, while it is significantly negative in regime 2 (y). This suggests that there are phases in the dynamics of volatility characterized by high peaks, notably in the second regime. The interesting point is that, in the latter, changes in volatility are of much higher magnitude than in the first regime, as illustrated by the high values of 3 in comparison with 3. We propose to label regime 1 as a low-change volatility regime and regime 2 as a high-change volatility regime.
Regarding the transition variables, three of them influence the switches of the volatility changes between the two regimes: bank funding illiquidity, the changes in volatility of the S&P 500 and the volatility changes of the other LAC’s equity markets. Indeed, the significance of the parameters and indicates whether the transition variables contain information about the probability of being in either regime or the other. Our results show that and/or are statistically significant in respectively the third, fourth and seventh columns. An increase in the volatility changes in either the US S&P 500 market or the regional equity markets (other LAC’s) decreases the probability of small changes in the Brazilian equity
16
The models are estimated using the first-difference of all the variables, given that all of them are I(1). 17
Note that market liquidity is an asset-specific concept referring to the ease with which a position in an asset may be liquidated without significantly altering its price, whereas funding liquidity is an institution-specific characteristic related to the ability of a financial intermediary to service its liabilities (for a detailed presentation of these concepts, see Frank et al. (2008)). 18
See Appendix 1.
CEPII, WP No 2010-11 The Effects of the Subprime Crisis on the Latin American Financial Markets
17
market volatility ( is significantly negative). This result is in line with the intuition of a contagion effect between the volatility changes of the different markets. For bank funding illiquidity, at first glance we obtain somewhat counter-intuitive, respectively positive and negative signs for and . Indeed, when banks in the US interbank markets are facing liquidity problems we would expect them to repatriate capitals from their affiliates in Brazil, thereby causing higher changes in volatility (thus, we would expect 0 and z 0). However, one explanation to the reversed signs could be that the signs are not showing a causality phenomenon, but a correlation. Indeed, the share of foreign banks in the banking sector total assets is low in Brazil (less than 30%, as compared, for instance, with Mexico where this proportion is nearly 80%). In the aftermath of the subprime crisis, the enterprises in the equity markets had to find alternative sources of financing and thereby increased the proportion of corporate bonds. Corporate spreads, although they increased, have been less volatile than other spreads at short maturities, because the Brazilian firms showed more resilience to the crisis than firms in the industrialized countries. As a consequence, the positive sign of reflects a situation in which, as the US markets were showing a higher volatility, the Brazilian corporate made a substitution in their sources of financing.
The other financial stress indicators in the US markets reveal little information about the future state of the volatility changes (the coefficients and are not statistically significant for the CDS spreads or the US market liquidity).
The next step is to investigate whether the time-varying inferred probabilities are correlated with the chronology of the volatility changes observed in reality. In this view, Table 1a also contains the percentage of probabilities above 0.5 for each regime and each year. The results are as expected. Indeed, in state 1 (low changes in the volatility), the probabilities are very high in 2004, 2005, 2006, and then, they decrease from 2007 onwards. Conversely, we observe low probabilities in state 2 during the years 2004 to 2006, and they increase substantially in 2008 and 2009.
The marginal advantage of the time-varying specification over the constant transition probability model can be assessed by computing the marginal contribution of the transition probabilities.
19 To measure whether the contribution of time-varying is important, we compute
the following weighted transition probability series for both states 1 and 2:
|' ⁄ ~ 0 ' U ) ⁄ , , , /, 1,2 (10)
where ' is the mean of the transition probabilities. One advantage of |' is that it helps detecting when the time variation is important, or the years when the transition variables give most information on the different regimes. Figures 7a to 7c reproduce the marginal contributions for the three models in which the transition variables have a significant influence on the probabilities, namely bank funding illiquidity, the S&P 500 volatility and the volatility of the other LAC emerging markets. The marginal contribution is evidenced by the deviations from zero. For the first two transition functions, we observe that the spikes correspond generally to the years 2008 and 2009, thereby supporting the assumption that these variables are providing important information about changes in volatility occurring during the subprime crisis and less information for the years before. The case of the third variable (changes in the volatility in other LAC equity markets) is even more interesting. It acts as a “fine” detector of turning points in the variations of volatility by revealing more
19
The graphs of this contribution are easier to interpret than those of the probabilities of the different regimes.
CEPII, WP No 2010-11 The Effects of the Subprime Crisis on the Latin American Financial Markets
18
spikes in the whole sample (not only during the years 2008 and 2009). The domestic market seems to be much more sensitive to contagion effects stemming from the regional equity markets than from other US indicators of financial stress. As a consequence, this variable helps better to track the changes occurring in the volatility.
All these findings also apply for the BOVESPA stock returns. The difference is that the volatility variables (S&P 500 and other LAC) are the only ones playing a significant role in influencing the probability of being in either regime or the other (see Table 1b).
INSERT TABLES 1a and 1b ABOUT HERE
INSERT FIGURES 7a THROUGH 7c ABOUT HERE
3.1.2. Mexico
The case of Mexico’s equity markets shows a contrasted view, as compared with the Brazilian situation (Table 2a). Indeed, given the high degree of integration between the US and Mexican financial markets, we find a significant influence of all the transition variables, with significant coefficients for and/or . Except the inversed signs of the variable “banking funding illiquidity” that we already noticed for Brazil, for the other variables, is negative while is either positive or statistically non-significant. Therefore, more financial stress in the US market reduces the probability of not observing important peaks (and huge downturns) in the volatility changes. Interestingly, the probabilities reported in Table 2a reveal that, in the aftermath of the crisis, the deterioration of the financial conditions in the US markets increased importantly the probability of a high volatility change regime (for instance, the percentage of probabilities above 0.5 is higher than 70% in general, in comparison with 50% in the case of Brazil). An examination of the figures showing the marginal contribution series (Figures 8a through 8c) reveals that the volatility of the other LAC markets convey less information on the occurrence of the high volatility change regime (state 2) than the liquidity of the US market. Comparing the findings obtained for the Mexican S&P/IFCI series with those using the BOLSA stock returns, we obtain very similar results (Table 2b).
INSERT TABLES 2a and 2b ABOUT HERE
INSERT FIGURES 8a THROUGH 8c ABOUT HERE
3.2. The other Latin American countries
The situation of the other countries in our sample resembles that of either Mexico or Brazil, despite some differences. In Chile, with the exception of market liquidity, the domestic markets are in general influenced by the US financial stress indicators (see Tables 3a-3b and Figures 9a and 9b). However, the latter do not perform quite well as “leading indicators” of times of crisis (when changes in volatility are characterized by high peaks with troughs of high magnitude), since they do not have a stronger explanatory power on the probability of being in regime 2. Indeed, if we compare the case of Mexico with that of Chile, the percentages of probabilities above 0.5 in the second regime are quite low, even during the years 2008 and 2009.
The situation of Peru is very close to that of Brazil, with only an influence of the US and LAC’s volatility changes driving the domestic volatility switches (Tables 4a-4b and Figures 10a and 10b). Turning to Colombia, it is in an intermediate situation between Brazil and
CEPII, WP No 2010-11 The Effects of the Subprime Crisis on the Latin American Financial Markets
19
Mexico with the CDS being the only statistically significant transition variable in addition to the market volatility series (but with smaller probabilities above 0.5 in regime 2); see Table 5 and Figures 11a and 11b.
INSERT TABLES 3a, 3b, 4a, 4b and 5 ABOUT HERE
INSERT FIGURES 9a, 9b, 10a, 10b, 11a, 11b ABOUT HERE
3.3. What can explain the observed differences between the Latin American countries?
Our findings globally put forward the importance of US financial stress indicators on the volatility of the LAC stock markets. They are in line with those obtained by Dooley and Hutchinson (2009) showing that the emerging markets (among which Brazil, Chile, Colombia and Mexico) indeed reacted to a host of bad news on the US economy, such as the bankruptcy of Lehman Brothers, the write-downs of equities in US financial institutions, or housing market developments. These factors had the effect of raising the CDS spread basis in the LAC financial markets, because they were providing bad news about the liquidity problems facing the US banks and credit markets. The changes in the CDS spreads were then transmitted to the volatility of the equity markets with more or less magnitude depending upon the strength of the LAC market interdependence with the US markets. During episodes of heightened volatility and intensive financial stress in the US markets, “irrational” moods (caused by liquidity needs) were the predominant factor of contagion. In this context, changes in the equity prices’ volatility took the form of clearly identifiable, discrete events happening only occasionally. Markov-switching models appear adequate to model such contagion shifts.
Though for all the countries the model dichotomizes into two regimes of respectively low and high changes in volatility, the above results point to two main differences between the Latin American countries. A first difference is that in Chile and Mexico, the interest rate spreads in the US markets (CDS, ABCP, bank funding liquidity) were at play to account for high changes in the volatility during the crisis in addition to market volatility variables, while Brazil, Colombia and Peru seem to be more sensitive to the volatility of the regional financial markets. Secondly, the relevance of the different financial variables in accounting for the evolution into the second regime (characterized by high volatility changes) is important for Mexico (to a less extent for Brazil) and of somewhat less importance for Chile, Colombia and Peru (for which we find quite small percentages of probabilities above 0.5 in regime 2 during the years 2008 and 2009).
These differences are in line with the observed stylized facts. Firstly, some countries have increased domestic securization and implemented regulatory framework that have made it difficult to domestic bank to buy asset-backed securities in the US markets. This concerns mainly the four countries other than Mexico. Because their banks’ balance sheets were not as exposed to the toxic assets as in the industrialized countries, the stock market volatilities showed more resilience to the increased financial stress in the US. Another point needs to be mentioned. In Peru, Colombia, Chile and Brazil, a substantial share of capitalization in the equity markets is linked to commodity and energy activities. This means that the peaks observed in the changes of volatility did not only stem from the financial stress in the US markets, but also from the huge drop in the prices of raw materials, commodities, oil that was observed at the beginning of the crisis.
20 Therefore, the stock valuations appeared to decline in
20
An extension of the present study would be to investigate the role of commodity price volatility, but this is beyond the scope of the paper and left for future research.
CEPII, WP No 2010-11 The Effects of the Subprime Crisis on the Latin American Financial Markets
20
line with the low performance of the world commodity markets. Conversely, in Mexico, the channel of contagion from the US financial stress is predominant because of the importance of cross-border funding flows for the Mexican corporate.
4. CONCLUSION
How extensive were the financial linkages between the Latin American countries and the United States during the subprime crisis? This paper attempts to answer this question by using a new empirical approach based on time-varying probability Markov-switching models. Our estimations show that a broad range of stress indicators in the US financial market can cause abrupt changes in the volatility of the LAC stock markets. These US factors had the effect of raising the CDS spread basis in the LAC financial markets, because they were notably providing bad news about the liquidity problems facing the US banks and credit markets. The changes in the CDS spreads were then transmitted to the volatility of the equity markets with more or less magnitude depending upon the strength of the LAC market interdependence with the US markets. We find that Mexico is the most vulnerable to the US financial stress, since this country has the closer links with the US financial markets; all the US transition variables being informative about the dynamics of the Mexican stock market volatility. A similar conclusion holds for Chile, although not all the transition variables were statistically significant. The other countries seem to be much more sensible to the activity in the regional financial markets (Colombia, Peru and Brazil).
CEPII, WP No 2010-11 The Effects of the Subprime Crisis on the Latin American Financial Markets
21
REFERENCES
Berglof, E., Korniyenko, Y., Plekhanov, A. and J. Zettelmeyer, 2009, “Understanding the Crisis in Emerging Europe,” mimeo, EBRD.
Berkmen, P., Rennhack, R., Walsh, J. and G. Gelos, 2009, “The global financial crisis: explaining cross-country differences in the output impact”, IMF Working Paper 09/280, International Monetary Fund, Washington DC.
Campbell, J., Lettau, M., Malkiel, B. and Y. Xu, 2001, “Have individual stocks become more volatile? An empirical exploration of idiosyncratic risk”, Journal of Finance 56(1), 1-43.
Clements, A. and J. Collet, 2008, “Do common volatility models capture cyclical behavior in volatility?”, Applied Financial Economics 18(7), 599-604.
Connor, G., Korajczyk, R. and O. Linton, 2006, “The common and specific components of dynamic volatility”, Journal of Econometrics 32(1), 231-255.
Diebold, F.X., Lee, J.H. and G. Weinbach, 1994, “Regime switching with time-varying transition probabilities”, in C. Hargreaves, C. (ed), Nonstationary time series analysis and cointegration, 283-302, Oxford University Press, Oxford.
Dooley, M. and M. Hutchison, 2009, “Transmission of the U.S. subprime crisis to emerging markets: Evidence on the decoupling-recoupling hypothesis”, Journal of International Money and Finance 28(8), 1331-1349.
Engle, R.F., Ng, V.K. and M. Rothchild, 1990, “Asset pricing with a factor-ARCH covariance structure: empirical estimates for Treasury bills”, Journal of Econometrics 45, 213-235.
Filardo, A.J., 1994, “Business cycle phases and their transitional dynamics”, Journal of Business and Economic Statistics, 12(3), 299-308.
Filardo, A.J. and S.F. Gordon, 1998, “Business cycle durations”, Journal of Econometrics 1, 3-16.
Frank, N., Gonzalez-Hermosillo, B. and H. Hesse, 2008, “Transmission of liquidity shocks: evidence from the 2007 subprime crisis”, IMF Working Paper 08/200, International Monetary Fund, Washington DC.
Garcia, R., 1998, “Asymptotic null distribution of the likelihood ratio test in Markov switching models”, International Economic Review 39(3), 763-788.
Goldfeld, S.M. and R.E. Quandt, 1973, “A Markov model for switching regressions”, Journal of Econometrics 1, 3-16.
Gonzalez-Hermosillo, B. and H. Hesse, 2009, “Global market conditions and systemic risks”, IMF Working Paper 09/230, International Monetary Fund, Washington DC.
Hamilton, J.D., 1989, “A new approach to the economic analysis of nonstationary time series and the business cycle”, Econometrica, 57(2), 357-384.
CEPII, WP No 2010-11 The Effects of the Subprime Crisis on the Latin American Financial Markets
22
Hamilton, J.D., 1991, “A quasi-Bayesian approach to estimating parameters for mixtures of Normal distributions”, Journal of Business and Economic Statistics 9, 27-39.
Hansen, B.E., 1992, “The likelihood ratio test under non-standard conditions: testing the Markov switching model of GNP”, Journal of Applied Econometrics 7, 61-82.
Hwang, S. and S. Satchell, 2005, “GARCH model with cross-sectional volatility: GARCHX models”, Applied Financial Economics 3, 203-216.
International Monetary Fund (IMF), 2008, “Latin American linkages to global financial market turbulence”, in Regional Economic Outlook – Western Hemisphere, April, Washington DC.
Kiefer, N.M., 1978, “Discrete parameter variations: efficient estimation of a switching regression model”, Econometrica 46, 427-434.
Kim, C.J., Piger, J. and R. Startz, 2008, “Estimation of Markov regime-switching regression models with endogenous switching”, Journal of Econometrics 143, 263-273.
Paiva, P., 2009, “Impact of economic crisis on Brazilian economy”, Revista de Economia Mundial 23, 227-244.
Pereira Valadao, M.A. and I.T. Gico Jr., 2009, “The (not so) great depression of the 21st century and its impact on Brazil”, Working Paper 0002/09, Universidade Catolica de Brasilia.
Powell, A. and J.F. Martinez (2008), “On emerging economy sovereign spreads and ratings”, Working Paper 629, Inter-American Development Bank.
Rose, A.K. and M.M. Spiegel, 2009, “Cross-country causes and consequences of the 2008 crisis: International linkages and American exposure”, CEPR Discussion Paper 7466, London.
CEPII, WP No 2010-11 The Effects of the Subprime Crisis on the Latin American Financial Markets
23
APPENDIX
Appendix 1. Data description
Source: Datastream for all series.
Frequency: Daily. Period: January 1, 2004 to April 7, 2009. Number of observations: 1374.
Financial stress indicators
• ABCP spreads: Spread between the yield of 3-month ABCP and that of 3-month US
Treasury bill. This is an indicator of funding liquidity conditions in the ABCP market
segment.
• Bank funding liquidity: Spread between the 3-month US interbank rate and the US federal
funds rate. This is an indicator of bank funding liquidity.
• Market volatility: Volatility of the S&P 500 index, which is a proxy of market volatility,
measured by the square of S&P 500 stock returns.
• Market liquidity: two proxies of overall market liquidity conditions are used: (i) Spread
between the US 30-year Treasury bonds and the US 10-year Treasury bonds, and (ii)
Spread between the US 5-year Treasury bonds and the US 2-year Treasury bonds.
• CDS spreads: 5-year US bank sector CDS. This is a measure of banks' default risk.
Equity indexes
Two series of equity indices are considered for each country (except for Colombia):
• S&P IFCI price indices. S&P/IFCI (Investable) indices are subsets of S&P/IFCG indices
and measure the returns of stocks that are legally and practically available to foreign
investors. Note that S&P/IFCI indices typically cover a high percentage of the stocks in
the S&P/IFCG indices.
• The following stock indices: (i) BOVESPA price index for Brazil, (ii) Chile INTER10
price index for Chile, (iii) IGBC price index for Colombia, (iv) BOLSA price index for
Mexico, and (v) LIMA SE price index for Peru.
CEPII, WP No 2010-11 The Effects of the Subprime Crisis on the Latin American Financial Markets
24
Appendix 2 Table A1. Information criteria on nonlinear GARCH m odels: S&P/IFCI indices
Brazil Chile Mexico Peru
GARCH LM -2617.06 -1708.23 -2310.17 -2603.35 AIC 3.8685 2.5251 3.4149 3.8482 BIC 3.9058 2.5677 3.4575 3.8855
EGARCH LM -2626.29 -1712.17 NC -2605.62 AIC 3.8821 2.5309 NA 3.8516 BIC 3.9248 2.5788 NA 3.8942
PGARCH LM NC -1715.50 -2538.56 -2604.21 AIC NA 2.5358 3.7525 3.8495 BIC NA 2.5891 3.8057 3.8975
LSTGARCH LM -2611.96 NC -2308.63 -2603.07 AIC 3.8609 NA 3.4126 3.8478 BIC 3.9089 NA 3.4659 3.8958
ESTGARCH LM -2621.56 -1707.23 -2310.11 -2603.26 AIC 3.9178 2.5236 3.4148 3.8481 BIC 3.8752 2.5769 3.4680 3.8961
ANST-GARH
LM -2621.49 -1707.37 -2309.83 NC AIC 3.9284 2.5238 3.4143 NA BIC 3.8751 2.5877 3.4783 NA
QGARCH LM -2617.48 -1708.20 -2308.97 -2603.26 AIC 3.8692 2.5250 3.4130 3.8480 BIC 3.9065 2.5730 3.4610 3.8900
Note: in bold the lowest criteria. LM: maximum likelihood, AIC: Akaike, BIC: Schwarz.
CEPII, WP No 2010-11 The Effects of the Subprime Crisis on the Latin American Financial Markets
25
Table A2. Information criteria on nonlinear GARCH m odels: other stock indices
Brazil Chile Colombia Mexico Peru
GARCH LM -2701.71 -2001,09 -2271.43 -2263.42 -2432.34 AIC 3.9936 2.9422 3.3576 3.3457 3.5954 BIC 4.0309 2.9795 3.4162 3.3884 3.6434
EGARCH
LM -2711.11 -1987.68 -2279.28 -2273.53 -2441.37 AIC 4.0075 2.9381 3.3692 3.3607 3.6088 BIC 4.0501 2.9808 3.4331 3.4086 3.6621
PGARCH LM NC -1987.86 -2275.59 -2272.33 -2444.98 AIC NA 2.9384 3.3637 3.3589 3.6141 BIC NA 2.9864 3.4330 3.4122 3.6727
LSTGARCH LM NC -1988.40 -2270.30 -2259.20 -2429.50 AIC NA 2.9392 3.3559 3.3395 3.5912 BIC NA 2.9872 3.4252 3.3928 3.6499
ESTGARCH LM -2700.26 -1988.31 -2271.43 -2263.19 NC AIC 3.9915 2.9391 3.3576 3.3454 NA BIC 4.0394 2.9870 3.4269 3.3987 NA
ANST-GARH
LM -2701.36 -1989.55 -2272.96 -2263.07 -2431.77 AIC 3.9931 2.9409 3.3598 3.3452 3.5946 BIC 4.0517 2.9995 3.4398 3.4092 3.6639
QGARCH LM -2696.45 -1988.93 -2270.42 -2260.68 -2431.18 AIC 3.9850 2.9400 3.3560 3.3410 3.5930 BIC 4.0280 2.9820 3.4200 3.3890 3.6470
Note: in bold the lowest criteria. LM: maximum likelihood, AIC: Akaike, BIC: Schwarz.
CEPII, WP No 2010-11 The Effects of the Subprime Crisis on the Latin American Financial Markets
26
Table 1a. Estimation of TVPMS model – Brazil – S&P/IFCI returns
ABCP spreads
Bank funding
S&P 500 volatility
CDS spreads US market liquidity
Other LAC volatility y 0.01 0.01 -0.09 0.0059 0.01 -1.18* y -9.46* -9.12* -6.03* -8.79* -9.21* 22.89* 2 -0.40* -0.39* -0.43* -0.39* -0.40* -0.86* 2 -0.64* -0.65* -0.61* -0.64* -0.64* -0.22* 3 2.54* 2.52* 2.49* 2.50* 2.50* 5.30* 3 21.85* 21.67* 21.73* 21.64* 21.75* 21.01* 1.41* 1.43* 1.96* 1.43* 1.41* 0.68* -0.76* -0.79* -0.72* -0.78* -0.76* 41.84 0.11 1.64* -0.45* -0.02 -5.65 -0.08* 0.20 -0.98** 0.02* -0.001 -1.26 -6.50 > 0.64* 0.65* 0.58* 0.62* 0.63* -0.94*
Percentage of probabilities higher than 0.5 Regime 1
(Regime 2) Regime 1
(Regime 2) Regime 1
(Regime 2) Regime 1
(Regime 2) Regime 1
(Regime 2) Regime 1
(Regime 2) 2005 93.46
(6.54) 92.31 (7.69)
93.65 (6.15)
93.46 (6.54)
93.46 (6.54)
95.77 (4.23)
2006 86.54 (13.46)
86.54 (13.46)
89.23 (10.77)
86.54 (13.46)
86.54 (13.46)
93.08 (6.92)
2007 81.23 (18.77)
81.23 (18.77)
78.93 (21.07)
80.84 (19.16)
80.84 (19.16)
87.74 (12.26)
2008 57.63 (42.37)
57.25 (42.75)
53.82 (46.18)
57.25 (42.75)
56.87 (43.13)
72.14 (27.86)
2009 43.48 (56.52)
44.93 (55.07)
40.58 (59.42)
43.48 (56.52)
43.48 (56.52)
68.12 (31.88)
CEPII, WP No 2010-11 The Effects of the Subprime Crisis on the Latin American Financial Markets
27
Table 1b. Estimation of TVPMS model – Brazil – BOVESPA returns
ABCP spreads
Bank funding
S&P 500 volatility
CDS spreads US Market liquidity
Other LAC volatility y 0.02 0.02 -0.13 0.02 0.02 -0.19** y -12.51* -12.25* -7.01* -12.29* -12.34* -4.79** 2 -0.45* -0.44* -0.46* -0.45* -0.45* -0.47* 2 -0.64* -0.35* -0.61* -0.64* -0.64* -0.63* 3 3.10* 3.12* 3.02* 3.12* 3.03* 3.39* 3 25.18* 25.12* 24.67* 25.31* 24.92* 27.49* 1.40* 1.42* 1.96* 1.42* 1.38* 2.34* -0.63* -0.64* -0.63* -0.64* -0.62* -0.60* 0.14 0.66 -0.46* 0.0053 -4.90 -0.30* 0.05 -0.78 0.02* 0.0019 -1.05 0.02* > 0.64* 0.64* 0.55* 0.63* 0.64* 0.39*
Percentage of probabilities higher than 0.5 Regime 1
(Regime 2) Regime 1
(Regime 2) Regime 1
(Regime 2) Regime 1
(Regime 2) Regime 1
(Regime 2) Regime 1
(Regime 2) 2005 91.54
(8.46) 91.54 (8.46)
93.46 (6.54)
91.92 (8.08)
91.54 (8.46)
96.15 (3.85)
2006 90.77 (9.23)
90.38 (9.62)
91.15 (8.85)
90.77 (9.23)
90.38 (9.62)
92.69 (7.31)
2007 85.44 (14.56)
85.82 (14.18)
83.14 (16.86)
85.82 (14.18)
85.06 (14.94)
87.74 (12.26)
2008 63.74 (36.26)
63.36 (36.64)
60.69 (39.31)
63.74 (36.26)
62.21 (37.79)
65.65 (34.35)
2009 55.07 (44.93)
55.07 (44.93)
50.72 (49.28)
55.07 (44.93)
52.17 (47.83)
55.07 (44.93)
Note: * and ** indicate that the estimated coefficients are statistically significant at the 5% and 10% significance level, respectively.
CEPII, WP No 2010-11 The Effects of the Subprime Crisis on the Latin American Financial Markets
28
Table 2a. Estimation of TVPMS model – Mexico – S&P/IFCI returns
ABCP spreads
Bank funding
S&P 500 volatility
CDS spreads US market liquidity
Other LAC volatility y 0.0114 0.0086 -0.037 0.009 0.0083 -0.02 y -3.50* -3.91* -2.66* -3.75* -3.73* -3.06* 2 -0.49* -0.48* -0.47* -0.49* -0.48* -0.48* 2 -0.55* -0.55* -0.53* -0.55* -0.55* -0.54* 3 1.40* 1.41* 1.44* 1.41* 1.40* 1.46* 3 14.52* 14.59* 15.12* 14.60* 14.53* 15.14* 1.69* 1.63* 2.27* 1.69* 1.69* 2.06* -1.06* -1.04* -0.91* -1.04* -1.05* -1.01* -3.58* 1.96* -0.51* -0.05* -13.93* -0.19* 0.04 -0.59 0.01* -0.0009 -2.19 0.0061 > 0.50* 0.53* 0.45* 0.52* 0.53* 0.48*
Percentage of probabilities higher than 0.5 Regime 1
(Regime 2) Regime 1
(Regime 2) Regime 1
(Regime 2) Regime 1
(Regime 2) Regime 1
(Regime 2) Regime 1
(Regime 2) 2005 93.08
(6.92) 93.08 (6.92)
94.23 (5.77)
93.08 (6.92)
93.08 (6.92)
93.08 (6.92)
2006 80.38 (19.62)
80.77 (19.23)
81.54 (18.46)
80.77 (19.23)
80.38 (19.62)
82.31 (17.69)
2007 73.95 (26.05)
74.33 (25.67)
76.25 (23.75)
74.71 (25.29)
74.71 (25.29)
76.63 (23.37)
2008 59.94 (40.46)
59.92 (40.08)
57.25 (42.75)
59.16 (40.84)
58.78 (41.22)
60.69 (39.31)
2009 26.09 (73.91)
27.54 (72.46)
27.54 (72.46)
27.54 (72.46)
26.09 (73.91)
27.54 (72.46)
CEPII, WP No 2010-11 The Effects of the Subprime Crisis on the Latin American Financial Markets
29
Table 2b. Estimation of TVPMS model – Mexico – BOLSA returns
ABCP spreads
Bank funding
S&P 500 volatility
CDS spreads US Market liquidity
Other LAC volatility y 0.0001 -0.0011 -0.04 -0.0051 0.0014 -0.029 y -3.89* -3.81* -2.27** -3.58* -3.71* -2.62* 2 -0.52* -0.52* -0.51* -0.52* -0.52* -0.52* 2 -0.54* -0.55* -0.53* -0.54* -0.54* -0.54* 3 1.32* 1.33 1.39* 1.32* 1.33* 1.42* 3 13.86* 13.91* 14.62* 13.81* 13.84* 14.72* 1.60* 1.64* 2.13* 1.66* 1.68* 2.11* -1.00* -1.02 -0.91* -1.02* -1.03* -0.95* -0.77 2.29* -0.38* -0.04* -13.13 -0.19* -0.08 -0.56 0.0094 0.0004 -4.38 0.0046 > 0.52* 0.53* 0.37* 0.51* 0.53* 0.41*
Percentage of probabilities higher than 0.5 Regime 1
(Regime 2) Regime 1
(Regime 2) Regime 1
(Regime 2) Regime 1
(Regime 2) Regime 1
(Regime 2) Regime 1
(Regime 2) 2005 93.46
(6.54) 93.85 (6.15)
94.23 (5.77)
93.46 (6.54)
93.85* (6.15)
94.62 (5.38)
2006 81.15 (18.85)
81.54 (18.46)
83.08 (16.92)
81.15 (18.85)
80.77 (19.23)
83.08 (16.92)
2007 75.48 (24.52)
75.48 (24.52)
77.39 (22.61)
74.71 (25.29)
75.48 (24.52)
79.31 (20.69)
2008 62.98 (37.02)
63.74 (36.26)
62.60 (37.40)
62.21 (37.79)
62.60 (37.40)
63.36 (36.64)
2009 28.99 (71.01)
28.99 (71.01)
28.99 (71.01)
28.99 (71.01)
27.54 (72.46)
30.43 (69.57)
Note: * and ** indicate that the estimated coefficients are statistically significant at the 5% and 10% significance level, respectively.
CEPII, WP No 2010-11 The Effects of the Subprime Crisis on the Latin American Financial Markets
30
Table 3a. Estimation of TVPMS model – Chile – S&P/IFCI returns
ABCP spreads
Bank funding
S&P 500 volatility
CDS spreads US market liquidity
Other LAC volatility y -0.0016 -0.0007 -0.01 -0.008 -0.0005 -0.01 y -3.57* -3.31* -2.97* -3.41* -3.76* -2.77* 2 -0.45* -0.46* -0.43* -0.45* -0.543* -0.43* 2 -0.41* -0.41* -0.40* -0.41* -0.41* -0.40* 3 0.70* 0.71* 0.75* 0.637* 0.70* 0.73* 3 13.69* 13.79* 14.62* 13.30* 13.77* 14.19* 1.80* 1.87* 2.28* 1.92* 1.78* 2.11* -0.93* -0.97* -0.80* -0.88* -0.91* -0.92* -1.32* -3.07 -0.28* -0.09* 2.57 -0.1* -0.19 0.16 0.003 0.003 -3.72 0.0015 > 0.41* 0.40* 0.38* 0.44* 0.41* 0.35*
Percentage of probabilities higher than 0.5 Regime 1
(Regime 2) Regime 1
(Regime 2) Regime 1
(Regime 2) Regime 1
(Regime 2) Regime 1
(Regime 2) Regime 1
(Regime 2) 2005 98.08
(1.92) 98.08 (1.92)
98.85 (1.15)
97.69 (2.31)
98.08 (1.92)
98.46 (1.54)
2006 96.92 (3.08)
96.92 (3.08)
97.69 (2.31)
96.54 (3.46)
96.92 (3.08)
96.92 (3.08)
2007 79.31 (20.69)
80.08 (19.92)
82.38 (17.62)
78.54 (21.46)
79.69 (20.31)
82.38 (17.62)
2008 62.60 (37.40)
65.27 (34.73)
66.03 (33.97)
61.45 (38.55)
63.36 (36.64)
65.65 (34.35)
2009 62.32 (37.68)
62.32 (37.68)
60.87 (39.13)
56.52 (43.48)
62.32 (37.68)
60.87 (39.13)
CEPII, WP No 2010-11 The Effects of the Subprime Crisis on the Latin American Financial Markets
31
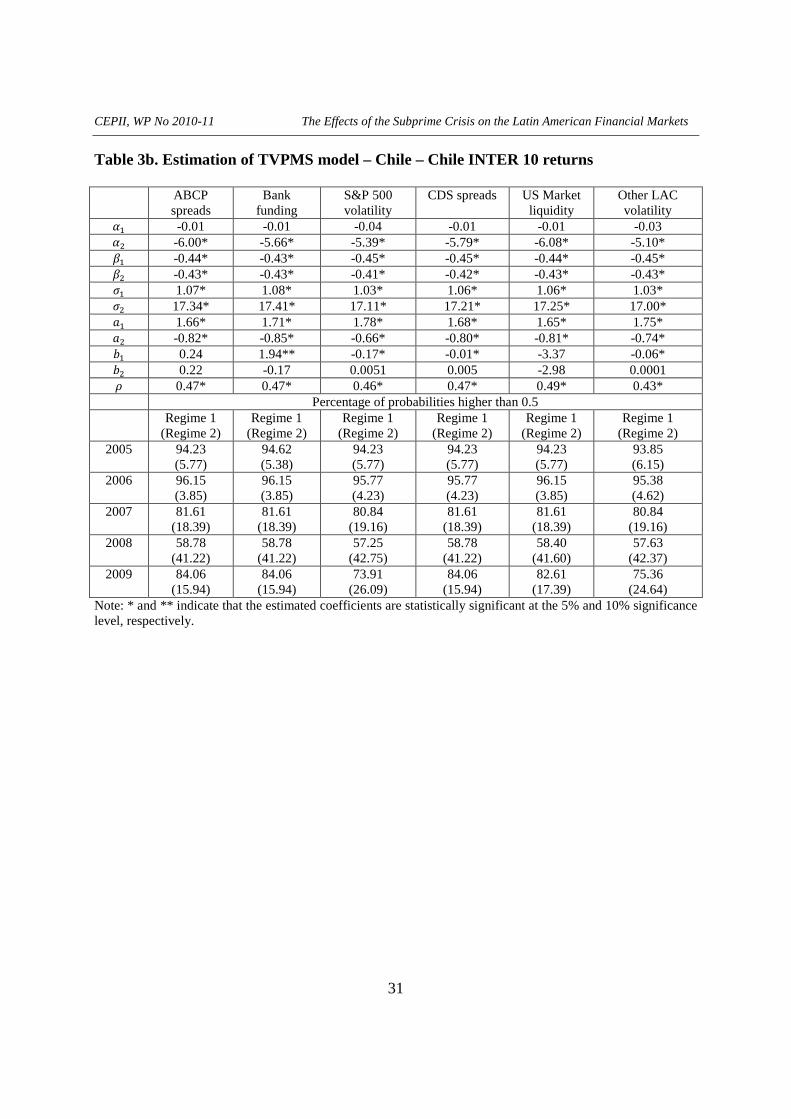
Table 3b. Estimation of TVPMS model – Chile – Chile INTER 10 returns
ABCP spreads
Bank funding
S&P 500 volatility
CDS spreads US Market liquidity
Other LAC volatility y -0.01 -0.01 -0.04 -0.01 -0.01 -0.03 y -6.00* -5.66* -5.39* -5.79* -6.08* -5.10* 2 -0.44* -0.43* -0.45* -0.45* -0.44* -0.45* 2 -0.43* -0.43* -0.41* -0.42* -0.43* -0.43* 3 1.07* 1.08* 1.03* 1.06* 1.06* 1.03* 3 17.34* 17.41* 17.11* 17.21* 17.25* 17.00* 1.66* 1.71* 1.78* 1.68* 1.65* 1.75* -0.82* -0.85* -0.66* -0.80* -0.81* -0.74* 0.24 1.94** -0.17* -0.01* -3.37 -0.06* 0.22 -0.17 0.0051 0.005 -2.98 0.0001 > 0.47* 0.47* 0.46* 0.47* 0.49* 0.43*
Percentage of probabilities higher than 0.5 Regime 1
(Regime 2) Regime 1
(Regime 2) Regime 1
(Regime 2) Regime 1
(Regime 2) Regime 1
(Regime 2) Regime 1
(Regime 2) 2005 94.23
(5.77) 94.62 (5.38)
94.23 (5.77)
94.23 (5.77)
94.23 (5.77)
93.85 (6.15)
2006 96.15 (3.85)
96.15 (3.85)
95.77 (4.23)
95.77 (4.23)
96.15 (3.85)
95.38 (4.62)
2007 81.61 (18.39)
81.61 (18.39)
80.84 (19.16)
81.61 (18.39)
81.61 (18.39)
80.84 (19.16)
2008 58.78 (41.22)
58.78 (41.22)
57.25 (42.75)
58.78 (41.22)
58.40 (41.60)
57.63 (42.37)
2009 84.06 (15.94)
84.06 (15.94)
73.91 (26.09)
84.06 (15.94)
82.61 (17.39)
75.36 (24.64)
Note: * and ** indicate that the estimated coefficients are statistically significant at the 5% and 10% significance level, respectively.

CEPII, WP No 2010-11 The Effects of the Subprime Crisis on the Latin American Financial Markets
32
Table 4a. Estimation of TVPMS model – Peru – S&P/IFCI returns
ABCP spreads
Bank funding
S&P 500 volatility
CDS spreads US market liquidity
Other LAC volatility y 0.08 0.08 0.08 0.09 0.09 0.01 y -10.01* -10.13* -10.28* -10.45* -10.12* -8.12* 2 -0.31* -0.31* -0.32* -0.31* -0.31* -0.34* 2 -0.52* -0.51* -0.50* -0.51* -0.52* -0.49* 3 2.22* 2.22* 2.22* 2.23* 2.22* 2.20* 3 22.45* 22.39* 22.15* 22.40* 22.41* 22.09* 1.37* 1.36* 1.38* 1.35* 1.35* 1.57* -0.75* -0.75* -0.70* -0.75* -0.74* -0.75* 0.7** -0.78 -0.07* -0.008 0.28 -0.13* 0.15 0.39 0.01* 0.009 1.23 0.02* > 0.64* 0.65* 0.68* 0.66* 0.65* 0.63*
Percentage of probabilities higher than 0.5 Regime 1
(Regime 2) Regime 1
(Regime 2) Regime 1
(Regime 2) Regime 1
(Regime 2) Regime 1
(Regime 2) Regime 1
(Regime 2) 2005 88.85
(11.15) 88.46
(11.54) 88.46
(11.54) 88.85
(11.15) 88.85
(11.15) 88.85
(11.15) 2006 79.23
(20.77) 79.23
(20.77) 79.23
(20.77) 79.23
(20.77) 79.23
(20.77) 80.00
(20.00) 2007 83.52
(16.48) 83.52
(16.48) 83.14
(16.86) 83.52
(16.48) 83.14
(16.86) 83.91
(16.09) 2008 65.27
(34.73) 65.27
(34.73) 64.12
(35.88) 65.27
(34.73) 65.27
(34.73) 62.60
(37.40) 2009 47.83
(52.17) 47.83
(52.17) 44.93
(55.07) 47.83
(52.17) 47.83
(52.17) 43.48
(56.52)
CEPII, WP No 2010-11 The Effects of the Subprime Crisis on the Latin American Financial Markets
33
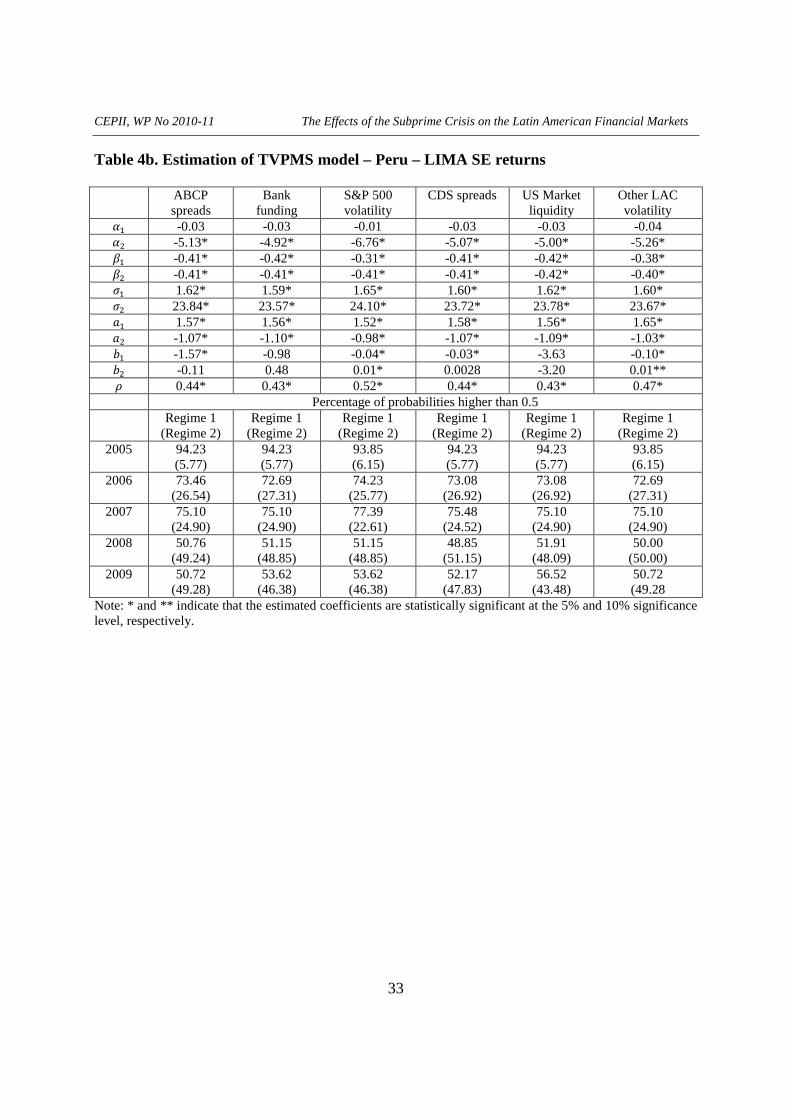
Table 4b. Estimation of TVPMS model – Peru – LIMA SE returns
ABCP spreads
Bank funding
S&P 500 volatility
CDS spreads US Market liquidity
Other LAC volatility y -0.03 -0.03 -0.01 -0.03 -0.03 -0.04 y -5.13* -4.92* -6.76* -5.07* -5.00* -5.26* 2 -0.41* -0.42* -0.31* -0.41* -0.42* -0.38* 2 -0.41* -0.41* -0.41* -0.41* -0.42* -0.40* 3 1.62* 1.59* 1.65* 1.60* 1.62* 1.60* 3 23.84* 23.57* 24.10* 23.72* 23.78* 23.67* 1.57* 1.56* 1.52* 1.58* 1.56* 1.65* -1.07* -1.10* -0.98* -1.07* -1.09* -1.03* -1.57* -0.98 -0.04* -0.03* -3.63 -0.10* -0.11 0.48 0.01* 0.0028 -3.20 0.01** > 0.44* 0.43* 0.52* 0.44* 0.43* 0.47*
Percentage of probabilities higher than 0.5 Regime 1
(Regime 2) Regime 1
(Regime 2) Regime 1
(Regime 2) Regime 1
(Regime 2) Regime 1
(Regime 2) Regime 1
(Regime 2) 2005 94.23
(5.77) 94.23 (5.77)
93.85 (6.15)
94.23 (5.77)
94.23 (5.77)
93.85 (6.15)
2006 73.46 (26.54)
72.69 (27.31)
74.23 (25.77)
73.08 (26.92)
73.08 (26.92)
72.69 (27.31)
2007 75.10 (24.90)
75.10 (24.90)
77.39 (22.61)
75.48 (24.52)
75.10 (24.90)
75.10 (24.90)
2008 50.76 (49.24)
51.15 (48.85)
51.15 (48.85)
48.85 (51.15)
51.91 (48.09)
50.00 (50.00)
2009 50.72 (49.28)
53.62 (46.38)
53.62 (46.38)
52.17 (47.83)
56.52 (43.48)
50.72 (49.28
Note: * and ** indicate that the estimated coefficients are statistically significant at the 5% and 10% significance level, respectively.

CEPII, WP No 2010-11 The Effects of the Subprime Crisis on the Latin American Financial Markets
34
Table 5. Estimation of TVPMS model – Colombia – IGBC returns
ABCP spreads
Bank funding
S&P 500 volatility
CDS spreads US Market liquidity
Other LAC volatility y 0.0021 -0.0013 0.0034 -0.0052 -0.0005 -0.01 y -7.77* -7.70* -8.08* -7.65* -7.72* -6.91* 2 -0.41* -0.40* -0.41* -0.40* -0.41* -0.39* 2 -0.55* -0.55* -0.55* -0.55* -0.55* -0.55* 3 1.59* 1.58* 1.58* 1.56* 1.58* 1.59* 3 23.37* 23.29* 23.46* 23.09* 23.28* 23.40* 1.65* 1.63* 1.63* 1.63* 1.63* 1.72* -0.76* -0.75* -0.71* -0.74* -0.74* -0.75* -0.44 0.18 0.02* 0.01* 0.43 -0.05* 0.52 0.69 0.0 0.01 -1.28 0.0017 > 0.45* 0.44* 0.45* 0.45* 0.44* 0.42*
Percentage of probabilities higher than 0.5 Regime 1
(Regime 2) Regime 1
(Regime 2) Regime 1
(Regime 2) Regime 1
(Regime 2) Regime 1
(Regime 2) Regime 1
(Regime 2) 2005 87.31
(12.69) 86.15
(13.85) 86.92
(13.08) 86.15
(13.85) 86.15
(13.85) 87.31
(12.639) 2006 73.85
(26.15) 73.46
(26.54) 74.23
(25.77) 73.08
(26.92) 73.85
(26.15) 73.46
(26.54) 2007 90.42
(9.58) 90.42 (9.58)
90.42 (9.58)
90.42 (9.58)
90.42 (9.58)
90.04 (9.96)
2008 79.77 (20.23)
79.39 (20.61)
79.39 (20.61)
78.24 (21.76)
79.39 (20.61)
79.01 (20.99)
2009 100.0 (0.0)
98.55 (1.45)
100 (0.0)
98.55 (1.45)
98.55 (1.45)
97.10 (2.90)
Note: * and ** indicate that the estimated coefficients are statistically significant at the 5% and 10% significance level, respectively.
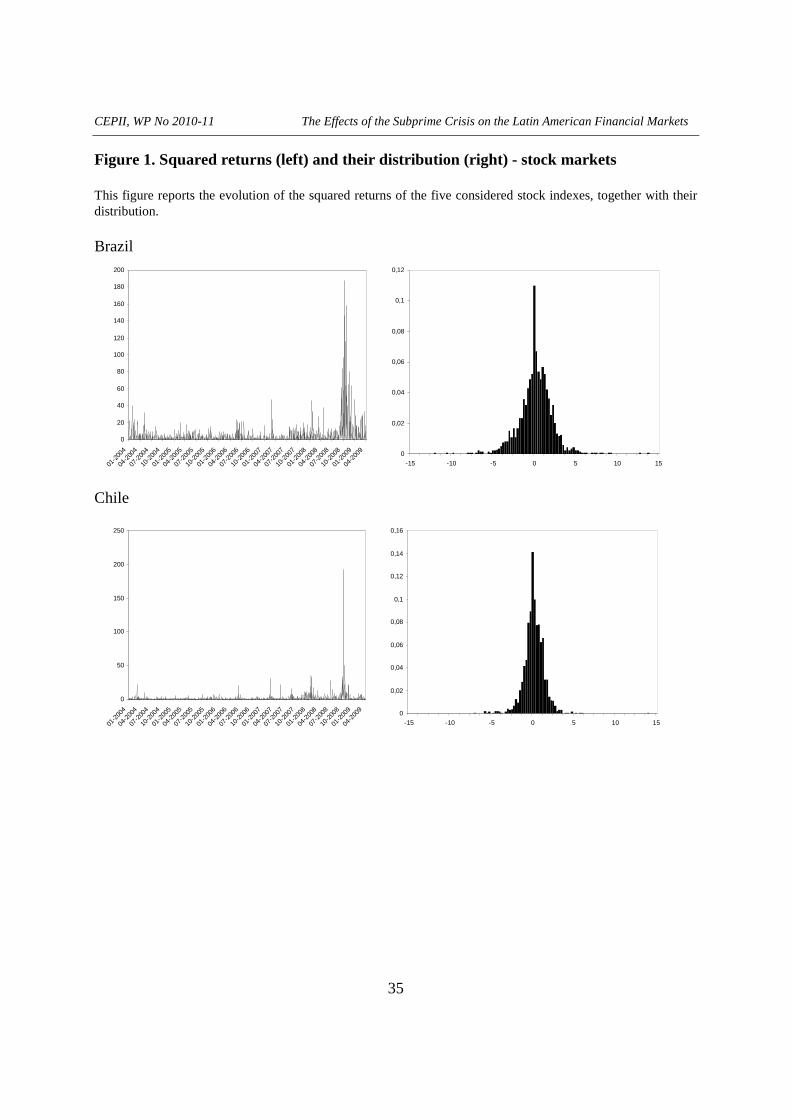
CEPII, WP No 2010-11 The Effects of the Subprime Crisis on the Latin American Financial Markets
35
Figure 1. Squared returns (left) and their distribution (right) - stock markets This figure reports the evolution of the squared returns of the five considered stock indexes, together with their distribution. Brazil
Chile
0
20
40
60
80
100
120
140
160
180
200
01-2
004
04-2
004
07-2
004
10-2
004
01-2
005
04-2
005
07-2
005
10-2
005
01-2
006
04-2
006
07-2
006
10-2
006
01-2
007
04-2
007
07-2
007
10-2
007
01-2
008
04-2
008
07-2
008
10-2
008
01-2
009
04-2
009 0
0,02
0,04
0,06
0,08
0,1
0,12
-15 -10 -5 0 5 10 15
0
50
100
150
200
250
01-2
004
04-2
004
07-2
004
10-2
004
01-2
005
04-2
005
07-2
005
10-2
005
01-2
006
04-2
006
07-2
006
10-2
006
01-2
007
04-2
007
07-2
007
10-2
007
01-2
008
04-2
008
07-2
008
10-2
008
01-2
009
04-2
009 0
0,02
0,04
0,06
0,08
0,1
0,12
0,14
0,16
-15 -10 -5 0 5 10 15
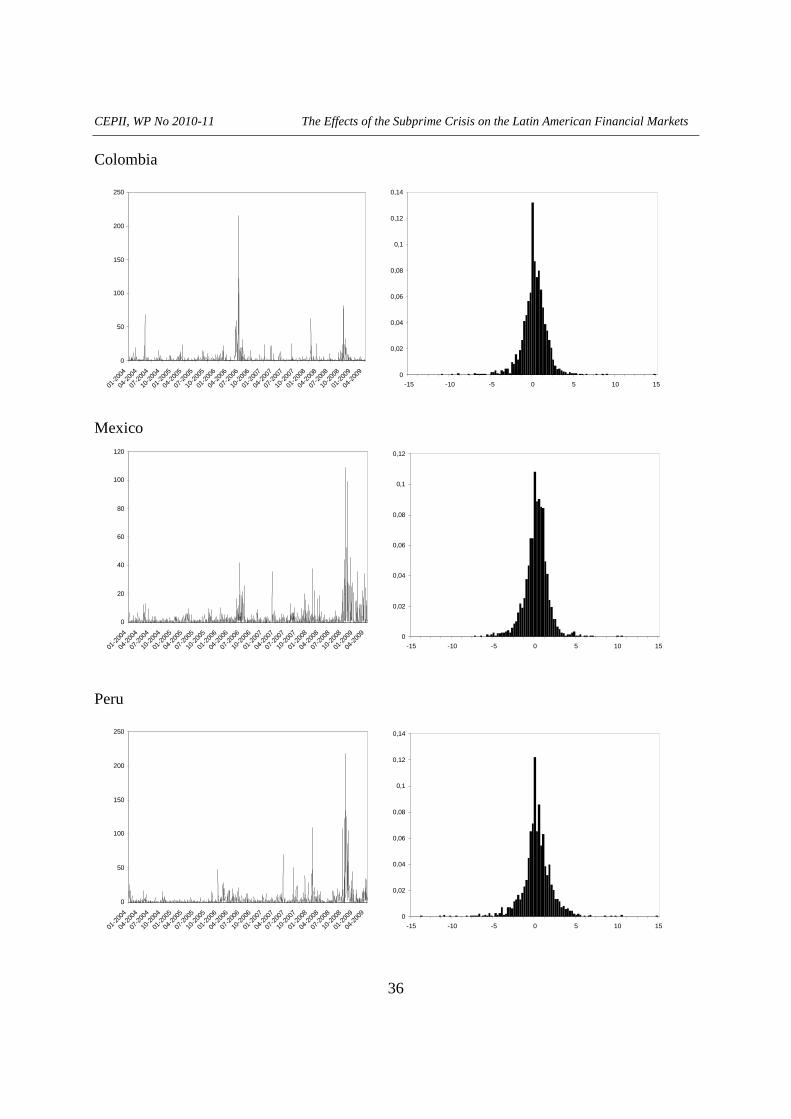
CEPII, WP No 2010-11 The Effects of the Subprime Crisis on the Latin American Financial Markets
36
Colombia
Mexico
Peru
0
50
100
150
200
250
01-2
004
04-2
004
07-2
004
10-2
004
01-2
005
04-2
005
07-2
005
10-2
005
01-2
006
04-2
006
07-2
006
10-2
006
01-2
007
04-2
007
07-2
007
10-2
007
01-2
008
04-2
008
07-2
008
10-2
008
01-2
009
04-2
009 0
0,02
0,04
0,06
0,08
0,1
0,12
0,14
-15 -10 -5 0 5 10 15
0
20
40
60
80
100
120
01-2
004
04-2
004
07-2
004
10-2
004
01-2
005
04-2
005
07-2
005
10-2
005
01-2
006
04-2
006
07-2
006
10-2
006
01-2
007
04-2
007
07-2
007
10-2
007
01-2
008
04-2
008
07-2
008
10-2
008
01-2
009
04-2
009 0
0,02
0,04
0,06
0,08
0,1
0,12
-15 -10 -5 0 5 10 15
0
50
100
150
200
250
01-2
004
04-2
004
07-2
004
10-2
004
01-2
005
04-2
005
07-2
005
10-2
005
01-2
006
04-2
006
07-2
006
10-2
006
01-2
007
04-2
007
07-2
007
10-2
007
01-2
008
04-2
008
07-2
008
10-2
008
01-2
009
04-2
009 0
0,02
0,04
0,06
0,08
0,1
0,12
0,14
-15 -10 -5 0 5 10 15
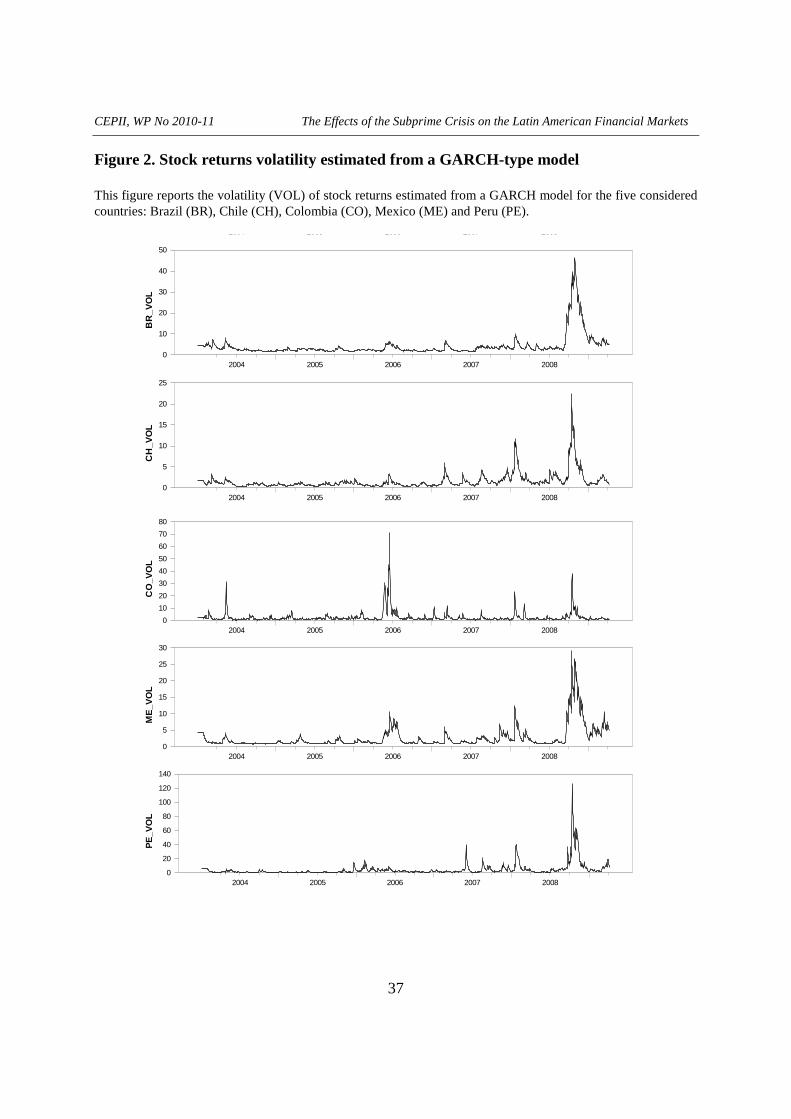
CEPII, WP No 2010-11 The Effects of the Subprime Crisis on the Latin American Financial Markets
37
Figure 2. Stock returns volatility estimated from a GARCH-type model This figure reports the volatility (VOL) of stock returns estimated from a GARCH model for the five considered countries: Brazil (BR), Chile (CH), Colombia (CO), Mexico (ME) and Peru (PE).
2004 2005 2006 2007 2008
BR
_VO
L
2004 2005 2006 2007 20080
10
20
30
40
50
CH
_VO
L
2004 2005 2006 2007 20080
5
10
15
20
25
CO
_VO
L
2004 2005 2006 2007 20080
10
20
30
40
50
60
70
80
ME
_VO
L
2004 2005 2006 2007 20080
5
10
15
20
25
30
PE
_VO
L
2004 2005 2006 2007 20080
20
40
60
80
100
120
140
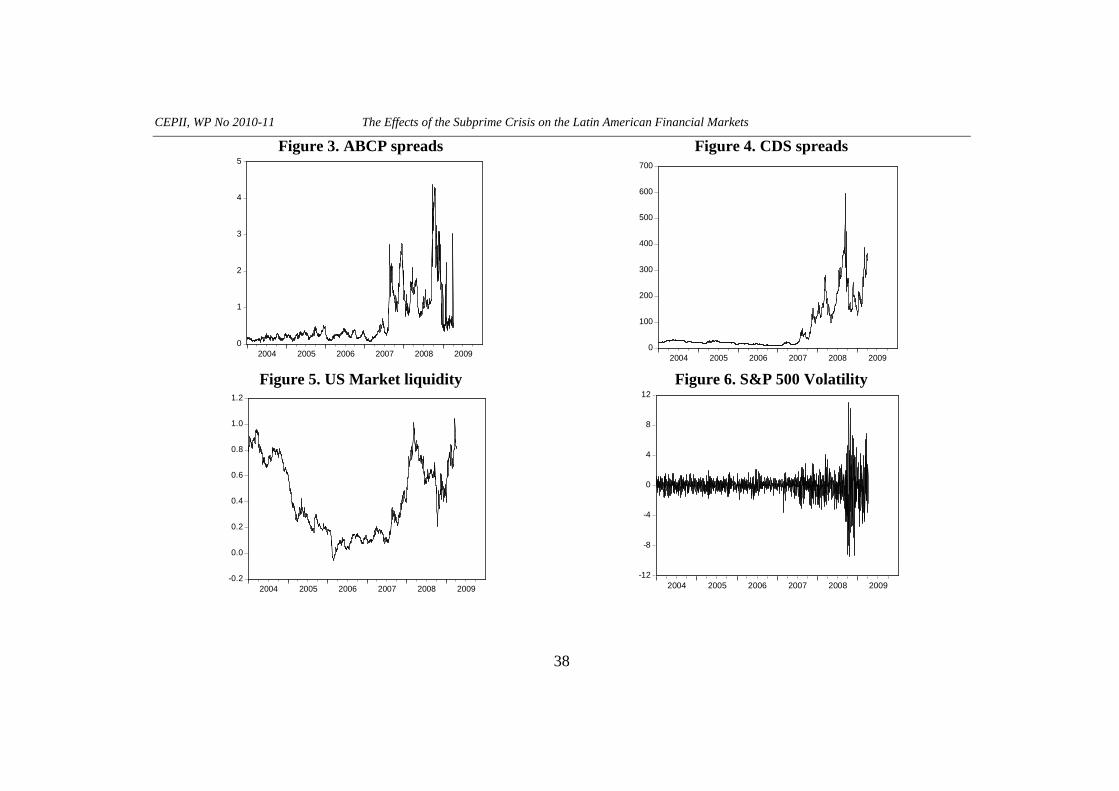
CEPII, WP No 2010-11 The Effects of the Subprime Crisis on the Latin American Financial Markets
38
Figure 3. ABCP spreads
Figure 4. CDS spreads
Figure 5. US Market liquidity Figure 6. S&P 500 Volatility
0
1
2
3
4
5
2004 2005 2006 2007 2008 20090
100
200
300
400
500
600
700
2004 2005 2006 2007 2008 2009
-0.2
0.0
0.2
0.4
0.6
0.8
1.0
1.2
2004 2005 2006 2007 2008 2009
-12
-8
-4
0
4
8
12
2004 2005 2006 2007 2008 2009
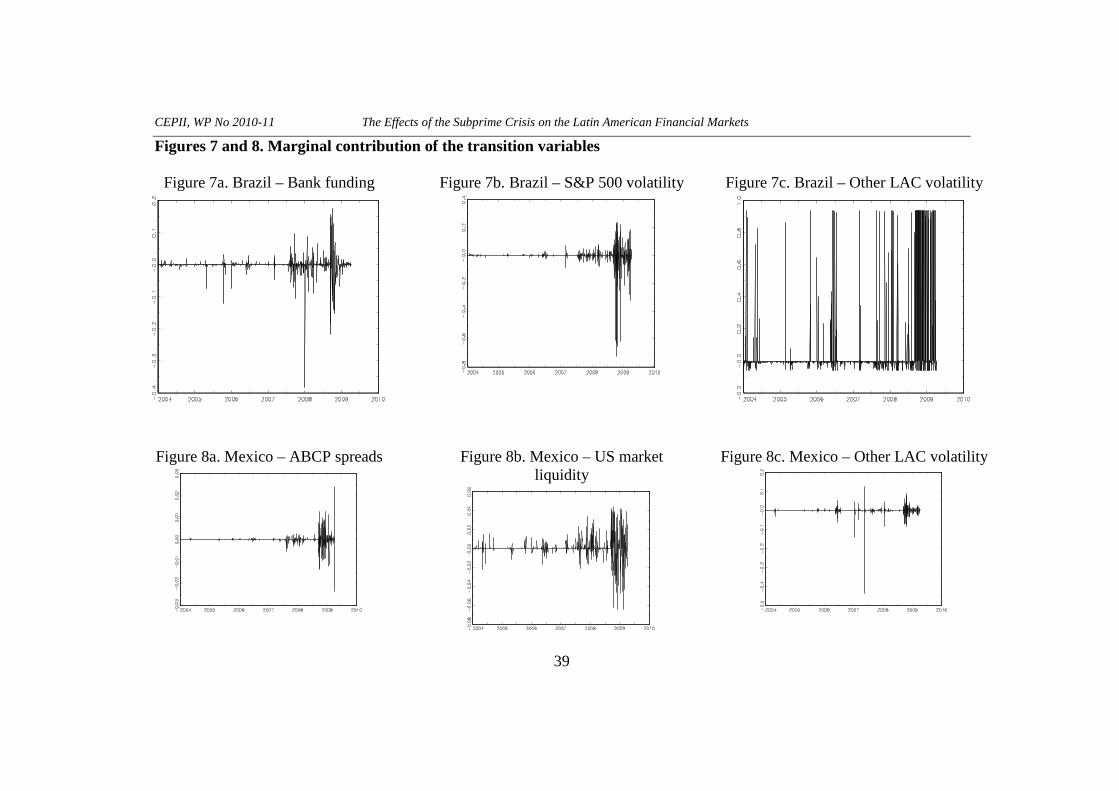
CEPII, WP No 2010-11 The Effects of the Subprime Crisis on the Latin American Financial Markets
39
Figures 7 and 8. Marginal contribution of the transition variables
Figure 7a. Brazil – Bank funding
Figure 7b. Brazil – S&P 500 volatility
Figure 7c. Brazil – Other LAC volatility
Figure 8a. Mexico – ABCP spreads
Figure 8b. Mexico – US market liquidity
Figure 8c. Mexico – Other LAC volatility
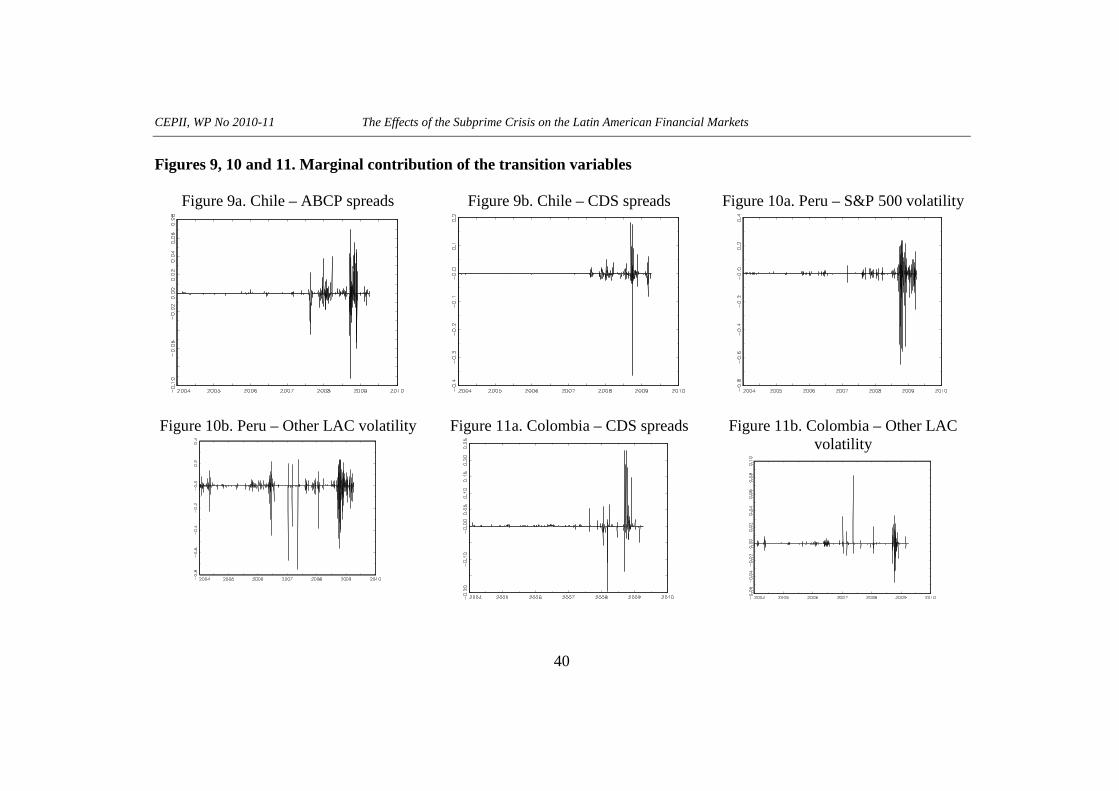
CEPII, WP No 2010-11 The Effects of the Subprime Crisis on the Latin American Financial Markets
40
Figures 9, 10 and 11. Marginal contribution of the transition variables
Figure 9a. Chile – ABCP spreads
Figure 9b. Chile – CDS spreads
Figure 10a. Peru – S&P 500 volatility
Figure 10b. Peru – Other LAC volatility
Figure 11a. Colombia – CDS spreads
Figure 11b. Colombia – Other LAC
volatility
CEPII, WP No 2010-11 The Effects of the Subprime Crisis on the Latin American Financial Markets
41
L IST OF WORKING PAPERS RELEASED BY CEPII
An Exhaustive list is available on the website: \\www.cepii.fr. To receive an alert, please contact Sylvie Hurion ([email protected]).
No Title Authors
2010-10 Foreign Bank Presence and its Effect on Firm Entry and Exit in Transition Economies
O. Havrylchyk
2010-09 The Disorted Effect of Financial Development on International Trade Flows
A. Berthou
2010-08 Exchange Rate Flexibility across Financial Crises V. Coudert, C. Couharde & V. Mignon
2010-07 Crises and the Collapse of World Trade: The Shift to Lower Quality
A. Berthou & C. Emlinger
2010-06 The heterogeneous effect of international outsourcing on firm productivity
Fergal McCann
2010-05 Fiscal Expectations on the Stability and Growth Pact: Evidence from Survey Data
M. Poplawski-Ribeiro & J.C. Rüle
2010-04 Terrorism Networks and Trade: Does the Neighbor Hurt J. de Sousa, D. Mirza & T. Verdier
2010-03 Wage Bargaining and the Boundaries of the Multinational Firm
M. Bas & J. Carluccio
2010-02 Estimation of Consistent Multi-Country FEERs B. Carton & K. Hervé
2010-01 The Elusive Impact of Investing Abroad for Japanese Parent Firms: Can Disaggregation According to FDI Motives Help
L. Hering, T. Inui & S. Poncet
2009-39 The Effects at Home of Initiating Production Abroad: Evidence from Matched French Firms
A. Hijzen, S. Jean & T. Mayer
2009-38 On Equilibrium Exchange Rates: Is Emerging Asia Different?
A. López-Villavicencio & V. Mignon
2009-37 Assessing Barriers to Trade in the Distribution and Telecom Sectors in Emerging Countries
L. Fontagné & C. Mitaritonna
CEPII, WP No 2010-11 The Effects of the Subprime Crisis on the Latin American Financial Markets
42
2009-36 Les impacts économiques du changement climatique : enjeux de modélisation
P. Besson & N. Kousnetzoff
2009-35 Trade, Foreign Inputs and Firms’ Decisions: Theory and Evidence
M. Bas
2009-34 Export Sophistication and Economic Performance: Evidence from Chinese Provinces
J. Jarreau & S. Poncet
2009-33 Assessing the Sustainability of Credit Growth: The Case of Central and Eastern European Countries
V. Coudert & C. Pouvelle
2009-32 How do different exporters react to exchange rate changes? Theory, empirics and aggregate implications
N. Berman, P. Martin & Thierry Mayer
2009-31 Spillovers from Multinationals to Heterogeneous Domestic Firms: Evidence from Hungary
G. Békés, J. Kleinert & F. Toubal
2009-30 Ethnic Networks, Information, and International Trade: Revisiting the Evidence
G. J. Felbermayr, B. Jung & F. Toubal
2009-29 Financial Constraints in China: Firm-level Evidence S. Poncet, W. Steingress & H. Vandenbussche
2009-28 The Crisis: Policy Lessons and Policy Challenges A. Bénassy-Quéré, B. Coeuré, P. Jacquet
&J. Pisani-Ferry
2009-27 Commerce et flux financiers internationaux : MIRAGE-D A. Lemelin
2009-26 Oil Prices, Geography and Endogenous Regionalism: Too Much Ado about (Almost) Nothing
D. Mirza & H. Zitouna
2009-25 EU15 Trade with Emerging Economies and Rentier States: Leveraging Geography
G. Gaulier, F. Lemoine & D. Ünal
2009-24 Market Potential and Development T. Mayer
2009-23 Immigration, Income and Productivity of Host Countries: A Channel Accounting Approach
A. Mariya & A. Tritah
2009-22 A Picture of Tariff Protection Across the World in 2004 MAcMap-HS6, Version 2
H. Boumellassa, D. Laborde Debucquet & C. Mitaritonna
2009-21 Spatial Price Discrimination in International Markets J. Martin
2009-20 Is Russia Sick with the Dutch Disease V. Dobrynskaya & E. Turkisch
CEPII, WP No 2010-11 The Effects of the Subprime Crisis on the Latin American Financial Markets
43
2009-19 Économies d’agglomération à l’exportation et difficulté d’accès aux marchés
P. Koenig, F. Mayneris & S. Poncet
2009-18 Local Export Spillovers in France P. Koenig, F. Mayneris & S. Poncet
2009-17 Currency Misalignments and Growth: A New Look using Nonlinear Panel Data Methods,
S. Béreau, A. López Villavicencio
& V. Mignon
2009-16 Trade Impact of European Measures on GMOs Condemned by the WTO Panel
A. C. Disdier & L. Fontagné
2009-15 Economic Crisis and Global Supply Chains
A. Bénassy-Quéré, Y. Decreux, L. Fontagné & D. Khoudour-Casteras
2009-14 Quality Sorting and Trade: Firm-level Evidence for French Wine
M. Crozet, K. Head & T. Mayer
2009-13 New Evidence on the Effectiveness of Europe’s Fiscal Restrictions
M. Poplawski Ribeiro
2009-12 Remittances, Capital Flows and Financial Development during the Mass Migration Period, 1870-1913
R. Esteves & D. Khoudour-Castéras
2009-11 Evolution of EU and its Member States’Competitiveness in International Trade
L. Curran & S. Zignago
2009-10 Exchange-Rate Misalignments in Duopoly: The Case of Airbus and Boeing
A. Bénassy-Quéré, L. Fontagné & H. Raff
2009-09 Market Positioning of Varieties in World Trade: Is Latin America Losing out on Asia?
N. Mulder, R. Paillacar & S. Zignago
2009-08 The Dollar in the Turmoil A Bénassy-Quéré, S. Béreau & V. Mignon
2009-07 Term of Trade Shocks in a Monetary Union: An Application to West-Africa
L. Batté, A. Bénassy-Quéré,
B. Carton & G. Dufrénot
2009-06 Macroeconomic Consequences of Global Endogenous Migration: A General Equilibrium Analysis
V. Borgy, X. Chojnicki, G. Le Garrec
& C. Schwellnus
2009-05 Équivalence entre taxation et permis d’émission échangeables
P. Villa
CEPII, WP No 2010-11 The Effects of the Subprime Crisis on the Latin American Financial Markets
44
2009-04 The Trade-Growth Nexus in the Developing Countries: a Quantile Regression Approach
G. Dufrénot, V. Mignon & C. Tsangarides
2009-03 Price Convergence in the European Union: within Firms or Composition of Firms?
I. Méjean & C. Schwellnus
2009-02 Productivité du travail : les divergences entre pays développés sont-elles durables ?
C. Bosquet & M. Fouquin
2009-01 From Various Degrees of Trade to Various Degrees of Financial Integration: What Do Interest Rates Have to Say
A. Bachellerie, J. Héricourt & V. Mignon
Organisme public d’étude et de recherche en économie internationale, le CEPII est placé auprès du Centre d’Analyse Stratégique. Son programme de travail est fixé par un conseil composé de responsables de l’administration et de personnalités issues des entreprises, des organisations syndicales et de l’Université.
Les documents de travail du CEPII mettent à disposition du public professionnel des travaux effectués au CEPII, dans leur phase d’élaboration et de discussion avant publication définitive. Les documents de travail sont publiés sous la responsabilité de la direction du CEPII et n’engagent ni le conseil du Centre, ni le Centre d’Analyse Stratégique. Les opinions qui y sont exprimées sont celles des auteurs.
Les documents de travail du CEPII sont disponibles sur le site : http//www.cepii.fr.
CEPII 9, RUE GEORGES PITARD, 75740 PARIS CEDEX 15
SYLVIE HURION – PUBLICATIONS
TÉL : 01 53 68 55 14 - FAX : 01 53 68 55 04
ISSN : 1293-2574