Embed Size (px)
Citation preview

THE EFFECTS OF TRIPS-MANDATED INTELLECTUAL PROPERTYRIGHTS ON ECONOMIC ACTIVITIES IN DEVELOPING COUNTRIES
W. LesserCornell University1
I. INTRODUCTION
December 31, 1999, in addition to being the last day of the 20th century, was the deadlinefor all but the least-developed countries to comply with the Trade-Related Aspects ofIntellectual Property Rights (TRIPs) requirements of the WTO2 for extending andharmonizing Intellectual Property Rights (IPR). Many countries have complied in fullwhile others are in process in some regards, but virtually all developing countries areasking, what are the economic implications of compliance? Better insights into thepositive benefits of enhanced IPR will allow national governments to plan economicpolicy more effectively, as well as providing a counter to the voices, such as those heardin Seattle in 1999, which are roundly condemning much of the globalization taking placeunder the WTO process. In the developing countries, strengthened IPR are a particulartarget of that rhetoric.
There is nothing new or recent about the debate over the implication of IPR fordeveloping countries. Among the issues which arose particularly strongly in the 1970swere the observation that, as many developing countries were not technologically at theforefront, the incentives provided by IPR, and patents in particular, for investment inresearch and development, were not meaningful. The small proportion of nationalcompared with foreign patent applicants is often cited as evidence for that position.Rather, IPR were portrayed as ‘protection for monopoly imports’ of benefit to exportersat the expense of developing country importers (see e.g., UNCTAD, 1975).
Much has changed economically in the world since the 1970s, including a number ofdeveloping countries reaching the position of being state-of-the-art in several importantsectors. Yet numerous countries remain in a position where they will be buyers ratherthan producers of key products and technologies for the foreseeable future. For thosenations, enhanced IPR will potentially lead to increased imports and higher prices insome sectors. But the matter of the domestic benefits of those stronger IPR are lessclearly established. Past justifications of stronger IPR as being an important ‘signal’ ofopenness to economic activities or theoretical justifications of the roles of IPR have beenuseful but not compelling for national leaders seeking some clearly documentedevidence.
The limited empirical evidence on the effects of IPR on domestic economic activity canbe explained in several ways, including the small number of countries which could beused as the basis of economic studies. TRIPs though is changing that, and with a numberof developing countries now TRIPs compliant, it is possible to conduct broader based 1 Prepared under WIPO Special Service Agreements.2 Annex 1C of the Marrakesh Agreement, 15 April 1994.
4-17-01
2
empirical studies. The overall objective of this study is to provide one such empiricalanalysis of the relationship between IPR and foreign direct investment (FDI) and imports.
A. IPR and Economic Growth
Ideally, it would be possible to identify a direct relationship between the forms ofintellectual property in place in a country and economic growth, whether measured asgross national product or the distribution of income on a per capita basis. This studyconsiders only part of that relationship, the association between IPR and trade activitywith the assumption that increases in trade, particularly in the form of FDI, will enhanceeconomic growth.
FDI is reflected in national accounts as transfer income. When the amounts correspondto a net increase, that is, not reflecting merely a change in ownership of existing assets,by definition both overall growth and per capita growth have occurred. The issue then ismore one of the distribution of that income, particularly as it affects the poor. This matteris not a direct subject of this study, but some connection between the parameters studiedhere and the distribution of benefits is desirable.
Theory is of limited value in predicting the welfare effects of IPR as there is no clearpresumption stronger rights will always be welfare-enhancing (Winter, 1989). Theanalysis becomes particularly complex, and the results ambiguous, when country size isconsidered. For example, for small countries (those whose R&D expenditures do notaffect world levels) stronger IPR increase welfare when enhancing access to products nototherwise available. Too strong protection in countries with limited R&D capacity,protection which reduces local production of ‘pirate’ products, would reduce welfare dueto higher prices and job loss. But if the small country has both production and innovationcapacity, welfare results are indeterminate. Analysis of effects on large countries mustfurther consider the general equilibrium effects of R&D spending. In general,determinate results are possible only on a country-by-country basis and then when strongassumptions are made (see Braga, 1995).
The most complex analysis arises in an international context, and as that analysis is oftencast in the context of developed (technology providing) and developing (technologyreceiving) countries, it is useful to examine a few of them. Deardoff (1992) considers asimple world in which there is one technology producer and multiple purchasers. From abase of unimpeded access by non-supplier countries, the welfare impacts of extendingpatent protection to more and more countries is considered. Overall, he concludes theeffect is welfare reducing as the costs to purchasers exceeds the benefits to producers.This result can be most easily understood in the simple single invention model whereprices following adoption of IPR move from competitive to monopoly levels. As aconsequence, the producer surplus is one-half of the price increase while the consumerdead weight loss is one-fourth.
When the results are extended to multiple inventions, the welfare effects depend on thesize of the populations in the supplying and recipient countries. Designating suppliers asdeveloped country and recipient developing countries as purchasers of technology,
3
Deardoff (1992, p. 50) concludes at least the poorest countries should be exempt from theTRIPs requirements. The analysis though is based on some strong assumptions whichmay or, more likely in practice, may not apply, including:
1. Countries are fixed as innovators or purchasers of innovations,2. Products are freely available without patent protection,3. Identical linear demand curves for all countries,4. Constant marginal production costs, and5. Monopoly prices imposed under patent protection.
To understand the effects of a change in assumptions, consider Diwan and Rodrik’s(1991) analysis, which permits different tastes between northern and southern countries(in contradistinction to #3 above). They conclude that as long as northern and southerncountries have differences in preferences, both groups have the incentive to providepatent protection when R&D resources are scarce (the general case). As differences inpreferences decline though, the effects become ambiguous. In general, southerncountries would be expected to purchase more from the north, reducing the incentive forpatent protection. For northern firms, both the marginal costs and marginal benefits ofprotection are reduced, so the overall effect depends on the relative magnitude of the two,which is not known a priori.
Helpman (1993) attempts to resolve such differences by modeling the patent rights issueas a dynamic general equilibrium problem. Considering only the case where FDI exists(the pertinent issue for the present study), he concludes southern consumers are hurt bytighter IPR due to higher prices, and hence reduced total consumption and employment.However, this model assumes an externally determined innovation rate so that strongerIPR will not increase the number of products available or reduce the costs of producingexisting ones, either change which could reverse the conclusion. In general, there is anear-infinite number of possible scenarios to examine so that no general conclusion ispossible theoretically so the issue becomes an empirical question.
In an empirically-based analysis, Dollar and Kraay (2000) recently studied therelationship of growth and the income of the poor for 80 developing countries over fourdecades. Pooled cross-section, time series regression analysis was used which allowedmeasurement of both time and country-specific factors. In general, the incomes of thepoorest fifth of the population grew at the same rate as average income, refuting manyobservations that growth often disadvantaged the poor, or the poor lagged the generalpopulation in growth. The results are stable for fast and slow growing countries, andhigh and low income ones.
More specific to the current study, Dollar and Kraay also considered the relative growthof imports and exports, and the strength of property rights (rule of law). Defining theopenness of an economy as the ratio of import plus exports over GDP 3, they find therelationship to the income of the poor to be positive but not significant. This finding is in 3 GDP is Gross Domestic Product, the total account of a country excluding imports and exports of goodsand capital.
4
contradiction to others, emphasizing the importance of the measure used to reflect the‘openness’ of an economy. Similarly, the rule of law has a positive but highlyinsignificant effect on the income of the poor. The authors do not describe the measureused to capture the rule of law. However, Knack and Keefer (1995, Data Appendix)whose methodology is followed, used the International Country Risk Guide (ICRG) andthe Business Environmental Risk Intelligence (BERI). Two ICRG scores are used,‘Expropriation Risk’ and ‘Rule of Law’, the latter more closely reflecting “provisions foran orderly succession of power”.
For the present study, these results together are taken as support for the assumption thatthe connection between FDI and imports examined here will have positive impacts ongrowth, and the distribution of income generated by that growth. However, thoserelationships are not explicitly examined for the sample of countries used here.
B. ObjectivesThe overall objective of this analysis is an empirical analysis of the relationship betweenthe strength of national IPR, and foreign direct investment (FDI) and imports. In order toconduct the analysis, it is necessary to have a measure of the ‘strength’ of national IPRsystems. Typically, a scoring system is used; several past estimates are available whichmust be updated to reflect related TRIPs-related changes. Subsequently, the new IPRscore can be used in an examination of the effects on FDI and imports. Thus the two sub-objectives are:
• Develop an IPR score reflecting current legislation and practice. Unlike pastefforts which were very time-specific, here emphasis is placed on a system whichcan be updated regularly using only secondary sources of information. This isdone in Section II following.
• Using the IPR scoring system developed under the preceding objective, analyzethe effects of the ‘strength’ of IPR on FDI flows and imports for a sample ofdeveloping countries. This is done in Section III below.
II. CONSTRUCTING AN IPR ‘SCORE’
In an earlier effort at measuring the strength of national-level IPR protection, Ferrantino(1993) used a series of dummy (0/1) variables to reflect differences in national protectionschemes. The factors included membership in the Paris, Berne and UPOV Conventions,as well as the term of patent protection. The results, however, showed only the durationof patent protection to be a significant explanatory factor. This was perhaps not asurprising result as membership in the Paris Convention is quite broad (about 100countries) while UPOV had but a handful of country members corresponding to the 1980time period of the data used, so there was relatively little variability in the independentvariables to explain differences in national economic activity. Subsequent studies thenattempted to incorporate several factors in a composite IPR score, the approach followedhere. The development of the new scoring system is discussed below following a reviewof past efforts.
5
A. Literature Review of Available IPR ScoresApproaches to developing a scoring system typically use one of two methods, one basedon the text of national intellectual property legislation and one based on a survey ofpractitioners’ opinions. Ginarte and Park (1997) and Rapp and Rozek (1990) areexamples of the legislation-based approach. Ginarte and Park (1997) use a five pointscore based on the sum of five national components:
• extent of coverage (pharmaceuticals, food, etc.),• membership in international agreements,• loss of protection (compulsory license provisions, etc.),• enforcement mechanisms (provisions for injunctions, pleadings, etc.), and• duration of protection (standard = 20 years).
A sensitivity test was done on the effects of a range of weights in the ranking of countriesunder the system. As the results are quite insensitive to the weights tested, anunweighted sum is used.
Rapp and Rozek (1990, footnote 11) based their five point ranking system on theminimum standards set by the U.S. Chamber of Commerce; that is, most attention isgiven to laws “in force against infringement but not on their enforcement orimplementation." Ginarte and Park (1997, p. 289) justify the lack of consideration ofenforcement by noting, “the main concern about [developing countries] is the absence oflaws [on infringement]”. That may have been valid at the time the index was developed,but would seem to apply less today in the aftermath of the TRIPs minimum standards.Given the related base of the two indexes, it is surprising they are not very closely related(r = .235). Moreover, the Ginarte and Park index is closely related with the national GDP(r = .747) while Rapp and Rozek’s is not (r = .124). This variability emphasizes adifficulty of using IPR scores.
A second set of indexes is based on the judgment of practitioners. Mansfield (1995) forexample surveyed a total of 180 executives and patent attorneys in the US, Japan andGermany. Focus was on the chemical and drugs, and machinery and electrical equipmentindustries which are believed to be particularly sensitive to intellectual property (IP)protection. Respondents were asked for 14 more technologically advanced developingcountries to indicate when IP protection was ‘too weak’ to permit transfer of sensitivetechnologies to (a) invest in joint ventures, (b) wholly owned subsidiaries and (c)licensing key technologies. In general, protection levels were considered more adequatefor machinery than chemicals and drugs. And while there was a high level of correlationamong the national respondents, US firms were more likely to consider protection levelsas too weak compared with responses from Japan and Germany, possibly due to nationaldifferences in the rate of innovation.
Sherwood (1997(a)) also utilized a judgment-based ranking, relying on his ownassessment of the conditions in 18 developing countries, most in Latin America. Eachcountry was ranked on a 103 point scale for nine components including:
6
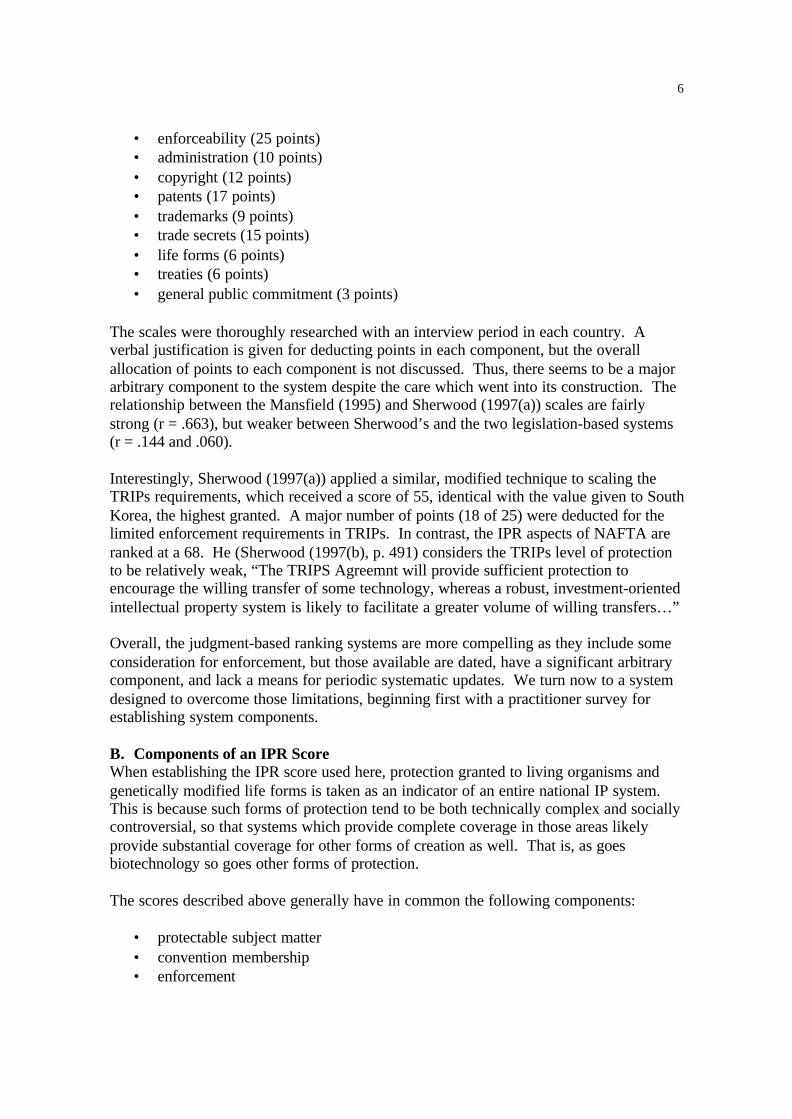
• enforceability (25 points)• administration (10 points)• copyright (12 points)• patents (17 points)• trademarks (9 points)• trade secrets (15 points)• life forms (6 points)• treaties (6 points)• general public commitment (3 points)
The scales were thoroughly researched with an interview period in each country. Averbal justification is given for deducting points in each component, but the overallallocation of points to each component is not discussed. Thus, there seems to be a majorarbitrary component to the system despite the care which went into its construction. Therelationship between the Mansfield (1995) and Sherwood (1997(a)) scales are fairlystrong (r = .663), but weaker between Sherwood’s and the two legislation-based systems(r = .144 and .060).
Interestingly, Sherwood (1997(a)) applied a similar, modified technique to scaling theTRIPs requirements, which received a score of 55, identical with the value given to SouthKorea, the highest granted. A major number of points (18 of 25) were deducted for thelimited enforcement requirements in TRIPs. In contrast, the IPR aspects of NAFTA areranked at a 68. He (Sherwood (1997(b), p. 491) considers the TRIPs level of protectionto be relatively weak, “The TRIPS Agreemnt will provide sufficient protection toencourage the willing transfer of some technology, whereas a robust, investment-orientedintellectual property system is likely to facilitate a greater volume of willing transfers…”
Overall, the judgment-based ranking systems are more compelling as they include someconsideration for enforcement, but those available are dated, have a significant arbitrarycomponent, and lack a means for periodic systematic updates. We turn now to a systemdesigned to overcome those limitations, beginning first with a practitioner survey forestablishing system components.
B. Components of an IPR ScoreWhen establishing the IPR score used here, protection granted to living organisms andgenetically modified life forms is taken as an indicator of an entire national IP system.This is because such forms of protection tend to be both technically complex and sociallycontroversial, so that systems which provide complete coverage in those areas likelyprovide substantial coverage for other forms of creation as well. That is, as goesbiotechnology so goes other forms of protection.
The scores described above generally have in common the following components:
• protectable subject matter• convention membership• enforcement
7
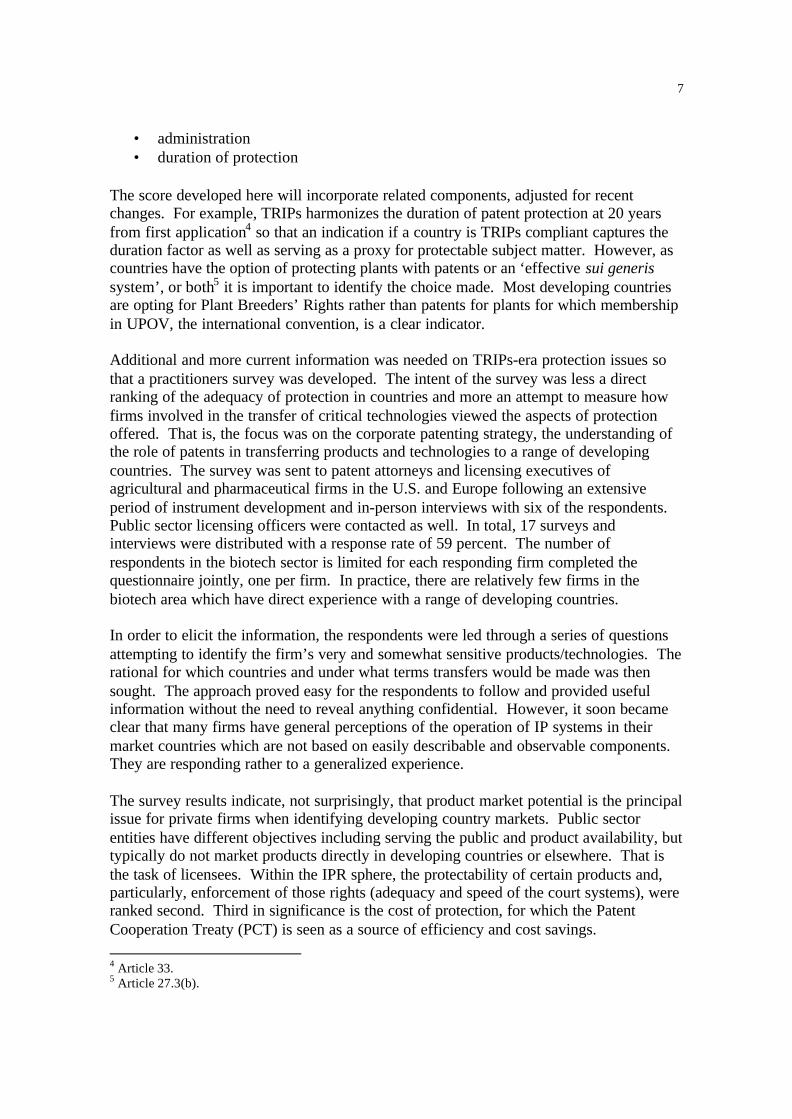
• administration• duration of protection
The score developed here will incorporate related components, adjusted for recentchanges. For example, TRIPs harmonizes the duration of patent protection at 20 yearsfrom first application4 so that an indication if a country is TRIPs compliant captures theduration factor as well as serving as a proxy for protectable subject matter. However, ascountries have the option of protecting plants with patents or an ‘effective sui generissystem’, or both5 it is important to identify the choice made. Most developing countriesare opting for Plant Breeders’ Rights rather than patents for plants for which membershipin UPOV, the international convention, is a clear indicator.
Additional and more current information was needed on TRIPs-era protection issues sothat a practitioners survey was developed. The intent of the survey was less a directranking of the adequacy of protection in countries and more an attempt to measure howfirms involved in the transfer of critical technologies viewed the aspects of protectionoffered. That is, the focus was on the corporate patenting strategy, the understanding ofthe role of patents in transferring products and technologies to a range of developingcountries. The survey was sent to patent attorneys and licensing executives ofagricultural and pharmaceutical firms in the U.S. and Europe following an extensiveperiod of instrument development and in-person interviews with six of the respondents.Public sector licensing officers were contacted as well. In total, 17 surveys andinterviews were distributed with a response rate of 59 percent. The number ofrespondents in the biotech sector is limited for each responding firm completed thequestionnaire jointly, one per firm. In practice, there are relatively few firms in thebiotech area which have direct experience with a range of developing countries.
In order to elicit the information, the respondents were led through a series of questionsattempting to identify the firm’s very and somewhat sensitive products/technologies. Therational for which countries and under what terms transfers would be made was thensought. The approach proved easy for the respondents to follow and provided usefulinformation without the need to reveal anything confidential. However, it soon becameclear that many firms have general perceptions of the operation of IP systems in theirmarket countries which are not based on easily describable and observable components.They are responding rather to a generalized experience.
The survey results indicate, not surprisingly, that product market potential is the principalissue for private firms when identifying developing country markets. Public sectorentities have different objectives including serving the public and product availability, buttypically do not market products directly in developing countries or elsewhere. That isthe task of licensees. Within the IPR sphere, the protectability of certain products and,particularly, enforcement of those rights (adequacy and speed of the court systems), wereranked second. Third in significance is the cost of protection, for which the PatentCooperation Treaty (PCT) is seen as a source of efficiency and cost savings. 4 Article 33.5 Article 27.3(b).
8
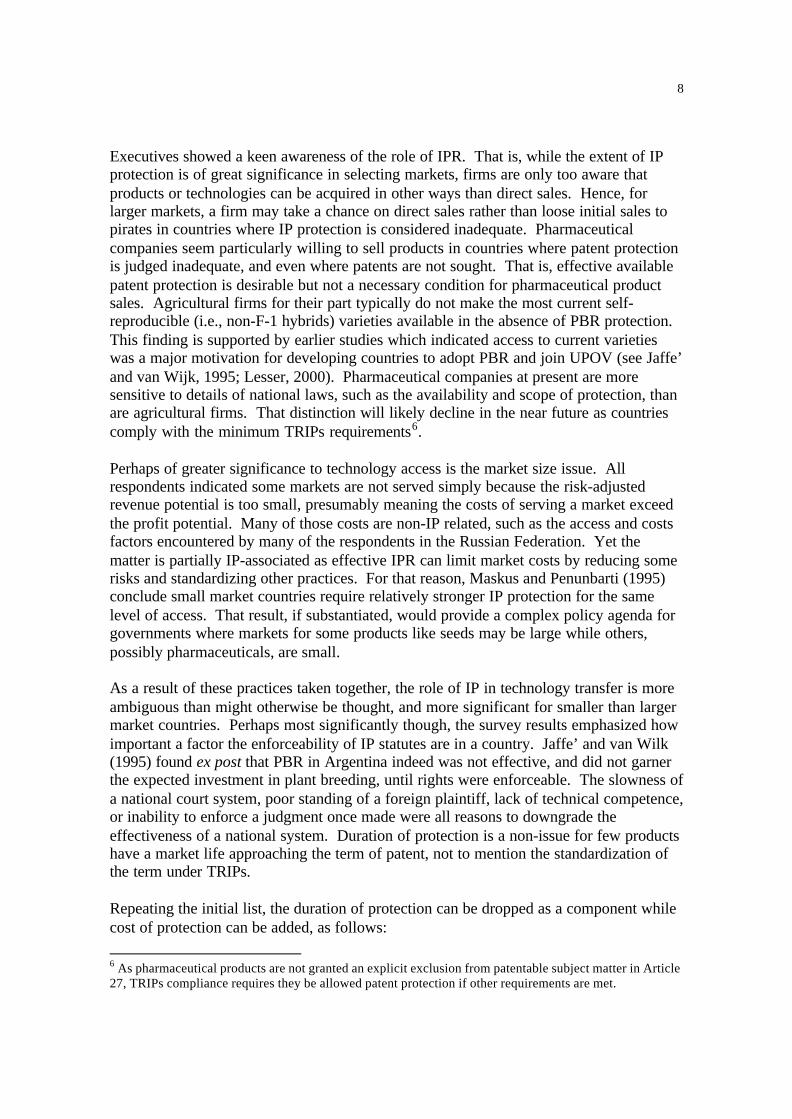
Executives showed a keen awareness of the role of IPR. That is, while the extent of IPprotection is of great significance in selecting markets, firms are only too aware thatproducts or technologies can be acquired in other ways than direct sales. Hence, forlarger markets, a firm may take a chance on direct sales rather than loose initial sales topirates in countries where IP protection is considered inadequate. Pharmaceuticalcompanies seem particularly willing to sell products in countries where patent protectionis judged inadequate, and even where patents are not sought. That is, effective availablepatent protection is desirable but not a necessary condition for pharmaceutical productsales. Agricultural firms for their part typically do not make the most current self-reproducible (i.e., non-F-1 hybrids) varieties available in the absence of PBR protection.This finding is supported by earlier studies which indicated access to current varietieswas a major motivation for developing countries to adopt PBR and join UPOV (see Jaffe’and van Wijk, 1995; Lesser, 2000). Pharmaceutical companies at present are moresensitive to details of national laws, such as the availability and scope of protection, thanare agricultural firms. That distinction will likely decline in the near future as countriescomply with the minimum TRIPs requirements6.
Perhaps of greater significance to technology access is the market size issue. Allrespondents indicated some markets are not served simply because the risk-adjustedrevenue potential is too small, presumably meaning the costs of serving a market exceedthe profit potential. Many of those costs are non-IP related, such as the access and costsfactors encountered by many of the respondents in the Russian Federation. Yet thematter is partially IP-associated as effective IPR can limit market costs by reducing somerisks and standardizing other practices. For that reason, Maskus and Penunbarti (1995)conclude small market countries require relatively stronger IP protection for the samelevel of access. That result, if substantiated, would provide a complex policy agenda forgovernments where markets for some products like seeds may be large while others,possibly pharmaceuticals, are small.
As a result of these practices taken together, the role of IP in technology transfer is moreambiguous than might otherwise be thought, and more significant for smaller than largermarket countries. Perhaps most significantly though, the survey results emphasized howimportant a factor the enforceability of IP statutes are in a country. Jaffe’ and van Wilk(1995) found ex post that PBR in Argentina indeed was not effective, and did not garnerthe expected investment in plant breeding, until rights were enforceable. The slowness ofa national court system, poor standing of a foreign plaintiff, lack of technical competence,or inability to enforce a judgment once made were all reasons to downgrade theeffectiveness of a national system. Duration of protection is a non-issue for few productshave a market life approaching the term of patent, not to mention the standardization ofthe term under TRIPs.
Repeating the initial list, the duration of protection can be dropped as a component whilecost of protection can be added, as follows: 6 As pharmaceutical products are not granted an explicit exclusion from patentable subject matter in Article27, TRIPs compliance requires they be allowed patent protection if other requirements are met.

9
• protectable subject matter• convention membership• enforcement• administration• cost of protection
Ways of quantifying each of these components using public sources are now explored.
• Protectable subject matter: as noted, TRIPs mandates a minimum scope of subjectmatter for patent protection so that satisfaction of the TRIPs requirements is an indicationof the allowable subject matter. Countries must certify their compliance with WTO inthe IP/N/1/[3 letter country code]/P 7 publication series. Those which have certifiedcompliance are noted with a 1; a 0 is used otherwise.
The only subject area where compliance is not fully indicative is for plants, wherecountries under Article 27.3(b) have the option of using patents and/or Plant BreedersRights (PBR). Membership in UPOV8 (a 1, 0 otherwise) is taken as an indication of theselection of the PBR option. The approach of using UPOV does miss those countrieswhich operate under a national law. At this stage, though, it is not clear whether anational system would be TRIPs compatible or indeed if national systems are oftenoperationalized. Kenya for example had PBR legislation for years but it was neverimplemented before the country began the process of joining UPOV in 1999 (see Jumaand Ojwang, 1989).
• Convention membership: in addition to membership in UPOV, signatories to thePCT are also noted (1 = member, 0 = not member). Participation in the PCT servesseveral functions for technology owners. Membership reduces direct and indirect costs(personnel) of application. The International Search also reduces the ambiguity of anational search in technical areas where national examiners may not have full access tocurrent documents (see Sherwood, 1997(a), p. 273). Membership in the Paris Conventionis no longer a meaningful distinction for most countries are now members andcompliance with 1967 Convention Articles 1-12 and 19 is mandated by TRIPs9.
• Cost of protection: while an important issue for firms, no data set of costs bydeveloping countries presently exists while only a few countries make even posted feesreadily available through a web site or other system. Thus it is not possible to include ameasure of costliness in the scoring system developed here.
• Administration: patent office administration incorporates a range of critical factorsfrom efficiency and transparency to adequacy of funding and training of examiners. Ofthese, the competence of staff is perhaps most significant, yet few patent offices provideinformation on the backgrounds of their employees. As an expedient, the decision was 7 Available online under publications at www.wto.org.8 UPOV membership is tabulated on the web page, www.upov.org.9 Article 2.
10
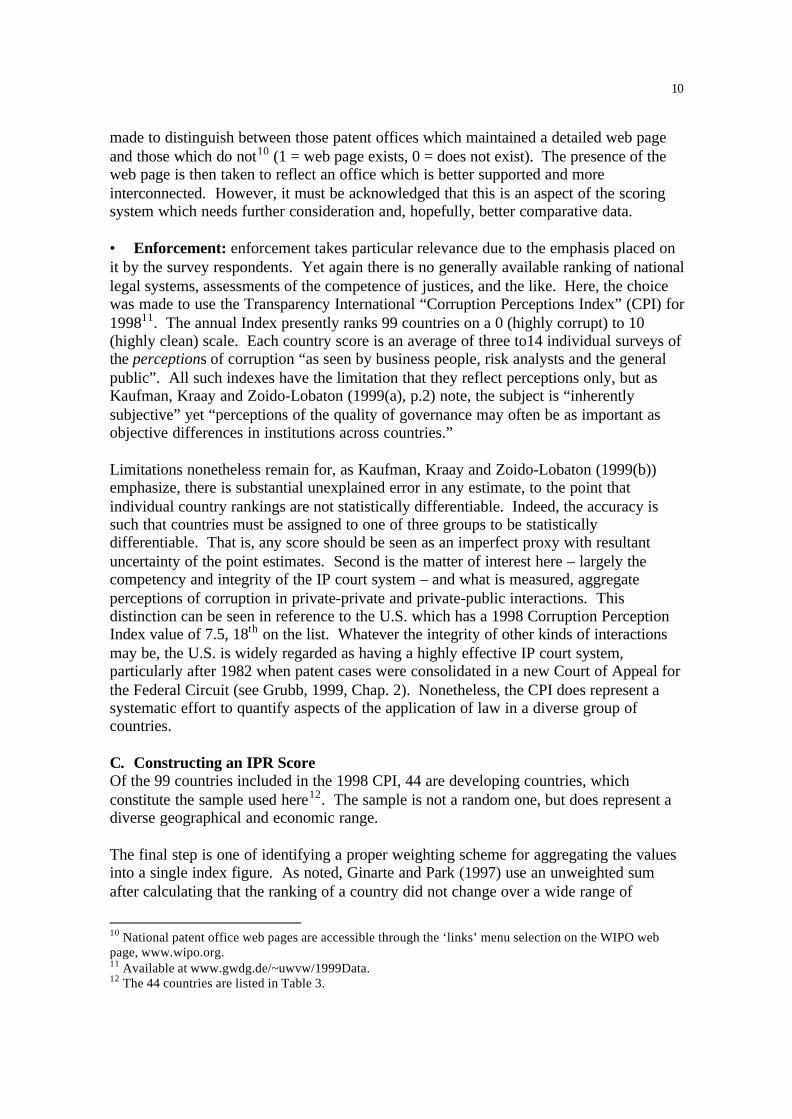
made to distinguish between those patent offices which maintained a detailed web pageand those which do not10 (1 = web page exists, 0 = does not exist). The presence of theweb page is then taken to reflect an office which is better supported and moreinterconnected. However, it must be acknowledged that this is an aspect of the scoringsystem which needs further consideration and, hopefully, better comparative data.
• Enforcement: enforcement takes particular relevance due to the emphasis placed onit by the survey respondents. Yet again there is no generally available ranking of nationallegal systems, assessments of the competence of justices, and the like. Here, the choicewas made to use the Transparency International “Corruption Perceptions Index” (CPI) for199811. The annual Index presently ranks 99 countries on a 0 (highly corrupt) to 10(highly clean) scale. Each country score is an average of three to14 individual surveys ofthe perceptions of corruption “as seen by business people, risk analysts and the generalpublic”. All such indexes have the limitation that they reflect perceptions only, but asKaufman, Kraay and Zoido-Lobaton (1999(a), p.2) note, the subject is “inherentlysubjective” yet “perceptions of the quality of governance may often be as important asobjective differences in institutions across countries.”
Limitations nonetheless remain for, as Kaufman, Kraay and Zoido-Lobaton (1999(b))emphasize, there is substantial unexplained error in any estimate, to the point thatindividual country rankings are not statistically differentiable. Indeed, the accuracy issuch that countries must be assigned to one of three groups to be statisticallydifferentiable. That is, any score should be seen as an imperfect proxy with resultantuncertainty of the point estimates. Second is the matter of interest here – largely thecompetency and integrity of the IP court system – and what is measured, aggregateperceptions of corruption in private-private and private-public interactions. Thisdistinction can be seen in reference to the U.S. which has a 1998 Corruption PerceptionIndex value of 7.5, 18th on the list. Whatever the integrity of other kinds of interactionsmay be, the U.S. is widely regarded as having a highly effective IP court system,particularly after 1982 when patent cases were consolidated in a new Court of Appeal forthe Federal Circuit (see Grubb, 1999, Chap. 2). Nonetheless, the CPI does represent asystematic effort to quantify aspects of the application of law in a diverse group ofcountries.
C. Constructing an IPR ScoreOf the 99 countries included in the 1998 CPI, 44 are developing countries, whichconstitute the sample used here12. The sample is not a random one, but does represent adiverse geographical and economic range.
The final step is one of identifying a proper weighting scheme for aggregating the valuesinto a single index figure. As noted, Ginarte and Park (1997) use an unweighted sumafter calculating that the ranking of a country did not change over a wide range of
10 National patent office web pages are accessible through the ‘links’ menu selection on the WIPO webpage, www.wipo.org.11 Available at www.gwdg.de/~uwvw/1999Data.12 The 44 countries are listed in Table 3.
11
weights, while Sherwood (1997(a)) used an arbitrary weighting system. For purposeshere, a more systematic approach is sought. What is used is factor analysis, where eachvariable is represented as a linear function of a small number of unobservable common-factors and a single specific variate. The common factors generate the covariancesamong the observed responses, while the particular terms contribute only to the variances(Morrison, 1976, Chap. 9).
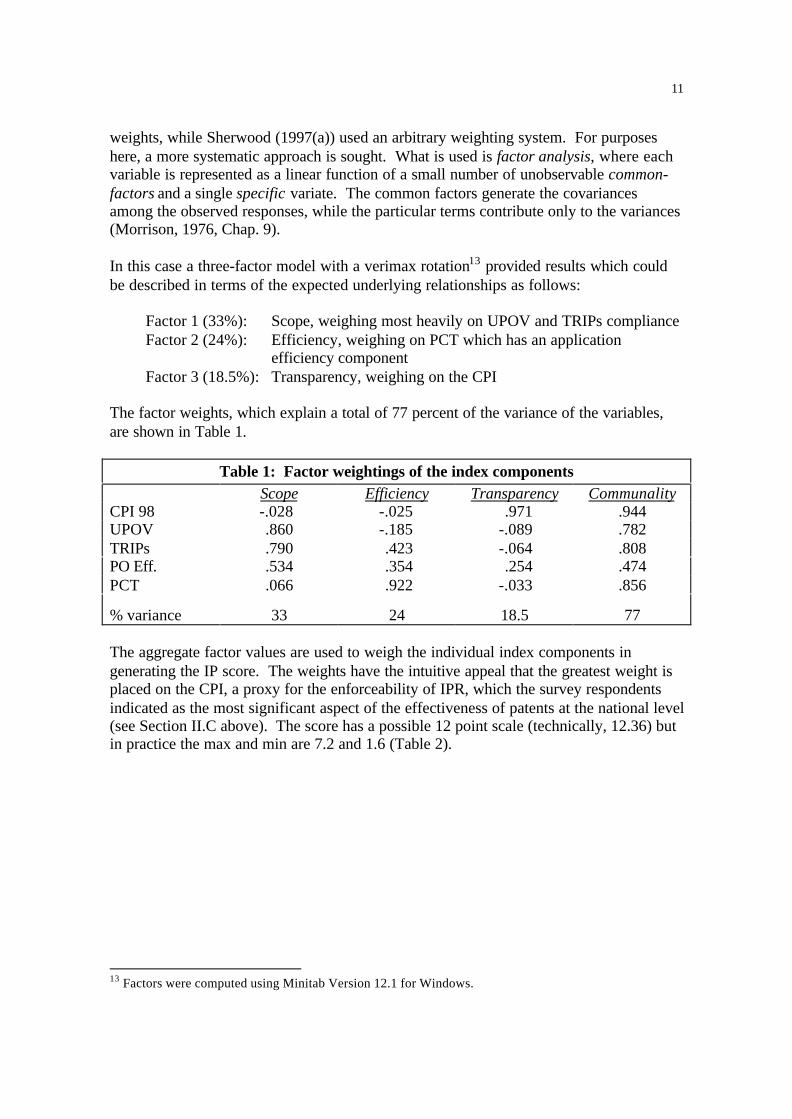
In this case a three-factor model with a verimax rotation13 provided results which couldbe described in terms of the expected underlying relationships as follows:
Factor 1 (33%): Scope, weighing most heavily on UPOV and TRIPs complianceFactor 2 (24%): Efficiency, weighing on PCT which has an application
efficiency componentFactor 3 (18.5%): Transparency, weighing on the CPI
The factor weights, which explain a total of 77 percent of the variance of the variables,are shown in Table 1.
Table 1: Factor weightings of the index componentsScope Efficiency Transparency Communality
CPI 98 -.028 -.025 .971 .944UPOV .860 -.185 -.089 .782TRIPs .790 .423 -.064 .808PO Eff. .534 .354 .254 .474PCT .066 .922 -.033 .856
% variance 33 24 18.5 77
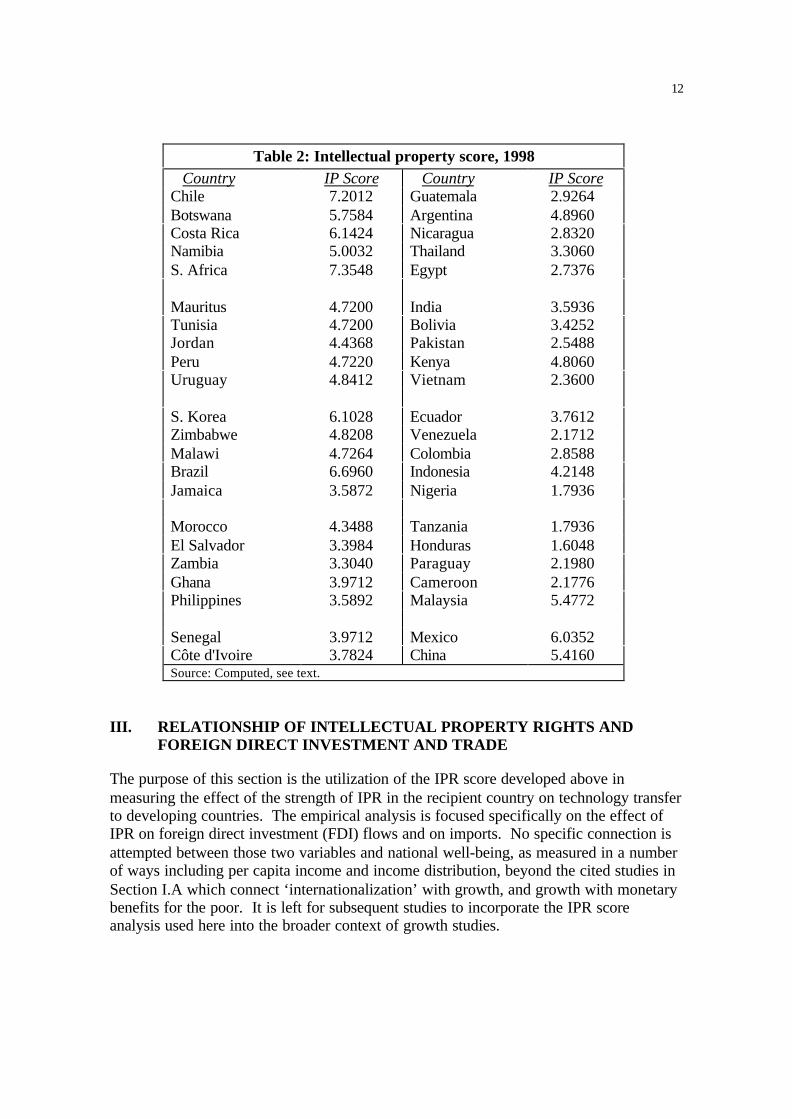
The aggregate factor values are used to weigh the individual index components ingenerating the IP score. The weights have the intuitive appeal that the greatest weight isplaced on the CPI, a proxy for the enforceability of IPR, which the survey respondentsindicated as the most significant aspect of the effectiveness of patents at the national level(see Section II.C above). The score has a possible 12 point scale (technically, 12.36) butin practice the max and min are 7.2 and 1.6 (Table 2).
13 Factors were computed using Minitab Version 12.1 for Windows.
12
Table 2: Intellectual property score, 1998 Country IP Score Country IP ScoreChile 7.2012 Guatemala 2.9264Botswana 5.7584 Argentina 4.8960Costa Rica 6.1424 Nicaragua 2.8320Namibia 5.0032 Thailand 3.3060S. Africa 7.3548 Egypt 2.7376
Mauritus 4.7200 India 3.5936Tunisia 4.7200 Bolivia 3.4252Jordan 4.4368 Pakistan 2.5488Peru 4.7220 Kenya 4.8060Uruguay 4.8412 Vietnam 2.3600
S. Korea 6.1028 Ecuador 3.7612Zimbabwe 4.8208 Venezuela 2.1712Malawi 4.7264 Colombia 2.8588Brazil 6.6960 Indonesia 4.2148Jamaica 3.5872 Nigeria 1.7936
Morocco 4.3488 Tanzania 1.7936El Salvador 3.3984 Honduras 1.6048Zambia 3.3040 Paraguay 2.1980Ghana 3.9712 Cameroon 2.1776Philippines 3.5892 Malaysia 5.4772
Senegal 3.9712 Mexico 6.0352Côte d'Ivoire 3.7824 China 5.4160Source: Computed, see text.
III. RELATIONSHIP OF INTELLECTUAL PROPERTY RIGHTS ANDFOREIGN DIRECT INVESTMENT AND TRADE
The purpose of this section is the utilization of the IPR score developed above inmeasuring the effect of the strength of IPR in the recipient country on technology transferto developing countries. The empirical analysis is focused specifically on the effect ofIPR on foreign direct investment (FDI) flows and on imports. No specific connection isattempted between those two variables and national well-being, as measured in a numberof ways including per capita income and income distribution, beyond the cited studies inSection I.A which connect ‘internationalization’ with growth, and growth with monetarybenefits for the poor. It is left for subsequent studies to incorporate the IPR scoreanalysis used here into the broader context of growth studies.
13
Prior to proceeding with the empirical analysis, the literature on prior IPR score studiesand determinates of FDI is reviewed. The review will both identify previous results forcomparison as well as variables to include in the analysis.
A. Literature reviewThis review begins at the most general level with studies of determinants of FDI,proceeding to prior studies using IPR scores, which are a special form of FDI models.The literature on the determinants of FDI, of which investment location theory is acomponent, is voluminous so that no attempt is made here to go beyond the basis theoriesand findings of relevance to IPR.
• General studies of determinates of FDI: McCorriston and Sheldon (1998) reviewthe theory of determinates of FDI in an effort to explain the ‘wavelike’ level of inwardbound FDI in the United States over the 1980 - 95 period. The classical theory explainsFDI as a mechanism used by firms which are otherwise unable to accrue fully firm-specific assets, assets such as a brand image or research intensity. An empirical studywould then include a number of industry-specific factors in a cross-section analysis toexplain why some industries are more international than others. But that approach cannotexplain the observed wave pattern to FDI.
Alternative explanations can be characterized as ‘relative wealth’ and ‘relative cost’theories, both associated with the exchange rate. The relative cost theory is concernedwith the effective cost in the currency of the investing country – depreciation of thecurrency of the recipient country tends to reduce costs for the investor. However, theeffect of the exchange rate is more ambiguous than that for it depends on where theinputs are acquired and the finished goods sold so a depreciation could as well raise asreduce costs. The relative wealth theory counters that ambiguity by invoking capitalmarkets imperfections which reduce the ability of financiers in the recipient country ofevaluating the assets of a foreign investor. A currency depreciation increases the value ofthe would-be acquirer in the eyes of a financial institution, reducing the credit constraintto FDI. Studies have generally shown that FDI is inversely related with the real value ofthe dollar, which is consistent with the relative wealth theory. Relative wealth is alsoaffected by relative stock prices.
In their analysis, McCorriston and Sheldon (1998, Table 2) attempt to explain cross-border acquisitions in U.S. manufacturing using both the real U.S. dollar exchange rateand the relative stock price in a time series analysis. Both variables have the expectedsigns and are statistically significant, again providing consistency with the marketimperfection hypothesis. The authors (1998, Table 3) then disaggregate the FDI data bysector, analyzing separately food, chemicals, fabricated metals, machinery, and othermanufacturing. While the aggregate results carried over for fabricated metals and othermanufacturing, neither explained the amount of cross-border investment in the foodsector. The reasons why the food sector responds differently to relative wealth factors,why possibly attributable to omitted variables problems or data quality limitations, arenot well understood.
14
Gopinath, Pick and Vasavada (1998) extend the preceding analysis in two ways by (a)considering volatility in the real exchange rates as a measure of riskiness of theinvestments, and (b) considering effects on exports and foreign affiliate sales as well asoutward FDI. In a pooled time series/cross-section study of 10 high income countries,the independent variables were normalized (divided) by GNP to account for incomeeffects and possible differences in factor costs. An appreciation of the dollar increasesoutward FDI and resultant affiliate sales, while reducing exports. Exports and FDI arethen substitutes, but only partially, for FDI is more responsive to appreciation of thedollar than are exports. Higher volatility of real exchange rates as expected depress bothoutward FDI and affiliate sales. Despite those results, Erb, Harvey and Viskanta (1996)argue that exchange rate volatility is an ex post measure of risk, while country risk ratingsare better ex ante measures.
Wheeler and Mody (1992) extend the analysis by considering location theory,particularly the opposing forces on firms making choices among recipient countries.According to the traditional, or ‘gravity’ model of trade, firm choices are based oncomparative advantage ‘classical’ variables of market size, openness of the economy,transportation, and relative costs. These variables come from the so-called ergodiclocation theories, long term patterns which can be affected, but only temporarily, bysubsidies. In counter-distinction is the non-ergodic theory which draws heavily onagglomeration economies. Investment creates specialized services, which attract furtherinvestment so that an early advantage, from whatever source, tends to be perpetuated.Disrupting this notion of ‘winning’ a location tournament is the desire for firms to reducerisk through geographic diversification.
Wheeler and Mody (1992) attempt to distinguish between these opposing theories byconstruction an outward-FDI flow model for U.S. firms for the 1980s. The cross-section/time series analysis uses an annual dummy to capture the gross annual changesbut no country dummies as that would leave only within-country differences to beexplained by the analysis. One country is used as a numeraire to avoid possible spuriousregression results due to non-stationarity of the investment series. Distinguishing amongthe competing theories is accomplished by three sets of data, (a) classical variables likecosts, market size and taxation, (b) agglomeration benefits such as infrastructure anddegree of industrialization, and (c) measures of riskiness. In general, risk was of littlesignificance, while both the classical variables and agglomeration factors helped explainthe location of investments. Important factors varied across industries with, for example,labor costs being more significant for the electronics sector, likely because assemblyplants are located in areas of low labor costs. The magnitude (or, more properly, theelasticities) of the effects are heavily influenced by the degree of industrialization. Whenproduction is for the domestic market, openness of the economy actually reducedinvestment, which is attracted by high trade barriers.
• FDI and IPR: Rapp and Rozek (1990) studied the relationship between the strengthof IPR systems and ‘modernization variables’ including GDP, access to electricity, andhealth factors. The relationship was found to be a statistically strong positive one, butthere is no indication of causality. That is, strong IPR could be leading to modernization,or ‘modern’ nations could be adopting stronger IPR as the economy reaches a critical
15
level. Critics of IPR frequently note that the Netherlands and Switzerland did not adoptpatent laws until 1912 and 1907, respectively (implying the same situation would apply atthe end as the beginning of the century), when their economies were well advanced,while stronger IPR have long been associated with higher per capita GDP (Grief, 1987).
As if to emphasize the causality issue, Ginarte and Park’s (1997) work focused onidentifying determinants of a country’s level of patent protection. Using their own IPRscore (see Section II.A), the authors find a strong correlation between the ‘strength’ ofIPR and GDP per capita lagged five years. However, once variables representing thedeterminants of economic development (R&D expenditures, market freedom, openness)are added, the explanatory power of GDP vanishes, suggesting it serves as a proxy.Dividing the sample of 48 countries in two based on GDP, R&D is a better explanation ofthe strength of IPR for the richer nations, which, the authors conclude, have more toprotect. Conversely, they argue that in less wealthy countries, most R&D spending is bythe public sector, which is less likely to use IPR than private firms. Yet there is aminimum critical size for the research sector, as indicated when R&D spending isreplaced by the R&D/GNP ratio.
A policy ramification drawn by Ginarte and Park (1997) is that less wealthy countries(which have lower levels of R&D spending) should economize on the institutional costsof providing IPR protection through some form of cooperation. Yet the point thatstronger IPR is less beneficial for the less technologically advanced countries will notescape policy makers, as noted above. Note however most of the emphasis is on theinnovation effect of IPR as opposed to its technology transfer role emphasized in thispaper.
Seyoum (1996) examined the relationship of FDI and IPR from the perspective ofgovernment control; can governments affect inward FDI more effectively throughmacroeconomic policy, or strength of IPR? IPR, in his view, is taking on additionalsignificance as technology-based products are supplanting natural resources in creatingnational wealth while production can be increasingly easily moved between countries.Using a cross-section/time series data set for 27 randomly selected countries for 1975-90,the author used two sets of independent variables, four (copyright, patents, trade secrets,etc.) to represent IPR and four (market size, public investment, external debt andexchange rate stability) to capture policy factors. The independent variable wasnormalized as a percentage of GDP. The IPR score is based on the views of practitionersusing a 1 – 3 scale in the 27 sample countries.
Results are separated for the least developed, emerging and developed economies in thesample. For the less developed, policy factors explain 21 percent of the variation in FDIflows, IPR factors, 13 percent. The relative importance is reversed for the emergingeconomies where economic policy variables account for only 28 percent of variationwhile IPR aspects capture 43 percent of the FDI flow variation. Among this secondgroup, “enforcement is the most important concern”, as has previously been noted.
16
In two high-profile studies, Mansfield (1994, 1995) examined FDI outward flows forU.S., German and Japanese firms. The IPR score used is explored elsewhere (see SectionII.A) so that attention here is focused on the empirical estimation. Due to datalimitations, only U.S. firms are included in the analysis for the years 1990-93. Inaddition to the IPR score, the independent variables include market size (GNP), stock ofFDI, degree of industrialization, and ‘openness’. The first three variables (plus a dummyvariable for Mexico) are significant with the results indicating that a 10 percent increasein the IPR score will, other factors held constant, increase annual FDI inflows to acountry by about $ 200 million. Caution is advised in interpreting that result. The degreeof industrialization might be expected to have a positive effect on FDI inflows, but in thismodel the result is negative.
Braga (1995) both reviews a number of other empirical studies as well as conducts hisown. He notes that the effect of stronger IPR on trade flows is ambiguous; if the market-power (leading to higher prices) effect dominates the market-expansion (or availability)effect, trade will diminish, and vice versa, so the matter is an empirical one. Ferrantino(1993) found the latter dominates the former – stronger IPR are trade promoting. In hisown analysis of the total foreign assets of U.S. firms, and using the Rapp and Rozek(1990) IPR score (see Section II.A), Braga (1995) includes as independent variablesGDP, growth rates, and a measure of trade barriers. Results show that a higher IPR scorehas a positive impact on aggregate U.S. investment abroad, but the sectoral models areless robust. He cautions that a formal model of the equilibrium distribution of FDI isneeded for more precise inferences, but as a minimum predicts the TRIPs standards willserve as a “threshold indicator”.
In summary, empirical studies generally support an expectation that stronger IPRprotection does indeed enhance both FDI and imports. The relative wealth theory isbetter supported empirically than the relative cost model, but in fact both require theinclusion of an exchange rate variable in the analysis. Results across time and models dohowever vary according to:
• production for export or domestic consumption: openness of the economy favorthe former over the latter,
• degree of industrialization: more industrialized nations show a more pronouncedresponse to the strength of IPR, but that may be due to either a causal relationshipor a statistical reality that more industrialized countries are more dependent onforeign technologies and capital,
• sector: more technologically advanced sectors (like electronics) are more IPRdependent than less technical ones (like food processing),
• exchange rate: due either to the cost or wealth effect, and• stock of existing FDI: possibly as a result of the agglomeration effect, countries
with significant prior FDI tend to attract more.
These factors must be considered in the current analysis.

17
B. Selection of Variables for Analysis and Data SourcesBased on the preceding, the independent variables can be grouped into three categories asfollows:
1. classical ‘gravity’-type variables describing business justifications for selectingone country over another, such as market size, costs openness and taxation,
2. agglomeration benefits like infrastructure, FDI stock and degree ofindustrialization, and
3. riskiness, such as the rule of law and exchange rate variability.
The dependent variables are FDI and exports for the full sample of countries. Additionaldependent variables such as high tech exports and royalties earned or paid are also used,but for only the part of the data set for which data are available.
Model forms are quite variable, including trans-log, semi-log and linear, with no cleartheoretical justification for one form over another. This will be left as an empirical,goodness-of-fit matter in the current analysis. Most studies do use a cross-section/timeseries (CSTS) approach which helps accommodate for unexplained inter-year variability.CSTS analysis however does increase the econometric complexity of the analysis. Forthe current application, the TRIPs provisions have been in place in a range of countriesfor a very short time period meaning TS analysis is not feasible, leaving only simple CSanalysis. Specific variables and data sources are identified below. All data are for 1998unless otherwise noted.
Dependent Variables:FDI inflows (UNCTAD, World Investment Report, 1999, Annex table B.1)Merchandise Imports (WB, World Development Index, 2000, Table 4.6)
High-Technology Exports (WB, World Development Index, 2000, Table 5.12)Royalty and License Fees (WB, World Development Index, 2000, Table 5.12)
Independent Variables:IPR Score – computed, see Section II.D.FDI inward stock (UNCTAD, World Investment Report, 1999, Annex table B.3)Risk: Country Credit Ranking (iiC.C.R.)14 OR standard deviation of exchange rate (WB,
World Development Index, various years, Table 5.6)GNP (WB, World Development Index, 2000, Table 1.1)Openness: notifications under Article 5.1 of TRIMs15 OR exports/GNPExchange rate, 1999 (WB, World Development Index, 2000, Table 5.6)Exchange rate, prior years (FAO Trade Yearbook, 1998, pp. xxx-xxxi)Degree of industrialization/industry value added (WB, World Development Index, 2000,
Table 6.6)Real exchange rate: computed by dividing the exchange rate by measures of external
purchasing parity index (WB, World Development Index, 2000, Tables 4.12 and 5.6) 14 Available online at www.iimagazine.com15 Available online at www.wto.org
18
Manufacturing wages (WB, World Development Index, 2000, Table 2.6)Road quality index (100 = expected for country at development level) (WB, World
Development Index, 2000, Table 5.9)Manufacturing tariff (WB, World Development Index, 2000, Table 6.6)Internal purchasing parity index (CIA)16
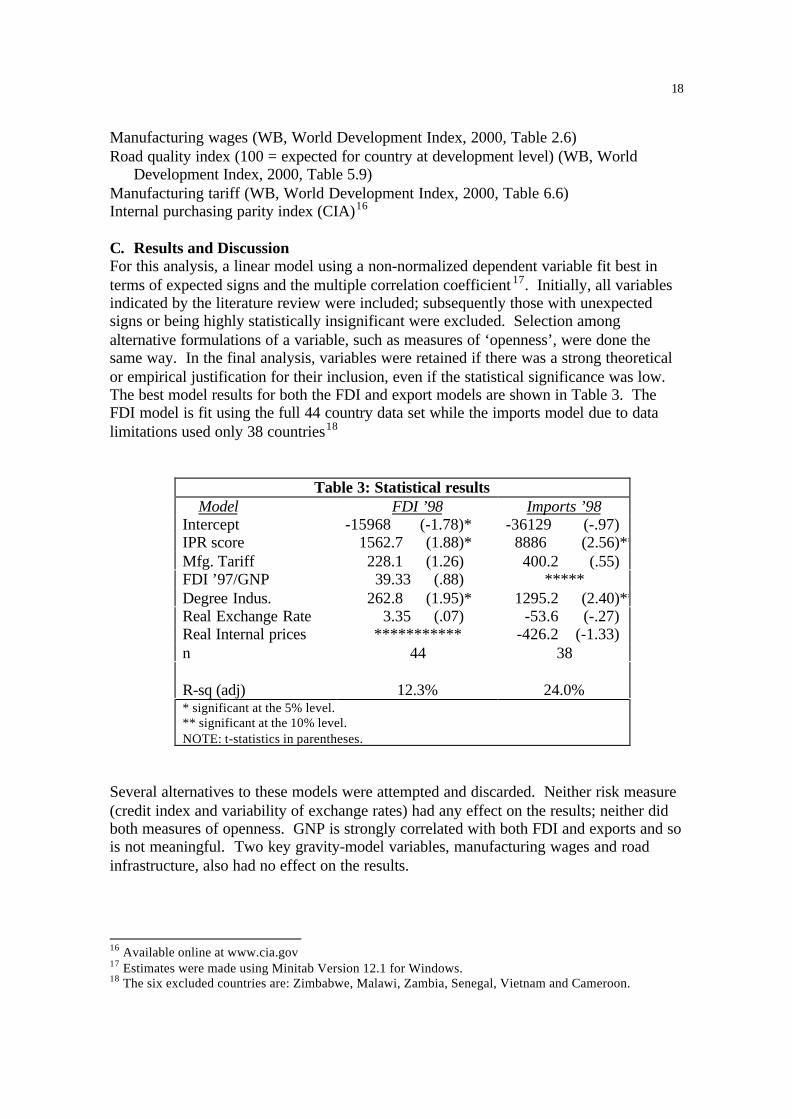
C. Results and DiscussionFor this analysis, a linear model using a non-normalized dependent variable fit best interms of expected signs and the multiple correlation coefficient 17. Initially, all variablesindicated by the literature review were included; subsequently those with unexpectedsigns or being highly statistically insignificant were excluded. Selection amongalternative formulations of a variable, such as measures of ‘openness’, were done thesame way. In the final analysis, variables were retained if there was a strong theoreticalor empirical justification for their inclusion, even if the statistical significance was low.The best model results for both the FDI and export models are shown in Table 3. TheFDI model is fit using the full 44 country data set while the imports model due to datalimitations used only 38 countries18
Table 3: Statistical results Model FDI ’98 Imports ’98Intercept -15968 (-1.78)* -36129 (-.97)IPR score 1562.7 (1.88)* 8886 (2.56)**Mfg. Tariff 228.1 (1.26) 400.2 (.55)FDI ’97/GNP 39.33 (.88) *****Degree Indus. 262.8 (1.95)* 1295.2 (2.40)**Real Exchange Rate 3.35 (.07) -53.6 (-.27)Real Internal prices *********** -426.2 (-1.33)n 44 38
R-sq (adj) 12.3% 24.0%* significant at the 5% level.** significant at the 10% level.NOTE: t-statistics in parentheses.
Several alternatives to these models were attempted and discarded. Neither risk measure(credit index and variability of exchange rates) had any effect on the results; neither didboth measures of openness. GNP is strongly correlated with both FDI and exports and sois not meaningful. Two key gravity-model variables, manufacturing wages and roadinfrastructure, also had no effect on the results.
16 Available online at www.cia.gov17 Estimates were made using Minitab Version 12.1 for Windows.18 The six excluded countries are: Zimbabwe, Malawi, Zambia, Senegal, Vietnam and Cameroon.
19
Overall, the two models fit moderately well, at least considering the purely cross-sectional nature of the analysis. Indeed, to attribute effects to TRIPs at an early stage inthe compliance process (1998), it is necessary to assume many FD investors acted in partin anticipation of the benefits of strengthened IPR. That is certainly plausible aslegislative changes are frequently announced, and drafts circulated, well beforeenactment. Butler and Marion (1985, p. 74) examining U.S. PBR law likewise found thatthe effects of strengthened IPR could be detected well in advance of enactment. Therecentness of the IPR effects does indicate the analysis should be confirmed in a fewyears, preferably using CS-TS methods, when more data are available. Moreover, ageneral equilibrium analysis is indeed required to understand the overall consequences ofchanging IPR legislation for part of what is being measured here is a reallocation ofmonies among countries rather than new and additional funds being made available.
In most cases, the variables have the expected signs. Imports for example are reducedwhen prices (external and internal) are higher, but the significance of the effect isminimal. That could be due to the dual use of imports for domestic consumption and asinputs into re-exports, which effects tend to counter themselves. FDI is enhanced byhigher tariffs, in line with the benefit of domestic production to avoid the high tariffsand/or as protection from import competition. Again though, the statistical significanceis not very strong, perhaps indicating a decline in the role of tariffs under the new WTOagreement. The significance of the industrialization variable indicates that the moreindustrialized countries are more international – whether this is due causally toagglomeration factors or is simply a control variable cannot be determined from theseresults.
Most pertinent here, the IPR index is positive and significant in both equations. That is,stronger IPR increases both FDI and imports. In the latter case, the availability effect ofIPR overcomes the price factor in increasing consumption. On average, the resultsindicate a one point increase in the IPR score (about 10 percent) will increase a country'sFDI by $ 1.5 billion (50 percent of the mean amount) and imports by $8.9 billion (40percent of the mean amount). The FDI effect is significantly greater than the $200million found by Mansfield (1995, see above) but he considered only US sources and anearlier period when FDI was less. Moreover, the forms of the indexes are notcomparable. Of course, these results are averages only and do not imply that an increasein the IPR index will necessarily lead to the FDI increase forecast here for a particularcountry at a specific time. Among other factors, the level of industrialization is asignificant factor so that less industrialized countries can expect a more modest effect ofIPR strength on FDI and imports. However, overall the results do indicate thatstrengthening IPRs is an effective policy tool for countries seeking to internationalize theeconomy or, conversely, increased internationalization is a benefit of TRIPs compliance.This conclusion is particularly relevant in the WTO-era when national governments havefewer policy options.
The analysis was rerun using as dependent variables high tech exports and license feespaid. Due to data limitations, these analyses were limited to 34 and 35 countries,respectively. The results (not shown here) are generally consistent with those in Table 3.
20
That is, the IPR score is positive if not strongly significant. Indeed, the only significantvariable is the degree of industrialization in the high tech export model, a not surprisingresult.
IV. SUMMARY AND CONCLUSIONS
This analysis undertakes a more complete and current understanding of the relationshipbetween international economic activity and IPR for developing countries in the post-TRIPs era. Under TRIPs, signatory countries are required to establish a prescribedminimal level of IPR protection. This is, and has long been, a contentious matter forcountries where the costs of strengthened IPR in royalty payments is easily identified.Benefits though are more elusive to document. Here, a link is examined betweenstronger IPR protection and two key international factors, foreign direct investment andimports. No specific connection is made here between increases in those factors andnational well-being, although through the literature it is possible to trace the associationbetween international linkages and economic growth and rising per capita income,including that for the poorest decile. The results presented here should benefitpolicymakers in developing countries wishing to understand the possible benefits ofstrengthened IPRs.
The analysis requires a means of measuring the relative strength of national IPRprotection, and IPR ‘score’. Several such scores have been developed in the past, of twotypes, one based on an evaluation of legislation alone and one on practitioners’judgments. All at this point are dated in this TRIPs era, and cannot be readily updated asmore countries comply with TRIPs mandates. A new score is developed here which usesonly secondary data. The components and general weighting of factors is based on asurvey of technology licensers in the biotechnology area, considered to be a complexaspect of property rights control and hence indicative of major issues. The scoringsystem consists of a ‘corruption index’, membership in UPOV and the PCT, compliancewith TRIPs, and a measure of patent office competency, as proxied by the existence of aweb site. Rather than using arbitrary weights in establishing the score, as is often done,factor analysis is applied. The result is three factors which can be titled ‘scope’,‘efficiency’, and ‘transparency’, which together explain 77 percent of the variance.
The resultant score is on a 12 point basis, and maintains the rankings of the earlierattempts. It is readily updatable, but has the limitation of a weak means of measuringrelative patent office competency, a difficult matter indeed given limited availableinformation, but one on which more work is needed.
Prior studies have generally shown a positive relationship between an IPR score and bothFDI and imports. Results however are not consistent for all sectors for reasons which arenot entirely explained. The positive relationship of the IPR score and imports indicatesthat FDI and imports are complements, and further that the availability factor under IPRoutweighs the higher price typically associated with protected products and technologies.
21
The current analysis replicated the prior studies using the newly developed IPR score,applied to 1998 data for 44 developing countries. The use of a single year (a cross-sectional model) as opposed to the typical cross-section/time series analysis isnecessitated by the recentness of the TRIPs standards, meaning there is no really relevantprior period. For greater confidence in the results, the analysis should be rerun after aperiod of several years when the data availability will be enhanced. Despite the purecross-sectional nature of the analysis, the statistical results are reasonable. A number ofvariables, such as various measures of risk and wage rates, had very low statisticalsignificance and were not retained.
Most importantly for this analysis, the relationship between the IPR score and both FDIand imports is both positive and significant (at the 10 and 5 percent levels, respectively).A one point increase in the IPR score (about 10 percent) would on average increase FDIby $ 1.5 billion. Of course, this result should not be interpreted to mean that amountwould apply to any particular country, but the direction of the effect is quite robust.These and prior results are non-general equilibrium results, meaning part of the observedeffects relate to movements among countries rather than all new investment funds. Ageneral equilibrium analysis is needed to understand the effects of simultaneous changesby all countries.
This result, taken in the context of previous studies, is compelling evidence that strongerIPR do indeed provide some domestic benefits for developing nations. This is aparticularly relevant factor in the WTO era when governments have fewer policy optionsavailable. Indeed, the current study shows that higher tariffs also contribute to greaterFDI, likely due to the creation of protected markets. But the factor is not as significant asfound in past studies, which is in line with the WTO tariff-reducing role.
In a broader perspective, this analysis does not identify what specifically about IPR leadsto greater internationalization. Clearly the protection aspect is significant, for IPR tend tobe more important for more valuable and readily copied inventions. Yet a major aspectof the score used here and in prior studies is based on the transparency of legal systems –the options to protect one's properties in whatever forms. Hence, stronger IPR couldserve in the analysis as a proxy for other legal and governmental factors. At the sametime, investors might look to the operation of property rights systems as an indicator ofthe general system for protecting property rights. Others have suggested this role forIPRs for a long time; in Penrose’s (1973, p. 785) words, “it may be that cooperation inthe [patent] system on the part of less developed countries will help them to obtain thecooperation of [multinational] firms”. Yet the results in general combined with thesurvey results do support the view that investors are very aware of IPR systems inindividual countries and act carefully within that context. Countries wishing to attractthat group are advised to strengthen the IPR systems accordingly.
22
V. REFERENCES
Braga, C.A. Primo, 1995. “Trade-Related Intellectual Property Issues: The UruguayRound Agreement and its Economic Implications”. Chap. 12 (pp. 381-412) in W. Martinand L.A. Winters (eds.), The Uruguay Round and Developing Economies. Wn., D.C.:World Bank, Discussion Paper 307.
Butler, L.J. and B.M. Marion, 1985. The Impacts of Patent Protection on the U.S. SeedIndustry and Public Plant Breeding. U. Wisconsin, N.C. Project 117, Monograph 16,Sept.
Deardorff, A.V., 1992. “Welfare Effects of Global Patent Protection”. Economica, 59:35-51.
Diwan, I. and D. Rodrik, 1991. “Patents, appropriate technology, and North-South trade”.J. Int. Econ., 30: 27-47.
Dollar, D. and A. Kraay, 2000. “Growth Is Good for the Poor.” World Bank. Availableat www.worldbank.org/research/growth/absdollakray (Draft).
Erb, C.B., C.R. Harvey and T.E. Viskanta, 1996. “Expected Returns and Volatility in 135Countries”. J. Portfolio Analysis, Spring: 46-58. Available atwww.duke.edu/~charvey/Country_risk/ccr/ccr1
Ferrantino, M.J., 1993. “The Effects of Intellectual Property Rights on InternationalTrade and Investment”. Weltwirtschaftliches Archiv., Vol. 129, pp. 300-31.
Food and Agricultural Organization (FAO), 1998. Trade Yearbook. Rome. Vol. 52.
Ginarte, J.C. and W.G. Park, 1997. “Determinants of patent rights: A cross-nationalstudy”. Research Policy, 26: 283-301.
Gopinath, M., D. Pick and U. Vasavada, 1998. “Exchange Rate Effects on theRelationship between FDI and Trade in the U.S. Food Processing Industry”. Am. J. Agr.Econ., 80(5):1073-79.
Grief, S., 1987. “Patents and Economic Growth”. Int. Rev. Industrial Prop. andCopyright Law, 18: 191-213.
Grubb, P.W., 1999. Patents for Chemicals, Pharmaceuticals and Biotechnology. Oxford:Clarendon Press.
Helpman, E., 1993. “Innovation, Imitation, and Intellectual Property Rights”.Econometrica, 61(Nov.): 1247-80.
23
Jaffe’, W. and J. van Wijk, 1995. “The impact of plant breeders’ rights in developingcountries”. Univ. Amsterdam, Inter-Am. Inst. For Cooperation? on Agriculture, Oct.
Juma, C. and J.B. Ojwang, 1989. Innovation and Soverereignty: The Patent Debate inAfrican Development. Nairobi: African Center for Technology Studies.
Kaufman, D., A. Kraay and P. Zoido-Lobaton, 1999(a). “Governance Matters”. WorldBank, Policy Research Working Paper 2196, October. Available at www.worldbank.org/wbi/gac
Kaufman, D., A. Kraay and P. Zoido-Lobaton, 1999(b). “Aggregating GovernanceIndicators”. World Bank, Policy Research Working Paper 2195, October. Available atwww.worldbank.org/wbi/gac
Knack, S. and P. Keefer, 1995. “Institutions and Economic Performance: Cross-CountryTests Using Alternative Institutional Measures.” Economics and Politics, 7(3): 207-27,Nov.
Lesser, W., 2000. "An Economic Approach to Identifying an 'Effective Sui GenerisSystem' for Plant Variety Protection Under TRIPS," Agribusiness, 16(1): 96-114.
Mansfield, E., 1995. “Intellectual Property Protection, Direct Investment, andTechnology Transfer: Germany, Japan, and the United States”. World Bank,International Finance Corporation, Discussion Paper 27, 32 pp.
Mansfield, E., 1994. “Intellectual Property Protection, Foreign Direct Investment, andTechnology Transfer: Germany, Japan, and the United States”. World Bank,International Finance Corporation, Discussion Paper 19.
Maskus, K.E. and M. Penunbarti, 1995. “How Trade-Related are Intellectual PropertyRights?" J. International Economics, 39: 227-48.
McCorriston, S. and I. M. Sheldon, 1998. “Cross-Border Acquisitions and Foreign DirectInvestment in the U.S. Food Industry”. Am. J. Agr. Econ., 80(5): 1066-72.
Morrison, D.F., 1976. Multivariate Statistical Methods. New York: McGraw-Hill BookCo.
Penrose, E., 1973. “International patenting and the Less-Developed Countries”.Economic J., 83(331): 768-786.
Rapp, R.T. and R.P. Rozek, 1990. “Benefits and Costs of Intellectual Property Protectionin Developing Countries”. National Economic Research Associates, Inc., White Plains,N.Y., Working paper No. 3.
24
Seyoum, B., 1996. “The Impact of Intellectual Property Rights on Foreign DirectInvestment”. Columbia J. World Business, 31(1): 51-59.
Sherwood, R.M., 1997(a). “Intellectual Property Systems and Investment Stimulation:The Rating of Systems in Eighteen Developing Countries”. IDEA: The J. Law andTechnology, 37: 261-371.
Sherwood, R.M., 1997(b). “The TRIPs Agreement: Implications for DevelopingCountries”. IDEA: The J. Law and Technology, 37: 491-545.
United Nations Conference on Trade and Development (UNCTAD), 1999. WorldInvestment Report, 1999. New York: United Nations.
United Nations Conference on Trade and Development (UNCTAD), 1975. “The Role ofthe Patent System in the Transfer of Technology to Developing Countries”. New York:United Nations, TD/B/AC.11/19/Rev. 1.
Wheeler, D. and A. Mody, 1992. “International Investment Location Decisions: The Caseof U.S. Firms”. J. Int. Econ., 33: 57-76.
Winter, S., 1989. “Patents in Complex Contexts: Incentives and Effectiveness”. In Weiland Snapper (eds.), Owning Scientific and Technical Information. New Brunswick, NJ:Rutgers Univ. Press.
World Bank, 2000. World Development Indicators. Washington, D.C. Available online atwww.worldbank.org.