Embed Size (px)
Citation preview
THE EFFECTS OF VOLATILITY RISK ON THE VOLUME OF
FUTURES CONTRACTS TRADING AT THE NAIROBI SECURITIES
EXCHANGE
BY
PETER KIOKO MUTHENYA
A RESEARCH PROJECT SUBMITTED IN PARTIAL FULFILLMENT
OF THE REQUIREMENTS FOR THE AWARD OF THE DEGREE OF
MASTER OF SCIENCE IN FINANCE, UNIVERSITY OF NAIROBI
NOVEMBER, 2020

ii
DECLARATION
This research project is my original work and has not been submitted to any other University
for academic award.
Sign……………………………. Date…………08/12/2020………………
Peter Kioko Muthenya D63/5353/2017
This project has been submitted with my approval as the University supervisor.
Sign…………………….………………….. Date……………………….
Dr. Angela Kithinji
Department of Finance & Accounting
University of Nairobi
08/12/2020

iii
ACKNOWLEDGEMENTS
I appreciate my supervisors, Ms Hellen Kinyua and Dr. Angela Kithinji, for their guidance. I
appreciate my colleagues and lecturers from the University of Nairobi for their Support. I also
appreciate my classmate and friend, Evans Magoba for his assistance during my Msc. Degree
program. I also appreciate my family and friends for their moral and financial support. Last
but not least I appreciate my wife, Benedetta Mbithe, for her constant support throughout my
education.

iv
DEDICATION
I dedicate this project to my wife, Benedetta Mbithe.

v
TABLE OF CONTENTS
DECLARATION..................................................................................................................... ii
ACKNOWLEDGEMENTS .................................................................................................. iii
DEDICATION........................................................................................................................ iv
LIST OF TABLES ............................................................................................................... viii
LIST OF FIGURES ............................................................................................................... ix
ABBREVIATIONS ................................................................................................................. x
ABSTRACT ........................................................................................................................... xii
CHAPTER ONE ..................................................................................................................... 1
INTRODUCTION................................................................................................................... 1
1.1 Background of Study ...................................................................................................... 1
1.1.1 Volatility Risks ........................................................................................................ 3
1.1.2 Volume of Futures Contracts Trading ..................................................................... 4
1.1.3 Volatility Risk And Volume Of Futures Contracts Trading .................................... 5
1.1.4 Futures Contracts Listed at Nairobi Securities Exchange ........................................ 6
1.2 Research Problem ........................................................................................................... 8
1.3 Research Objective ......................................................................................................... 9
1.4 Value of Study ................................................................................................................ 9
CHAPTER TWO .................................................................................................................. 11
LITERATURE REVIEW .................................................................................................... 11
2.1 Introduction ................................................................................................................... 11
2.2 Theoretical Review ....................................................................................................... 11
2.2.1 Sequential Information Arrival Hypothesis ........................................................... 11
vi
2.2.2 Mixture of Distributions Hypothesis ..................................................................... 12
2.2.3 Asymmetric Information Theory ........................................................................... 12
2.2.4 Modern Portfolio Theory ....................................................................................... 12
2.2.5 Prospect Theory ..................................................................................................... 14
2.3 Determinants of Futures Contract trading .................................................................... 15
2.3.1 Volatility ................................................................................................................ 15
2.3.2 Time to Maturity .................................................................................................... 16
2.3.3 Open Interest .......................................................................................................... 17
2.3.4 Inflation .................................................................................................................. 17
2.3.5 Information ............................................................................................................ 17
2.4 Review of Empirical Studies ........................................................................................ 18
2.5 Conceptual Framework ................................................................................................. 20
2.6 Summary of Empirical Review ..................................................................................... 20
CHAPTER THREE: ............................................................................................................. 22
RESEARCH METHODOLOGY ........................................................................................ 22
3.1 Introduction ................................................................................................................... 22
3.2 Research Design ........................................................................................................... 22
3.3 Population ..................................................................................................................... 22
3.4 Sample .......................................................................................................................... 23
3.5 Data Collection ............................................................................................................. 23
3.6 Diagnostic Tests ............................................................................................................ 23
3.7 Data Analysis ................................................................................................................ 24
CHAPTER FOUR ................................................................................................................. 26
vii
DATA ANALYSIS AND PRESENTATION OF FINDINGS ........................................... 26
4.1 Introduction ................................................................................................................... 26
4.2 Descriptive Statistics ..................................................................................................... 26
4.3 Diagnostic Tests ............................................................................................................ 27
4.4 Empirical Model ........................................................................................................... 28
4.4.1 Stationarity Test ..................................................................................................... 28
4.4.2 Heterogeneous Autoregressive Realized Volatility Model .................................... 29
4.4.3 Heterogeneous Autoregressive Model with Volume ............................................. 30
4.5 Discussions ................................................................................................................... 32
CHAPTER FIVE .................................................................................................................. 34
SUMMARY, CONCLUSION AND RECOMMENDATIONS ........................................ 34
5.1 Introduction ................................................................................................................... 34
5.2 Summary of Findings .................................................................................................... 34
5.3 Conclusions ................................................................................................................... 35
5.4 Policy Recommendations ............................................................................................. 36
5.5 Limitations of the Study ............................................................................................... 36
5.6 Recommendations for Future Studies ........................................................................... 37
REFERENCES ...................................................................................................................... 38
viii
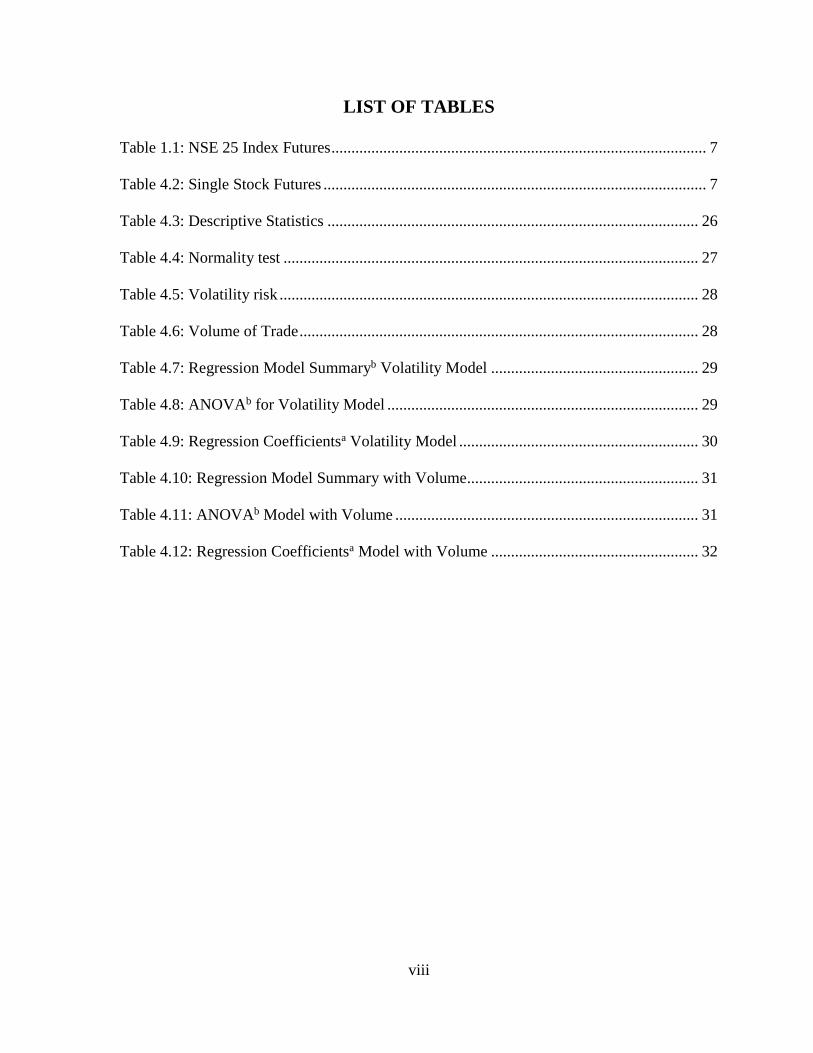
LIST OF TABLES
Table 1.1: NSE 25 Index Futures .............................................................................................. 7
Table 4.2: Single Stock Futures ................................................................................................ 7
Table 4.3: Descriptive Statistics ............................................................................................. 26
Table 4.4: Normality test ........................................................................................................ 27
Table 4.5: Volatility risk ......................................................................................................... 28
Table 4.6: Volume of Trade .................................................................................................... 28
Table 4.7: Regression Model Summaryb Volatility Model .................................................... 29
Table 4.8: ANOVAb for Volatility Model .............................................................................. 29
Table 4.9: Regression Coefficientsa Volatility Model ............................................................ 30
Table 4.10: Regression Model Summary with Volume.......................................................... 31
Table 4.11: ANOVAb Model with Volume ............................................................................ 31
Table 4.12: Regression Coefficientsa Model with Volume .................................................... 32

ix
LIST OF FIGURES
Figure 1.1: Future Contract ....................................................................................................... 6
Figure 2.2: Conceptual Framework ........................................................................................ 20
Figure 4.3: Breusch-Pagan Test of heteroskedasticity ............................................................ 27
x
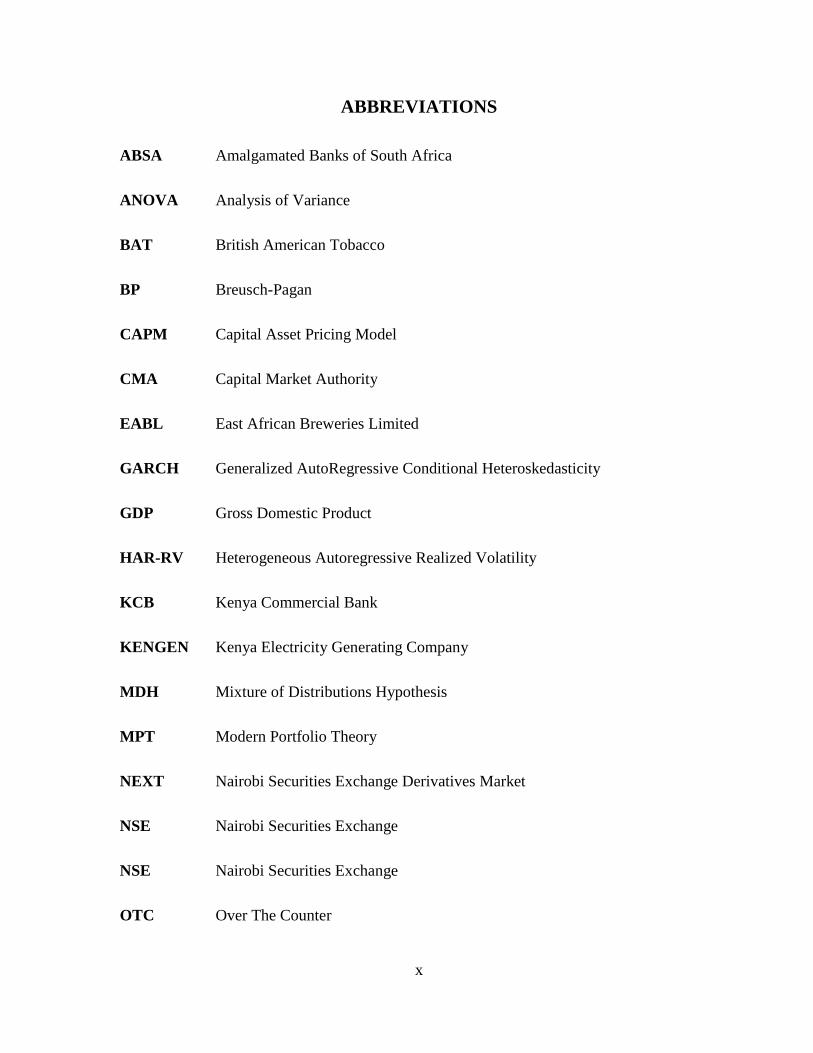
ABBREVIATIONS
ABSA Amalgamated Banks of South Africa
ANOVA Analysis of Variance
BAT British American Tobacco
BP Breusch-Pagan
CAPM Capital Asset Pricing Model
CMA Capital Market Authority
EABL East African Breweries Limited
GARCH Generalized AutoRegressive Conditional Heteroskedasticity
GDP Gross Domestic Product
HAR-RV Heterogeneous Autoregressive Realized Volatility
KCB Kenya Commercial Bank
KENGEN Kenya Electricity Generating Company
MDH Mixture of Distributions Hypothesis
MPT Modern Portfolio Theory
NEXT Nairobi Securities Exchange Derivatives Market
NSE Nairobi Securities Exchange
NSE Nairobi Securities Exchange
OTC Over The Counter
xi
SET Stock Exchange of Thailand
SIAH Sequential Information Arrival Hypothesis
TFEX Thailand Futures Exchange
TTM Time to maturity
USIU Unites States International University
xii
ABSTRACT
The study sought to determine the effects of volatility risk on the volume of futures contracts
traded at NSE. This study used a descriptive cross-sectional research design. The targeted
population was the NSE Listed firms which trades in future contracts and the NSE25 Index
Futures. The data used consisted of daily futures contract prices, the volume of daily futures
contracts traded and the NSE25 Index Futures for the period 4th July 2019 to 4th July 2020.
Secondary data obtained from NSE data-bank for the one-year period starting 4th July 2019 to
4th July 2020 was used for this study. Analysis was carried out using data for the NSE25 Index
Futures, daily futures contracts prices and trading volume data. Descriptive statistics were used
in summarizing the data. Information effects on Volatility was investigated by applying
Heterogeneous Autoregressive Realized Volatility (HAR-RV) model. The study extended this
model as HARX-RV model by adding the trade volume as a proxy for the information arrival
in the HAR-RV model. The descriptive shows high mean and standard deviation values for
volatility risk and low average figures for volume of trades. Results from HAR-RV model
show that volatility of future contracts is persistent in the futures market at the NSE and the
persistence reduces when volume is added to the model. The findings show a positive but
insignificant effect of volatility risk on volume of trade. The study concludes that the number
of future contracts traded is volatile. The researcher further concluded that changes in the
volatility of futures contracts positively but insignificantly affect the volume of future contracts
traded. The study recommends that investors understand future contract market behaviours so
as to make informed investment decisions relating to their investment. The Capital Markets
Authority, NSE and other policy makers should be conscious of the effects of other factors
other than volatility on future contracts traded. The study recommends that similar study with
a longer period and different variables.

1
CHAPTER ONE
INTRODUCTION
1.1 Background of Study
The Nairobi Securities Exchange (NSE) established Derivatives market in efforts minimize
losses arising from sudden changes in asset prices at the stock market and to diversify its
trading activities thus deepen capital markets. As a subsidiary of NSE, the derivatives market
dubbed Nairobi Securities Exchange Derivatives Market (NEXT) was officially commissioned
on 4th July 2019 and offers future contracts as a hedging tool to either gain or mitigate the risk
of loss. NEXT is governed and regulated by the Capital Market Authority (CMA) under the
Capital Market Act (Cap. 485A), the Capital Markets (Derivatives Market) regulations, 2016
and the NSE Derivatives Rules. Future contracts enables a trader to buy a certain amount of
foreign currency today in the prevailing market rate and then later on have it deposited in the
customer’s account when required. Such a move is reached after having considered the
exchange rate that will be expected at that given time. According to Geoffrey Odundo, the
Chief Executive Officer at NSE asserted that ‘derivatives trading would be of great help
towards the growth of the trading activities which had remained flat in the years before its
introduction’.
The derivative market is thought to be capable of enhancing the investors’ portfolio
performance by providing the traders with tools that are able to help manage risks associated
with the financial transactions. This has been realized in the past few years of an increase in
asset price volatility in international as well as in domestic markets.
2
The future contracts were, perhaps thought to be one of the most successful financial
innovations of the 1980’s by most the financial traders (Gorham & Singh, 2009). The first
future contract was undertaken in April 1982 by the Chicago mercantile exchange S&P 500
futures. After that there were many others traders based in Osaka Stock Exchange, Hong Kong
Index Futures, and the London International Financial Futures Exchange, just but to mention
a few who took part in trading using future contracts. There has been far-reaching changes
with the global financial markets due to the increased number of orders and consequently the
increased volume of the quantities coming from traders from all over the world. Therefore,
there has been a need to have in place adequate technology inform of high speed computers in
order to enable the traders to handle the increasing volume or orders for financial assets.
Since within the developing and emerging financial markets there are no gadgets that are able
to help in processing the increasing volume for financial assets, it has been found that such
markets are susceptible to volatility compared to the already developed nations (Gorham, et
al., 2009). Previous empirical studies which have focused on regulated derivatives trading
have not conclusively supported a stabilizing impact for instance (Koch & Koch, 1993; Darrat
& Rahman, 1995) studies did not confirm volatility impact resulting from S&P 500 futures
trading, whereas still others, (Eva & Wagner , 2012) found a stabilizing impact on futures
contracts trading on the mean level of conditional volatility of the underlying stock index, on
their research of Volatility impact on Stock Index Futures Trading using GARCH to model
stock market volatility (Olatundun, 2009) states that introduction of derivatives market in Sub-
Saharan African Countries would assist the countries in hedging their assets against capital
flow volatility thus minimizing overdependence on borrowing from credit banks and also
enhance their risk management techniques with proper guidelines and regulations.

3
1.1.1 Volatility Risks
Volatility is how rapidly the price of an asset may change, Volatility risk is the risk which
occurs as result of changes in price of an asset, thus it may be viewed as how rapidly the price
of an asset may change. Volatility within the financial market sector impacts the returns earned
by those who happen to have been involved in financial transactions such as those involving
future contracts. The decision-making process undertaken by the investors is normally
influenced by communication from NSE pertaining the volatility of the future contracts. Due
to the uncertainties that are associated with the changes that takes place within the financial
markets, the investors might not be placed in a better position to reach for informed decisions
with regard to investments.
A major point of concern within the future contract market is the opaqueness over the counter
(OTC) markets. Also, there is the concerns of the complexity of the different OTC derivatives
instruments as well as the high degree of concentration. There lacks transparency with regard
to the total risk exposures of the market participants which is as a result of underestimation of
the counterparty risk and those that come from the unregulated non-bank market entities. This
would lead to a negative impact with regard to the financial market stability. This effect would
be significantly reduced by having an exchange-based derivative trading or a centralized
counterparty as is a common for the classic kinds of derivatives such as options as well as
others within the financial markets across the world. Future contracts return volatility is a
significant concept in finance which can be used by financial analysts as well as other financial
professionals in interpreting and understanding how the market appears to be performing
during a particular time.
4
In the case that market indicates a higher volatility, such would be regarded to indicate the
likelihood that the market is declining. While, in the case that there appears to be indication of
a lower volatility, such would be taken to be indicating the possibility of a rising market. Such
information needs to be availed to the investors so that they can be in a position to reach for
sound business decisions. It assists the investors to align their investment portfolios with the
anticipated returns.
There are various methods that can be used to evaluate volatility which can be either
categorized as time variant or time invariant. However, one of the easiest methods of
measuring volatility can be asserted to be the standard deviation. Standard deviation method
is characterized as a time invariant method.
1.1.2 Volume of Futures Contracts Trading
Volume is reported for all futures contracts traded in a specified period. Volume of contracts
is calculated by summing up all number of contracts bought and sold over a given period of
time. This implies that when a future is traded either by being bought or sold, is counts towards
volume of that contract. The rise or decline of volume in futures contract can be used by
investors to make trading decisions.
Volume gives important information to traders such as identifying the times of day when a
future contract is most liquid, this is key in making trading decisions as traders would prefer
higher volumes time to trade since it means more traders are actively interested in buying and
selling.

5
Volume also indicates the price levels at which traders are more or less intereseted in trading
a future cotract, traders can use this information to decide whether to buy or sell. Moreover
volume can be important during the rollover as traders can decide when to switch to trading
the front month futures contract as volume decrease in the expiring contract.
1.1.3 Volatility Risk And Volume Of Futures Contracts Trading
Previous empirial studies have tended to find a positive relationship between volatilty and
volume of derivatives traded in stock markets. Most of the research has greatly focused on the
behaviour of volume of futures contract traded as volatility changes from one period to the
next. (Karpoff, 1987) , found that there exists a positive relatioship between volatility and
trading volumes of both equity stock and futures contracts. Empirical researches of literature
on volatility market activity, incoporates day-to-day changes in volumes of futures contracts
traded when modelling volatilty and has in most cases given a positive realationship, however
looking at volatility against monthly volume changes gives a contrary opinion. However
(Huson ,Ali & Annuar, 2005) found that there is persistence in volatility even after volume
was included in their GARCH model contrary to the major believe of earlier studies which
tend to suggest a positive correlation between volatility and volume of futures contracts.
Different markets have different dynamics and diiferent mcroeconomic factors that influence
volatilty-volume relatioships, (Bhaumik, Karanasos & Kartsaklas, 2008) noted an inverse
volatility – volume relationship in the Indian stock market. They note a decline in spot volatility
when futures trading is introduced in the market, and consequently a drop in volume on
introduction of option contracts., offering support to the view that derivatives trading
introduction on the market leads to decrease in trading volumes of futures contracts as investors
have a wide range of instruments to hedge their portfolios.

6
1.1.4 Futures Contracts Listed at Nairobi Securities Exchange
The Nairobi Securities Exchange (NSE) offers platform to investors both local and
international to trade in equity and debt security instruments. It is the leading Securities
Exchange in East Africa and has been in operations since 1954. The Nairobi Securities
Exchange launched Nairobi Securities Exchange Derivatives Market (NEXT) in July 2019 to
introduce Futures trading to the Kenyan Market. NEXT is regulated by the Capital Markets
Authority (CMA), NEXT was established to expand the country’s financial market to the
international markets and as an alternative to risk averse investors who would want to trade to
an already volatile stock market. NEXT offers the NSE 25 Index Futures and the Single Stock
Futures. The body offers future contracts which are characterized by; Standardized
Specifications, Trade on Exchange, Agreed Underlying Asset, Price and Date and Daily
Valuation and settlement.
Figure 1.1: Future Contract
Futures Contract
Standardised Specifications
Trades on Exchange
Daily Valuation
and Settlement
Agreed Underlying Asset, Price and Date
7
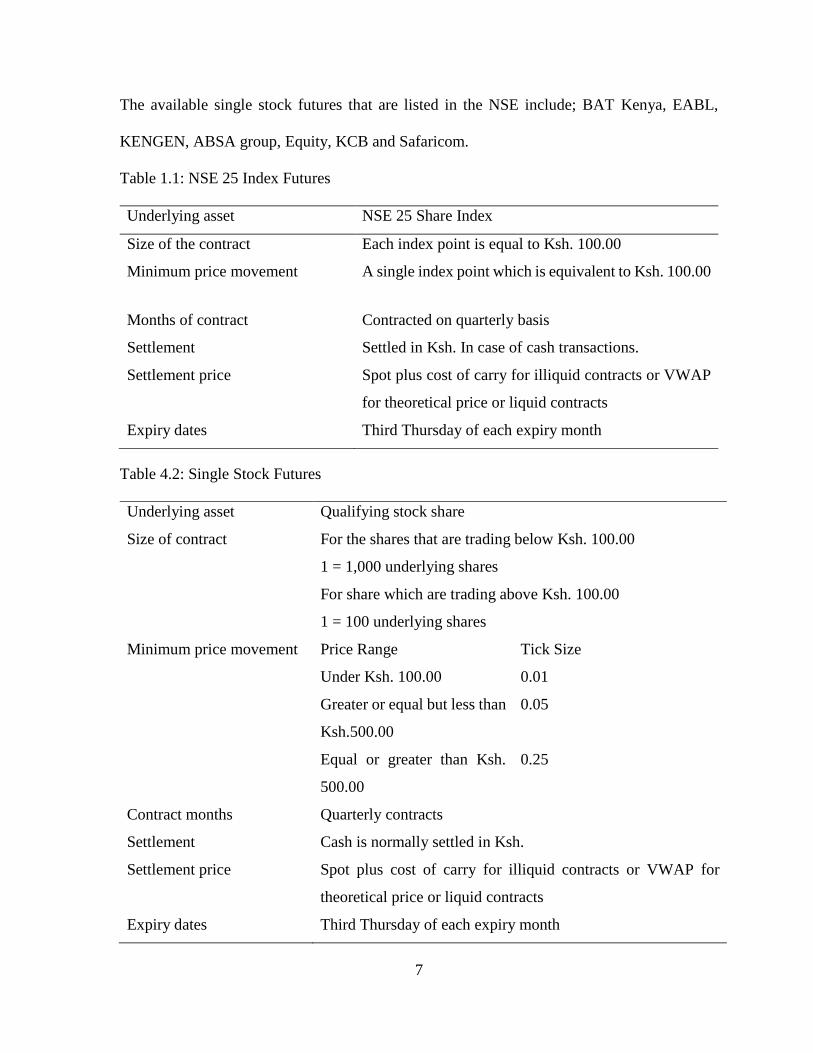
The available single stock futures that are listed in the NSE include; BAT Kenya, EABL,
KENGEN, ABSA group, Equity, KCB and Safaricom.
Table 1.1: NSE 25 Index Futures
Underlying asset NSE 25 Share Index
Size of the contract Each index point is equal to Ksh. 100.00
Minimum price movement A single index point which is equivalent to Ksh. 100.00
Months of contract Contracted on quarterly basis
Settlement Settled in Ksh. In case of cash transactions.
Settlement price Spot plus cost of carry for illiquid contracts or VWAP
for theoretical price or liquid contracts
Expiry dates Third Thursday of each expiry month
Table 4.2: Single Stock Futures
Underlying asset Qualifying stock share
Size of contract For the shares that are trading below Ksh. 100.00
1 = 1,000 underlying shares
For share which are trading above Ksh. 100.00
1 = 100 underlying shares
Minimum price movement Price Range Tick Size
Under Ksh. 100.00 0.01
Greater or equal but less than
Ksh.500.00
0.05
Equal or greater than Ksh.
500.00
0.25
Contract months Quarterly contracts
Settlement Cash is normally settled in Ksh.
Settlement price Spot plus cost of carry for illiquid contracts or VWAP for
theoretical price or liquid contracts
Expiry dates Third Thursday of each expiry month
8
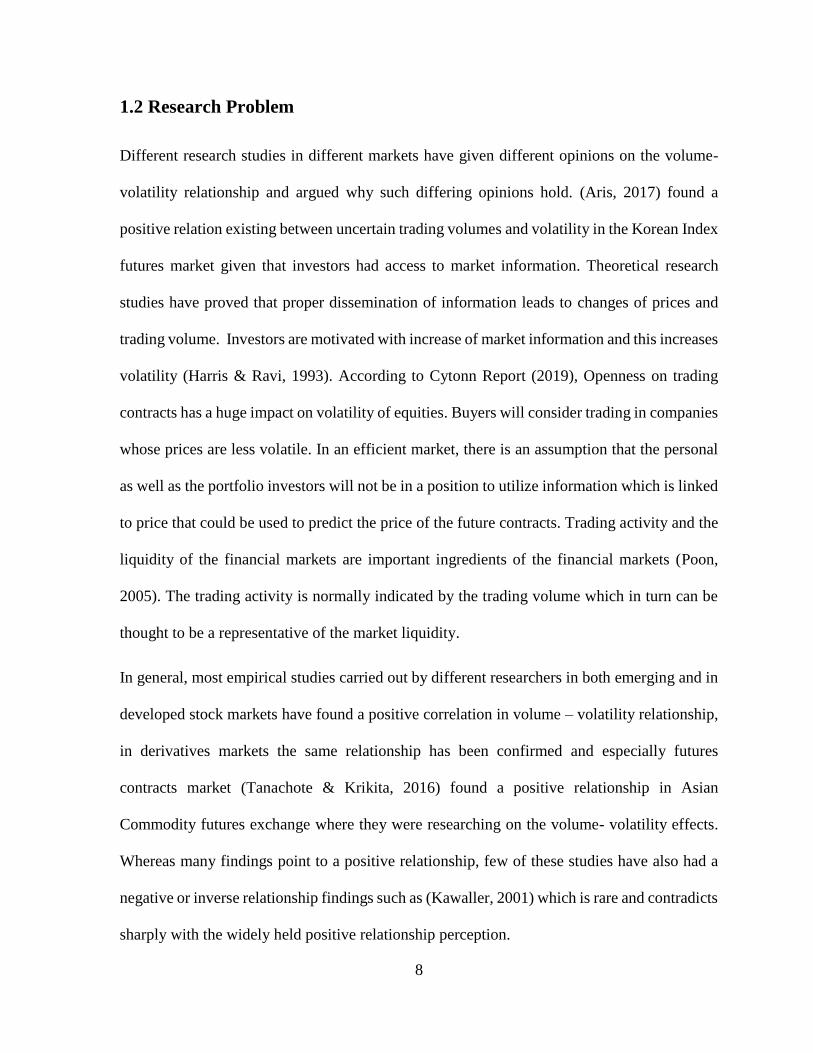
1.2 Research Problem
Different research studies in different markets have given different opinions on the volume-
volatility relationship and argued why such differing opinions hold. (Aris, 2017) found a
positive relation existing between uncertain trading volumes and volatility in the Korean Index
futures market given that investors had access to market information. Theoretical research
studies have proved that proper dissemination of information leads to changes of prices and
trading volume. Investors are motivated with increase of market information and this increases
volatility (Harris & Ravi, 1993). According to Cytonn Report (2019), Openness on trading
contracts has a huge impact on volatility of equities. Buyers will consider trading in companies
whose prices are less volatile. In an efficient market, there is an assumption that the personal
as well as the portfolio investors will not be in a position to utilize information which is linked
to price that could be used to predict the price of the future contracts. Trading activity and the
liquidity of the financial markets are important ingredients of the financial markets (Poon,
2005). The trading activity is normally indicated by the trading volume which in turn can be
thought to be a representative of the market liquidity.
In general, most empirical studies carried out by different researchers in both emerging and in
developed stock markets have found a positive correlation in volume – volatility relationship,
in derivatives markets the same relationship has been confirmed and especially futures
contracts market (Tanachote & Krikita, 2016) found a positive relationship in Asian
Commodity futures exchange where they were researching on the volume- volatility effects.
Whereas many findings point to a positive relationship, few of these studies have also had a
negative or inverse relationship findings such as (Kawaller, 2001) which is rare and contradicts
sharply with the widely held positive relationship perception.

9
(Edwards, 1988) and (brown-Hruska & kuserk, 1995) found a negative correlation on futures
trading with the spot volatility on the S&P 500. Whereas (Dennis and Sim, 1999) stated that
there existed insignificant effects on introduction of futures trading to the spot market volatility
in the Australian Stock Market.
The Nairobi Securities Exchange Derivatives Market (NEXT) will see a shift of risk averse
investors as they seek to hedge their portfolios and reduce risk of exposure. On the first trading
day after NEXT was launched, single stock futures for Safaricom and EABL were traded with
nil purchase of equity index futures contract mainly explained by the investors’ preference of
single stock futures to index futures contract. Openness on contracts traded and market
information needed to be properly availed to investors in time to enable them make informed
business decisions.
1.3 Research Objective
This study was carried to establish the effects of volatility risk on the volume of futures
contracts traded at NSE.
1.4 Value of Study
Findings of this study will impact inside knowledge to financial investors which can be used
in making wise investment decisions and protect their assets against volatile stock prices.
Insights into how volume-volatility risk affect performance of future contracts will help
investors choose onto which companies to invest in and allow them to make informed decisions
on when to anticipate price changes and hedge their investments. Investors can well use this
study to align their assets with associated expected returns.
10
The study will also help companies and financial Managers in managing of market risks
resulting due to volatility risk, this will in-turn will be beneficial as both domestic and
international investors will have confidence and invest in them and positively influence the
performance of companies. This study will also assist pension funds and insurance companies
to monitor volatility and downside risk of their equity holdings.
Government of Kenya will be in a position to understand the impact of volume-volatility
relationship to the economic performance. Economic policy makers in government may use
this study as a guide when formulating economic policies. This study may be used as a source
of reference by Researchers and Scholars as they conduct their academic research or as source
of knowledge.

11
CHAPTER TWO
LITERATURE REVIEW
2.1 Introduction
Different research studies have given different concepts that affect the derivatives markets in
Kenya. This chapter will entail theoretical review, some of the factors that are thought to
influence future contract volatility and the empirical review of the research from local as well
as international studies. In addition, the study will also present a summary of the empirical
review as well as the study’s conceptual framework.
2.2 Theoretical Review
2.2.1 Sequential Information Arrival Hypothesis
Copeland (1976), introduced the Sequential Information Arrival Hypothesis (SIAH) and
assumed that trader’s first utilized information received and then passed to each other
gradually. Copeland suggested that changes in price and trading volume are caused by the
change in demand curve of traders due to the information received and thus markets dynamics
depended on how idealists and pessimists received information.
By simulating data, Copeland indicated existence of positive relationship between trading
volume and price volatility. However, Copeland also showed existence of inverse correlation
between volume and value of price changes if the information was simultaneously received to
every trader. Thereby consecutive dissemination of information leads to positive relationship
rather than simultaneous arrival of information.
12
2.2.2 Mixture of Distributions Hypothesis
Clarks (1973) introduced the Mixture of Distributions Hypothesis (MDH) and Epps & Epps
(1976) enhanced its application further. The hypothesis stated that prices changes and trading
volume are independently distributed over a series of information arrival. According to Clarks
conditional volatility variance and volume traded are positive function of information arrival.
The MDH implies existence of strong certain contemporaneous link between price volatility
and volume. However, return levels and volume data does not show any usual patterns.
2.2.3 Asymmetric Information Theory
This theory suggests insider trading, this implies that sellers have important information of the
products in the market that buyers may not possess thus they end up setting the prices of the
goods sold in their favor. It argues that superior and inferior goods can be traded with prices at
par as long as buyers have scanty information on the goods sold.
Admati and Pfleiderer (1988), stated that volatility increased when investors trade more
because of the knowledge gap between sellers and buyers. Assuming that sellers traded based
on their private information. Arkelof (1970), affirmed this by finding that buyers of motor
vehicles were being exploited by sellers because of buyers’ lack of knowledge in motor
vehicles. Sellers private information made them sell low quality cars at the price of high-end
vehicles.
2.2.4 Modern Portfolio Theory
The modern portfolio theory (MPT) assumes that the investors are risk averse, implying that
in a case where there are two portfolios which are offering similar expected return, the investors
will go for the one that has less risks involved (Francis & Kim, 2013).
13
However, an investor is free to take on increased risks if the compensation appears to them to
be worth taking. This is to mean that, an investor might decide to indulge in a high risk
transaction given that the expected returns are high. Therefore, for the investors who might be
looking for greater anticipated returns, they must accept to take on transactions that are riskier
(Francis, et al., 2013). In addition, following this theory it appears that there will be exact trade-
off of each, consequently different investors will eventually result in evaluating the trade-off
in a different way based on his or her individual risk aversion characteristics.
According to the MPT, volatility generates risks which are associated to the degree of the
spread of returns about the average. Generally, volatility is experienced within a market
whenever the prices or the interest rates fall or rise within the stock market. In this theory, the
most commonly used measure of volatility of the securities is the standard deviation (Elton,
2009). The investors always look forward to earn a certain amount of return from the
investments that they make. However, at times there might be deviation from the amount that
the investors had anticipated to earn. Therefore, each of the securities that the investors takes
there is a possibility that they might not earn the anticipated amount of return and this is what
amounts to the risk that a certain individual investor is exposed to (Elton, 2009). The MPT
theory is relevant to this study because it is based on the assumption that the investors within
the market are risk averse and are always looking forward to optimizing their anticipated
returns from the investments that they decide to take on which are pegged on a certain market
risk level.

14
2.2.5 Prospect Theory
This is a theory that is used in decision making under conditions of risks. Decisions are
normally based on judgments that are made by the investors found within the securities market.
Judgments on the other hand refer to assessments about the external state of the market. The
external markets or world normally is full on uncertainties due to the unforeseen outcomes or
consequences that comes with certain decisions. This theory was designed to explain a certain
pattern of choice (Kahnemann & Tversky, 1979). This theory is made up of two distinct parts
of making decisions; the framing phase and the evaluation phase. The evaluation phase is the
phase that appears to be relevant in this study since it involves the decision process of choosing
from the available options. This is the same case with securities at the Nairobi Security
Exchange derivatives market, where there are normally options presented to the investors in
order to choose from. The decision made by the investors are normally influenced by two
distinct process; one which is linked to subjective value and the second one is related to the
perceptual possibility or likelihood.
According to Tversky and Kaheman (1979), framing is influenced by the manner in which the
issue has been presented, the habits as well as the decision maker’s expectancies. The reason
why people engage in framing is to simplify the evaluation of the available choices. This can
be related to what the investors at the NSE do – the investors are presented with various options
pertaining future contracts and they simplify the evaluation by relying on their habits as well
as their expectancies. The investors might, for instance, be presented with different scenarios
indicating different levels of return and it is upon them to make decisions that are based on
their habits as well as their expectancies.

15
2.3 Determinants of Futures Contract trading
This section will elaborate on the determinants which have an influence on volume of futures
contract trading. There are various factors that have been found to influence the volume of
futures contracts.
2.3.1 Volatility
Volatility is the core variable that is applied when pricing futures contracts, managing risk as
well as calculating or determining the margin amount that is anticipated by the investors. If the
investors happen to have known the correct volatility direction as maturity approaches, they
get a chance to know the correct estimate of the settlement price. Previous research view
present value dividends as key aspect of stock prices level. Nevertheless, recent research
studies have found that variability of dividends may not solely explain volatility (West, 1988
& Shiller, 1987). There has been carried out several works that were meant to check volatility
versus trading volume relationship. There has resulted considerable evidence pointing that
there exists a positive correlation between the trading volume and futures price volatility.
Wiley and Daigler (1999), there are a likelihood that volatility-volume association is relying
on the type of investor. Wiley and Daigler (1999), found out that trades carried out by clearing
members as well as the floor traders mostly indicate an inverse association between volume
and future price volatility and public drives the positive volume-volatility association. It should
also be noted that informed trades lead to decrease in volatility, whereas uninformed trades
leads to rise in volatility in futures contract prices (Fabozzi, 2008). This is important within
the NSE derivative market, since it can make the investors to reach for sound decisions
regarding the type and number of futures contracts that they can acquire and at what time.
16
2.3.2 Time to Maturity
As earlier cited, that, according to Samuelson, price changes of futures contracts prices should
be expected to rise when the contract is almost expiring, as prices changes so do the volume
of futures contracts, as the market activity become intense. It is the latter that is widely known
as the “Samuelson hypothesis”. The reasoning behind the Samuelson hypothesis is that the
sensitivity of the market towards news as the expiring date nears causes the volatility of the
future contracts in question to increase (Samuelson, 1965). This is based on the assumption
that the market becomes more sensitive to news about near-maturity compared to those whose
maturity date is far. This hypothesis has been proved to hold in the TFEX where SET50 future
contract price volatility as well as gold futures price volatility have appeared to rise once the
expiry date approaches.
On the other hand, there are some other futures contracts which have shown the inverse
maturity effect. For instance, the inverse maturity effect has been shown by crude oil futures
that were traded in the TFEX. The volatility appears to decrease as the maturity date
approaches. Therefore, it could be argued that volatility can depend on the type of future
contracts that are in question.
17
2.3.3 Open Interest
Open interest differs greatly from the volume of trade. The expected in this case is that open
interest is inversely associated with volatility since the availability of a large number of
contracts represents increased market depth, therefore meaning improved liquidity.
2.3.4 Inflation
Inflation is upward movement of prices commodities and services; inflation reduces the
purchasing power of a country’s currency making it weaker against other currencies. Previous
studies have had a mixed finding on how inflation affects stock returns volumes. Most of the
researchers found expected inflation impacts stock returns either on the upward side or
downward side depending on existing government’s monetary policy’s framework and the
ability to hedge. Studies on the unexpected inflation however found a positive correlation to
stock returns during certain economic periods such as economic contractions.
2.3.5 Information
Investors have access to unlimited market information in the recent due to advanced
technological milestones. Investors can access daily stock market information at their own
convenience. The availability of credible and ready information has enabled investors to update
their projections and make informed investment decisions as they able to anticipate future
changes in prices at the stock market.
Developing markets may have limited information on their stock market and this may give
incomplete information environment to investors. Investors with inadequate market
information may be biased in their predictions on stock performance thus increasing their risk
of loss.
18
2.4 Review of Empirical Studies
Wiley and Daigler (1999), undertook a study that was meant to investigate the causes of
volatility in futures contract prices. In their study, the two researchers found out that trades that
were been conducted by the clearing members and the traders on the floor indicated an inverse
relation on volume and future price volatility, also the same researchers stated that there was a
positive association between volume and volatility with regard to the price movement of the
future contracts was concerned. The above lead both Wiley and Daigler to reach at the
conclusion that the relation between volume and volatility of the price of the futures contracts
relied on the type of trader.
“Samuelson hypothesis”. The reasoning behind the Samuelson hypothesis is that the sensitivity
of the market towards news as the expiring date nears causes the volatility of the future
contracts in question to increase. In addition, the open interest and volume were studied by
Saunders and Grammatikos (1986) and found existence of positive association of volatility -
volume of futures contracts. However, there were others that were carried and indicated inverse
relationship such as those carried out by Pati and Kumar (2007). On the other hand, there are
some other futures contracts which have shown the inverse maturity effect. For instance, the
inverse maturity effect has been shown by crude oil futures that were traded in the TFEX.
Following the findings by Samuelson, it can be asserted that volatility of futures contracts
prices should be rises contract as futures contract is almost expiring. It is the latter that is widely
known as the Time to maturity (TTM) and affects volatility of future contract prices across
different derivative market such as the NSE. The association between time to maturity and
volume has been carried out in various countries across the world using different underlying
assets.

19
According to (Rutledge, 1976; Beaulieu, 1998 and Walls, 1999) there are some studies that
have found an inverse association between volume-volatility while others have found out a
positive relationship between volatility-volume with regard to future contract prices are
considered. Wang et al. (2012) investigated the volatility –volume association at the Chinese
Stock Market, the study’s findings were a positive correlation of daily volatility with trading
volume, explaining the aspect of private information in skewing the prices changes of stocks.
Matheka (2011), from the University of Nairobi in his research on the Impact of derivatives in
the Nairobi Securities Exchange. The study stated that futures trading in general will
significantly decrease the spot price volatility. Applying the GARCH Model, the study
indicates a decrease in spot price volatility if derivatives were introduced into Kenyan Market,
“Futures trading in general does not destabilize (unpredictable volatility and share price
movements) the underlying security”. Matheka (2011)
Kinyua (2014), from the Unites States International University (USIU), in his research of
Adopting Derivatives Market in Kenya found a decreasing Market volatility In the NSE on the
introduction of Equity Derivatives. This was due to lack of investor information and existence
of weak regulation framework on the rules governing derivatives markets in Kenya.
20
2.5 Conceptual Framework
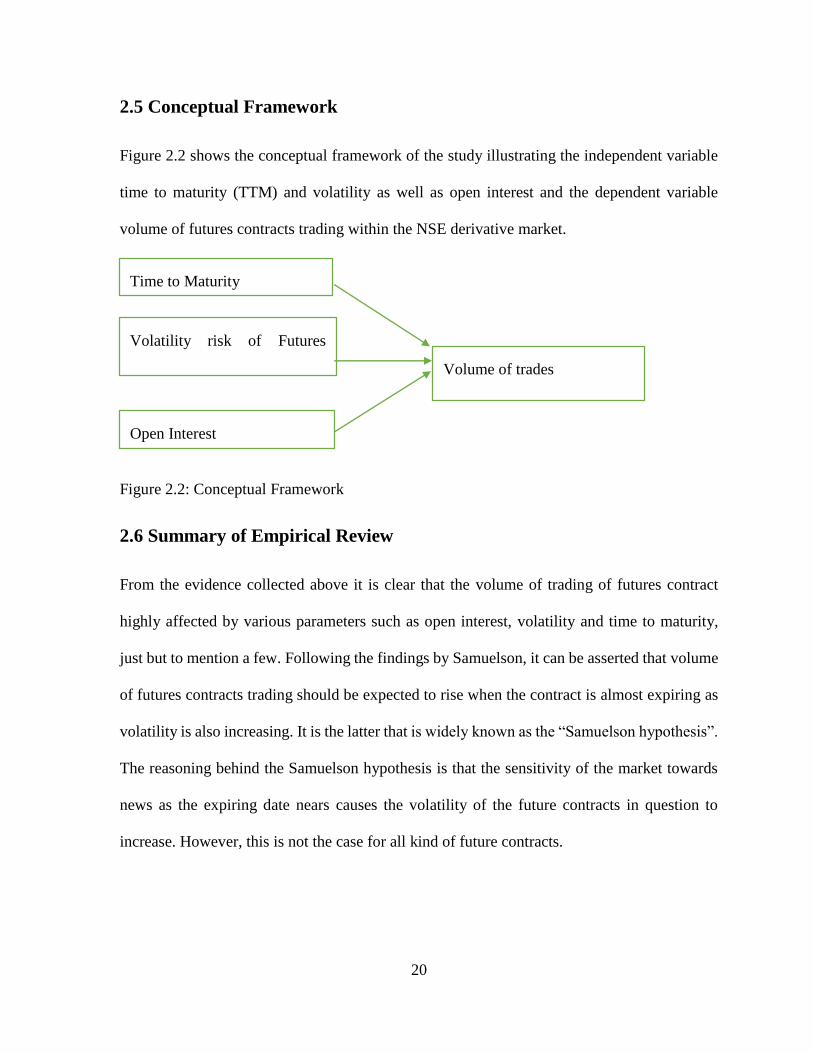
Figure 2.2 shows the conceptual framework of the study illustrating the independent variable
time to maturity (TTM) and volatility as well as open interest and the dependent variable
volume of futures contracts trading within the NSE derivative market.
Figure 2.2: Conceptual Framework
2.6 Summary of Empirical Review
From the evidence collected above it is clear that the volume of trading of futures contract
highly affected by various parameters such as open interest, volatility and time to maturity,
just but to mention a few. Following the findings by Samuelson, it can be asserted that volume
of futures contracts trading should be expected to rise when the contract is almost expiring as
volatility is also increasing. It is the latter that is widely known as the “Samuelson hypothesis”.
The reasoning behind the Samuelson hypothesis is that the sensitivity of the market towards
news as the expiring date nears causes the volatility of the future contracts in question to
increase. However, this is not the case for all kind of future contracts.
Time to Maturity
Volatility risk of Futures
Contracts
Open Interest
Volume of trades
21
This hypothesis has been proved to hold in the TFEX where SET50 future contract price
volatility as well as gold futures price volatility have appeared to rise once the expiry date
approaches. On the other hand, there are some other futures contracts which have shown the
inverse maturity effect. For instance, the inverse maturity effect has been shown by crude oil
futures that were traded in the TFEX.
22
CHAPTER THREE:
RESEARCH METHODOLOGY
3.1 Introduction
The chapter looked at the selection, justification and presentation methods as well as the
techniques which were employed in order to realize the objectives of the research study. This
chapter takes care of the research methodology process right from the research design to
methods used to analyze our data
3.2 Research Design
This refers to the various research methods and techniques that are researcher chooses in order
to conceptualize a research topic to the relevant empirical research. This simply means that a
research design takes into consideration the information which is required as well as the
techniques which were employed by the researcher in order to collect and analyze the data that
is linked to the research question. There are various kinds within which research design can be
classified; descriptive and explanatory research. In this study, the researcher employed the use
of descriptive cross-sectional research. Cross-sectional research entails collection of data or
information pertaining a certain thing at a given point in time.
3.3 Population
The targeted population in this research study was the NSE Listed firms which traded in future
contracts and the NSE25 Index Futures between 4th July 2019 and 4th July 2020.

23
3.4 Sample
The data used consisted of daily futures contract prices, the volume of daily futures contracts
traded and the NSE25 Index Futures for the period 4th July 2019 to 4th July 2020.
3.5 Data Collection
Secondary data obtained from NSE data-bank for the one-year period starting 4th July 2019 to
4th July 2020 was used for this study. Analysis was carried out using data for the NSE25 Index
Futures, daily futures contracts prices and trading volume data.
3.6 Diagnostic Tests
Application of T-test and F-test to check any significant difference on descriptive statistics
measures and hypothesis testing. We calculated 95% confidence interval to confirm the
findings. ANOVA as well as linear regression statistics employed in the research study as they
assume that the errors of the models that are employed to carry out the analysis are independent
of one another and that there is no autocorrelation.
The study involved carrying out of the Breusch-Pagan (BP) in order to check for
heteroscedasticity. According to the heteroscedasticity test considers a significance level of
over 0.05 as an indicator that there is no heteroscedasticity issue has been found in the data
that is obtained from the results of the ANOVA. The rule that is employed in interpreting
heteroscedasticity is that if a clear pattern is shown, then there is a heteroscedasticity issue,
whereas, if there is no a clear pattern then there is no heteroscedasticity issue in the data. The
research study also employed graphical tests using the scatterplot in order to determine if
heteroscedasticity was in the data or not.
24
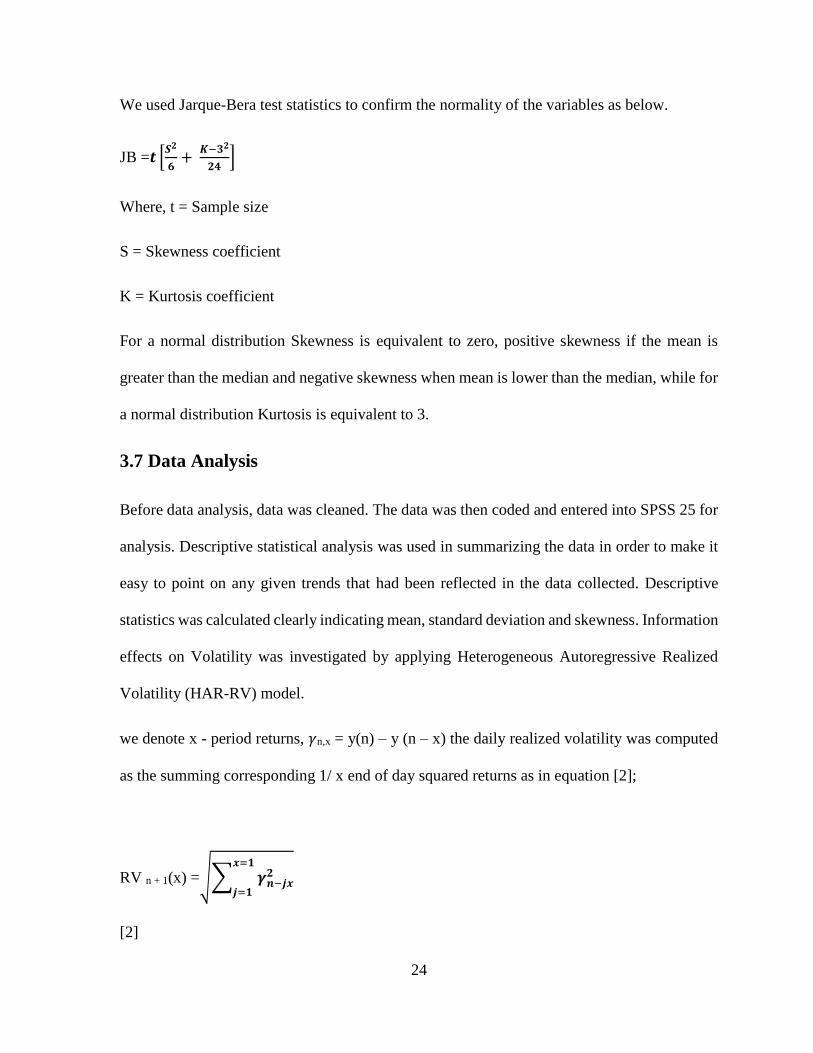
We used Jarque-Bera test statistics to confirm the normality of the variables as below.
JB =𝒕 [𝑺𝟐
𝟔+
𝑲−𝟑𝟐
𝟐𝟒]
Where, t = Sample size
S = Skewness coefficient
K = Kurtosis coefficient
For a normal distribution Skewness is equivalent to zero, positive skewness if the mean is
greater than the median and negative skewness when mean is lower than the median, while for
a normal distribution Kurtosis is equivalent to 3.
3.7 Data Analysis
Before data analysis, data was cleaned. The data was then coded and entered into SPSS 25 for
analysis. Descriptive statistical analysis was used in summarizing the data in order to make it
easy to point on any given trends that had been reflected in the data collected. Descriptive
statistics was calculated clearly indicating mean, standard deviation and skewness. Information
effects on Volatility was investigated by applying Heterogeneous Autoregressive Realized
Volatility (HAR-RV) model.
we denote x - period returns, 𝛾n,x = y(n) – y (n – x) the daily realized volatility was computed
as the summing corresponding 1/ x end of day squared returns as in equation [2];
RV n + 1(x) =√∑ 𝜸𝒏−𝒋𝒙𝟐
𝒙=𝟏
𝒋=𝟏
[2]
25
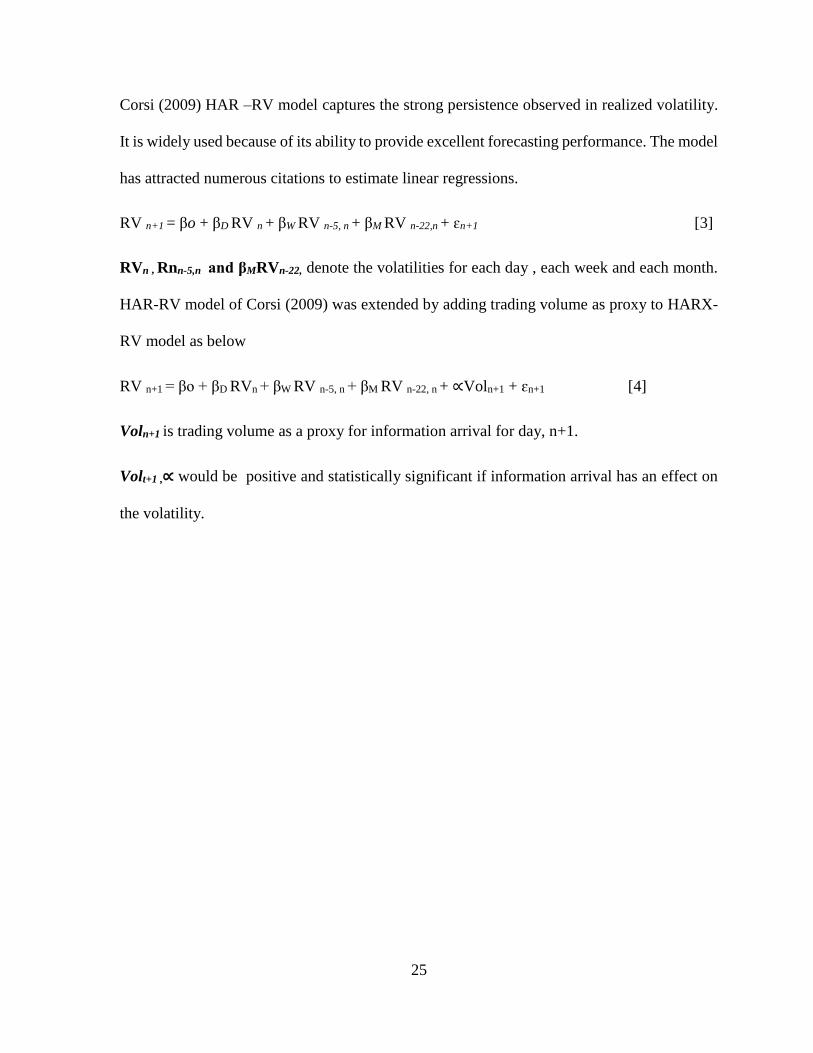
Corsi (2009) HAR –RV model captures the strong persistence observed in realized volatility.
It is widely used because of its ability to provide excellent forecasting performance. The model
has attracted numerous citations to estimate linear regressions.
RV n+1 = βo + βD RV n + βW RV n-5, n + βM RV n-22,n + ɛn+1 [3]
RVn , Rnn-5,n and βMRVn-22, denote the volatilities for each day , each week and each month.
HAR-RV model of Corsi (2009) was extended by adding trading volume as proxy to HARX-
RV model as below
RV n+1 = βo + βD RVn + βW RV n-5, n + βM RV n-22, n + ∝Voln+1 + ɛn+1 [4]
Voln+1 is trading volume as a proxy for information arrival for day, n+1.
Volt+1 ,∝ would be positive and statistically significant if information arrival has an effect on
the volatility.
26
CHAPTER FOUR
DATA ANALYSIS AND PRESENTATION OF FINDINGS
4.1 Introduction
This chapter presents findings from data analysis, which was guided by research objectives
and the results presented in the tables below. Data analysis was done in the chapter. Tabular
presentation was used in this study.
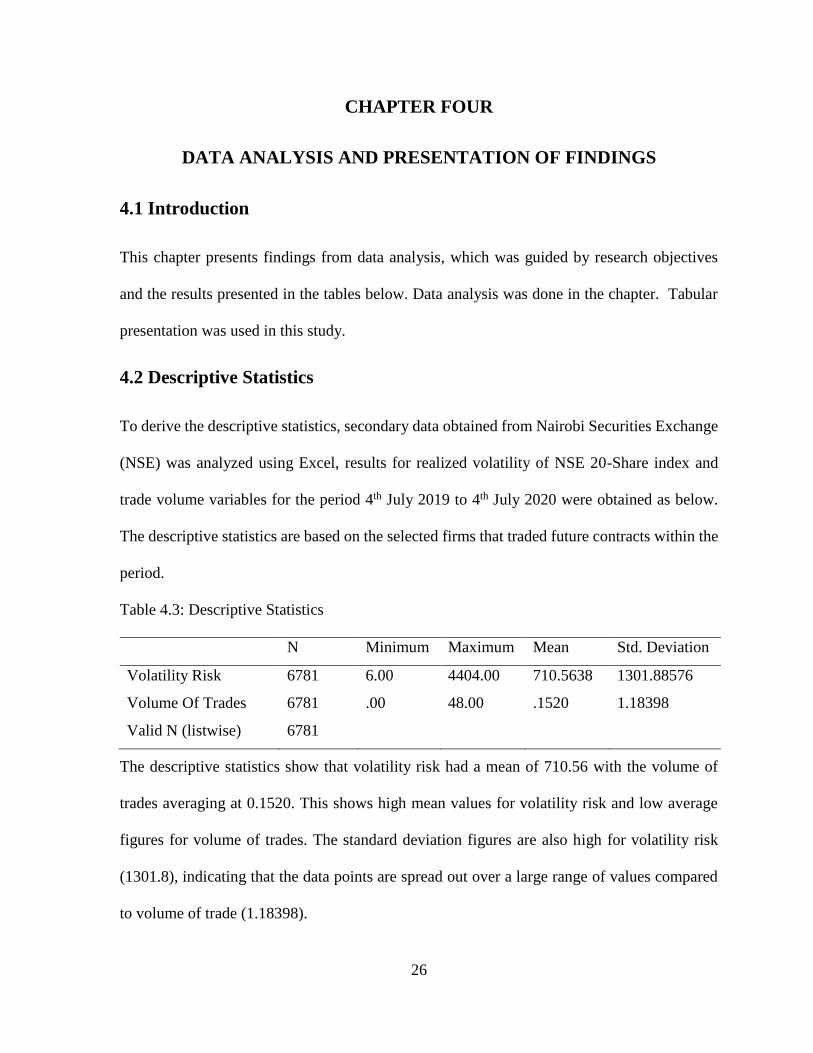
4.2 Descriptive Statistics
To derive the descriptive statistics, secondary data obtained from Nairobi Securities Exchange
(NSE) was analyzed using Excel, results for realized volatility of NSE 20-Share index and
trade volume variables for the period 4th July 2019 to 4th July 2020 were obtained as below.
The descriptive statistics are based on the selected firms that traded future contracts within the
period.
Table 4.3: Descriptive Statistics
N Minimum Maximum Mean Std. Deviation
Volatility Risk 6781 6.00 4404.00 710.5638 1301.88576
Volume Of Trades 6781 .00 48.00 .1520 1.18398
Valid N (listwise) 6781
The descriptive statistics show that volatility risk had a mean of 710.56 with the volume of
trades averaging at 0.1520. This shows high mean values for volatility risk and low average
figures for volume of trades. The standard deviation figures are also high for volatility risk
(1301.8), indicating that the data points are spread out over a large range of values compared
to volume of trade (1.18398).

27
The variation between the maximum and minimum volatility risk and volume indicates
existence of high variability of both volatility risk and volume trade in future contracts.
4.3 Diagnostic Tests
Table 4.4: Normality test
Volatility Risk Volume of Trades
Kurtosis 1.405370821 516.5312
Skewness 1.796220329 18.16525
JB-Stat 4204.4169** 75756299.0204**
Positive skewness for volatility indicates that the right tail is longer and most of the data is at
the left. The normality test also shows Kurtosis for volatility less than 3 indicating a platykurtic
distribution, meaning that there is fewer and less extreme outliers as compared to normal
distribution. Whereas kurtosis for realized volume of trades is more than 3 and values
concentrated around the mean, it clearly indicates existence of high probability for extreme
volumes since the kurtosis of realized volume of trades is precise than the normal distribution.
The study used Jarque-Bera test statistics to confirm the normality of the data for the study
variables where J-B is equal to 0 under the null hypothesis of normal distribution. Since the
Kurtosis and skewness are both greater than zero it shows the data is not normally distributed.
Figure 4.3: Breusch-Pagan Test of heteroskedasticity
From the findings shown by figure 4.2, the p-value is more than 0.05. Hence, we cannot reject
the null hypothesis that there is constant variance in our data. Hence the data used in analysis
has low levels of heteroscedasticity which is not a problem.

28
4.4 Empirical Model
4.4.1 Stationarity Test
To find out whether the data is stationary, Augmented Dickey Fuller (ADF) Unit Root test has
been used. The ADF test includes testing with presence of intercept for this study.
Table 4.5: Volatility risk
Intercept
ADF Test Statistic -1.4072
1% critical value* -2.567
5% critical value* -1.941
10% critical value* -1.616
When stationarity was tested for volatility risk, the t-statistics value of 1.4072 was below the
critical value of 1.941 at 5%, this indicates Stationarity of the data series. At significance level
of 5%, the time series of the variables were stationary, indicating that volatility risk would be
temporary and its effects on the volume of trade would cease to exist over time.
Table 4.6: Volume of Trade
Intercept
ADF Test Statistic -1.4619
1% critical value* -2.567
5% critical value* -1.941
10% critical value* -1.616
When stationarity was tested for volume of trade, the t-statistics value of 1.4619 was below
the critical value of 1.941 at 5%, this indicates Stationarity of the data series. At significance
level of 5%, the time series of the variables were stationary, indicating that shocks on futures
traded would be temporary and its effects on the volume of trade would cease to exist over
time.
29
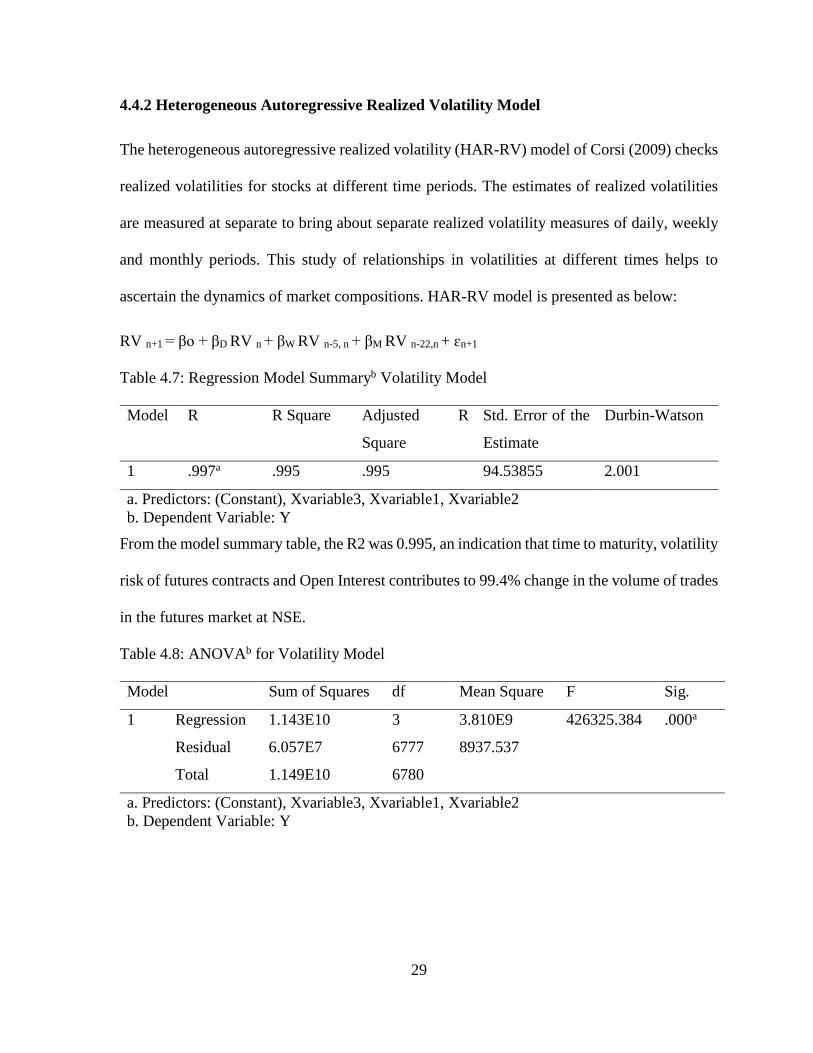
4.4.2 Heterogeneous Autoregressive Realized Volatility Model
The heterogeneous autoregressive realized volatility (HAR-RV) model of Corsi (2009) checks
realized volatilities for stocks at different time periods. The estimates of realized volatilities
are measured at separate to bring about separate realized volatility measures of daily, weekly
and monthly periods. This study of relationships in volatilities at different times helps to
ascertain the dynamics of market compositions. HAR-RV model is presented as below:
RV n+1 = βo + βD RV n + βW RV n-5, n + βM RV n-22,n + ɛn+1
Table 4.7: Regression Model Summaryb Volatility Model
Model R R Square Adjusted R
Square
Std. Error of the
Estimate
Durbin-Watson
1 .997a .995 .995 94.53855 2.001
a. Predictors: (Constant), Xvariable3, Xvariable1, Xvariable2
b. Dependent Variable: Y
From the model summary table, the R2 was 0.995, an indication that time to maturity, volatility
risk of futures contracts and Open Interest contributes to 99.4% change in the volume of trades
in the futures market at NSE.
Table 4.8: ANOVAb for Volatility Model
Model Sum of Squares df Mean Square F Sig.
1 Regression 1.143E10 3 3.810E9 426325.384 .000a
Residual 6.057E7 6777 8937.537
Total 1.149E10 6780
a. Predictors: (Constant), Xvariable3, Xvariable1, Xvariable2
b. Dependent Variable: Y
30
The calculated F-statistic (426325.384) was greater than the F-critical (2.606) indicating that
the model fitted the data. The Anova tables shows a p-value of 0.000 indicating a statistically
significant model with a statistically significant relationship between volatility risk and volume
of trade variables.
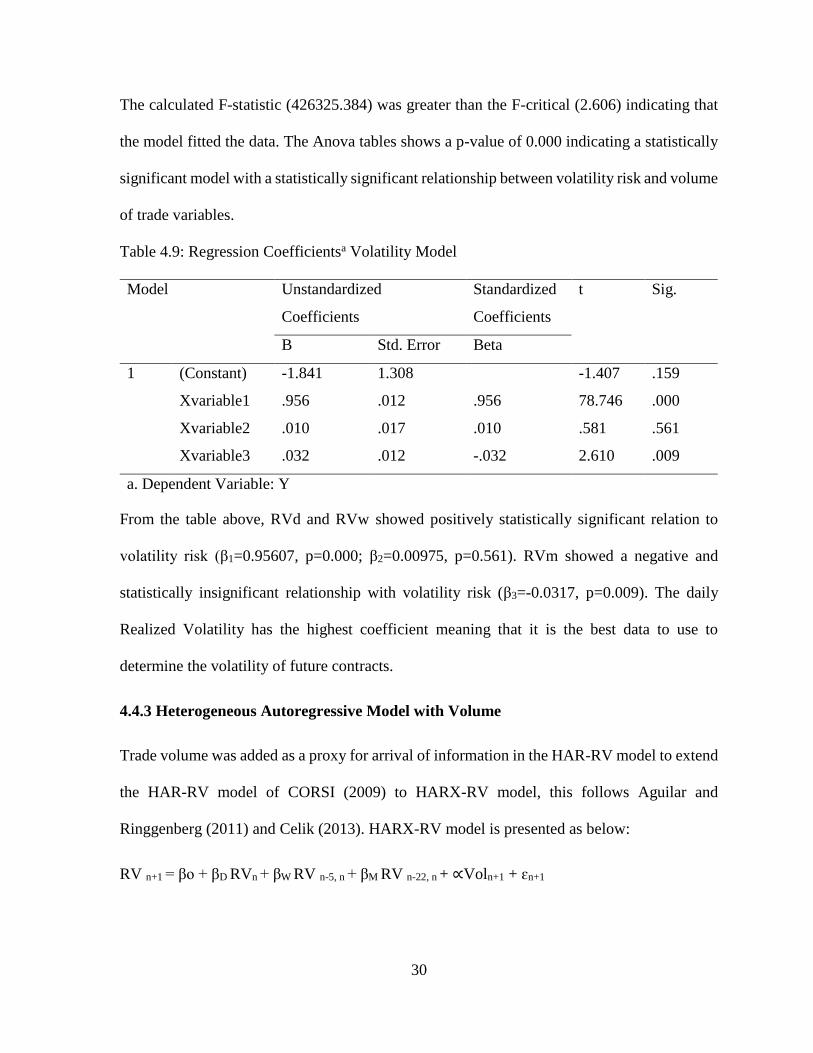
Table 4.9: Regression Coefficientsa Volatility Model
Model Unstandardized
Coefficients
Standardized
Coefficients
t Sig.
B Std. Error Beta
1 (Constant) -1.841 1.308 -1.407 .159
Xvariable1 .956 .012 .956 78.746 .000
Xvariable2 .010 .017 .010 .581 .561
Xvariable3 .032 .012 -.032 2.610 .009
a. Dependent Variable: Y
From the table above, RVd and RVw showed positively statistically significant relation to
volatility risk (β1=0.95607, p=0.000; β2=0.00975, p=0.561). RVm showed a negative and
statistically insignificant relationship with volatility risk (β3=-0.0317, p=0.009). The daily
Realized Volatility has the highest coefficient meaning that it is the best data to use to
determine the volatility of future contracts.
4.4.3 Heterogeneous Autoregressive Model with Volume
Trade volume was added as a proxy for arrival of information in the HAR-RV model to extend
the HAR-RV model of CORSI (2009) to HARX-RV model, this follows Aguilar and
Ringgenberg (2011) and Celik (2013). HARX-RV model is presented as below:
RV n+1 = βo + βD RVn + βW RV n-5, n + βM RV n-22, n + ∝Voln+1 + ɛn+1
31
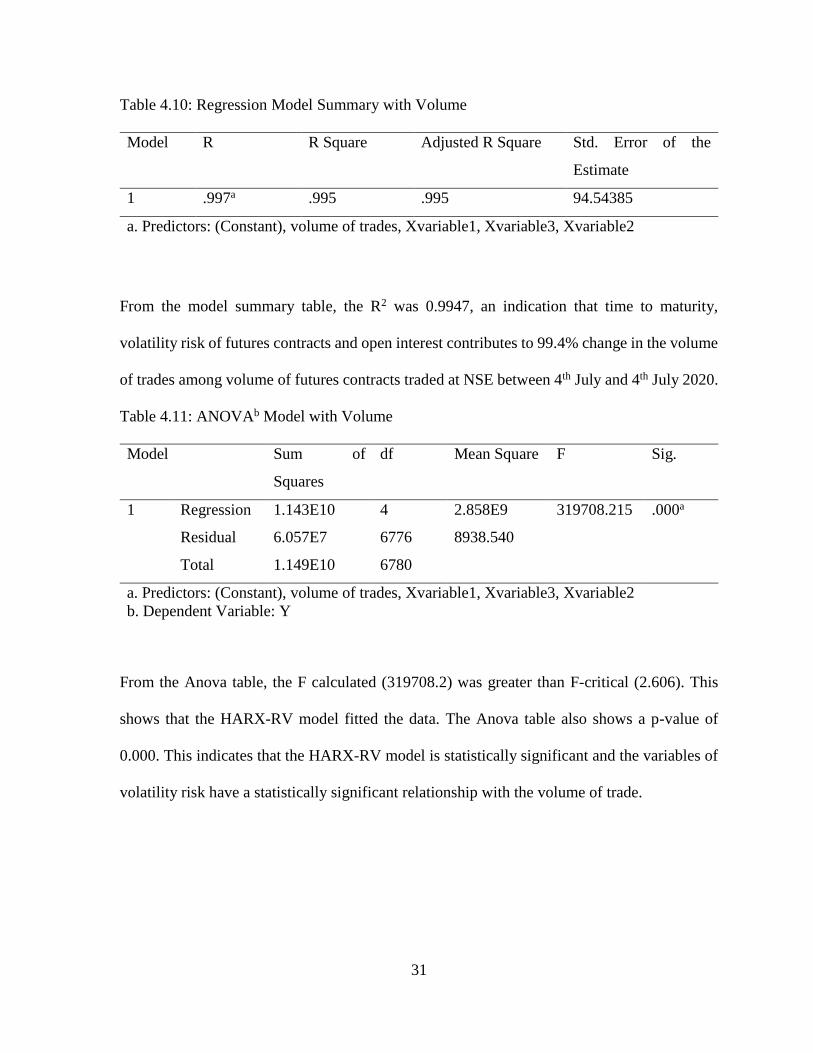
Table 4.10: Regression Model Summary with Volume
Model R R Square Adjusted R Square Std. Error of the
Estimate
1 .997a .995 .995 94.54385
a. Predictors: (Constant), volume of trades, Xvariable1, Xvariable3, Xvariable2
From the model summary table, the R2 was 0.9947, an indication that time to maturity,
volatility risk of futures contracts and open interest contributes to 99.4% change in the volume
of trades among volume of futures contracts traded at NSE between 4th July and 4th July 2020.
Table 4.11: ANOVAb Model with Volume
Model Sum of
Squares
df Mean Square F Sig.
1 Regression 1.143E10 4 2.858E9 319708.215 .000a
Residual 6.057E7 6776 8938.540
Total 1.149E10 6780
a. Predictors: (Constant), volume of trades, Xvariable1, Xvariable3, Xvariable2
b. Dependent Variable: Y
From the Anova table, the F calculated (319708.2) was greater than F-critical (2.606). This
shows that the HARX-RV model fitted the data. The Anova table also shows a p-value of
0.000. This indicates that the HARX-RV model is statistically significant and the variables of
volatility risk have a statistically significant relationship with the volume of trade.
32
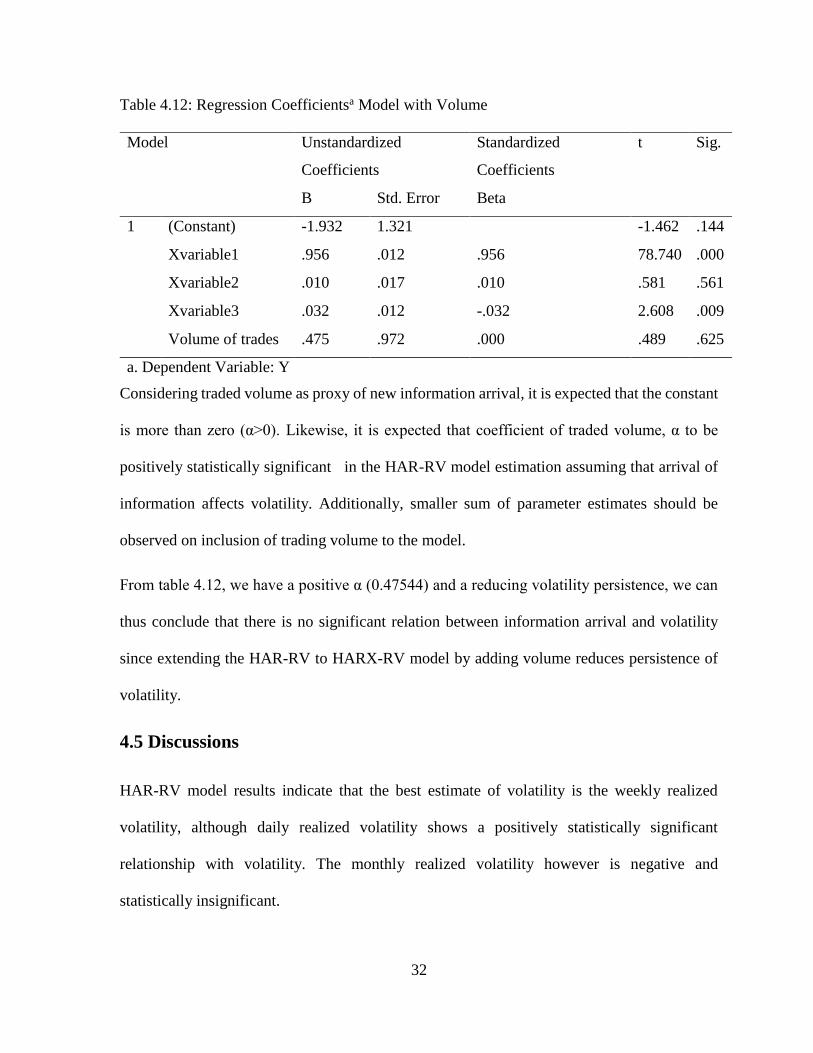
Table 4.12: Regression Coefficientsa Model with Volume
Model Unstandardized
Coefficients
Standardized
Coefficients
t Sig.
B Std. Error Beta
1 (Constant) -1.932 1.321 -1.462 .144
Xvariable1 .956 .012 .956 78.740 .000
Xvariable2 .010 .017 .010 .581 .561
Xvariable3 .032 .012 -.032 2.608 .009
Volume of trades .475 .972 .000 .489 .625
a. Dependent Variable: Y
Considering traded volume as proxy of new information arrival, it is expected that the constant
is more than zero (α>0). Likewise, it is expected that coefficient of traded volume, α to be
positively statistically significant in the HAR-RV model estimation assuming that arrival of
information affects volatility. Additionally, smaller sum of parameter estimates should be
observed on inclusion of trading volume to the model.
From table 4.12, we have a positive α (0.47544) and a reducing volatility persistence, we can
thus conclude that there is no significant relation between information arrival and volatility
since extending the HAR-RV to HARX-RV model by adding volume reduces persistence of
volatility.
4.5 Discussions
HAR-RV model results indicate that the best estimate of volatility is the weekly realized
volatility, although daily realized volatility shows a positively statistically significant
relationship with volatility. The monthly realized volatility however is negative and
statistically insignificant.
33
Overall the model was significant, showing a statistically significant relationship between
volatility and all identified variables. Likewise, for the HARX-RV model, the daily and weekly
volatility had significant positive coefficients, in conjunction the monthly volatility was
negative and insignificant. The overall model including volume is statistically significant. We
can conclude that daily volatility is the best estimate for volatility forecast for volume trading
in future contracts from the both models.
The regression modelling findings indicate trading volume can be considered as a proxy of
new information arrival, however this does not mean it relates significantly to volatility risk.
This indicates that changes in volume of future contracts trading in the NSE are driven about
by factors other than volatility, such factors may include future expectations of markets by
investors and political environment. If the investors expect future better performance of
volume of trading in future contracts, they can increase their current demand for futures
contracts stimulating a rise in trading volume. The result of insignificant volume volatility
relationship at NSE indicates that volatility of futures contracts may have low impact on the
influence to investors’ decision making to purchase more securities in the stock market. Other
factors such as available capital to invest are likely to have influence to investors. Thus,
volatility risk in the market do not impact on the volume of future contracts traded at the NSE.
Either changes in future contract volatility or changes in volumes traded influence changes in
future contract volumes traded and changes in volatility risk in the market. Tanachote and
Krikita (2016) found that a significant relationship existed between volatility and trade
volumes in the futures market. This shows that this study finding differed with those of
Tanachote and Krikita.

34
CHAPTER FIVE
SUMMARY, CONCLUSION AND RECOMMENDATIONS
5.1 Introduction
This chapter gives a summarization of findings and conclusions, any limitations in this study
and further areas of research are also discussed in this chapter.
5.2 Summary of Findings
Volatility measures the extend of price movement in futures contracts thus it is measure
variability, or dispersion about a central tendency. Standard deviation calculation was done for
NSE 20-Share index over the period of study (4th July 2019-4th July 2020). Large values of
standard deviation and mean for volatility risk fluctuate in a wide range from the mean.
Volatility of futures contracts show high values of standard deviation and mean implying that
there is high futures volatility during the period of study. The volume of futures contracts
shows low values of standard deviation and mean implying that there is low variation in the
volume of future contracts traded during the period of study.
This research aimed to determine and explain the effects of volatility risk on the volume of
futures contracts traded at NSE. For this purpose, daily NSE-20 Share index data and daily
trade volume data as a proxy for information arrival as at 4th July 2019 to 4th July 2020 was
used for the study. The application of HARX-RV model to test whether there is a
contemporaneous relation between volatility risk and volume of trading in future contracts.
To add trade volume as proxy of new information arrival in HAR-RV model the HARX-RV
model extended the HAR-RV model of Corsi (2009).
35
HARX-RV model application on this study assist find that trading volume can be considered
as a proxy for arrival of new information. Although the relationship between volatility and
information arrival is not statistically significant. On inclusion of trading volume, there is a
decrease in volatility persistence, indicating a weak effect of volatility risk on volume of future
contract trades.
5.3 Conclusions
The research culminates that the number of future contracts traded is volatile, indicating that
trading volume varies over time as shown by the high standard deviation of volatility risk. The
researcher further concluded that changes in the volatility of futures contracts positively but
insignificantly affect the volume of future contracts traded. This shows that major changes in
future contract prices are affected by other variables except traded volumes.
The reason for the insignificant effect of volatility and volume of future contracts at the NSE
can be accredited to the fact that Kenya is a developing country and in such the NSE market
in not fully developed but rather an emerging market, wherein limited investor knowledge on
the derivatives market might be reason, this result raises a number of issues that could be
addressed in future research regarding the specific variables that affect volume of trading of in
the futures market.
36
5.4 Policy Recommendations
Availability of market information is fundamental as investors are able to understand market
dynamics especially factors affecting market prices movements and volume traded, investors
with market knowledge are able to make informed investment decisions. The study
recommends that Nairobi Securities Exchange to arrange public workshops and educate
investors on stock investments and also provide periodical briefs and journals to Investors.
The Capital Markets Authority, Nairobi Securities Exchange and all other policy makers
including government treasury should be conscious of the effects of other factors other than
volatility on future contracts traded. This should be aimed at stimulating development of
financial markets in Kenya and to enable mobilization of adequate capital both long term and
short term for economic growth and development. In introduction and assimilation of relevant
strategies, policy makers must study and look deeply to all effects of other factors other than
trading volume.
The study recommends that there should be policy framework which is agreeable to market
participants aimed at fostering a conducive market environment to assist stabilize the market
when the factors are not able to majorly impact. This would increase investors’ confidence on
the stock market and also encourage and attract foreign investors to invest into the equity
market enhancing market liquidity
5.5 Limitations of the Study
The study was based on a one-year period from 4th July 2019 to 4th July 2020. This means that
the findings may differ where the analysis is done based on a different period like 10 years.
Hence the analysis was limited to the period of study.
37
The study was also limited by the authenticity of the data. Despite the data having been
collected from NSE, it was difficult for the researcher to ascertain the authenticity of the data
provided. The study was also limited to the variables of study. The study was based on
volatility risk and volume of trades in futures contracts.
First, only the NSE25 Index is studied in this research. Although the index represents different
sectors, a clearer picture would still be established if all listed firms are studied. This study
generalized the findings from all the sectors and this raises the question of whether the findings
could hold for each sector.
5.6 Recommendations for Future Studies
The study was based on a one-year period (4th July 2019 to 4th July 2020). The study
recommends a similar research based on a longer period of time like 5 years. This would enable
reader to compare and validate the findings on the effect of volatility risk on future contracts.
The study was based on the variables of volatility risk and volume of future contracts. Based
on the findings, the study recommends that other factors that affect the volume of trading at
the futures market. The study recommends a study based on all listed firms other than the firms
under NSE25 Index. This would enhance the generalizability of the findings.
The study was conducted on Nairobi Securities Exchange in Kenya, the study recommends a
similar research done on sub-Saharan Africa markets since most of those markets are emerging
markets. This would enable the reader to compare different markets based on the countries
market composition.

38
REFERENCES
Beaulieu, M. C. (1998). Time to maturity in the basis of stock market indices: Evidence from
the S&P 500 and the MMI. Journal of Empirical Finance, 5(3), 177-195.
Boonvorachote, T., & Lakmas, K. (2016). Price Volatility, Trading Volume, and Market depth
in Asian Commodity Futures exchanges. Kasetsart Journal of Social Sciences, 37(1),
53-58
Elton, E. J. (2009). Modern portfolio theory and investment analysis. New Delhi: Wiley India.
Fabozzi, F. J. (2008). Handbook of finance. Hoboken, N.J: John Wiley & Sons.
Francis, J. C., & Kim, D. (2013). Modern portfolio theory: Foundations, analysis, and new
developments + website. Hoboken, N.J: Wiley.
Galai, D., & Masulis, R. W. (1976). The Option Pricing Model and the Risk Factor of Stock.
Journal of Financial Economics, 3(5), 53-81.
Gorham, M., & Singh, N. (2009). Electronic exchanges: The global transformation from pits
to bits. Burlington, MA: Elsevier.
Grammatikos, T., & Saunders, A. (1986). Futures price variability: A test of maturity and
volume effects. Journal of Business, 59(4),319–330.
Kahnemann, D. & Tversky, A. (1979). Prospect theory: AN analysis of decisions under risk.
Econometrica, 47(3), 262-91.
Matanovic, E. & Wagner, H. (2012). Derivatives Trading and Financial Market Stability –
Analysing the Volatility Impact of DAX Stock Index Futures Trading Using GARCH
(Masters in Economics). University of Hagen.
39
Pati, P. & Kumar, K. (2007). Maturity and Volume Effects on the Volatility: Evidences from
NSE Nifty Futures. ICFAI Journal of Derivatives Markets, 4(4), 44-63.
Poon, S. H. (2005). A practical guide to forecasting financial market volatility. Hoboken, New
Jersey: John Wiley & Sons.
Rhoads, R. (2011). Trading VIX Derivatives: Trading and Hedging Strategies Using VIX
Futures, Options, and Exchange-traded Notes. Hoboken, New Jersey: John Wiley &
Sons.
Rutledge, D. J. S. (1976). A note on the variability of futures prices. Review of Economics and
Statistics, 58(4), 118-20.
Samuelson, P. A. (1965). Proof that properly anticipated prices fluctuate randomly. Industrial
Management Review, 6(5), 41-49.
Walls, W. (1999). Volatility, volume and maturity in electricity futures. Applied Financial
Economics, 9(3), 283-287.