Embed Size (px)
Citation preview

1
The Effects of Weather on Freeway Traffic Flow
The Effects of Weather on Freeway Traffic Flow
Meead Saberi K.Priya Chavan
Robert L. BertiniKristin Tufte
Alex Bigazzi2009 ITE Quad Conference , Vancouver, B.C.
2
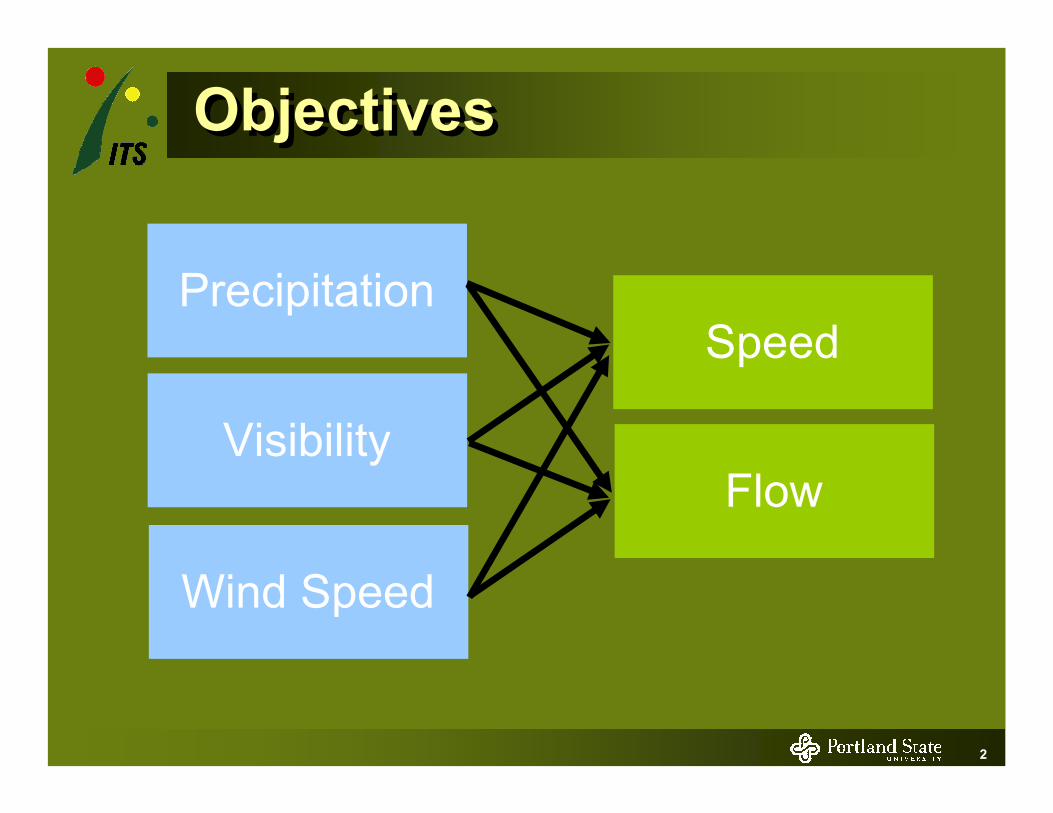
ObjectivesObjectives
Precipitation
Visibility
Wind Speed
Speed
Flow
3
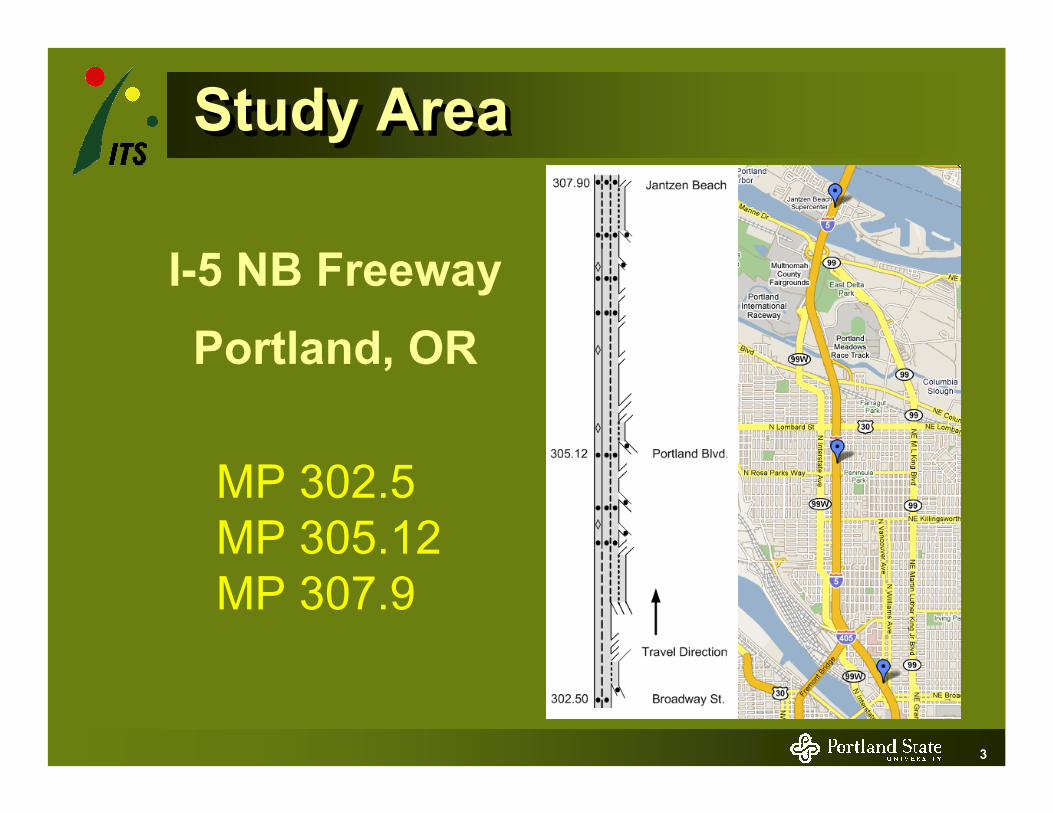
Study AreaStudy Area
I-5 NB FreewayPortland, OR
MP 302.5MP 305.12MP 307.9
4
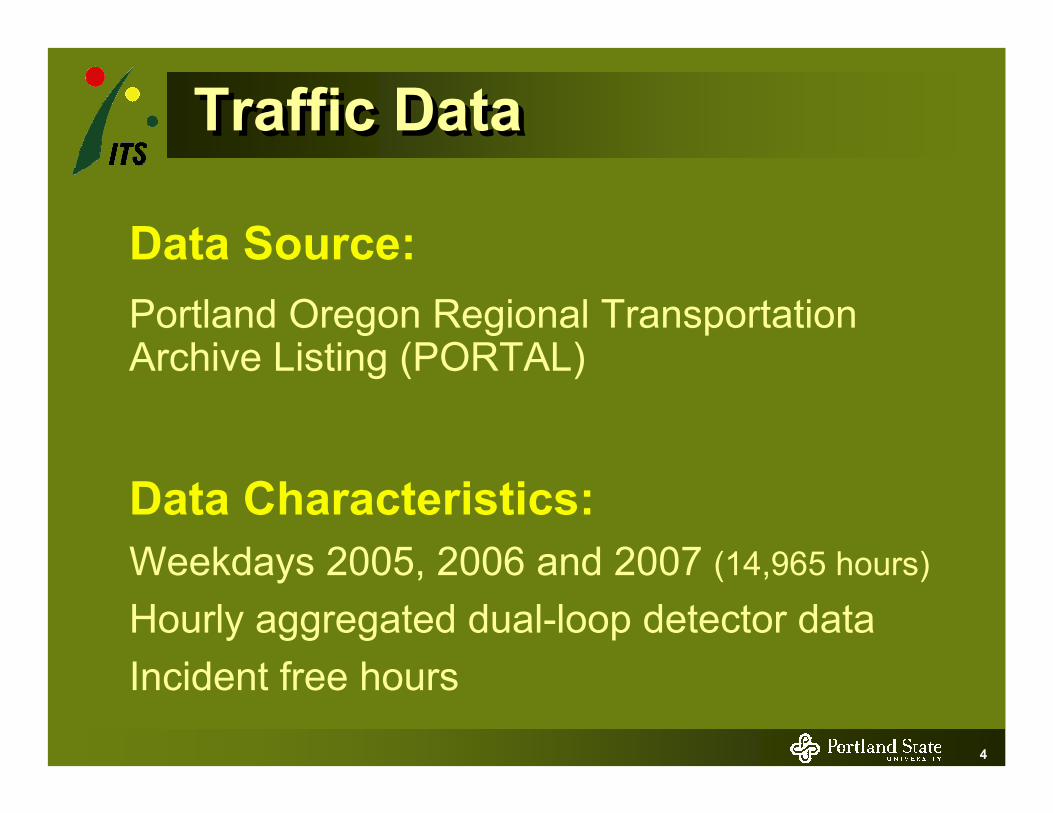
Traffic DataTraffic Data
Data Source:Portland Oregon Regional Transportation Archive Listing (PORTAL)
Data Characteristics:Weekdays 2005, 2006 and 2007 (14,965 hours)
Hourly aggregated dual-loop detector dataIncident free hours
5
Weather DataWeather Data
Data Source:National Oceanic and Atmospheric Administration (NOAA)
Weather Station:Portland International Airport (PDX)Hourly rainfall, visibility and wind speed
6
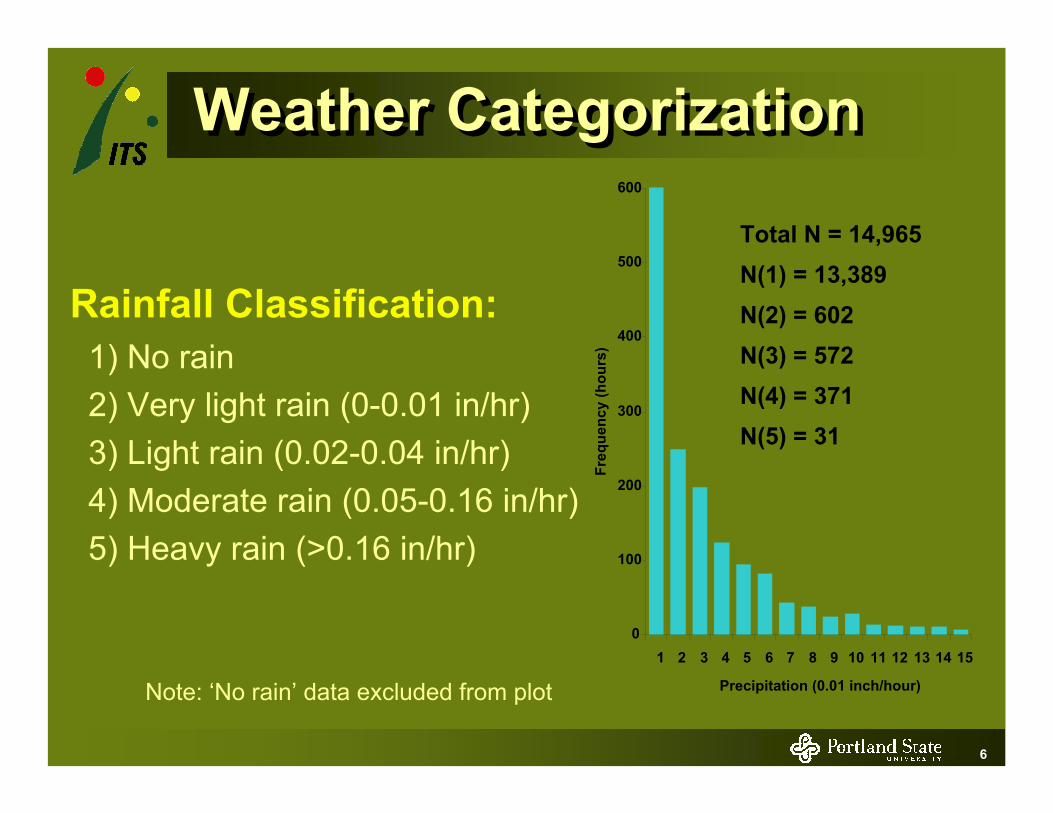
Weather CategorizationWeather Categorization
Rainfall Classification:1) No rain2) Very light rain (0-0.01 in/hr)3) Light rain (0.02-0.04 in/hr)4) Moderate rain (0.05-0.16 in/hr)5) Heavy rain (>0.16 in/hr)
Total N = 14,965N(1) = 13,389N(2) = 602N(3) = 572N(4) = 371N(5) = 31
Note: ‘No rain’ data excluded from plot
0
100
200
300
400
500
600
1 2 3 4 5 6 7 8 9 10 11 12 13 14 15
Precipitation (0.01 inch/hour)
Freq
uenc
y (h
ours
)
7
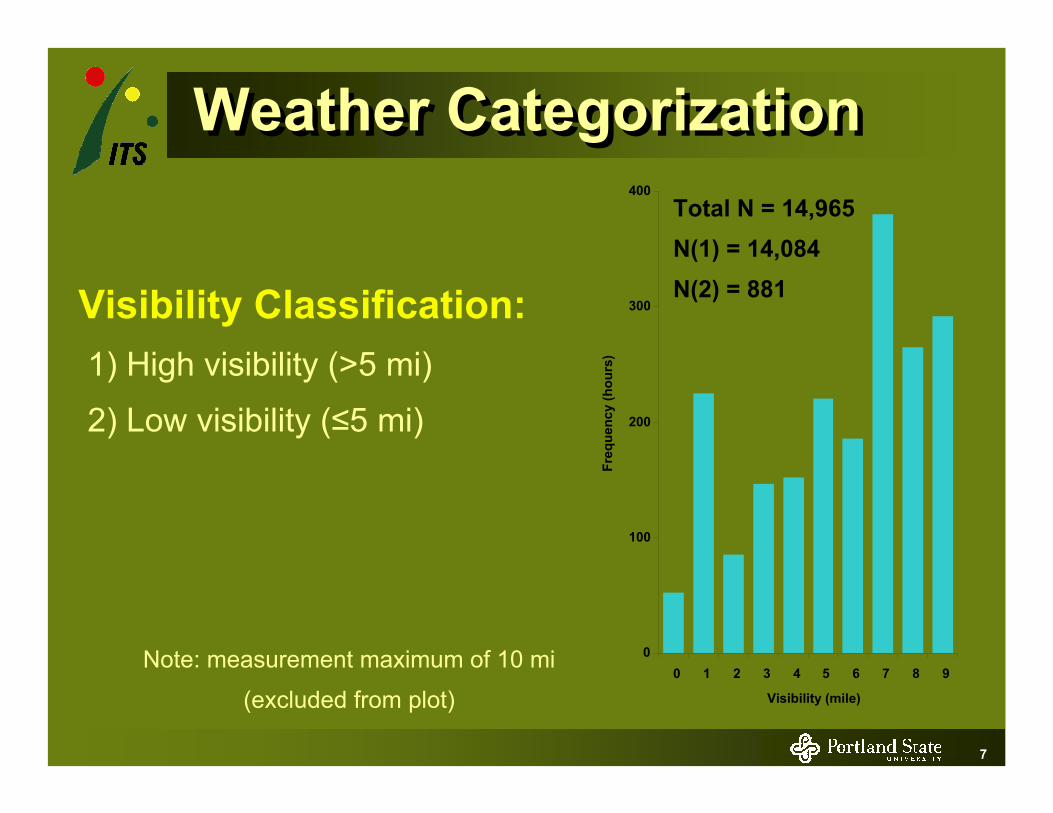
Weather CategorizationWeather Categorization
Visibility Classification:1) High visibility (>5 mi)
2) Low visibility (≤5 mi)
Total N = 14,965N(1) = 14,084N(2) = 881
Note: measurement maximum of 10 mi
(excluded from plot)
0
100
200
300
400
0 1 2 3 4 5 6 7 8 9
Visibility (mile)
Freq
uenc
y (h
ours
)
8
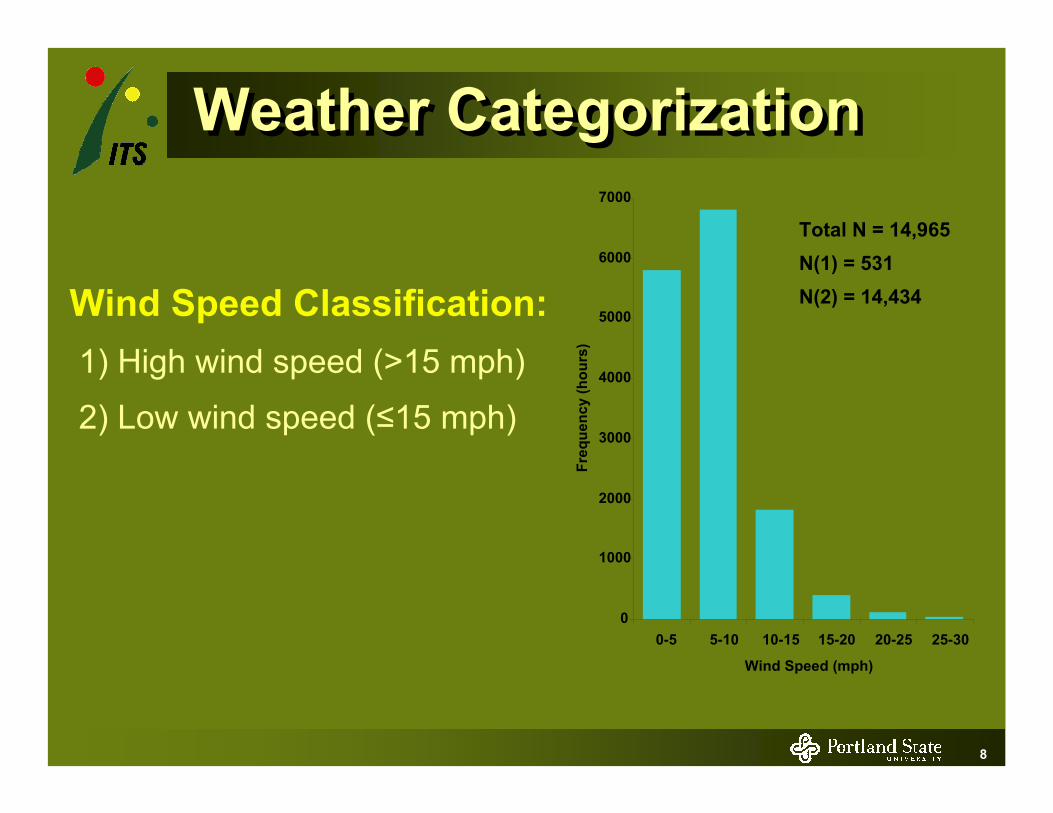
Weather CategorizationWeather Categorization
Wind Speed Classification:1) High wind speed (>15 mph)
2) Low wind speed (≤15 mph)
Total N = 14,965N(1) = 531N(2) = 14,434
0
1000
2000
3000
4000
5000
6000
7000
0-5 5-10 10-15 15-20 20-25 25-30
Wind Speed (mph)
Freq
uenc
y (h
ours
)
9
25
35
45
55
65
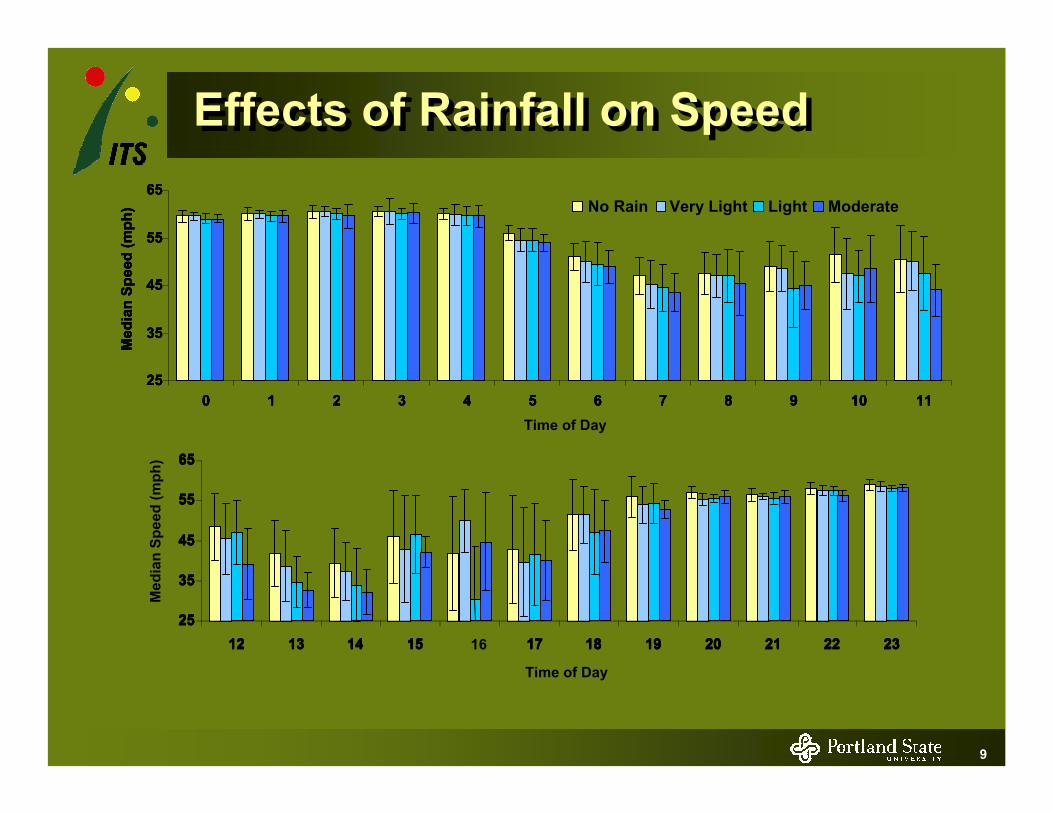
0 1 2 3 4 5 6 7 8 9 10 11Time of Day
Med
ian
Spee
d (m
ph) No Rain Very Light Light Moderate
25
35
45
55
65
0 1 2 3 4 5 6 7 8 9 10 11
Med
ian
Spee
d (m
ph)
25
35
45
55
65
0 1 2 3 4 5 6 7 8 9 10 11
Med
ian
Spee
d (m
ph)
25
35
45
55
65
0 1 2 3 4 5 6 7 8 9 10 11
Med
ian
Spee
d (m
ph)
25
35
45
55
65
12 13 14 15 16 17 18 19 20 21 22 23
Time of Day
Med
ian
Spee
d (m
ph)
25
35
45
55
65
12 13 14 15 17 18 19 20 21 22 23
Effects of Rainfall on SpeedEffects of Rainfall on Speed
25
35
45
55
65
12 13 14 15 17 18 19 20 21 22 2325
35
45
55
65
12 13 14 15 17 18 19 20 21 22 23
10
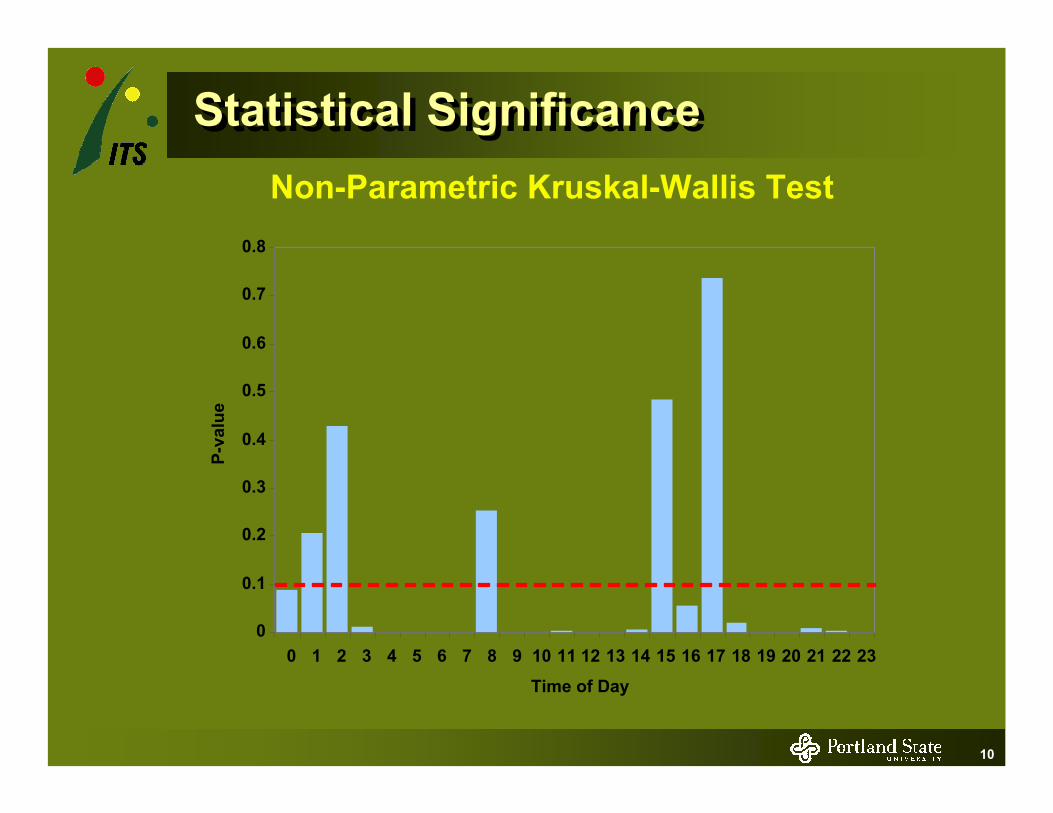
Statistical SignificanceStatistical SignificanceNon-Parametric Kruskal-Wallis Test
0
0.1
0.2
0.3
0.4
0.5
0.6
0.7
0.8
0 1 2 3 4 5 6 7 8 9 10 11 12 13 14 15 16 17 18 19 20 21 22 23
Time of Day
P-va
lue
11
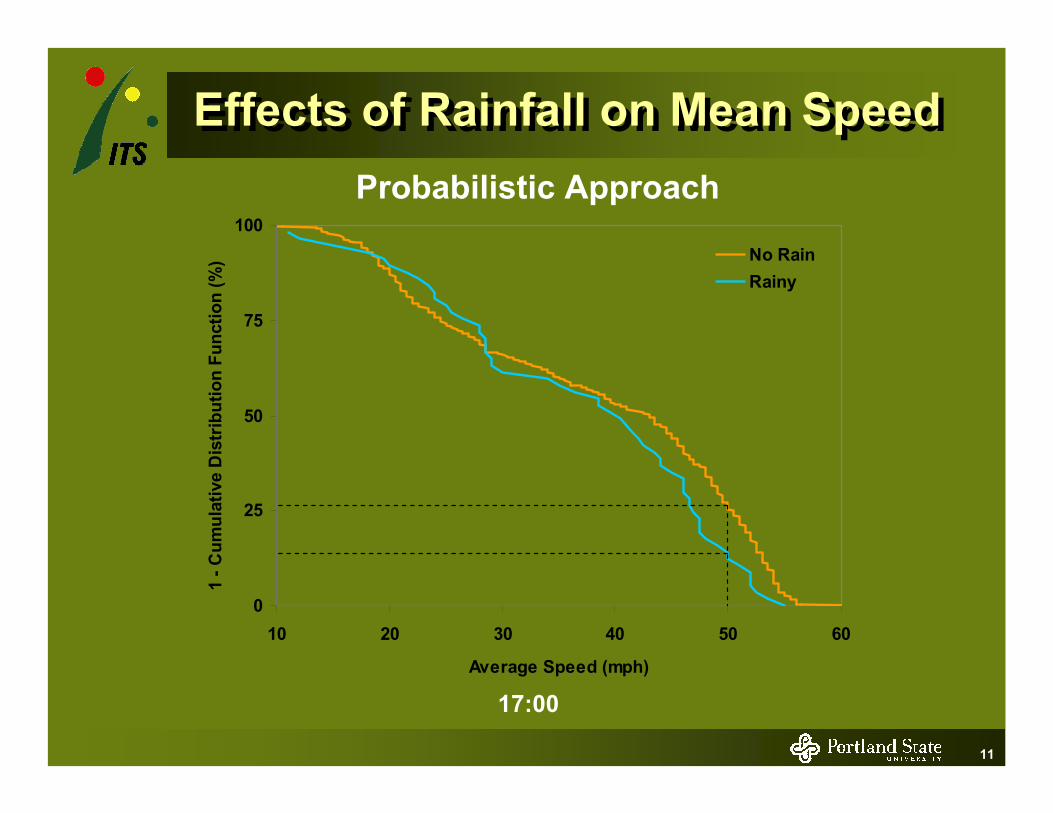
Effects of Rainfall on Mean SpeedEffects of Rainfall on Mean Speed
17:00
Probabilistic Approach
0
25
50
75
100
10 20 30 40 50 60
Average Speed (mph)
1 - C
umul
ativ
e D
istr
ibut
ion
Func
tion
(%) No Rain
Rainy
12
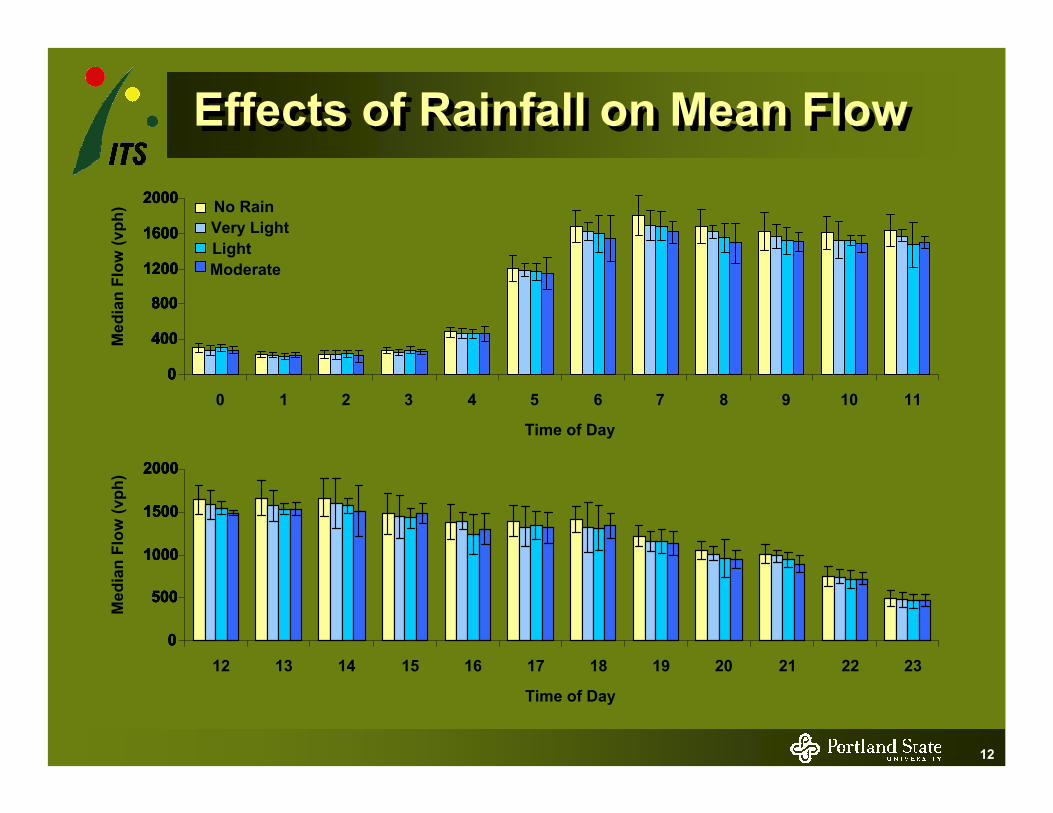
Effects of Rainfall on Mean FlowEffects of Rainfall on Mean Flow
0
400
800
1200
1600
2000
0 1 2 3 4 5 6 7 8 9 10 11
Time of Day
Med
ian
Flow
(vph
) No RainVery LightLightModerate
0
400
800
1200
1600
2000
0
400
800
1200
1600
2000
0
400
800
1200
1600
2000
0
500
1000
1500
2000
12 13 14 15 16 17 18 19 20 21 22 23
Time of Day
Med
ian
Flow
(vph
)
0
500
1000
1500
2000
0
500
1000
1500
2000
0
500
1000
1500
2000
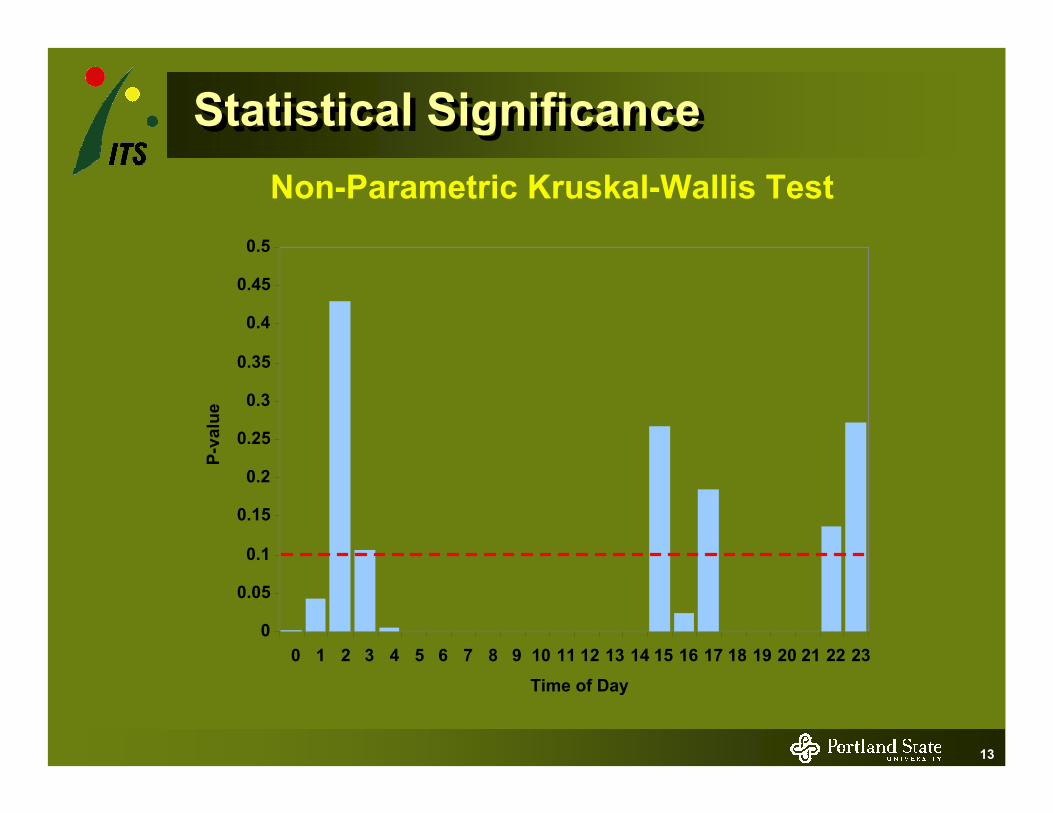
13
Statistical SignificanceStatistical SignificanceNon-Parametric Kruskal-Wallis Test
0
0.05
0.1
0.15
0.2
0.25
0.3
0.35
0.4
0.45
0.5
0 1 2 3 4 5 6 7 8 9 10 11 12 13 14 15 16 17 18 19 20 21 22 23
Time of Day
P-va
lue
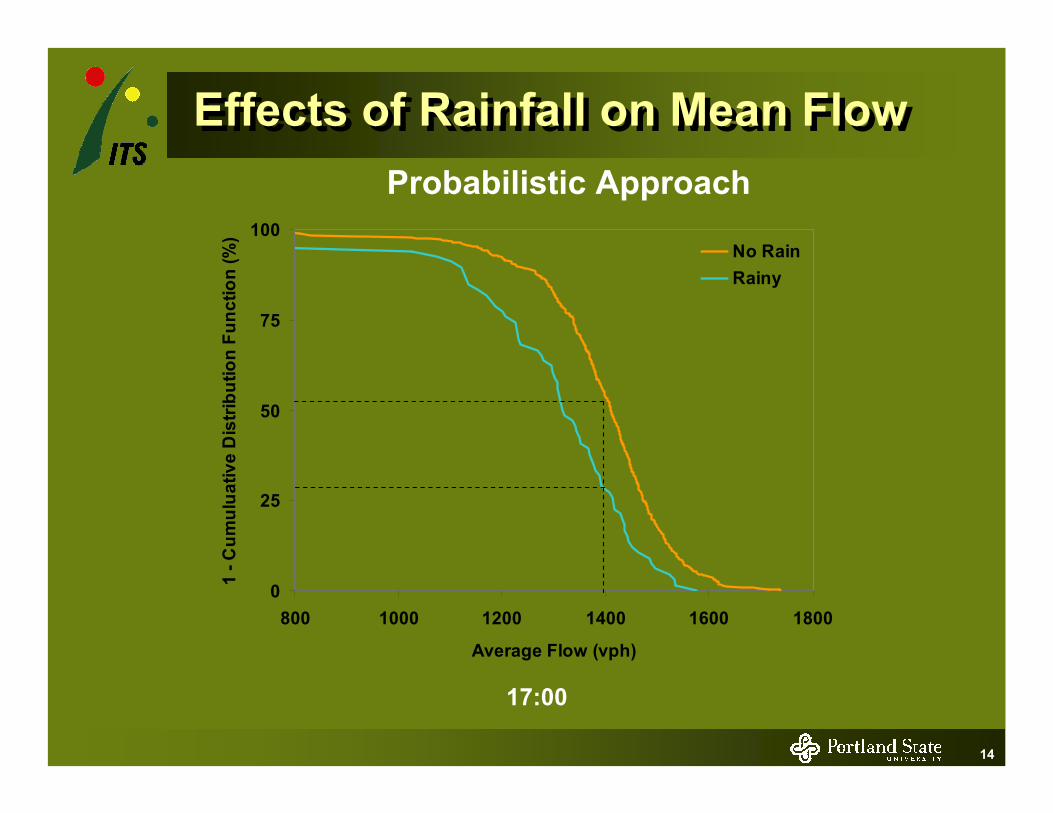
14
Effects of Rainfall on Mean FlowEffects of Rainfall on Mean Flow
17:00
Probabilistic Approach
0
25
50
75
100
800 1000 1200 1400 1600 1800
Average Flow (vph)
1 - C
umul
uativ
e D
istri
butio
n Fu
nctio
n (%
)No RainRainy
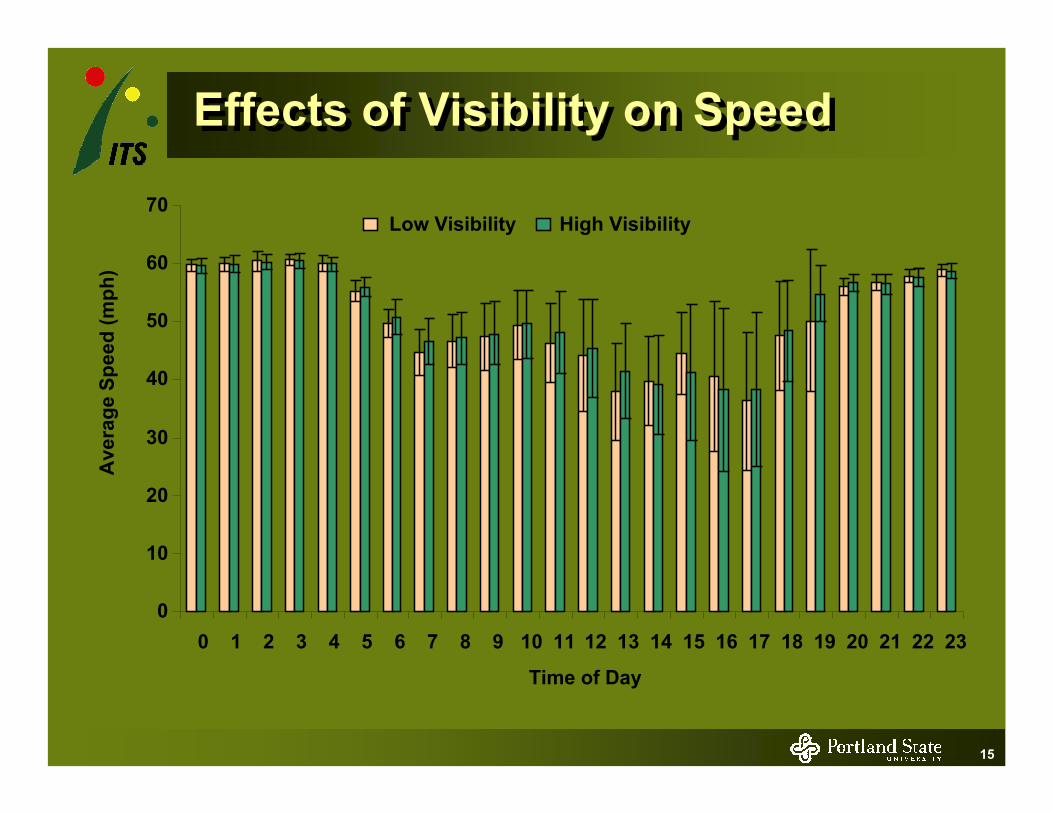
15
Effects of Visibility on SpeedEffects of Visibility on Speed
0
10
20
30
40
50
60
70
0 1 2 3 4 5 6 7 8 9 10 11 12 13 14 15 16 17 18 19 20 21 22 23
Time of Day
Ave
rage
Spe
ed (m
ph)
Low Visibility High Visibility
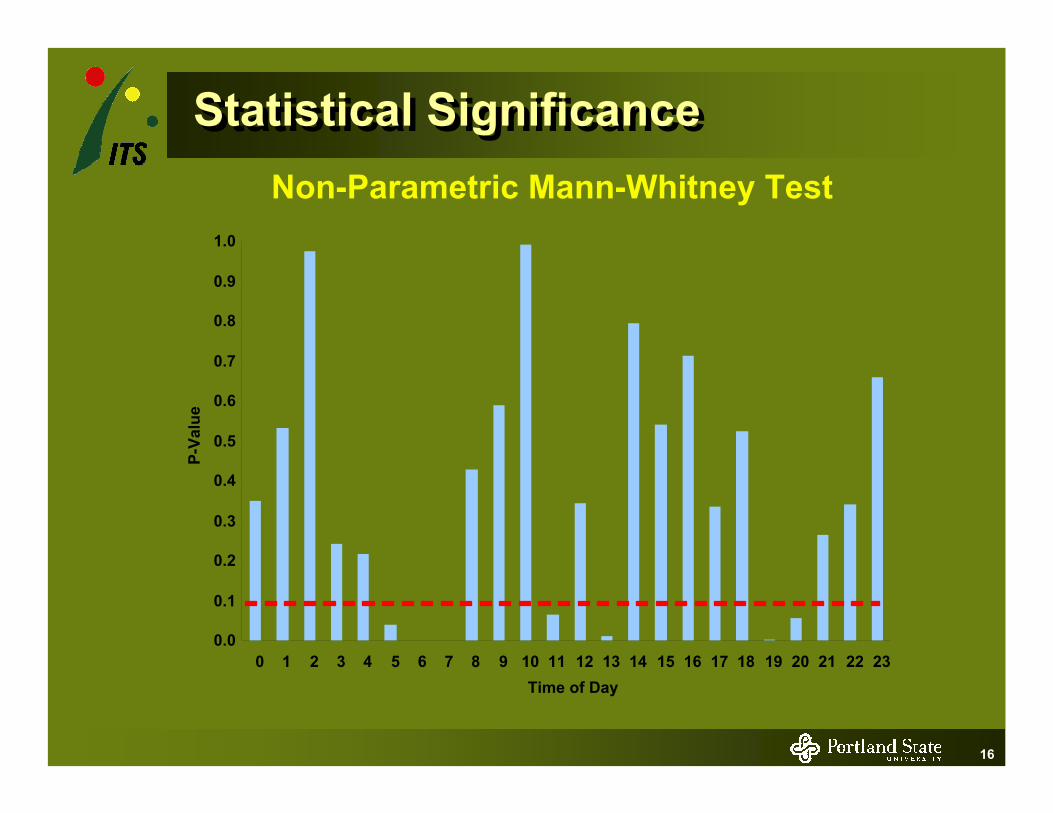
16
Statistical SignificanceStatistical SignificanceNon-Parametric Mann-Whitney Test
0.0
0.1
0.2
0.3
0.4
0.5
0.6
0.7
0.8
0.9
1.0
0 1 2 3 4 5 6 7 8 9 10 11 12 13 14 15 16 17 18 19 20 21 22 23Time of Day
P-Va
lue
17
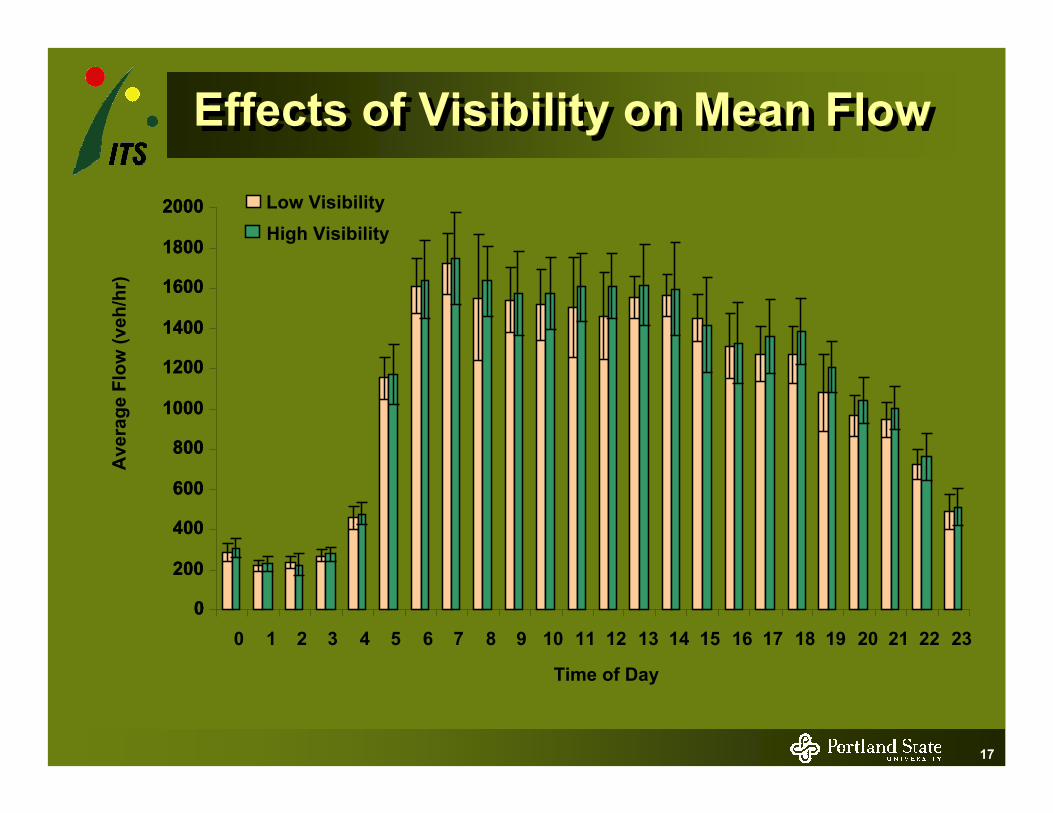
Effects of Visibility on Mean FlowEffects of Visibility on Mean Flow
0
200
400
600
800
1000
1200
1400
1600
1800
2000
0 1 2 3 4 5 6 7 8 9 10 11 12 13 14 15 16 17 18 19 20 21 22 23
Time of Day
Ave
rage
Flo
w (v
eh/h
r)
Low VisibilityHigh Visibility
0
200
400
600
800
1000
1200
1400
1600
1800
2000
18
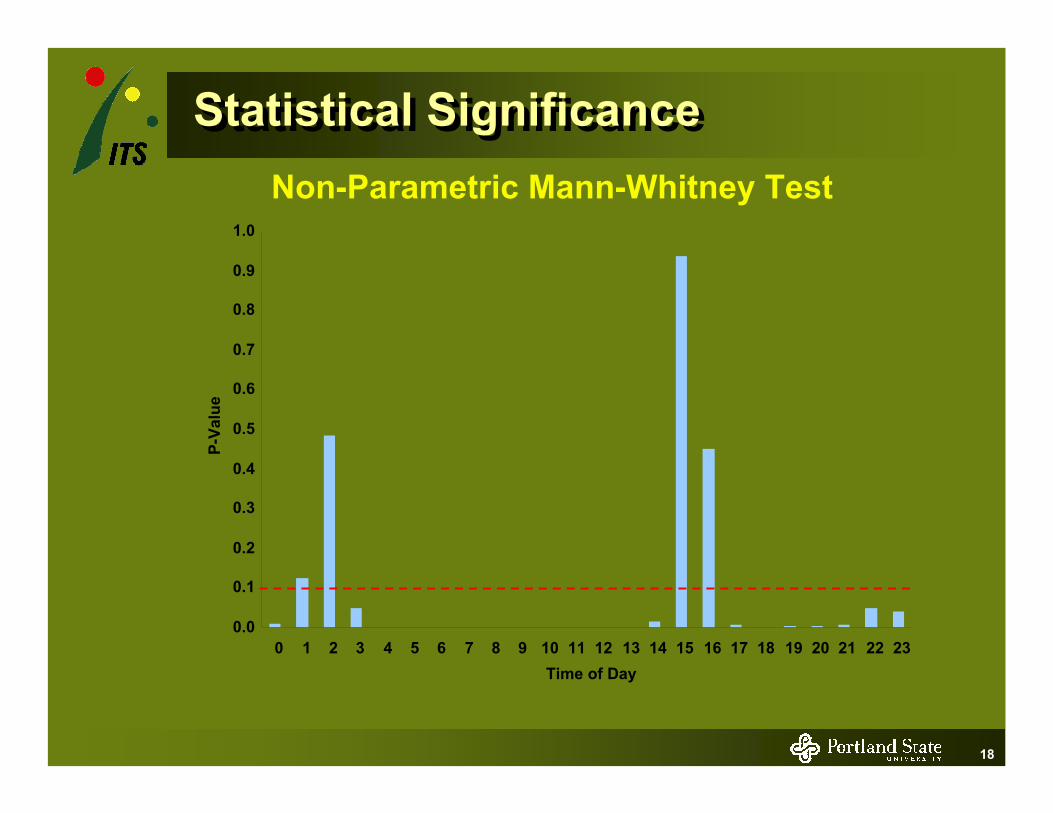
Statistical SignificanceStatistical SignificanceNon-Parametric Mann-Whitney Test
0.0
0.1
0.2
0.3
0.4
0.5
0.6
0.7
0.8
0.9
1.0
0 1 2 3 4 5 6 7 8 9 10 11 12 13 14 15 16 17 18 19 20 21 22 23Time of Day
P-Va
lue
19
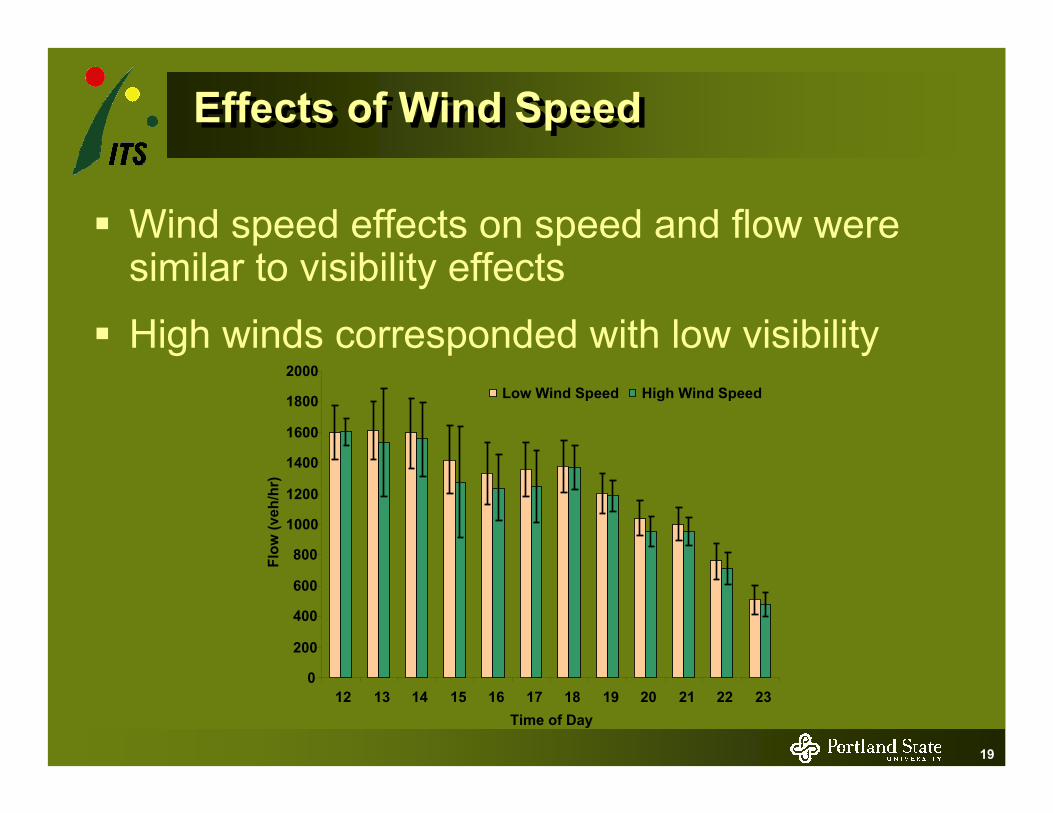
Effects of Wind SpeedEffects of Wind Speed
Wind speed effects on speed and flow were similar to visibility effects
High winds corresponded with low visibility
0
200
400
600
800
1000
1200
1400
1600
1800
2000
12 13 14 15 16 17 18 19 20 21 22 23Time of Day
Flow
(veh
/hr)
Low Wind Speed High Wind Speed
20
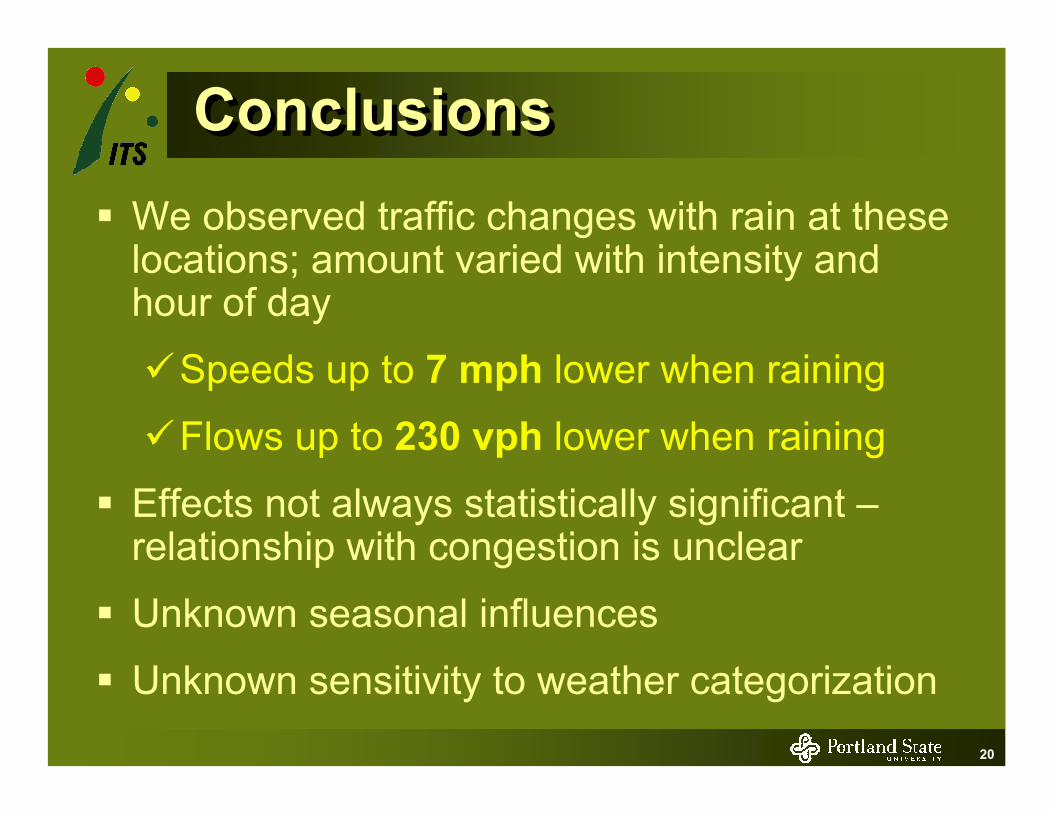
ConclusionsConclusionsWe observed traffic changes with rain at these locations; amount varied with intensity and hour of day
Speeds up to 7 mph lower when raining
Flows up to 230 vph lower when raining
Effects not always statistically significant –relationship with congestion is unclear
Unknown seasonal influences
Unknown sensitivity to weather categorization
21
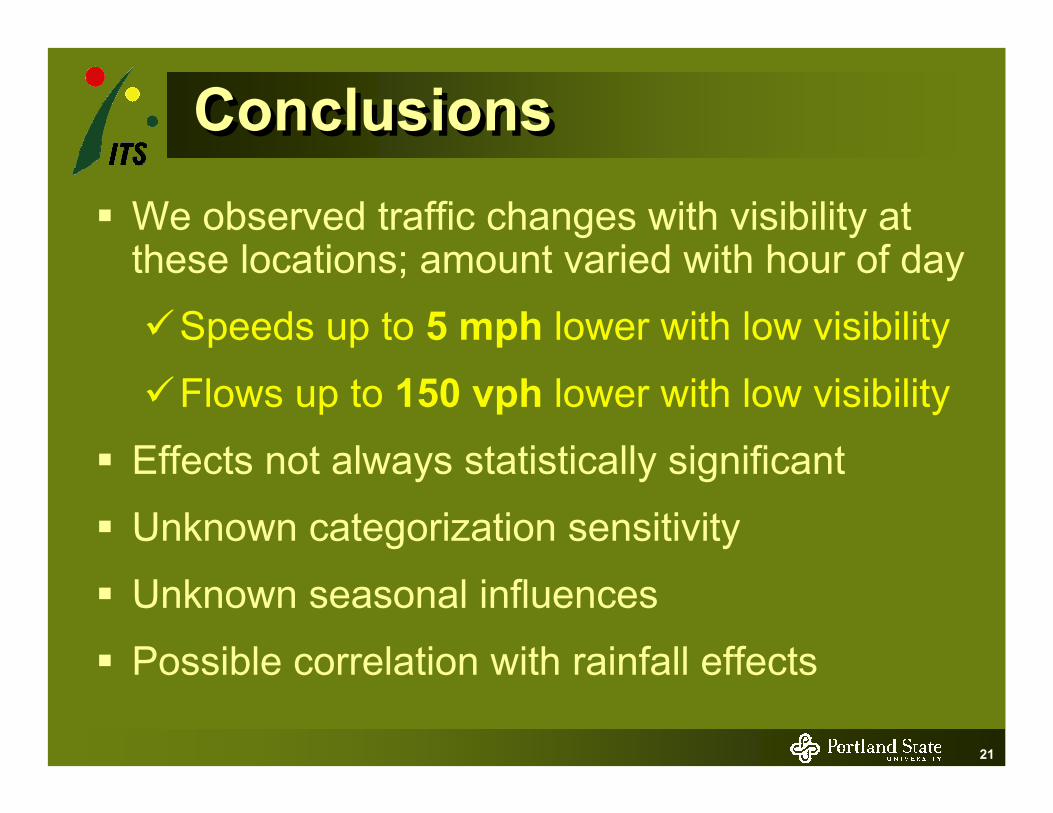
ConclusionsConclusionsWe observed traffic changes with visibility at these locations; amount varied with hour of day
Speeds up to 5 mph lower with low visibility
Flows up to 150 vph lower with low visibility
Effects not always statistically significant
Unknown categorization sensitivity
Unknown seasonal influences
Possible correlation with rainfall effects
22
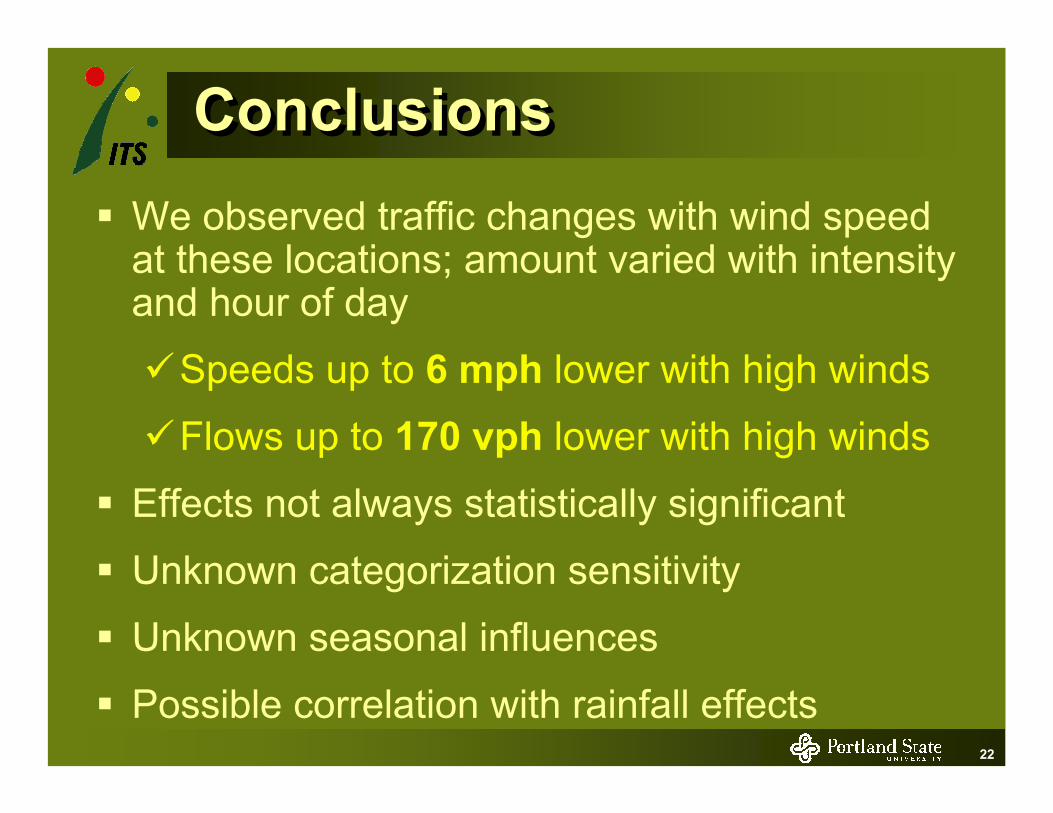
ConclusionsConclusionsWe observed traffic changes with wind speed at these locations; amount varied with intensity and hour of day
Speeds up to 6 mph lower with high winds
Flows up to 170 vph lower with high winds
Effects not always statistically significant
Unknown categorization sensitivity
Unknown seasonal influences
Possible correlation with rainfall effects
23
Next StepsNext Steps
Work with higher resolution weather and traffic data (5-min aggregated weather data are also available)
Look at more sites
Sensitivity analysis of weather classification

24
Questions?Questions?Questions?
Thank you!