Embed Size (px)
Citation preview
THE EFFECTS OF WINTER COVER CROPS AND SOIL COMPACTION TREATMENTS
ON SOIL PROPERTIES AND SOYBEAN PRODUCTION IN ILLINOIS
BY
JUAN CARLOS ACUNA
THESIS
Submitted in partial fulfillment of the requirements
for the degree of Master of Science in Crop Sciences
in the Graduate College of the
University of Illinois Urbana-Champaign, 2013
Adviser:
Assistant Professor Maria B. Villamil
Urbana, Illinois
ii
ABSTRACT
Winter cover crops (WCC) are suggested as a tool to alleviate compaction while
improving soil properties. However, WCC have also been reported to have detrimental effects on
the following crop. Our goals in this study were twofold: i) to evaluate the short-term ability of
radish and companion cover crops to alleviate induced soil compaction and improve soil physical
and chemical properties and ii) to assess soybean growth, development and yield following
compaction and cover crop treatments under conventional corn-soybean systems in two different
environments and on poorly drained soils typical of Illinois. The experimental design was a 6 x 4
factorial arrangement of the WCC and compaction treatments in a CRD with two reps. WCC
included radish (Raphanus sativus L. var. longipinnatus) “R”, alone and mixed with rye (Secale
cereale L.) “RR”, triticale (× Triticosecale cv Presto) “RTR”, buckwheat (Fagopyrum
esculentum L. Moench) “RB”, or hairy vetch (Vicia villosa Roth) “RHV”, and a control with no
cover crop “NCOV”. Compaction treatments included a control with no compaction (Nc), and
three levels of compaction achieved with either a small tractor (ST), a large tractor (LT) or a
hauling truck (TK). After the WCC growing season, soil physical properties improved compared
for all treatments including the NCOV. The studied soils in this experiment showed high
resilience to imposed compaction treatments probably related to inherently high levels of soil
organic carbon and of natural weathering processes. Soybean growth parameters, yield
components and grain yield showed no significant differences due to compaction treatments,
WCC or their interactions. Results from this study show that one growing season is not enough
time to evidence changes in the soil related to the incorporation of cover crops in the rotation,
and that following adequate management practices WCC should not affect soybean growth and
yield parameters.

iii
ACKNOWLEDGEMENTS
The author would like to thank fellow students from Dr.Villamil’s Lab for their help
during field and lab work, staff at the Crop Sciences Research and Education Center (South
Farms), especially Bod Dunker and Jeff Warren for their help conducting the field experiments
and the staff in the Crop Sciences Department of the University of Illinois.
He would also like to take this opportunity to express deep gratitude to his committee members;
Dr. Adam Davis, Dr. Don Bullock, and especially Dr. Maria Villamil, for their patient guidance
and assistance over the past few years.
This work is dedicated to my parents who provided the baselines for this endeavor and my wife
and two daughters for their unconditional support.

iv
TABLE OF CONTENTS
CHAPTER 1. WINTER COVER CROPS AND SOIL COMPACTION ALLEVIATION
EFFECTS IN ILLINOIS ..............................................................................................................1
ABSTRACT .................................................................................................................................1
INTRODUCTION .......................................................................................................................2
MATERIALS AND METHODS .................................................................................................10
RESULTS AND DISCUSSION ..................................................................................................17
CONCLUSION ............................................................................................................................25
TABLES AND FIGURES ...........................................................................................................27
REFERENCES ............................................................................................................................49
CHAPTER 2. COVER CROPS AND SOIL COMPACTION EFFECTS ON SOYBEAN
PRODUCTION IN ILLINOIS .....................................................................................................62
ABSTRACT .................................................................................................................................62
INTRODUCTION .......................................................................................................................63
MATERIALS AND METHODS .................................................................................................68
RESULTS AND DISCUSSION ..................................................................................................75
CONCLUSION ............................................................................................................................80
TABLES AND FIGURES ...........................................................................................................82
REFERENCES ............................................................................................................................91

v
APPENDIX ..................................................................................................................................100

1
CHAPTER 1. WINTER COVER CROPS AND SOIL COMPACTION ALLEVIATION
EFFECTS IN ILLINOIS
ABSTRACT
The increase in farm machinery weight in the recent decades has increased the likelihood
of soil compaction compromising soil productivity and environmental quality. Winter cover
crops (WCC) are suggested as a tool to alleviate compaction while improving soil properties.
Our goal was to evaluate the short-term contributions of radish and companion cover to a)
alleviate induced soil compaction and b) improve soil physical and chemical properties in
conventional corn-soybean systems in two different environments and on poorly drained soils
typical of Illinois. The experimental design was a 6 x 4 factorial arrangement of the WCC and
compaction treatments in a CRD with two reps. WCC included radish (Raphanus sativus L. var.
longipinnatus) “R”, alone and mixed with rye (Secale cereale L.) “RR”, triticale (× Triticosecale
cv Presto) “RTR”, buckwheat (Fagopyrum esculentum L. Moench) “RB”, or hairy vetch (Vicia
villosa Roth) “RHV”, and a control with no cover crop “NCOV”. Compaction treatments
included a control with no compaction (Nc), and three levels of compaction achieved with either
a small tractor (ST), a large tractor (LT) or a hauling truck (TK). After the WCC growing season,
bulk density and penetration resistance decreased compared to the values determined after
compaction for all treatments including the NCOV. The studied soils in this experiment showed
high resilience to imposed compaction treatments probably related to inherently high levels of
soil organic carbon and of natural weathering processes. Water aggregate stability and soil
chemical properties showed no significant differences after one WCC growing season in both
environments. Results from this study show that one growing season is not enough time to
evidence changes in the soil related to the incorporation of cover crops in the rotation.
2
INTRODUCTION
Since the beginnings of agriculture farmers have relied heavily on tillage practices for
crop production. Soil degradation induced by misuse of land and intensification of tillage
practices has been a trade-off of agriculture productivity, affecting agricultural sustainability and
environmental quality (Tilman et al., 2001). Soil compaction has been identified as one of the
leading causes of soil degradation threatening future productivity of American farmland
(Voorhees, 1987). It has been estimated that different degrees of soil compaction affect more
than 68 million hectares worldwide (Oldeman et al., 1991), yet more recent estimates indicate
there are more than 83 million hectares severely degraded by subsoil compaction (Wiebe, 2003).
Changes in soil physical properties induced by compaction alters soil nutrient and water
dynamics, reducing crop growth and yield and lowering the efficiency of cultivation inputs while
increasing the susceptibility of soils to wind and water erosion, affecting short-term fluxes of
greenhouse gases, and the pollution of surface and ground waters. Thus, soil compaction
contributes substantially to the United States costs associated with soil erosion (around $37
billion per year, Pimentel, 2006), agricultural greenhouse gas emissions (estimated as 6.2% of
total US emissions, EPA, 2010), water pollution ($4.3 billion annually, Dodds et al., 2009), and
increased energy use (15% of agricultural production costs, SARE, 2010) (Hamza and Anderson,
2005; Beare et al., 2009). These issues call for remedial measures to increase and maintain
current productivity while preserving agriculture’s non-renewable resource, the soil.
Cropping systems and tillage practices changed dramatically in the United States in the
last fifty years. In 1950, the average farm in the United states was 90 hectares (Dimitri, 2005),
more than 90 % of farm tractors had power levels of less than 26 kW and few wheel type tractors
exceeded 37 kW (Ngunjiri, 1994). By 2007, the average farm size in the US was 169 hectares

3
and the largest tractors produced more than 300 kW (USDA farm facts). According to the NASS
Illinois Field office (2010) farm size in Illinois increased from 78 hectares in 1960 to 143
hectares in 2009. This trend towards bigger farms is explained by a reduction in farm number,
almost by half in this same period. As farm size increased, farmers continued in the search for
bigger labor-saving farm equipment; disc rippers, soil finishers, planters and harvesters in order
to do field activities in a timely manner. Increased size and weight of farm machinery in the last
fifty years has increased the likelihood of soil compaction (Soane and Van Ouwekerk, 1998).
Larger farm equipment resulted in the need for larger and more powerful tractors to pull
them. Large tractors with large power levels allow farmers to conduct field operations in wetter
conditions than smaller tractors allowed in the past, increasing the likelihood of soil compaction.
Most of the soil compaction in modern agriculture is caused and fostered by wheel traffic of
heavy machinery use on wet soils, which is exacerbated with monocultures or with the use of a
limited number of species in crop rotations (Van Owerkerk and Soane, 1994; Hamza and
Anderson, 2005; Servadio et al., 2005; Hoorman, 2009). Intensification of tillage practices and
crop rotations in the Midwest have increased the concerns of soil compaction. Extensive tillage
on heavy soils in the Midwest causes compaction (Horn et al., 1995; Brevik et al., 2002) and it is
estimated that farmers in the region lose over $100 million each year due to soil compaction
(Mann, 2008).
Soil compaction directly alters soil structure decreasing pore size distribution and
aeration, increasing bulk density and root penetration resistance, and lowering the resistance of
soil aggregates to water (Horn, 2004). Soil structure refers to the arrangement of sand, silt and
clay particles into aggregates which affects water and air movement through soil, influencing its
ability to sustain life. The result of compaction is the densification and distortion of the soil and

4
is defined as “the process by which soil grains are rearranged to decrease void space and bring
them into closer contact with one another, thereby increasing the bulk density” (Soil Science
Society of America, 1996). Soil physical properties affected by compaction include bulk density,
soil strength and aggregate stability or the ability of soil aggregates to resist disintegration by
tillage, water or wind. Soil bulk density values vary with soil texture and soil organic matter, and
it refers to the capacity of a soil to store and transport water and air. Soil strength, also referred to
as penetration resistance, is a measure of force required to push a cone-tipped probe through a
soil and it relates to root ability to overcome mechanical resistances of soil aggregates.
Penetration resistance varies with soil texture, organic matter content, bulk density and water
content; showing a positive correlation to soil bulk density and a general negative relationship
with soil organic matter and water content. Variations in penetration resistance correlate well
with variations in the overall resistance to root penetration (Unger and Kaspar, 1994). Soil
compaction can be divided into two types: surface compaction and subsoil compaction. Surface
or topsoil compaction is associated with traffic and ground pressure during field operations,
especially during periods of high soil moisture. In the Midwest region soils are typically wet at
seed bed preparation and planting in the spring and during fall harvest. The weakened aggregates
and thus, soil structure resulting of topsoil compaction are susceptible to water and wind erosion
leading to soil crusting and run-off after rain events. Topsoil compaction affects crop emergence
and water infiltration yet it can be disrupted by natural forces and biological activities and tillage
(Larson and Allmaras, 1971; Voorhees, 1983). On the other hand subsoil compaction can be
caused by field activities such as tillage (plow pans), excessive axle loads (usually below the
tilling depth) and by processes of soil formation such as fragipans and claypans. Heavy farm
machinery can create subsoil compaction (Hakansson and Reeder, 1994) which is very difficult

5
to remediate and may exist permanently. In the last hundred years, tillage practices have
decreased soil organic levels by 60% worldwide (International Panel on Climate Change, 1996;
Lal, 2004). Farmers used to restore and maintain soil physical and chemical fertility through crop
rotations, but as farm size increased in the last decades the number of commodities produced per
farm decreased (NASS Illinois Field office 2010). Cropping systems shifted from diverse
rotations involving cash grains crops like corn, soybeans, winter wheat, oats with pastures and
livestock to short rotations of corn and soybeans or corn monocultures, thus increasing tillage
intensity and the risk for soil degradation (Voorhees and Lindstrom 1994).
Crop rotations benefits include increased soil organic matter levels (Bullock, 1992;
Bremer et al., 2008) improved soil structure (Raimbault and Vyn, 1991), and reduced grain yield
variability (Varvel, 2000). Yet, current subsidy policies and economic trends favor corn
monoculture or the biculture of corn and soybeans over more diverse cropping systems (Karlen
et al., 2006; Liebman et al., 2008). Karlen et al (2006) after analyzing rotations profitability and
soil ratings from three long-term studies in Iowa and one in Wisconsin reported that extended
rotations had a positive effect on soil quality indicators. The lowest soil quality rating values and
20-yr average profit were associated with continuous corn, while extended rotations that
included at least 3 year of forage crops had the highest soil quality rating values. Similarly,
Liebman et al (2008) reported on how various rotation systems compared in terms of soil quality
ratings and profitability. They compared over a 4-year period of time a conventionally managed
2-year rotation system corn-soybean with a 3-year corn-soybean-small grain + red clover
(Trifolium pratense L.) rotation, and a 4-year corn-soybean-small grain +alfalfa (Medicago
sativa L.) rotation. Without subsidy payments, net returns were highest for the 4-year system,

6
intermediate for the 2-yr systems and lowest for the 3-yr system. With subsidies, differences
among systems in net returns were smaller, as subsidies favored the 2-yr system.
Diversified farming systems in the Midwest used to include small grains with alfalfa and
clovers (Liebman, 2008). Longer rotations including perennials protected soils from compaction
reducing the need of tillage for several years after seeding, and reducing traffic across the field;
usually associated with hay harvesting when the soil is dry and less susceptible to compaction.
Compared with a crop rotation with annual plowing to 30 cm soil depth, perennial forage crops
increased soil C content, N content, had higher densities of medium and coarse biopores at a
depth of 35 cm and larger water-stable soil macroaggregates (Kautz, 2010). Long term rotations
with perennial crops have also been found to maintain or increase soil organic carbon levels
(Wilts et al., 2004; Russell et al., 2006; Varvel, 2006). Soil organic matter plays a key role in the
ability of a soil to resist compaction by increasing binding forces between particles and within
aggregates, increasing elasticity (Soane, 1990). Organic residues on the soil have the ability to be
compressed and return to their original form after traffic has passed, protecting soil from
compaction. Although surface residues are important to protect soils from traffic and water and
wind erosion, residues within the soil profile may be even more important. Effects of soil organic
matter levels and the development of compaction have been widely studied and there is evidence
that soils with low organic matter contents are more susceptible to compaction (Soane, 1990;
Diaz Zorita, 2000).
While going back to longer rotations could prove to be a challenge to modern farm
management practices or economically unviable, including winter cover crops (WCC) in a
cropping system could prevent soil degradation resultant of tillage and rotation intensification.
Cover crops are defined as crops planted between periods of cash crop production to reduce loss
7
of nutrients, decrease runoff from agricultural fields and provide ground cover to reduce soil
erosion (Reeves, 1994; Dabney et al., 2001; Phatak et al., 2002). Cover crops may be utilized in
farming systems as companion crops to cash crops or grown during fallow periods between cash
crops in field rotations. Including cover crops in cropping systems provides numerous benefits
such as carbon sequestration, increased residue cover, integrated pest management, and enhance
nutrient cycling (Marshall et al., 2002; Taboada-Castro et al., 2006; Balkcom et al., 2007) that
might result in greater crop yield or enhanced yield stability (Snapp et al., 2005). Winter cover
crops can enhance soil structure by maintaining or increasing soil carbon and nitrogen, reducing
bulk density and penetration resistance, and improving water aggregate stability of the topsoil
(Kuo et al., 1997; Latif et al., 1992; Calegari, 1995; Meisinger and Delgado 2002; Sainju et al.,
2002; Williams et al., 2002; Villamil et al., 2006; 2008). Changes in soil physical properties
subsequently impact several soil chemical and biological properties ultimately affecting crop
growth, development and yield.
Plant roots have been proposed as “tillage tools” to ameliorate effects of soil compaction
(Elkins, 1985). The growth and decomposition of roots leaves voids and root channels, biopores,
that could be later used as low resistance pathways for subsequent crop roots, ma processes
dubbed “biodrilling” (Creswell and Kirkegaard, 1995). Winter cover crops with vigorous root
systems can also alleviate compacted subsoils (Dexter, 1991), providing a more uniform rupture
of compacted layers than the common mechanical methods offering both economic and
environmental benefits over subsoiling (Camargo and Alleoni, 1997). Roots are also an active
source of organic exudates which are effective stabilizing agents in soil aggregation (Reid and
Goss, 1981). Different plant species and cultivars within the same species may differ in their
ability to penetrate compacted soils (Rosolem et al., 2002; Cairns et al., 2004). Root length
8
density in compacted soils is positively correlated to root diameter. Thus roots with larger
relative root diameters, usually tap rooted dicots, have a greater ability to penetrate trough
compacted soil layers than roots with smaller diameters, usually fibrous-rooted monocots
(Materechera et al., 1991;1992; Merril et al., 2002). Deep-rooted cover crops penetrate
compacted soil layers (Chen and Weil, 2010), ameliorating soil compaction (Clark, 2007;
Williams and Weil, 2004), and increasing nutrient use efficiency by capturing nutrients from
deeper soil layers (Kristensen and Thorup-Kristensen, 2004; Thorup-Kristensen, 2006; Dean and
Weil, 2009).
Although the potential of perennial grass and legume forages to improve soil physical
properties and ameliorate soil compaction has been extensively researched and supported for
various crops (Elkins et al., 1985; Rasse and Smucker, 1998; Katsvairo et al., 2007) the potential
effects of annual crops is still under research. Da Silva and Rosolem (2002) found that annual
cover crops of black oat (Avena strigosa Schreb.), pigeon pea (Cajanus cajan L.), and pearl
millet (Pennisetum glaucum L.) were the most effective in disrupting compacted layers favoring
the subsequent growth of soybean roots through the compacted layers. Similarly, Williams and
Weil (2004) reported that soybean roots were able to grow through a compacted plowpan soil
using channels made by decomposing canola cover crop roots.
The predominant cover crop selections in the Midwest region are winter annuals,
particularly winter cereals, followed closely by hairy vetch (Singer, 2008). Cereal rye, wheat
(Triticum aestivum L.), triticale, and annual rye grass (Lolium multiflorum L.) are used as catch
crops for their high nitrogen scavenging potential, biomass production, winter hardiness, and
ease to kill with herbicide (Odhiambo and Bomke, 2001). Other relatively new cover crops in
this region include Brassica species, such as radishes, and summer annuals, such as buckwheat.
9
These last options might be more appealing to producers because they do not overwinter, thus
removing the concern of appropriate killing times to prevent negative effects on the
establishment and yield of the following cash crop. In the Midwest region, planting dates and
harvest schedules of crop production systems often create restricted periods to maximize the
advantages of traditional cover crop use.
Previous research in Illinois has shown the potential of hairy vetch and rye and their
mixture to improve soil structure in no-till corn soybean systems compared to bare fallow
(Villamil et al., 2006; 2008). Rotations including vetch or a mixture of rye and vetch
significantly increased the soil organic matter in the top 30cm of the soil profile with resulting
reductions in bulk density and penetration resistance and a significant increase in water
aggregate stability, total porosity and related water retention properties. Yet information is
currently lacking for other cover crop options and tillage systems.
I hypothesize that winter cover crops will alleviate induced soil compaction and improve
soil properties as compared with winter fallowing in conventional corn soybean systems. I also
expect that winter cover crops with different root systems will differ in either the magnitude or
the direction of the observed response. Radish cover crops are expected to have greater effects on
loosening deep soil compacted layers due to stronger and larger root diameters while grass cover
crops effects will be reflected primarily on the topsoil due to a reduced ability to penetrate
induced compacted layers. I anticipate that the mixtures of radishes and grasses will have a
greater effect on soil compaction alleviation due to combined effect of different root systems.
The main objectives of this research were therefore to evaluate the short-term differential effects
and contributions of radish and companion cover crops to a) alleviate soil compaction and b)

10
improve soil physical and chemical properties in conventional corn-soybean systems established
in poorly drained soils typical of Illinois.
I expect that the results of this research will provide useful and currently lacking
information on the effects of compaction in Illinois poorly drained soils, and the potential
alleviation effects of selected cover crops informing their inclusion in corn-soybean systems.
MATERIALS AND METHODS
Experimental sites and treatments
The study was carried out at Urbana, Illinois, in 2010 and 2011 at the Crop Sciences
Research and Education Center (South Farms) of the University of Illinois. A different field
coming out of wheat production (T. aestivum L.) was used each year. Both fields were on
Drummer silty clay loam (fine silty, mixed, superactive, mesic Typic Endoaquoll) with less than
2% slope. Drummer series consist of dark colored, very deep, poorly drained soils developed in
100- to 150-cm of loess or other silty material under prairie vegetation. Permeability is moderate
and surface runoff is negligible to low (Soil Survey Staff, 2012). The two selected fields had
several years of corn-soybean rotation followed by one year with winter wheat prior to our
experiments. We decided to start our experiments after winter wheat in order to induce the
compaction treatments and plant the WCC in a timely manner. Before establishing our
experiment, conventional tillage consisting of a deep ripper followed by disking was used to
control weeds and to prepare the seed bed. Compaction levels and cover crop treatments were
arranged in a 4 x 6 factorial in a completely randomized design (CRD) with two replications.
11
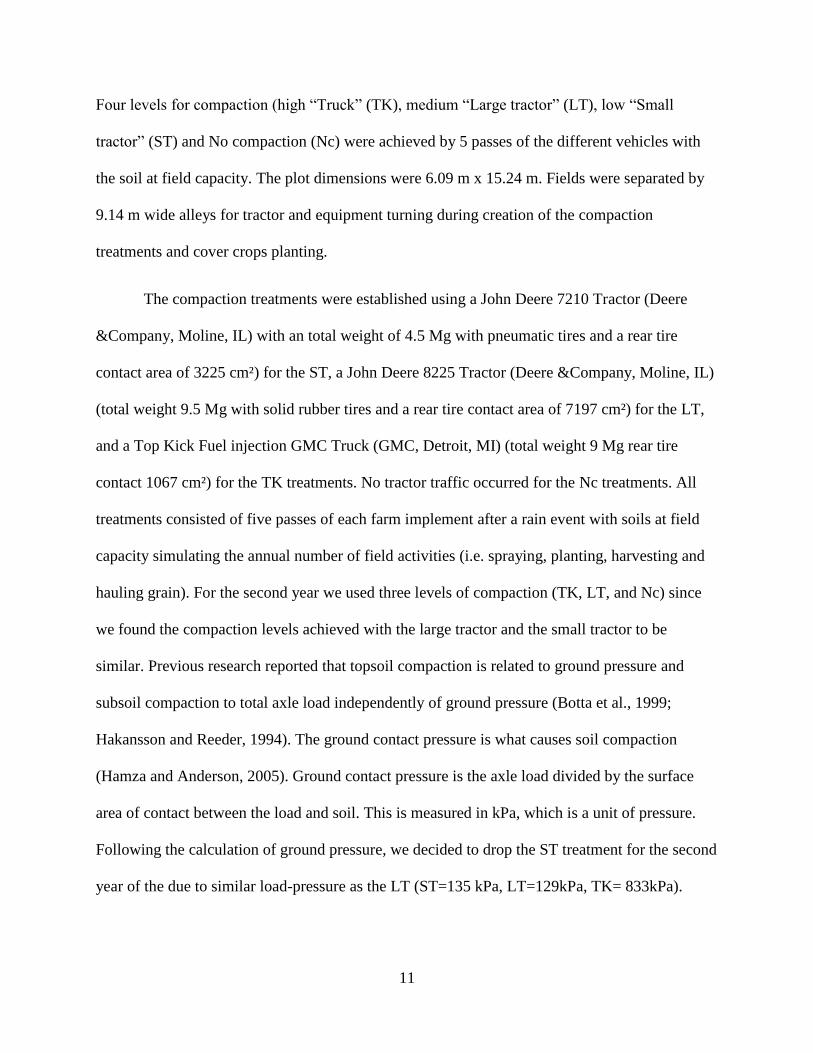
Four levels for compaction (high “Truck” (TK), medium “Large tractor” (LT), low “Small
tractor” (ST) and No compaction (Nc) were achieved by 5 passes of the different vehicles with
the soil at field capacity. The plot dimensions were 6.09 m x 15.24 m. Fields were separated by
9.14 m wide alleys for tractor and equipment turning during creation of the compaction
treatments and cover crops planting.
The compaction treatments were established using a John Deere 7210 Tractor (Deere
&Company, Moline, IL) with an total weight of 4.5 Mg with pneumatic tires and a rear tire
contact area of 3225 cm²) for the ST, a John Deere 8225 Tractor (Deere &Company, Moline, IL)
(total weight 9.5 Mg with solid rubber tires and a rear tire contact area of 7197 cm²) for the LT,
and a Top Kick Fuel injection GMC Truck (GMC, Detroit, MI) (total weight 9 Mg rear tire
contact 1067 cm²) for the TK treatments. No tractor traffic occurred for the Nc treatments. All
treatments consisted of five passes of each farm implement after a rain event with soils at field
capacity simulating the annual number of field activities (i.e. spraying, planting, harvesting and
hauling grain). For the second year we used three levels of compaction (TK, LT, and Nc) since
we found the compaction levels achieved with the large tractor and the small tractor to be
similar. Previous research reported that topsoil compaction is related to ground pressure and
subsoil compaction to total axle load independently of ground pressure (Botta et al., 1999;
Hakansson and Reeder, 1994). The ground contact pressure is what causes soil compaction
(Hamza and Anderson, 2005). Ground contact pressure is the axle load divided by the surface
area of contact between the load and soil. This is measured in kPa, which is a unit of pressure.
Following the calculation of ground pressure, we decided to drop the ST treatment for the second
year of the due to similar load-pressure as the LT (ST=135 kPa, LT=129kPa, TK= 833kPa).

12
Each year and a week after imposing the compaction treatments, the field was disked to a
depth of approximately 8 cm to establish a suitable seedbed for the cover crop treatments. The
six cover crops levels consisted of: radish (Raphanus sativus L. var. longipinnatus) “R”, sown
alone or along with rye (Secale cereale L.,) “RR”, triticale (× Triticosecale cv Presto) “RTR”,
buckwheat (Fagopyrum esculentum L. Moench) “RB”, or hairy vetch (Vicia villosa Roth)
“RHV” and a control with no cover crop, “NCOV”.
Planting date for WCC was September 27th
2010 and September 7th
2011. Seeding rate
was 10 kg ha-1
for radish sown alone, 28 kg ha-1
for rye in combination with radish, 38 kg ha-1
for triticale in combination with radish, 30 kg ha-1
for hairy vetch in combination with radish and
45 kg ha-1
for buckwheat in combination with radish. The seeding rate for radish in combination
with other WCC was 5 kg ha-1
. Hairy vetch was inoculated every year with Rhizobium
leguminosarum var. viciae. WCC were chemically suppressed with glyphosate (N-
(phosphonomythyl) glycine) at 1.2 kg a.i. ha-1
in the spring, approximately two weeks before
planting the main crop based on guidelines developed by Ruffo (2001) and Crandall (2003).
Soybean was planted on June 3rd
on 2011 and on May 15th
2012 respectively.
Soil sampling and analysis
After a preliminary penetration resistance characterization of both fields, complete soil
sampling was conducted during fall and spring seasons, each time after establishment of the
compaction treatments and before planting the main soybean crop. On September 7 2010 and
August 15 2011, and May 15 2011 and May 5 2012, two soil subsamples per plot up to 50-cm in
depth were taken with a Giddings® sampler (29.5-mm diam., Giddings machine Co., Fort
Collins, CO) for bulk density (BD) and soil chemical analysis. The cores were then cut to obtain
0-10, 10-20, 20-30, 30-40, and 40-50-cm subsamples, and stored in plastic bags. After weighing
13
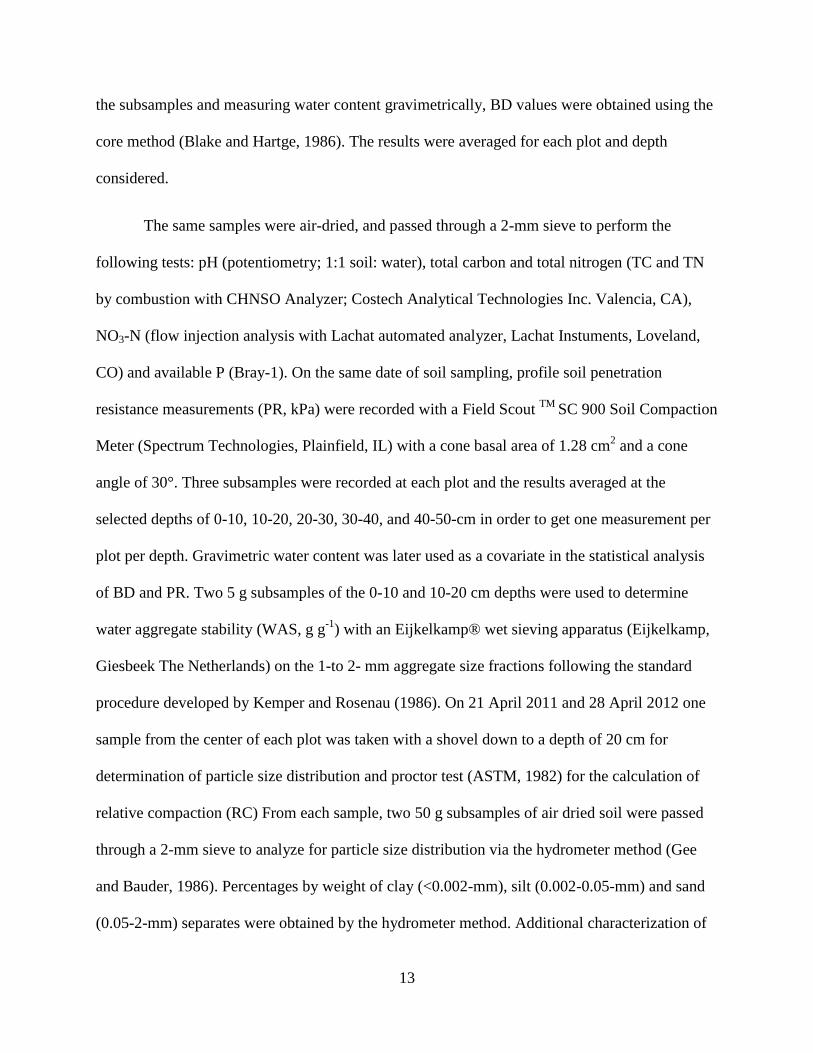
the subsamples and measuring water content gravimetrically, BD values were obtained using the
core method (Blake and Hartge, 1986). The results were averaged for each plot and depth
considered.
The same samples were air-dried, and passed through a 2-mm sieve to perform the
following tests: pH (potentiometry; 1:1 soil: water), total carbon and total nitrogen (TC and TN
by combustion with CHNSO Analyzer; Costech Analytical Technologies Inc. Valencia, CA),
NO3-N (flow injection analysis with Lachat automated analyzer, Lachat Instuments, Loveland,
CO) and available P (Bray-1). On the same date of soil sampling, profile soil penetration
resistance measurements (PR, kPa) were recorded with a Field Scout TM
SC 900 Soil Compaction
Meter (Spectrum Technologies, Plainfield, IL) with a cone basal area of 1.28 cm2 and a cone
angle of 30°. Three subsamples were recorded at each plot and the results averaged at the
selected depths of 0-10, 10-20, 20-30, 30-40, and 40-50-cm in order to get one measurement per
plot per depth. Gravimetric water content was later used as a covariate in the statistical analysis
of BD and PR. Two 5 g subsamples of the 0-10 and 10-20 cm depths were used to determine
water aggregate stability (WAS, g g-1
) with an Eijkelkamp® wet sieving apparatus (Eijkelkamp,
Giesbeek The Netherlands) on the 1-to 2- mm aggregate size fractions following the standard
procedure developed by Kemper and Rosenau (1986). On 21 April 2011 and 28 April 2012 one
sample from the center of each plot was taken with a shovel down to a depth of 20 cm for
determination of particle size distribution and proctor test (ASTM, 1982) for the calculation of
relative compaction (RC) From each sample, two 50 g subsamples of air dried soil were passed
through a 2-mm sieve to analyze for particle size distribution via the hydrometer method (Gee
and Bauder, 1986). Percentages by weight of clay (<0.002-mm), silt (0.002-0.05-mm) and sand
(0.05-2-mm) separates were obtained by the hydrometer method. Additional characterization of
14
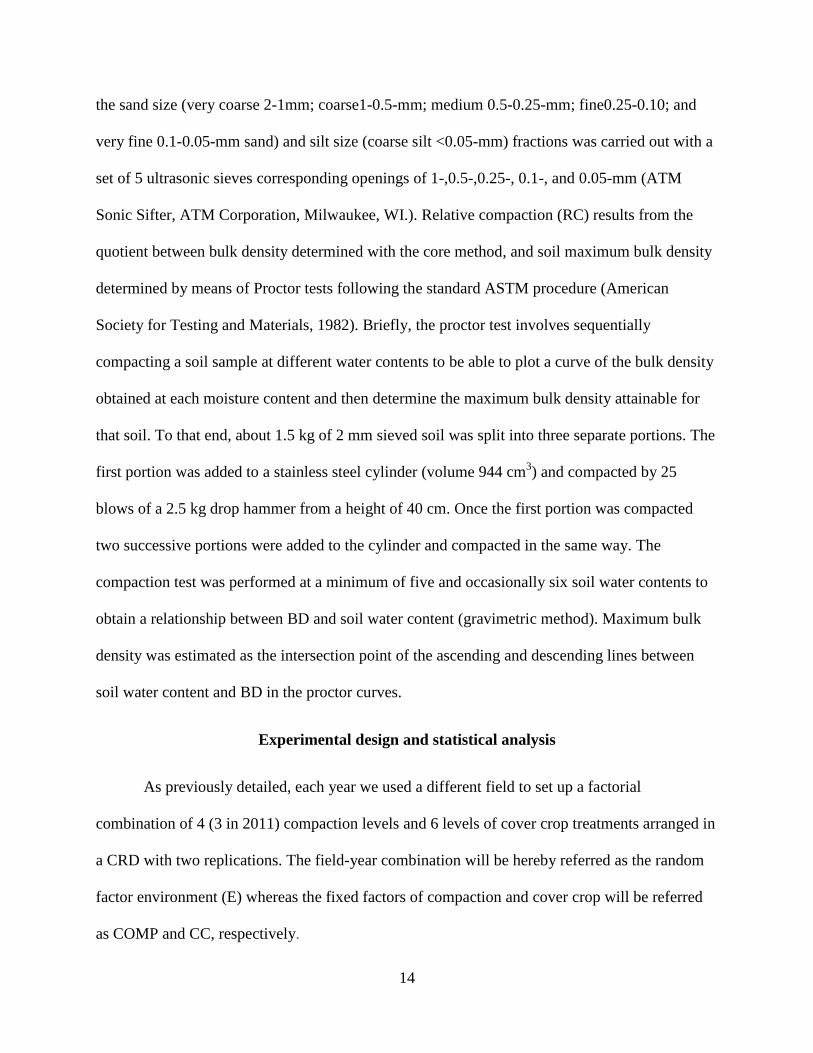
the sand size (very coarse 2-1mm; coarse1-0.5-mm; medium 0.5-0.25-mm; fine0.25-0.10; and
very fine 0.1-0.05-mm sand) and silt size (coarse silt <0.05-mm) fractions was carried out with a
set of 5 ultrasonic sieves corresponding openings of 1-,0.5-,0.25-, 0.1-, and 0.05-mm (ATM
Sonic Sifter, ATM Corporation, Milwaukee, WI.). Relative compaction (RC) results from the
quotient between bulk density determined with the core method, and soil maximum bulk density
determined by means of Proctor tests following the standard ASTM procedure (American
Society for Testing and Materials, 1982). Briefly, the proctor test involves sequentially
compacting a soil sample at different water contents to be able to plot a curve of the bulk density
obtained at each moisture content and then determine the maximum bulk density attainable for
that soil. To that end, about 1.5 kg of 2 mm sieved soil was split into three separate portions. The
first portion was added to a stainless steel cylinder (volume 944 cm3) and compacted by 25
blows of a 2.5 kg drop hammer from a height of 40 cm. Once the first portion was compacted
two successive portions were added to the cylinder and compacted in the same way. The
compaction test was performed at a minimum of five and occasionally six soil water contents to
obtain a relationship between BD and soil water content (gravimetric method). Maximum bulk
density was estimated as the intersection point of the ascending and descending lines between
soil water content and BD in the proctor curves.
Experimental design and statistical analysis
As previously detailed, each year we used a different field to set up a factorial
combination of 4 (3 in 2011) compaction levels and 6 levels of cover crop treatments arranged in
a CRD with two replications. The field-year combination will be hereby referred as the random
factor environment (E) whereas the fixed factors of compaction and cover crop will be referred
as COMP and CC, respectively.

15
The linear model used for the statistical analysis of the dependent variables was
yijkl = μ + Ei + αj+ βk + Eiαj + Eiβk + αjβk + Eiαjβk + Error
yijkl = observation for the ith
level of E for the jth
level of COMP and the kth
level of CC.
μ = grand mean.
Ei = random effect due to the ith
level of factor E. df=i-1 = 2-1=1
αj = fixed effect of the jth
COMP. df=j-1 = 4-1=3
Eiαj= random effect due to ith
level of factor E and the jth
COMP. df=(i-1)(j-1) =3
βk = fixed effect due to the kth
level of factor CC df=k-1=6-1=5
αj βk = fixed effect due to the jth
level of factor COMP and the kth
CC. df=(i-1)(j-1)(k-1) =15
Ei βk = random effect due to ith
level of factor E the kth
CC. df=(i-1)(k-1) =5
Ei αj βk = random effect due to ith
level of factor E the kth
COMP and the kth
CC. df=(i-1)(j-1)(k-
1) =15
Error = residual effect assumed identically and independently distributed (i.i.d.) N (0,σ2).
These models were analyzed using the MIXED procedure of SAS 9.3 (SAS Institute Inc,
2012). For dependent variables that were measured at specific and subsequent depths, a fixed
factor D (depth) was added to the model. Dependent variables that were measured at several
depths on the same experimental units were analyzed using a repeated measures approach (Littell
et al., 2002). The model used for the variance-covariance matrix of the residuals was
unstructured (UN) with random effects for subject (S) and it was selected based on the lowest
Akaike’s Information Criterion and the Schwarz’s Bayesian Criterion (Littell et al., 2000).

16
When covariance parameter estimates appeared to be negative or zero, we used the -2Log
Likelihood test to compare successive reduced forms of the original models (Littell et al., 2002).
To compare differences among treatments and depths the PDIFF options of the LSMEANS
statement was used. Mean separation procedure was accomplished by using Fisher’s Protected
Least Significant Difference (LSD) with a probability of Type I error or alpha level (α) set at 0.1.
The matching SAS coding was as follows,
proc mixed data=thesis;
class E S CC COMP D;
model variable = CC|COMP|D;
random E E*CC E*COMP E*D E*CC*COMP E*COMP*D E*CC*D
repeated D/type = UN subject = S; run;
Where E, environment; S, subject; CC, cover crop; COMP, compaction; and D, depth.
The variable nitrates (NO3-N), water aggregate stability (WAS), and available P required
transformations due to lack of normality of residuals and heterogeneity of variances. Possible
transformations were explored by using the BOXCOX macro in SAS (Friendly, 1991). When
two or more transformations were possible, the one most commonly used in the literature was
chosen. Thus the transformation used for nitrates was logarithm (log10) the transformation used
for WAS was λ=2, and the transformation for available P was natural logn.

17
RESULTS AND DISCUSSION
Establishment of compaction treatments and preliminary characterization of experimental
plots
Soil Texture and Particle Size Distribution.
Our experiment was conducted on Drummer soils yet the series concept involves a broad
range of properties such as the arrangement of soil horizons, thickness and soil type. Results
from the particle size analysis show that the textural class of the soils used in this experiment is
silty clay loam (Figure 1.1). The lack of significant differences among particle size separates of
the soils studied in this experiment is of critical importance for assessing changes in soil
properties since the texture of a given soil and its mineral composition determine the nature and
behavior of the soil (Hillel, 1998). Moreover different textures give rise to different pore sizes in
the soil (Dexter, 2004), and therefore could behave differently to the imposed compaction
treatments. The compared soils are highly homogenous in particle size distribution as data in
Table 1.1 and Table 1.2 show which is preferred given the range of variability for each textural
class (Fig 1.1). When using small treatment plots and limited number of replications, small
variations in clay or sand content or even in the amount of coarse or fine sand fractions may lead
to wrong conclusion since many of the soil properties (PR, BD, WAS, etc.) are very sensitive to
differences in particle size distribution (Amezketa, 1999).
Soil physical properties
Compaction treatments were achieved after a rainfall in a recently tilled, loose soil, in
order to achieve the maximum level of compaction possible. The treatments consisted in five
passes of each implement small tractor (ST), large tractor (LT) and hauling truck (TK), through
each plot. The number of passes selected reflects typical farm trafficking and cultivation

18
operations for a given season in IL: seed bed preparation, planting, spraying and harvesting.
Traffic intensity (number of passes) plays an important role in soil compaction because number
of passes increases soil deformation (Bakker and Davis, 1995). It is estimated that under
conventional tillage systems vehicular traffic exceeds 100% of the ground area during one crop
cycle (Soane et al., 1982). After the induced compaction, differences between treatments were
evident: as expected TK achieved a greater level of compaction and sealing of the topsoil due to
its axle load and smaller contact area. Differences between the compaction achieved with the LT
and ST were less evident. Although the axle load of the LT was almost double the axle load of
the ST, the fact that it had dual tires lowered the overall pressure exerted on the soil. Several soil
physical parameters were examined to quantify the effects of the different compaction
treatments.
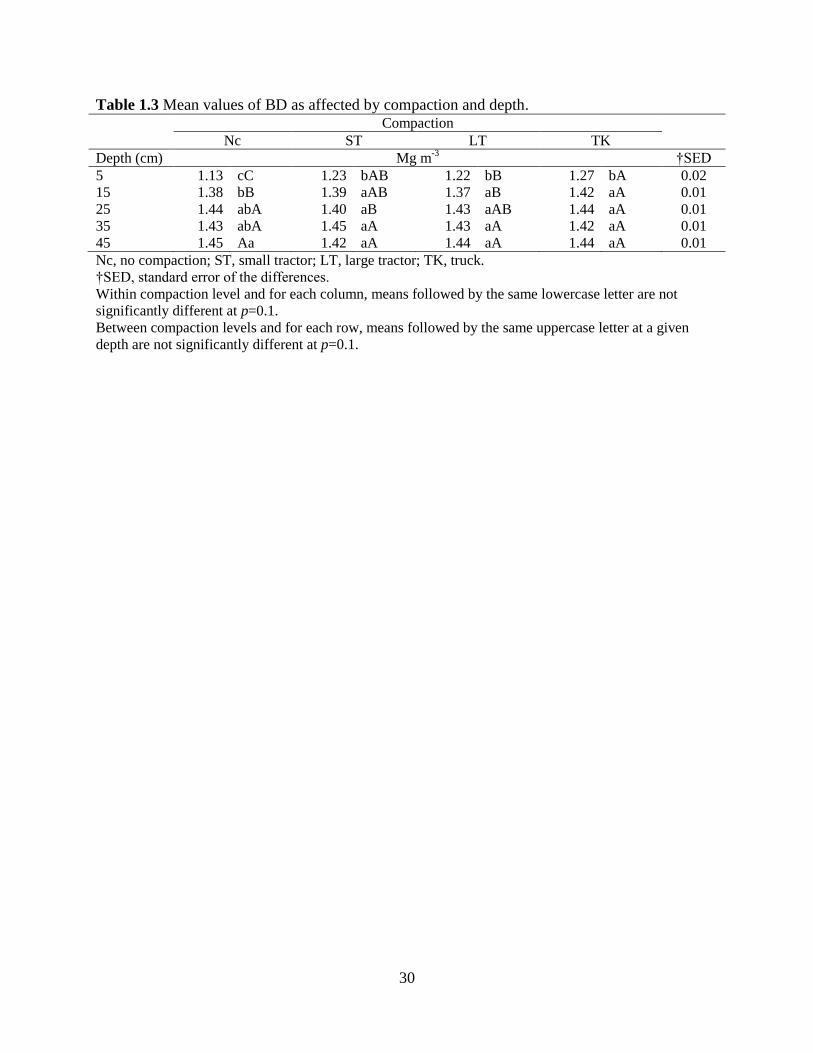
As expected bulk density (BD) values showed significant differences for the interaction
of compaction level and depth (p<0.0001), and main effects compaction level (p<0.0036) and
depth (p<0.0064). BD values showed that compaction was confined to the topsoil. The TK
treatment achieved the greater BD values in the top 20cm. After the 20cm depth differences in
BD values started decreasing. There were no significant differences in BD values after the 30cm
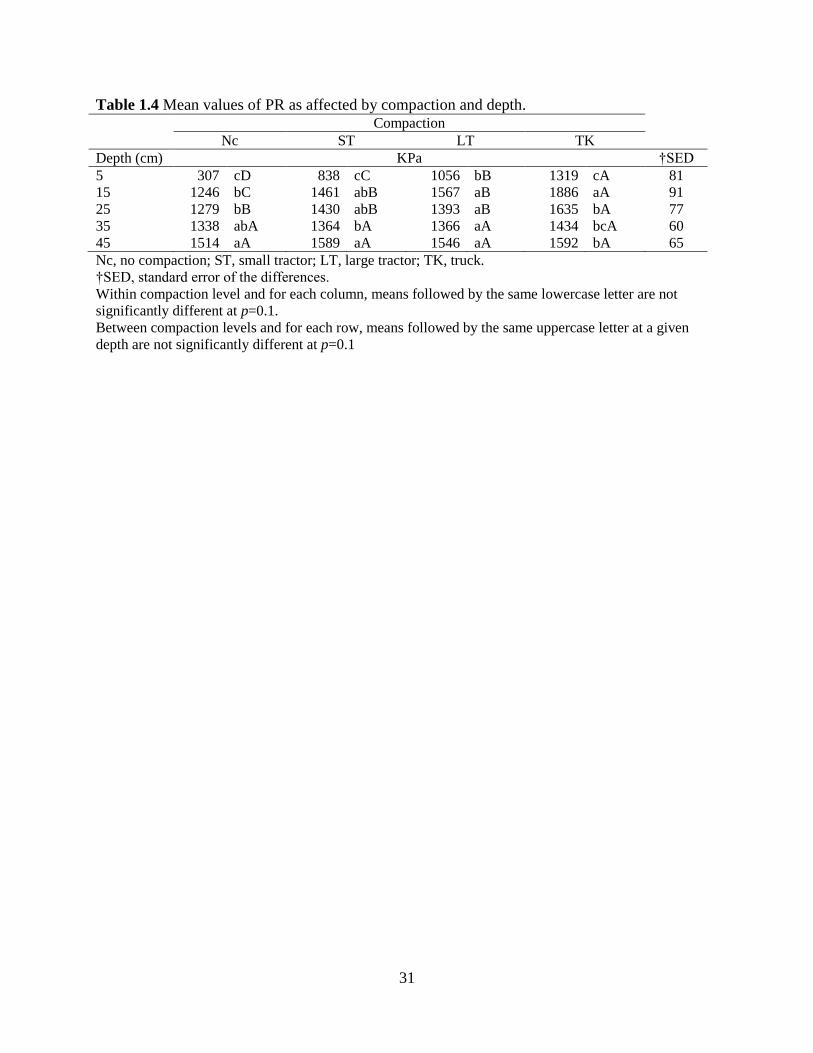
depth (Table 1.3). A similar trend was observed for penetration resistance (PR) values. After
compaction PR showed significant differences for the interaction of compaction level and depth
(p<0.0001), and main effects compaction level (p<0.0116) and depth (p<0.0325). TK achieved
the highest PR values in the top 30cm. After the 30cm depth there were no significant
differences in PR (Table 1.4). Though the highest values were observed in the Nc treatment,
water aggregate stability (WAS) values showed no significant differences after the compaction
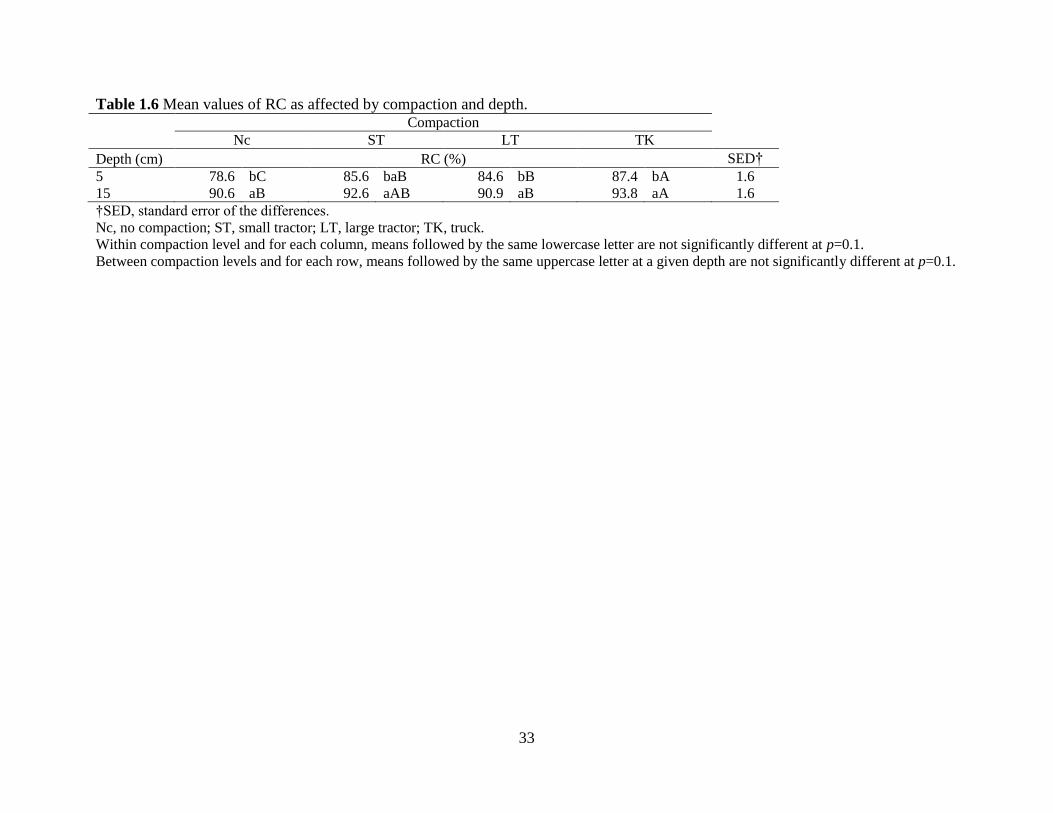
treatments for the interactions or the main effects (Table 1.5). Relative compaction (RC) was
19
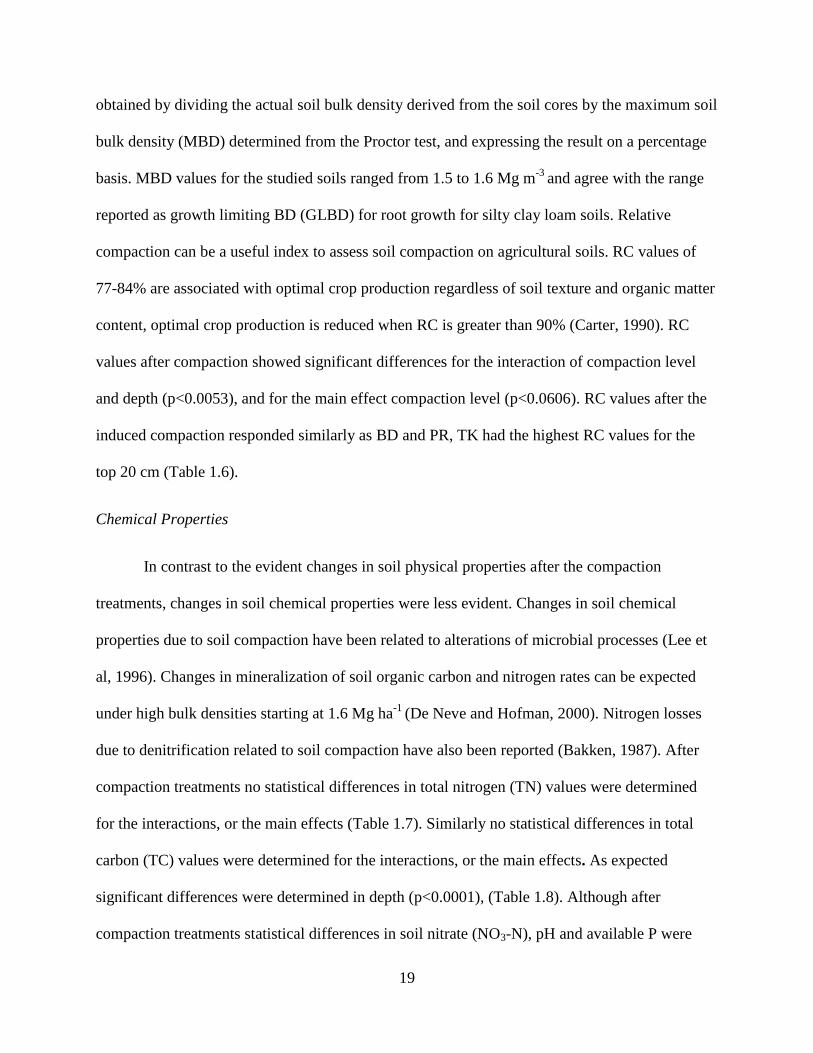
obtained by dividing the actual soil bulk density derived from the soil cores by the maximum soil
bulk density (MBD) determined from the Proctor test, and expressing the result on a percentage
basis. MBD values for the studied soils ranged from 1.5 to 1.6 Mg m-3
and agree with the range
reported as growth limiting BD (GLBD) for root growth for silty clay loam soils. Relative
compaction can be a useful index to assess soil compaction on agricultural soils. RC values of
77-84% are associated with optimal crop production regardless of soil texture and organic matter
content, optimal crop production is reduced when RC is greater than 90% (Carter, 1990). RC
values after compaction showed significant differences for the interaction of compaction level
and depth (p<0.0053), and for the main effect compaction level (p<0.0606). RC values after the
induced compaction responded similarly as BD and PR, TK had the highest RC values for the
top 20 cm (Table 1.6).
Chemical Properties
In contrast to the evident changes in soil physical properties after the compaction
treatments, changes in soil chemical properties were less evident. Changes in soil chemical
properties due to soil compaction have been related to alterations of microbial processes (Lee et
al, 1996). Changes in mineralization of soil organic carbon and nitrogen rates can be expected
under high bulk densities starting at 1.6 Mg ha-1
(De Neve and Hofman, 2000). Nitrogen losses
due to denitrification related to soil compaction have also been reported (Bakken, 1987). After
compaction treatments no statistical differences in total nitrogen (TN) values were determined
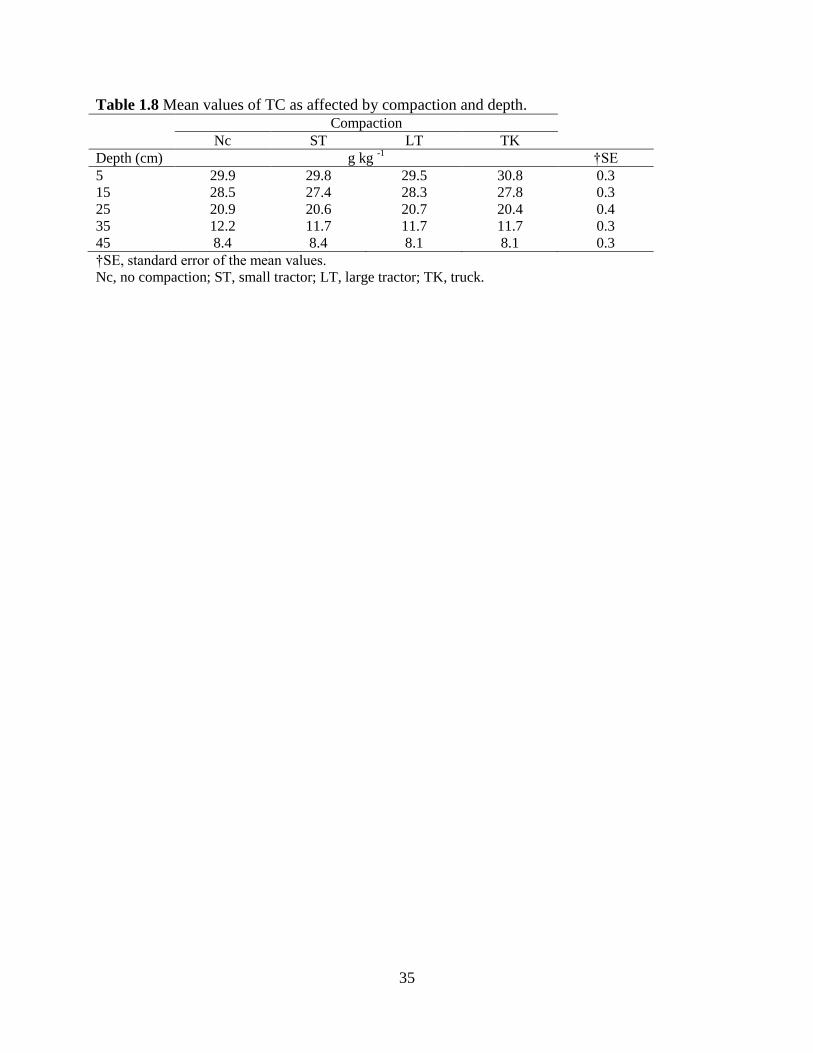
for the interactions, or the main effects (Table 1.7). Similarly no statistical differences in total
carbon (TC) values were determined for the interactions, or the main effects. As expected
significant differences were determined in depth (p<0.0001), (Table 1.8). Although after
compaction treatments statistical differences in soil nitrate (NO3-N), pH and available P were

20
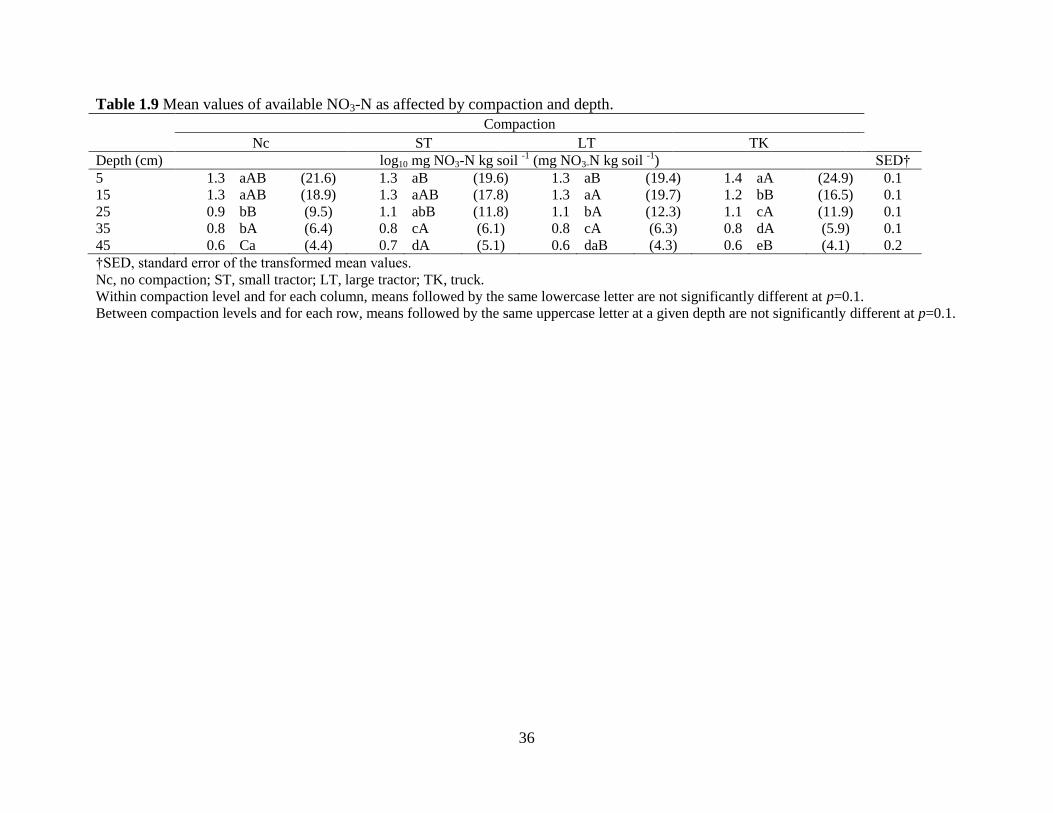
determined the magnitude of these differences had no agronomic importance. Soil nitrate values
showed a significant differences for the interaction of compaction level and depth (P<0.0008)
and the main effect depth (p<0.0001). Differences across compaction levels did not show a clear
trend across treatments. Soil nitrate levels decreased with depth (Table 1.9). Likewise, soil pH
values showed differences for the compaction level and depth interaction (P<0.0008) and for the
main effect depth (p<0.0001). Values of pH were slightly higher in the compacted treatments in
comparison to the control in the top 20 cm. After the 20 cm depth there were no differences in
soil pH. Soil pH increased with depth (Table 1.10). In addition, soil available P showed a
significant interaction effect between compaction level and depth (p<0.0640) and for the main
effect depth (p<0.0806). Average Bray P1 test levels in this experiment decreased with depth
(Table 1.11).
Cover crop establishment and biomass production
Cover crops (WCC) were established successfully on both years of this study. Buckwheat
was the most susceptible to cold temperatures and was killed by the first frosts on both years.
The cover crops that successfully overwintered were rye, triticale and hairy vetch. Radish was
intermediate in cold hardiness but did not overwinter. The differences in the length of the WCC
growing season help explain differences in biomass production and in turn may explain
differences between the studied variables. WCC biomass production was measured before soil
sampling at the end of the cover crop growing season and before planting the soybean crop and
serves as a measure of success of the different cover crops (Table 1.12). For the cover crops that
did not over winter biomass at sampling was negligible. There were no significant differences on
cover crop biomass due to compaction levels or interactions between cover crop and compaction
level (data not shown).

21
Changes in Soil Physical Properties after Winter Cover crops
Optimal bulk-density values refer to maximum root growth or crop yield, and GLBD
values refer to conditions where root growth is stopped or reduced to some 20% of the maximum
(Kaufmann, 2010). The optimal BD for root growth in fine textured soils is in the order of 0.8 to
1.2 Mg m-3
(Reynolds et al., 2002) and the GLBD for the soils in this study (silty clay loam,
averages of 13% sand, 57% silt, and 29% clay) is between 1.50 and 1.55 Mg m-3
(USDA-NRCS,
1996). After the WCC growing season, no significant differences were determined for BD for the
interactions between cover crops and compaction levels or the main effects except depth
(p<0.0027) for both environments (Table 1.13). As expected lower bulk densities were found at
the surface 10cm and increased in depth. This difference in bulk density in depth is due to greater
additions of organic residues and greater activity of micro and macro fauna and roots in the
topsoil. BD values were near the optimal bulk density for all the treatments including the NCOV,
and all BD values also decreased in comparison to the values reported right after the compaction
treatments were imposed. We expected to find greater differences in BD in the top layers of the
soil profile after WCC but the lack of significant differences can be explained at least partly, by
the seed bed preparation tillage needed to establish the WCC. It is also important to point out
that prior to our experiment the fields were on winter wheat and immediately after harvest the
stubble was incorporated with tillage, mixing organic residues in the top 20 cm of soil. Addition
of organic matter to the topsoil through incorporation of plant residues has been widely studied
and it is known to improve bulk density and soil porosity (Soane, 1990; Zhang, 1994; Hamza and
Anderson, 2005). Lastly, Drummer soils are characterized by having a high content of highly
expandable smectitic clays in the topsoil (Soil Survey Staff, 2012) that experience important
shrink-swell cycles with changes in water content. We believe that the shrink swell and wet dry
22
cycles in the topsoil of the studied plots, along with the inherently high levels of soil organic
matter plus the residues added via the previous wheat crop, played a significant role in the high
resilience showed by these soils to applied compaction.
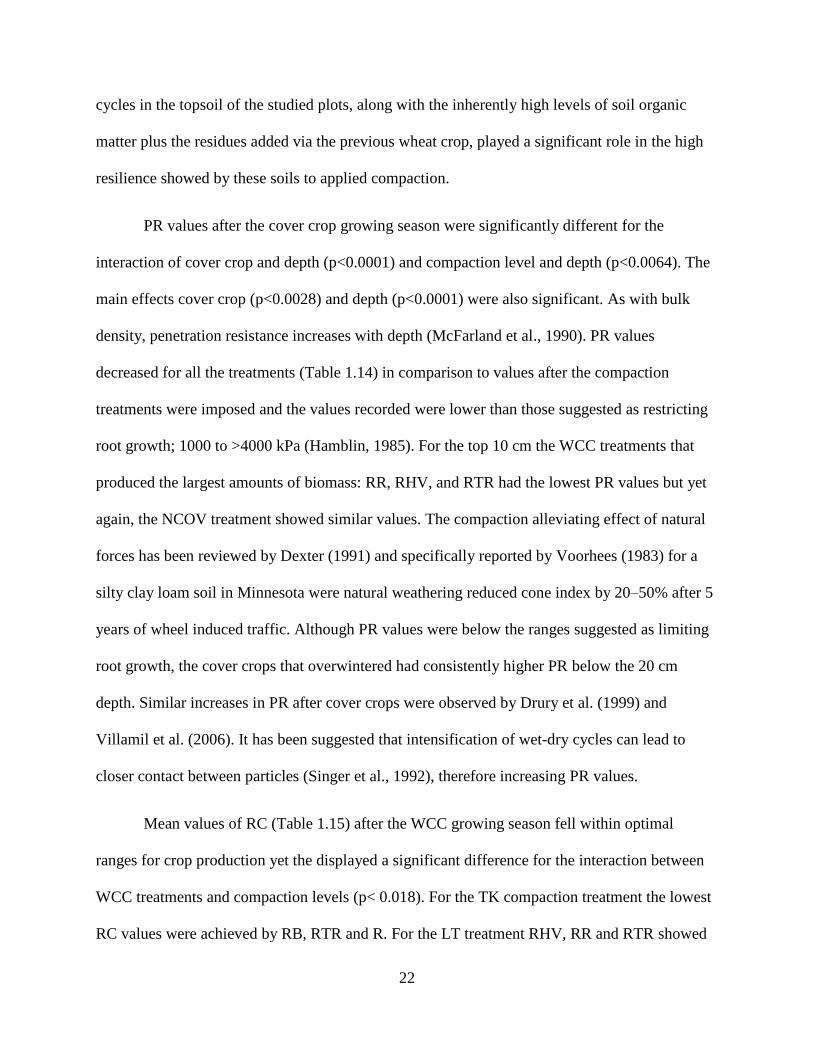
PR values after the cover crop growing season were significantly different for the
interaction of cover crop and depth (p<0.0001) and compaction level and depth (p<0.0064). The
main effects cover crop (p<0.0028) and depth (p<0.0001) were also significant. As with bulk
density, penetration resistance increases with depth (McFarland et al., 1990). PR values
decreased for all the treatments (Table 1.14) in comparison to values after the compaction
treatments were imposed and the values recorded were lower than those suggested as restricting
root growth; 1000 to >4000 kPa (Hamblin, 1985). For the top 10 cm the WCC treatments that
produced the largest amounts of biomass: RR, RHV, and RTR had the lowest PR values but yet
again, the NCOV treatment showed similar values. The compaction alleviating effect of natural
forces has been reviewed by Dexter (1991) and specifically reported by Voorhees (1983) for a
silty clay loam soil in Minnesota were natural weathering reduced cone index by 20–50% after 5
years of wheel induced traffic. Although PR values were below the ranges suggested as limiting
root growth, the cover crops that overwintered had consistently higher PR below the 20 cm
depth. Similar increases in PR after cover crops were observed by Drury et al. (1999) and
Villamil et al. (2006). It has been suggested that intensification of wet-dry cycles can lead to
closer contact between particles (Singer et al., 1992), therefore increasing PR values.
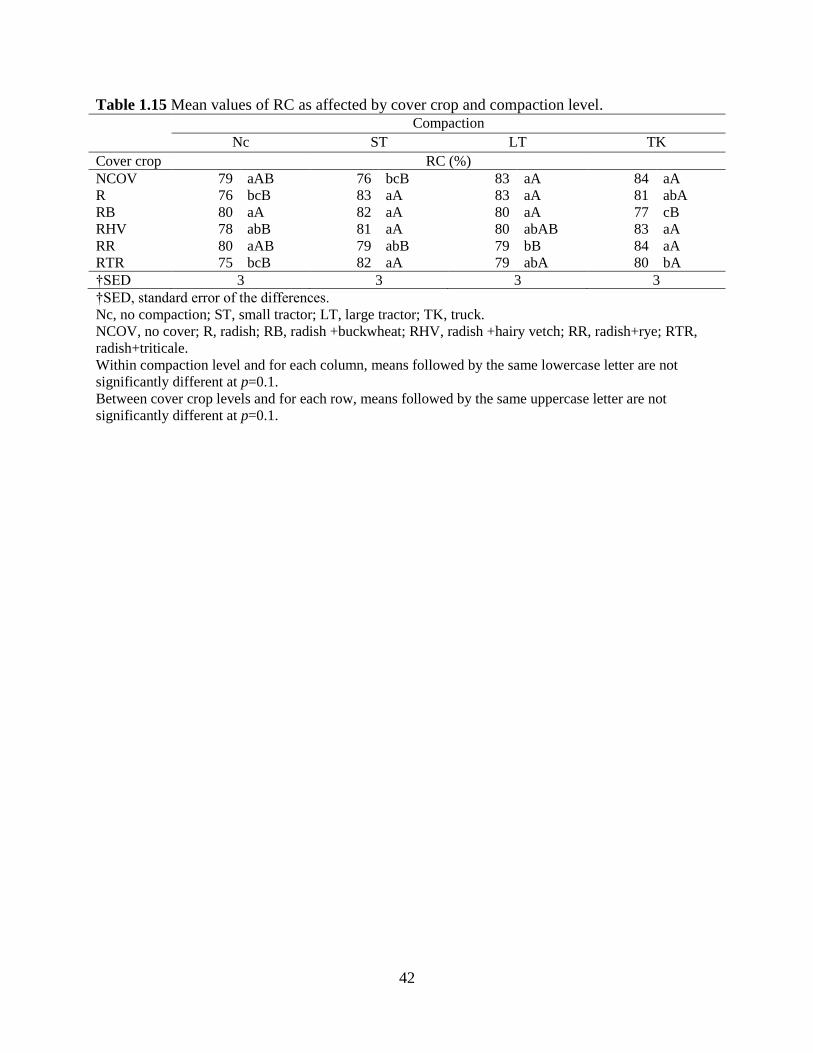
Mean values of RC (Table 1.15) after the WCC growing season fell within optimal
ranges for crop production yet the displayed a significant difference for the interaction between
WCC treatments and compaction levels (p< 0.018). For the TK compaction treatment the lowest
RC values were achieved by RB, RTR and R. For the LT treatment RHV, RR and RTR showed
23
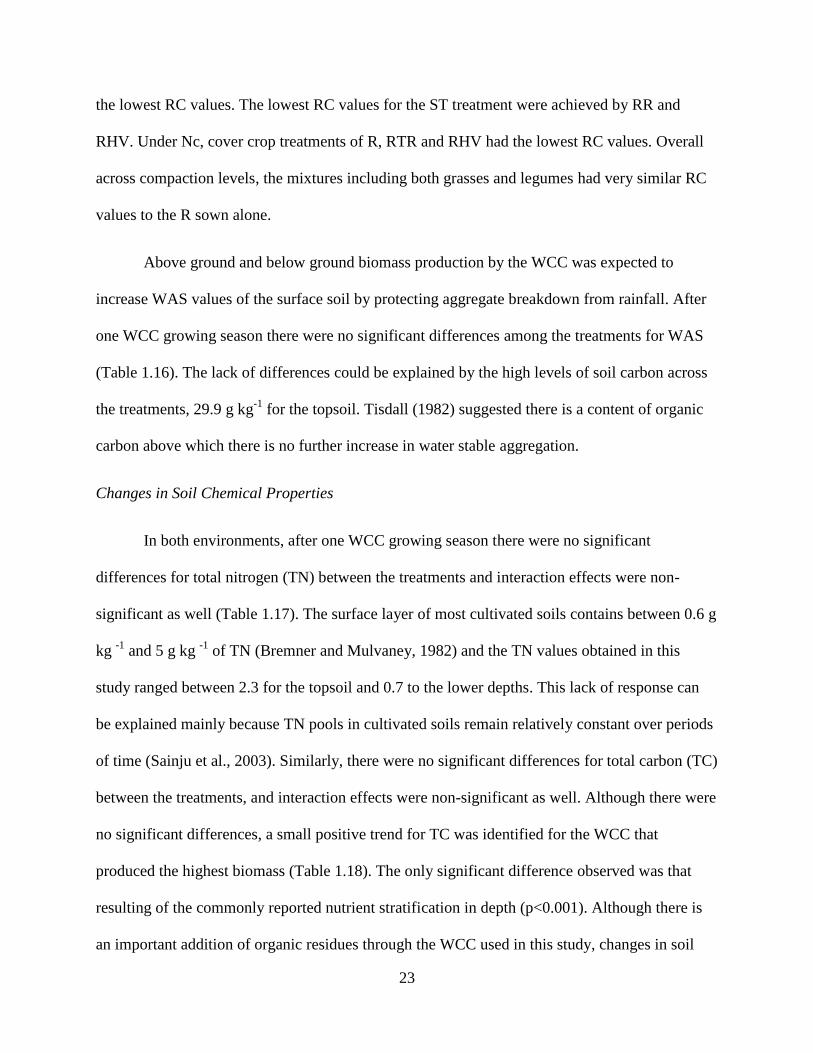
the lowest RC values. The lowest RC values for the ST treatment were achieved by RR and
RHV. Under Nc, cover crop treatments of R, RTR and RHV had the lowest RC values. Overall
across compaction levels, the mixtures including both grasses and legumes had very similar RC
values to the R sown alone.
Above ground and below ground biomass production by the WCC was expected to
increase WAS values of the surface soil by protecting aggregate breakdown from rainfall. After
one WCC growing season there were no significant differences among the treatments for WAS
(Table 1.16). The lack of differences could be explained by the high levels of soil carbon across
the treatments, 29.9 g kg-1
for the topsoil. Tisdall (1982) suggested there is a content of organic
carbon above which there is no further increase in water stable aggregation.
Changes in Soil Chemical Properties
In both environments, after one WCC growing season there were no significant
differences for total nitrogen (TN) between the treatments and interaction effects were non-
significant as well (Table 1.17). The surface layer of most cultivated soils contains between 0.6 g
kg -1
and 5 g kg -1
of TN (Bremner and Mulvaney, 1982) and the TN values obtained in this
study ranged between 2.3 for the topsoil and 0.7 to the lower depths. This lack of response can
be explained mainly because TN pools in cultivated soils remain relatively constant over periods
of time (Sainju et al., 2003). Similarly, there were no significant differences for total carbon (TC)
between the treatments, and interaction effects were non-significant as well. Although there were
no significant differences, a small positive trend for TC was identified for the WCC that
produced the highest biomass (Table 1.18). The only significant difference observed was that
resulting of the commonly reported nutrient stratification in depth (p<0.001). Although there is
an important addition of organic residues through the WCC used in this study, changes in soil

24
TC are more commonly reported in long-term experiments. After 6 years of a corn (Zea mays L.)
rotation including several leguminous and non-leguminous cover crops in Washington, cereal rye
and annual ryegrass (Lolium multiflorum Lam.) were observed to increase soil TC levels (Kuo,
1997). However in southern Illinois on a moderately eroded Typic Fragiudalfs no differences in
soil TC were determined after 8 years of a corn-soybean rotation with or without cover crops
(Olson, 2010). The Drummer soil has a naturally high level of total C and total N and relatively
small increases of C and N associated with WCC would likely go undetected except in a stable
long-term study. Similar results were reported by Ebehlar (1984) and Villamil (2006).
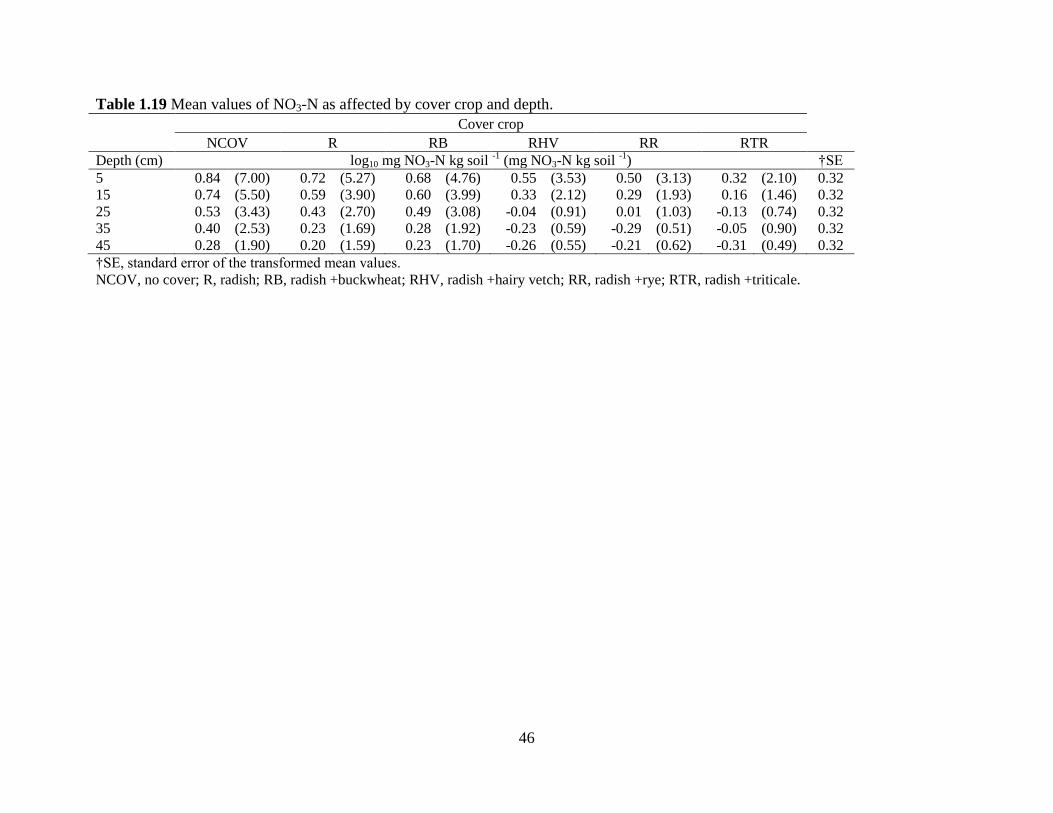
After one WCC growing season in both environments, there were no significant
differences for soil nitrates (NO3-N) between the treatments; interaction effects were non-
significant as well (Table 1.19). As no nitrogen source was used in this experiment, existing
levels of soil nitrates are attributed to mineralization of the organic matter, residual nitrates from
the nitrogen fertilization of the previous wheat crop, and to whereas differences in the
scavenging abilities of the WCC. We did not expect to find differences related to residual
nitrogen effects after wheat because in Illinois wheat is fertilized in late winter or early spring of
the previous year (Illinois Agronomy Handbook, 2009). In the present study, results of soil pH
ranged between 5.4 and 5.8 for the top 10 cm with values increased in depth (Table 1.20). The
lower pH was found at the surface soil which might be associated with residual effects of
nitrogen fertilization of the previous winter wheat crop. Significant differences were observed
for the three way interaction between cover crop, compaction level and depth (p<0.0008) and
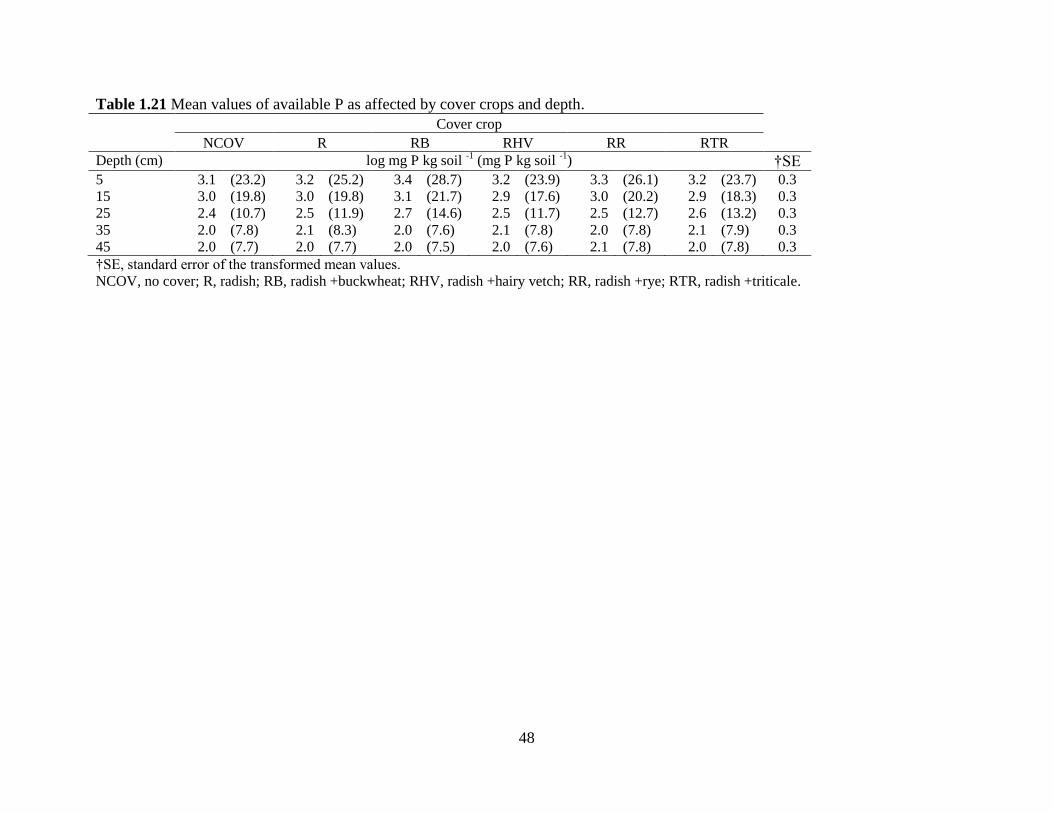
cover crop and depth (p<0.0539) and for the main effect depth (p<0.044). Although reductions
on available soil P with the use of WCC have been reported for legumes and grasses (McVay et
al., 1989; Eckert, 1991; Villamil et al., 2006) no significant differences were determined in this
25
study. Soil available P values after WCC showed no significant differences for the interaction or
the main effects of compaction and cover crop treatments, yet as expected, P values decreased
with increasing depths (P<0.0470). Available P levels found in the topsoil are considered in the
high supply range for corn and soybean production in IL according to the Illinois Agronomy
Handbook (Nafziger, 2004) (Table 1.21).
CONCLUSION
This work provides needed and currently lacking information regarding the potential
alleviation effect of WCC on imposed soil compaction treatments and their contribution to soil
general fertility. It is the first study in Illinois and in the Midwest region that shows the effect of
selected WCC mixtures including Brassicas sp. on short term soil physical and chemical
properties. Despite research on cover crops, reporting positive effects on soil properties, adoption
rates within the corn-soybean rotation in the Corn Belt, at least as measured by observation of
fields after harvest in the fall, remains low. Recent interest in cover crops has been gauged by
press articles, promotional efforts, and brochures from companies who sell cover crop seed or
provide services such as aerial seeding. In many of these efforts, cover crop benefits are
exaggerated –and disadvantages minimized- to the point of being regarded as a ‘silver-bullets’
fast acting solutions to agricultural problems. Though the use of cover crops might be desirable
in many situations, increased adoption on these terms may prove counterproductive. Changes in
in soil properties and cropping systems do not occur overnight. As soil compaction, the effects of
cover crops on soil properties are build-up processes that take time to become evident or
26
measurable. Results from this study show that one growing season is not enough time to
evidence changes in the soil related to the incorporation of cover crops in the rotation. Although
WCC did not differ from the control in improving soil physical properties in both environments,
management practices that maintain or increase soil carbon through additions of organic residues
will help soil resilience to compaction. Further research is needed on the use of WCC as soil
compaction management tool in stabilized corn-soybean-WCC rotations especially in fields with
persistent compaction problems.

27
TABLES AND FIGURES
Percent Sand
0
10
20
30
40
50
60
70
80
90
100
Percent Silt
0
10
20
30
40
50
60
70
80
90
100
Percent Clay
0102030405060708090100
Silty clay
Silty clay loam
Silt loam
Silt
Loam
Sandy loam
Loamy
sandSand
Clay loam
Clay
Sandy clay loam
Sandy
clay
Figure 1.1 Textural triangle showing the percentages by weight of clay (<0.002-mm), silt
(0.002-0.05-mm), and sand (0.05-2mm) separates of the studied soils in the conventional USDA
soil textural classes.

28
Table 1.1 Mean values of particle size separates for cover crops and compaction treatments. Particle size separate (g kg
-1)
Sand Silt Clay
Cover crop
NCOV 14.0 56.7 24.2
R 11.8 57.9 25.4
RB 12.2 58.4 24.3
RHV 13.3 56.9 24.6
RR 13.2 57.2 24.6
RTR 12.1 57.7 25.3
SE† 2.00 0.67 1.02
Compaction
Nc 13.0 57.2 25.3
ST 12.1 58.5 24.3
LT 13.1 56.8 25.5
TK 13.0 57.4 23.8
SE† 1.90 0.49 1.09
NCOV, no cover; R, radish; RB, radish+buckwheat; RHV, radish +hairy vetch; RR, radish+rye; RTR,
radish+triticale.
Nc, no compaction; ST, small tractor; LT, large tractor; TK, truck.
†SE, standard error of mean.

29
Table 1.2 Additional characterization of the sand and silt size separates.
Sand size fraction Silt fraction ¶VCoS CoS MS FS VFS CoSi FSi
Cover crop g kg-1
g kg-1
NCOV 1.0 1.5 3.8 3.7 1.0 16.6 40.1
R 0.6 1.2 3.1 3.1 0.9 16.7 41.3
RB 0.8 1.3 3.2 3.1 0.9 17.1 41.3
RHV 0.9 1.5 3.6 3.4 0.9 16.6 40.3
RR 0.8 1.4 3.5 3.5 1.0 17.3 39.8
RTR 0.8 1.4 3.3 3.1 0.9 16.6 41.2
SE† 0.3 0.5 1.5 1.9 0.5 0.5 0.6
Compaction
Nc 0.8 1.4 3.5 3.4 1.0 16.2 40.9
ST 0.8 1.3 3.2 3.0 0.8 17.3 41.3
LT 0.8 1.4 3.5 3.5 1.0 16.9 39.9
TK 0.9 1.4 3.6 3.4 1.0 16.9 40.5
SE† 0.3 0.5 1.5 1.9 0.5 0.6 0.7
¶Vcos, very coarse sand; CoS, coarse sand; MS, medium sand; FS, fine sand; VFS, very fine sand; CoSi, coarse silt, and FSi, fine silt.
NCOV, no cover; R, radish; RB, radish+buckwheat; RHV, radish+hairy vetch; RR, radish+rye; RTR, radish+triticale.
Nc, no compaction; ST, small tractor; LT, large tractor; TK, truck.
†SE, standard error of mean.
30
Table 1.3 Mean values of BD as affected by compaction and depth. Compaction
Nc ST LT TK
Depth (cm) Mg m-3
†SED
5 1.13 cC 1.23 bAB 1.22 bB 1.27 bA 0.02
15 1.38 bB 1.39 aAB 1.37 aB 1.42 aA 0.01
25 1.44 abA 1.40 aB 1.43 aAB 1.44 aA 0.01
35 1.43 abA 1.45 aA 1.43 aA 1.42 aA 0.01
45 1.45 Aa 1.42 aA 1.44 aA 1.44 aA 0.01
Nc, no compaction; ST, small tractor; LT, large tractor; TK, truck.
†SED, standard error of the differences.
Within compaction level and for each column, means followed by the same lowercase letter are not
significantly different at p=0.1.
Between compaction levels and for each row, means followed by the same uppercase letter at a given
depth are not significantly different at p=0.1.
31
Table 1.4 Mean values of PR as affected by compaction and depth. Compaction
Nc ST LT TK
Depth (cm) KPa †SED
5 307 cD 838 cC 1056 bB 1319 cA 81
15 1246 bC 1461 abB 1567 aB 1886 aA 91
25 1279 bB 1430 abB 1393 aB 1635 bA 77
35 1338 abA 1364 bA 1366 aA 1434 bcA 60
45 1514 aA 1589 aA 1546 aA 1592 bA 65
Nc, no compaction; ST, small tractor; LT, large tractor; TK, truck.
†SED, standard error of the differences.
Within compaction level and for each column, means followed by the same lowercase letter are not
significantly different at p=0.1.
Between compaction levels and for each row, means followed by the same uppercase letter at a given
depth are not significantly different at p=0.1

32
Table 1.5 Mean values of WAS as affected by compaction and depth. Compaction
Nc ST LT TK
Depth (cm) WAS2 (%)
5 7396 (86) 6724 (82) 6889 (83) 6889 (83)
15 7225 (85) 7225 (85) 6724 (82) 6724 (82)
SE† 594 767 594 594
†SE, standard error of the transformed mean values.
Nc, no compaction; ST, small tractor; LT, large tractor; TK, truck.
33
Table 1.6 Mean values of RC as affected by compaction and depth. Compaction
Nc ST LT TK
Depth (cm) RC (%) SED†
5 78.6 bC 85.6 baB 84.6 bB 87.4 bA 1.6
15 90.6 aB 92.6 aAB 90.9 aB 93.8 aA 1.6
†SED, standard error of the differences.
Nc, no compaction; ST, small tractor; LT, large tractor; TK, truck.
Within compaction level and for each column, means followed by the same lowercase letter are not significantly different at p=0.1.
Between compaction levels and for each row, means followed by the same uppercase letter at a given depth are not significantly different at p=0.1.

34
Table 1.7 Mean values of TN as affected by compaction and depth. Compaction
Nc ST LT TK
Depth (cm) g kg -1
†SE
5 2.3 2.2 2.2 2.3 0.1
15 2.2 2.0 2.2 2.2 0.1
25 1.7 1.6 1.6 1.6 0.1
35 0.9 0.9 0.9 0.9 0.1
45 0.7 0.7 0.7 0.7 0.1
†SE, standard error of the mean values.
Nc, no compaction; ST, small tractor; LT, large tractor; TK, truck.
35
Table 1.8 Mean values of TC as affected by compaction and depth. Compaction
Nc ST LT TK
Depth (cm) g kg -1
†SE
5 29.9 29.8 29.5 30.8 0.3
15 28.5 27.4 28.3 27.8 0.3
25 20.9 20.6 20.7 20.4 0.4
35 12.2 11.7 11.7 11.7 0.3
45 8.4 8.4 8.1 8.1 0.3
†SE, standard error of the mean values.
Nc, no compaction; ST, small tractor; LT, large tractor; TK, truck.
36
Table 1.9 Mean values of available NO3-N as affected by compaction and depth.
Compaction
Nc ST LT TK Depth (cm) log10 mg NO3-N kg soil
-1 (mg NO3-N kg soil
-1) SED†
5 1.3 aAB (21.6) 1.3 aB (19.6) 1.3 aB (19.4) 1.4 aA (24.9) 0.1
15 1.3 aAB (18.9) 1.3 aAB (17.8) 1.3 aA (19.7) 1.2 bB (16.5) 0.1
25 0.9 bB (9.5) 1.1 abB (11.8) 1.1 bA (12.3) 1.1 cA (11.9) 0.1
35 0.8 bA (6.4) 0.8 cA (6.1) 0.8 cA (6.3) 0.8 dA (5.9) 0.1
45 0.6 Ca (4.4) 0.7 dA (5.1) 0.6 daB (4.3) 0.6 eB (4.1) 0.2
†SED, standard error of the transformed mean values.
Nc, no compaction; ST, small tractor; LT, large tractor; TK, truck.
Within compaction level and for each column, means followed by the same lowercase letter are not significantly different at p=0.1.
Between compaction levels and for each row, means followed by the same uppercase letter at a given depth are not significantly different at p=0.1.

37
Table 1.10 Mean values of pH as affected by compaction and depth. Compaction
Nc ST LT TK
Depth (cm) pH SED†
5 5.3 dB 5.4 dAB 5.4 dA 5.4 cA 0.03
15 5.6 cB 5.8 cA 5.7 cAB 5.7 cAB 0.04
25 6.0 bA 5.9 bcA 5.9 cA 5.9 bcA 0.02
35 6.2 bA 6.2 bA 6.3 bA 6.2 bA 0.03
45 6.5 aBC 6.5 aBC 6.6 aB 6.7 aA 0.05
SE† 0.1
†SED, standard error of the differences.
†SE, standard error of the mean values.
Within compaction level and for each column, means followed by the same lowercase letter are not significantly different at p=0.1.
Between compaction levels and for each row, means followed by the same uppercase letter at a given depth are not significantly different at p=0.1.
Nc, no compaction; ST, small tractor; LT, large tractor; TK, truck.

38
Table 1.11 Mean values of available P as affected by compaction and depth.
Compaction
Nc ST LT TK Depth (cm) log mg P kg soil
-1 (mg P kg soil
-1) SED†
5 3.5 aA (32.7) 3.6 aA (35.4) 3.5 aA (32.9) 3.5 aA (33.2) 0.1
15 3.0 abAB (20.8) 2.9 aB (17.3) 3.2 aA (24.3) 3.0 aB (19.6) 0.1
25 2.2 abAB (9.1) 2.4 abB (11.4) 2.3 abA (10.0) 2.1 bB (8.2) 0.1
35 1.9 bA (6.7) 1.9 bA (6.5) 1.8 bA (6.0) 1.7 bA (5.7) 0.1
45 1.5 aB (4.5) 1.2 bA (3.4) 1.4 bA (4.0) 1.4 bA (4.0) 0.2
†SED, standard error of the transformed mean values.
Nc, no compaction; ST, small tractor; LT, large tractor; TK, truck.
Within compaction level and for each column, means followed by the same lowercase letter are not significantly different at p=0.1.
Between compaction levels and for each row, means followed by the same uppercase letter at a given depth are not significantly different at p=0.1

39
Table 1.12 Winter cover crop aboveground biomass before termination.
WCC dry biomass
RR RTR RHV Growing season Mg ha
-1 SED† 2010-2011 8.66 8.15 2.29 0.38
2011-2012 6.05 5.96 4.03 0.35
†SED, standard error of the mean values.
RHV, radish +hairy vetch; RR, radish+rye; RTR, radish+triticale.

40
Table 1.13 Mean values of BD after cover crop growing season for cover crop level and depth. Cover crop
NCOV R RB RHV RR RTR
Depth (cm) Mg m-3
5 1.15 1.16 1.15 1.13 1.14 1.15
15 1.30 1.27 1.29 1.23 1.23 1.23
25 1.34 1.32 1.29 1.26 1.29 1.27
35 1.33 1.33 1.30 1.25 1.28 1.29
45 1.35 1.33 1.33 1.27 1.32 1.29
SE† 0.03
†SE, standard error of the mean values.
NCOV, no cover; R, radish; RB, radish +buckwheat; RHV, radish +hairy vetch; RR, radish+rye; RTR, radish+triticale.

41
Table 1.14 Mean values of PR after cover crop growing season for cover crop level and depth.
Cover crop
NCOV R RB RHV RR RTR
Depth (cm) kPa †SED
5 447 dB 576 dA 655 cA 467 dB 370 eB 417 eB 81
15 917 cBC 906 cC 1027 baB 1385 cA 981 dB 1223 dA 106
25 1087 bB 1006 bB 1031 bB 1714 abA 1418 cA 1700 cA 150
35 1210 bC 1122 bC 1122 bC 1680 bB 1555 bB 1901 bA 132
45 1384 aC 1311 aC 1288 aC 1818 aB 1734 aB 2098 aA 120
†SED, standard error of the differences.
NCOV, no cover; R, radish; RB, radish +buckwheat; RHV, radish +hairy vetch; RR, radish+rye; RTR, radish+triticale.
Within cover level and for each column, means followed by the same lowercase letter are not significantly different at p=0.1.
Between cover levels and for each row, means followed by the same uppercase letter at a given depth are not significantly different at p=0.1.
42
Table 1.15 Mean values of RC as affected by cover crop and compaction level.
Compaction
Nc ST LT TK
Cover crop RC (%) NCOV 79 aAB 76 bcB 83 aA 84 aA
R 76 bcB 83 aA 83 aA 81 abA
RB 80 aA 82 aA 80 aA 77 cB
RHV 78 abB 81 aA 80 abAB 83 aA
RR 80 aAB 79 abB 79 bB 84 aA
RTR 75 bcB 82 aA 79 abA 80 bA
†SED 3 3 3 3
†SED, standard error of the differences.
Nc, no compaction; ST, small tractor; LT, large tractor; TK, truck.
NCOV, no cover; R, radish; RB, radish +buckwheat; RHV, radish +hairy vetch; RR, radish+rye; RTR,
radish+triticale.
Within compaction level and for each column, means followed by the same lowercase letter are not
significantly different at p=0.1.
Between cover crop levels and for each row, means followed by the same uppercase letter are not
significantly different at p=0.1.

43
Table 1.16 Mean values of WAS as affected by cover crop and depth.
Cover crop
Nc R RB RHV RR RTR
Depth (cm) WAS2 (%)
5 6838 (83) 6395 (80) 6423 (80) 6423 (82) 6537 (81) 6700 (82)
15 7157 (85) 7702 (88) 7038 (84) 7776 (88) 7870 (89) 7762 (88)
SE† 797 †SE, standard error of the transformed mean values.
NCOV, no cover; R, radish; RB, radish +buckwheat; RHV, radish +hairy vetch; RR, radish +rye; RTR, radish +triticale.

44
Table 1.17 Mean values of TN as affected by compaction and depth. Cover crop
NCOV R RB RHV RR RTR
Depth (cm) g kg -1
†SE
5 2.2 2.3 2.4 2.3 2.2 2.3 0.1
15 2.0 2.0 2.1 2.1 2.1 2.1 0.1
25 1.6 1.7 1.6 1.6 1.7 1.7 0.1
35 0.9 0.9 0.9 0.9 0.9 0.9 0.1
45 0.7 0.7 0.7 0.7 0.7 0.7 0.1
†SE, standard error of the transformed mean values.
NCOV, no cover; R, radish; RB, radish +buckwheat; RHV, radish +hairy vetch; RR, radish +rye; RTR,
radish +triticale.

45
Table 1.18 Mean values of TC as affected by compaction and depth. Cover crop
NCOV R RB RHV RR RTR
Depth (cm) g kg -1
†SE
5 29.0 28.9 30.8 30.2 29.9 30.3 1.1
15 26.6 26.5 28.2 28.7 28.1 28.2 1.3
25 20.1 21.0 20.4 20.3 21.2 21.5 1.5
35 11.1 11.8 10.7 11.6 11.7 11.9 1.0
45 8.5 7.9 7.4 7.8 8.8 7.9 0.9
†SE, standard error of the transformed mean values.
NCOV, no cover; R, radish; RB, radish +buckwheat; RHV, radish +hairy vetch; RR, radish +rye; RTR,
radish +triticale
46
Table 1.19 Mean values of NO3-N as affected by cover crop and depth.
Cover crop
NCOV R RB RHV RR RTR Depth (cm) log10 mg NO3-N kg soil
-1 (mg NO3-N kg soil
-1) †SE
5 0.84 (7.00) 0.72 (5.27) 0.68 (4.76) 0.55 (3.53) 0.50 (3.13) 0.32 (2.10) 0.32
15 0.74 (5.50) 0.59 (3.90) 0.60 (3.99) 0.33 (2.12) 0.29 (1.93) 0.16 (1.46) 0.32
25 0.53 (3.43) 0.43 (2.70) 0.49 (3.08) -0.04 (0.91) 0.01 (1.03) -0.13 (0.74) 0.32
35 0.40 (2.53) 0.23 (1.69) 0.28 (1.92) -0.23 (0.59) -0.29 (0.51) -0.05 (0.90) 0.32
45 0.28 (1.90) 0.20 (1.59) 0.23 (1.70) -0.26 (0.55) -0.21 (0.62) -0.31 (0.49) 0.32
†SE, standard error of the transformed mean values.
NCOV, no cover; R, radish; RB, radish +buckwheat; RHV, radish +hairy vetch; RR, radish +rye; RTR, radish +triticale.

47
Table 1.20 Mean values of pH after cover crop growing season for cover crop level and depth. Cover crop
NCOV R RB RHV RR RTR
Depth (cm) pH †SED
5 5.5 bA 5.6 bA 5.5 bA 5.5 bA 5.5 bA 5.6 bA 0.1
15 5.7 bAB 5.7 bAB 5.7 bAB 5.8 bA 5.5 bB 5.7 bAB 0.1
25 5.8 bA 5.7 bA 5.7 bA 5.8 bA 5.9 bA 5.8 bA 0.1
35 6.2 abA 6.2 aA 6.2 aA 6.2 aA 6.1 abA 6.1 abA 0.1
45 6.3 aA 6.2 aA 6.3 aA 6.2 aA 6.3 aA 6.2 aA 0.1
†SED, standard error of the differences.
NCOV, no cover; R, radish; RB, radish +buckwheat; RHV, radish +hairy vetch; RR, radish+rye; RTR, radish+triticale.
Within cover level and for each column, means followed by the same lowercase letter are not significantly different at p=0.1.
Between cover levels and for each row, means followed by the same uppercase letter at a given depth are not significantly different at p=0.1.
48
Table 1.21 Mean values of available P as affected by cover crops and depth.
Cover crop
NCOV R RB RHV RR RTR Depth (cm) log mg P kg soil
-1 (mg P kg soil
-1) †SE
5 3.1 (23.2) 3.2 (25.2) 3.4 (28.7) 3.2 (23.9) 3.3 (26.1) 3.2 (23.7) 0.3
15 3.0 (19.8) 3.0 (19.8) 3.1 (21.7) 2.9 (17.6) 3.0 (20.2) 2.9 (18.3) 0.3
25 2.4 (10.7) 2.5 (11.9) 2.7 (14.6) 2.5 (11.7) 2.5 (12.7) 2.6 (13.2) 0.3
35 2.0 (7.8) 2.1 (8.3) 2.0 (7.6) 2.1 (7.8) 2.0 (7.8) 2.1 (7.9) 0.3
45 2.0 (7.7) 2.0 (7.7) 2.0 (7.5) 2.0 (7.6) 2.1 (7.8) 2.0 (7.8) 0.3
†SE, standard error of the transformed mean values.
NCOV, no cover; R, radish; RB, radish +buckwheat; RHV, radish +hairy vetch; RR, radish +rye; RTR, radish +triticale.

49
REFERENCES
Amezketa, E.1999. Soil aggregate stability: A review. J. Sustain. Agric. 14: 83-151.
Andrade, A., Wolfe, D.W., and Fereres, E. 1993. Leaf expansion, photosynthesis and water
relations of sunflower plants grown on compacted soil. Plant Soil 149: 175-184.
Araujo, M.A., Tormena, C.A., Inoue, T.T., and Costa, A.C.S. 2004. Efeitos da escarificacão na
qualidade física de um Latossolo Vermelho distroférrico após treze anos de semeadura direta.
Rev. Bras. Ciênc. Solo 28: 495–504.
Arvidsson, J. 1999. Nutrient uptake and growth of barley as affected by soil compaction. Plant
Soil 208: 9-19.
Bakken, L.R., Borresen, T., and Njos, A. 1987. Effect of soil compaction by tractor traffic on soil
structure, denitrification, and yield of wheat. J. Soil Sci. 38:541–552.
Bakker, D., and Davis, R. 1995. Soil deformation observations in a vertisol under field traffic.
Soil Res. 33:817-832.
Balkcom, K.S., Schomberg, H., Reeves, D.W., and Clark, A. 2007. Managing cover crops in
conservation tillage systems. In A. Clark (ed.). Managing Cover Crops Profitably. SARE.
College Park, MD: 44-61.
Barzegar, A.R., Rengasamy, P., and Oades, J.M. 1995. Effects of clay type and rate of wetting
on the mellowing of compacted soils. Geoderma 68:39-49.
Beare, M.H., Gregorich, E.G., and St-Georges, P. 2009. Compaction effects on CO2 and N2O
production during drying and rewetting of soil. Soil Biol. Biochem. 41: 611-621.
50
Blake, G.R., and Hartge, K.H.1986. Bulk Density. Methods of Soil Analysis, Part 1, Soil Sci.
Soc.Am., 363-376, Madison, WI, USA.
Botta, G.G., Jorajuria, C.D., and Draghi, T.L.1999. Soil compaction during secondary tillage
traffic. Agro-Ciencia 15: 139–144.
Bremer, E., Janzen, H.H., Ellert, B.H., and McKenzie, R.H. 2008.Soil organic carbon after
twelve years of various crop rotations in an aridic boroll. Soil Sci. Soc. Am. J. 72:970-974
Bremner, J.M., and Mulvaney, R.L. 1982. Nitrogen-Total, p.595-624, In Page, A.L. Miller, R.H.
and Keeny, D.R., eds. Methods of soil analysis, Part 2 chemical and microbiological properties,
2nd
ed. American Society of Agronomy, Inc., Soil Society of America, Inc., Madison, WI.
Brevik, E., Fenton, T., and Moran, L. 2002. Effect of soil compaction on organic carbon amounts
and distribution, south-central Iowa. Environ. Pollution, 116 (Supplement 1): S137-S141.
Bullock, D.G.1992. Crop rotation. Crit. Rev. Plant Sci. 11: 309-309.
Busscher, W.J., Bauer, P.J., and Frederick, J.R. 2002. Recompaction of a coastal loamy sand
after deep tillage as a function of subsequent cumulative rainfall. Soil Till. Res. 68: 49–57.
Cairns, J.E., Audebert, A., Townend, J., Price, A.H., and Mullins, C.E. 2004. Effect of soil
mechanical impedance on root growth of two rice varieties under field drought stress. Plant Soil
267: 309-318.
Calegari, A., and Pavan, M.A. 1995. Efeitos da rotação de milho com adubos verdes de inverno
na agregação do solo. Arquivo de Biologia e Tecnologia 38: 45-53.
Carter, M.R. 1990. Relative measures of soil bulk density to characterize compaction in tillage
studies on fine sandy loams. Can. J. Soil Sci. 70:425-433.
51
Chen, G., and Weil, R.R. 2009. Penetration of cover crop roots through compacted soils. Plant
Soil 331: 31-43.
Clark, A. 2007. Managing cover crops profitably, 3rd
ed. National SARE Outreach Handbook
Series Book 9. Natl. Agric. Lab., Beltsville, MD.
Creswell, H.P., and Kirkegaard, S.A. 1995. Subsoil amelioration by plant roots, the process and
the evidence. Aust. J. Soil Res. 33: 221–239
Dabney, S.M., Delgado, J.A. and Reeves, D.W. 2001. Using winter cover crops to improve soil
and water quality. Comm. Soil Sci. Plant Anal. 32: 1221–1250.
De Neve, S., and Hofman, G. 2000. Influence of soil compaction on carbon and nitrogen
mineralization of soil organic matter and crop residues. Biol. Fertil. Soils 30: 544-549.
Dean, J.E., and Weil, R.R. 2009. Brassica cover crops for nitrogen retention in the mid-Atlantic
coastal plain. J. Environ. Qual. 38: 520-528.
Dexter, A.R. 1988. Advances in characterization of soil structure. Soil Till. Res. 11:199-238.
Dexter, A.R. 1991. Amelioration of soil compaction by natural processes. Soil Till. Res. 20:87-
100.
Dexter, A.R. 2004. Soil physical quality: Part I. Theory, effects of soil texture, density, and
organic matter, and effects on root growth. Geoderma 120:201-214.
D az-Zorita, M., and Grosso, G.A. 2000. Effect of soil texture, organic carbon and water
retention on the compactability of soils from the Argentinean pampas. Soil Till. Res. 54:121-126.
52
Dimitri, C., Effland, A., and Conklin, N. 2005. The 20th
century transformation of U.S.
agriculture and farm policy. Economic Information Bulletin Number 3 Economic Research
Service, USDA, 5.
Dodds, W.K., Bouska, W.W., Eitzmann, J.L., Pilger, T.J., Pitts, K.L., and Riley, A.J. 2009.
Eutrophication of U.S. freshwaters: Analysis of potential economic damages. Environ. Sci. Tech.
43: 12-19.
Drury, C.F., Tan, C.S., Welacky, T.W., Oloya, T.O., Hamill, A.S. and Weaver, S.E. 1999. Red
clover and tillage influence on soil temperature, water content, and corn emergence. Agron. J.
91:101–108.
Ebelhar, S.A., Frye, W.W., and Blevins, R.L. 1984. Nitrogen from legume cover crops for no-
tillage corn. Agron. J. 76: 51-55.
Eckert, D.J. 1991. Chemical attributes of soils subjected to no-till cropping with rye cover crops.
Soil Sci. Soc. Am. J. 55:405–409.
Elkins, C.B.1985. Plant roots as tillage tools. International Conference on Soil Dynamics.
Auburn, AL, pp. 519-523.
EPA. 2010. Inventory of U.S. Greenhouse Gas Emissions and Sinks: 1990-2008. U.S. EPA #
430-R-10-006 Available at http://epa.gov/climatechange/emissions/usinventoryreport.html
(Accessed 06/27/12)
Friendly, M. 1991. SAS system for statistical graphics. 1st ed. SAS Inst., Cary, NC. Macros are
available from: http://www.datavis.ca/sasmac/.
53
Gee, G.W., and Bauder, J.W. 1986 Particle size analysis, p. 384-412, In Klute, A. ed. Methods of
soil analysis Part I: Physical and mineralogical methods, 2nd
ed. SSSA, Madison WI.
Hakansson, I., and Reeder, R.C. 1994. Subsoil compaction by vehicles with high axle load-
extent, persistence and crop response. Soil Till. Res. 29:277–304.
Hamblin, A.P. 1985. The influence of soil structure on water movement, crop root growth, and
water uptake. Adv. Agron. 38:95–158.
Hamza, M.A., and Anderson, W.K. 2005. Soil compaction in cropping systems: A review of the
nature, causes and possible solutions. Soil Till. Res. 82: 121-145.
Hillel, D. 1998. Environmental soil physics. Academic Press, San Diego, CA.
Horn, R. 2002. Soil mechanical properties and processes in structured unsaturated soils under
various land use and management systems, p. 305–330. In Pagliai, M. and Jones, R. ed.
Sustainable land management–environmental protection: A soil physical approach. Adv.
GeoEcol. 35. Catena Verlag, Reiskirchen, Germany.
Horn, R. 2004. Time dependence of soil mechanical properties and pore functions for arable
soils. Soil Sci. Soc. Am. J. 68: 1131-1137
Horn, R., Domzzal, H., Slowinska-Jurkiewicz, A., and van Ouwerkerk, C.1995. Soil compaction
processes and their effects on the structure of arable soils and the environment. Soil Till. Res. 35:
23-36.
Karlen, D.L., Hurley, E.G., Andrews, S.S., Cambardella, C.A., Meek, D.W., Duffy, M.D., and
Mallarino, A.P. 2006. Crop rotation effects on soil quality at three northern corn/soybean belt
locations. Agron. J. 98:484-495.

54
Katsvairo, T.W.,Wright, D.L., Marois, J.J., Hartzog, D.L., Balkcom, K.B., Wiatrak, P.J., and
Rich, J.R., 2007. Performance of peanut and cotton in a bahiagrass cropping system. Agron. J.
99:1245-1251.
Kaufmann, M., Tobias, S., Schulin, R. 2010. Comparison of critical limits for crop plant growth
based on different indicators for the state of soil compaction. J. Plant Nutr. Soil Sci.173: 573-
583.
Kautz, T., Stumm, C., Kösters, R., and Köpke, U. 2010. Effects of perennial fodder crops on soil
structure in agricultural headlands. J. Plant Nutr. Soil Sci. 173:490-501
Kemper, W.D., and Rosenau, R.C.,1986. Aggregate stability and size distribution, p. 425-442. In
Klute, A. ed. Methods of soil analysis. Part I: Physical and mineralogical methods, 2nd
ed. SSSA,
Madison, WI.
Kristensen, H. L., and Thorup-Kristensen, K. 2004. Root growth and nitrate uptake of three
different catch crops in deep soil layers. Soil Sci. Soc. Am. J. 68: 529-537.
Kuo, S., Sainju, U.M., and Jellum, E.J. 1997. Winter cover crop effects on soil organic carbon
and carbohydrate in soil. Soil Sci. Soc. Am. J. 61: 145-152.
Lal, R. 2004. Soil carbon sequestration impacts on global climate change and food security.
Science 304: 1623-1627.
Larson, W.E., and Allmaras, R.R. 1971. Management factors and natural forces as related to
compaction, p. 367-427. In Barnes, K.K., et al. (ed.) Compaction of agricultural soils. ASAE. St.
Joseph, MI.
55
Latif, M.A., Mehuys, G.R., Mackenzie, A.F., Alli, I., and Faris, M.A.1992. Effects of legumes
on soil physical quality in a maize crop. Plant Soil 140:15-23.
Lee, W.J., Wood, C.W., Reeves, D.W., Entry, J.A., and Raper, R.L. 1996. Interactive effects of
wheel-traffic and tillage system on soil carbon and nitrogen. Commun. Soil. Sci. Plant Anal. 27:
3027–3043.
Liebman, M., Gibson, L.R., Sundberg, D.N., Heggenstaller, A.H., Westerman, P.R., Chase, C.A.,
Hartzler, R.G., Menalled, F.D., Davis, A.S., and Dixon, P.M. 2008. Agronomic and economic
performance characteristics of conventional and low-external-input cropping systems in the
central Corn Belt. Agron. J. 100: 600-610.
Lindstrom, M.J., and Voorhees, W.B. 1994. Responses of temperate crops in North America to
soil compaction, p. 265-386. In Soane, B.D. and Van Ouwerkek, C. eds. Soil compaction in crop
production. New York, USA.
Lipiec, J., Arvidsson, J., and Murer, E. 2003. Review of modeling crop growth, movement of
water and chemicals in relation to topsoil and subsoil compaction. Soil Till. Res.73: 15-29.
Littell, R.C., Pendergast, J., and Natarajan, R. 2000. Modelling covariance structure in the
analysis of repeated measures data. Statist. Med 19: 1793-1819.
Littell, R.C., Stroup, W.W., and Freund R.J. 2002. SAS for lineal models. 4th
ed. Wiley
InterScience.
Mann, C.C. 2008. Our good earth. National Geographic Online, Available at
http://ngm.nationalgeographic.com/2008/09/soil/mann-text (Accessed 04/09/13)

56
Marshall, A.J., Gallaher, R.N.,Wang, K.H., and McSorley, R. 2002. Partitioning of dry matter
and minerals in sunn hemp, p. 310-313 In van Santen, E. ed. Making conservation tillage
conventional: building a future on 25 years of research. Proceedings of 25th
annual southern
conservation tillage conference for sustainable agriculture, Auburn, AL, USA.
Materechera, S.A., Alston, A.M., Kirby, J.M., and Dexter, A.R. 1992. Influence of root diameter
on the penetration of seminal roots into a compacted subsoil. Plant Soil 144: 297-303
Materechera, S.A., Dexter, A.R., and Alston, A.M. 1991. Penetration of very stong soils by
seedling roots of different plant-species. Plant Soil 135: 31-34
McFarland, M.L., Hons, F.M., and Lemon, R.G.1990. Effects of tillage and cropping sequence
on soil physical properties. Soil Till. Res. 17: 77-86.
McVay, K.A., Radcliffe, D.E., and Hargrove, W.L. 1989. Winter legume effects on soil
properties and nitrogen fertilizer requirements. Soil Sci. Soc. Am. J. 53:1856-1862.
Meisinger, J.J., and Delgado, J.A. 2002. Principles for managing nitrogen leaching. J. Soil Water
Conserv. 57: 485-498.
Merrill, S.D., Tanaka, D.L., and Hanson, J.D. 2002. Root length growth of eight crops species in
Haplustoll soils. Soil Sci. Soc. Am. J. 66: 913-923.
Nafziger, E. 2004. Small grains and grain sorghum . p. 37–47. In Illinois Agronomy Handbook.
University of Illinois at Urbana-Champaign, Urbana, IL.
Ngunjiri, G.M.N., and Siemens, J.C.1994. Wheel traffic effects on corn growth. T. ASAE. 38:
691-696.
57
Odhiambo, J.J.O., and Bomke, A.A. 2001. Grass and legume cover crop effects on dry matter
and nitrogen accumulation. Agron. J. 93: 299–307.
Oldeman, L.R., Hakkeling, R.T.A. and Sombroek, W.G. 1991. World map of the status of human
induced soil degradation. An explanatory note. ISRIC, Wageningen, the Netherlands, UNEP,
Nairobi, Kebya. http://isric.nl/ISRIC/webdocs/docs/explannote.pdf (Verified 02/01/13).
Olson, K.R., Ebelhar, S.A., and Lang, J.M. 2010. Cover crop effects on crop yields and soil
organic carbon content. Soil Sci. 175:89-98.
Passioura, J.B. 2002. Soil conditions and plant growth. Plant Cell Environ. 25: 311-318.
Phatak, S.C., Dozier, J.R., Bateman, A.G., Brunson, K.E., and Martini, N.L. 2002. Cover crops
and conservation tillage in sustainable vegetable production. 401-403 In van Santen, E. ed.
Making conservation tillage conventional: building a future on 25 years of research. Proceedings
of 25th
annual southern conservation tillage conference for sustainable agriculture, Auburn, AL,
USA.
Pimentel, D. 2006. Soil erosion: A food and environmental threat. Env. Dev. Sust.8: 119-137.
Place, G., Bowman, D., Burton, M., and Rufty, T. 2008. Root penetration through a high bulk
density soil layer: Differential response of a crop and weed species. Plant Soil 307: 179-190.
Radford, B.J., Yule, D. F., McGarry, D., and Playford, C., 2001. Crop responses to applied soil
compaction and to compaction repair treatments. Soil Till. Res. 61:157-166.
Raimbault, B.A., and Vyn, T.J. 1991. Crop rotation and tillage effects on corn growth and soil
structural stability. Agron. J. 83:979-985.

58
Raper, R.L. and Kirby, J.M. 2006. Soil compaction: How to do it, undo it, or avoid doing it, p.1-
14 ASAE Agricultural Equipment technology Conference, Louisville, Kentucky, USA.
Rasse, D. P., and Smucker, A. J. M. 1998. Root recolonization of previous root channels in corn
and alfalfa rotations. Plant Soil 204: 203-212.
Reeves, D.W. 1994. Cover crops and rotations, p.125-158 In Hatfield, J.L and Stewart, B.A. eds.
Crops residue management, Adv. Soil Science.
Reid, J.B., and Goss, M.J. 1981. Effect of living roots of different plant species on aggregate
stability of two arable soils. J. Soil Sci. 32, 521–541.
Reynolds, W.D., Bowman, B.T., Drury, C.F., Tan, C.S., Lu, X. 2002. Indicators of good soil
physical quality: density and storage parameters. Geoderma 110: 131-146.
Rosolem, C.A., Foloni, J.S.S., Tiritan, C.S. 2002. Root growth and nutrient accumulation in
cover crops as affected by soil compaction. Soil Till. Res. 65:109-115.
Russell, A.E., Laird, D.A., and Mallarino, A.P. 2006. Nitrogen fertilization and cropping system
impacts on soil quality in midwestern mollisols. Soil Sci. Soc. Am. J. 70:249-255.
Sadras, V. O., O’Leary, G. J., and Roget, D. K. 2005. Crop responses to compacted soil: Capture
and efficiency in the use of water and radiation. Field Crop Res. 91(2-3), 131-148.
Sainju, U.M. 2002. Long-term effects of tillage, cover crops, and nitrogen fertilization on
organic carbon and nitrogen concentrations in sandy loam soils in Georgia, USA. Soil Till. Res.
63:167-179.
Sainju, U.M., Terrill, T.H., Gelaye, S., and Singh, B.P. 2003. Soil aggregation and carbon and
nitrogen pools under rhizoma peanut and perennial weeds. Soil Sci. Soc. Am. J. 67:146-155.

59
Saqib, M., Akhtar, J., and Qureshi, R.H. 2004. Pot study on wheat growth in saline and
waterlogged compacted soil: II. Root growth and leaf ionic relations. Soil Till. Res. 77:179-187.
SARE (Sustainable Agriculture Research and Education Program) 2010. Clean Energy Farming:
Cutting Costs, Improving Efficiencies, Harnessing Renewables. Available at
http://www.sare.org/publications/energy/energy.pdf (Accessed 08/29/11)
SAS Institute. 2012. SAS v. 9.3. SAS Inst., Cary, NC.
Schafer, R.L. 1992. Future research needs in soil compaction. T. ASAE. 35 (6): 1761-1770.
Servadio, P., Marsili, A., Vignozzi, N., Pellegrini, S., and Pagliai, M. 2005. Effects on some soil
qualities in central Italy following the passage of four wheel drive tractor fitted with single and
dual tires. Soil Till. Res. 84:87-100
Singer, M.J., Southard, R. J., Warrington, D.N., and Janitzky, P. 1992. Stability of synthetic
sand–clay aggregates after wetting and drying cycles. Soil Sci. Soc. Am. J. 56:1843–1848.
Snapp, S.S., Swinton, S.M., Labarta, R., Mutch, D., Black, J.R., Leep, R., Nyiraneza, J., and
O’Neil, K. 2005. Evaluating cover crops for benefits and costs and performance within cropping
system niches. Agron. J. 97:322-332.
Soane, B.D., Dickson, J.W., and Campbell, D.J.1982. Compaction by agricultural vehicles: A
review III. Incidence and control of compaction in crop production. Soil Till. Res. 2:3-36.
Soane, B.D.1990. The role of organic matter in soil compactibility: A review of some practical
aspects. Soil Till. Res. 16:179-201
Soane, B. D., and van Ouwerkerk, C.1995. Implications of soil compaction in crop production
for the quality of the environment. Soil Till. Res. 35: 5-22.

60
Soane, B.D., and Van Ouwerkerk, C. 1998. Soil compaction: A global threat to sustainable land
use Adv. Geoecol. 31:517-525.
Strock, J.S., Porter, P.M., and Russelle, M.P., 2004. Cover cropping to reduce nitrate loss
through subsurface drainage in the northern U.S. Corn Belt. J. Environ. Qual. 33:1010-1016.
Taboada-Castro, M., Alves, M.C., Whalen, J., and Taboada, T. 2006. Dynamics of aggregate
stability influenced by soil management and crop residues. Commun. Soil Sci. Plant Anal.
37:2565–2575.
Thorup-Kristensen, K. 2006. Effect of deep and shallow root systems on the dynamics of soil
inorganic N during 3-year crop rotations. Plant Soil 288:233–248.
Tilman, D., Cassman, K. G., Matson, P. A., Naylor, R., and Polasky, S. 2002. Agricultural
sustainability and intensive production practices. Nature, 418: 671-677.
Tisdall, J.M. and Oades, J.M. 1982. Organic matter and water-stable aggregates in soils. J. Soil
Sci. 33:141-163.
Unger P.W., Kaspar, T.C. 1994. Soil compaction and root growth: A review. Agron. J. 86:759-
766
Van Ouwerkerk, C., and Soane, B. D.1994. Conclusions and recommendations for further
research on soil compaction in crop production, p 627-642 In Soane, B.D. and van Ouwerkerk C.
eds., Soil Compaction in Crop Production. Developments in Agricultural Engineering.The
Netherlands
Varvel, G.E. 2000. Crop rotation and nitrogen effects on normalized grain yields in a long-term
study. Agron. J. 92:938-941.

61
Villamil, M.B., Bollero, G.A., Darmody, R.G., Simmons, F.W., and Bullock, D.G. 2006. No-till
corn/soybean systems including winter cover crops: effects on soil properties. Soil Sci. Soc. Am.
J. 70: 1936-1944.
Villamil, M.B., Miguez, F.E., and Bollero, G.A. 2008. Multivariate analysis and visualization of
soil quality data for no-till systems. J. Environ. Qual. 37:2063-2069.
Voorhees, W.B. 1983. Relative effectiveness of tillage and natural forces in alleviating wheel-
induced soil compaction. Soil Sci. Soc. Am. J. 47:129-133.
Voorhees, W.B. 1987. Assessment of soil susceptibility to compaction using soil and climatic
data bases. Soil Till. Res. 10: 29-38
White, C., and Weil, R., 2011. Forage radish cover crops increase soil test P surrounding holes
created by the radish taproots. Soil Sci. Soc. Am. J. 75: 121-130.
Wiebe, K. D., 2003. Linking Land Quality, Agricultural Productivity, and Food Security. USDA-
ERS Agricultural Economic Report No. 823.
Williams, S. M., and Weil, R. R. 2004. Crop cover root channels may alleviate soil compaction
effects on soybean crop. Soil Sci. Soc. Am. J. 68: 1403-1409.
Wilts, A.R., Reicosky, D.C., Allmaras, R.R., and Clapp, C.E. 2004. Long-term corn residue
effects: Harvest alternatives, soil carbon turnover, and root-derived carbon. Soil Sci. Soc. Am. J.
68: 1342-1351.
Zhang, H. 1994. Organic matter incorporation affects mechanical properties of soil aggregates.
Soil Till. Res. 31, 263–275.
62
CHAPTER 2. COVER CROPS AND SOIL COMPACTION EFFECTS ON SOYBEAN
PRODUCTION IN ILLINOIS
ABSTRACT
The inclusion of radish (Raphanus sativus L. var. longipinnatus) as a winter cover crop
(WCC) has been suggested as a valuable soil compaction management tool for the corn-soybean
(Zea mays L.) [Glycine max (L.) Merr.] rotation of the U.S. Midwest. However, little information
is available on the effects of radishes and its combinations with other cover crops on the
following soybean crop. Recent interest in cover crops has been gauged by articles, NRCS
promotional efforts, and sales promotions from companies who sell cover crop seed and services
such as aerial seeding. Still, it has to be acknowledged that cover crops have not been shown
definitively to provide a positive return on investment, at least within farming systems most
commonly used in this region. Increased knowledge of the effects of WCC on growth,
development and yield of the following crop will inform the decision of WCC inclusion within
corn-soybean rotations in the Midwest. The objective of this study was to evaluate soybean
growth and development under different cover crop combinations and compaction induced
treatments on a typical Illinois Drummer soil at Urbana, IL. The cover crops used were: radish
(Raphanus sativus L. var. longipinnatus) “R”, sown alone and its combination with rye (Secale
cereale L.,) “RR”, triticale (× Triticosecale cv Presto) “RTR”, buckwheat (Fagopyrum
esculentum L.Moench) “RB”, hairy vetch (Vicia villosa Roth) “RHV” and a control with no
cover crop “NCOV” after compaction induced treatments in Fall 2010 and Fall of 2011.The
compaction treatments included a control with no compaction (Nc), and three levels of
compaction achieved with either a small tractor (ST), a large tractor (LT) or a hauling truck
(TK). Compaction levels and cover crops were arranged in a 4 x 6 factorial in a completely

63
randomized design (CRD) with two replications. In 2011 the ST treatment was dropped due to
similar contact pressure and compaction achieved with the LT. The degrees of compaction
achieved in this study had no significant effect on soybean growth, development and yield. WCC
showed significant differences for soybean population: WCC that over wintered had 5-20% less
plants than the WCC that did not overwinter and the control. WCC also showed significant
differences for LAI and number of nodes, soybeans had 8% more nodes on the plots without
over wintering WCC. Differences disappeared towards harvest. Overall yield components and
grain yield showed no significant differences due to WCC or their interactions. With adequate
management practices soybean growth parameters and yield should not be affected by WCC and
may prove to be a useful tool for soil compaction management especially in fields with persistent
compaction.
INTRODUCTION
Farmers recognize soil compaction as a threat to crop productivity. Compaction reduces
void space in the soil reducing water storage and availability for crops. Mechanical loosening
using deep tillage, chiseling and subsoiling have been the most common practices to alleviate
compacted layers for decades. However recent research has shown that these effects are
temporary, usually lasting no longer than one growing season (Busscher et al., 2002; Horn et al.,
2002; Araujo et al., 2004). Moreover the benefits of subsoiling can be offset by its high cost and
the risk of re-compaction after trafficking the same area (Raper and Kirby, 2006). Alternatives to
tillage practices include natural processes of wetting and drying, freezing and thawing cycles,

64
and biological processes related to root exploration, and activities of soil microbes and fauna
(Dexter, 1988; Barzegar, 1995).
Soil compaction and its negative effects on crop production have been widely researched
for various crops and soil types (Letey, 1985; Haakanson, 1988; Arvidsson, 1991). Changes in
soil properties related to soil compaction affect root growth and development (Unger and Kasper
1994; Dexter, 2004) nutrient uptake (Arvidsson, 1999), and can dramatically alter plant
morphology, reducing yields and decreasing soil productivity and farmers profits (Andrade et al.,
1993; Radford et al., 2001; Passioura, 2002; Sadras et al., 2005). Restricted soybean root growth
in compacted sandy loam and clay loam soils can exacerbate water stress and reduce yields
(Buttery, 1998). Reductions in soybean yields of 9-19%, were observed in a three year
experiment after 10 Mg and 20 Mg axle load compaction treatments in a poorly-drained heavy-
textured soil in northwest Ohio (Flowers, 1998). Similarly, in southern Minnesota compaction
imposed treatments including 4.5 Mg, 9 Mg and 18 Mg axle loads on a clay loam soil, affected
soybean plant height and integrated leaf area index reducing yields by 15% and up to 27%
(Johnson and Voorhees, 1990). Effects of compaction on crop production varies with soils,
seasons and crops since soil compaction is the result of a complex interaction between machines,
soil, crop, and weather (Soane and van Owerkerk, 1994). In particular, yield variability found in
compaction studies is highly dependent on the season’s rainfall and may not always affect the
crop negatively. Johnson and Voorhees (1990) found general decreases in yield during a wet
year and yield increases during a dry year in response to compaction and, in 5 out of 14 location-
years an intermediate compaction level (9 Mg axle load) out yielded the control treatments with
no compaction. Likewise, in a 2 year experiment on a Wisconsin clay loam soil, Lindemann
(1982) found significant differences in soybean yield after imposed compaction treatments

65
including different number of passes with a tractor weighing 3.5 Mg; yields were higher in the
compacted treatments in a dry season and lower in the compacted treatments in a wet season.
Yield reductions following rainfall patterns have also been reported in maize; by up to 50% in a
wet season and 25% in a drier-than-normal season after imposed compaction treatments in
poorly drained silt loam soils in Indiana (Gaultney et al., 1982). Attempts to measure and
understand the degree of soil compaction have been hindered due to the difficulty of isolating the
effects of compaction from the season effect and other factors present in the soil (Voorhees et al.,
1987; Morgan et al., 1993).
Soil organic matter plays a key role in a soil’s susceptibility to compaction since organic
matter retains soil water and has the ability to rebound after being compacted (Thomas et al.,
1996; Reeves, 1997; Dexter, 2004). Moreover, organic residues are lighter and less dense that
silt, clay and sand particles therefore management practices that can increase additions of organic
materials into the soil profile can lower soil bulk density (Zhang, 1994). Typically, soils with
high organic matter values are more resilient to soil compaction, thus management practices that
maintain or increase organic matter will help to prevent or avoid soil compaction (Soane, 1990).
One of these practices is the incorporation of winter cover crops in rotation (Kuo, 1997). The
inclusion of WCC in modern cropping systems has been suggested to improve soil structure
(Shepherd, 2002; Lal, 2004) and help alleviate soil compaction (Clark, 2007; Williams and Weil,
2004; Chen and Weil, 2010). Due to the short growing season after harvest of the main crop in
the fall, the prevalent cover crops in the Midwest region are winter annuals (Singer, 2008).
Winter rye is the most common small grain winter cover crop in the central U.S. (Bollero 1994;
Singer, 2008) while hairy vetch is considered to be the best legume option for the central and
southern U.S (Smith et al., 1987). Separately or in mixtures, cereal rye and hairy vetch are the

66
most studied cover crops in the Midwest (Ruffo, 2004; Villamil 2006; Singer, 2008). Cereal rye
has a high biomass production, ranging from 1 to 8 Mg ha-1
(Baker, 2009), and has a high
nitrogen scavenging potential, thus reducing nitrogen leaching from agricultural land (Shipley et
al., 1992). Hairy vetch has good winter hardiness and is usually used in rotation with corn for its
ability to fix large amounts of nitrogen 90-100 kg ha-1
(Ebelhar, 1984). Farmers interested in
cover crops in the Midwest have been recently interested in species of the Brassicaceae family,
such as radish (Raphanus sativus L. var. longipinnatus) for their rapid growth in fall, potential
nutrient cycling, compaction alleviation abilities and die off in winter.
Including winter cover crops (WCC) in a cropping system provides multiple benefits to
the soil and to crops that can result in greater crop yield or enhanced yield stability (Snapp et al.,
2005). Soil productivity with WCC can be increased through increased soil organic matter, weed
and pest suppression, reduced nutrient loss and enhanced nutrient cycling (Sainju et al., 2002;
Williams et al., 2000; Meisinger and Delgado 2002, Villamil et al., 2006; 2008). WCC are one of
the most researched conservation practices, yet adoption levels are still low. Results after a mail
survey including 3500 farmers in Illinois, Indiana, Iowa and Minnesota showed that 18% of
farmers had used cover corps once and 11% had planted cover crops between 2001 and 2005
(Singer et al., 2007; Singer 2008). One of the reasons for this low adoption of cover crops is that
under certain circumstances WCC have been reported to lower crop yields. Including cover crops
in modern cropping systems requires adequate management practices to minimize any possible
negative impacts (Snapp et al., 2005). Crop yield reductions are usually associated to water
depletion by the WCC, and or delayed emergence and growth of the cash crop (Raimbault et al.,
1991; Unger et al., 1998; Westgate 2005). Difficulties in establishing soybeans in high biomass
overwintering cover crops such as rye have been reported by Williams et al. (2000) and Reddy et

67
al. (2003). Rye has been reported to decrease (Eckert, 1988; Williams et al., 2000; Davis, 2010)
increase (Williams et al., 2000; Williams, 2004), or have no effect (Swanton, 1988, Reddy, 2003;
Ruffo, 2004; Strock, 2004) on the yield of the following soybean crop. More recently, radish has
been reported to have positive or neutral effects on soybean yield (Chen and Weil, 2010).
Although there is an increased interest in the use of WCC in Illinois conflicting information
pertaining to the effects on the following crop’s yield is an important limitation for farmer
adoption.
Previous studies in Illinois have focused on management strategies for rye, hairy vetch
and the rye -vetch mixture in no-till systems (Crandall, 2005; Davis 2010), their effects on weed
and pest suppression, residue decomposition, and crop yields (Wagger et al., 1998; Reddy et al.,
2003; Ruffo and Bollero., 2003). Moreover, Villamil et al. (2006; 2008) have shown the
potential of these cover crops to improve soil structure and increase soil organic matter and
nutrient cycling in no-till systems. Yet conventional systems continue to dominate the
agricultural landscape in IL and there is little information regarding the effects of cover crops,
including brassicas on the following cash crop. Literature regarding cover crops and crop yield
typically only report crop yield data without growth and development parameters. Although
there are studies in the Illinois showing soybean growth and development under different cover
crop systems (Ruffo, 2004; Davis, 2010) and the effects of cover crops on the growth and
development of the following corn crop (Miguez et al., 2006) there are studies conducted under
no-till management and there are no studies showing the combined effects of compaction and
cover crops on the following soybean crop growth, development and yield in conventional
systems. Evaluation of crop growth and development parameters such as light interception, leaf
area index, crop growth rate and dry matter accumulation is a useful tool for comparing different

68
management systems (Pedersen, 2004). Evaluating crop growth and development parameters of
soybeans under WCC may lead to improved management decisions that can help maximize
benefits while minimizing negative effects associated with the use of WCC. The objective of this
study was to examine the effects of compaction and WCC treatments on soybean development,
growth and yield through the evaluation of development parameters: Leaf area index (LAI), dry
matter accumulation (DM), crop growth rate (CGR), relative growth rate (RGR), and yield
components in conventional systems in two different environments in IL.
I expect that the results of this study will provide currently lacking information regarding
the effects of compaction induced treatments and of selected WCC on the subsequent soybean
crop growth and yield to help inform the decision of the inclusion of WCC as a soil compaction
management tool in corn-soybean systems.
MATERIALS AND METHODS
Experimental sites and methods
The study was carried out at Urbana, Illinois, in 2010 and 2011 at the Crop Sciences
Research and Education Center (South Farms) of the University of Illinois. A different field
coming out of wheat production (T. aestivum L.) was used each year. Both fields were on
Drummer silty clay loam (fine silty, mixed, superactive, mesic Typic Endoaquoll) with less than
2% slope. Drummer series consists of dark colored, very deep, poorly drained soils developed in
100- to 150-cm of loess or other silty material under prairie vegetation. Permeability is moderate
and surface runoff is negligible to low (Soil Survey Staff, 2012). The two selected fields had

69
been cultivated to an average depth of 20cm. Before establishing our experiment, conventional
tillage consisting of a deep ripper followed by disking was used to control weeds and prepare the
seed bed. Compaction levels and cover crop treatments were arranged in a 4 x 6 factorial in a
completely randomized design (CRD) with two replications. Four levels for compaction (high
“Truck” (TK), medium “Large tractor” (LT), low “Small tractor” (ST) and No compaction (Nc)
were achieved by 5 passes of the different vehicles with the soil at field capacity. The plot
dimensions were 6.09 m x 15.24 m. Fields were separated by 9.14 m wide alleys for tractor and
equipment turning during creation of the compaction treatments and cover crops planting.
The compaction treatments were established using a John Deere 7210 Tractor (Deere
&Company, Moline, IL) with a total weight of 4.5 Mg with pneumatic tires and a rear tire
contact area of 3225 cm² for the ST, a John Deere 8225 Tractor (Deere &Company, Moline, IL)
with a total weight 9.5 Mg with solid rubber tires and a rear tire contact area of 7197 cm² for the
LT, and a Top Kick Fuel injection GMC Truck (GMC, Detroit, MI) with a total weight 9 Mg
rear tire contact 1067 cm² for the TK treatments. No tractor traffic occurred for the Nc
treatments. All treatments consisted of five passes of each farm implement after a rain event with
soils at field capacity simulating the annual number of field activities (i.e. spraying, planting,
harvesting and hauling grain). For the second year we used three levels of compaction (TK, LT,
and Nc) since we found the compaction levels achieved with the large tractor and the small
tractor to be similar. Previous research reported that topsoil compaction is related to ground
pressure and subsoil compaction to total axle load independently of ground pressure (Botta et al.,
1999; Hakansson and Reeder, 1994). The ground contact pressure is what causes soil compaction
(Hamza and Anderson, 2005). Ground contact pressure is the axle load divided by the surface
area of contact between the load and the soil. This is measured in kPa, which is a unit of

70
pressure. Following the calculation of ground pressure we decided to drop the ST treatment for
the second year of the study due to similar load-pressure as the LT (ST=135 kPa, LT=129 kPa,
TK=833 kPa). Each year and a week after imposing the compaction treatments, the field was
disked to a depth of approximately 8 cm to establish a suitable seedbed for the cover crop
treatments. The six cover crops levels consisted of: radish (Raphanus sativus var. longipinnatus)
“R”, sown alone or along with rye (Secale cereale L.) “RR”, triticale (x Triticosecale cv Presto)
“RTR”, buckwheat (Fagopyrum esculentum L. Moench) “RB”, or hairy vetch (Vicia villosa
Roth) “RHV” and a control with no cover crop, “NCOV”.
Planting date for WCC was September 27th
2010 and September 7th
2011. Seeding rate
was 10 kg ha-1
for radish sown alone, 28 kg ha-1
for rye in combination with radish, 38 kg ha-1
for triticale in combination with radish, 30 kg ha-1
for hairy vetch in combination with radish and
45 kg ha-1
for buckwheat in combination with radish. The seeding rate for radish in combination
with other WCC was 5 kg ha-1
. Hairy vetch was inoculated every year with Rhizobium
leguminosarum var. viciae. WCC were chemically suppressed with glyphosate (N-
(phosphonomythyl) glycine) at 1.2 kg a.i. ha-1
in the spring, approximately two weeks before
planting the main crop based on guidelines developed by Ruffo (2001) and Crandall (2003).
Glyphosate-resistant (RR) soybeans maturity group 3.4 were planted on June 3rd
on 2011 and on
May 15th
2012 respectively.
Soil sampling and analysis
After a preliminary penetration resistance characterization of both fields, complete soil
sampling was conducted during both fall and spring seasons, each time after establishment of the
compaction treatments and before planting the main soybean crop. On September 7 2010 and
August 15 2011, and May 15 2011 and May 5 2012, two soil subsamples per plot up to 50-cm in

71
depth were taken with a Giddings® sampler (29.5-mm diam., Giddings machine Co., Fort
Collins, CO) for bulk density (BD) and soil chemical analysis. The cores were then cut to obtain
0-10, 10-20, 20-30, 30-40, and 40-50-cm subsamples, and stored in plastic bags. After weighing
the subsamples and measuring water content gravimetrically, BD values were obtained using the
core method (Blake and Hartge, 1986). The results were averaged for each plot and depth
considered.
The same samples were air-dried, and passed through a 2-mm sieve to perform the
following tests: pH (potentiometry; 1:1 soil: water), total carbon and total nitrogen (TC and TN
by combustion with CHNSO Analyzer; Costech Analytical Technologies Inc. Valencia, CA),
NO3-N (flow injection analysis with Lachat automated analyzer, Lachat Instuments, Loveland,
CO) available P (Bray-1). On the same date of soil sampling, profile soil penetration resistance
measurements (PR, kPa) were recorded with a Field Scout TM
SC 900 Soil Compaction Meter
(Spectrum Technologies, Plainfield, IL) with a cone basal area of 1.28 cm2 and a cone angle of
30°. Three subsamples were recorded at each plot and the results averaged at the selected depths
of 0-10, 10-20, 20-30, 30-40, and 40-50-cm in order to get one measurement per plot per depth.
Gravimetric water content was later used as a covariate in the statistical analysis of BD and PR.
Two 5 g subsamples of the 0-10 and 10-20 cm depths were used to determine water aggregate
stability (WAS, g g-1
) with an Eijkelkamp® wet sieving apparatus (Eijkelkamp, Giesbeek, The
Netherlands) on the 1-to 2- mm aggregate size fractions following the standard procedure
developed by Kemper and Rosenau (1986). On 21 April 2011 and 28 April 2012 one sample
from the center of each plot was taken with a shovel down to a depth of 20 cm for determination
of particle size distribution and proctor test (ASTM, 1982). From each sample, two 50 g
subsamples of air dried soil were passed through a 2-mm sieve to analyze for particle size
72
distribution via the hydrometer method (Gee and Bauder, 1986). Percentages by weight of clay
(<0.002-mm), silt (0.002-0.05-mm) and sand (0.05-2-mm) separates were obtained by the
hydrometer method. Additional characterization of the sand size (very coarse 2-1mm; coarse1-
0.5-mm; medium 0.5-0.25-mm; fine0.25-0.10; and very fine 0.1-0.05-mm sand) and silt size
(coarse silt <0.05-mm) fractions was carried out with a set of 5 ultrasonic sieves corresponding
openings of 1-,0.5-,0.25-, 0.1-, and 0.05-mm (ATM Sonic Sifter, ATM Corporation, Milwaukee,
WI.). Relative compaction (RC) results from the quotient between soil bulk density determined
with the core method, and the maximum bulk density determined by means of Proctor tests
following the standard ASTM procedure (American Society for Testing and Materials, 1982).
Plant sampling
Triticale and rye and hairy vetch were chemically terminated in the pre-anthesis (Feeks
10.5.1) and pre-bloom stages respectively, on 19 May 2011 and 26 April 2012 with glyphosate
(1.2 kg a.i. ha-1
of glyphosate [(N –(phosphonometyl) glycine]). Soybean was no-till planted
using 76-cm row spacing on 3 June 2011 June, and 15 May 2012 at a seeding rate of 350.000
plants per hectare. Population was determined 21 days after planting. Soybean vegetative stages
were measured starting 21 days after emergence (DAE) during the growing season as suggested
by Ritchie et al (1996). Plants samples were hand-harvested and counted from 0.76 m² every 10
days to determine soybean growth parameters such as leaf area index (LAI), height (cm), number
of nodes, dry matter accumulation (DM) crop growth rate (CGR) and relative growth rate (RGR)
until soybean pod fill (R5 stage). There were six sampling dates (T) through-out the growing
season (21, 31, 41, 51, 61, and 71 DAE). In 2011 LAI measurements was determined with a
Licor Li-3100 Area meter. In 2012 LAI measurements were determined with a Licor Li-2200
Plant canopy analyzer (Licor, Lincoln, NE).
73
Prior to soybean harvest a dry matter sample was hand- harvested from 0.38 m² of each
plot. Yield components: pod density, beans per pod and number of beans were determined from
a sample of three plants randomly collected from the hand-harvested section. Soybean yield was
determined with an Almaco combine (Nevada, IA) and adjusted to 130 g/kg moisture.
Experimental design and statistical analysis
As previously detailed, each year a different field was used to set up a factorial
combination of 4 (3 in 2012) compaction levels and 6 levels of cover crop treatments arranged in
a CRD with two replications. The field-year combination will be hereby referred as the random
factor ENVIRONMENT (E); whereas the fixed factors of compaction and cover crop will be
referred as COMP and CC, respectively.
The linear model used for the statistical analysis of the dependent variables was
yijkl = μ + Ei + αj+βk+ Eiαj + Ei βk + Ei αj βk +Error
yijkl = observation for the ith
level of E for the jth
level of COMP and the kth
level of CC
μ = grand mean.
Ei = random effect due to the ith
level of factor E. df=i-1 = 2-1=1
αj = fixed effect of the jth
COMP. df=j-1 = 4-1=3
Eiαj= random effect due to ith
level of factor E and the jth
COMP. df=(i-1)(j-1) =3
βk = fixed effect due to the kth
level of factor CC df=k-1=6-1=5
Ei βk = random effect due to ith
level of factor E the kth
CC. df=(i-1)(k-1) =5
αj βk = fixed effect due to the jth
level of factor COMP and the kth
CC. df=(i-1)(j-1)(k-1) =15
74
Ei αj βk = random effect due to ith
level of factor E the jth
COMP and the kth
CC. df=(i-1)(j-1)(k-
1) =15
Error (l) = residual effect assumed identically and independently distributed (i.i.d.) N (0,σe2).
These models were analyzed using the MIXED procedure of SAS (SAS Institute Inc,
2012). For dependent variables that were measured at several times, a fixed factor T (time) was
added to the model. Dependent variables that were measured at several times on the same
experimental units were analyzed using a repeated measures approach (Littell et al., 2002). The
lowest Akaike’s Information Criterion and the Schwarz’s Bayesian Criterion where used to
select the variance-covariance model. AR1 was used for CGR, Toep was used for DM, RGR,
and LAI, and UN was used for Number of nodes and Height. When covariance parameter
estimates appeared to be negative or zero, we used the -2Log Likelihood test to compare
successive reduced forms of the original models (Littell et al., 2002). To compare differences
among treatments and times the PDIFF options of the LSMEANS statement was used. Mean
separation procedure was accomplished by using Fisher’s Protected Least Significant Difference
(LSD) with a probability of Type I error or alpha level (α) set at 0.05.
The matching SAS coding was as follows,
proc mixed data=thesis;
class E S CC COMP T;
model variable = CC|COMP|T;
random E E*CC E*COMP E*T E*CC*COMP E*COMP*T E*CC*T
repeated T/type = UN subject = S; run;
Where E, environment; S, subject; CC, cover crop, COMP, compaction; and T, time.
The variables total dry matter (TDM), number of pods (Npod), beans per plant (Bnpl) and
(RGR) required transformations due to lack of normality and heterogeneity of variances.
75
Possible transformations were explored using the BOXCOX macro in SAS (Friendly, 1991). The
square transformation was used for TDM, while natural logarithm (logn) was used Npod, Bnpl
and RGR.
RESULTS AND DISCUSSION
Growing conditions during 2011 and 2012 were very dissimilar and challenging for crop
production (Figure 2). Soil moisture conditions at WCC planting was limiting for the 2011
growing season which was characterized by a dry Fall, and optimum for the 2012 growing
season. The total amount of precipitation was different for the 2011 (693 mm) and 2012 (485
mm) cover crop growing seasons. Rainfall during the soybean growing season (May-September)
was 384 mm for 2011 and 435 mm for 2012. While 2011 was characterized by a wet spring with
ample soil moisture at soybean planting time, 2012 showed a warm and dry spring with just
sufficient soil moisture at planting time. Although the total amount of precipitation was similar
between years it was far below average (507 mm) in both growing seasons. An important
difference was the precipitation received in June-July (146 mm in 2011 vs. 60 mm in 2012)
being July especially important for soybean development and yield determination since pod set
(R3-R4) occurred in late July in both years.
Winter cover crop biomass
Significant differences in cover crop biomass production were observed between cover
crops and environments (Table 2.1). Among cover crops, the main contributors to the differences
in biomass production during spring time are winter hardiness and planting time. WCC plating
was delayed almost a month from the desired date (August) due to an unusually dry fall in 2010.

76
These differences in biomass production show the widely reported importance of early fall
planting for successful establishment and biomass production of WWC (Clark et al., 1997;
Miguez and Bollero, 2006) especially important for radish, buckwheat and hairy vetch, because
of their susceptibility to winterkill. Buckwheat was the most susceptible to low temperatures, and
was killed by the first frosts on both years. Rye, triticale and hairy vetch overwintered well in
both years. Radish was intermediate in winter hardiness but as expected did not overwinter in the
two years of this study. As suggested by Crandall (2005) rye and triticale were killed 2 weeks
prior to soybean planting to optimize rye biomass and yield of the subsequent crop. Rye and
hairy vetch biomass obtained in this study showed similar ranges to previous studies in Illinois
(Ruffo and Bollero 2003; Ruffo et al.,2004; Miguez and Bollero 2006; Davis, 2010).
Soybean Population and Growth Parameters
Soybean population was measured two weeks after emergence. Significant differences
were determined for the main effect cover crop (p<0.0204), and there were no interactions
between compaction level and cover crops (Table 2.2). Differences in population can be
explained by the difficulty to plant into the stubble of the WCC that over wintered. Reduced
soybean stands after rye cover crop caused by poor seed-soil contact may be associated with
excessive cover crop growth as reported by Eckert, (1988) and Reddy, (2001).
Soybean vegetative growth characteristics starting 21 days after emergence (DAE) to R5
stage, seed filling period (Fehr and Caviness, 1977) were evaluated by changes in plant height
and node number on the main stem. Differences in plant height between treatments may reflect
unfavourable growth conditions (Reddy, 1998) and were evident along the growing season
between cover crops treatments. Starting 21 days after emergence (DAE) soybean plants in the
plots with highest WCC biomass showed the tallest plants in part to overcome the thick mulch
77
and reach full sunlight. These differences in plant height were reverted by R5 stage soybean
plants under rye and triticale were 9.6 and 7.9 cm shorter than the plants in the no cover plots
(Table 2.2). Plant height values showed significant differences for the interaction of cover crop
and time (p<0.028) and the main effect time (p<0.001). There were no significant differences for
the interactions between cover crop and compaction levels (Table 2.3). Differences in plant
height between the WCC treatments can be explained by the differences in population and
interplant competition in the plots with higher population in comparison with the plots with
lower populations. These differences disappeared towards harvest but were maintained well into
the R5 stage (seed filling period).
Node number and percentage of reproductive nodes (pod bearing nodes) is a proxy for
number of pods (Pedersen and Lauer, 2004). The interaction of cover crop and time (p<0.0001),
and the main effects cover crop (p<0.0001) and time (p<0.0001) showed significant values for
number of nodes. There were no significant differences for the interactions between cover crop
and compaction levels (Table 2.4). Differences in the number of nodes on the main stem first
appeared 31 DAE (R1/R2), soybeans had 8% more nodes on the plots without over wintering
WCC. As with plant height, differences in node number across the WCC treatments can be
explained by the differences in population and the overproduction of nodes and branches in the
plots with lower populations. Again, node number differences started decreasing towards harvest
but were maintained well into the R5 stage.
Leaf area index (LAI), crop growth rate (CGR) and relative growth rate (RGR) where
measured along the growing season to examine how the treatments affected these parameters and
ultimately soybean yield. LAI is defined as the ratio of unit leaf area of the crop to unit ground
area. Previous research on soybeans indicates that LAI values of 3.5 to 4.0 by R2 and R4
78
developmental stages (full flowering to full pod) are critical in order to maximize photosynthetic
potential (Board and Harville, 1992; Westgate, 1999). Soybean leaf area index values showed
significant differences for the main effects cover crop (p<0.049) and time (p<0.0262). There
were no significant differences for the interactions between cover crop and compaction level or
the main effects (Table 2.5). At R5 stage LAI showed reductions of 10-15% for the WCC that
overwintered. Although restricted by drought events on both growing seasons LAI values were
maximum at R5 stage ranging from 3.9 to 4.7.
CGR is defined as dry matter accumulation rate per day per unit land area. Canopy
photosynthetic rate and CGR directly control total dry matter (TDM) production (Board, 2011).
Final yield is a function of (TDM) produced and the percentage of dry matter transferred into
harvestable portion indicated by harvest index (Loomis and Connor 1992). Relative growth rate
(RGR) is defined as dry matter accumulation per day per unit plant material, and it serves as a
measure of biomass production efficiency (Evans, 2003).
Dry matter accumulation (DM) showed significant values for the three way interaction
between cover crop compaction and time (p>0.0005), the interaction between cover crop and
time (p<0.0051) and the main effect time (p<0.0012) (Table 2.6). Although differences in DM
were observed throughout the growing season, there were no differences TDM at harvest.
Despite maximum LAI recorded at R5 stage, DM at this stage was below the 500 g m-2
value
suggested as a threshold to maximize yield (Egli et al., 1987). Likely the drought conditions
present during both growing seasons led to stomata closure reducing photosynthesis and thus
CGR and TDM (Board, 2011). In addition, CGR season showed significant differences in the
three way interaction between cover crop compaction and time (p>0.0001), and for cover crop
and time (P<0.0007) throughout the growing season (Table 2.7). Overall CGR from R1-R5

79
showed no significant differences between cover crops or compaction levels. Relative growth
rates (RGR) showed no significant differences for the interactions between cover crop and
compaction levels or for the main effects (Table 2.8). The lack of significant differences in RGR
agrees with the results from TDM and CGR indicating that growth patterns were similar across
treatments.
Soybean Yield Components and Yield
In soybean, as in most other grain crops, seed number per unit area is an important
determinant of yield in many crop plants including soybean (Egli, 1998). Pods and seed number
in soybean is largely determined by the environmental conditions between initial bloom R1 stage
(Fehr and Caviness, 1977) and the beginning of seed filling R5 stage (Egli, 1998). This period is
critical for soybean yield. Stresses during this period should be avoided to achieve optimum pod
number and yield (Board and Tan, 1995). Jiang and Egli (1995) reported results showing a linear
relationship between average CGR during R1 to R5 and seeds production, indicating that seeds
per square meter is determined primarily by canopy photosynthesis during flowering and podset.
In the present study, soybean yields were very dissimilar for both environments in agreement
with differences in total precipitation and deviations from the 30 year average (Figure 2.1). In
2011 overall soybean yield was 4.250 Mg ha-1
, and above the average for Champaign County for
that year (3.7 Mg ha-1
). In 2012 Soybean grand mean yield across treatments was 2.820 Mg ha-1
below the average for Champaign County (3.1 Mg ha-1
). No interactions between WCC and
compaction treatments were observed for yield data. No significant yield differences were
observed across WCC and induced compaction treatments. However, the lower yielding plots
coincided with plots with high WCC biomass: RR and RTR yield was 0.24 Mg ha1
lower in
comparison with the NCOV plots. These results agree with results reported by Crandall (2005)

80
and Wortman (2012) and the importance of appropriate cover crop residue management in
maximizing potential agronomic benefits associated with cover crops. The NCOV plots in turn
were out yielded by the R, RB and RHV plots by 0.24 Mg ha1.Yield trends between compaction
treatments were smaller; Nc yielded 0.1Mg ha1 more than TK (Table 2.2). The lack of significant
effect of WCC on soybean yield agrees with results reported by Wagner-Riddle et al. (1994)
Swanton et al. (1998), Reddy (2003) and Ruffo et al. (2004). No interactions were observed
between WCC and compaction levels for soybean yield components. Additionally yield
components: pod number, seeds per pod and seed number per plant were not significant for
either cover crops or compaction treatments. Seed number per pod was very consistent across
WCC and compaction treatments. Number of seeds per plants where higher for the rye WCC and
was evident that plants were compensating yield for lower population with an increase
production of seeds per plant. Soybean has the ability to regulate branch production in response
to available space within a canopy (Carpenter and Board, 1997) and pod per reproductive node to
produce similar seed and pod number as higher populations (Board, 2000).
CONCLUSION
This study provides lacking information regarding the effects of compaction induced
treatments and selected WCC on soybean production in poorly drained soils in Illinois. The two
environments evaluated differed greatly between them and from the 30 year average in Central
Illinois. The compaction levels achieved in this study disappeared during the winter season likely
due to self-mulching capacity of the studied soils and thus we were unable to evaluate the effect

81
of compaction on the soybean crop yet future research is needed in this regard. Interestingly
though the WCC generated differences in soybean population, these differences did not have a
negative impact on the final soybean yield. Similarly differences in LAI, height and number of
nodes measured during the growing seasons did not affect yield. Based on this study we
concluded that following appropriate management practices, WCC should not affect negatively
soybean growth parameters and yield. This is an important consideration for producers in the
region who may be reluctant to incorporate WCC based on the perception of lower yields
following WCC.

82
TABLES AND FIGURES
Table 2.1 Winter cover crop aboveground biomass before termination.
WCC dry biomass
RR RTR RHV Growing season Mg ha
-1 SED† 2010-2011 8.66 8.15 2.29 0.38
2011-2012 6.05 5.96 4.03 0.35
†SED, standard error of the mean values.
RHV, radish +hairy vetch; RR, radish+rye; RTR, radish+triticale.

83
Cover crop Growing Season
Month
OCT NOV DEC JAN FEB MAR APR
Pre
cip
iation (
mm
)
0
50
100
150
200
250
2010-2011
2011-2012
1990-2012
Soybean Growing season
Month
APR MAY JUN JUL AUG SEP OCT
Pre
cip
iation (
mm
)
0
50
100
150
200
250
2011
2012
1990-2012
Cover crop Growing Season
Month
OCT NOV DEC JAN FEB MAR APR
Te
mp
era
ture
(oC
)
-10
-5
0
5
10
15
2010-2011
2011-2012
1990-2012
Soybean Growing Season
Month
APR MAY JUN JUL AUG SEP OCT
Te
mp
era
ture
(oC
)
0
5
10
15
20
25
30
2011
2012
1990-2012
Figure 2.1 Precipitation and temperature for the cover crops (left panels) and soybean growing
seasons (right panels) 2011 and 2012 compared with the average for 1990-2012.

84
Table 2.2 Mean of main effects cover crop and compaction level for yield and yield components at harvest.
Treatment Population Height Yield
Number of
Nodes Pod number
Seed
number
Seed
number
Harvest
index
CGR
R1-R5
Cover crop Plants ha-1
cm kg ha-1
Nodes
plant-1
ln pods
pl-1
(pods pl-1
) Seeds pod-1
Seeds
plant-1
% g m-2
day-1
NCOV 333755 90.6 3507 17.7 3.4 (32.4) 2.4 77.0 50.3 7.2
R 343809 94.2 3723 17.8 3.5 (33.0) 2.4 78.0 50.1 7.7
RB 339649 91.6 3701 17.6 3.5 (33.1) 2.4 78.0 53.3 7.7
RHV 317476 90.3 3759 17.5 3.6 (35.9) 2.4 84.1 47.7 8.2
RR 268104 84.0 3268 17.7 3.7 (42.1) 2.3 98.1 38.5 7.6
RTR 294530 85.2 3373 16.9 3.6 (35.6) 2.3 80.9 45.1 7.1
†SED 14886 7.4 252 0.5 0.1 0.1 9.9 7.7 1.1
Compaction
Nc 316965 89.5 3513 17.6 3.5 (33.4) 2.4 79.1 45.5 7.4
ST 316993 89.2 3674 17.4 3.6 (37.2) 2.3 88.5 48.9 6.8
LT 319257 89.5 3564 17.5 3.5 (34.7) 2.3 80.5 47.9 8.6
TK 311667 89.1 3470 17.5 3.6 (36.1) 2.3 82.6 47.8 7.4
SED 17696 3.4 140 0.3 0.1 0.0 5.2 2.1 0.5
†SED, standard error of the differences.
NCOV, no cover; R, radish; RB, radish +buckwheat; RHV, radish +hairy vetch; RR, radish+rye; RTR, radish+triticale.
Nc, no compaction; ST, small tractor; LT, large tractor; TK, truck.
‡CC, Cover crop; CL, Compaction level.
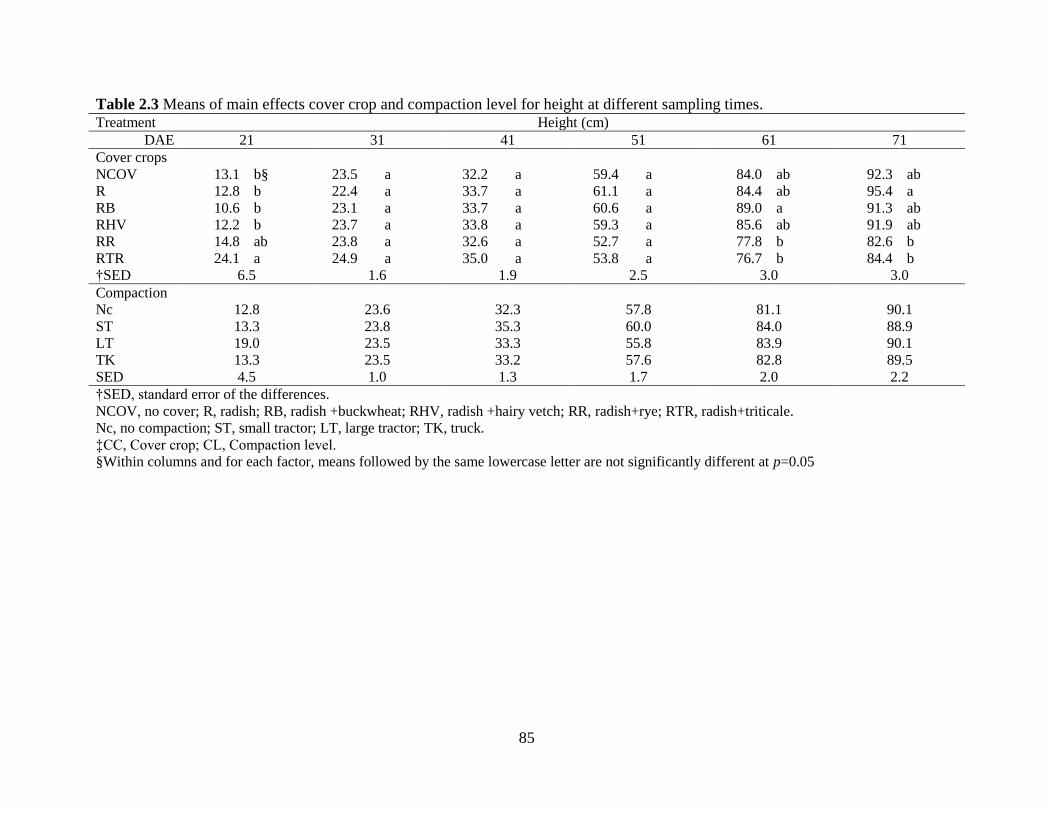
85
Table 2.3 Means of main effects cover crop and compaction level for height at different sampling times. Treatment Height (cm)
DAE 21 31 41 51 61 71
Cover crops
NCOV 13.1 b§ 23.5 a 32.2 a 59.4 a 84.0 ab 92.3 ab
R 12.8 b 22.4 a 33.7 a 61.1 a 84.4 ab 95.4 a
RB 10.6 b 23.1 a 33.7 a 60.6 a 89.0 a 91.3 ab
RHV 12.2 b 23.7 a 33.8 a 59.3 a 85.6 ab 91.9 ab
RR 14.8 ab 23.8 a 32.6 a 52.7 a 77.8 b 82.6 b
RTR 24.1 a 24.9 a 35.0 a 53.8 a 76.7 b 84.4 b
†SED 6.5 1.6 1.9 2.5 3.0 3.0
Compaction
Nc 12.8
13.3
19.0
13.3
4.5
23.6
23.8
23.5
23.5
1.0
32.3
35.3
33.3
33.2
1.3
57.8
60.0
55.8
57.6
1.7
81.1
84.0
83.9
82.8
2.0
90.1
88.9
90.1
89.5
2.2
ST
LT
TK
SED
†SED, standard error of the differences.
NCOV, no cover; R, radish; RB, radish +buckwheat; RHV, radish +hairy vetch; RR, radish+rye; RTR, radish+triticale.
Nc, no compaction; ST, small tractor; LT, large tractor; TK, truck.
‡CC, Cover crop; CL, Compaction level.
§Within columns and for each factor, means followed by the same lowercase letter are not significantly different at p=0.05
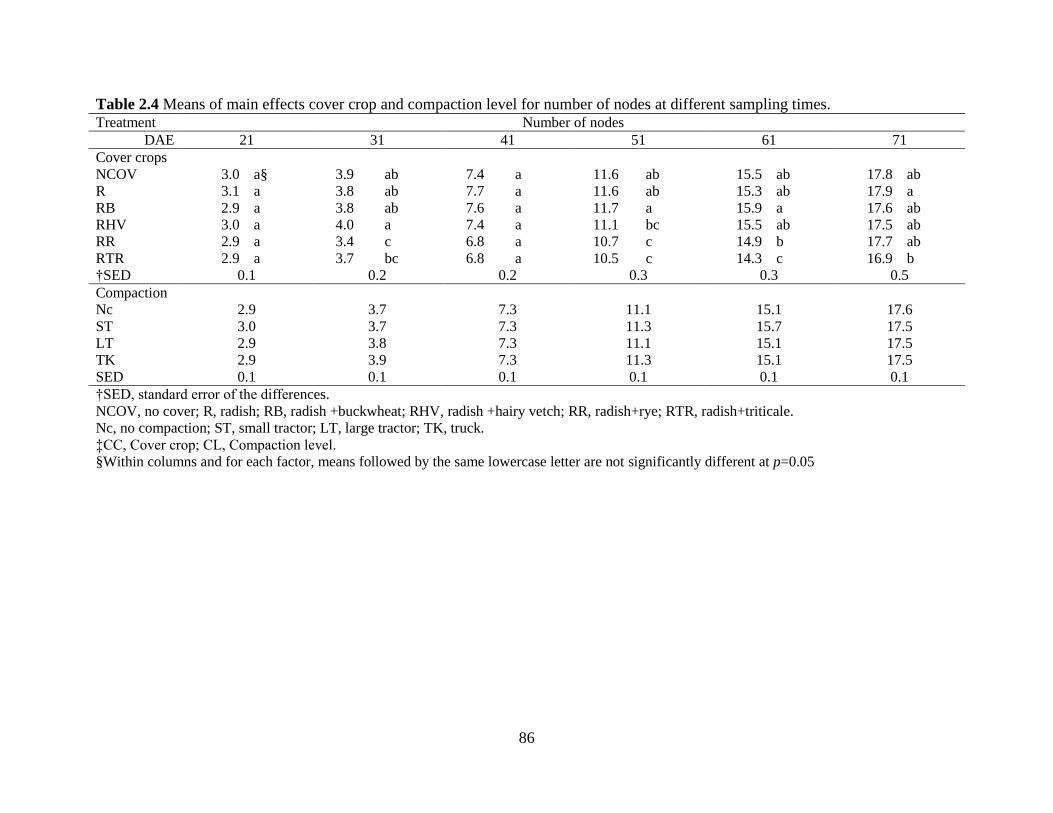
86
Table 2.4 Means of main effects cover crop and compaction level for number of nodes at different sampling times. Treatment Number of nodes
DAE 21 31 41 51 61 71
Cover crops
NCOV 3.0 a§ 3.9 ab 7.4 a 11.6 ab 15.5 ab 17.8 ab
R 3.1 a 3.8 ab 7.7 a 11.6 ab 15.3 ab 17.9 a
RB 2.9 a 3.8 ab 7.6 a 11.7 a 15.9 a 17.6 ab
RHV 3.0 a 4.0 a 7.4 a 11.1 bc 15.5 ab 17.5 ab
RR 2.9 a 3.4 c 6.8 a 10.7 c 14.9 b 17.7 ab
RTR 2.9 a 3.7 bc 6.8 a 10.5 c 14.3 c 16.9 b
†SED 0.1 0.2 0.2 0.3 0.3 0.5
Compaction
Nc 2.9
3.0
2.9
2.9
0.1
3.7
3.7
3.8
3.9
0.1
7.3
7.3
7.3
7.3
0.1
11.1
11.3
11.1
11.3
0.1
15.1
15.7
15.1
15.1
0.1
17.6
17.5
17.5
17.5
0.1
ST
LT
TK
SED
†SED, standard error of the differences.
NCOV, no cover; R, radish; RB, radish +buckwheat; RHV, radish +hairy vetch; RR, radish+rye; RTR, radish+triticale.
Nc, no compaction; ST, small tractor; LT, large tractor; TK, truck.
‡CC, Cover crop; CL, Compaction level.
§Within columns and for each factor, means followed by the same lowercase letter are not significantly different at p=0.05

87
Table 2.5 Mean of main effects cover crop and compaction level for LAI at different sampling times Treatment LAI
DAE 21 31 41 51 61 71
Cover crops
NCOV 0.3 1.8 2.6 3.2 3.4 4.7
R 0.4 2.0 2.7 3.3 3.5 4.6
RB 0.3 1.9 2.8 3.4 3.7 4.7
RHV 0.3 1.8 2.5 3.0 3.3 4.4
RR 0.3 1.6 2.4 2.9 3.1 4.2
RTR 0.3 1.6 2.3 2.8 2.8 4.0
†SED 0.2 0.2 0.2 0.2 0.2 0.2
Compaction
Nc 0.3 1.8 2.6 3.1 3.3 4.3
ST 0.3 1.8 2.6 3.4 3.5 4.8
LT 0.3 1.8 2.5 3.0 3.2 4.3
TK 0.3 1.7 2.5 3.0 3.2 4.2
SED 0.1 0.1 0.1 0.1 0.1 0.1
†SED, standard error of the differences.
NCOV, no cover; R, radish; RB, radish +buckwheat; RHV, radish +hairy vetch; RR, radish+rye; RTR, radish+triticale.
Nc, no compaction; ST, small tractor; LT, large tractor; TK, truck.
‡CC, Cover crop; CL, Compaction level.

88
Table 2.6 Means of main effects cover crop and compaction level for DM at different sampling times. Treatment DM
DAE 21 31 41 51 61 71
Cover crops
NCOV 16.6 a§ 80.7 a 108.5 a 260.0 a 313.4 a 344.6 a
R 17.9 a 71.6 a 107.8 a 268.0 a 307.4 a 343.0 ab
RB 15.7 a 68.5 a 112.8 a 254.1 ab 304.6 a 319.4 b
RHV 15.0 a 72.5 a 115.6 a 255.6 a 321.2 a 351.7 a
RR 12.3 a 64.0 a 99.2 a 272.8 a 282.1 ab 329.7 ab
RTR 13.0 a 67.7 a 99.5 a 240.9 b 266.2 b 343.4 ab
†SED 12.7 12.7 12.7 12.7 12.7 12.7
Compaction
Nc 15.6
14.7
15.3
14.8
10.6
74.1
68.9
69.6
70.7
10.6
105.4
111.6
105.3
106.6
10.6
257.0
266.3
260.0
251.0
10.6
282.0
326.8
293.4
294.5
10.6
347.8
352.1
328.6
326.1
10.6
ST
LT
TK
SED
†SED, standard error of the differences.
NCOV, no cover; R, radish; RB, radish +buckwheat; RHV, radish +hairy vetch; RR, radish+rye; RTR, radish+triticale.
Nc, no compaction; ST, small tractor; LT, large tractor; TK, truck.
‡CC, Cover crop; CL, Compaction level.
§Within columns and for each factor, means followed by the same lowercase letter are not significantly different at p=0.05

89
Table 2.7 Means of main effects cover crop and compaction level for CGR at different sampling times. Treatment CGR
DAE 21 31 41 51 61 71
Cover crops
NCOV 0.8 a§ 5.5 a 2.6 a 17.1 ab 6.6 ab 6.2 b
R 0.9 a 5.0 a 3.4 a 17.9 ab 5.3 b 6.3 b
RB 0.7 a 4.7 a 4.1 a 16.4 b 6.7 ab 5.2 b
RHV 0.7 a 5.2 a 4.2 a 16.2 b 7.8 a 5.7 b
RR 0.6 a 4.7 a 2.8 a 19.4 a 2.7 c 8.7 a
RTR 0.6 a 4.9 a 2.8 a 16.2 b 4.1 c 11.1 a
†SED 1.3 1.3 1.3 1.3 1.3 1.3
Compaction
Nc 7.4
7.5
7.3
6.2
1.1
5.1
4.6
4.4
4.7
1.4
3.2
4.3
3.7
3.7
1.4
15.4
16.0
16.1
15.1
1.4
5.4
8.8
6.3
7.0
1.4
10.6
6.9
8.3
7.6
1.4
ST
LT
TK
SED
†SED, standard error of the differences.
NCOV, no cover; R, radish; RB, radish +buckwheat; RHV, radish +hairy vetch; RR, radish+rye; RTR, radish+triticale.
Nc, no compaction; ST, small tractor; LT, large tractor; TK, truck.
‡CC, Cover crop; CL, Compaction level.
§Within columns and for each factor, means followed by the same lowercase letter are not significantly different at p=0.05

90
Table 2.8 Mean of main effects cover crop and compaction level for RGR at different sampling
times. Treatment RGR (g m
-2 plant day
-1)
DAE 21 31 41 51 61 71
Cover crops
NCOV 0.02 0.02 0.02 0.02 0.02 0.01
R 0.02 0.02 0.02 0.02 0.01 0.01
RB 0.02 0.02 0.02 0.02 0.02 0.01
RHV 0.02 0.02 0.02 0.02 0.02 0.01
RR 0.02 0.02 0.02 0.02 0.01 0.01
RTR 0.02 0.02 0.02 0.02 0.01 0.02
†SED 0.001 0.001 0.001 0.001 0.001 0.001
Compaction
Nc 0.02 0.02 0.02 0.02 0.01 0.02
ST 0.02 0.02 0.02 0.02 0.02 0.01
LT 0.02 0.02 0.02 0.02 0.02 0.01
TK 0.02 0.02 0.02 0.02 0.02 0.01
SED 0.001 0.001 0.001 0.001 0.001 0.001
†SED, standard error of the differences.
NCOV, no cover; R, radish; RB, radish +buckwheat; RHV, radish +hairy vetch; RR, radish+rye; RTR,
radish+triticale.
Nc, no compaction; ST, small tractor; LT, large tractor; TK, truck.
‡CC, Cover crop; CL, Compaction level.
91
REFERENCES
Andrade, A., Wolfe, D.W., and Fereres, E.1993. Leaf expansion, photosynthesis, and water
relations of sunflower plants grown on compacted soil. Plant Soil 149:175-184.
Araujo, M.A., Tormena, C.A., Inoue, T.T., and Costa, A.C.S. 2004. Efeitos da escarificacão na
qualidade física de um Latossolo Vermelho distroférrico após treze anos de semeadura direta.
Rev. Bras. Ciênc. Solo 28: 495–504.
Arvidsson, J. 1999. Nutrient uptake and growth of barley as affected by soil compaction. Plant
Soil 208:9-19.
Arvidsson, J., and Håkansson, I.1991. A model for estimating crop yield losses caused by soil
compaction. Soil Till. Res. 20:319-332.
Baker, J.M., and Griffis T.J. 2009. Evaluating the potential use of winter cover crops in corn
soybean systems for sustainable co-production of food and fuel. Agr. Forest. Meteorol.
149:2120-2132.
Blake, G.R., and Hartge, K.H.1986. Bulk Density. Methods of Soil Analysis, Part 1, Soil Sci.
Soc. Am., 363-376, Madison, WI, USA.
Board, J.E., and C.S. Kahlon. 2011. Soybean yield formation: what controls it and how it can be
improved. pp.1-36. In El-Shemy, H.A. Ed. Soybean Physiology and Biochemistry. Intech
publishing.
Board, J.E., and Harville, B.G.1992. Explanations for greater light interception in narrow- vs.
wide-row soybean. Crop Sci. 32: 198–202.

92
Board, J.E., and Tan, Q.1995. Assimilatory capacity effects on soybean yield components and
pod formation. Crop Sci. 35: 846–851.
Board, J.E. 2000. Light interception efficiency and light quality affect yield compensation of
soybean at low plant populations. Crop Sci. 40:1285-1294.
Bollero, G.A. 1994. Cover cropping systems for the Central Corn Belt. J. Prod. Agric. 7:55–58
Busscher, W.J., Bauer, P.J., and Frederick, J.R. 2002. Recompaction of a coastal loamy sand
after deep tillage as a function of subsequent cumulative rainfall. Soil Till. Res. 68: 49–57.
Buttery, B.R. 1998. The effects of soil compaction, soil moisture and soil type on growth and
nodulation of soybean and common bean. Can. J. Plant Sci. 78:571–576.
Carpenter, A.C., and Board, J.E. 1997. Branch yield components controlling soybean yield
stability across plant populations. Crop Sci. 37:885-891.
Chen, G., and Weil, R.R. 2010. Penetration of cover crop roots through compacted soils. Plant
Soil 331:31-43.
Clark, A.J., Decker, A.M., Meisinger, J.J., and McIntosh, M.S.1997. Kill date of vetch, rye, and
a vetch-rye mixture: I. Cover crop and corn nitrogen. Agron. J. 89:427-434.
Clark, A. 2007. Managing cover crop profitably. 3rd edition. Beltsville, MD: Sustainable
Agriculture Network.
Crandall, S.M., Ruffo, M.L., and Bollero, G.A. 2005. Cropping system and nitrogen dynamics
under a cereal winter cover crop preceding corn. Plant Soil 268:209-219.
Cresswell, H.P. 1995. Subsoil amelioration by plant roots—The process and the evidence. Aust.
J. Soil Res. 33:221–239.
93
Davis, A. 2010. Cover crop roller-crimper contributes to weed management in no-till soybean.
Weed Sci. 58:300–309.
Dexter, A.R. 2004. Soil physical quality: Part I. Theory, effects of soil texture, density, and
organic matter, and effects on root growth. Geoderma 120:201-214.
Dexter, A.R. 1988. Advances in characterization of soil structure. Soil Till. Res. 11:199-238.
Ebelhar, S.A., Frye, W.V., and Blevins, R.L.1984. Nitrogen from legume cover crops for no
tillage corn. Agron. J. 76:51-55.
Eckert, D.J. 1988. Rye cover crops for no-tillage corn and soybean production. J. Prod. Agric.
1:207–210.
Egli, D.B. 1987. Factors associated with reduced yields of delayed plantings of soybeans. J.
Agron. Crop Sci. 159:176–185.
Egli, D.B. 1988. Plant density and soybean yield. Crop Sci. 28:977-981.
Egli, D.B.1999. Variation in leaf starch and sink limitations during seed filling in soybean. Crop
Sci. 39:1361-1368.
Evans, S. P., Knezevic, S.Z., Lindquist, J.L, and Shapiro, C.A., 2003. Influence of nitrogen and
duration of weed interference on corn growth and development. Weed Sci. 51:546–556.
Fehr, W. R., and Caviness, C.E. 1977. Stages of Soybean Development. Ames: Iowa State
University Cooperative Extension Service Special Rep. 80.
Flowers, M.D., and Lal, R.1998. Axle load and tillage effects on soil physical properties and
soybean grain yield on a mollic ochraqualf in northwest Ohio. Soil Till. Res. 48:21-35.

94
Friendly, M. 1991. SAS system for statistical graphics. 1st ed. SAS Inst., Cary, NC. Macros are
available from: http://www.datavis.ca/sasmac/.
Gaultney, L., Krutz, G.W., Steinhardt, G.C., and Liljedahl, J.B. 1982. Effects of subsoil
compaction on corn yields. T. ASAE 24: 563-569.
Håkansson I., Voorhees W.B., and Riley H.1988. Vehicle and wheel factors influencing soil
compaction and crop response in different traffic regimes. Soil Till. Res. 11:239-282.
Hamza, M. A., and Anderson, W. K. 2005. Soil compaction in cropping systems: A review of the
nature, causes and possible solutions. Soil Till. Res. 82: 121-145.
Horn, R. 2002. Soil mechanical properties and processes in structured unsaturated soils under
various land use and management systems, p. 305–330. In Pagliai, M. and Jones, R. ed.
Sustainable land management–environmental protection: A soil physical approach. Adv. in
GeoEcol. 35. Catena Verlag, Reiskirchen, Germany.
Ishaq, M., Hassan, A., Saeed, M., Ibrahim, M., and Lal, R. 2001. Subsoil compaction effects on
crops in Punjab, Pakistan. Soil Till. Res. 59:57–65.
Jiang H., and Egli, D.B. 1995. Soybean seed number and crop growth rate during flowering.
Agron. J. 87:264-267.
Johnson J.F., Voorhees, W.B., Nelson, W.W., and Randall, G.W. 1990. Soybean growth and
yield as affected by surface and suboil compaction. Agron. J. 82:973-979
Kuo, S., Sainju, U.M., and Jellum, E.J. 1997. Winter cover crop effects on soil organic carbon
and carbohydrate in Soil. Soil Sci. Soc. Am. J. 61:145-152.

95
Lal, R. 2004. Soil carbon sequestration impacts on global climate change and food security.
Science 304:1623-1627.
Letey, J. 1985. Relationship between soil physical properties and crop production, p. 277-294. In
Stewart, B.A. ed., Advances in Soil Science. New York, USA.
Lindemann, W.C., Ham, G.E., and Randall, G.W. 1982. Soil compaction effects on soybean
nodulation, N2(C2H4) fixation and seed yield. Agron. J. 74:307-311.
Loomis, R. S., and Connor, D. J. 1992. Crop Ecology: Productivity and Management in
Agricultural Systems. Cambridge University Press, Cambridge.
Meisinger, J.J. and Delgado, J. A. 2002. Principles for managing nitrogen leaching. J. Soil Water
Conserv. 57:485-498.
Miguez, F.E., and Bollero, G.A. 2006. Winter cover crops in Illinois. Crop Sci. 46:1536-1545.
Morgan, P.W., Sarquis, J.L., He, C., Jordan, W.R., and Drew, M.C. 1993. Regulation of ethylene
biosynthesis in maize root responses to stress, p.232-237. In Cellular and Molecular Aspects of
the Plant Hormone Ethylene. eds Pech, J.C., Latche, A., Balague, C. Dordrecht, The
Netherlands.
Passioura, J.B. 2002. Soil conditions and plant growth. Plant Cell Environ. 25:311-318.
Pedersen, P., and Lauer, J.G. 2004. Soybean growth and development in various management
systems and planting dates. Crop Sci. 44:508-515.
Radford, B.J., Yule, D.F., McGarry, D., and Playford, C. 2001. Crop responses to applied soil
compaction and to compaction repair treatments. Soil Till. Res. 61:157-166
96
Raimbault, B.A., and Vyn, T.J. 1991. Crop rotation and tillage effects on corn growth and soil
structural stability. Agron. J. 83:979-985.
Raper, R.L., and Kirby, J.M. 2006. Soil compaction: how to do it, undo it, or avoid doing it.
ASABE 2006 Distinguished Lecture Series. ASABE, St. Joseph, Michigan.
Reddy, V.R., Pachepsky, Y.A., and Whisler, F.D. 1998. Allometric relationships in field-grown
soybean. Ann. Bot. 82:125–131.
Reddy, K. N. 2001. Effects of cereal and legume cover crop residues on weeds, yield, and net
return in soybean (Glycine max). Weed Technol.15:660–668.
Reddy, K.N. 2003. Impact of rye cover crop and herbicides on weeds, yield, and net return in
narrow-row transgenic and conventional soybean (Glycine max). Weed Technol. 17:28–35.
Reeves, D.W. 1994. Cover crops and rotations, p. 125-172. In Hatfield, J.L., and Stewart, B.A.
eds. Advances in soil science. Crops residue management. CRC Press, Boca Raton, FL.
Reeves, D.W. 1997. The role of soil organic matter in maintaining soil quality in continuous
cropping systems. Soil Till. Res. 43:131-167.
Ruffo, M.L., Bullock, D.G., and Bollero, G.A. 2004. Soybean yield as affected by biomass and
nitrogen uptake of cereal rye in winter cover crop rotations. Agron. J. 96:800 805.
Ruffo, M.L. and Bolero, G.A. 2003. Modeling rye and hairy vetch residue decomposition as a
function of degree days and decomposition-days. Agron. J. 95:900– 907.
Sadras, V.O., O’Leary, G.J., and Roget, D.K. 2005. Crop responses to compacted soil: capture
and efficiency in the use of water and radiation. Field Crop. Res.91:131 148.

97
Sainju, U.M., Terrill, T.H., Gelaye, S., and Singh, B.P. 2003. Soil aggregation and carbon and
nitrogen pools under rhizoma peanut and perennial weeds. Soil Sci. Soc. Am. J. 67:146-155.
Sainju, U.M. 2002. Long-term effects of tillage, cover crops, and nitrogen fertilization on
organic carbon and nitrogen concentrations in sandy loam soils in Georgia, USA. Soil Till. Res.
63:167–179.
Shepherd, M.A., Harrison, R., and Webb, J. 2002. Managing soil organic matter – implications
for soil structure on organic farms. Soil Use and Manage. 18:284-292.
Shipley, P. R., Messinger, J.J., and Decker, A.M. 1992. Conserving residual corn fertilizer
nitrogen with winter cover crops. Agron. J. 84:869–876.
Singer, J.W., Nusser, S.M., and Alf, C.J. 2007. Are cover crops being used in the U.S. Corn
Belt? J. Soil Water Conserv. 62:353–358.
Smith, M.S., Frye, W., and Varco, J. 1987. Legume winter cover crops, p.95-139. In Stewart,
B.A. ed., Advances in Soil Science. New York.
Snapp, S.S., Swinton, S.M., Labarta, R., Mutch, D., Black, J.R., Leep, R., Nyiraneza, J., and
O’Neil, K. 2005. Evaluating cover crops for benefits, costs, and performance within cropping
system niches. Agron. J.97:322–332.
Soane, B.D. 1990. The role of organic matter in soil compactibility: A review of some practical
aspects. Soil Till. Res. 16:179-201
Soane, B.D., and Van Ouwerkerk, C. 1994. Soil Compaction in Crop Production, p.662-670. In
Soane, B.D., and Van Ouwerkerk, C. eds., Developments in Agricultural Engineering Series.
Amsterdam, The Netherlands.
98
Soil Survey Staff, Natural Resources Conservation Service, United States Department of
Agriculture. Official Soil Series Descriptions. Available online
http://soils.usda.gov/technical/classification/osd/index.html. Accessed [12/07/2012].
Strock, J.S., Porter, P.M., and Russelle, M.P. 2004. Cover cropping to reduce nitrate loss through
subsurface drainage in the northern U.S. Corn Belt. J. Environ.Qual. 33, 1010–1016.
Swanton, C.J., Vyn, T.J., Chandler, K., and Shrestha, A. 1998. Weed management strategies for
no till soybean (Glycine max) grown on clay soils. Weed Tech. 12:660-669.
Thomas, G.W., Haszler, G.R., and Blevins, R.L. 1996. The effects of organic matter and tillage
on maximum compactability of soils using the Proctor test. Soil Sci. 161:502–508.
Unger, P.W., and Kaspar, T.C.1994. Soil compaction and root growth: A review. Agron. J.
86:759-766.
Villamil, M.B., Bollero, G.A., Darmody, R.G., Simmons, F.W., and Bullock, D.G. 2006. No-till
corn/soybean systems including winter cover crops. Soil Sci. Soc. Am. J. 70:1936-1944.
Villamil, M.B., Miguez, F.E., and Bollero, G.A. 2008. Multivariate analysis and visualization of
soil quality data for no-till systems. J. Environ. Qual. 37:2063-2069.
Voorhees, W.B. 1987. Assessment of soil susceptibility to compaction using soil and climatic
data bases. Soil Till. Res. 10: 29-38.
Wagger, M.G., and Mengel, D.B. 1988. The role of nonleguminous cover crops in the efficient
use of water and nitrogen. p. 115–128. In Hargrove, H.L. ed. Cropping strategies for efficient use
of water and nitrogen. ASA Spec. Publ. 51. ASA, CSSA, and SSSA, Madison, WI.
99
Wagner-Riddle, C. 1994. Rye cover crop management impact on soil water content, soil
temperature and soybean growth. Can. J. Plant Sci. 74:485–495.
Westgate, L.R., and Singer, J.W. 2005. Soybean development is affected by method and timing
of rye control in cover crop systems. J. Nat. Res. Life Sci. Ed. 34:17-21.
Westgate, M.E. 1999. Managing soybeans for photosynthetic efficiency. In Kauffman, H.E. ed.
World soybean research. Proc. World Soybean Res. Conf. Chicago, IL.
Williams II, M.M. 2000. No-tillage soybean performance in cover crops for weed management
in the western corn belt. J. Soil Water Conserv. 55:79–84.
Williams, S.M., and Weil, R.R. 2004. Crop cover root channels may alleviate soil compaction
effects on soybean crop. Soil Sci. Soc. Am. J. 68, 1403–1409.
Wortman, S.E., Francis, C.A., Bernards, M.A., Blankenship, E.E., and Lindquist, J.L. 2012.
Mechanical termination of diverse cover crop mixtures for improved weed suppression in
organic cropping systems. Weed Sci. 61:162-170.
Zhang, H.1994.Organic matter incorporation affects mechanical properties of soil aggregates.
Soil Till. Res. 31:263-275.
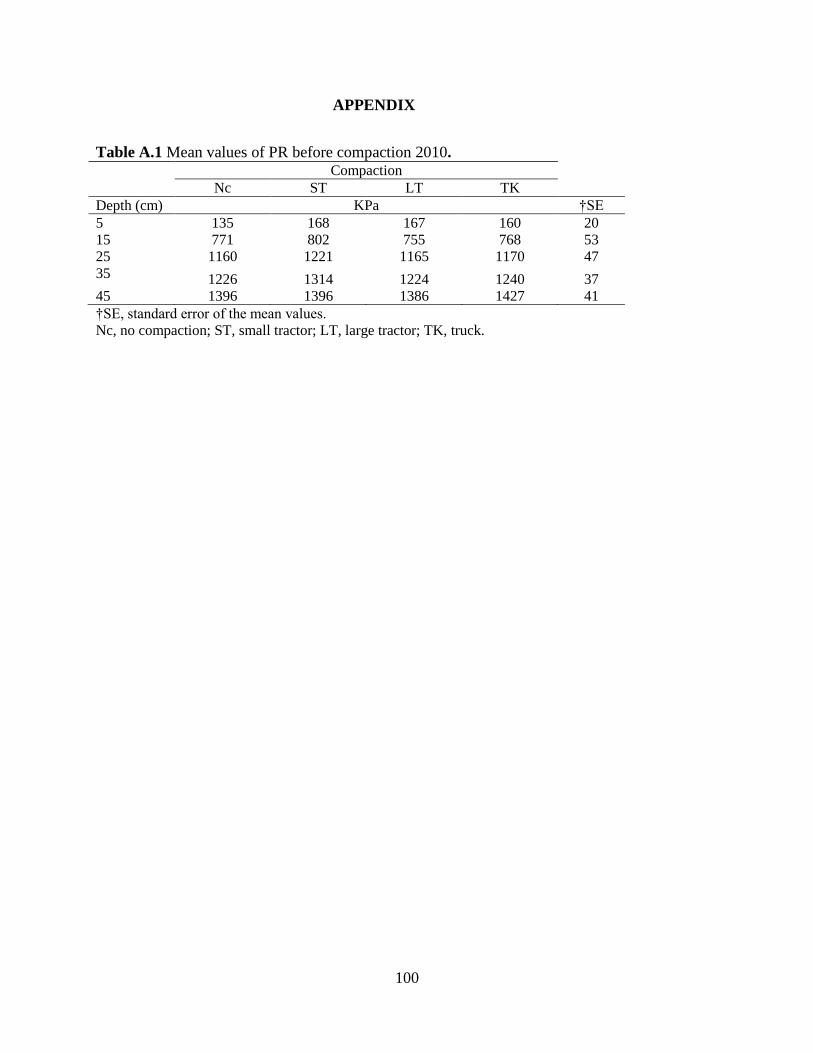
100
APPENDIX
Table A.1 Mean values of PR before compaction 2010. Compaction
Nc ST LT TK
Depth (cm) KPa †SE
5 135 168 167 160 20
15 771 802 755 768 53
25 1160 1221 1165 1170 47
35 1226 1314 1224 1240 37
45 1396 1396 1386 1427 41
†SE, standard error of the mean values.
Nc, no compaction; ST, small tractor; LT, large tractor; TK, truck.

101
Table A.2 Mean values of PR before compaction 2011. Compaction
Nc LT TK
Depth (cm) KPa SE†
5 284 244 303 53
15 1072 981 1116 119
25 1197 1147 1318 123
35 1371 1298 1263 53
45 1518 1453 1426 53
†SE, standard error of the mean values.
Nc, no compaction; ST, small tractor; LT, large tractor; TK, truck.