Embed Size (px)
Citation preview
Journal of
Medical Pharmaceutical www.jmpas.com
And Allied Sciences ISSN NO. 2320 - 7418
Journal of Medical Pharmaceutical and Allied Sciences (Vol-7_I-1_2018) 02; 970-982 970
Research Article
The Efficacy of Mean Gestation Sac
Diameter Measurement By Ultrasound
In Estimating The Gestational Age
Dr Hisham Al-Hammami, Mhd Nezar Alsharif*, Yaser Fawaz,
Gebrail Thomas
Department of Obstetrics and Gynecology, Syrian Private
University. Damascus, Syrian Arab Republic.
Correspondence
Mhd Nezar Alsharif*
Department of obstetrics and
gynecology, Syrian private
university. Damascus, Syrian
Arab Republic
Keywords
Obstetric complication,
Malposition, gestational
age, regression model, LMP
method.
Received
25 December 2017
Reviewed
04 January 2018
Accepted
08 January 2018
ABSTRACT
This research aimed to determine the efficacy of Mean Gestation Sac Diameter (MGSD) by
ultrasound in estimating the Gestational Age (GA) compared to GA by Naegele’s rule using Last
menstrual period (LMP) date. This was a prospective observational study of women with a
normal spontaneously conceived viable singleton pregnancy, a regular menstrual cycles, and
spontaneous onset of labor at term. The LMP was considered certain in all cases. We used
ultrasound to scan 2067 fetuses (894 healthy women) and we had 515 MGSD measurements.
Data were collected prospectively and used for statistical analysis. We used Descriptive Statistics
to calculate the Mean, Standard Deviation (SD), Median and Percentiles values (3rd, 5th, 10th,
50th, 90th, 95th, and 97th) for MGSD measurements on gestational age. We found a regression
equation to estimate the GA using MGSD measurements. The results of the current study were
compared with different studies using the Paired Differences (t-test analysis). The Mean Sum of
Squares of regression deviations of the GA regression model using (MGSD) was 897.9 and this
value is significant at P <0.001. The standard error of the Estimate (Standard Error) and the
standard deviation (SD) for the GA regression model (using MGSD measurements) was 0.74 and
0.73 when the GA is <12 weeks to 0.82 when the GA is between 12-18, respectively.
971
Journal of Medical Pharmaceutical and Allied Sciences (Vol-7_I-1_2018) 02; 970-982
INTRODUCTION
Monitoring fetal growth and assessing the
growth predictors has an important role in
the care of pregnant women. Accurate
estimation of GA gestational age and Fetal
Weight (FW) are clinically important.
Ultrasound is useful as an accurate method
for estimating Gestational Age (GA).
Different embryonic measurements can be
used to date pregnancy. Accurate estimation
of GA is important in for normal and
pathological pregnancies management.(1,2,3)
We used MGSD (mean gestational sac
diameter) to predict the GA in pregnant
women reviewing ALZAHRAWI Hospital.
Up to our Knowledge, this study is the first
of its kind in Syria.
MATERIALS AND METHODS
1- Study design: This study is a prospective
descriptive longitudinal population study.
2- Setting: AlTawlid University Hospital
3- Description of populations and variables:
All the participants were pregnant women
representing a specific geographic region
from Damascus and its suburbs, who
reviewed the hospital either to confirm
pregnancy or for following up. 51%
(455/894) of all participants were between
22-30 years old and most of them were
housewives of a low socioeconomic status.
4- Inclusion criteria:
Voluntary participation with
informed consent.
A correct, accurate and reliable
patient’s knowledge of the first day
of the LMP.
Regular menstrual cycles (at least
three previous regular menses).
Singular alive normal fetus with a
gestational age between 13-41
weeks. [3].
Spontaneous labor by full term
pregnancy (259-293 days/37-41
weeks).
5- Exclusion criteria: Women who have one
of the following:
Uncertainty of the LMP date.
Irregular menstrual cycles.
Multi-gestation or fetal demise.
Oral contraceptive use (OCP) or any
recent hormonal treatment (3-4
months) before current pregnancy.
Pregnancy during lactation.
History of previous abortion or
recent delivery preceding the current
pregnancy.
Diagnosis of fetal malformations
during examination or after birth.
Presence of any medical or obstetric
complication with known effect on
fetal growth.
Smoking or drug addiction.
MGSD measures taken after week 41
of pregnancy.
Pregnancies that ended in abortion
preterm or postterm deliveries.
Date of delivery (vaginal or cesarean
section) is inaccurate.
Malpositioned deliveries.

972
Journal of Medical Pharmaceutical and Allied Sciences (Vol-7_I-1_2018) 02; 970-982
6- Ultrasound examination: An ultrasound
examination was made for 894 pregnant
women (2067 fetuses) who were selected
according to the previously explained
inclusion and exclusion criteria and
reviewed the hospital between March 2017
and November 2017 to determine
gestational age by measuring different fetal
parameters (in this study MGSD). We had
515 MGSD measurements.
Statistical Analysis Methods
The regression model of the MGSD was
used to determine the GA and in order to
choose the best regression model we used
the: 1- Coefficient of Determination (r2) and
the adjusted Coefficient of Determination
( ) and chose the one with the higher value.
2- The standard error (Std.Error) of both
methods and chose the one least value. 3-
Durbin–Watson Test and chose the one that
gives a value close to the Std.Error. 4- The
significance of regression model by doing an
analysis of variance. 5- The significance of
the regression model constants’ (parameters)
using T test. 6- Estimating the SD of the GA
using the MGSD regression model. Paired –
Samples T-TEST were done to test each
method accuracy.
RESULTS AND DISCUSSION
Growth chart of the MGSD measurements
(mm) showing the Percentile Values and
Standard deviation (SD) between 5-15
weeks of pregnancy, Table 1.
The Embryonic Parameters have several
applications in clinical practice such as
estimating the gestational age, fetal weight,
and fetal growth. In this study, we presented
Growth Charts & Tables with the (3rd, 5th,
10th, 50th, 90th, 95th, and 97th) Percentile
Values and the standard deviation of MGSD
during the concordant pregnancy periods.
We set a regression model equation that can
be used to estimate the expected GA using
MGSD measurements (mm).This equation
was statistically significant (P <0.001). A
strong correlation was found between the
dependent variable (GA) and the
independent variable (MGSD). We found a
third degree valuable regression equation
(p<0.001) that we can use to get the
expected GA from MGSD measures (mm).
GA from MGSD measures (mm):
iY
= 5.155 + 0.05(MGSD)i +
0.0024(MGSD)i2 –1.83*10
5- (MGSD)i
3
r 2 =0.91 Std. Err
=0.74 Sig=0.000

973
Journal of Medical Pharmaceutical and Allied Sciences (Vol-7_I-1_2018) 02; 970-982
The Adjusted Coefficient of Determination
(r (2 of the regression model of GA (weeks)
using MGSD measurements (mm) was
0.91.). The coefficient of determination is
greater than 0.75 (75%), therefore, the
correlation between the dependent variable
Y line (GA) and the independent variable X
line (MGSD) is very strong (Figure 2).
The Mean Sum of Squares of regression
deviations of the GA regression model using
(MGSD) was 897.9 and this value is
significant at P <0.001. The standard error
of the Estimate (Std.Error) for the GA
regression model (using MGSD
measurements) was 0.74 (Figure 2). This
value represents the effect of many factors
that were not included in the regression
model which affect the dependent variable Y
line (GA). (Figure 2).
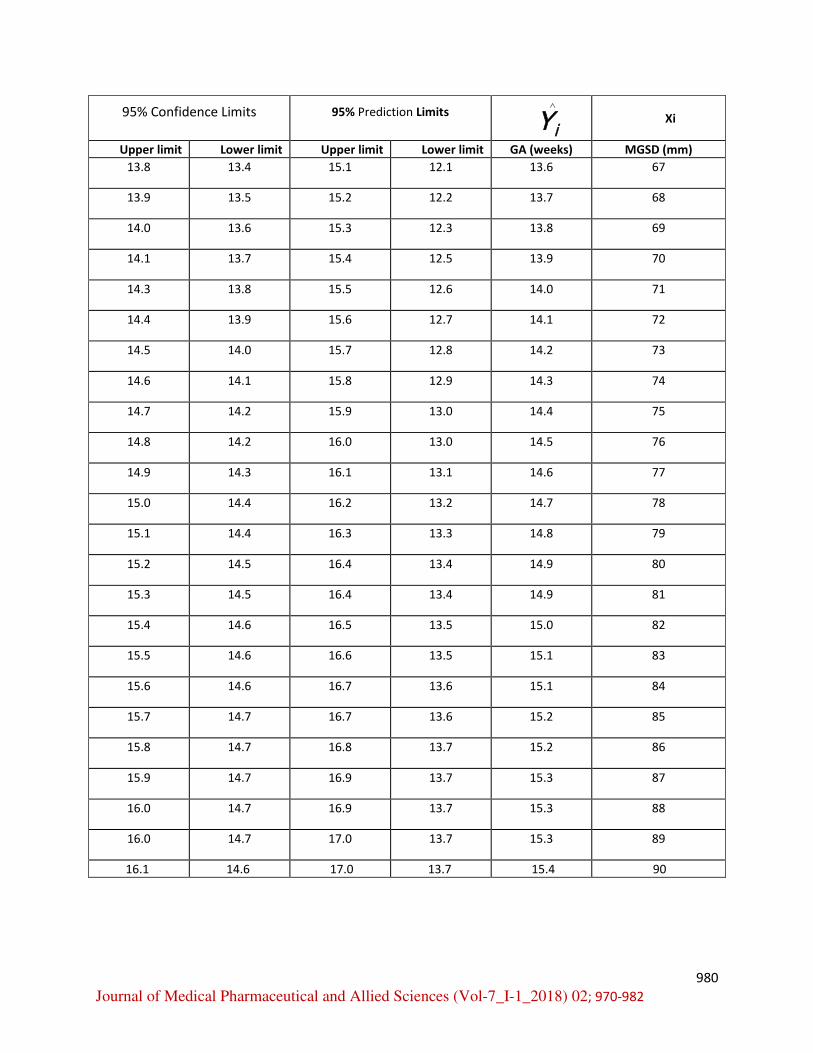
Figure 2 shows the expected GA (weeks)
using MGSD measurements (mm). Based on
the regression model, we also demonstrated
the expected GA, the lower and upper limits
of the confidence interval (Table 2). The
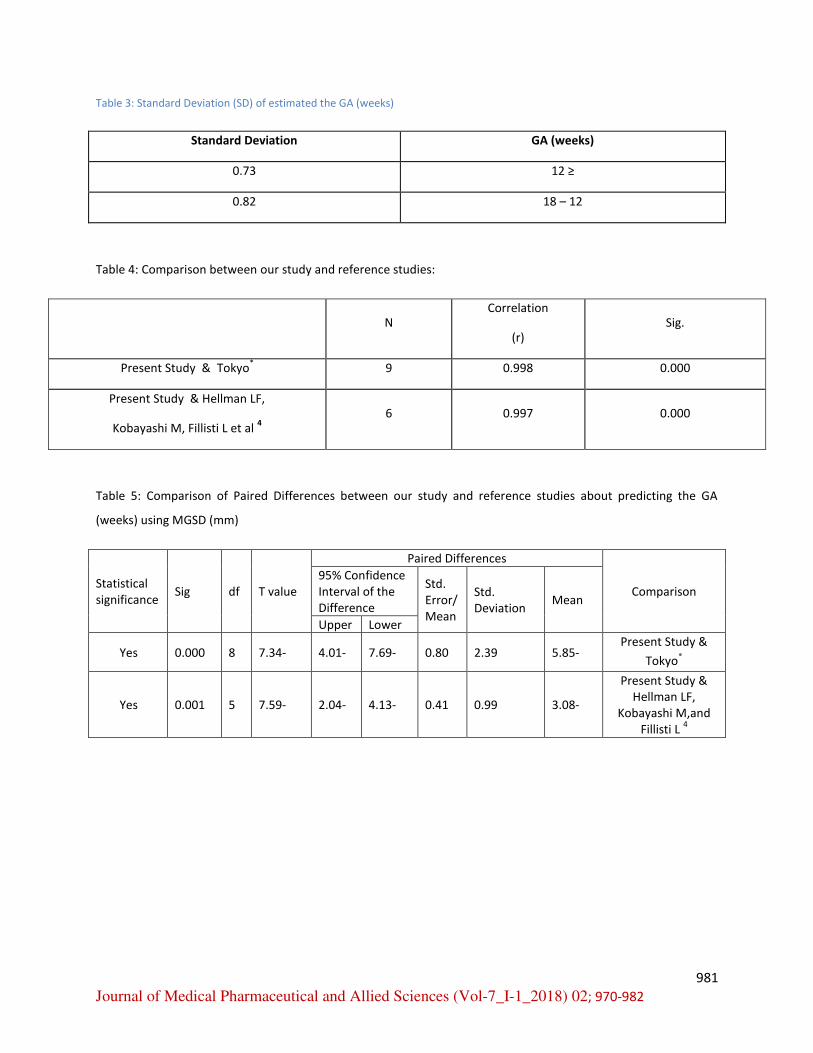
standard deviation (SD) of estimated the GA
(weeks) from the actual GA using MGSD
measurements (mm) was 0.73 weeks when
the GA is <12 weeks and 0.82 weeks when
the GA is between 12-18 years. (Table 3)
We compared this study to two similar
studies, one was done in Japan and the other
was Hellman LF and colleagues (1969) 34
.
We compared the correlation coefficient ,
the mean, standard deviation, standard Error,
lower and upper limits of the confidence
interval (95% Confidence Interval of the
Difference), the T value, the degree of
freedom df, P value and Statistical
Significance.
The comparison results were: the correlation
coefficients values were strong (0.998 and
0.997) and significant (0.000 and 0.000)
between this study and the compared studies
(The Japanese study and the Hellman LF
study and colleague’s studies), respectively
(P <0.001) (Table 4). The mean difference
in the MGSD measurements (mm) using the
Paired-Samples T-TEST between this study
and the (Japanese study and Hellman LF
study and colleagues) was -5.85 and -3.08
mm, respectively according to GA (weeks).
The negative values indicates that the values
of the compared studies were higher. There
is statistical significance (P <0.001) between
the current study and the compared studies.
(Table 5, Figure 3).
CONCLUSION
Many women do not recall their LMP and
most pregnant women review the clinic in
the first three months of pregnancy and the
estimation of GA is important for the follow

974
Journal of Medical Pharmaceutical and Allied Sciences (Vol-7_I-1_2018) 02; 970-982
up and determing the Expected delivery date
(EDD) for assessing growth during the rest
of pregnancy and predicting the expected
date of delivery (EDD). We presented
diagrams and tables for the estimation of
GA using MGSD measurements in a group
of pregnant Syrian women reviewing
ALZAHRAWI Hospital according to the
inclusion and exclusion criteria stated
before. These results can be useful in
women who cannot recall their last
menstrual period (LMP). Our criteria will
provide useful references for estimating
gestational age and fetal care. A larger study
might be needed to include a larger sample
of the population. We also compared our
results with similar studies abroad, and we
found that our results were lower than their
counterparts were. These results could help
in estimating the gestational age, diagnosing
fetuses who are younger than their GA, and
IUGR embryos. Thus, ultrasound may be
more accurate and could replace LMP
method.
RECOMMENDATIONS
1. Emphasize the importance of
doing a bigger more inclusive study
to determine the accuracy of the fetal
measurements in predicting the
delivery date
2. Using the MGSD by ultrasound to
determine the GA especially in
women who cannot recall their LMP
accurately.
REFERENCES
1. National Collaborating Centre for
Women's and Children's Health
(UK), 2008. Antenatal Care: Routine
Care for the Healthy Pregnant
Woman. London: RCOG Press;
(NICE Clinical Guidelines, No. 62.)
12, Fetal growth and wellbeing.
2. Wu M, Shao G, Zhang F, Ruan Z,
Xu P, Ding H, 2015. Estimation of
fetal weight by ultrasonic
examination. International Journal
of Clinical and Experimental
Medicine. 8(1):540-545.
3. Ana I.L. Namburete, Richard V.
Stebbing, Bryn Kemp, Mohammad
Yaqub, Aris T. Papageorghiou, J.
Alison Noble, 2015. Learning-based
prediction of gestational age from
ultrasound images of the fetal brain,
In Medical Image Analysis, Volume
21, Issue 1, Pages 72-86.
4. Hellman LF, Kobayashi M, Fillisti L
Growth and development of the
human fetus prior to the twentieth

975
Journal of Medical Pharmaceutical and Allied Sciences (Vol-7_I-1_2018) 02; 970-982
week of gestation. Am J Obstet
Gynecol 1969;103:pp789.
5. Papageorghiou AT, Kennedy SH,
Salomon LJ, 2014. International
standards for early fetal size and
pregnancy dating based on
ultrasound measurement of crown–
rump length in the first trimester of
pregnancy. Ultrasound in Obstetrics
& Gynecology.; 44(6):641-648.
6. Villandré L, Hutcheon JA, Perez
Trejo ME, Abenhaim H, Jacobsen G,
Platt RW, 2011. Modeling Fetal
Weight for Gestational Age: A
Comparison of a Flexible Multi-level
Spline-based Model with Other
Approaches. The International
Journal of Biostatistics. 7(1):32.

976
Journal of Medical Pharmaceutical and Allied Sciences (Vol-7_I-1_2018) 02; 970-982
TABLE AND FIGURE
Table 1: Growth chart of the MGSD measurements (mm) showing the Percentile Values and Standard deviation
(SD) between 5-15 weeks of pregnancy.
MGSD (mm) Percentiles Standard
deviation
(SD)
GA
(weeks) %97 %95 %90 %50 %10 %5 %3
15.1 14.3 13.1 8.7 4.3 3.1 2.3 3.4 5
22.0 20.9 19.2 13.3 7.4 5.7 4.6 4.6 6
32.5 30.9 28.5 19.8 11.2 8.8 7.2 6.7 7
38.3 37.0 35.0 28.0 20.9 18.9 17.6 5.5 8
46.3 44.9 42.7 35.1 27.4 25.2 23.8 6.0 9
52.9 51.5 49.3 41.6 34.0 31.8 30.4 6.0 10
55.0 53.8 52.0 45.4 38.9 37.0 35.8 5.1 11
61.2 60.0 58.1 51.3 44.6 42.7 41.4 5.3 12
72.4 70.9 68.6 60.4 52.3 50.0 48.4 6.4 13
71.0 69.9 68.3 62.5 56.7 55.1 54.0 4.5 14
88.4 87.0 84.8 77.2 69.6 67.5 66.1 5.9 15
Figure 1: MGSD growth chart showing the fitted Percentile Values (3rd ،5th ،10
th ،50th ،90
th ،95th ،97
th) of the MGSD
and GA

977
Journal of Medical Pharmaceutical and Allied Sciences (Vol-7_I-1_2018) 02; 970-982
Figure 2: Predicted GA (weeks) using MGSD measurements (mm). Each point represents one fetus result.
Table 2: Expected GA (weeks) using the MGSD measurements (mm) and the lower and upper limits of both the
95% Prediction Limits and the 95% Confidence Limits based on the regression model.
Xi iY
95% Prediction Limits 95% Confidence Limits
MGSD (mm) GA (weeks) Lower limit Upper limit Lower limit Upper limit
5 5.5 4.0 6.9 5.3 5.7
6 5.5 4.1 7.0 5.4 5.7
7 5.6 4.2 7.1 5.5 5.8
8 5.7 4.2 7.2 5.6 5.8
9 5.8 4.3 7.2 5.7 5.9
10 5.9 4.4 7.3 5.8 6.0
11 6.0 4.5 7.4 5.9 6.1
12 6.1 4.6 7.5 6.0 6.2
13 6.2 4.7 7.6 6.1 6.3
14 6.3 4.8 7.7 6.2 6.4

978
Journal of Medical Pharmaceutical and Allied Sciences (Vol-7_I-1_2018) 02; 970-982
Xi iY
95% Prediction Limits 95% Confidence Limits
MGSD (mm) GA (weeks) Lower limit Upper limit Lower limit Upper limit
15 6.4 4.9 7.8 6.3 6.5
16 6.5 5.0 8.0 6.4 6.6
17 6.6 5.1 8.1 6.5 6.7
18 6.7 5.3 8.2 6.6 6.8
19 6.8 5.4 8.3 6.7 6.9
20 7.0 5.5 8.4 6.9 7.1
21 7.1 5.6 8.5 7.0 7.2
22 7.2 5.7 8.7 7.1 7.3
23 7.3 5.9 8.8 7.2 7.4
24 7.5 6.0 8.9 7.4 7.6
25 7.6 6.1 9.1 7.5 7.7
26 7.7 6.3 9.2 7.6 7.8
27 7.9 6.4 9.3 7.8 8.0
28 8.0 6.5 9.5 7.9 8.1
29 8.1 6.7 9.6 8.1 8.2
30 8.3 6.8 9.8 8.2 8.4
31 8.4 7.0 9.9 8.3 8.5
32 8.6 7.1 10.0 8.5 8.7
33 8.7 7.3 10.2 8.6 8.8
34 8.9 7.4 10.3 8.8 9.0
35 9.0 7.6 10.5 8.9 9.1
36 9.2 7.7 10.6 9.1 9.3
37 9.3 7.9 10.8 9.2 9.4
38 9.5 8.0 10.9 9.4 9.6
39 9.6 8.2 11.1 9.5 9.7
40 9.8 8.3 11.2 9.7 9.9

979
Journal of Medical Pharmaceutical and Allied Sciences (Vol-7_I-1_2018) 02; 970-982
Xi iY
95% Prediction Limits 95% Confidence Limits
MGSD (mm) GA (weeks) Lower limit Upper limit Lower limit Upper limit
41 9.9 8.5 11.4 9.8 10.0
42 10.1 8.6 11.5 10.0 10.2
43 10.2 8.8 11.7 10.1 10.3
44 10.4 8.9 11.8 10.3 10.5
45 10.5 9.1 12.0 10.4 10.6
46 10.7 9.2 12.1 10.6 10.8
47 10.8 9.4 12.3 10.7 10.9
48 11.0 9.5 12.4 10.8 11.1
49 11.1 9.7 12.6 11.0 11.2
50 11.3 9.8 12.7 11.1 11.4
51 11.4 10.0 12.9 11.3 11.5
52 11.6 10.1 13.0 11.4 11.7
53 11.7 10.2 13.2 11.6 11.8
54 11.9 10.4 13.3 11.7 12.0
55 12.0 10.5 13.5 11.8 12.1
56 12.1 10.7 13.6 12.0 12.3
57 12.3 10.8 13.7 12.1 12.4
58 12.4 11.0 13.9 12.3 12.6
59 12.6 11.1 14.0 12.4 12.7
60 12.7 11.2 14.2 12.5 12.9
61 12.8 11.4 14.3 12.7 13.0
62 13.0 11.5 14.4 12.8 13.1
63 13.1 11.6 14.6 12.9 13.3
64 13.2 11.7 14.7 13.0 13.4
65 13.3 11.9 14.8 13.2 13.5
66 13.5 12.0 14.9 13.3 13.6
980
Journal of Medical Pharmaceutical and Allied Sciences (Vol-7_I-1_2018) 02; 970-982
Xi iY
95% Prediction Limits 95% Confidence Limits
MGSD (mm) GA (weeks) Lower limit Upper limit Lower limit Upper limit
67 13.6 12.1 15.1 13.4 13.8
68 13.7 12.2 15.2 13.5 13.9
69 13.8 12.3 15.3 13.6 14.0
70 13.9 12.5 15.4 13.7 14.1
71 14.0 12.6 15.5 13.8 14.3
72 14.1 12.7 15.6 13.9 14.4
73 14.2 12.8 15.7 14.0 14.5
74 14.3 12.9 15.8 14.1 14.6
75 14.4 13.0 15.9 14.2 14.7
76 14.5 13.0 16.0 14.2 14.8
77 14.6 13.1 16.1 14.3 14.9
78 14.7 13.2 16.2 14.4 15.0
79 14.8 13.3 16.3 14.4 15.1
80 14.9 13.4 16.4 14.5 15.2
81 14.9 13.4 16.4 14.5 15.3
82 15.0 13.5 16.5 14.6 15.4
83 15.1 13.5 16.6 14.6 15.5
84 15.1 13.6 16.7 14.6 15.6
85 15.2 13.6 16.7 14.7 15.7
86 15.2 13.7 16.8 14.7 15.8
87 15.3 13.7 16.9 14.7 15.9
88 15.3 13.7 16.9 14.7 16.0
89 15.3 13.7 17.0 14.7 16.0
90 15.4 13.7 17.0 14.6 16.1
981
Journal of Medical Pharmaceutical and Allied Sciences (Vol-7_I-1_2018) 02; 970-982
Table 3: Standard Deviation (SD) of estimated the GA (weeks)
GA (weeks) Standard Deviation
≥ 0.73
18 – 12 0.82
Table 4: Comparison between our study and reference studies:
Sig. Correlation
(r)
N
0.000 0.998 9 Present Study & Tokyo*
0.000 0.997 6
Present Study & Hellman LF,
Kobayashi M, Fillisti L et al 4
Table 5: Comparison of Paired Differences between our study and reference studies about predicting the GA
(weeks) using MGSD (mm)
Comparison
Paired Differences
T value df Sig Statistical
significance Mean Std. Deviation
Std. Error/
Mean
95% Confidence
Interval of the
Difference
Lower Upper
Present Study &
Tokyo*
5.85- 2.39 0.80 7.69- 4.01- 7.34- 8 0.000 Yes
Present Study &
Hellman LF,
Kobayashi M,and
Fillisti L 4
3.08- 0.99 0.41 4.13- 2.04- 7.59- 5 0.001 Yes

982
Journal of Medical Pharmaceutical and Allied Sciences (Vol-7_I-1_2018) 02; 970-982
Figure 3: Comparison between GA using MGSD in our study (red line) and the GA using MGSD in reference studies
(blue line)