Embed Size (px)
Citation preview

University of Kentucky University of Kentucky
UKnowledge UKnowledge
DNP Projects College of Nursing
2015
The Efficacy of STEMI Networks and Systems of Coordinated The Efficacy of STEMI Networks and Systems of Coordinated
STEMI Care: An Evaluation of the Implementation of a STEMI STEMI Care: An Evaluation of the Implementation of a STEMI
Network Network
Julianne M. Evers University of Kentucky, [email protected]
Right click to open a feedback form in a new tab to let us know how this document benefits you. Right click to open a feedback form in a new tab to let us know how this document benefits you.
Recommended Citation Recommended Citation Evers, Julianne M., "The Efficacy of STEMI Networks and Systems of Coordinated STEMI Care: An Evaluation of the Implementation of a STEMI Network" (2015). DNP Projects. 37. https://uknowledge.uky.edu/dnp_etds/37
This Practice Inquiry Project is brought to you for free and open access by the College of Nursing at UKnowledge. It has been accepted for inclusion in DNP Projects by an authorized administrator of UKnowledge. For more information, please contact [email protected].

DNP Practice Inquiry Project Report
The Efficacy of STEMI Networks and Systems
of Coordinated STEMI Care: An Evaluation of the
Implementation of a STEMI Network
Julianne Evers, BSN, MS, RN, CCRN
University of Kentucky
College of Nursing
Spring 2015
Melanie Hardin-Pierce, DNP, APRN, ACNP-BC Committee Co-Chair
Sheila Melander, PhD, RN, ACNP-BC, FCCM, FAANP Committee Co-Chair
Elizabeth Burckardt, DNP, APRN, Committee Member
Chandhiran Rangaswamy, MD, Clinical Mentor

Dedication
This capstone project is dedicated to my amazing teammate and partner in life, whose
unwavering support, understanding and love made my achievement of a Doctorate of Nursing
Practice possible. I also dedicate this project to my two kids, Kylar and Zack. My pride, love,
and joy for them are eternally endless. I love you all to the moon and back – infinity. To my
parents, Barb and Ed Evers, for your continued encouragement, love, and support throughout my
entire lifetime – I would not be here if it were not for the foundation you always provided me.
To my in-laws, Jim, Lois, and Keith LaBelle, for your support and love throughout this process.
Thank you to all of you for helping me in reaching this milestone.

iii
Acknowledgments
I would like to acknowledge the following people for their assistance with various
aspects of this project:
Dr. Melanie Hardin-Pierce (academic advisor & committee chair): for serving as my
advisor over the past five years, for supporting me and guiding me through my
educational journey; for the time she spent reading and reviewing my work, and for her
dedication to educating future nurse practitioners.
Dr. Sheila Melander (committee co-chair): for her time spent reading, reviewing, and editing
my manuscripts, and for her assistance and expertise she offered me in the field of cardiology;
and for her continued support and encouragement of my work.
Dr. Elizabeth Burckardt (committee member): for her dedication to her students, for her time
spent reading, reviewing, and editing my manuscripts, and for her continued support and
encouragement of me as future DNP graduate.
Dr. Chandhiran Rangaswamy (committee member and clinical mentor): for his support,
guidance and expertise in the field of interventional cardiology that he offered throughout my
educational journey and for the time he spent reading and reviewing my work.
Celeste Romp (key study personnel): for her unwavering assistance through the navigation of
two IRBs and her patience, support, and guidance through this journey; for the countless hours
spent reviewing my work and for her steadfast dedication to bring research to the masses of
bedside nurses.
Susan Westneat (UK College of Nursing statistician): for her continued assistance in the
analysis, interpretation, and edits of my capstone data collection for this project, her assistance
was invaluable.
Whitney Kurtz-Ogilvie (writing specialist): for her time spent reviewing my work and
improving my academic writing skills.
Lindsay Lewis (Chest Pain Coordinator): for facilitating many valuable connections as I
worked towards my capstone project, for her knowledge related to my capstone, and for her
continued support as I worked on this project.

iv
Table of Contents
Acknowledgements……………………………………………………………………….…iii
List of Tables…………………………………………………...………………………….....v
List of Figures………………………………………………………………………………..vi
Introduction to Final DNP Capstone Report………………………………………………....1
Manuscript 1: The Efficacy of STEMI Networks and Systems of Coordinated Care: An
Integrative Review…...………………………………………………………………….........4
Manuscript 2: An Evaluation of the Implementation of a STEMI Network: A Retrospective
Electronic Medical Record Review…….……………………………………………………40
Manuscript 3: Social Determinants of Cardiovascular Disease: A Literature Review………78
Final DNP Capstone Report Conclusion……………………………………………….…….97
Appendix A: Waiver of Authorization………………………………………………….…....100
Appendix B: Jewish Hospital Nursing Research Council Approval…………………….…...105
Appendix C: University of Louisville IRB Approval …………………………………….....109
Appendix D: University of Kentucky IRB Authorization Agreement…………………..…...110
Appendix E: Kentucky One Hospital, Jewish Hospital Final Facility Approval ……………111
Appendix F: Data Collection Tool……………………………………………………….......102
References……………………………………………………………………………………114
v
List of Tables
Manuscript 1
Table 1—Article Utilized in Review . . . . . . . . . . . . . . . . . . . . . . . . . . . . . . . . . . . . . .. . .26
Table 2—EMS Articles . . . . . . . . . . . . . . . . . . . . . . . . . . . . . . . . . . . . . . . . . . . . . . . . . . 38
Table 3—Hospital Process Articles. . . . . . . . . . . . . . . . . . . . . . . . . . . . . . . . . . . . . . . . ..39
Manuscript 2
Table 1—Descriptive Statistics for Demographic Characteristics. . . . . . . . . . . . . . . . . . 69
Table 2—Descriptive Statistics for Laboratory Results. . . . . . . . . . . . . . . . . . . . . . . . . . 70
Table 3—Descriptive Statistics for Co-morbid and Pre-existing Conditions . . . . . . . . 71
Table 4—Type of Presentation . . . . . . . . . . . . . . . . . . . . . . . . . . . . . . . . . . . . . . . . . . . . 72
Table 5—D2B Times . . . . . . . . . . . . . . . . . . . . . . . . . . . . . . . . . . . . . . . . . . . . . . . . . . . 73
Table 6—Working vs. Non-working Hour D2B Times. . . . . . . . . . . . . . . . . . . . . . . . . .75
Table 7—ANOVA Analysis/Least Square Means. . . . . . . . . . . . . . . . . . . . . . . . . . . . ...76

vi
List of Figures
Manuscript 2
Figure 1—Type of Presentation and D2B times. . . . . . . . . . . . . . . . . . . . . . . . . . . . . . . . 74
Manuscript 3
Figure 1— State and National CVD Co-morbidity and Risk Factor Rates . . . . . . . . . . . 96

1
Introduction to DNP Practice Inquiry Project
Julianne Evers, BSN, MS, RN, CCRN
University of Kentucky

2
Coronary artery disease (or heart disease) is a group of diseases that can cause heart
attacks. Coronary artery disease is the leading cause of death for adults globally and it can be
blamed for even more deaths in developed countries (Peterson, Syndergaard, Bowler, & Doxey,
2012) and it carries the risk of acute coronary syndrome. Acute coronary syndrome (ACS) is an
umbrella term that can include any of the three following more specific syndromes; unstable
angina, non-ST segment myocardial infarction or a heart attack (NSTEMI), and ST-segment
elevation or heart attack (STEMI). All three of these terms are associated with a sudden rupture
of plaque inside the coronary artery. The location of the blockage, the amount of time in which
the blood flow to the myocardium (i.e., heart muscle) is occluded, and the amount of damage
determines which type of acute coronary syndrome is occurring (Cleveland Clinic, 2015).
Door to balloon time (D2B) is the time from the arrival of an STEMI patient at a hospital
to the time of percutaneous coronary intervention (PCI). The ACC/AHA, the Joint Commission
Core Measures, and the European Society of Cardiology state the D2B time recommended to be
within a 90 minute time frame (Antman et al, 2008; Silber et al., 2005) and within a 120 minute
timeframe for transfer patients (ACC/AHA guidelines in 2002). There are multiple other studies
that support the relationship between decreased morbidity/mortality and D2B time. Those
studies also suggest a continuous relationship between shorter D2B times and better survival for
patients who undergo primary PCI for a STEMI (Antonuicci et al, 2002; Berger et al, 1999;
Cannon et al, 2000; McNamara et al, 2006; Brodie et al, 2001).
The ACC/AHA guidelines state that PCI is preferred over fibrinolytics as the method of
reperfusion for patients who present with a STEMI. However, only forty percent are treated
within the AHA’s recommended door-to-balloon timeframe of 90 minutes (Jacobs, Antman,
Faxon, Gregory, & Solis, 2007). This is only true when PCI can be performed in a time sensitive

3
manner after the onset of symptoms and by experienced operators (Antman et al., 2004).
However, universal access is a problem and is a significant limitation in treating a STEMI patient
with PCI, because PCI is only available in 25 percent of U.S. hospitals (Nallamothu, Bates,
Wang, Bradley, & Krumholz, 2006).
The focus of this practice inquiry project was to determine if implementation of a STEMI
network could decrease the D2B times for walk-in, EMS, and transfer patients who present with
a STEMI. The first manuscript is a review of studies published between 1995 and 2014 that
described the effects of implementing a STEMI network into different geographical regions of
care and to investigate the use of STEMI Networks in the United States and throughout other
countries. During the review, a variety of evidence based techniques to implement hospital
processes and regionalized systems to help in decreasing D2B times in patients who presented
with STEMIs were identified. However, there were no articles specific to STEMI Networks in
the Kentucky area. The performance of primary PCI in a time sensitive manner is the preferred
method of treatment for a STEMI, and according to the BRFSS (2012) approximately 6.6 percent
of adults in Kentucky have been told by a health care professional that they have had a heart
attack, compared to the national percentage of 4.5 percent. Therefore the purpose of the second
manuscript was to evaluate whether or not the implementation of a STEMI Network in a 462-bed
metropolitan hospital in Kentucky would help to decrease the D2B times of those patients who
presented with a STEMI as walk-ins, EMS, or transfers. The third and final manuscript includes
a review of studies that highlight the disparity between socioeconomic status (SES) and
cardiovascular disease (CVD). Given that Kentucky has 19.1 percent of its population living in
poverty, compared to 15.9 percent overall in the U.S. (KDPH, 2013), the third manuscript
suggests focus areas to attempt to decrease the disparities between SES and CVD.

4
Manuscript 1
The Efficacy of STEMI Networks
and Systems of Coordinated STEMI Care:
An Integrative Review
Julianne M. Evers, BSN, MS, RN, CCRN
University of Kentucky

5
Abstract
Background: STEMIs are a type of coronary occlusion that deprives the heart of oxygen and
nutrients thereby causing coronary ischemia, injury and possible irreversible damage to the
myocardial tissue. Several studies suggest that primary percutaneous intervention (PCI) is the
preferred method of restoring blood flow to the blocked artery; however this is only true when it
can occur in an expeditious manner.
Objective: To identify strategies other hospitals and systems of care have implemented to help
decrease door to balloon (D2B) times for STEMI patients. The goal is to determine if a STEMI
network and regionalized system of care should be implemented in central Kentucky.
Methods: This integrative literature review explores fifteen articles found in CINAHL,
MEDLINE, and PUBMED. These articles report on the utilization of various strategies in order
to decrease D2B time in ST-elevation myocardial infarction (STEMI) patients.
Findings: Although the articles vary in approach to reducing D2B times (e.g., EMS field
activation, EMS direct transport to a primary PCI facility, hospital specific process changes,
regionalization of systems coordinated care, and prompt data feedback), the overarching theme is
that all of the approaches have independently helped in the reduction of D2B times and have
provided STEMI patients with the timely care necessary to improve outcomes and adhere to the
AHA recommended <90 minute treatment window.
Keywords: STEMI Network, door to balloon time, STEMI D2B, acute myocardial
infarction, walk-in D2B time, STEMI and ER/ED, and STEMI EMS

6
Background
According to the American Heart Association (AHA, 2013), every year in the United
States there are more than 250,000 individuals who experience an ST-elevation myocardial
infarction (STEMI), an out of the hospital cardiac arrest, or both. A STEMI is a type of acute
coronary syndrome (ACS) and can be accompanied by life threatening complications. ACS is a
process caused by a coronary occlusion that may precipitate ischemia or infarction. This
occlusion deprives the heart muscle of oxygen and nutrients, causing possible irreversible
damage if the myocardial tissue is not reperfused rapidly (Alspach, 2006). There are several
acute and life threatening complications that can occur from a STEMI, including cardiogenic
shock, heart failure, ventricular tachycardia, atrial fibrillation, symptomatic bradycardia, acute
mitral regurgitation, and sudden cardiac death (Learn the Heart, 2013).
The American College of Cardiology (ACC), the AHA, and the Joint Commission Core
Measures published the current recommended door to balloon (D2B) time as within a 90 minute
time frame (Antman, Hand, & Armstrong, 2007). For every 15 minute time period beyond 90
minutes there is an associated increased risk of in-hospital death from complications. Despite
this widespread knowledge, the vast majority of these individuals fail to receive the appropriate
treatment for this life-threatening condition within the recommended timeframe (Nallamothu,
Bradley, & Krumholz, 2007a).
Mission Lifeline (ML) is a national initiative set forth by the AHA (AHA-ML) to help
advance the systems of care for patients presenting with a STEMI. Jacobs, Antman, Faxon,
Gregory, and Solis (2007), state that thirty percent of STEMI patients fail to receive
percutaneous coronary intervention (PCI) or fibrinolytic therapy (lytics) during their hospital
stay. According to the authors, of those patients who do receive immediate PCI, only forty

7
percent are treated within the AHA’s recommended door-to-balloon timeframe of 90 minutes.
Additionally, fewer than half the patients who are treated with fibrinolytic therapy are treated
within the AHA recommended door-to-needle timeframe of 30 minutes. Furthermore, of the
population of patients who are not eligible for thrombolytic therapy, seventy percent of those
patients fail to receive PCI, which is the only other option to restore blood flow to blocked
coronary arteries (Jacobs et al., 2007). AHA-ML is working to improve these statistics and the
overall quality of care while reducing the mortality and morbidity (e.g., cardiogenic shock, fatal
dysrhythmias, mechanical incompetencies, etc.) for STEMI patients. The statistics presented by
the AHA are evidence that the majority of healthcare systems have a great deal of improvements
to make when it comes to caring for STEMI patients according to the guidelines set forth by the
AHA.
In 2004, Antman et al. conducted trials which demonstrated that the transfer of patients
for PCI will still produce superior outcomes when compared with fibrinolysis (lytics) at a non-
PCI capable hospital. From these studies, consistent with the ACC/AHA guidelines, it was
determined that PCI is preferred over lytics as the method of reperfusion for patients who present
with a STEMI. However, this is only true when PCI can be performed in a time sensitive
manner after the onset of symptoms and by experienced operators (Antman et al., 2004).
However, universal access is a problem and is a significant limitation in treating a STEMI patient
with PCI, because PCI is only available in 25 percent of U.S. hospitals (Nallamothu, Bates,
Wang, Bradley, & Krumholz, 2006). In addition to the lack of availability of PCI-capable
hospitals, there is also a lack of organized care systems as well as a lack of an integrated system
of care for transfer patients identified as having a STEMI (Jacobs et al., 2006). This is evidenced
by reports that the median D2B time for patients who are transferred for PCI is 180 minutes

8
(Henry et al., 2007; Nallamothu et al., 2005). Moreover, only 4.2 percent of transferred patients
are treated within 90 minutes, which is the guideline set by the ACC/AHA (AHA, 2013).
According to Jacobs et al. (2007), there are practically 5,000 acute care hospitals in the
U.S. However, only 44 percent of those have a cardiac catheterization lab and only 24 percent
have the capabilities of performing PCI. It is because only 24 percent of hospitals have the
ability to perform PCI that creating a coordinated system of care is crucial to helping deliver PCI
in the timeliest manner to those patients who present with a STEMI. Similar to Jacobs et al.
(2006), this practice inquiry will define a STEMI Network as “an integrated group of separate
entities within a region providing specific services for the system that could include emergency
medical services (EMS) providers, a community hospital(s), a tertiary center(s), and others” (p.
217).
Purpose of Review
The purpose of this integrative review is to identify and critique research designed to
investigate the use of STEMI Networks in the United States and throughout other countries.
Additionally, this review will examine the use and efficacy of STEMI Networks and regionalized
systems of care to decrease the STEMI door to balloon (or device) treatment time of patients
who present to a hospital via walk-in, transfer, or EMS. This review will also identify gaps in
the literature and provide recommendations for future research and practice.
Method
A predefined strategy was used to extract the most current and relevant research from the
available literature for this integrative review. A comprehensive search of the Cumulative Index
of Nursing and Allied Health Literature (CINAHL), Medical Literature Analysis and Retrieval
System Online (MEDLINE), and PUBMED databases was conducted. Searches of the reference

9
lists of retrieved papers were also performed for references within relevant journals. The
selection criteria for these searches included systematic review articles, meta-analyses, and
clinical trials/studies in English. The keywords to search the literature included the following:
STEMI Network, door to balloon time, STEMI D2B, acute myocardial infarction, walk-in D2B
time, STEMI and emergency room/emergency department (ER/ED), and STEMI emergency
medical services (EMS). The terms were searched independently and then combined.
The goal of this review was to identify published clinical research to determine the impact
of organized STEMI Networks and regional systems of care for patients who present with a
STEMI. Inclusion criteria were as follows: full text, peer reviewed nursing or medical journal
articles published in English between the years 1995 and 2014. Additionally, the selected studies
were included if they met the following criteria: 1) studies conducted with adults aged 18 years
and older, 2) studies that focused on system improvements (i.e., PCI receiving hospital, PCI
referring hospital, EMS), and 3) articles extracted from the database search were then
systematically reviewed for clinical significance (i.e., sample characteristics, the setting, data
collection, inclusion criteria of specific populations, findings and conclusion) and relevance.
References of the selected articles were also reviewed and evaluated for potential application to
the clinical topic. Studies that were qualitative in nature were excluded from this literature
review. This search revealed 47 articles, and after evaluation of inclusion/exclusion factors, 15
were reviewed. The articles that were identified included topics such as process improvements,
regional network implementation, streamlining referral protocols, use of a “code STEMI” or
“code AMI”. These 15 articles are discussed in further detail below and identified in Table 1.

10
Summary of Findings
EMS and D2B Times
The impact of EMS on D2B times was recognized as main focal points in six of the
fifteen articles (Cone, Lee, & Van Gelder, 2013; Cheskes et al., 2011; Camp-Rogers et al., 2011;
Fosbol et al., 2013; Eckstein, Koenig, Kaji, & Tadeo, 2009; Caudle, Piggott, Dostaler, Graham,
& Brison, 2009). These six articles all recognized EMS as belonging to part of a
multidisciplinary team and the need for EMS companies to develop protocols for a prehospital
assessment, triage, and treatment of patients who have a suspected STEMI. These six articles
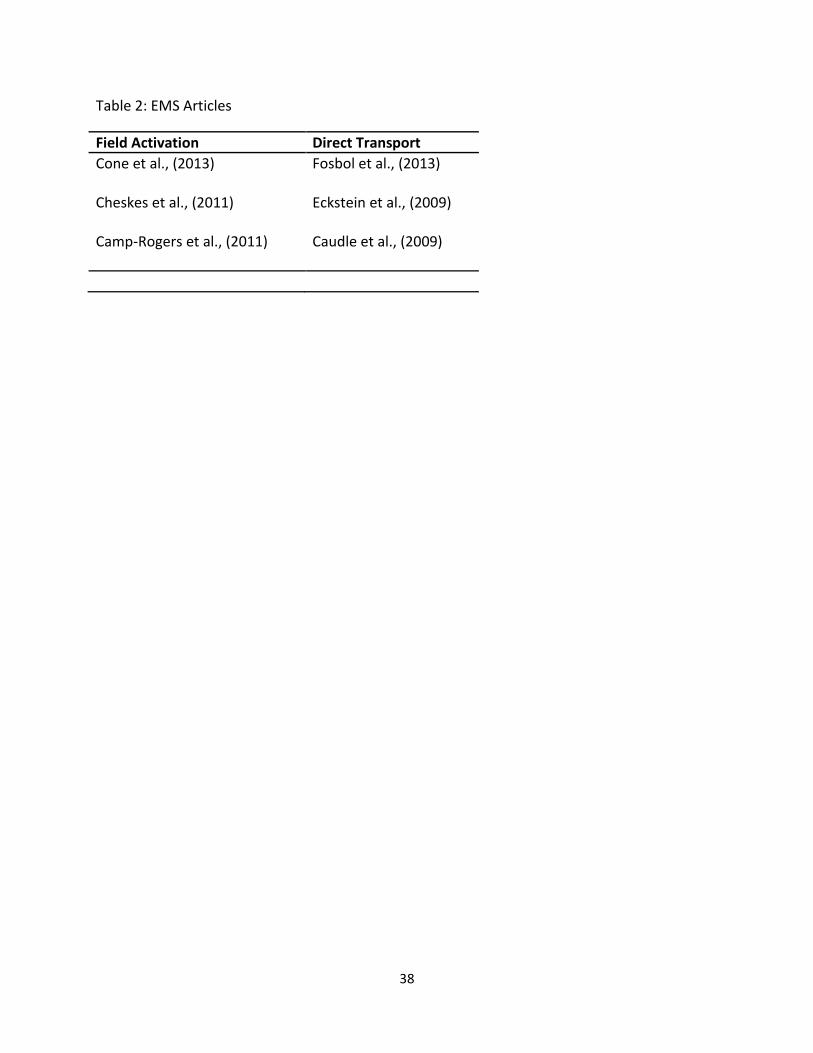
were further separated into the two themes of field activation and direct transport. Field
activation can be defined as EMS activation of a nearby PCI capable ER/ED whereas direct
transport can be defined as EMS patients who were sent directly to a PCI capable facility,
bypassing other hospitals in the process.
Field Activation. Field activation data were collected in three of the six EMS specific
articles. These studies are listed in Table 2 for further review. These three studies examined
D2B times and EMS compliance with a national 90 minute performance benchmark (Cone, Lee,
& Van Gelder, 2013; Cheskes et al., 2011; Camp-Rogers et al., 2011). The studies revealed that
EMS field activation can significantly improve the proportion of patients with a first medical
contact (FMC) to balloon time of less than 90 minutes. In addition to these findings, one of these
studies also sought to evaluate the accuracy of EMS activation of the cardiac cath lab for patients
with a STEMI (Camp-Rogers et al., 2011). The authors conducted a pre/post cohort study of
patients presenting via EMS with pre-hospital EKG that showed a STEMI. Before the date of
August 20, 2007 preparation for the patient to go to the cath lab for treatment with PCI was
initiated after the patient arrived at the hospital. After the August 20, 2007 date, a protocol was

11
developed that enabled EMS providers to activate the cath lab if the prehospital EKG indicated
STEMI. All times were measured by clocks that were synchronized between the time that EMS
was dispatched until PCI. A total of 53 patients, 14 pre and 39 post-hospital activation were
included. The results showed that prehospital activation of the cath lab significantly improved
mean D2B time by 18.2 minutes (95% CI, 7.69-28.71 minutes; p = .0029) and door-to-cath lab
by 14.8 minutes (95% CI, 6.20-23.39 minutes; p = .0024). There were significant time savings
reflected in all EMS intervals (e.g., mean dispatch-to-reperfusion time, in mean FMC-to-
reperfusion time, and in recognition-to-reperfusion time). This supported the assumption that
EMS providers can appropriately activate the cardiac cath lab team for patients with a STEMI
before the patient’s ER arrival thereby helping to decrease D2B time.
Direct Transport. The remaining three studies from the six that examined the role of
EMS in D2B times for STEMI patients assessed adherence to a variety of protocols that were
developed to facilitate direct transport to a PCI capable facility (Fosbol et al., 2013; Eckstein,
Koenig, Kaji, & Tadeo, 2009; Caudle, Piggott, Dostaler, Graham, & Brison, 2009). Results from
these three studies independently determined that patients who were sent directly to a PCI center
had significantly shorter times to reperfusion and a greater likelihood of meeting the STEMI
treatment guidelines. These patients were more likely to have a D2B time of less than 90
minutes. In a study by Eckstein et al. (2009), the authors found after the implementation of a
regional STEMI system that D2B times within the 90 minute benchmark were achieved for
nearly ninety percent of STEMI patients who were transported by EMS providers. Interestingly,
Eckstein et al. (2009) reported that nationally, only four percent of STEMI patients who are
taken for primary PCI have a D2B time of less than 90 minutes.
12
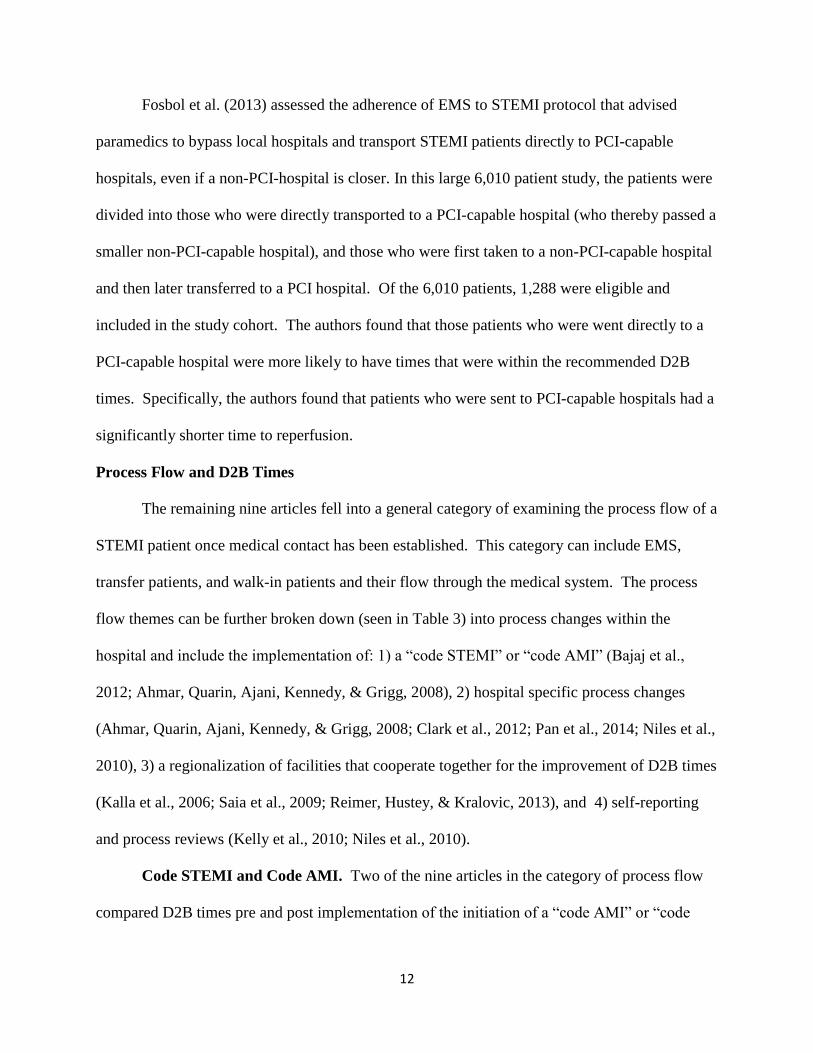
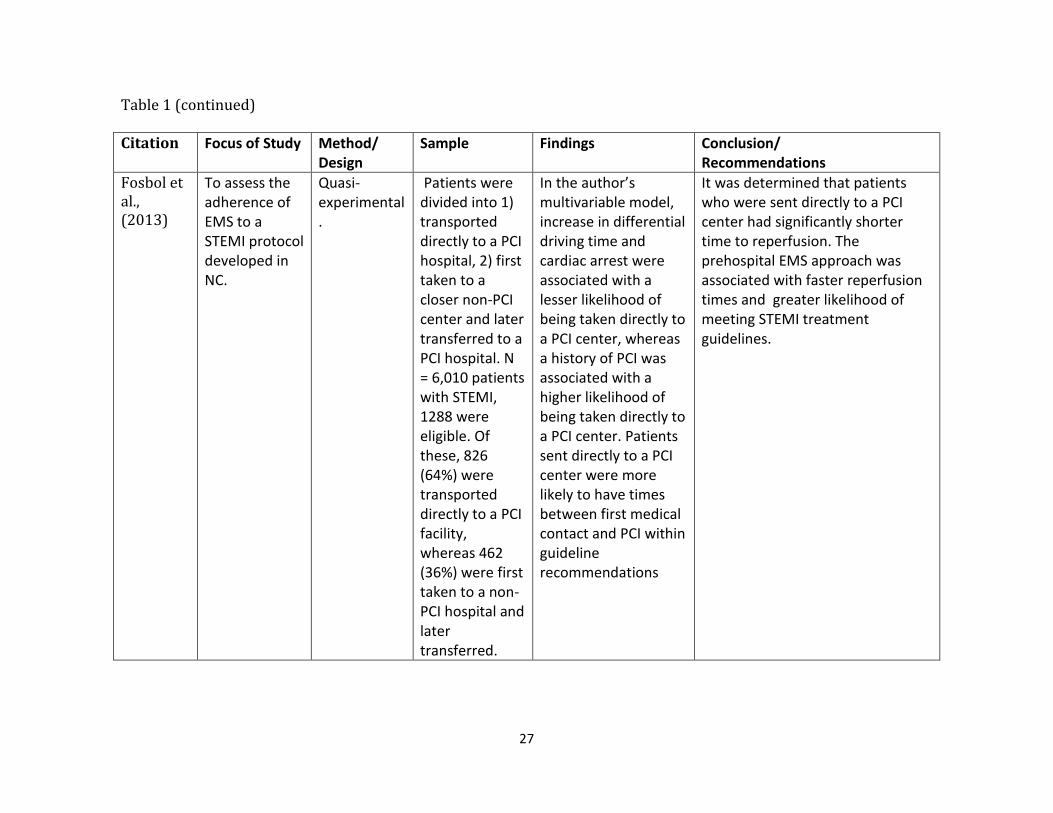
Fosbol et al. (2013) assessed the adherence of EMS to STEMI protocol that advised
paramedics to bypass local hospitals and transport STEMI patients directly to PCI-capable
hospitals, even if a non-PCI-hospital is closer. In this large 6,010 patient study, the patients were
divided into those who were directly transported to a PCI-capable hospital (who thereby passed a
smaller non-PCI-capable hospital), and those who were first taken to a non-PCI-capable hospital
and then later transferred to a PCI hospital. Of the 6,010 patients, 1,288 were eligible and
included in the study cohort. The authors found that those patients who were went directly to a
PCI-capable hospital were more likely to have times that were within the recommended D2B
times. Specifically, the authors found that patients who were sent to PCI-capable hospitals had a
significantly shorter time to reperfusion.
Process Flow and D2B Times
The remaining nine articles fell into a general category of examining the process flow of a
STEMI patient once medical contact has been established. This category can include EMS,
transfer patients, and walk-in patients and their flow through the medical system. The process
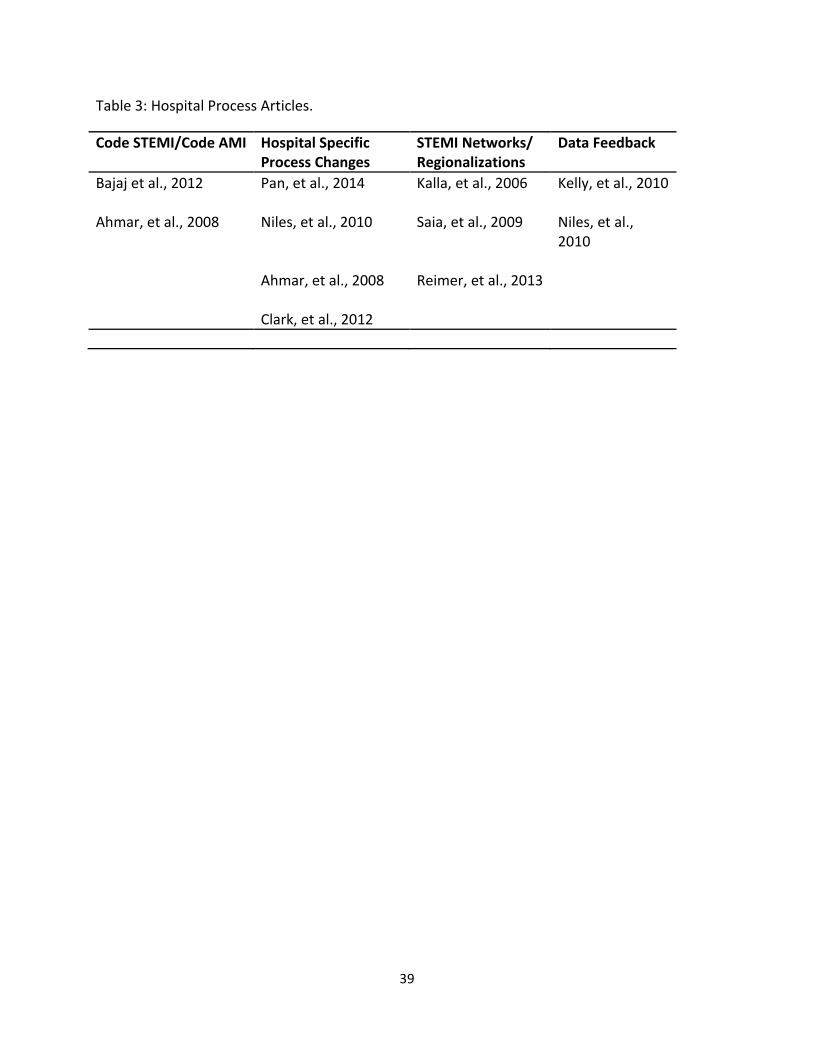
flow themes can be further broken down (seen in Table 3) into process changes within the
hospital and include the implementation of: 1) a “code STEMI” or “code AMI” (Bajaj et al.,
2012; Ahmar, Quarin, Ajani, Kennedy, & Grigg, 2008), 2) hospital specific process changes
(Ahmar, Quarin, Ajani, Kennedy, & Grigg, 2008; Clark et al., 2012; Pan et al., 2014; Niles et al.,
2010), 3) a regionalization of facilities that cooperate together for the improvement of D2B times
(Kalla et al., 2006; Saia et al., 2009; Reimer, Hustey, & Kralovic, 2013), and 4) self-reporting
and process reviews (Kelly et al., 2010; Niles et al., 2010).
Code STEMI and Code AMI. Two of the nine articles in the category of process flow
compared D2B times pre and post implementation of the initiation of a “code AMI” or “code

13
STEMI” for off-hour STEMIs (Bajaj et al., 2012; Ahmar, et al., 2008). The activation of a “code
STEMI” or a “code AMI”, for the purposes of this review, involved a single call from the
emergency physician to a central phone number would simultaneously activate the on call
interventionalist, the cardiac cath lab team, and the on call in house cardiology fellow, as well as
the necessary administrators to plan for transfer, transport from the ED to the cath lab, and a
hospital bed post PCI (Bajaj et al., 2012; Ahmar, et al., 2008). Both studies reported that the
implementation of the “code” at each of the institutions significantly reduced D2B times for off-
hour STEMIs. Specifically, Bajaj et al. (2012) found that with the implementation of “code
STEMI” protocol the median D2B time during off hours dropped to 77 minutes, which
represents a 52 minute improvement. EKG to cath lab time demonstrated a reduction of 16
minutes. Similarly, Ahmar et al. (2008) found that through changes that were implemented to
improve off-hours D2B times (including the initiation of a “code AMI”), a 29 percent
improvement was made in the off-hours D2B times and 69 percent of those cases were managed
in under 90 minutes.
Hospital-Specific Process Changes and D2B Time. Four of the nine articles in this
review examined multi-dimensional hospital-specific process changes. These articles had a
variety of process improvement techniques that were implemented. For example, one of the
studies utilized implementation of a computerized provider order entry (Pan et al., 2014).
Another study (Niles et al., 2010) examined a hospital’s D2B process because only 33 percent of
its STEMI patients had D2B times that were under 90 minutes. The authors implemented the
ST-elevation myocardial infarction process upgrade (STEPUP) project. In this project a
multidisciplinary group was formed with members from cardiology, emergency medicine, EMS,
hospital communications, coronary care, cardiac cath lab, and administration. The mission of the

14
group was to identify and implement strategies to improve the process of care, treatment times,
and outcomes of STEMI patients. Examples of process improvements that were made included:
1) ER physician activation of the cardiac cath lab, 2) a single phone call activation the cardiac
cath lab by triggering STEMI alert pages to all necessary cardiac cath lab staff, 3) cardiac cath
lab being ready to accept patients no greater than 30 minutes after the initial activation call, and
4) a system of prompt data feedback with data recipients including EMS, ER, and cardiac cath
lab personnel, etc.
Similarly, Clark et al. (2012) and Ahmar et al. (2008) examined a variety of hospital
processes such as the relationship of EMS intervals and internal hospital interval processes (i.e.,
EMS activation, door to page, page to cath lab, and lab to reperfusion) to the rapid reperfusion of
patients with STEMIs. Specifically, Ahmar et al (2008) explored the hospital practice of
managing STEMIs by identifying processes that were associated with possible time delays in
treating STEMI patients. The authors subsequently looked for ways in which to improve the
acute STEMI management system for both “on hours” and “off hours” patients. The study group
was made up of consecutive patients who presented to the hospital with a STEMI between April
and September 2005 and the same period in 2006 and compared patients who presented “in
hours” (0700 hours to 1800 hours (Monday to Friday)) versus out of hours (which was all other
times including public holidays). The authors found that the guideline recommendations for
D2B times (90 min) were achieved during the “in hours” however during the “off hours”, times
exceeded the recommended time frames.
The authors were able to identify several possible delays in achieving the recommended
time frame of 90 minutes during all hours. These potential delays included the performance and

15
analysis of EKGs, a decision made by the cardiology team, and transfer of the patient to the cath
lab. Moreover, these delays were more significant in the “off hours” patients.
Subsequently, there were several changes that were implemented in order to improve
D2B time for both “on” and “off” hours. For example, some changes that were made included
(but were not limited to) changing hospital policy. That is, the hospital changed its policy so that
all STEMI patients were first and foremost treated with primary PCI, which eliminated the need
for the cardiologist to determine whether the treatment of choice would be lytics or PCI. Second,
there was focus placed on the ER performing immediate EKG after patient arrival to the hospital.
Third, the ER was provided with direct telephone access to the cardiologist in order to provide
more efficient cath lab activation.
Implications all of these studies suggest that it is critical to use coordinated approach in
conjunction with an ongoing review. The previously mentioned studies strongly suggest that a
multidisciplinary approach and a continuous feedback process through a quality improvement
program are critical variables to consider when attempting to reduce the D2B times in STEMI
patients.
STEMI Networks and Regionalization and D2B Times. Three of the nine articles
specifically discussed and evaluated a streamlined interfacility referral protocol or a
regionalization and network for treatment of STEMIs (Kalla et al., 2006; Saia et al., 2009;
Reimer, Hustey, & Kralovic, 2013). Many of the studies examined referral hospitals (e.g. non-
PCI capable hospitals that transfer patients out to PCI capable hospitals, which are also referred
to as receiving centers). These systems (or networks) focused on referral and transport
processes. In one study, the traditional referral protocol was reviewed in order to identify areas
for improvement by the transport team as well as cardiology management teams (Niles et al.,

16
2010). The authors identified one of the main points as being the benefit in providing a direct
contact telephone number to a coordinator who could activate the cardiac cath lab team.
Subsequently, that coordinator would obtain the information about the current STEMI patient
(e.g., EKG, patient location, demographics, mode of transportation). This would occur
simultaneously while the coordinator activates the cardiac cath lab team and makes sure a table
and bed are reserved and available by hospital administration. The authors found that there were
significant reductions in time to the first EKG in the ER and in D2B times. This supports the
necessity for continuous improvement in the process of STEMI patient care and constant
education and re-education of the staff involved.
Data Feedback and D2B Times. Two studies of the nine used a self-reporting and
immediate data feedback to assist in improving D2B times with patients who present with a
STEMI (Kelly et al., 2010; Niles et al., 2010). One study that occurred at Wake Forest Hospital
used the Six Sigma methodology to aid in the improvement of hospital D2B times (Kelly et al.,
2010). Six Sigma methodology is a quality improvement tool that was first developed and used
by the Motorola Corporation in the 1970s (Harry, 2000). This is an evaluation tool that has more
recently been adapted to use in the medical field in order to attempt to be more efficient and
create less error. Specifically, Six Sigma can be useful to analyze and modify complicated and
time sensitive processes that involve multiple disciplines and treatment areas (e.g., EMS, ED,
cath lab). Consequently, this tool is particularly useful in exploring any issues with the rapid
reperfusion of patients who present with a STEMI. Thus, the authors reported that after process
analysis and implementation of improvements, mean D2B times decreased from 128 minutes to
90 minutes. This improvement was sustained. Additionally, as of June 2010, the year of
publication, the mean D2B was 56 minutes with 100% of the patients who present with STEMI
17
meeting the 90 minute window. Both studies, Niles et al. (2010) and Kelly et al. (2010),
demonstrate the effectiveness of prompt provider data feedback and its positive impact on
helping to decrease D2B times of STEMI patients.
Gaps and Barriers
The articles in this review used a variety of evidence based techniques to implement
hospital processes and regionalized systems to help in decreasing D2B times in patients who
presented with STEMIs; however, there were no articles specific to STEMI Networks in the
Kentucky area. This is an important consideration and a major gap in the literature because
according to the BRFSS (2012), approximately 6.6 percent of adults in Kentucky have been told
by a health care professional that they have had a heart attack, compared to the national
percentage of 4.5 percent. Further research and data analysis needs to be performed on the
effects of a STEMI Network in this specific region in the southeastern United States.
The benefit of timely access to primary PCI for STEMI patients has been established.
However, there are significant barriers to the establishment and implementation of the ideal
system. One possible limitation is the unstructured and competitive nature of the United States
healthcare system. Due to this lack of structure other possible barriers to the implementation of a
coordinated system of care subsequently arise. For example, the heterogeneous nature of EMS
providers and hospitals across the U.S. will require that these “systems” be malleable enough to
account for the differences in local needs and the resources of different communities.
Limitations
This review has several limitations. All of the studies had an observational pre/post
design, which can prevent the establishment of a causal relationship between implementation of
a STEMI network and the frequency and timeliness of diagnostic and therapeutic coronary

18
interventions and patient outcomes such as morbidity, mortality, and hospital length of stay. The
before-and-after design of the studies may also subject the differences found between patients in
the pre- and post- implementation groups to confounding factors that may occur with temporal
changes.
Another limitation of creating coordinated STEMI networks throughout a region is one
that stems from economics. In a great number of hospitals, cardiovascular services make up
close to 40 percent of general revenue and in turn those services are used to subsidize other less
profitable, yet important services (Nallamothu et al., 2007b). By taking STEMI patients from
smaller hospitals to larger PCI-capable hospitals, there needs to be consideration given to the
possible change in revenue and reimbursement structures for these smaller hospitals. Therefore,
when designing STEMI systems of care there needs to be careful thought given as well as
changing reimbursement structures proposed. This is a necessary consideration in order to avoid
the significant pressures from referring hospitals to keep and give care for patients with STEMIs
when they should instead be sent out to a STEMI receiving center in order to provide the best
care possible to the patient.
Finally, another challenge occurs in regard to the public’s use of EMS. That is, patients
who are transported via EMS have two advantages when treated within a STEMI system of care
which are 1) they may have shorter times to reperfusion therapy because of an earlier and more
prompt recognition of their symptoms, and 2) they may be transported directly to a primary PCI
center if a pre-hospital EKG was performed. That is, EMS providers may pass by a smaller
hospital without stopping there because the providers are aware the patient is having a STEMI
based on the pre-hospital EKG. The EMS providers will instead head straight to a PCI-capable
hospital with the knowledge that the patient will receive more appropriate care at the PCI-

19
capable hospital. This in turn will avoid a probable transfer, which will consequently save time
and therefore save heart muscle.
Implications for Future Research
Evidence suggests that primary PCI is the preferred reperfusion strategy in the majority of
patients with a STEMI. However, a minority of patients is treated with primary PCI and even
fewer of those are treated in the recommended 90 minutes after first medical contact. The
benefits of primary PCI are the greatest if the procedure is performed in a timely manner after
initial symptom onset (Keeley, Boura, & Grines, 2003).
The literature presented supports the development and implementation of a highly
coordinated system of care. However, this will require a practice change in many institutions,
and it is important to realize that attempting to change practice can be a challenging task.
Therefore, implementing these strategies will require a carefully planned educational
intervention for ER physicians, interventional physicians, EMS providers, staff RNs, and
hospital administration, and a plan to increase buy-in from staff. Educational interventions
should be designed to raise awareness of what a STEMI is, what the process is once the STEMI
is diagnosed, and what is the best practice (i.e., core measures for AMI) in treating a STEMI
patient by staff RNs.
Implications for Practice
Collectively, data from the reviewed studies support the implementation of a STEMI
network, or an organized system of STEMI care to facilitate the delivery of care to patients who
present with STEMIs and in order to improve patient outcomes. Implementation of a STEMI
network may increase the frequency, timeliness, and appropriateness of diagnostic and
therapeutic coronary interventions. Patients with STEMIs who have received care within a

20
STEMI network or an organized system of care have benefitted from its association with a
decreased D2B time and subsequent decrease in morbidity and mortality. Quality improvement
efforts that target the dissemination and adoption of an organized system of care for patients with
STEMIs among clinicians should continue.
Conclusion
Improving outcomes for patients who present with a STEMI in the United States is an
important public health goal. Although these studies are a part of a small but growing body of
literature, they all demonstrate the potential of a streamlined and coordinated process in treating
STEMI patients. The optimization of care of STEMI patients through the establishment of
systems of care could be of great value. If these systems can be implemented correctly (i.e.,
accounting for differences in regional needs), such coordinated care systems have the potential to
significantly improve outcomes for these patients. This is critical because acute myocardial
infarction (STEMI) is still the leading cause of death in the United States and worldwide (CDC,
2014). All of the studies presented in this integrative review of the literature demonstrate the
effectiveness of a quality improvement strategies that are directed towards the processes of care
of STEMI patients from a variety of different regions (i.e., rural, urban, etc.). Ultimately, a well-
designed and coordinated system of care, created using the existing evidence, will improve care
for patients with a STEMI.

21
References
Ahmar, W., Quarin, T., Ajani, A., Kennedy, M., & Grigg, L. (2008). Improvement in door-to-
balloon time in management of acute st-segment elevation myocardial infarction
(STEMI) through the initiation of “code AMI”. Internal Medicine Journal. (38), 714-718.
Alspach, J.G. (2006). AACN Core Curriculum for Critical Care Nursing (6th
ed) Saunders.
American Heart Association (2013). Retrieved from (June 7, 2014)
http://www.heart.org/HEARTORG/HealthcareResearch/MissionLifelineHomePage/Lear
n-About-Mission-Lifeline_UCM_438708_Article.jsp
American Heart Association (2013). Retrieved from (June 7, 2014)
http://www.heart.org/HEARTORG/HealthcareResearch/MissionLifelineHomePage/Lear
nAboutMissionLifeline/STEMI-Systems-of-Care_UCM_439065_SubHomePage.jsp
Antman, E.M., Anbe, D.T., Armstrong, P.W., Bates, E.R., Green, L.A., Hand, M, … Jacobs,
A.K. (2004). ACC/AHA guidelines for the management of patients with ST-elevation
myocardial infarction: executive summary: a report of the American college of
cardiology/American heart association task force on practice guidelines. Circulation, 110,
588-636.
Antman, E.M., Hand, M., Armstrong, P.W., et al. (2008). 2007 focused update of the ACC/AHA
2004 guidelines for the management of patients with st-elevation myocardial infarction.
Journal of American College of Cardiology, 51, 210-247.
Bajaj, S., Parikh, R., Gupta, N., Aldehneh, A., Rosenberg, M., Hamdan, A., & Bikkina, M.
(2012). “Code STEMI” Protocol helps in achieving reduced door-to-balloon times in
patients presenting with acute ST-segment elevation myocardial infarction during off-
hours. Journal of Emergency Medicine, 42(3), 260-266.

22
Behavioral Risk Factor Surveillance System. (2014). Retrieved November 18, 2014) from:
http://www.cdc.gov/brfss/.
Camp-Rogers, T., Dante, S., Kontos, M. C., Roberts, C. S., Kreisa, L., & Kurz, M. (2010). The
impact of prehospital activation of the cardiac catheterization team on time to treatment
for patients presenting with st-segment-elevation myocardial infarction. American
Journal Of Emergency Medicine.
Caudle, J., Piggott, Z., Dostaler, S., Graham, K., & Brison, R. (2009). Impact of a rapid access
protocol on decreasing door-to-balloon time in acute st-elevation myocardial infarction.
Canadian Journal of Emergency Medicine, 11(1), 29-35.
Centers for Disease Control and Prevention (CDC). (2014). Retrieved (November 10, 2014)
from http://www.cdc.gov /nchs/fastats/leading-causes-of-death.htm.
Cheskes, S., Turner, L., Foggett, R., Huiskamp, M., Popov, D., Thomson, S., & ... Verbeek, R.
(2011). Paramedic contact to balloon in less than 90 minutes: a successful strategy for st-
segment elevation myocardial infarction bypass to primary percutaneous coronary
intervention in a Canadian emergency medical system. Prehospital Emergency Care,
15(4), 490-498.
Clark, C., Berman, A., McHugh, A., Roe, E., Boura, J., & Swor, R. (2012). Hospital process
intervals, not ems time intervals, are the most important predictors of rapid reperfusion in
ems patients with st-segment elevation myocardial infarction. Prehospital Emergency
Care, 16(1), 115-120.
Cone, D. C., Lee, C. H., & Van Gelder, C. (2013). EMS activation of the cardiac catheterization
laboratory is associated with process improvements in the care of myocardial infarction
patients. Prehospital Emergency Care, 17(3), 293-298.

23
Eckstein, M., Koenig, W., Kaji, A., & Tadeo, R. (2009). Implementation of specialty centers for
patients with st-segment elevation myocardial infarction: the Los Angeles STEMI
receiving center project. Prehospital Emergency Care, 13(2), 215-222.
Fosbol, E., Granger, C., Jollis, J., Monk, L., Lin, L., Lytle, B., & ... Glickman, S. (2013). The
impact of a statewide pre-hospital STEMI strategy to bypass hospitals without
percutaneous coronary intervention capability on treatment times. Circulation, 127(5),
604-612.
Harry, M.S.R. (2000). Six Sigma. New York, NY. Doubleday Publishers.
Henry, T.D., Sharkey, S.W., Burke, N., Chavez, I.J., Graham, K.J., Henry, C.R., … Larson,
D.M. (2007). A regional system to provide timely access to percutaneous coronary
intervention for st-elevation myocardial infarction. Circulation, 116, 721-728.
Jacobs A.K., Antman, E.M., Ellrodt, G., Faxon, D.P., Gregory, T., Mensah, …Smith, S.C.
(2006). Recommendation to develop strategies to increase the number of st-segment-
elevation myocardial infarction patients with timely access to primary percutaneous
coronary intervention. Circulation, 113, 2152-2163.
Jacobs, A.K., Antman, E.M., Faxon, D.P., Gregory, T., & Solis, P. (2007). Development of
systems of care for st-elevation myocardial infarction patients. Executive summary.
Circulation, 116, 217-230.
Kalla, K., Christ, G., Karnik, R., Malzer, R., Norman, G., Prachar, H., & ... Huber, K. (2006).
Implementation of guidelines improves the standard of care: the Viennese registry on
reperfusion strategies in st-elevation myocardial infarction (Vienna STEMI registry).
Circulation, 113(20), 2398-2405
24
Keeley, E.C., Boura, J.A., & Grines, C.L. (2003). Primary angioplasty versus intravenous
thrombolytic therapy for acute myocardial infarction: a quantitative review of 23
randomized trials. Lancet, 361, 13-20.
Kelly, E., Kelly, J., Hiestand, B., Wells-Kiser, K., Starling, S., & Hoekstra, J. (2010). Six sigma
process utilization in reducing door-to-balloon time at a single academic tertiary care
center. Progress in Cardiovascular Diseases, 53(3), 219-226.
Learn the Heart. (2013). Retrieved (January 27, 2014) from http://www.learntheheart.com/CAD-
STEMI-SpecialSituations.html.
McNamera, R.L., Herrin, J., Bradley, E.H., et al. (2006). Hospital improvement in time to
reperfusion in patients with acute myocardial infarction, 1999-2000. Journal of American
College of Cardiology, 46, 45-51.
Nallamothu, B.K., Bates, E.R., Herrin, J., Wang, Y., Bradley, E.H., Krumholz, H.M. (2005).
Times to treat in transfer patients undergoing percutaneous coronary intervention in the
United States: national registry of myocardial infarction. Circulation, 111, 761-767.
Nallamothu, B.K., Bates, E.R., Wang, Y., Bradley E.H., Krumholz, H.M. (2006). Driving times
and distances to hospitals with percutaneous coronary intervention in the United States:
implications for prehospital triage of patients with ST-elevation myocardial infarction.
Circulation, 113, 1189-1195.
Nallamothu, B.K., Bradley, E.H., & Krumholz, H.M. (2007a). Time to treatment in primary
percutaneous coronary intervention. New England Journal of Medicine, 357, 1631-1638.
Nallamothu B.K., Krumholz, H.M., Ko, D.T., LaBresh, K.A., Rathore, S, Roe, M.T., &
Schwamm, L. (2007b). Development of systems of care for ST elevation myocardial
infarction patients: gaps, barriers, and implications. Circulation, 116, 68-72.

25
Niles, N., Conley, S., Yang, R., Vanichakarn, P., Anderson, T., Butterly, J., & ... Brown, J.
(2010). Primary percutaneous coronary intervention for patients presenting with st-
segment elevation myocardial infarction: process improvement in a rural st-segment
elevation myocardial infarction receiving center. Progress in Cardiovascular Diseases,
53(3), 202-209.
Pan, M., Chen, S., Chen, C., Chen, W., Chang, C., Lin, C., & ... Chen, Y. (2014).
Implementation of multiple strategies for improved door-to-balloon time in patients with
st-segment elevation myocardial infarction. Heart & Vessels, 29(2), 142-148.
Reimer, A., Hustey, F., & Kralovic, D. (2013). Decreasing door-to-balloon times via a
streamlined referral protocol for patients requiring transport. American Journal of
Emergency Medicine, 31(3), 499-503.
Saia, F., Marozzini, C., Palmerini, T., Guastaroba , P., Cortesi, P.C., & Gordini, G. (2009).
Optimization of therapeutic strategies for st-segment evaluation acute myocardial
infarction: the impact of a territorial network on reperfusion therapy and mortality. Heart,
95, 370-376.
So, D.Y., Ha, A.C., Turek, M.A. (1997). Comparison of mortality patterns in patients with ST-
elevation myocardial infarction arriving by emergency medical services versus self-
transport. American Journal of Cardiology 97(458-61).

26
Table 1: Articles Utilized in Review.
EMS STEMI Articles Citation Focus of Study Method/
Design Sample Findings Conclusion/
Recommendations
Cone et al., (2013)
To examine D2B times and compliance with the national 90-minute D2B performance benchmark in the first 14 months of a “field activation protocol”
Quasi-experimental. Prospective, observational
There were 38 EMS field activations, 47 nonactivation EMS STEMI arrivals, and 28 walk-in STEMI patients
The mean (±SD) D2B times were 37 (±17), 87 (±40), and 80 (±23) minutes, respectively. D2B time was better for the EMS field activations than for either nonactivation EMS transports or walk-in patients Compliance with the 90-minute D2B benchmark was 100%, 72%, and 68%, respectively, and was better for the EMS field activations than for either of the other groups.
EMS field activation of the cath lab for patients with a STEMI is associated with shorter D2B times and better compliance with 90-minute benchmarks than ED activation for either walk-in STEMI patients or STEMI patients arriving by EMS without field activation. However, improvements are needed with the compliance in the field activation protocol to maximize the stated benefits.
27
Table 1 (continued) Citation Focus of Study Method/
Design Sample Findings Conclusion/
Recommendations
Fosbol et al., (2013)
To assess the adherence of EMS to a STEMI protocol developed in NC.
Quasi-experimental.
Patients were divided into 1) transported directly to a PCI hospital, 2) first taken to a closer non-PCI center and later transferred to a PCI hospital. N = 6,010 patients with STEMI, 1288 were eligible. Of these, 826 (64%) were transported directly to a PCI facility, whereas 462 (36%) were first taken to a non-PCI hospital and later transferred.
In the author’s multivariable model, increase in differential driving time and cardiac arrest were associated with a lesser likelihood of being taken directly to a PCI center, whereas a history of PCI was associated with a higher likelihood of being taken directly to a PCI center. Patients sent directly to a PCI center were more likely to have times between first medical contact and PCI within guideline recommendations
It was determined that patients who were sent directly to a PCI center had significantly shorter time to reperfusion. The prehospital EMS approach was associated with faster reperfusion times and greater likelihood of meeting STEMI treatment guidelines.

28
Table 1 (continued) Citation Focus of Study Method/
Design Sample Findings Conclusion/
Recommendations
Eckstein et al., (2009)
To determine the performance of a regional system with prehospital 12-lead EKG identification of STEMI patients and direct paramedic transport to STEMI receiving centers for PCI.
Prospective observational cohort study
1,220 patients in Los Angeles who were identified with suspected STEMI on prehospital 12-lead.
60% underwent emergency PCI. A D2B time of 90 minutes or less was achieved for 651 (89%) patients, and 459 (62.5%) had EMS-patient contact-to-balloon times </= 90 minutes. Transport of suspected STEMI patients to an STEMI Receiving Center (SRC) resulted in ambulance diversion from a closer ED for 31% of patients and a median increase in transport time of 3.8 minutes.
D2B times within the 90-minute benchmark were achieved for nearly 90% of STEMI patients who were transported by paramedics after implementing a regional system. Whereas the national average of STEMI patients who are taken for primary PCI have a D2B time of less than 90 minutes is only 4%.

29
Table 1 (continued) Citation Focus of Study Method/
Design Sample Findings Conclusion/
Recommendations
Caudle et al., (2009)
Purpose: assess the effectiveness of a protocol for rapid access to PCI in reducing D2B times in STEMI.
Descriptive pre-post-program evaluation.
Rapid transport protocol n=39, historical controls n=42
Patients transported under the rapid access protocol (n = 39) were compared with historical controls (n = 42). Median D2B time was reduced from 87 minutes (67-108) pre-protocol to 62 minutes (40-80) post-protocol (p < 0.001).
The implementation of an EMS protocol for rapid access to PCI significantly reduced time to reperfusion for patients with STEMI.

30
Table 1 (continued) Citation Focus of
Study Method/ Design
Sample Findings Conclusion/ Recommendations
Cheskes et al., (2011)
Purpose: to determine the proportion of patients who met the benchmark of first emergency contact to balloon (E2B) in less than 90 minutes after institution of a regional paramedic activated STEMI bypass to primary PCI protocol.
Pre/post observation cohort study over a 24-month period
Included were all patients diagnosed with STEMI by paramedics trained in ECG acquisition/ interpretation and transported via EMS. In the "pre" phase of the study, paramedics gave EDs advance notification of the arrival of STEMI patients and took the patients to the ED of the PCI center. In the "post" phase of the study, paramedics activated a STEMI bypass protocol in which STEMI patients were transported directly to the PCI suite, bypassing the local hospital EDs.
The times for 95 STEMI patients in the pre- phase were compared with the times for 80 STEMI patients in the post phase. The proportion for whom D2B was less than 90 minutes increased from 28.4% before to 91.3% after (p < 0.001). Median E2B time decreased from 107 minutes pre to 70 minutes post. Median D2B time decreased from 83 minutes pre to 35 minutes post. Median E2D time increased from 21 minutes pre to 32 minutes post. Median differences between phases were significant at p < 0.001.
The proportion of patients with E2B times less than 90 minutes significantly improved through with the implementation of this paramedic-activated STEMI bypass protocol. Further study should occur to determine whether the benefits are reproducible in other EMS systems.

31
Table 1 (continued) Citation Focus of
Study Method/ Design
Sample Findings Conclusion/ Recommendations
Camp-Rogers et al., (2011)
Evaluating the accuracy of EMS activation of the cardiac cath lab for patients with STEMI and its impact on treatment intervals from dispatch to reperfusion.
Pre/post retrospective cohort study
A total of 53 patients, 14 before and 39 after prehospital activation, were included
EMS cardiac cath lab activation was 79.6% sensitive and 99.7% specific. Mean door-to-hospital EKG and mean cath lab-to-reperfusion times were not affected by the intervention. Prehospital activation of the cath lab significantly improved mean door-to-balloon (D2B) time by 18.2 minutes and door-to-cath lab by 14.8 minutes. Improvements in D2B were independent of presentation during peak hours. There were significant time savings reflected in all EMS intervals.
Emergency medical service providers can appropriately activate the CCL for patients with STEMI before emergency department arrival, significantly reducing mean D2B time. Significant reduction is demonstrated throughout EMS intervals.

32
Table 1 (continued)
Process Flow STEMI Articles Citation Focus of Study Method
/ Design Sample Findings Conclusion/
Recommendations
Clark et al., (2012)
Assessing the relationship of emergency medical services (EMS) intervals and internal hospital intervals to the rapid reperfusion of patients with STEMI.
Secondary analysis of prospective cohort.
313 EMS-transported STEMI patients with 298 (95.2%) MI team activations. between January 1, 2004, and December 31, 2009.
In a multivariate analysis, hospital processes EMS activation and Lab arrival to Reperfusion were the most important predictors of Scene to Balloon ≤ 90 minutes.
In this study, hospital process intervals (i.e., EMS activation, door to page, page to laboratory, and laboratory to reperfusion) are key covariates of rapid reperfusion for EMS STEMI patients and should be used when assessing STEMI care.
Kalla et al., (2006)
The purpose of this study was to determine whether implementation of recent guidelines improves in-hospital mortality from acute STEMI in a metropolitan area.
Pre/post retrospective
1053 patients who were admitted with acute STEMI to 1 of the 5 participating high frequency cardiology departments.
Demonstrated the number of patients receiving 1 of the 2 reperfusion strategies (from 66% to 86.6%). Conversely, the proportion of patients not receiving reperfusion therapy dropped from 34% to 13.4%, respectively. Primary PCI (PPCI) usage increased from 16% to almost 60%, whereas the use of lytics decreased from 50.5% to 26.7% in the participating centers. PPCI was more effective in acute STEMI of > 3 but < 12 hours' duration.
The implementation of recent guidelines for the treatment of acute STEMI by the organization of a cooperating network within a large metropolitan area was associated with a significant improvement in clinical outcomes.

33
Table 1 (continued) Citation Focus of Study Method
/ Design Sample Findings Conclusion/
Recommendations
Saia et al., (2009)
To assess the clinical impact of a regional network for the treatment STEMI.
Pre/post comparison
All patients with STEMI (n = 1823) admitted to any of the hospitals of an area with one million inhabitants during the year 2002 (n = 858)-that is, before the network was implemented, and in 2004 (n = 965), the year of full implementation of the network, were enrolled in this study
Between 2002 and 2004, there was a major change in reperfusion strategy: primary angioplasty increased from 20.2% to 65.6%, fibrinolytic therapy decreased from 38.2% to 10.7% and the rate of patients not undergoing reperfusion was reduced from 41.6% to 23.7%. In-hospital mortality decreased from 17.0% to 12.3%. This reduction was continued at 1-year follow-up. The 1-year incidence of all major adverse cardiac and cerebrovascular events were reduced from 39.5% in 2002 to 34.3% in 2004.
Organization of a network for treatment of STEMIs is associated with increased rates of reperfusion therapy and reduction of in-hospital and 1-year mortality.

34
Table 1 (continued) Citation Focus of Study Method
/ Design Sample Findings Conclusion/
Recommendations
Pan et al., (2014)
Purpose: was to assess D2B time before and after specific hospital strategies, including a computerized provider order entry (CPOE), were implemented to reduce D2B time.
Retrospective cohort study
A total of 134 patients were included in the study (preintervention, n = 69; postintervention, n = 65).
Median D2B time improved from 83 to 63 min after the new strategies were implemented ( P = 0.001). Median door-to-electrocardiogram (5-2 min) and door-to-laboratory time (60-41 min) also significantly improved ( P < 0.001). The proportion of patients with a D2B time within 90 min increased from 59.4 % to 98.5 % ( P < 0.001).
These findings suggest that implementing specific strategies can substantially improve D2B time for patients with STEMI and increase the proportion of patients with D2B time less than 90 min.

35
Table 1 (continued) Citation Focus of Study Method
/ Design Sample Findings Conclusion/
Recommendations
Bajaj et al., (2012)
Purpose: was to determine the impact of emergency physician-activated “Code STEMI” protocol on door-to-balloon times during off-hours. The primary objective was to compare median D2B times in both the study groups
Pre/post comparison
Two study groups: one group consisted of 27 STEMI patients who presented during off-hours in the pre-Code STEMI period (Jan to Dec 2006) and the second group consisted of 60 STEMI patients admitted during off-hours when Code STEMI was fully operational (Jan 2007 to Dec 2008).
With the implementation of “Code STEMI” protocol, the median D2B time during off-hours dropped to 77 min (interquartile range [IQR] 67–95), representing a 52-min improvement (p = 0.0001). ECG-to-catheterization laboratory time demonstrated absolute reduction of 16 min. Median peak troponin-I levels dropped from 62 ng/mL (IQR 23–142) to 25 ng/mL (IQR 7–43; p < 0.002). No statistically significant differences were perceived in all-cause mortality among the study groups.
Implementation of “Code STEMI” protocol at this institution significantly reduced D2B times for STEMI during off-hours.

36
Table 1 (continued) Citation Focus of Study Method
/ Design Sample Findings Conclusion/
Recommendations
Reimer et al., (2013)
Purpose: was to evaluate the effectiveness of a streamlined interfacility referral protocol in reducing door-to-balloon (D2B) times for patients experiencing acute STEMI.
Retrospective database review
A total of 133 patients exhibited complete data and were included in the analysis, 54 of which were transferred via the streamlined referral protocol
Streamlined referral patients exhibited a median D2B time of 101 minutes vs a median D2B time of 122 minutes for the traditional referral. D2B times of 90 minutes or less were achieved in 13% of the traditional referral patients and in 30% of the protocol group.
The implementation of a streamlined referral protocol has significantly reduced D2B times for patients diagnosed with STEMI that required interfacility transport for intervention.
Niles et al., (2010)
Purpose: Compare pre and post strategy implementation for process improvement of STEMI patients’ D2B times.
Pre/post comparison
Series of STEMI patients presenting pre and post strategy implementation.
Significant reductions in time to first ECG in the emergency department and D2B were seen in group 2 compared with group 1.
Important improvement in the process of acute STEMI patient care was accomplished in the rural percutaneous coronary intervention center setting by implementing evidence-based strategies.
37
Table 1 (continued) Citation Focus of Study Method/
Design Sample Findings Conclusion/
Recommendations
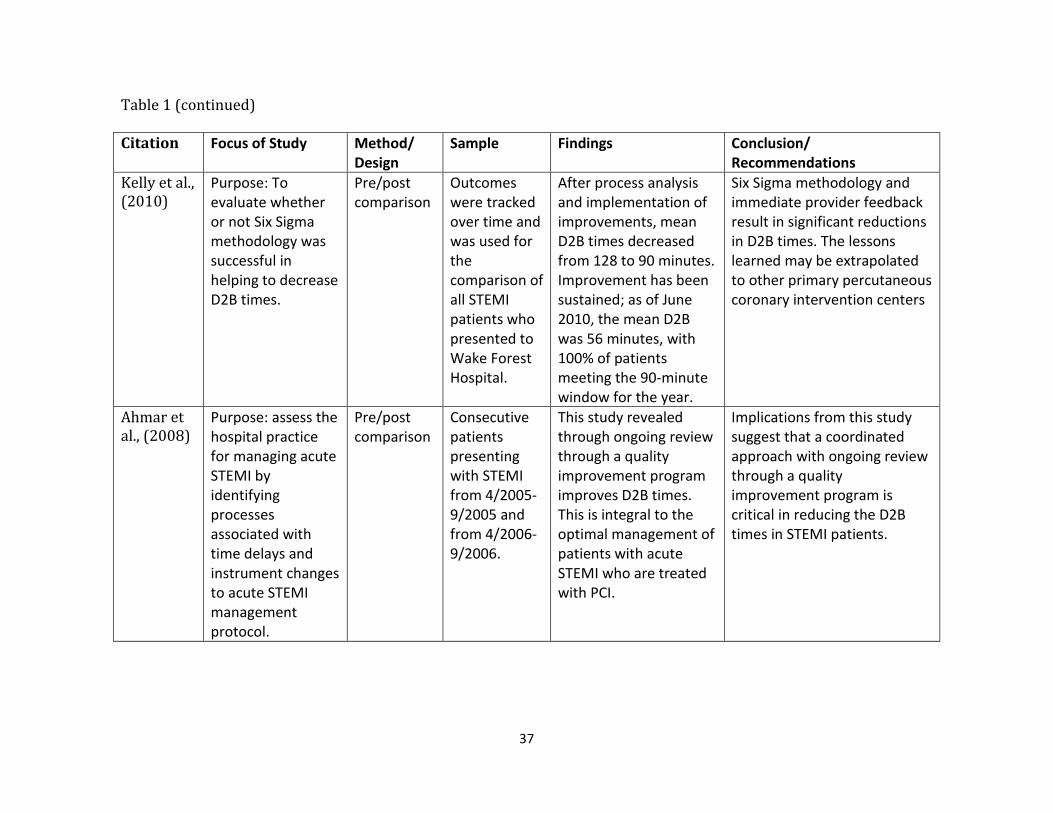
Kelly et al., (2010)
Purpose: To evaluate whether or not Six Sigma methodology was successful in helping to decrease D2B times.
Pre/post comparison
Outcomes were tracked over time and was used for the comparison of all STEMI patients who presented to Wake Forest Hospital.
After process analysis and implementation of improvements, mean D2B times decreased from 128 to 90 minutes. Improvement has been sustained; as of June 2010, the mean D2B was 56 minutes, with 100% of patients meeting the 90-minute window for the year.
Six Sigma methodology and immediate provider feedback result in significant reductions in D2B times. The lessons learned may be extrapolated to other primary percutaneous coronary intervention centers
Ahmar et al., (2008)
Purpose: assess the hospital practice for managing acute STEMI by identifying processes associated with time delays and instrument changes to acute STEMI management protocol.
Pre/post comparison
Consecutive patients presenting with STEMI from 4/2005-9/2005 and from 4/2006-9/2006.
This study revealed through ongoing review through a quality improvement program improves D2B times. This is integral to the optimal management of patients with acute STEMI who are treated with PCI.
Implications from this study suggest that a coordinated approach with ongoing review through a quality improvement program is critical in reducing the D2B times in STEMI patients.
38
Table 2: EMS Articles
Field Activation Direct Transport
Cone et al., (2013) Fosbol et al., (2013) Cheskes et al., (2011) Eckstein et al., (2009) Camp-Rogers et al., (2011) Caudle et al., (2009)
39
Table 3: Hospital Process Articles.
Code STEMI/Code AMI Hospital Specific Process Changes
STEMI Networks/ Regionalizations
Data Feedback
Bajaj et al., 2012 Pan, et al., 2014 Kalla, et al., 2006 Kelly, et al., 2010 Ahmar, et al., 2008 Niles, et al., 2010 Saia, et al., 2009 Niles, et al.,
2010 Ahmar, et al., 2008
Reimer, et al., 2013
Clark, et al., 2012

40
Manuscript 2
An Evaluation of the Implementation of a STEMI Network:
A Retrospective Electronic Medical Review
Julianne Evers, BSN, MS, RN, CCRN
University of Kentucky

41
Abstract
Purpose: The purpose of this project was to evaluate the implementation of an ST-elevation
myocardial infarction (STEMI) Network into a large metropolitan healthcare system in
Kentucky. The objectives of this project were to (1) determine if (and to what extent) the
implementation of the STEMI Network decreased walk-in, emergency medical services (EMS),
and transfer door to balloon (D2B) times at a STEMI receiving center at a metropolitan
Kentucky academic hospital, (2) determine if there is a difference in treatment times for those
individuals who present during working hours compared to non-working hours of the day, and
(3) examine the associations between STEMI processes and specific patient characteristics (age,
gender, race, body mass index, and various co-morbidities).
Setting: This project was conducted in an in-hospital invasive cardiovascular laboratory at a
large metropolitan tertiary care and multi-organ transplant center located in Kentucky.
Population: Among the sample 69.9 % were male and 30.1 % were female. 80.1 % of the
sample was Caucasian and 17.9 % were African American. Those included had an average age
of 59 years (SD= 13.8), the mean body mass index (BMI) was 29.0% (SD=7.5), and 65.5%
percent presented during non-working hours, while 34.5 % presented during working hours.
Inclusion criteria: Patients 18 years or older with the principal diagnosis of a STEMI who
presented as a walk-in to the ED, via EMS directly to the receiving facility or as a transfer
patient from one of the referring hospitals within a 35 mile radius of the receiving hospital during
three separate time periods.
Design & Methods: A retrospective study of electronic medical record data was conducted to
evaluate the efficacy of a STEMI Network during three separate four consecutive month long
time frames. ICD-9 codes 410.0-410.9 and medical record numbers were obtained by the
42
Information Technology Department at a large metropolitan hospital in Kentucky. The data
review included age, gender, race, height, weight; history of hypertension, diabetes mellitus,
prior MI; zip code of patient presenting via EMS; FMC time, door time, first medical contact
time, EKG time, cardiac catheterization lab door time, and device time, and time of day
categorized into working and non-working hours.
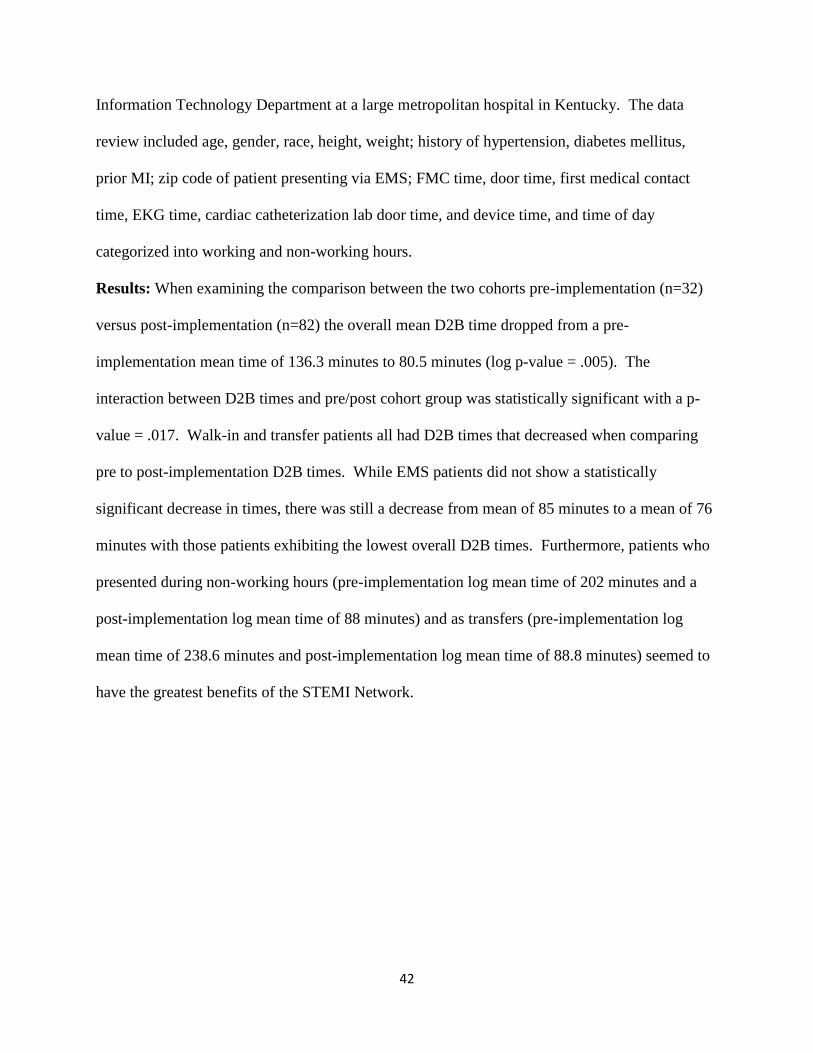
Results: When examining the comparison between the two cohorts pre-implementation (n=32)
versus post-implementation (n=82) the overall mean D2B time dropped from a pre-
implementation mean time of 136.3 minutes to 80.5 minutes (log p-value = .005). The
interaction between D2B times and pre/post cohort group was statistically significant with a p-
value = .017. Walk-in and transfer patients all had D2B times that decreased when comparing
pre to post-implementation D2B times. While EMS patients did not show a statistically
significant decrease in times, there was still a decrease from mean of 85 minutes to a mean of 76
minutes with those patients exhibiting the lowest overall D2B times. Furthermore, patients who
presented during non-working hours (pre-implementation log mean time of 202 minutes and a
post-implementation log mean time of 88 minutes) and as transfers (pre-implementation log
mean time of 238.6 minutes and post-implementation log mean time of 88.8 minutes) seemed to
have the greatest benefits of the STEMI Network.

43
Introduction
Coronary heart disease (CHD) is the principal cause of death in adults throughout the
world and accounts for an even more substantial number of deaths in developed countries
(Rosamond, Flegal, & Friday, et al. 2007). According to Murphy, Xu, and Kochanek (2013),
approximately 600,000 people die from heart disease in the United States every year. Moreover,
heart disease is the leading cause of death for both males and females. The most common type
of heart disease is coronary artery disease, which kills nearly 380,000 people annually (Murphy,
Xu, & Kochanek, 2013). Every year in the United States approximately 720,000 individuals
have a heart attack, of those nearly 75 percent are considered a first heart attack for the
individual (Go, Mozaffarian, Roger, et al, 2014). Additionally, CVD costs the United States
320.1 in 2011 and more specifically, CHD costs the United States practically $108.9 billion a
year (CDC, 2015). This estimation includes the cost of the healthcare provided to patients, their
necessary medications, and the loss of productivity associated with the illness (Heidenreich,
Trogdon, Khavjou et al., 2011).
The burden of heart disease not only exists as a national problem, it also is a significant
burden in the Commonwealth of Kentucky. According to Rosamond, Flegal, & Friday, et al.
(2007), Kentucky was ranked sixth highest in total cardiovascular disease (CVD) deaths.
Moreover, the morbidity and mortality from CVD in Kentucky are among the highest in the
United States (KDPH, 2004). Nationally, Kentuckians have the some of the highest prevalence
of multiple risk factors at 46 percent of adults (e.g., cholesterol, smoking, sedentary lifestyle,
obesity, etc.) (CDC, 2015). This data suggest there is much to be done in the Commonwealth of
Kentucky to decrease the incidence and prevalence as well as mortality and morbidity of
coronary artery disease.

44
Background
Coronary artery disease carries the risk of acute coronary syndromes. Acute coronary
syndrome is an umbrella term that can include any of the three following more specific
syndromes; unstable angina, non-ST segment myocardial infarction or a heart attack (NSTEMI),
and ST-segment elevation myocardial infarction or heart attack (STEMI). All three of these
terms are associated with a sudden rupture of plaque inside the coronary artery. It is the location
of the blockage, the amount of time in which the blood flow to the myocardium (i.e., heart
muscle) is occluded, and the amount of damage that determines which type of acute coronary
syndrome is occurring (Cleveland Clinic, 2015). The type of acute coronary syndrome that is
termed STEMI is the type of heart attack that is associated with a large area of the myocardium;
therefore there will be changes on the EKG, which manifest as ST elevations, thus STEMI. A
STEMI is a medical emergency and requires prompt and timely treatment in order to save as
much heart muscle as possible. The American College of Cardiology (ACC), the American
Heart Association (AHA) as well as the European Society of Cardiology recommends
percutaneous coronary intervention (PCI) as the preferred method of reperfusion for STEMI
patients (Antman et al., 2004; Van de Werf et al., 2003). However, current evidence suggests
that a major limitation to timely reperfusion of STEMIs in the United States is access and lack of
an organized system of care (Nallamothu et al., 2006; Jacobs et al., 2006).
Door to balloon time (D2B) is the time from the arrival of an STEMI patient at a hospital
to the time of PCI. This is a critical variable when evaluating the outcomes of STEMI patients
treated with PCI (McNamara et al., 2006). The ACC/AHA, the Joint Commission Core
Measures, and the European Society of Cardiology published the current recommended door to
balloon (D2B) time as being within a 90 minute time frame (Antman et al, 2008; Silber et al.,

45
2005; Antman, Hand, & Armstrong, 2008) and within a 120 minute timeframe for transfer
patients (ACC/AHA guidelines in 2002). The relationship between decreased
morbidity/mortality and door to balloon (D2B) time is supported by multiple other studies that
also suggest a continuous relationship between shorter D2B times and better survival for patients
who undergo primary PCI for a STEMI (Antonuicci et al, 2002; Berger et al, 1999; Cannon et al,
2000; McNamara et al, 2006; Brodie et al, 2001). For every 15 minute time period beyond 90
minutes there is an associated increased risk of in-hospital death from complications
(Nallamothu, Bradley, & Krumholz, 2007). Despite this widespread knowledge, the vast
majority of these individuals, both male and female, fail to receive the appropriate treatment for
this life-threatening condition within the recommended timeframes.
It is for these reasons, as well as the desire to provide patients with the best care possible
that the STEMI Network was developed at a large metropolitan academic tertiary hospital in
Kentucky. The purpose of the STEMI Network is to decrease D2B times by the optimization of
patient flow (i.e., movement from the field, en route with EMS, through the ER, to the cardiac
catheterization lab (cath lab), with cath lab call team staff prepared and ready for the emergency
patient) and procedural characteristics so that a decreased D2B time can be obtained thereby
decreasing the time until a blocked artery is opened in the cath lab. The goal of the STEMI
Network is to decrease door or first medical contact (FMC)-to-balloon (D2B) to 90 minutes or
less. Furthermore, the goal of the STEMI Network is to decrease D2B time to the lowest
possible D2B time. The ways in which the STEMI Network will aim to achieve an improvement
in this time are threefold: (1) provide immediate assessment in the field, which will allow the
patient to skip the initial emergency department (ED) assessment and be transported directly to
the cath lab; (2) eliminate the timely process of unloading patients at a local hospital that is non-
46
PCI capable; and (3) provide continuous feedback and education on the process and importance
of timely treatment and care of STEMI patients to staff involved. All of these aforementioned
items address the optimization in the flow of the patient from the field through the ED to the cath
lab throughout the cardiac catheterization procedure until PCI is completed.
Furthermore, in order to provide data feedback and assist in the self-reporting of process
improvements the use of Six Sigma methodology is suggested. Six Sigma methodology is a
quality improvement tool that was first developed and used by the Motorola Corporation in the
1970s (Harry, 2000). This is an evaluation tool that has more recently been adapted to use in the
medical field in order to attempt to create less error and to increase efficiency (Schweikhart,
2009). Specifically, Six Sigma can be useful in the analysis and subsequent modifications to
complicated and time sensitive processes that are multidisciplinary in nature and to a variety of
treatment areas (e.g., EMS, ED, cath lab) (Kelly et al., 2010). Consequently, this tool is
particularly useful in exploring any issues with the rapid reperfusion of patients who present with
a STEMI.
Purpose of the Study
The purpose of this study was to evaluate the impact of the implementation of a STEMI
Network into a large metropolitan healthcare system. This study will look to explore whether the
implementation of the STEMI Network decreased the time in which STEMI patients were
appropriately treated with PCI as the primary form of reperfusion therapy in less than 90 minutes
for walk-in and EMS patients; and 120 minutes for transfer patients. The specific aims of this
retrospective medical record review were to examine if: 1) the implementation of a STEMI
Network decrease walk-in door to balloon (D2B) times, 2) the implementation of a STEMI
Network decrease emergency medical system (EMS) D2B times, 3) the implementation of a

47
STEMI Network decrease the D2B time of patients transported from satellite hospitals within a
35 mile radius of the metropolitan hospital (i.e., transfer patients), and 4) to examine whether or
not there an association between the time of day (working hours versus non-working hours)
when the patient was admitted and D2B times?
Description of the Practice Inquiry Project
This practice inquiry project involved the evaluation of selected outcomes of the STEMI
Network in patients who present via walk-in or EMS or are transferred to a 462-bed tertiary
referral center and multi-organ transplant center located in a metropolitan region of Kentucky. A
(descriptive and retrospective review of the EMR) one-time series pre/post-test analysis was used
to determine specific outcomes of the implementation of the STEMI Network and its ability to
decrease the D2B times of STEMI patients.
Methods
Study Design and Sample
A retrospective medical record review was conducted for this descriptive study. One
hundred fifty six medical records from patients who were admitted to a metropolitan hospital
were selected for review. Subjects included all patients admitted to the receiving hospital whose
principal diagnosis was a STEMI during three separate time frames. The first time frame will be
considered the STEMI Network pre-implementation time period and will range from June 1,
2012 through September 30, 2012. The second and third time periods will be considered the
STEMI Network post-implementation time frame and will range from June 1, 2013 through
September 30, 2013 and June 1, 2014 through September 30, 2014. Inclusion criteria are all
patients 18 years or older with the principal diagnosis of a STEMI who presented as a walk-in to
the ED, via EMS directly to the hospital’s ED, or as a transfer patient from one of the referring

48
hospitals within a 35 mile radius of the receiving hospital during the time periods of June 1, 2012
through September 30, 2012, from June 1, 2013 through September 30, 2013, and from June 1,
2014 through September 30, 2014. Exclusion criteria include the following: patient age under 18
years, patients who expire prior to percutaneous coronary intervention, transfers who are coming
to the metropolitan hospital from greater than 35 miles distance, and patients who have received
fibrinolytics before transfer or admission. A waiver of authorization will be requested from the
IRB (Appendix A).
Setting
An in-hospital cardiac catheterization laboratory at a 462-bed metropolitan tertiary care
referral center in Kentucky was used as the setting for this study. The hospital is accredited by
the Joint Commission for Accreditation of Hospitals.
Procedure
Following the development of a project proposal and authorization from the capstone
committee, approval was obtained from the facility’s nursing research council (Appendix B). An
expedited proposal was then submitted and subsequently approved by the University of
Louisville’s (U of L) Institutional Review Board (IRB) (Appendix C). Following U of L’s
approval an IRB authorization agreement (IAA) form was then submitted to request approval
from the University of Kentucky’s (UK) IRB (Appendix D). Nurse administrators, service line
directors, the director of invasive cardiology, and the chest pain coordinator were informed of the
project via hospital email communication and scheduled face-to-face meetings. Approval was
obtained from the director of the cardiovascular service line (Appendix E). This research
involved minimal risk to the participants.

49
Data was retrospectively collected by the Primary Investigator (PI) from multiple
electronic medical databases (EMRs) (Sovera, ICIP, Clinician Valet, Cerner). Data was securely
stored in a locked file while in paper form (Data Collection Form, Appendix F) in which the PI
assigned each subject a sequential ID number. Once all data was collected and there was no
further need to return to a subject’s medical record, paper forms were then shredded. The data
was transferred to an SPSS spreadsheet once received. Data was secured electronically on the
PI’s password protected computer in a locked office. The code to the computer was available to
the PI only. Data was stored on an encrypted file on password protected computers. Data was
not stored on an unauthorized “cloud” type server per HIPAA regulations.
Data Collection
Demographic and data collection variables for this study were collected from the
following databases of the EMR (Sovera, ICIP, Clinician Valet, Cerner): age, gender, race,
height, weight, zip code of patient presenting via EMS, and name of satellite facility of origin or
referring hospital of origin (within a 35 mile radius of the receiving hospital). Independent
variables of interest were collected from the various databases of the EMR (Sovera, ICIP,
Clinician Valet, Cerner): principal diagnoses and comorbidities that included: history of
hypertension, dyslipidemia, diabetes mellitus (diet controlled, insulin requiring, non-insulin
requiring, or no treatment), prior myocardial infarction (MI), prior percutaneous coronary
intervention, prior coronary artery bypass graft surgery (CABG), cocaine use, smoking status,
cardiogenic shock on arrival, hemoglobin A1C, HDL, LDL, cholesterol, statin therapy, non-
statin lipid lowering therapy, name of satellite facility of origin or referring hospital of origin
(within a 35 mile radius of the receiving hospital), first medical contact (FMC) time, door time,
EKG time, STEMI EKG time, fibrinolytic time, cath lab staff activation time, cardiac cath lab
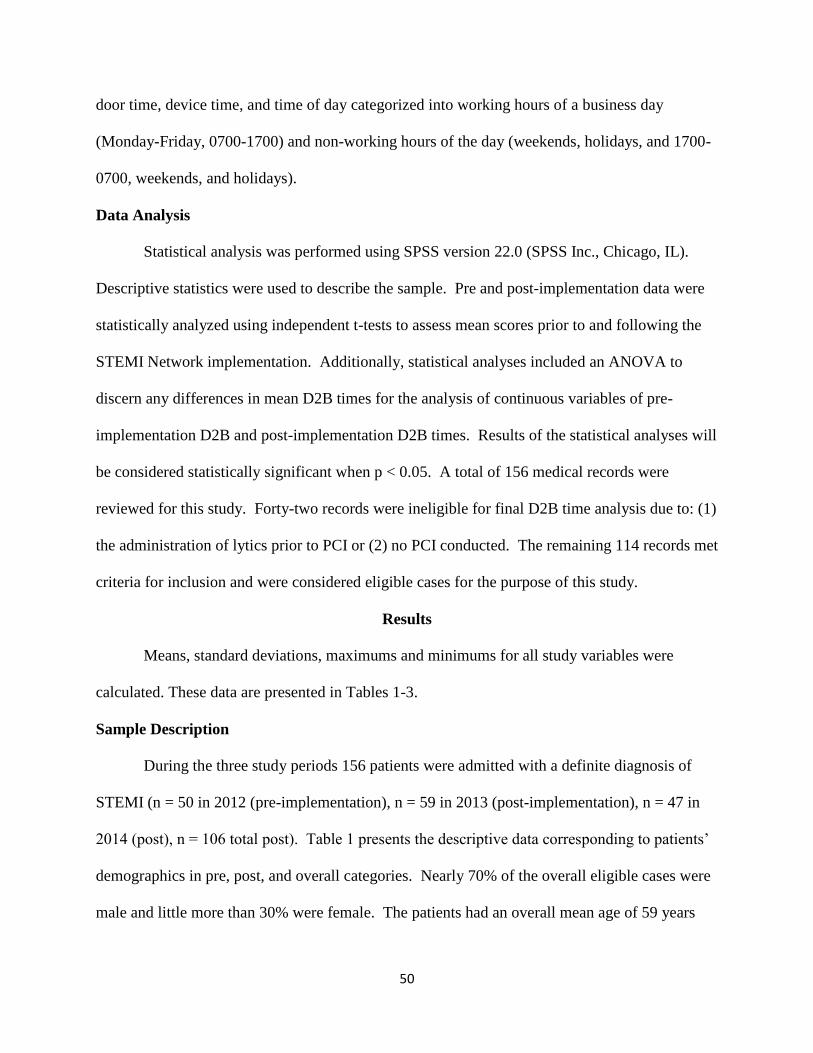
50
door time, device time, and time of day categorized into working hours of a business day
(Monday-Friday, 0700-1700) and non-working hours of the day (weekends, holidays, and 1700-
0700, weekends, and holidays).
Data Analysis
Statistical analysis was performed using SPSS version 22.0 (SPSS Inc., Chicago, IL).
Descriptive statistics were used to describe the sample. Pre and post-implementation data were
statistically analyzed using independent t-tests to assess mean scores prior to and following the
STEMI Network implementation. Additionally, statistical analyses included an ANOVA to
discern any differences in mean D2B times for the analysis of continuous variables of pre-
implementation D2B and post-implementation D2B times. Results of the statistical analyses will
be considered statistically significant when p < 0.05. A total of 156 medical records were
reviewed for this study. Forty-two records were ineligible for final D2B time analysis due to: (1)
the administration of lytics prior to PCI or (2) no PCI conducted. The remaining 114 records met
criteria for inclusion and were considered eligible cases for the purpose of this study.
Results
Means, standard deviations, maximums and minimums for all study variables were
calculated. These data are presented in Tables 1-3.
Sample Description
During the three study periods 156 patients were admitted with a definite diagnosis of
STEMI (n = 50 in 2012 (pre-implementation), n = 59 in 2013 (post-implementation), n = 47 in
2014 (post), n = 106 total post). Table 1 presents the descriptive data corresponding to patients’
demographics in pre, post, and overall categories. Nearly 70% of the overall eligible cases were
male and little more than 30% were female. The patients had an overall mean age of 59 years

51
(SD = 13.7). The percentage of Caucasians was 80.1%, African Americans totaled 17.9%
overall, and Hispanics were just over 1% of total cases.
When comparing the two groups as categorized by pre-implementation and post-
implementation there was not a significant demographical difference between the two groups.
Nearly 66% of the pre- group was male compared to almost 72% of the post- group being male.
Females made up 34% of the pre-group while the post- group was made up of just over 28%
females. The patients in the pre-group had a mean age of 60 years (SD = 14.9) while the post-
group had a mean age of 58 years (SD = 13.1). The percentage of Caucasians in the pre- group
was 74% while in the post- group 83% were Caucasian. Interestingly, just over 39% of the pre-
group were African American while in the post- group just over 60% were African American.
Tables 2 and 3 present data related to pre-existing and co-morbid conditions. The most
frequently occurring co-morbid conditions for the overall patient population were hypertension
at 65.4%, positive smoking status at 53.2%, hyperlipidemia at 50.6%, non-insulin requiring
diabetic at 19.2%, previous history MI 17.3%, previous history of PCI at 16.7%, previous history
of CABG at 9.0%. Additionally, there were no significant differences between pre/post cohorts
in regard to laboratory data (Table 2). Overall, the patients did significantly differ between the 2
cohorts (pre/post) in the conditions of hypertension (p = 0.0017) and diabetes non-insulin
requiring (p = 0.0445) (see Table 3). The remaining co-morbidities and pre-existing conditions
did not show any statistical significance.
Main Study Analyses
Overall Pre and Post D2B Times
The current study was conducted to examine whether the implementation of a STEMI
Network in a large metropolitan hospital would affect, either alone or interactively, the D2B time

52
of STEMI patients who presented either via walk-in, EMS, or transfer. To test for these effects,
an independent t-test was conducted (see Table 5). Subjects were divided into pre-
implementation cohort (n = 32) and post-implementation cohort (n = 82). Table 5 reveals that in
the pre STEMI Network implementation cohort, the overall mean D2B time was 136.3 minutes
(SD = 32.5) and post-implementation of the STEMI network, the overall mean D2B time
dropped to 80.5 (SD = 26.9). The log p-value of 0.005 suggests that this decrease in D2B times
was statistically significant. Table 4 shows the rates of patient presentation separated by pre/post
cohort.
An ANOVA was conducted in order to take into account other variables and to explore
the impact of a STEMI Network on D2B times. The interaction between D2B times and pre/post
cohort group was statistically significant, (F = 5.83, p = 0.017 when p < 0.05).
Presentation Type and D2B Times
EMS and D2B. It should be noted that independent t-tests were initially conducted that
revealed a skewed output (Table 5). However, through the exploration of D2B and EMS
presentation in the initial bivariate analysis, it was revealed that pre-implementation mean time
was 85.5 minutes, (SD = 21.0, 61 min, 140 max) and post-implementation mean time was 76.9,
(SD = 21.8, 46 min, 164 max, p = 0.14). This suggests a not statistically significant interaction
despite the fact that there was a decrease in mean times.
Walk in and D2B. Upon exploration of D2B times and walk-in presentation it was
revealed that through a bivariate analysis that pre-implementation mean time was 98 minutes,
(SD = 51, 62 min, 134 max) and post-implementation mean time was 86, (SD = 33, 54 min, 120
max, p = 0.82). This suggests a not statistically significant interaction despite the fact that there
was a decrease in mean times.

53
Transfer and D2B. Transfer patient presentation and D2B times were also examined in
an independent t-test. Data analysis revealed that pre-implementation mean time was 155
minutes, (SD = 134, 86 min, 628 max) and post-implementation mean time was 92, (SD = 58, 55
min, 474 max, p = 0.004). This suggests a statistically significant interaction.
ANOVA. In regard to D2B time and all three types of presentation (walk-in, EMS, and
transfer), Tables 5-7 present the data for the effects of STEMI Network implementation on D2B
times. Table 7 specifically presents an ANOVA that was conducted to determine whether a
STEMI Network would have effects on D2B time when separated into categories based on
presentation. The results of this ANOVA revealed a highly significant effect. This suggests that
there is in an interaction between implementation and presentation type (F = 6.17, p = .003).
For this ANOVA, the log D2B times were taken for analysis because the initial analysis
showed skewed D2B times. The results of the ANOVA revealed for walk-in presentation pre-
implementation mean time was 98 minutes and post-implementation mean time was 78 minutes
with a standard error of 72.6. For EMS presentation pre-implementation mean was 72 minutes
and post-implementation mean was 74 minutes. Finally, transfer presentation pre-
implementation mean was 238 minutes and the post-implementation mean was 88 minutes.
These changes in mean minutes for each type of presentation suggest that the impact of the
implementation on D2B time seems to be the strongest for transfer patients from outlying
hospitals.
Working Versus Non-Working Hours D2B Times
Independent t-tests were conducted to explore the relationship between D2B and
presentation during working hours in the pre/post cohorts. It was revealed that pre-

54
implementation mean time was 101.3 minutes and post-implementation mean time was 74.1 (log
p-value = .007). This suggests a statistically significant relationship.
Independent t-tests were also conducted for patients who presented during non-working
hours and explored D2B times between pre/post cohorts. Through the bivariate analysis, it was
revealed that pre-implementation mean time was 137.3 minutes and post-implementation mean
time was 91.5 (log p-value = .051). This suggests a not statistically significant interaction
despite the fact that there was a decrease in mean times and the p-value was so close to p > .05
(Table 6).
Table 7 shows the results of the ANOVA which revealed whether there was an impact on
D2B times based on the comparison between working hours (0700-1700) and non-working hours
(1700-0700, weekends, and holidays). The results suggest that no significant differences based
on time or day of patient presentation existed (F = 2.94, p = .09). When comparing pre- versus
post-implementation D2B times, working hours pre-implementation D2B was a mean time of 70
minutes with a standard error of 39.4, and post-implementation time was 72 minutes with a
standard error of 34.6. Conversely, non-working hours pre-implementation D2B revealed a
mean of 202 minutes with a standard error of 38.8, while non-working hours post-
implementation mean was 88 minutes with a standard error of 26.3. Because p = .09, and thus
was approaching significance at p < .05, it was added to the ANOVA to see if there was an
interaction with pre/post implementation and whether or not there was a difference between
patient presentation during working hours versus non-working hours. This data analyses also
revealed this to be not statistically significant.

55
Discussion
It should be understood that reducing total ischemic time has traditionally been limited to
improving the D2B time for patients who present with a STEMI. Within the D2B interval, the
health care team can directly improve mortality by delivering rapid reperfusion therapy (Camp-
Rogers et al., 2011). The current recommended door to balloon (D2B) time is within a 90
minute time frame (Antman et al, 2008; Silber et al., 2005; Antman, Hand, & Armstrong, 2008).
Despite this widespread knowledge, the majority of these STEMI patients do not receive
appropriate treatment within the recommended timeframes. With the creation of STEMI
systems/networks of care, and subsequent ongoing improvements to these systems, the goal to
reduce D2B times (and in turn, total ischemic time) has the possibility of being achieved.
Based upon research previously conducted on the impact of STEMI Networks and their
ability to decrease D2B times, the question was posed in this study asking if a STEMI Network
in a large metropolitan area in Kentucky would be able to replicate similar results. It was
hypothesized that the implementation of a STEMI Network in this metropolitan area would
decrease D2B times. Furthermore, it was hypothesized that D2B times would improve
regardless of type of presentation to the hospital. These types of presentations included walk-in
patients, EMS patients, and transfer patients. Moreover, the question was asked if there was a
difference between D2B times and whether or not the patient presented during working hours or
non-working hours. An ANOVA was conducted to compare the results of pre-implementation
and post-implementation data. The results of these are discussed in the following paragraphs.
Data suggests that the study population in the pre-implementation group compared to the
post-implementation group significantly differed in the conditions of hypertension (p = 0.0017)
and diabetes non-insulin requiring (p = 0.0445) (see Table 3). The remaining co-morbidities and

56
pre-existing conditions did not show any statistical significance and wasn’t vastly different
demographically or clinically (Tables 1-3).
Overall Pre and Post D2B Times
The main findings of this project are that the implementation of a STEMI Network (or an
organized regional system for treatment of STEMIs) effectively decreased D2B times for all
patients across all types of presentations. In the pre STEMI Network implementation cohort, the
overall mean D2B time was 136.3 minutes, whereas post-implementation the overall mean D2B
time dropped to 80.5 minutes with a log p-value of 0.005. This shows that the STEMI network
implementation was successful in decreasing D2B times for all patients who presented in the pre-
implementation group (N= 32) when compared to the post-implementation group (N = 82). This
decrease in D2B time reflects several process improvements for the treatment of STEMI patients.
Presentation Type and D2B Times
Independent t-tests revealed D2B times decreased across all types of presentation.
However, through exploration of this data it was revealed that only the transfer patients had a
statistically significant p-value. Despite transfer patients being the only statistically significant
presentation type, this does not mean that the STEMI Network was only successful for transfer
patients. Rather, this simply means transfer patients saw the biggest improvement in D2B times.
Previous research conducted by Nallamothu, Bradley, and Krumholz (2007) states that for every
15 minute time period beyond 90 minutes there is an associated increased risk of in-patient death
from complications. Therefore, although EMS and walk-in patients did not see a statistically
significant improvement, any time saved is muscle saved and most likely will contribute to
improved patient outcomes and less morbidity and mortality. Through the initial bivariate
analysis, there were time decreases across all types of presentation. It should be noted that

57
independent t-tests were initially conducted that revealed a skewed output (Table 5). Therefore,
an ANOVA was conducted using the log D2B times.
The results of the ANOVA conducted to examine patients D2B times dependent upon
type of presentation revealed that there was a highly significant interaction between
implementation of a STEMI Network and presentation type. That is, the results suggest that
there is a difference between impact of Network implementation and strength of interaction
based on presentation. The STEMI Network, according to the results suggested that the
strongest interaction seemed to be for transfer patients (whose log D2B mean time in minutes
started at 238.6 and after implementation decreased to a mean time of 88.8 minutes, bivariate log
p-value = 0.004). Additionally, the results of this ANOVA also revealed that there was a strong
relationship between network implementation and decrease in D2B time for walk-in patients
whose mean time started at 98.0 minutes and decreased to a mean time of 88.7 minutes (log p-
value =.82). When examining the results for mean time in minutes for patients who arrived via
EMS, there was not a decrease. Rather, there was essentially no change in this measure; the
times (in minutes) remained about the same for EMS patients (pre-implementation mean time
was 72.3 minutes, post-implementation mean time was 74.5, log p-value = 0.1425).
The results of the decrease in D2B time for transfer patients and walk-in patients suggests
that patients from both types of presentation were reperfused more quickly than were their
counterparts who presented via EMS when accounting for other variables. While EMS patients’
D2B times did not reveal a statistically significant improvement over the course of the study
periods, this does not suggest the STEMI Network was not successful for those individuals. This
could have been for a variety of reasons. For example, it may have been that a patient who
presented via EMS was not perfused in a timely manner due to the instability of their condition.

58
That is, it wouldn’t be extraordinary if a patient presented in cardiogenic shock or respiratory
distress needed emergent and prioritized stabilization where reperfusion came second to other
life-saving interventions.
Additionally, the overall picture that can be seen from Table 7 examines the effect of all
variables in conjunction with each other. That is, although EMS patients (irrespective of the
implementation) do have the lowest overall D2B time (Tables 5 and 7); when looking at the
interaction of presentation and pre vs. post it revealed that the implementation was most effective
for the transfer patients (p= .004 log value) (Table 7). Conversely, the 2 minute increase in log
D2B for the EMS patients in the ANOVA analysis isn’t a significant increase (72 minutes pre
and 74 minutes post). It simply indicates that the implementation was more effective for walk-in
and transfer presentation types. When looking at the bivariate association between D2B and pre
vs. post just for the EMS presentations it is demonstrated that the mean D2B did decrease, just
not significantly (pre - 85 minutes and post - 76 minutes).
Working Versus Non-Working Hours D2B Times
The results of the ANOVA conducted to examine the interaction of time and day of
presentation on patient D2B times revealed that there were no significant differences between
patient presentation during working hours (0700-1700) and patient presentation during non-
working hours (1700-0700, weekends, and holidays). However, p = .09 is approaching
significance at p < .05 but is not yet significant. Therefore, this may suggest a need to
investigate further whether there is a difference between impact of network implementation and
strength of interaction based day and time of presentation. That is, patients who presented
during non-working hours had a pre-implementation D2B time in minutes of 202 while the post-
implementation D2B time mean was 88 minutes. This suggests that patients who presented after

59
working hours, on weekends, and on holidays experienced the greatest benefits of the STEMI
Network. Upon further exploration the actual times illustrate that the STEMI network
implementation revealed most significance when examining the improvements of the non-
working hours D2Bs.
Limitations
This project had several important limitations that could potentially affect the validity of
reported results. First, this study holds the characteristics associated with observational
retrospective cohort studies. That is, the PI has no control over exposure or outcome assessment
and there is a reliance on the record keeping of others.
Second, the use of EMRs as a reliable source for information and data collection is an
unending focus in the profession of nursing and healthcare in general (Westra, Delaney,
Konicek, & Keenan, 2008). The clinical documentation of data for the use of program
evaluation and research is in an ongoing process of investigation for its reliability and validity.
Nevertheless, nurses must be able to document and describe clinical practice through the
documentation of an intervention (Westra et al., 2008). Moreover, the ability to use
documentation as a source of information allows researchers to demonstrate the way in which
nursing interventions can affect patient outcomes (Westra et al., 2008).
Third, only the PI was authorized to review the medical records for data collection, which
consequently precluded the establishment of inter-rater reliability and potentially introduced
misclassification bias to the findings. Furthermore, misclassification bias could have occurred at
the time of the IT medical record selection due to inaccurate billing and diagnosis codes.
Fourth, the use of pre and post study design model without any randomization or specific
control group could make it difficult to determine if the reduction in D2B was due to the various

60
changes that were made in this specific STEMI Network such as: (1) providing immediate
assessment in the field, which will allow the patient to skip the initial emergency department
(ED) assessment and allow for immediate transportation directly to the cath lab; (2) elimination
of the timely process of unloading patients at a local hospitals that are non-PCI capable; and (3)
the providing of continuous feedback and education on the process and importance of timely
treatment and care of STEMI patients to staff involved. Although a concurrent cohort may have
been able to minimize potential influence of unanticipated events, it would have not been
logistically feasible to implement. Finally, the findings may not be generalizable to other
facilities or populations as the study was conducted at only one receiving center hospital and
only patients with documented STEMIs were included.
Implications for Practice
Despite the limitations listed above, the results of this study are likely to be useful in a
number of ways. Since CHD is the major cause of mortality for adults globally as well as
nationally and because every 15 minute time period beyond 90 minutes there is an associated
increased risk of in-hospital death from complications (Nallamothu, Bradley, & Krumholz,
2007), it is critical for the medical team to have the best information possible to help guide them
as they try to lower D2B times. This goal can be supported by the body of evidence that
demonstrates the relationship between decreased morbidity/mortality and door to balloon (D2B)
and the assertion that there is a continuous relationship between shorter D2B times and better
survival for patients who undergo primary PCI for a STEMI (Antonuicci et al, 2002; Berger et al,
1999; Cannon et al, 2000; McNamara et al, 2006; Brodie et al, 2001).
The implementation of a STEMI Network for the treatment of acute STEMIs in a large
metropolitan hospital in Kentucky has led to a significant overall reduction in D2B times. When

61
patients were identified as having a STEMI, treatment protocols were initiated in a time sensitive
fashion thereby facilitating these improvements (decreases) in D2B time. This is of critical
importance especially when considering recent studies that suggest even small improvements in
D2B times have a direct relationship to patient mortality (Nallamothu, Bradley, & Krumholz,
2007; McNamara et al., 2006).
Implications for Education
This study provides an important example of evidence to support the use of a method for
continuous program evaluation. In order to carry out a continuous program evaluation, there
needs to be a framework in which to use as a guide. A useful quality improvement plan in this
case may perhaps be best implemented with the use of Six Sigma methodology. The Six Sigma
methodology is a quality improvement tool that was first developed and used by the Motorola
Corporation in the 1970s (Harry, 2000). This is an evaluation tool that has more recently been
adapted to use in the medical field in order to attempt to be more efficient and create less error
(Schweikhart, 2009). Specifically, Six Sigma can be useful to analyze and modify complicated
and time sensitive processes that involve multiple disciplines and treatment areas (e.g., EMS,
ED, cath lab) (Kelly et al., 2010). Consequently, this tool is particularly useful in exploring any
issues with the rapid reperfusion of patients who present with a STEMI. One study that occurred
at Wake Forest Hospital used the Six Sigma methodology to aid in the improvement of hospital
D2B times (Kelly et al., 2010). Thus, the authors reported that after process analysis and
implementation of improvements, mean D2B times decreased from 128 minutes to 90 minutes.
This improvement was sustained. Similarly, for this project, it may be useful to use the Six
Sigma framework to improve specific areas of the STEMI Network processes, specifically in the
category of EMS STEMI times.

62
Implications for Future inquiry
There are several areas for future research when attempting to decrease D2B times for
patients who present with a STEMI. That is, are any barriers becoming apparent with current
STEMI Network protocol? What are possible ways in which to work through those barriers
while holding true to the best-practice based on AHA guidelines? Another area for future
inquiry might perhaps lie in an effort to integrate disciplines for optimal outcomes for STEMI
patients. This will take a continuous evaluation with a multidisciplinary approach to discuss
processes, goals, concerns with current protocols and make suggestions as to how to make
improvements. Additionally, individual stakeholders such as the receiving hospital, the referring
hospitals, healthcare providers, EMS, and local patient populations need to be involved in future
research. In addition to the stakeholders as individuals, further research should be taken into
consideration with regard to the relationships between and within the stakeholders including but
not limited to receiving hospital relationship with outlying facilities, receiving hospital
relationship with local EMS companies, local patient population characteristics, and other
variables specific to an institution’s location and demographics. Finally, further research related
to D2B time should include factors that take into consideration geographic location as there are
various aspects to any location that may influence D2B times.
Conclusion
This study aimed to determine if the implementation of a STEMI Network could decrease
walk-in Door to Balloon (D2B) times, decrease EMS D2B times, decrease the D2B time of
patients transported from satellite hospitals, and determine if there is an association between the
time of day (working hours versus non-working hours) when the patient was admitted and D2B
times. Results suggest that the implementation of a STEMI Network for the treatment of acute

63
STEMI patients in a large metropolitan area in Kentucky by way of regional network is an
effective strategy to help reduce D2B times in patients who present with STEMIs. This is
critical because as the literature suggests, even small improvements in D2B are important and
demonstrate a direct relationship between a decreased D2B and decreased mortality rates
(Nallamothu et al., 2007; McNamara et al., 2006). The clinical significance of this finding for a
state that has the sixth highest rate of heart disease mortality in the nation is critical and has the
potential to decrease mortality and morbidity (Haverson, Ma, & Hamer, 2004; KDPH, 2009a;
KDPH 2009b; & Rugg, Bailey, & Browning, 2008). Future research and ongoing education of
and with the multidisciplinary team can be instrumental to improving the design,
implementation, and evaluation in order to facilitate the growth of future organized systems of
STEMI care and STEMI Networks.

64
References
ACC/AHA Guidelines 2002.
Alspach, J.G. (2006). AACN Core Curriculum for Critical Care Nursing (6th ed) Saunders.
American Diabetes Association: Standards of medical care in diabetes–2006. Diabetes Care 29
(Suppl. 1):S4 –S42, 2006.
American Heart Association (2013). Retrieved from
http://www.heart.org/HEARTORG/HealthcareResearch/MissionLifelineHomePage/Lear
n-About-Mission-Lifeline_UCM_438708_Article.jsp.
American Heart Association (2013). Retrieved from
http://www.heart.org/HEARTORG/HealthcareResearch/MissionLifelineHomePage/Lear
nAboutMissionLifeline/STEMI-Systems-of-Care_UCM_439065_SubHomePage.jsp.
Antman E.M., Hand M., Armstrong P.W., Bates E.R., Green L.A., Halasysmani L.K.,…Yancy
C.W. (2008). 2007 Focused update of the ACC/AHA 2004 guidelines for the
management of patients with st-elevation myocardial infarction: a report of the American
college of cardiology/American heart association task force on practice guidelines:
developed in collaboration with the Canadian cardiovascular society endorsed by the
American academy of family physicians: 2007 writing group to review new evidence and
update the ACC/AHA 2004 guidelines for the management of patients with st-elevation
myocardial infarction, writing on behalf of the 2004 writing committee. Circulation 117:
296-329.
Antman, E.M., Anbe, D.T., Armstrong, P.W., Bates, E.R., Green, L.A., Hand….Jacobs, A.K.
(2004). ACC/AHA guidelines for the management of patients with st-elevation
myocardial infarction: executive summary: a report of the American college of

65
cardiology/American heart association task force on practice guidelines. Circulation.
110:588-636.
Antman, E.M., Hand, M., Armstrong, P.W., et al. (2008). 2007 focused update of the ACC/AHA
2004 guidelines for the management of patients with st-elevation myocardial infarction.
Journal of American College of Cardiology. 51:210-247.
Antonuicci, D.,Valenti R., Migliorini A., Moschi G., Trapani M., Buonamici P,… Cerisano G,
(2002). Relation of time to treatment and mortality in patients with acute myocardial
infarction undergoing primary coronary angioplasty. American Journal of Cardiology.
89(11): 1248-52.
Berger P.B., Ellis S.G., Holmes D.R. Jr, Granger C.B., Criger D.A., Betriu A.,…Topol E.J.,
(1999). Relationship between delay in performing direct coronary angioplasty and early
clinical outcome in patients with acute myocardial infarction: results from the global use
of strategies to open occluded arteries in acute coronary syndromes (GUSTO-IIb) trial.
Circulation. 100(1): 14-20.
Brodie B.R., Stone G.W., Morice M.C., Cox D.A., Garcia E., Mattos L.A. (2001). Importance of
time to reperfusion on outcomes with primary coronary angioplasty for acute myocardial
infarction (results from the stent primary angioplasty in myocardial infarction trial).
American Journal of Cardiology. 88:1085-1090.
Candido R, Srivastava P, Cooper ME, Burrell LM. (2003). Current opinion in investigational
drugs. Diabetes mellitus: a cardiovascular disease. Sep;4(9):1088-94.
Cannon C.P., Gibson C.M., Lambrew C.T., Shoultz D.A., Levy D., French W.J…Tiefenbrunn,
A.J. (2000). Relationship of symptom-onset-to-balloon time and door-to-balloon time

66
with mortality in patients undergoing angioplasty for acute myocardial infarction. JAMA.
283:2941-2941.
Centers for Disease Control and Prevention (CDC). (2015). Retrieved on February 6, 2015.
http://nccd.cdc.gov/DHDSP_DTM/#
Chen Y., Wang C., Yang X., Wang L., Sun Z., Liu H., Chen L. (2012). Independent no-reflow
predictors in female patients with st-elevation myocardial infarction treated with primary
percutaneous coronary intervention. Heart Vessels. 27: 243-249.
Close to the Heart of Kentucky—A Report on the Status of Cardiovascular Disease in the
Commonwealth: Chronic Disease Prevention and Control Branch Division of Adult and
Child Health Improvement, Kentucky Department for Public Health; 2004.
Expert Panel on Detection, Evaluation, and Treatment of High Blood Cholesterol in Adults.
(2001). Executive summary of the third report of the national cholesterol education
program (NCEP) expert panel on detection, evaluation, and treatment of high blood
cholesterol in adults (Adult Treatment Panel III). JAMA 285: 2486–2497.
Go AS, Mozaffarian D, Roger VL, Benjamin EJ, Berry JD, Blaha MJ, et al. Heart disease and
stroke statistics—2014 update: a report from the American Heart Association.
Circulation. 2014 ;128.
Halverson, J., Ma, L., & Harner, E. (2004). An analysis of disparities in health status and access
to care in the Appalachian region. Appalachian Regional Commission. Washington, DC.
Harry, M.S.R. (2000). Six Sigma. New York, NY. Doubleday Publishers.
Heidenreich PA, Trogdon JG, Khavjou OA, et al. Forecasting the future of cardiovascular
disease in the United States: a policy statement from the American Heart Association.
Circulation. 2011;123:933-44. Epub 2011 Jan 24.

67
http://my.clevelandclinic.org/services/heart/disorders/cad/hic_Heart_Attack/mi_types
Jacobs A.K., Antman, E.M., Ellrodt, G., Faxon, D.P., Gregory, T., Mensah….Smith, S.C. (2006).
Recommendation to develop strategies to increase the number of st-segment-elevation
myocardial infarction patients with timely access to primary percutaneous coronary
intervention. Circulation. 113: 2152-2163.
KDPH 2009a. Kentucky Department of Public Health, County health profiles. Retrieved (2014,
Oct 3) from http://chfs.Kentucky.gov/dph/epi/cohealthprofiles.htm.
KDPH 2009b. Kentucky Department of Public Health, Office of Vital Statistics.
Kelly, E., Kelly, J., Hiestand, B., Wells-Kiser, K., Starling, S., & Hoekstra, J. (2010). Six sigma
process utilization in reducing door-to-balloon time at a single academic tertiary care
center. Progress in Cardiovascular Diseases, 53(3), 219-226.
Learn the Heart. (2013). Retrieved from http://www.learntheheart.com/CAD-STEMI-
SpecialSituations.html.
McNamara R.L., Wang Y., Herrin J., Curtis J.P., Bradley E.H., Magid D.J…NRMI
Investigators. (2006). Effect of door-to-balloon time on mortality in patients with st-
segment elevation myocardial infarction. Journal of American College of Cardiology.
47:2180-2186.
Murphy SL, Xu JQ, Kochanek KD. Deaths: Final data for 2010. Natl Vital Stat Rep. 2013;61(4).
http://www.cdc.gov/nchs/data/nvsr/nvsr61/nvsr61_04.pdf
Nallamothu, B.K., Bates, E.R., Wang, Y., Bradley E.H., Krumholz, H.M. (2006). Driving times
and distances to hospitals with percutaneous coronary intervention in the United States:
implications for prehospital triage of patients with st-elevation myocardial infarction.
Circulation. 113:1189-1195.

68
Nallamothu, B.K., Bradley, E.H., & Krumholz, H.M. (2007). Time to treatment in primary
percutaneous coronary intervention. New England Journal of Medicine; 357:1631-1638.
Racial/Ethnic and Socioeconomic Disparities in Multiple Risk Factors for Heart Disease and
Stroke—United States, (2003). MMWR Morb Mortal Wkly Rep. Feb 11 2005;54(5):113-
117.
Rosamond W, Flegal K, Friday G, et al. Heart disease and stroke statistics—2007 update: a
report from the American Heart Association statistics committee and stroke statistics
subcommittee. Circulation. 115(5):e69-171.
Rugg, S.S., Bailey, A.L., & Browning, S.R. (2008). Preventing cardiovascular disease in
Kentucky: epidemiology, trends, and strategies for the future. Kentucky Medical
Association Journal CME. 153-167 April 2008. Vol 106.
Silber S., Albertsson P., Aviles F.F., Camici P.G., Columbo A., Hamm C., Jorgensen E.,…Wijns
W. (2005). Task force for percutaneous coronary interventions of the European society of
cardiology guidelines for percutaneous coronary interventions. The task force for
percutaneous coronary interventions of the European society of cardiology. European
Heart Journal. 26:804-810.
Schweikhart, S.D. (2009). The applicability of lean and six sigma techniques to clinical and
translational research. Journal of Investigative Medicine, 57: 748-755.
World Health Organization. (2015) Retrieved January 7, 2015 from
http://www.who.int/mediacentre/factsheets/fs317/

69
Table 1: Descriptive Statistics for Demographic Characteristics.
Variable N Pre-
Mean
Post-
Mean
Overall
Mean
Standard
Deviation
Maximum
Value
Minimum
Value
Age (in years) 156 60.0 58.8 59.3 13.7 102 26
Gender
Male 109 66.0% 71.7% 69.9% -- -- --
Female 47 34.0% 28.3% 30.1% -- -- --
Race
Caucasian 125 74.0% 83.0% 80.1% -- -- --
African
Am.
28 22.0% 16.0% 17.9% -- -- --
Hispanic 3 4.0% 0.9% 1.9% -- -- --
BMI % 28.4% 29.3% 29.0% 7.52 68.3 13.5
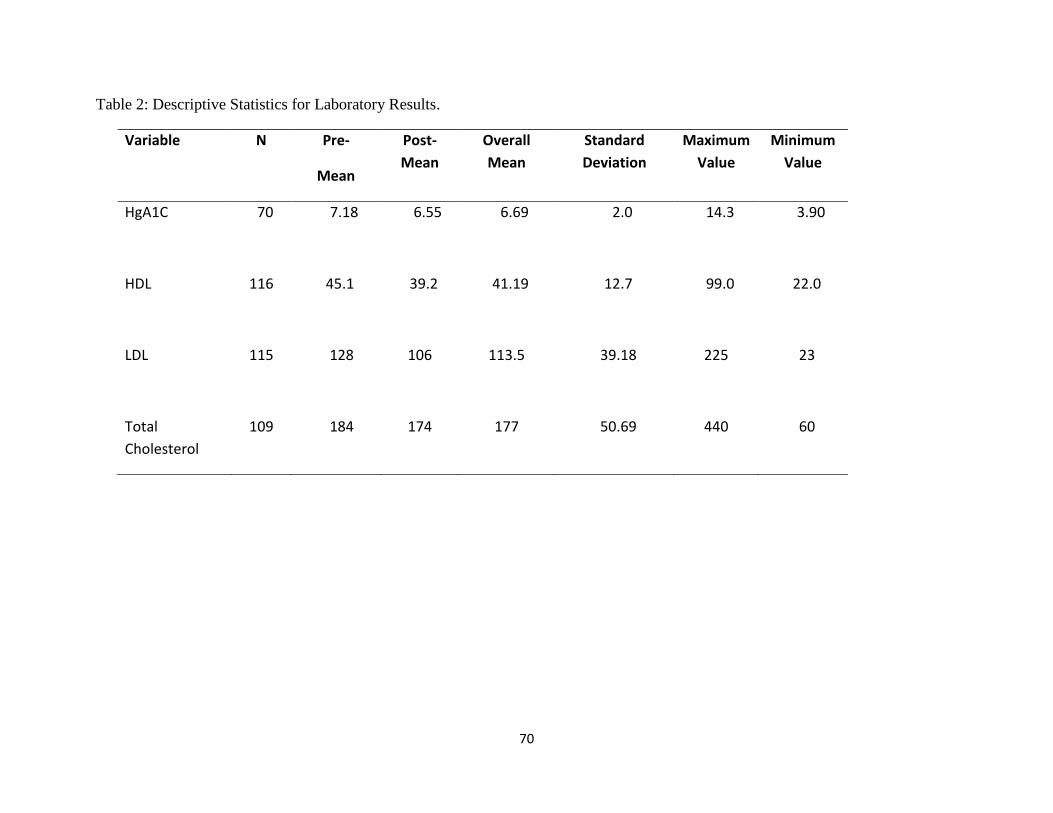
70
Table 2: Descriptive Statistics for Laboratory Results.
Variable N Pre-
Mean
Post-
Mean
Overall
Mean
Standard
Deviation
Maximum
Value
Minimum
Value
HgA1C 70 7.18 6.55 6.69 2.0 14.3 3.90
HDL 116 45.1 39.2 41.19 12.7 99.0 22.0
LDL 115 128 106 113.5 39.18 225 23
Total
Cholesterol
109 184 174 177 50.69 440 60

71
Table 3: Descriptive Statistics for Co-morbid and Pre-existing Conditions (N = 156).
Co-Morbidities Pre- Mean Post-Mean Overall Mean Chi-square
Hypertension 48.0% 73.6% 65.4% 0.0017
Smoking 52.0% 53.8% 53.2% 0.8359
Hyperlipidemia 44.0% 53.8% 50.6% 0.2545
Statin Therapy 20.0% 30.2% 26.9% 0.1806
Diabetes Non-Insulin Requiring 10.0% 23.6% 19.2% 0.0445
Prior MI 16.0% 17.9% 17.3% 0.7668
Prior PCI 12.0% 18.9% 16.7% 0.2828
Prior CABG 6.0% 10.4% 8.97% 0.3720
Non-statin lipid
lowering Therapy
2.0% 7.6% 5.8%
0.1655
Diabetes Insulin Requiring 4.0% 4.7% 4.49% 0.8400
Diet Controlled 2.0% 0% 0.6% 0.1441
No Treatment 2.0% 3.77% 3.2% 0.5573
Cardiogenic Shock 6.0% 1.9% 3.2% 0.1735
Cocaine 0% 0% 0% --

72
Table 4: Type of Presentation, % of patients.
Presentation Pre-
Post- Overall
Walk-in 8.0% 8.5% 8.3%
EMS 36.0% 31.1% 32.7%
Transfer 56.0% 60.4% 58.9%
Total 32.1% 67.9% 100.0%

73
Table 5: D2B Times (in minutes).
Presentation Mean D2B
Time
Standard
Deviation
Maximum
Value
Minimum
Value
Log of the D2B
p value
Overall Pre-implementation 136.3 0.005
Post-implementation 80.5
Walk-in
Pre-implementation 98 51 134 62 0.8212
Post-implementation 86 33 120 54
EMS
Pre-implementation 85 21 140 61 0.1425
Post-implementation 76 22 164 46
Transfer
Pre-implementation 155 134 628 86 0.0047
Post-implementation 92 58 474 55
74
Figure 1: Type of Presentation and D2B times.
0
20
40
60
80
100
120
140
160
180
Overall (p =0.005)
Walk-in (p =0.82)
EMS (p = 0.14) Transfer (p =0.004)
Pre-implementation
Post-Implementation
Time in
Minutes
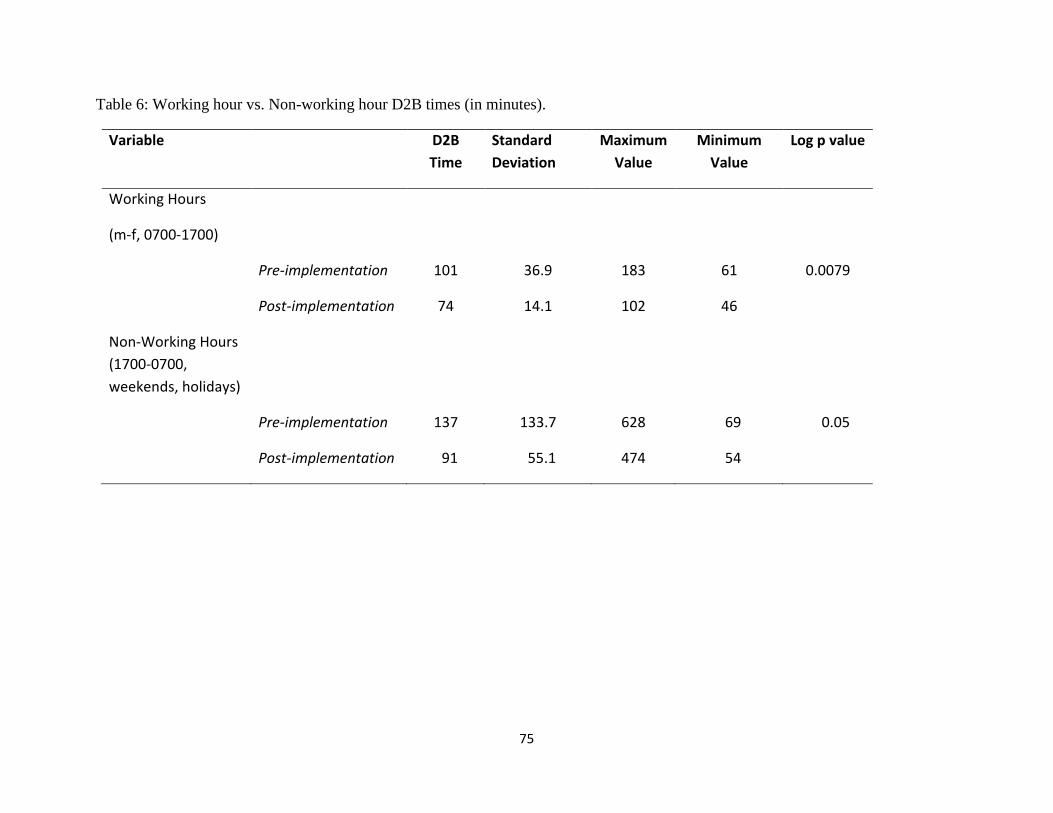
75
Table 6: Working hour vs. Non-working hour D2B times (in minutes).
Variable D2B
Time
Standard
Deviation
Maximum
Value
Minimum
Value
Log p value
Working Hours
(m-f, 0700-1700)
Pre-implementation 101 36.9 183 61 0.0079
Post-implementation 74 14.1 102 46
Non-Working Hours
(1700-0700,
weekends, holidays)
Pre-implementation 137 133.7 628 69 0.05
Post-implementation 91 55.1 474 54

76
Table 7: ANOVA Analysis.
Variable Implementation
Period
Log D2B time in
minutes
Standard
Error
DF F value P value
p < .05
Overall
pre 136.3 32.5 107 5.83 0.017
post 80.5 26.9 107
Walk-in
Pre 98.0 87.0 107 6.17 .0029
Post 78.3 72.6 107
EMS
Pre 72.3 32.1 107
Post 74.5 22.5 107
Transfer
Pre 238.6 30.9 107
Post 88.8 18.9 107

77
Table 7 (continued)
Variable Implementation
Period
Log D2B time in
minutes
Standard
Error
DF F value P value
p < .05
Working Hours
Pre 70.1 39.4 107 2.94 .0896
Post 72.2 34.6 107
Non-working
hours
Pre 202.5 38.8 107
Post 88.9 26.3 107

78
Manuscript 3
Social Determinants of Cardiovascular Disease
A Literature Review
Julianne Evers, BSN, MS, RN, CCRN
The University of Kentucky
79
Abstract
The purpose of this manuscript is twofold: (1) highlight the disparity between socioeconomic
status (SES) and cardiovascular disease (CVD) and (2) suggest focus areas to attempt to decrease
the disparities between SES and CVD. Although it is well known that CVDs are diseases related
the physical and chemical environment (e.g. high blood pressure, diabetes, cholesterol, tobacco
use, sedentary lifestyle), it is less well known how social and economic status (e.g. income,
education, socioeconomic status, occupation) influence CVD. Social determinants of health do
not simply come down to social inequalities; however, social inequalities help to demonstrate the
shortcomings our healthcare system in the setting of SES. This literature review presents
several studies that highlight the correlation between SES and CVD (O’Connor & Wellenius,
2012; & Pollack et al, 2012). Finally, by using Healthy People 2020 as a guide, this manuscript
will also illuminate several areas to focus on (e.g., medical care, public education, public policy,
and research) in an attempt to decrease the disparities between socioeconomic status (SES) and
CVD.
Keywords: Socioeconomic status (SES), cardiovascular disease (CVD), social
determinants

80
Introduction
There is an abundance of literature and it is widely known that there exists a relationship
between cardiovascular disease (CVD) and risk factors such as high blood pressure, cholesterol,
smoking, diabetes, and sedentary lifestyle. Conversely, there is much less known about the
social determinants of an individual’s CVD. Social determinants in the setting of health and
health care can be understood as the social conditions in which an individual lives, an
individuals’ working conditions, and/or their social relationships (Lang, Lepage, Scheiber,
Lamy, & Kelly-Irving, 2012). These conditions are influenced and shaped by a variety of factors
including an individual’s education, income, occupation, employment status, and living
conditions (Morgenstern, 1985). Disparities in health outcomes related to socioeconomic status
(SES) have long been recognized as a continuing and perhaps an even increasing public health
problem (Lantz et al, 1998).
The National Institute of Health (2014) defines health disparities as the differences in the
incidence, prevalence, mortality, and burden of diseases as well as other adverse health
conditions that exist among specific population groups in the United States. According to
Healthy People 2020 (Healthy People, 2015), some of the leading disparities in the United States
are cardiovascular disease (CVD), diabetes, cancer, HIV/AIDS, infant mortality, asthma, and
mental health. This review focuses on the disparities in cardiovascular disease (CVD) in the
setting of socioeconomic status (SES).
CVDs are a group of disorders of the heart and blood vessels. According to the World
Health Organization (2014), the diseases that make up CVD are; coronary heart disease (CHD),
which is a disease of the blood vessels that supply blood to the heart; cerebrovascular disease
(stroke), which is a disease of the blood vessels that supply blood to the brain; peripheral arterial

81
disease, which is a disease of the blood vessels that supply blood to the arms and legs, rheumatic
heart disease, which is damage to the heart muscle and heart valves from rheumatic fever;
congenital heart disease; and deep vein thrombosis and pulmonary embolism. The most
common of these are CHD and stroke which, both of which are the most widespread and are the
most costly in the U.S. Specifically, it is reported that heart disease and stroke cost the U.S. over
$500 billion in health care expenditures and associated expenses in the year 2010 (Lloyd-Jones,
Adams, & Brown, et al., 2010). Collectively, these diseases make up the umbrella term
cardiovascular disease (CVD).
Healthy People 2020 reports the following objectives in regard to cardiovascular disease:
(1) increase overall cardiovascular health in the U.S. population, (2) reduce CHD deaths, (3)
increase the proportion of adults who have their blood pressure measured and how many of these
individuals can report whether their blood pressures are high/low/normal, (4) reduce the
proportion of individuals with hypertension, (5) reduce the number of individuals who have high
cholesterol, and (6) increase the proportion of adults who are aware of the early warning
symptoms and signs of a heart attack, etc. (Healthy People, 2015). Unfortunately, according to
the 2004 Behavioral Risk Factor Surveillance System (BRFSS), the Commonwealth of Kentucky
had not met any of the stated objectives for CVD from Healthy People 2010. If there is to be any
advancement towards meeting some of Healthy People 2020’s goals, interventions and public
health initiatives need to be more effective at addressing the prevention and treatment of CVD
(Rugg, Bailey, & Browning, 2008).
The purpose of this review is twofold: (1) highlight the disparity between socioeconomic
status (SES) and cardiovascular disease (CVD) and (2) suggest focus areas to attempt to decrease
the disparities between SES and CVD. CVDs are diseases related not only to the physical and
82
chemical environment but also to the social and economic one. While the question of social
determinants of health does not only mean social inequalities in health, social inequalities do
help to reveal the shortcomings of our healthcare system in the setting of SES.
Quantifying Cardiovascular Disease Globally and Nationally
On the global level, CVD is the number one cause of death with more people dying from
CVD than any other cause (Rosamond, Flegal, & Friday et al., 2007). The WHO (2014)
estimated that 17.5 million people died from CVDs in 2012 which represents 30% of all global
deaths. Of these deaths, an estimated 7.4 million were due to CHD which is a disease that
affects the blood vessels of the heart and is one of the many diseases that make up the
overarching disease of CVD. It is important to note that low- and middle-income countries are
disproportionally affected: specifically, over 80 percent of CVD deaths take place in low- and
middle-income countries and occur almost equally in men and women (WHO, 2011b; CDC,
2015).
In the United States, CVDs are the primary cause of death and are major causes of
disability (Centers for Disease Control and Prevention (CDC), 2006). The CDC estimates that
720,000 heart attacks occur every year and according to the American Heart Association (CDC,
2015), 80 million people in the U.S had one or more forms of the previously mentioned CVDs in
2006. Nearly one in every four deaths can be attributed to CVD (Murphy, Xu, & Kochanek,
2013). Moreover, the estimated direct and indirect cost of CHD in the U.S. in 2011 was 320.1
billion dollars (CDC, 2015; AHA, 2015).
Quantifying Cardiovascular Disease in Kentucky
Coronary heart disease (CHD) or heart disease is a group of diseases that can cause heart
attacks and is the leading cause of death in Kentucky and the nation. It is the most common form
83
of CVD and in 2005 accounted for 76 percent of all CVD deaths in the Commonwealth of
Kentucky. This translated to over 10,000 deaths. As of 2006, Kentucky had the sixth highest rate
of heart disease mortality in the nation, while Mississippi, District of Columbia, Alabama,
Oklahoma, and West Virginia, had the top five positions, respectively (Haverson, Ma, & Hamer,
2004; KDPH, 2009a; KBDP 2009b; & Rugg, Bailey, & Browning, 2008).
In addition to the CVD and CHD rates, Kentucky also leads the nation in the prevalence
of several of the known risk factors for CVD (CDC, 2011). While the rates for CVD in
Kentucky remain high, the prevalence of the risk factors for CVD sets the population up for
disease sequalae. According to Kentucky’s Behavioral Risk Factor Survey (BRFSS) (2012),
approximately 6.6 percent of adults in Kentucky have been told by a health care professional that
they have had a heart attack compared to the national percentage of 4.5 percent. Similarly, 6.1
percent have been told they have CHD while the national percentage is 4.3 percent. Kentuckians
who have been told they have had a stroke is 4.2 percent while the national percentage is 2.9
percent, and those who have been told they have diabetes is about 10.7 percent while the national
percentage is 9.7, and in the 2012 report, those who were classified as obese were 31.3 percent
and comparatively that same year, the national percentage for obesity based on body mass index
was 21.7 percent. Finally, those who are considered current smokers (as defined by currently
smoking cigarettes every day or some days) in Kentucky are 28.3 percent while the national
average for the same classification is 19.6 percent (Figure 1).
Because Kentucky leads the nation in the prevalence of the known risk factors for CVD,
it would stand to reason than that Kentucky also leads the nation in a more comprehensive
umbrella diagnosis of CVD (KDPH, 2009b). The 2012 annual report from the BRFSS,
illustrates the disparity between the national rates of CVD (specifically CHD) and the

84
Commonwealth of Kentucky’s rate of CHD. That is, in the areas of obesity, diabetes, CHD,
stroke, heart attack (which are all sub-categories of CVD) Kentucky has a higher prevalence of
each of those diseases than does the rest of the nation.
In addition to the above statistics, the KDPH (2009b), also reports that men in Kentucky
have higher heart disease death rates than women. Moreover, the rates for both men and women
in Kentucky are higher than the rates for men and women nationwide. Similar disparities are
also seen among whites and blacks (KDPH, 2009b). In both Kentucky and the U.S., heart
disease death rates for blacks are higher than they are for whites. The age-adjusted heart disease
mortality rate for white Kentuckians (250 per 100,000) is higher than it is for white Americans
(212 per 100,000). The rate for black Kentuckians (292 per 100,000) is higher than it is for
black Americans (277 per 100,000) (KDPH, 2009b).
Quantifying Socioeconomic Status
There are many different ways in which to conceptualize and thus measure SES. Some
of those variables that can be used to measure SES are education, income, social class,
occupation, employment status, living conditions, status, power, etc. (Morgenstern, 1985). In
this review the following three variables will briefly be discussed; income, occupation, and
education in the setting of access to health and health care. Income is a typically very good
marker of SES (Libertos, Link, & Kelsey, 1988; & Morgenstern, 1985). Information concerning
income can provide access to goods and services that include but are not limited to quality
education and quality health care. However, this is a difficult variable to measure. That is,
individual or family income may be measured or incomes can be adjusted to a specific family
size. Additionally, this can be a difficult number to gain access to due to the sensitivity of it and
need for assurance of confidentiality. Second, occupation is an important status characteristic in

85
modern societies and is often used as a measure of SES. Finally, according to Libertos et al.
(1985), education is often used as a measure of SES. This may be for a variety of reasons
including the possibility of the ease in which subjects feel when answering education questions
compared to income questions.
People in low- and middle-income areas, specifically those in Kentucky, may be more
exposed to risk factors such as lack of regular physical activity, exposure to first and secondhand
smoking, access to poor or inadequate dietary programs, and cardiovascular associated health
problems such as hypertension and diabetes (BRFSS, 2012), leading to CHD and other CVDs.
Simultaneously these individuals many times do not have the benefit of prevention programs
compared to people in higher-income areas. Individuals who live in low income areas of
Kentucky who suffer from CVDs have less access to effective and equitable health care services
which respond to their needs (including early detection services) (Rugg et al., 2008). This may
result in individuals from low- and middle-income areas dying younger than their peers within a
higher-income category from CVDs. Moreover, the poorest people in low- and middle-income
areas are affected most significantly (BRFSS, 2012). Additionally, on a larger level, CVDs place
a heavy burden on the economies of low- and middle-income counties (WHO, 2014). The
following studies will present the possible correlation between SES and CVD.
Review of the Literature
O’Connor and Wellenius (2012) conducted a cross-sectional study of more than 214,000
respondents using data reported to the CDC 2008 Behavioral Risk Factor Surveillance System.
The BRFSS survey defined a MSA-metropolitan statistical area as 50,000 or more inhabitants as
urban and anything less than that was rural. Additionally, respondents were asked to respond to
an income question that categorized their incomes from $10,000-$15,000, $15,000-$20,000,
86
$20,000-$25,000, $25,000-$35,000, $35,000-$50,000, $50,000-$75,000, and greater than
$75,000. They were asked to answer gender and weight, height, ethnicity, age, and if their
physician had told them they had angina or CHD. If they didn’t know they were omitted from
the study.
The authors found that areas defined by the BRFSS survey as being a “rural” had
inhabitants that were more likely to be diagnosed with CHD. Additionally, after controlling for
risk factors of income, age, gender, ethnicity, BMI, and tobacco use, it was found that persons in
a rural environment are still more likely to be diagnosed with CHD than persons in urban
locations.
O’Connor and Wellenius (2012) suggested this may be due to actual treatment cost or
increased rate of complication and mortality among persons of lower SES. The higher
prevalence of CHD in rural locations also exacerbates other health care disparities that impact
the diagnosis and treatment of CHD itself such as, increased difficulty obtaining health
insurance, longer distances to reach health care facilities, shortage of primary care provider
(PCP) in rural areas (O’Connor & Wellenius, 2012; Coburn et al, 2009). Like a vicious circle,
there is a shortage of PCPs in rural areas; residents of rural states in the US have access to about
half as many PCPs compared with residents of urban locations, which in turn leads to reduced
access to care.
In another cross-sectional study also conducted in 2012, Pollack, Slaughter, Griffin,
Dubowitz, and Bird examined the association between CHD risk scores and neighborhood SES
(NSES). The authors defined NSES using six Census variables which were then summarized
and organized into indices such as median household income, percent of households below the
poverty threshold, percent of adults older than 25 with a high school diploma., etc. The 10 year

87
risk of CHD was then calculated using the 2001 Framingham Risk Score (FRS). The FRS is a
scale used to estimate an individual’s 10 year risk of CHD. Fiscella, Tancredi, and Franks
(2009) found that when adding SES to the calculation, the accuracy of the FRS predicting CHD
outcomes among low income populations improves. Pollack et al. (2012) found that an
individual living in a neighborhood at the 75th
percentile of NSES (high NSES) has on average a
10 year CHD risk that is .16 percentage points lower than a similar person from a neighborhood
from the 25th
percentile. That is, NSES is significantly associated with CHD risk. Interestingly,
NSES has also been found to be linked with smoking, physical inactivity, dietary patterns, and
obesity both in local and national samples (Pickett & Pearl, 2001).
All of these studies suggest that individuals living in disadvantaged (or low-income)
neighborhoods (e.g., neighborhoods near the 25th
percentile of NSES) are significantly more
likely to suffer CHD than those living in advantaged (or higher-income) neighborhoods (e.g.,
neighborhoods near the 75th
NSES) (Diez-Roux, et al 1995 & Diez-Roux et al, 2001).
How to Eliminate the Disparities
Eliminating the disparities between CVD and SES is critical to reaching the Healthy
People 2020 goals previously discussed. There are a variety of different methods in which to
disseminate knowledge, services, and access to impoverished individuals with lack of health
insurance. For example, placing a greater emphasis on recruiting primary care providers to rural
areas and loan forgiveness for practicing in rural areas may be quick fix solutions but also may
help to fill a necessary gap. Other than the aforementioned “quick fixes” how can there be cost
effective and worthwhile ways to reduce the higher prevalence of CHD in rural settings? The
following will focus on four areas that may help to decrease the disparities between SES and
CVD including: (1) medical care, (2) public education, (3) public policy, and (4) research.
88
Focus on Medical Care
There are a great deal of variations dependent upon SES in regard to access to care and
quality of care for CVD, this needs further documentation and measurement so that
improvements can be made to SES groups that are not receiving adequate care. Preventative
services need to be aggressively aimed at lower SES groups and within areas in an effort to
reduce disparities in CVD risk factors between different SES groups. There may begin to be a
slight shift in access to health care with the initiation of the Affordable Care Act (ACA) which
will bring health insurance to more than 30 million people. The ACA will attempt to reduce
disparities with investments in prevention and wellness (DHHS, 2014). Moreover, there are two
important initiatives that belong to the ACA: (1) the National Strategy for Quality Improvement
in Health Care, which includes priorities that will attempt to improve the delivery of health care,
and (2) the National Prevention and Health Promotion Strategy, which will attempt to bring
prevention as well as wellness to the frontlines of national policies (DHHS, 2014). Education
should be developed to help PCPs and other health care practitioners understand the extent of the
problem of the correlation between SES and subsequent CVD risk and the factors that lie
beneath it.
Focus on Public Education
Successful interventions to reduce the increase CVD risk factors associated with lower
SES need to be broad based. They need to be specific to CVD risk factors as well as the
conditions of a society that lead to the adoption and maintenance of high-risk behaviors (i.e.,
smoking, drug use, obesity, etc.). For example, The DHHS (2014) has initiated a plan entitled
the Strategic Action Plan to End the Tobacco Epidemic. This is a plan that was released in 2010
and is built around 4 pillars: (1) engaging the public, (2) supporting evidence based control

89
policies at both at the state and local levels, (3) expecting the HHS to lead by example, and (4)
advancing research especially in the setting of the government’s regulation of tobacco (DHHS,
2014). There needs to be assurance that the targeted audience is involved in developing and
implementing the education program. Additionally, there should be exploration of new and
appropriate techniques and methods to deliver more effective messages to specific and high risk
populations and to target these high risk populations earlier in a given disease process.
Focus on Public Policy
Interestingly, promotion of products associated with increased risk of CVD (e.g., tobacco
and high fat foods) seems to be targeted toward lower SES. There should be some consideration
when creating policies that emphasize the focus of high risk behavior that targets lower SES
groups. According to Rugg, Bailey, and Browning (2008), there are three general areas that
warrant continued emphasis. One is in the area of research. Public policy programs are
necessary in order to ensure that federally funded research programs include investigations
between SES and CVD. Second, is the area of healthcare. The AHA and local governmental
participation in the development of guidelines for appropriate patient care. Last, should be
consideration in the area of disease prevention and health promotion. Continued emphasis on
federal, state, and local policy initiatives that encourage the development, expansion, and
implementation of public policy will aid in the prevention of CVD. For example, Senate Bill
172 was passed by the Kentucky General Assembly in 2005 which established requirements for
nutrition regulation in regard to the type of food sold in public schools (Rugg et al., 2008).
Additionally, programs should be created to help educate all individuals about the prevention and
control of CVD. This is crucial when examining the formation of policy initiatives related to the
control of tobacco and other health initiatives.

90
Focus on Research
When exploring the relationship between CVD and SES there needs to be a focus on
trying to understand the behavioral, social, biological, and physiological variables that link CVD
to SES. There is a great deal of need to understand the links between economic policy, health
care coverage, education level, unemployment and their relation to the prevention, incidence, and
treatment of CVD. For example, research needs to be designed to improve risk-factor detection
and management in primary care settings that is based on a better and more holistic
understanding of the behavior of the patient. Research needs to be conducted in order to acquire
knowledge in regard to the intensity of intervention required in order to activate specific
behavior modifications. Additionally, there needs to be better measures of outcomes to monitor
these behavior modifications and the means to maintain these behavior changes (Cooper et al.,
2000).
In addition to the research gaps mentioned above, research also needs to be conducted in
healthcare organizations in order to gain a better understanding the role of incentives may play in
preventative and primary care delivery. There should be continued research in the managed care
approach and the potential of multidisciplinary teams (Cooper et al., 2000) as well as the
possible advantages and disadvantages of care delivered in this fashion. Finally, there is a need
to seek a better more comprehensive understanding of the physician and patient factors that may
affect the adherence to prescribed prevention guidelines that are based within the evidence and
are cost-effective, but specific to the setting of SES (Cooper et al., 2000).
Conclusion
There is a clear message throughout the literature that emphasizes the importance of
exploring at greater depth the relationship between SES and CVD (O’Connor & Wellenius,
91
2012; Coburn et al, 2009; Pollack et al, 2012; Fiscella et al, 2009; Pickett & Pearl, 2001).
Evidence suggests that there have been recent decreases in CVD mortality, however, these
diseases are still the leading cause of death in the United States and Healthy People 2020 reports
that 129.2 out of 100,000 deaths are due to cardiovascular disease and stroke (Healthy People,
2015). While it may seem like most of the significant risk factors for CVD have been identified,
there are still questions as to other modifiable risk factors that have the ability to influence CVD.
The main measures of SES have been education, occupation, and income. However, there are
other indices of SES that include employment status, indexes of social class, measures of living
conditions, area-based measures, etc. Incorporating these additional measures into a
multidimensional model to assess SES as a whole in the setting of CVD may be a useful piece of
the puzzle when aiming to reach the goals set by Healthy People 2020 and in improving the
overall health of the United States.

92
References
Abramson, R. (2006). Introduction to Encyclopedia of Appalachia. Knoxville, Tenn.: University
of Tennessee Press. pp. xix—xxv.
AHA American Heart Association. (2015). Cardiovascular disease statistics. Retrieved 2014,
Dec 28, from http://www.americanheart.org/presenter.jhtml?identifier=4478.
CDC Center for Disease Control. (2011). Capacity Building States. National Heart Disease and
Stroke Prevention Program in Kentucky. Retrieved from
http://www.cdc.gov/dhdsp/programs/nhdsp_program/ky.htm.
CDC Centers for Disease Control and Prevention. (2006). Division of Heart Disease and Stroke
Prevention Retrieved (2015, Jan 4) from http://www.cdc.gov/dhdsp/.
CDC Centers for Disease Control and Prevention. (2009). Chronic disease prevention and health
promotion: heart disease and stroke prevention: addressing the nation’s leading killers: at
a glance 2009. Retrieved (2015, Jan 4) from
http://www.cdc.gov/nccdphp/publications/AAG/dhdsp.htm
Coburn, A.F., MacKinney, A.C., McBride, T.D., Mueller, K.J., Slifkin, R.T., & Ziller, E. (2009).
Assuring health coverage for rural people through health reform. Robert Wood Johnson
Foundation, Princeton, NJ. Available at: www.rwjf.org/files/research/50808.pdf.
Cooper, R., Cutler, J., Desvigne-Nickens, P., Fortmann, Friedman, L., Hvlik, R.,…..Thom, T.
(2000). Trends and disparities in the coronary heart disease, stroke, and other
cardiovascular diseases in the United States: findings of the national conference on
cardiovascular disease prevention. Circulation, 102, 3137-3147.

93
Diez Roux, A.V., Merkin, S.S., Arnett, D., Chambless, L., Massing, M., Nieto, F.J., et al. (2001).
Neighborhood of residence and incidence of coronary heart disease. N Engl J Med
345:99e106.
Diez-Roux, A.V., Nieto, F.J., Tyroler, H.A., Crum, L.D., & Szklo, M. (1995). Social inequalities
and atherosclerosis. The atherosclerosis risk in communities study. Am J Epidemiol
141:960e72.
Department of Health and Human Services. (2014). HHS action plan to reduce racial and ethnic
health disparities. A nation free of disparities in health and health care.
Fiscella, K., Tancredi, D., & Franks P. (2009). Adding socioeconomic status to Framingham
scoring to reduce disparities in coronary risk assessment. American Heart Journal;
157(6):988-94.
Halverson, J., Ma, L., & Harner, E. (2004). An analysis of disparities in health status and access
to care in the Appalachian Region. Appalachian Regional Commission. Washington, DC.
Healthy People 2020 (2015). Healthy people 2020: heart disease and stroke. Retrieved January
22, 2015 from http://www.healthypeople.gov/2020/topics-objectives/topic/heart-disease-
and-stroke/objectives.
KDPH 2009a. Kentucky Department of Public Health, County health profiles. Retrieved (2014,
Oct 3) from http://chfs.Kentucky.gov/dph/epi/cohealthprofiles.htm.
KDPH 2009b. Kentucky Department of Public Health, Office of Vital Statistics.
Lang, T., Lepage, B., Schieber, A.C., Lamy, S., & Kelly-Irving, M. (2012). Social determinants
of cardiovascular diseases. Public Health Reviews. 33: 601-22.
94
Lantz, P.M., House, J.S., Lepkowski, J.M., Williams, D.R., Mero, R.P., & Chen, J. (1998).
Socioeconomic factors, health behaviors, and mortality: results from a nationally
representative prospective study of US adults. JAMA Vol 279 No 21: 1703-1708.
Libertos, P., Link, B.G., & Kelsey, J.L. (1988). The measurement of social class in
epidemiology. Epidemiology Review, 10, 87-121.
Lloyd-Jones D, Adams RJ, Brown TM, et al. (2010). Heart disease and stroke statistics—2010
update: A report from the American Heart Association statistics committee and stroke
statistics subcommittee. Circulation. 121:e1-e170.
Morgenstern, H. (1985). Socioeconomic factors: concepts, measurement, and health effects. In
Ostfeld, A.M., Eaker, E.D., ED eds Workshop on Measuring Psychosocial Variables in
Epidemiologic Studies of Cardiovascular Disease. Bethesda, MD: National Institute of
Health: 3-36.
Murphy S.L., Xu J.Q., Kochanek K.D. (2013). Deaths: Final data for 2010. Natl Vital Stat Rep.,
61(4).
O’Connor & Wellenius (2012). Rural-urban disparities in the prevalence of diabetes and
coronary heart disease. Public Health. 126(10):813-20.
Pickett, K.E., & Pearl, M. (2001). Multilevel analyses of neighborhood socioeconomic context
and health outcomes: a critical review. J Epidemiol Community Health. 55(2):111e22
Pollack, C.E., Slaughter, M.E., Griffin, B.A., Dubowitz, T., & Bird, C.E. (2012). Neighborhood
socioeconomic status and coronary heart disease prediction in a nationally representative
sample. Public Health. 126; 827-835

95
Rosamond W, Flegal K, Friday G, et al.(2007). Heart disease and stroke statistics—2007 update:
a report from the American Heart Association statistics committee and stroke statistics
subcommittee. Circulation. 115(5):e69-171.
Rugg, S.S., Bailey, A.L., & Browning, S.R. (2008). Preventing cardiovascular disease in
Kentucky: epidemiology, trends, and strategies for the future. Kentucky Medical
Association Journal CME. 153-167 April 2008. Vol 106.
US Centers for Disease Control and Prevention. Heart disease facts. US Centers for Disease
Control and Prevention, Atlanta. Available at: www.cdc.gov/heartdisease/facts.htm;
2011.
WHO World Health Organization. 2014. Cardiovascular diseases. Retrieved (2014, Sept 30)
from http://www.who.int/mediacentre/factsheets/fs317/en/index.html.
World Health Organization (2011a). Global status report on noncommunicable diseases 2010.
Geneva. 2011a.
World Health Organization (2011b). Global atlas on cardiovascular disease prevention and
control. Geneva.
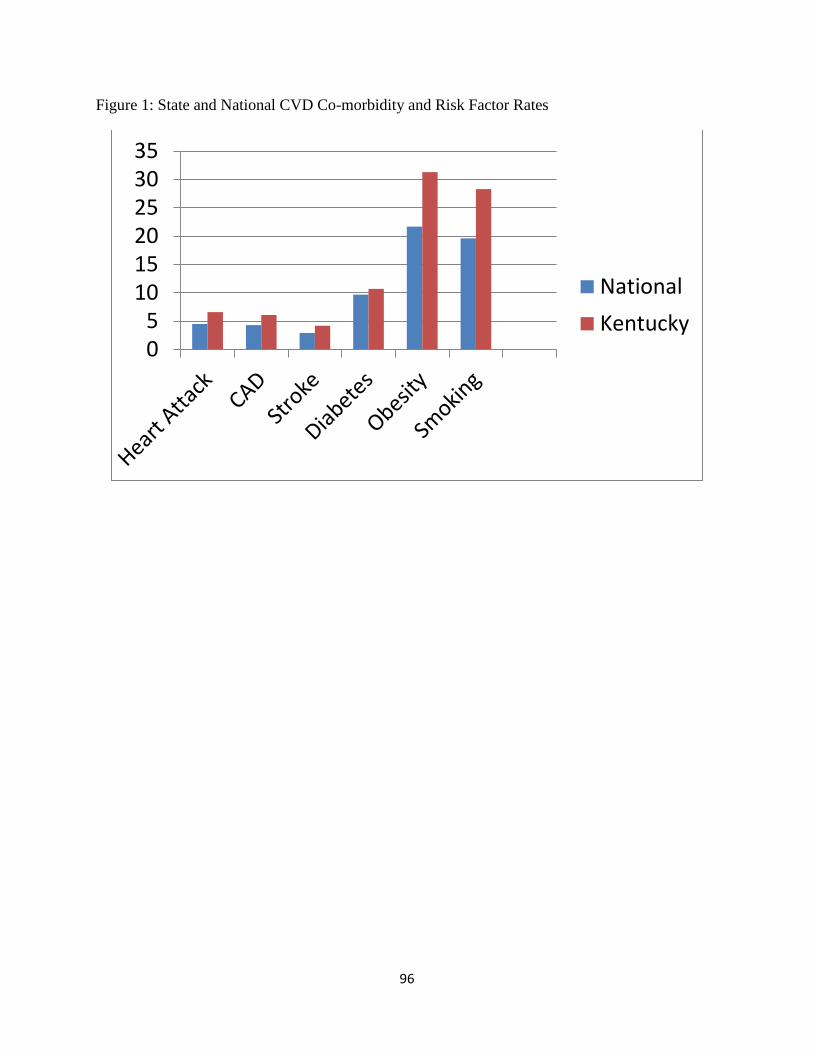
96
Figure 1: State and National CVD Co-morbidity and Risk Factor Rates
05
101520253035
National
Kentucky

97
Conclusion to DNP Practice Inquiry Project
Julianne Evers, BSN, MS, RN, CCRN
University of Kentucky

98
Acute myocardial infarction (STEMI) is still the leading cause of death in the United
States and worldwide (CDC, 2014). Improving outcomes for patients who present with a STEMI
in the United States is an important public health goal. Manuscript one presented studies that are
a part of a small but growing body of literature, they all demonstrate the potential of a
streamlined and coordinated process in treating STEMI patients. The optimization of care of
STEMI patients through the establishment of systems of care could be of great value. If these
systems can be implemented correctly (e.g., accounting for differences in regional needs), such
coordinated care systems have the potential to significantly improve outcomes for these patients.
All of the studies presented in this integrative review of the literature demonstrate the
effectiveness of a quality improvement strategies that are directed towards the processes of care
of STEMI patients from a variety of different regions (i.e., rural, urban, etc.).
Manuscript three highlighted a clear message throughout the literature of the importance
of exploring at greater depth the relationship between SES and CVD (O’Connor & Wellenius,
2012; Coburn et al, 2009; Pollack et al, 2012; Fiscella et al, 2009; Pickett & Pearl, 2001).
Evidence suggests that there have been recent decreases in CVD mortality, however, these
diseases are still the leading cause of death in the United States, specifically, Healthy People
2020 reports that 129.2 out of 100,000 deaths are due to cardiovascular disease and stroke
(Healthy People 2020, 2015). Additionally, according to the BRFSS (2012), approximately 6.6
percent of adults in Kentucky have been told by a health care professional that they have had a
heart attack, compared to the national percentage of 4.5 percent. Furthermore, Kentucky has
19.1 percent of its population living in poverty, compared to 15.9 percent overall in the U.S.
(KDPH, 2013).

99
Manuscript two was an evaluation of the implementation of a STEMI Network and its
impact on walk-in D2B times, EMS D2B times, the D2B time of patients transported from
satellite hospitals, during working hours and non-working hours. The findings of this practice
inquiry project support the implementation of a STEMI Network for the treatment of acute
STEMI patients in a large metropolitan area in Kentucky by way of regional network.
Specifically, the findings of this practice inquiry project suggest that the STEMI Network has led
to a significant overall reduction in D2B times. It is clear that even relatively small
improvements in D2B have become of crucial importance with current evidence demonstrating a
direct relationship between D2B and mortality (Nallamothu et al., 2007; McNamara et al., 2006).
Ultimately, a well-designed and coordinated system of care, created using the existing evidence,
will improve care for patients with a STEMI.

100
Appendix A
Waiver of Authorization
COMPLETE WAIVER OF AUTHORIZATION
IRB#: Study Title
14.0687 An Evaluation of the Implementation and Efficacy of a STEMI Network in the Southeastern
United States
PRINCIPAL INVESTIGATOR/PROJECT DIRECTOR (PI/PD)
Name (Last Name, First Name, MI)
Evers, Julianne M. Email Address
Mailing Address – Include University Department (if
applicable)
Telephone Number
Pager/Cell Phone Number
Fax Number
NA
Please indicate the Covered Entities from which you will seek PHI in this research. Please check () all that apply.
Affiliated Sites Non-Affiliated Sites
University of Louisville Research Foundation (ULRF) Clinical Sites. Please check () all that apply.
[] University of Louisville (Do not remove this
check.)
[ ] Louisville Metro Department of Public Health
& Wellness
[] Jewish Hospital & St. Mary’s Healthcare [ ] KY Cabinet for Health & Family Services
[ ] Norton Healthcare, Inc., including Kosair
Children’s Hospital
[ ] Seven Counties Services
[ ] University of Louisville Hospital/J. Graham
Brown Cancer Center
[ ] Other(s):
[ ] Children & Youth Clinic [ ] UL Pathology Flow Cytometry Lab (BCC)
[ ] Dentistry Clinics (Undergraduate DMD;
Graduate, Perio, Endo and Ortho; Oral
Surgery and GPR at ACB; Faculty Practice,
Graduate Pedodontic Clinic)
[ ] UL Pathology Special Procedures Lab
[ ] Family Medicine – (Newburg and Central
Station; also Geriatrics and Sports Medicine
at
Central Station)
[ ] University Health Services (HSC and Belknap)
[ ] Harambee Nursing Center [ ] Weisskopf Child Evaluation Center
[ ] Kidney Disease Program (Dialysis Unit and
UL
Renal Transport Lab)
[ ] WHAS Crusade For Children Audiology & Speech
Pathology Center
[ ] Neonatal Follow Up Program [ ] WINGS Clinic – (ACB)

101
This form is to be used when it is not feasible to obtain an authorization prior to viewing PHI (PHI means
health information plus one or more of the 18 identifiers under the HIPAA regulations).
1. Please explain why your research project cannot be done using de-identified information. If
you need to look at identified information, but only will be collecting de-identified
information, this is still using identified information for your research project. (NOTE:
Responses “b” and “c” cannot both be checked.)
[ ] a. This project requires health information from multiple holders that needs to be linked
using identifiers.
[ ] b. This project requires the retention of identified health information to answer the
research question.
[ ] c. While this project does not require the retention of identifiable information, identifiable
information must be accessed to extract the de-identified information.
[ ] d. Other - please explain:
2. a. For your research activities, please specify the health information that will be viewed,
collected, or disclosed by you and the research team to conduct this research. (Some examples
of health information may include: consultation reports, operative records, medical progress
notes, or diagnostic test results.)
Viewed: Patient’s Medical Record, including: Face Sheet, Attestation sheet, ICIP Charting,
Nurses Notes; Labs/diagnostics, Invasive Cardiology, Echocardiography reports, Other
cardiology reports, Radiology Reports, History and Physicals, Care Managers Discharge
Disposition Record, Nurse’s Discharge Instructions/Summary, MD’s Progress Notes, MD’s
Discharge Summary, Medical Records Look-up.
Collected: Demographic and data collection variables for this study will be collected from the
various databases of the EMR (i.e., Sovera, ICIP, Clinician Valet, Cerner): age, gender, race,
height, weight, zip code of patient presenting via EMS, name of Satellite facility of origin or
referring hospital of origin (within a 35 mile radius of Jewish Hospital). Independent variables
of interest will be collected from the various databases of the EMR (i.e., Sovera, ICIP,
Clinician Valet): principal diagnoses and comorbidities (i.e., history of hypertension,
dyslipidemia, diabetes mellitus (diet controlled, insulin requiring, non-insulin requiring, or no
treatment), prior myocardial infarction, prior percutaneous coronary intervention, prior
coronary artery bypass graft surgery, cocaine use, smoking status); cardiogenic shock on
arrival; hemoglobin A1C, HDL, LDL, statin therapy, non-statin lipid lowering therapy; name
of Satellite facility of origin or referring hospital of origin (within a 35 mile radius of Jewish
Hospital); First medical contact (FMC) time, door time, EKG time, fibrinolytics time, cardiac
cath lab activation time, cardiac cath lab door time, and device time, and time of day
categorized into working hours of a business day (Monday-Friday, 0700-1900) and non-
working hours of the day (weekends, holidays, and 1900-0700 7 days a week).
Disclosed (shared with anyone other than key personnel listed in the research application):
Nothing will be disclosed in an individualized form; summarized data only, conclusions and
descriptive statistics
b. Please describe why the information you wish to view, collect, and/or disclose is the minimum
necessary for the research project based on the protocol (reference protocol section(s) or
page(s)). Do not state “See protocol.”
In order to thoroughly answer the Research questions related to predictors and factors related
to the evaluation of the implementation of a STEMI Network protocol, large amounts of data
need to be viewed and collected. However, data has been minimized.
3. a. The health information identified in 2, combined with one or more of the identifiers listed
below becomes PHI. Please indicate which of the following identifiers, if any, of the subject,
relative of subject, household member of the subject, or employer of the subject, will be
viewed, collected, and/or disclosed by you or any other investigator for this research project.

102
Please check () all that apply.
[] 1. Name (including initials)
[] 2. All geographic subdivisions smaller than a State, including street address, city,
county, precinct, zip code, and their equivalent geocodes, except for the initial
three digits of a zip code.
[] 3. All elements of dates except year, for dates directly related to an individual, e.g.,
date of birth, admission date, discharge date, date of death. For individuals who
are 90 years or older, all elements of date, including year, is considered a “direct
identifier.” Note: if such ages and elements are aggregated into a single category
of “age 90 or older” then it is not considered to be a direct identifier.
[] 4. Telephone numbers
[] 5. Facsimile numbers
[] 6. Electronic mail addresses
[] 7. Social Security numbers (full or partial, including the final four digits)
[] 8. Medical Records numbers, prescription numbers
[] 9. Health Plan numbers
[] 10
.
Account Numbers
[ ] 11
.
Certificate/license numbers
[ ] 12
.
Vehicle identification/serial numbers/license plate numbers
[ ] 13
.
Device identifiers/serial numbers
[ ] 14
.
Universal Resource Locators (URLs) for Web sites
[ ] 15
.
Internet Protocol (IP) Address
[ ] 16
.
Biometric Identifiers, e.g. fingerprints, voice prints
[ ] 17
.
Full face or comparable photographic images
[ ] 18
.
Any other unique number, characteristic, or code that could be used to identify the
individual. (If you abstract any unique identifiers, please specify.)
b. Additionally, if you are collecting demographic information (e.g. age, gender, ethnicity,
education, income, etc.), please specify the information that will be viewed, collected and/or
disclosed for this research study.
age, gender, race, home zip code
c. Please attach a copy of the data collection form when submitting the Complete Waiver. If the
data collection form is unavailable, please explain: data collection form is attached.
If the data collection form is unavailable for submission, please note that a data collection
form determined to be inconsistent with this waiver may impact the ongoing status of
your study.
4. Please indicate your sources of the PHI that will be viewed, collected, and/or disclosed for this
research study. Please check () all that apply.
[ ] 1. Physician/clinic records
[] 2. Hospital/medical records
[ ] 3. Databases collected for informational/reporting purposes
[ ] 4. Data previously collected for research purposes
[] 5. Diagnostic test results

103
[ ] 6. Interviews/questionnaires
[ ] 7. Other – Please describe:
5. List the names of all individuals on the research team who will be looking at and/or sharing
PHI (medical record or other identifiable health information about the subject).
Julianne Evers, BSN, RN, CCRN; Melanie Hardin-Pierce, DNP, APRN; Celeste Romp, MSN,
APRN, CCNS, RN-BC
6. In order for the Privacy Board to determine that the use and disclosure of PHI involves
minimal risk to a subject’s privacy, please respond to a, b, and c below.
a. By law/regulation/policy/study site you may be required to disclose PHI to one or more of the
following oversight agencies/offices: OHRP, OCR, CMS, FDA, NHORA, ULH RIO, JHSMH
CAM, UofL IRBs/Privacy Boards, HSPPO, UofL Privacy Office.
Are you planning to disclose PHI from one covered entity to an outside entity or other
individuals outside the Research Team? Yes [ ] No [] If No, go to 6.b.
If so, to whom will you disclose (share) the PHI?
[ ] 1. Sponsor and/or agents of the sponsor
[ ] 2. Research oversight offices and collaborators at other institutions
[ ] 3. Other, please identify:
b. Are you planning to retain identifiers in paper and/or electronic format to conduct this study?
(Note: If you are retaining identifiers such as a list of dates of service, medical record numbers,
list of names, etc., then you must protect the identifiers you will use to identify potential
subjects.)
Yes [] No []
If no, proceed to the “Attestation of Investigator.”
If yes, please select the longest policy or regulatory retention requirement that is applicable to
your research project from the list below. If there is a reason to retain identifiers longer than
any period listed below, please describe in the “Other” section below.
[ ] University Record Retention Policy (retain research information 5 years post submission
for publication or publication, whichever is longer)
[ ] Common Rule (retain research information 3 years following closure of the study)
[ ] FDA (retain 2 years following FDA submission, approval or FDA notification of
discontinuation of investigation, whichever is longer)
[ ] Contractual requirements
[ ] Other (please explain)
c. Describe your plan to protect identifiers in paper format from improper use and/or disclosure
by completing the applicable questions below.
c.
1.
Are you storing PHI in paper form? Yes [ ] No [ ] If No, please proceed to
“ATTESTATION OF INVESTIGATOR.”
Please describe the permanent location of the paper form.
Data will be securely stored in a locked file while in paper form prior to being inputted into a
spreadsheet. When completed, paper forms will be shredded. As soon as all data have been
collected and there is no further need to return to a subject’s medical record, the Excel key

104
linking name and MR # to assigned sequential ID numbers will be destroyed. The data will be
transferred to an SPSS spreadsheet once received. Data will be secured electronically on the
PI’s password protected computer in a locked office at Jewish Hospital.
Please describe the security measures that you will put in place for stored data.
Will the data be kept in a locked file cabinet? Yes [] No
[ ]
Will the cabinet be kept in a locked office or store room? Yes [] No [ ]
Will the area be a locked/limited access area? Yes [] No
[ ]
Describe any additional security measures, including the security measures for paper data in
transit.
Data will be stored on an encrypted file on password protected computers. Data will not be
stored on an unauthorized “cloud” type server per HIPPA regulations. If data is transported via
email or a thumb drive, it will be encrypted for transport.
ATTESTATIONS OF INVESTIGATOR
By submitting this document for Privacy Board approval and electronically signing your submission in BRAAN2,
you attest, that PHI will not be reused/disclosed to any other person or entity, except:
1) as required by law,
2) for authorized oversight of the research project, or
3)for other research for which use/disclosure of PHI would be permitted by the HIPAA privacy regulations.
The researcher, listed below, and his/her entire research team agree:
1) that this Complete Waiver will be used to access only the specific PHI identified in this document.
2) that only the undersigned will be permitted to use this Complete Waiver to obtain PHI from the entities
identified in this document.
3) to share the PHI obtained under this document only with those persons or entities identified by this
document.
4) to provide sufficient documentation to any covered entity where PHI is obtained so that an accounting of
disclosures can be generated.
5) to maintain, store, and/or transmit any PHI, obtained during this study, on any electronic media
(server, desktop computer, laptop, PDA/Smart phone, USB drive, DVD/CD or any other electronic
storage media) in a manner consistent with the University of Louisville Information Security Policies
and Standards.
PRINCIPAL INVESTIGATOR:
Julianne Evers, BSN, RN, CCRN
RESEARCH TEAM:
Melanie Hardin-Pierce DNP, APRN
Celeste R. Romp, MSN, APRN, CCNS, RN-BC.

105
Appendix B
Jewish Hospital Nursing Research Council Approval IT
EM
ISSUE/DISCUSSION
TARGET
DATE/REPSONSIBLE
PERSON(S)
People
Present: Shih-Chia Chung- SMEH 1st Floor Surgery,
Celeste Romp- KentuckyOne West System Education,
Debbie Brown- JH PATT, Kim Quinlan- MCE
Perianesthesia, Stephanie Eitel- MCE Perianesthesia, Brian
Engelbach- JH 6/7 Towers, and Anette Bickett- MCS- ED.
Guest presenters- Juli Evers, Jewish Hospital STEMI
Coordinator and staff nurse, Cath Lab
Welcomed our members both in the room and on the
call/Webinar.
All
Celeste Romp/Siga Chung
Stewardship
Congratulation was given to our poster presenters that
were selected to present their posters orally during the
sessions at Research Louisville 2014! KentuckyOne
podium presenters from our Legacy JHSMH system
include: Shih-Chia (Siga) Chung, MSN, RN, CNOR and
Paula O’Hara, ADN, RN, ONC from 1st
floor Surgery at
SMEH with their poster on “Efficient Instrument Use:
Enhancing Surgical Care Quality Improvement Project”
and Kathleen Hall, BSN, RN, PCCN from 3 East at Jewish
Hospital with her poster on “Bedside Shift Report: A Pilot
Evidence Based Practice Project”. Congratulations! There
were only 6 posters selected to be presented at the event
from all of the local facilities, and we had 2 of them!
Celeste/All
Quality Celeste presented a continuing education program to the
council titled “Developing and Presenting your
Professional Poster”. It covered not only the key parts
and special considerations of professional posters, but
also how to use Microsoft Powerpoint to develop and edit
one, with or without a template. It also covered
important behaviors and “How to’s” for presenting a
poster during a conference. Although a review for some,
Celeste/All
106
members found the information very helpful and were
glad to have it in handout format for future reference.
Siga and Celeste updated the council on the results of the
Change of Shift study and reviewed the rough draft of the
poster with the group. Although there were actually 233
nurses that accessed the survey, only 194 completed it.
16% only answered the first or second screen with the
demographics and did not click “next” to go to the page of
the survey with the actual survey/study questions. In
hindsight, the team decided nursing surveys should not
have separate “pages” for different sections. Results of
the survey were included in the handout and were
reviewed and discussed. Then the poster draft was
reviewed. Feedback and input on wording was received.
A graph will be added.
Celeste updated the council on the results of the Alarm
Fatigue quality improvement project and reviewed the
rough draft of the poster with the group. Due to the need
to begin collecting the alarm data quickly, the education
and implementation stages had been quite short, but the
data was able to be collected in time for this year’s
Research Louisville. With additional time and education,
there may have been more nurse customization of
alarms. Regardless, though, the team was able to
decrease the total number of alarms by 39%! Results of
both the alarm data and poster draft were reviewed and
discussed with the members. A graph will also be added
to this poster with the alarm data before and after
results.
Siga Chung/Celeste/All
Celeste/All
Growth
Juli Evers, STEMI coordinator and staff nurse in the Jewish
Hospital Cath lab, as well as a DNP student at UK,
presented her new study, An Evaluation of the
Implementation and Efficacy of a STEMI Network in the
Southeastern United States, to the group for review and
approval. The study is a descriptive, retrospective chart
review designed to evaluate the impact of the
implementation of a STEMI Network at Jewish to see if it
decreased the door-to-balloon time in which STEMI
patients were treated with Coronary Intervention. The
members were interested in the study and are looking
forward to seeing the results. Members voted and
unanimously approved the study.
The virtual library dissemination was discussed with the
Celeste/ All

107
group. Official dissemination information had recently
been sent out by HR that included a general informational
flyer. Members felt the flyer could be posted in the units,
but additional information could be provided to nurses to
let them know how it could benefit them, specifically if
they are in school and need literature searches done or
articles retrieved. The members felt dissemination should
include multiple methods including e-mail, newsletter,
and other meetings (like Shared Governance) too reach as
many people as possible. Siga and Celeste will work to
draft an e-mail and newsletter dot points for
dissemination, and will included the “officially made” flyer
for posting.
The council also discussed the upcoming Research
Louisville symposium, Sept 19th
, 2014. Members were
encouraged to save the date and be available to assist
with registration, decorating, and poster set up.
Siga and Celeste
All
Innovation
The next meeting will be October 22nd
, 2014, 1-3PM on
the 15th
Floor Frazier Boardroom. September’s meeting
will be Research Louisville Sept 19th
, 2014.
Webinar information for the council meeting:
Siga/ All

108
Appendix C
University of Louisville IRB Approval

109

110
Appendix D
University of Kentucky IRB Authorization Agreement

111
Appendix E
Kentucky One Hospital, Jewish Hospital Final Facility Approval
Re: STEMI Network Study IRB Documents
Shelburne, Dorie
Sent: Thursday, October 09, 2014 12:11 PM
To: Evers, Julianne
Cc: Cravens, Lorie
Great job! Approved.
Dorie Shelburne RN, BSN, MSBC
Director of Nursing for Intensive Care, Emergency Department, and Logistics Center
Kentucky One Health
Jewish Hospital
On Oct 7, 2014, at 1:32 PM, "Evers, Julianne" <[email protected]>
wrote:
Hi Dorie,
This again is Julianne Evers (I emailed you earlier-so I am sorry for the multiple emails).
However, I am emailing you with the U of L IRB application and Data Collection Tool in
addition to the latest version of the STEMI-Written Protocol for the STEMI Network study I am
hoping to do for my DNP at UK. I don't know if you remember, but I spoke with you a year or
two ago in regard to my collecting data for this project.
I am working with Celeste Romp on this project. I look forward to any thoughts, questions,
and/or approval you may have.
I am cc-ing this to Lorie Cravens as well.
Thank you so much for your time and I look forward to hearing back.
Juli Evers
<IRB Submission- STEMI Network- J. Evers- 14.0687.pdf>
<STEMI- Written Protocol.pdf>
<STEMI- Data Collection Tool.pdf>
<STEMI- Waiver of Authorization.pdf>
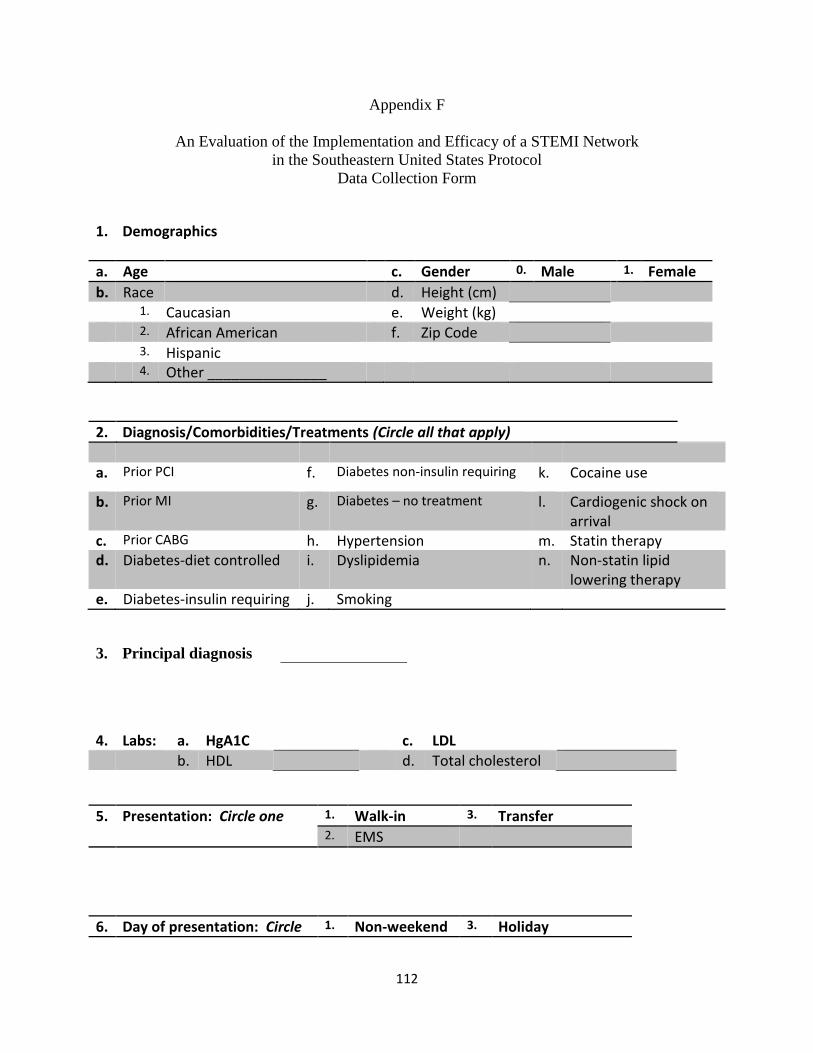
112
Appendix F
An Evaluation of the Implementation and Efficacy of a STEMI Network
in the Southeastern United States Protocol
Data Collection Form
1. Demographics
a. Age c. Gender 0. Male 1. Female
b. Race d. Height (cm)
1. Caucasian e. Weight (kg)
2. African American f. Zip Code
3. Hispanic 4. Other _______________
2. Diagnosis/Comorbidities/Treatments (Circle all that apply)
a. Prior PCI f. Diabetes non-insulin requiring k. Cocaine use
b. Prior MI g. Diabetes – no treatment l. Cardiogenic shock on arrival
c. Prior CABG h. Hypertension m. Statin therapy d. Diabetes-diet controlled i. Dyslipidemia n. Non-statin lipid
lowering therapy e. Diabetes-insulin requiring j. Smoking
3. Principal diagnosis
4. Labs: a. HgA1C c. LDL
b. HDL d. Total cholesterol
5. Presentation: Circle one 1. Walk-in 3. Transfer 2. EMS
6. Day of presentation: Circle 1. Non-weekend 3. Holiday

113
one 2. Weekend
7. Satellite Medical Center: 1. St. Mary’s Elizabeth 5. JH Northeast
2. JH East 6. JH Shelbyville 3. JH South 7. Flaget 4. JH Southwest 8. Other _____________
8. Enter all as MILITARY TIME: a. First medical contact time:
b. Jewish Hospital door time:
c. EKG time:
d. Fibrinolytic time:
e. Cardiac Cath activation time:
f. Cardiac Cath lab door time:
g. Device time:

114
References
ACC/AHA Guidelines 2002.
Antman, E.M., Hand, M., Armstrong, P.W., et al. (2008). 2007 focused update of the ACC/AHA
2004 guidelines for the management of patients with st-elevation myocardial infarction.
Journal of American College of Cardiology, 51, 210-247.
Antonuicci, D.,Valenti R., Migliorini A., Moschi G., Trapani M., Buonamici P,… Cerisano G,
(2002). Relation of time to treatment and mortality in patients with acute myocardial
infarction undergoing primary coronary angioplasty. American Journal of Cardiology.
89(11): 1248-52.
Behavioral Risk Factor Surveillance System. (2014). Retrieved November 18, 2014) from:
http://www.cdc.gov/brfss/.
Berger P.B., Ellis S.G., Holmes D.R. Jr, Granger C.B., Criger D.A., Betriu A.,…Topol E.J.,
(1999). Relationship between delay in performing direct coronary angioplasty and early
clinical outcome in patients with acute myocardial infarction: results from the global use
of strategies to open occluded arteries in acute coronary syndromes (GUSTO-IIb) trial.
Circulation. 100(1): 14-20.
Brodie B.R., Stone G.W., Morice M.C., Cox D.A., Garcia E., Mattos L.A. Stent primary
angioplasty in myocardial infarction study group. (2001). Importance of time to
reperfusion on outcomes with primary coronary angioplasty for acute myocardial
infarction (results from the stent primary angioplasty in myocardial infarction trial).
American Journal of Cardiology. 88:1085-1090.
Cannon C.P., Gibson C.M., Lambrew C.T., Shoultz D.A., Levy D., French W.J…Tiefenbrunn,
A.J. (2000). Relationship of symptom-onset-to-balloon time and door-to-balloon time
115
with mortality in patients undergoing angioplasty for acute myocardial infarction. JAMA.
283:2941-2941.
Centers for Disease Control and Prevention (CDC). (2014). Retrieved (November 10, 2014)
from http://www.cdc.gov /nchs/fastats/leading-causes-of-death.htm.
Cleveland Clinic (2015). Retrieved on January 21, 2015 from
http://www.clevelandclinicmeded.com/medicalpubs/diseasemanagement/cardiology/acut
e-myocardial-infarction/Default.htm
Coburn, A.F., MacKinney, A.C., McBride, T.D., Mueller, K.J., Slifkin, R.T., & Ziller, E. (2009).
Assuring health coverage for rural people through health reform. Robert Wood Johnson
Foundation, Princeton, NJ. Available at: www.rwjf.org/files/research/50808.pdf.
Fiscella, K., Tancredi, D., & Franks P. (2009). Adding socioeconomic status to Framingham
scoring to reduce disparities in coronary risk assessment. American Heart Journal;
157(6):988-94.
Healthy People 2020 (2015). Healthy people 2020: heart disease and stroke. Retrieved January
22, 2015 from http://www.healthypeople.gov/2020/topics-objectives/topic/heart-disease-
and-stroke/objectives.
Jacobs, A.K., Antman, E.M., Faxon, D.P., Gregory, T., & Solis, P. (2007). Development of
systems of care for st-elevation myocardial infarction patients. Executive summary.
Circulation, 116, 217-230.
Kentucky Department for Public Health (2013). Retrieved on February 26, 2015 from
http://chfs.ky.gov/nr/rdonlyres/cf31d71b-c7e3-4fa3-a8c7-
713bea63f833/0/2013kystatehealthassessmentfinal52913.pdf

116
McNamera R.L., Wang Y., Herrin J., Curtis J.P., Bradley E.H., Magid D.J…NRMI
Investigators. (2006). Effect of door-to-balloon time on mortality in patients with st-
segment elevation myocardial infarction. Journal of American College of Cardiology.
47:2180-2186.
Nallamothu, B.K., Bates, E.R., Wang, Y., Bradley E.H., Krumholz, H.M. (2006). Driving times
and distances to hospitals with percutaneous coronary intervention in the United States:
implications for prehospital triage of patients with st-elevation myocardial infarction.
Circulation. 113:1189-1195.
Nallamothu, B.K., Bradley, E.H., & Krumholz, H.M. (2007). Time to treatment in primary
percutaneous coronary intervention. New England Journal of Medicine; 357:1631-1638.
O’Connor & Wellenius (2012). Rural-urban disparities in the prevalence of diabetes and
coronary heart disease. Public Health. 126(10):813-20.
Peterson, Syndergaard, Bowler, & Doxey, (2011). A systematic review of factors predicting door
to balloon time in st-segment elevation myocardial infarction treated with percutaneous
intervention. International Journal of Cardiology 17; 157(1):8-23.
Pickett, K.E., & Pearl, M. (2001). Multilevel analyses of neighborhood socioeconomic context
and health outcomes: a critical review. J Epidemiol Community Health. 55(2):111e22
Pollack, C.E., Slaughter, M.E., Griffin, B.A., Dubowitz, T., & Bird, C.E. (2012). Neighborhood
socioeconomic status and coronary heart disease prediction in a nationally representative
sample. Public Health. 126; 827-835
Silber S., Albertsson P., Aviles F.F., Camici P.G., Columbo A., Hamm C., Jorgensen E.,…Wijns
W. (2005). Task force for percutaneous coronary interventions of the European society of
cardiology guidelines for percutaneous coronary interventions. The Task Force for

117
Percutaneous Coronary Interventions of the European Society of Cardiology. European
Heart Journal. 26:804-810.