Embed Size (px)
Citation preview
The efficiency challenge of LNG
production
Planning and scheduling in a global
industry coming of age
Enersight Corporation
August 2015
2 Enersight Corporation August 2015
Contents
3 Executive summary
5 Industry context
LNG reputation for high costs
Growing LNG demand and supply
Pricing uncertainty
Capex challenge of LNG ramp up
10 Integrated planning and scheduling
Industry analysis of operator opportunity for LNG efficiency
Analyst perspective on Integrated planning and scheduling
Integrate planning and scheduling technology requirements
14 Use Case – Integrated planning for coal seam gas to LNG in Australia
Australia opportunity and challenge
Enersight integrated planning technology applied
19 Summary
20 References
5
6
7
8
10
10
13
14
15
The efficiency challenge of LNG production 3
Executive summary
Liquid Natural Gas production volume is set to hit a new global height between 2015 and 2020.
In order to be competitive, companies need to shift from bringing massive facility construction projects in on budget, to large-scale production of natural gas in a volatile price environment. In this white paper we will explore what opportunities LNG operators have for capital efficiency in one of the world’s most cost-intensive industries as it comes of age.
Industry analysts, including Accenture and KPMG, have put forward integrated planning and scheduling technology as one of several high-impact methods for oil and gas companies to manage and reduce the risk of the complex and cost-intensive factors of LNG production.
KPMG, in its 2014 analysis Major LNG projects: Navigating the New Terrain1, found that successful LNG projects worldwide were defined by their ability to deliver on drivers under their control including capital efficiency, timely project delivery and disciplined and robust processes and systems. KPMG went on to report that among the key means operators have to achieve capital efficient and timely delivery of LNG to market is comprehensive planning and scheduling.
In this analysis we will assess:
• How does integrated planning and scheduling play a role in capital efficient LNG production?
• What critical impact can integrated planning and scheduling have on hitting production deadlines and targets?
• What have emerged as critical capabilities for integrated planning technology?
• What are the opportunities and challenges ahead?
Working with global LNG producers, including QGC and energy consultants at Accenture, Enersight has observed three capabilities of integrated planning and scheduling technology that global energy companies require to best compete:
• Comprehensive planning model that provides accurate forecasts and plan adaptability – ability to forecast accurately and rapidly make decisions based on what-if scenarios run on a comprehensive plan model.
• Integrated activity scheduling – development plan models must incorporate all of the complex factors of production and tie in the interdependencies of scheduling.
• Company-wide visibility of continuous evolving plans – immediate access to revised plans and schedules across corporate planning, asset planning and operations teams.
With such a significant role ahead for Australia in global LNG production, we will examine a use case where the core capabilities of the Enersight petroleum planning technology contributes to high performance by Coal Seam Gas (CSG) to LNG producers.
4 Enersight Corporation August 2015
The efficiency challenge of LNG production 5
Industry context
LNG reputation for high costs
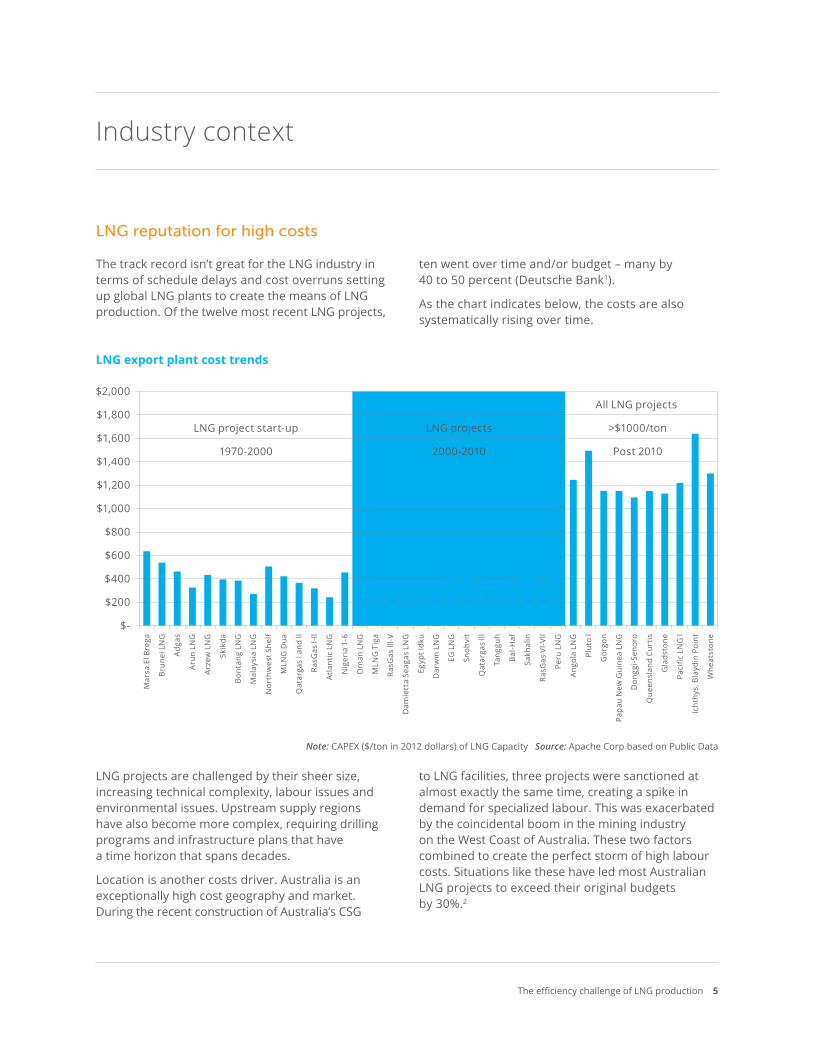
The track record isn’t great for the LNG industry in terms of schedule delays and cost overruns setting up global LNG plants to create the means of LNG production. Of the twelve most recent LNG projects,
ten went over time and/or budget – many by 40 to 50 percent (Deutsche Bank1).
As the chart indicates below, the costs are also systematically rising over time.
LNG export plant cost trends
$2,000
$1,800
$1,600
$1,400
$1,200
$1,000
$800
$600
$400
$200
$-
Mar
sa E
l Bre
ga
Bru
nei L
NG
Adg
as
Aru
n LN
G
Arz
ew L
NG
Skik
da
Bon
tang
LN
G
Mal
aysi
a LN
G
Nor
thw
est S
helf
MLN
G D
ua
Qat
arga
s l a
nd ll
RasG
as l-
ll
Atl
anti
c LN
G
Nig
eria
1-6
Om
an L
NG
MLN
G T
iga
RasG
as ll
l-V
Dam
iett
a Se
agas
LN
G
Egyp
t Idk
u
Dar
win
LN
G
EG L
NG
Snoh
vit
Qat
arga
s lll
Tang
guh
Bal
-Haf
Sakh
alin
RasG
as V
l-Vll
Peru
LN
G
Ang
ola
LNG
Plut
o l
Gor
gon
Papa
u N
ew G
uine
a LN
G
Don
ggi-S
enor
o
Que
ensl
and
Curt
is
Gla
dsto
ne
Paci
fic L
NG
l
Icht
hys,
Bla
ydin
Poi
nt
Whe
atst
one
All LNG projects
>$1000/ton
Post 2010
LNG projects
2000-2010
LNG project start-up
1970-2000
Note: CAPEX ($/ton in 2012 dollars) of LNG Capacity Source: Apache Corp based on Public Data
LNG projects are challenged by their sheer size, increasing technical complexity, labour issues and environmental issues. Upstream supply regions have also become more complex, requiring drilling programs and infrastructure plans that have a time horizon that spans decades.
Location is another costs driver. Australia is an exceptionally high cost geography and market. During the recent construction of Australia’s CSG
to LNG facilities, three projects were sanctioned at almost exactly the same time, creating a spike in demand for specialized labour. This was exacerbated by the coincidental boom in the mining industry on the West Coast of Australia. These two factors combined to create the perfect storm of high labour costs. Situations like these have led most Australian LNG projects to exceed their original budgets by 30%.2
6 Enersight Corporation August 2015
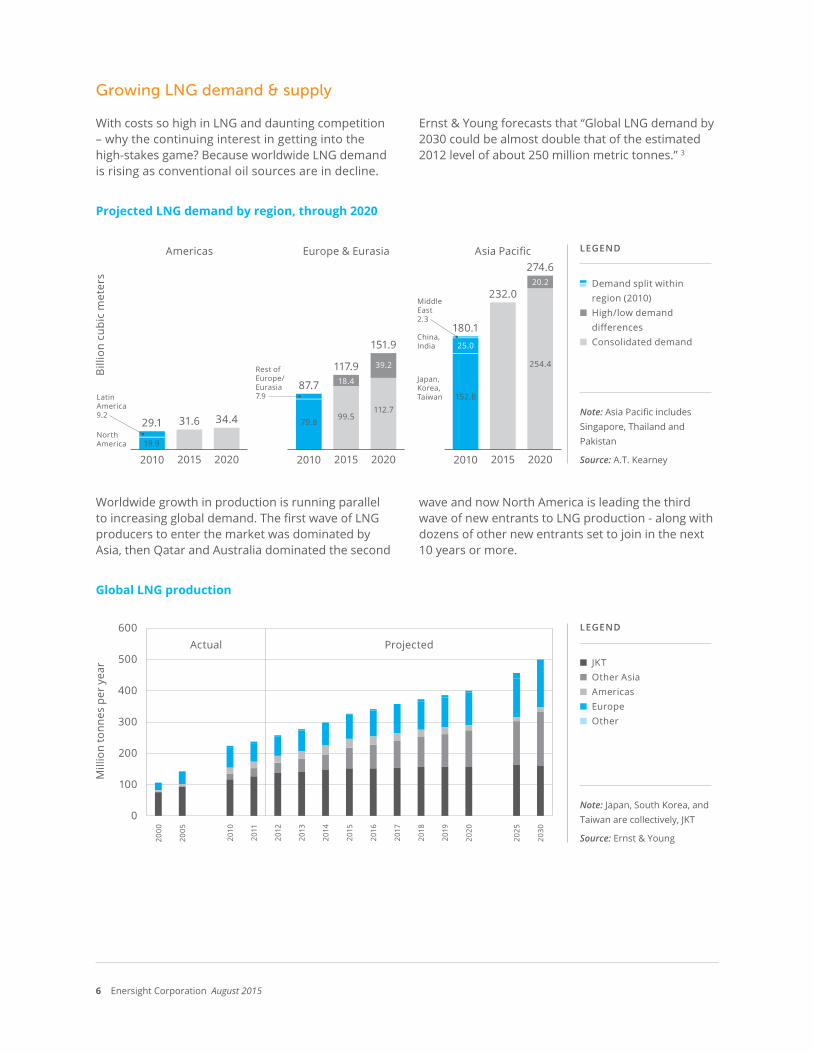
Growing LNG demand & supply
With costs so high in LNG and daunting competition – why the continuing interest in getting into the high-stakes game? Because worldwide LNG demand is rising as conventional oil sources are in decline.
Ernst & Young forecasts that “Global LNG demand by 2030 could be almost double that of the estimated 2012 level of about 250 million metric tonnes.” 3
Projected LNG demand by region, through 2020
2010 2015 2020
29.1 31.6 34.4NorthAmerica
2010 2015 2020
87.7 18.4
19.9
99.5
39.2
112.7
117.9
151.9
Rest of Europe/Eurasia7.9
2010 2015 2020
180.125.0
152.8
254.4
232.0
274.6
China,India
Middle East2.3
Japan,Korea,Taiwan
Americas Europe & Eurasia Asia Pacific
79.8
20.2
LatinAmerica9.2
LEGEND
Demand split within region (2010)
■ High/low demand differences
■ Consolidated demand
Note: Asia Pacific includes Singapore, Thailand and Pakistan
Source: A.T. Kearney
Worldwide growth in production is running parallel to increasing global demand. The first wave of LNG producers to enter the market was dominated by Asia, then Qatar and Australia dominated the second
wave and now North America is leading the third wave of new entrants to LNG production - along with dozens of other new entrants set to join in the next 10 years or more.
Global LNG production
600
500
400
300
200
100
0
2000
2005
2010
2011
2012
2013
2014
2015
2016
2017
2018
2019
2020
2025
2030
Actual Projected
Mill
ion
tonn
es p
er y
ear
LEGEND
■ JKT ■ Other Asia■ Americas ■ Europe■ Other
Note: Japan, South Korea, and Taiwan are collectively, JKT
Source: Ernst & Young
Bill
ion
cubi
c m
eter
s
The efficiency challenge of LNG production 7
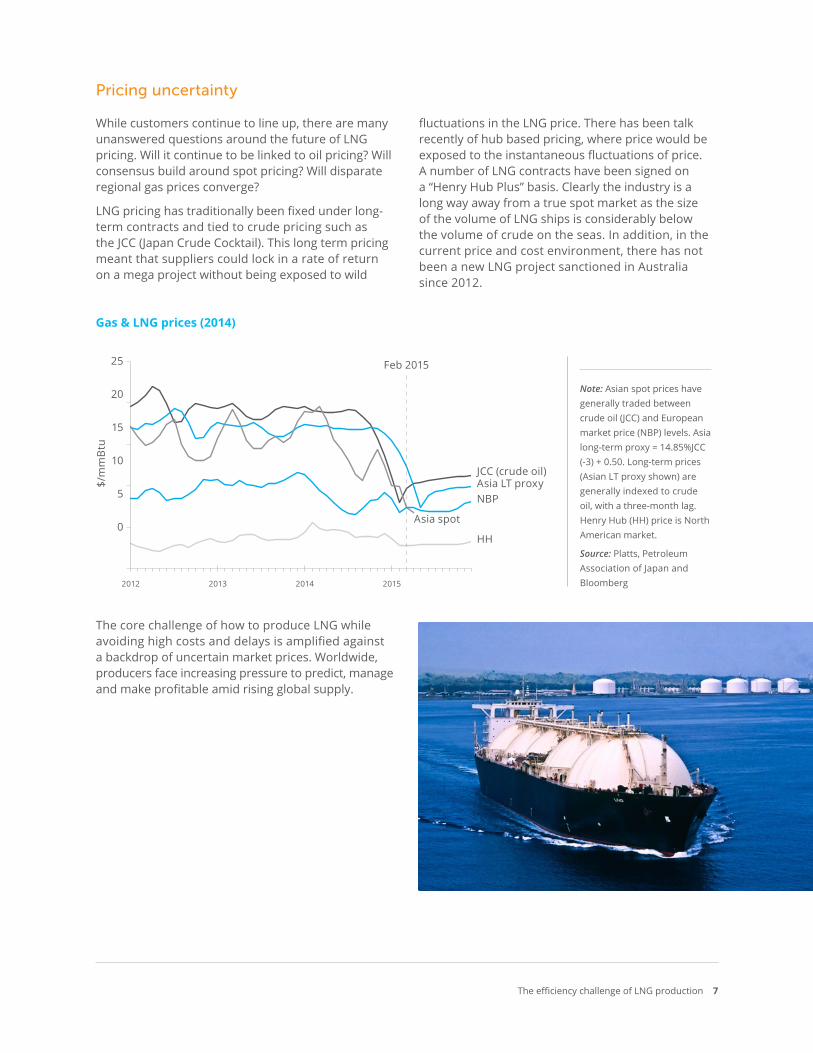
Pricing uncertainty
While customers continue to line up, there are many unanswered questions around the future of LNG pricing. Will it continue to be linked to oil pricing? Will consensus build around spot pricing? Will disparate regional gas prices converge?
LNG pricing has traditionally been fixed under long-term contracts and tied to crude pricing such as the JCC (Japan Crude Cocktail). This long term pricing meant that suppliers could lock in a rate of return on a mega project without being exposed to wild
fluctuations in the LNG price. There has been talk recently of hub based pricing, where price would be exposed to the instantaneous fluctuations of price. A number of LNG contracts have been signed on a “Henry Hub Plus” basis. Clearly the industry is a long way away from a true spot market as the size of the volume of LNG ships is considerably below the volume of crude on the seas. In addition, in the current price and cost environment, there has not been a new LNG project sanctioned in Australia since 2012.
Gas & LNG prices (2014)
25
20
15
10
5
0
2012 2013 2014 2015
Feb 2015
$/m
mB
tu
JCC (crude oil)Asia LT proxyNBP
Asia spot
HH
Note: Asian spot prices have generally traded between crude oil (JCC) and European market price (NBP) levels. Asia long-term proxy = 14.85%JCC (-3) + 0.50. Long-term prices (Asian LT proxy shown) are generally indexed to crude oil, with a three-month lag. Henry Hub (HH) price is North American market.
Source: Platts, Petroleum Association of Japan and Bloomberg
The core challenge of how to produce LNG while avoiding high costs and delays is amplified against a backdrop of uncertain market prices. Worldwide, producers face increasing pressure to predict, manage and make profitable amid rising global supply.
8 Enersight Corporation August 2015
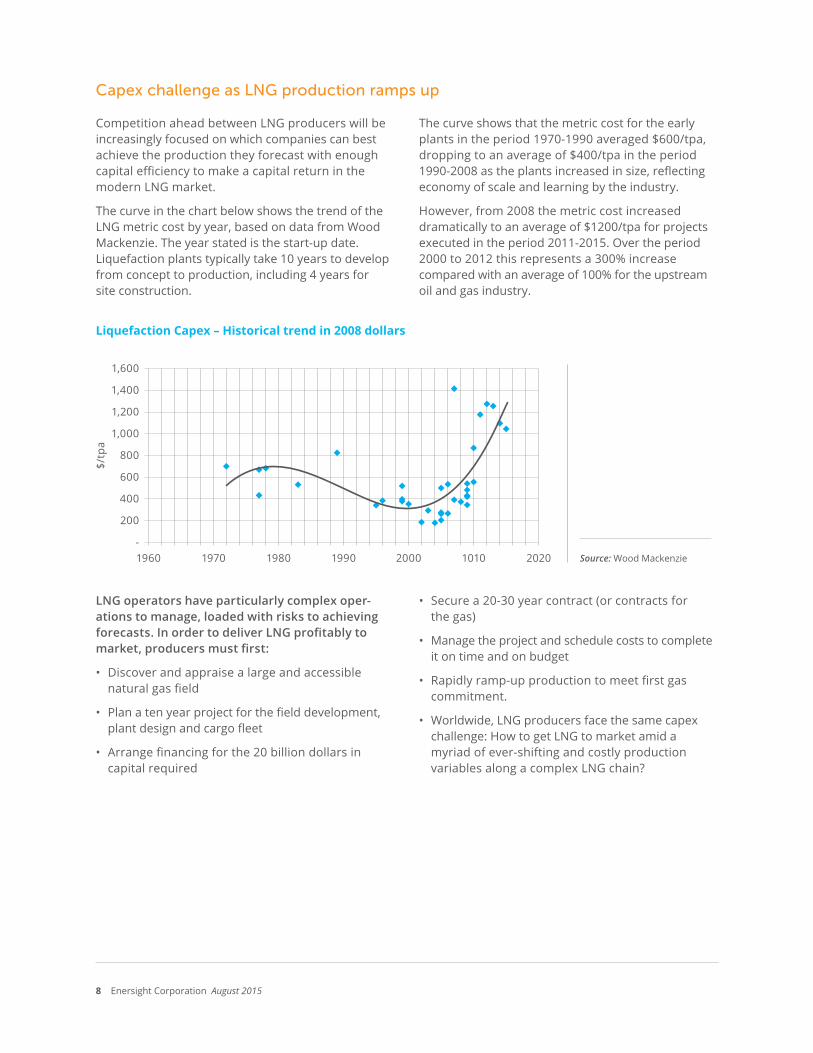
Capex challenge as LNG production ramps up
Competition ahead between LNG producers will be increasingly focused on which companies can best achieve the production they forecast with enough capital efficiency to make a capital return in the modern LNG market.
The curve in the chart below shows the trend of the LNG metric cost by year, based on data from Wood Mackenzie. The year stated is the start-up date. Liquefaction plants typically take 10 years to develop from concept to production, including 4 years for site construction.
The curve shows that the metric cost for the early plants in the period 1970-1990 averaged $600/tpa, dropping to an average of $400/tpa in the period 1990-2008 as the plants increased in size, reflecting economy of scale and learning by the industry.
However, from 2008 the metric cost increased dramatically to an average of $1200/tpa for projects executed in the period 2011-2015. Over the period 2000 to 2012 this represents a 300% increase compared with an average of 100% for the upstream oil and gas industry.
Liquefaction Capex – Historical trend in 2008 dollars
1,600
1,400
1,200
1,000
800
600
400
200
-1960 1970 1980 1990 2000 1010 2020
$/tp
a
Source: Wood Mackenzie
LNG operators have particularly complex oper-ations to manage, loaded with risks to achieving forecasts. In order to deliver LNG profitably to market, producers must first:
• Discover and appraise a large and accessible natural gas field
• Plan a ten year project for the field development, plant design and cargo fleet
• Arrange financing for the 20 billion dollars in capital required
• Secure a 20-30 year contract (or contracts for the gas)
• Manage the project and schedule costs to complete it on time and on budget
• Rapidly ramp-up production to meet first gas commitment.
• Worldwide, LNG producers face the same capex challenge: How to get LNG to market amid a myriad of ever-shifting and costly production variables along a complex LNG chain?
The efficiency challenge of LNG production 9
LNG chain – Producing and delivering LNG to market
illustration / icons
10 Enersight Corporation August 2015
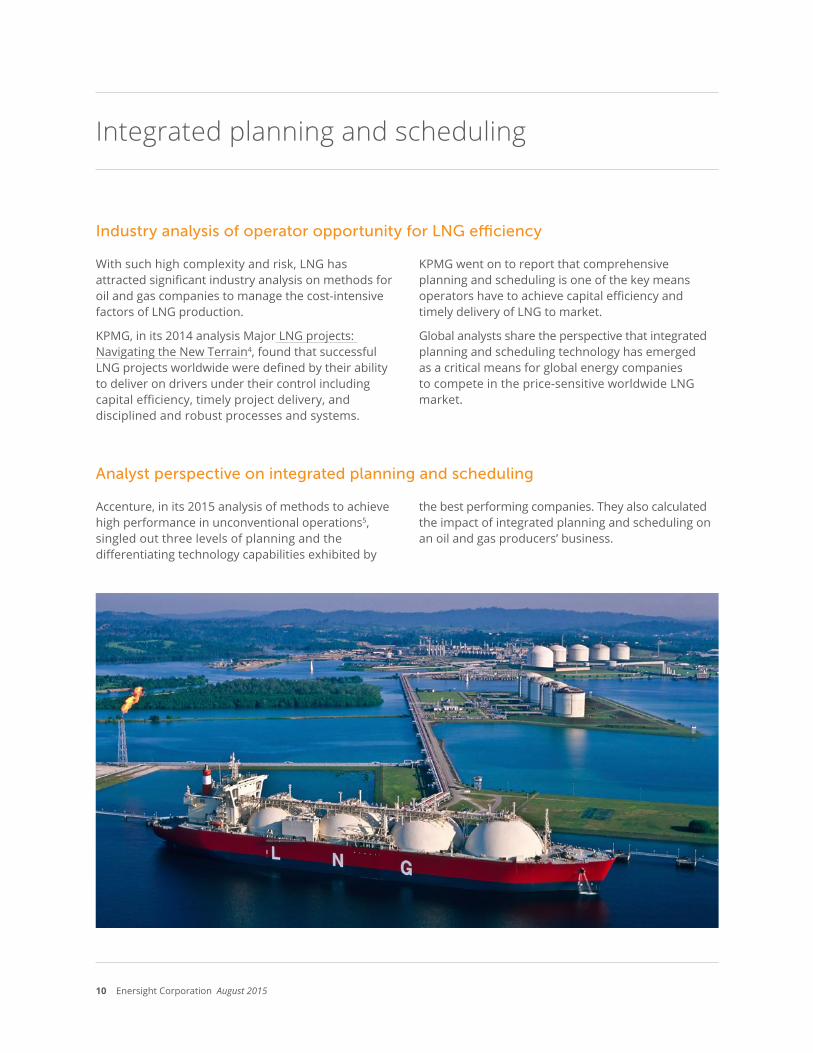
Integrated planning and scheduling
Industry analysis of operator opportunity for LNG efficiency
With such high complexity and risk, LNG has attracted significant industry analysis on methods for oil and gas companies to manage the cost-intensive factors of LNG production.
KPMG, in its 2014 analysis Major LNG projects: Navigating the New Terrain4, found that successful LNG projects worldwide were defined by their ability to deliver on drivers under their control including capital efficiency, timely project delivery, and disciplined and robust processes and systems.
KPMG went on to report that comprehensive planning and scheduling is one of the key means operators have to achieve capital efficiency and timely delivery of LNG to market.
Global analysts share the perspective that integrated planning and scheduling technology has emerged as a critical means for global energy companies to compete in the price-sensitive worldwide LNG market.
Analyst perspective on integrated planning and scheduling
Accenture, in its 2015 analysis of methods to achieve high performance in unconventional operations5, singled out three levels of planning and the differentiating technology capabilities exhibited by
the best performing companies. They also calculated the impact of integrated planning and scheduling on an oil and gas producers’ business.
The efficiency challenge of LNG production 11
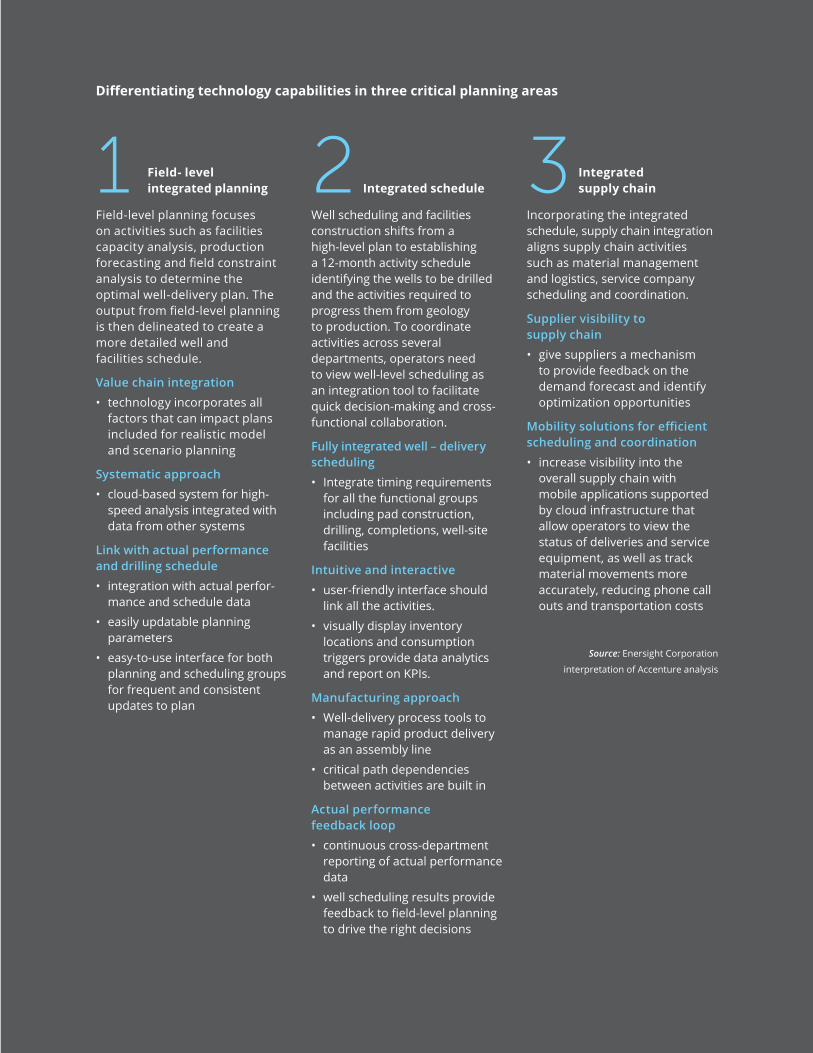
Differentiating technology capabilities in three critical planning areas
1 Field- level integrated planning
Field-level planning focuses on activities such as facilities capacity analysis, production forecasting and field constraint analysis to determine the optimal well-delivery plan. The output from field-level planning is then delineated to create a more detailed well and facilities schedule.
Value chain integration
• technology incorporates all factors that can impact plans included for realistic model and scenario planning
Systematic approach
• cloud-based system for high-speed analysis integrated with data from other systems
Link with actual performance and drilling schedule
• integration with actual perfor-mance and schedule data
• easily updatable planning parameters
• easy-to-use interface for both planning and scheduling groups for frequent and consistent updates to plan
2 Integrated schedule
Well scheduling and facilities construction shifts from a high-level plan to establishing a 12-month activity schedule identifying the wells to be drilled and the activities required to progress them from geology to production. To coordinate activities across several departments, operators need to view well-level scheduling as an integration tool to facilitate quick decision-making and cross-functional collaboration.
Fully integrated well – delivery scheduling
• Integrate timing requirements for all the functional groups including pad construction, drilling, completions, well-site facilities
Intuitive and interactive
• user-friendly interface should link all the activities.
• visually display inventory locations and consumption triggers provide data analytics and report on KPIs.
Manufacturing approach
• Well-delivery process tools to manage rapid product delivery as an assembly line
• critical path dependencies between activities are built in
Actual performance feedback loop
• continuous cross-department reporting of actual performance data
• well scheduling results provide feedback to field-level planning to drive the right decisions
3 Integrated supply chain
Incorporating the integrated schedule, supply chain integration aligns supply chain activities such as material management and logistics, service company scheduling and coordination.
Supplier visibility to supply chain
• give suppliers a mechanism to provide feedback on the demand forecast and identify optimization opportunities
Mobility solutions for efficient scheduling and coordination
• increase visibility into the overall supply chain with mobile applications supported by cloud infrastructure that allow operators to view the status of deliveries and service equipment, as well as track material movements more accurately, reducing phone call outs and transportation costs
Source: Enersight Corporation
interpretation of Accenture analysis
12 Enersight Corporation August 2015
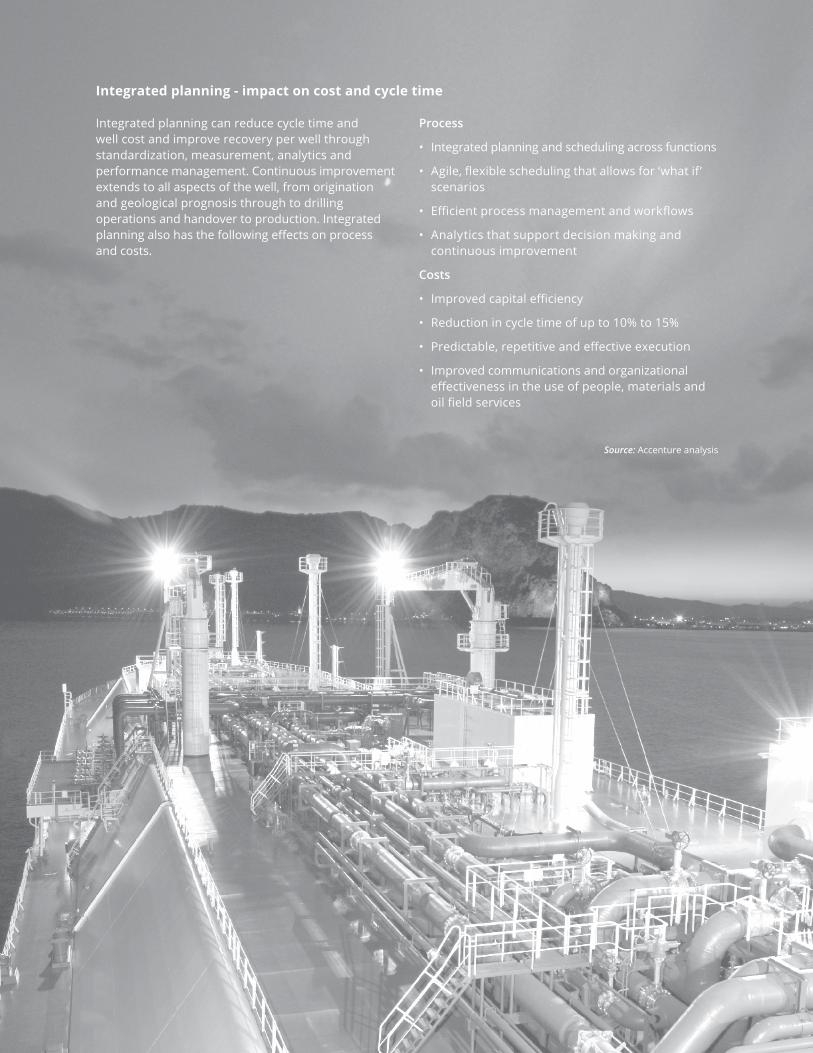
Integrated planning - impact on cost and cycle time
Integrated planning can reduce cycle time and well cost and improve recovery per well through standardization, measurement, analytics and performance management. Continuous improvement extends to all aspects of the well, from origination and geological prognosis through to drilling operations and handover to production. Integrated planning also has the following effects on process and costs.
Process
• Integrated planning and scheduling across functions
• Agile, flexible scheduling that allows for ‘what if’ scenarios
• Efficient process management and workflows
• Analytics that support decision making and continuous improvement
Costs
• Improved capital efficiency
• Reduction in cycle time of up to 10% to 15%
• Predictable, repetitive and effective execution
• Improved communications and organizational effectiveness in the use of people, materials and oil field services
Source: Accenture analysis
The efficiency challenge of LNG production 13
Integrated planning and scheduling technology requirements
Based on more than 10 years of experience working directly with oil and gas companies on some of the most complex and capital intensive development projects worldwide, Enersight Corporation has observed three critical capabilities of integrated planning and scheduling technology to equip global energy companies to best compete:
• Comprehensive planning model that provides accurate forecasts and plan adaptability – ability to forecast accurately and rapidly make decisions based on what-if scenarios run on a comprehensive plan model.
• Integrated activity scheduling – development plan models must incorporate all complex factors of production and tie in interdependencies of scheduling.
• Company-wide visibility of continuous evolving plans – immediate access to revised plans and schedules across corporate planning, asset planning and operations teams.
Given the manufacturing-style complexity and risks of LNG production, companies that possess these capabilities have certain advantage.
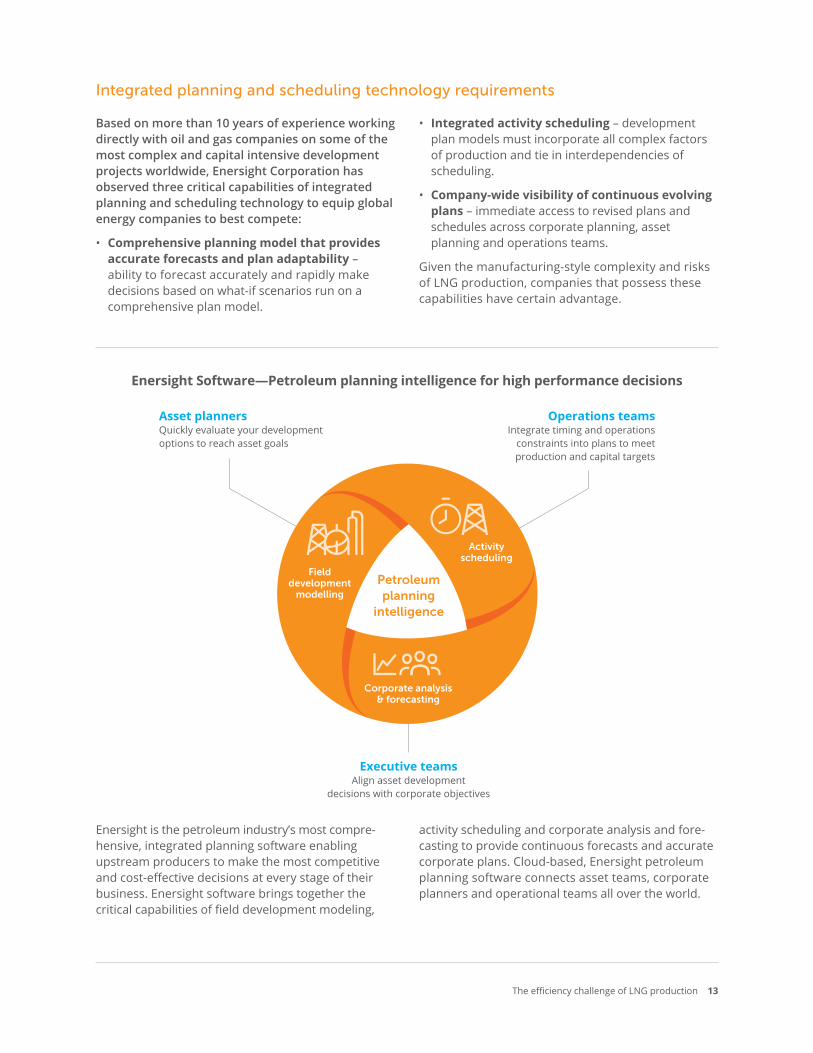
Enersight Software—Petroleum planning intelligence for high performance decisions
y
Enersight is the petroleum industry’s most compre-hensive, integrated planning software enabling upstream producers to make the most competitive and cost-effective decisions at every stage of their business. Enersight software brings together the critical capabilities of field development modeling,
activity scheduling and corporate analysis and fore-casting to provide continuous forecasts and accurate corporate plans. Cloud-based, Enersight petroleum planning software connects asset teams, corporate planners and operational teams all over the world.
14 Enersight Corporation August 2015
INTEGRATED PLANNING FOR COAL SEAM GAS TO LNG IN AUSTRALIA
Australia opportunity and challenge
By 2018, Australia is positioned to be the world’s largest LNG exporter.6 The nation already has seven LNG operations now constructed and three export facilities.
The challenge for Australia ahead becomes how to produce LNG with enough capital efficiently to realize returns on the massive investment in plant infrastructure and upstream gathering systems. To date, Australia’s costs are estimated to be 40 percent greater than US LNG capex costs.7
Twenty-nine percent of Australia’s LNG production is forecast to use conventional coal seam gas as feedstock.8 CSG to LNG production is an industrial process with infrastructure for compression, gas gathering and water treatment.
While conventional LNG projects are challenging already, coal seam gas LNG projects have additional operational and cost efficiency challenges:
• Relatively low production rates of the wells require large number of wells to be drilled to meet the ramp up and to continue to fill the plant into the future
• Rapid production ramp-up required to fill the LNG plant
• Production drawn from a large number of wells across huge basin areas in order to meet the deliverability requirements of multiple LNG trains
• CSG wells initially create large volumes of water resulting large water volumes to be managed
• Variable nature of CSG reservoirs - notoriously difficult to model
AUSTRALIA USE CASE
The efficiency challenge of LNG production 15
Enersight integrated planning technology applied
In this case study, we will examine a coal seam to LNG development in Queensland, Australia. A typical project in Queensland supplies an LNG plant with 1.5 bcf per day from five thousand to seven thousand producing gas wells in a basin producing for more than 25 years.
We will look at how Enersight integrated planning and scheduling technology can be applied to help most profitably develop, adapt and execute an on-target development plan.
Comprehensive planning for accurate forecasts
To be reliable and achievable, the CSG to LNG corporate plan needs to factor in all of the complexity of production and capital investment. The planning model must incorporate workflows including individual well forecasts, surface flow model, constrained surface network, drilling scheduling including constraints and downtime, and economics.
Enersight petroleum planning software incorporates the industry’s most comprehensive field development
modelling plus integrated activity scheduling to provide LNG producers intelligence for making good development decisions and provides continuous, accurate capital forecasting and corporate plans.
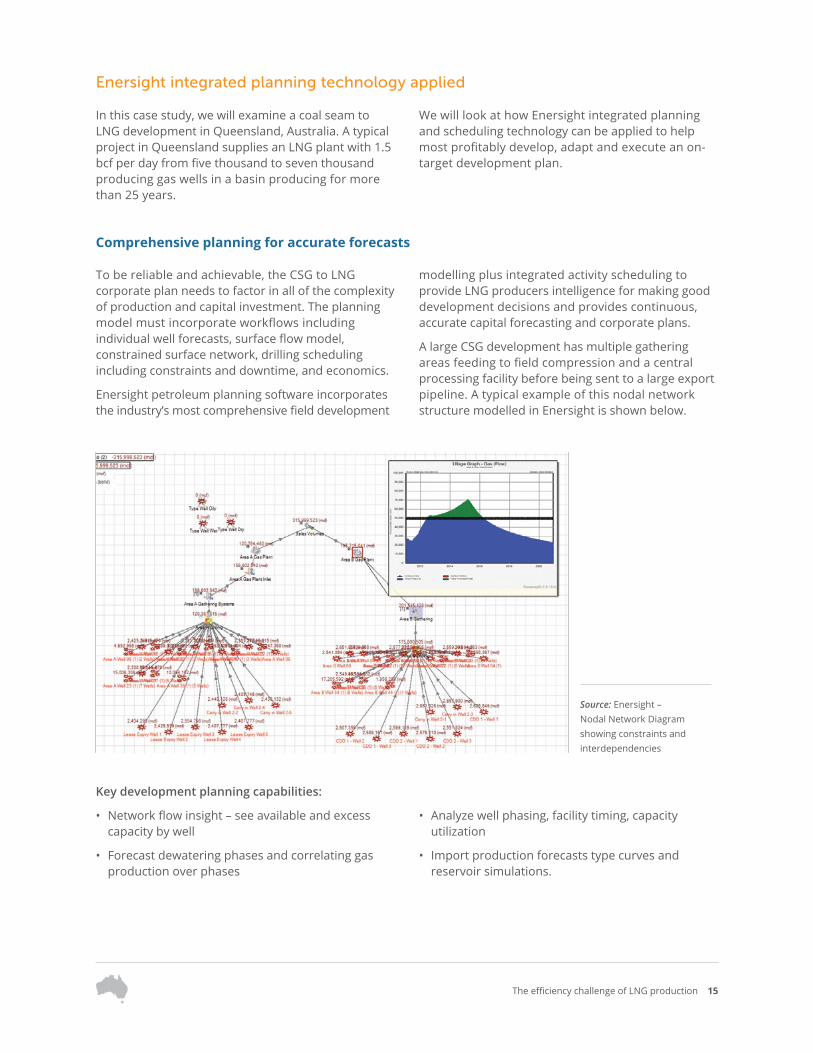
A large CSG development has multiple gathering areas feeding to field compression and a central processing facility before being sent to a large export pipeline. A typical example of this nodal network structure modelled in Enersight is shown below.
Source: Enersight – Nodal Network Diagram showing constraints and interdependencies
Key development planning capabilities:
• Network flow insight – see available and excess capacity by well
• Forecast dewatering phases and correlating gas production over phases
• Analyze well phasing, facility timing, capacity utilization
• Import production forecasts type curves and reservoir simulations.
16 Enersight Corporation August 2015
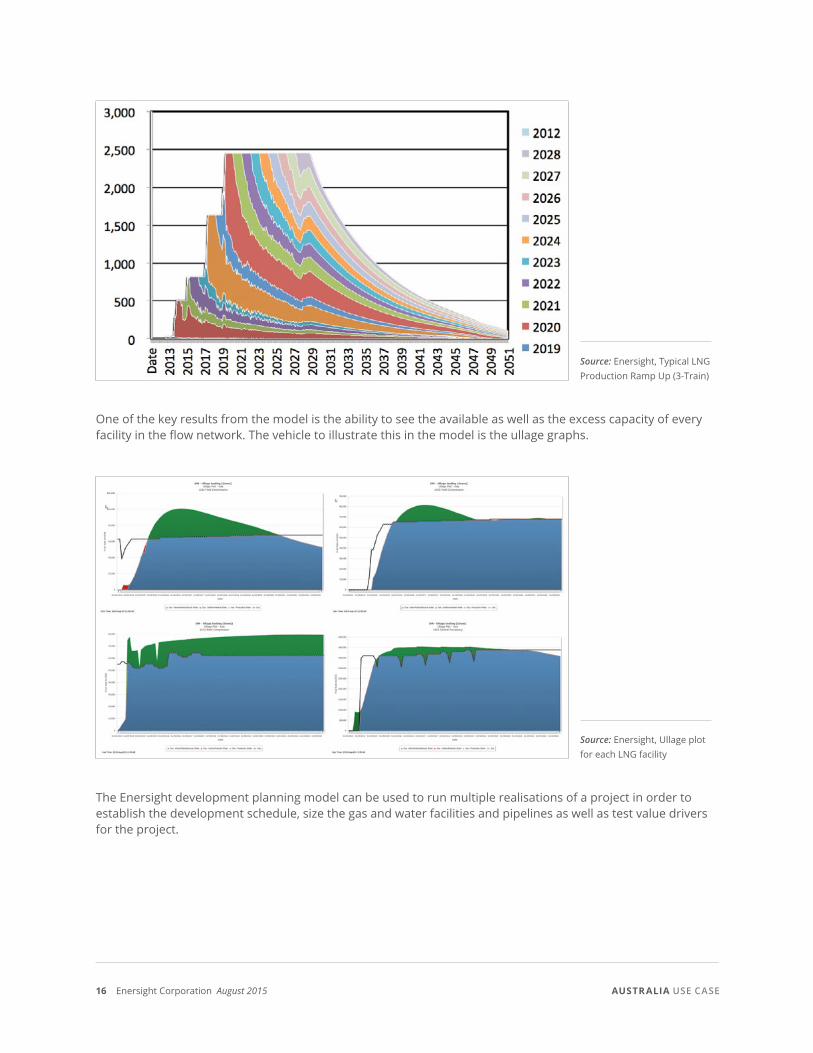
Source: Enersight, Typical LNG Production Ramp Up (3-Train)
One of the key results from the model is the ability to see the available as well as the excess capacity of every facility in the flow network. The vehicle to illustrate this in the model is the ullage graphs.
Source: Enersight, Ullage plot for each LNG facility
The Enersight development planning model can be used to run multiple realisations of a project in order to establish the development schedule, size the gas and water facilities and pipelines as well as test value drivers for the project.
AUSTRALIA USE CASE
The efficiency challenge of LNG production 17
Plan adaptability
In addition to accurate corporate planning, capital efficient LNG production requires ongoing, intelligent decisions on how to best realize the project as development factors shift including schedule, water and pipeline facility capacity and value drivers such as fluctuating global pricing.
With the corporate plan in place, Enersight allows producers to perform what-if analysis, such as pricing or timing, and to evaluate specific investment decisions, such as expanding facility capacity. What-if scenarios can be run within a few hours to evaluate new plans and make the best use of capital.
Key capabilities for ongoing development decisions:
• Quantify the economic and production metrics of each development option
• Assess detailed capital expenditure profiles and development schedules
• Rapidly compare various development decisions
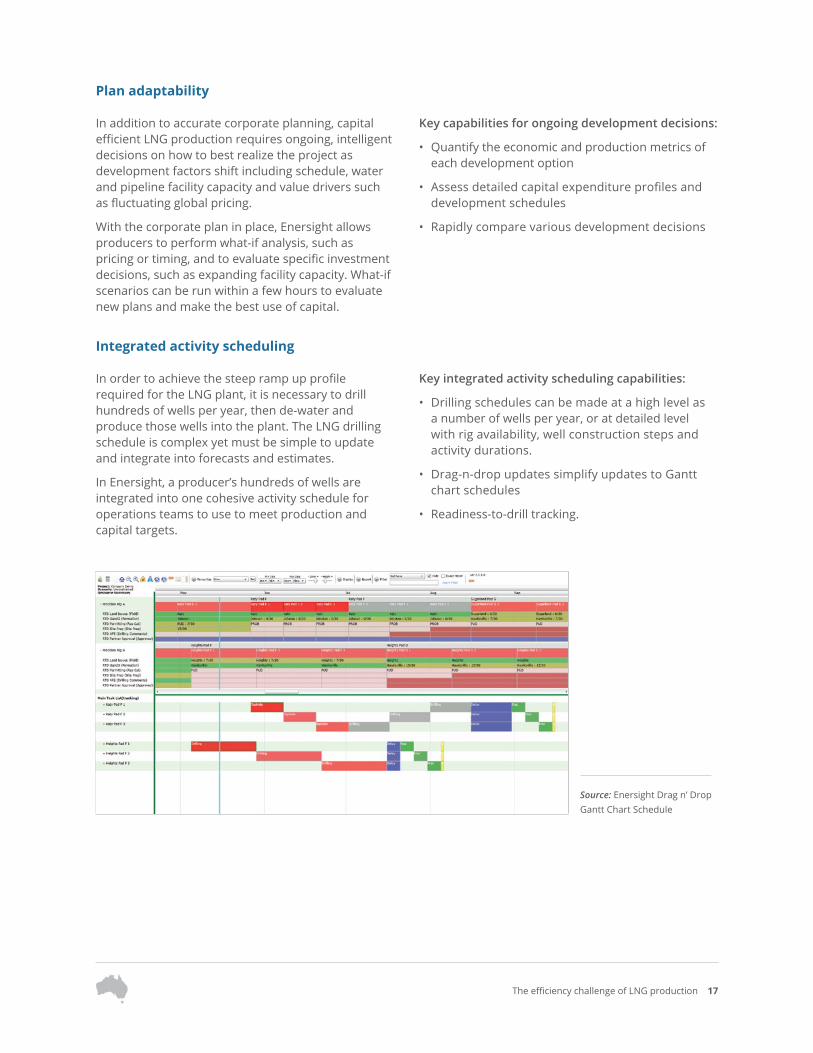
Integrated activity scheduling
In order to achieve the steep ramp up profile required for the LNG plant, it is necessary to drill hundreds of wells per year, then de-water and produce those wells into the plant. The LNG drilling schedule is complex yet must be simple to update and integrate into forecasts and estimates.
In Enersight, a producer’s hundreds of wells are integrated into one cohesive activity schedule for operations teams to use to meet production and capital targets.
Key integrated activity scheduling capabilities:
• Drilling schedules can be made at a high level as a number of wells per year, or at detailed level with rig availability, well construction steps and activity durations.
• Drag-n-drop updates simplify updates to Gantt chart schedules
• Readiness-to-drill tracking.
Source: Enersight Drag n’ Drop Gantt Chart Schedule
18 Enersight Corporation August 2015
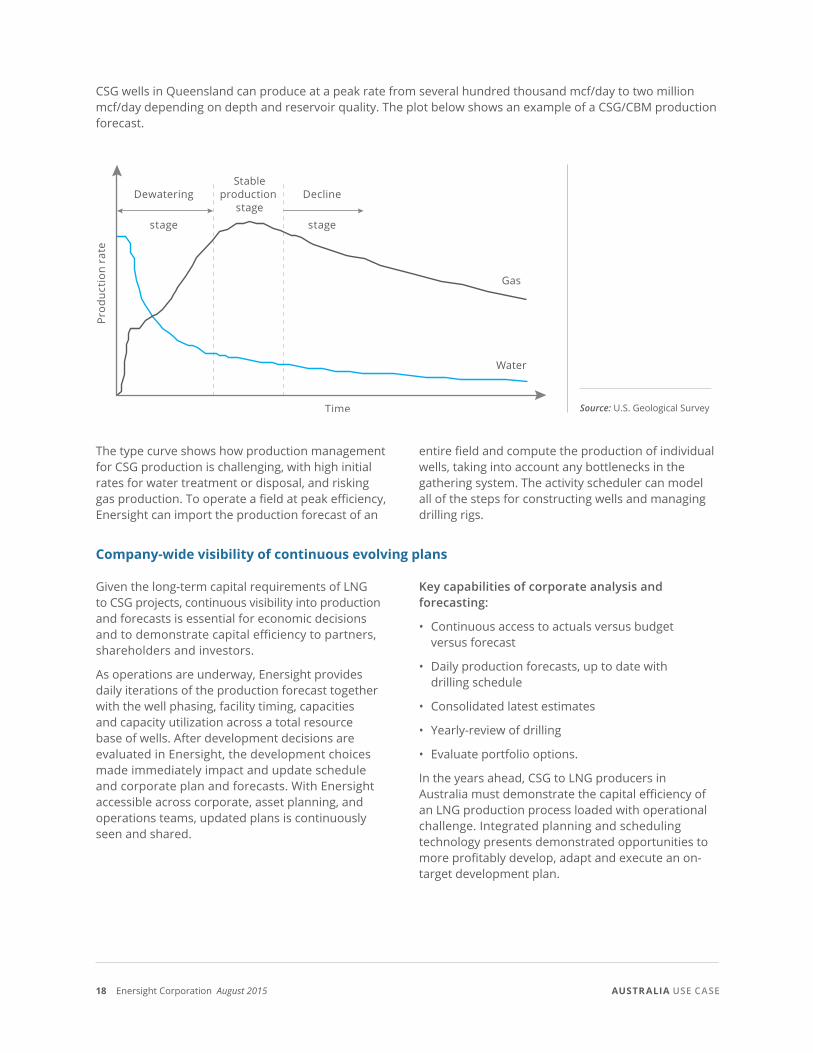
CSG wells in Queensland can produce at a peak rate from several hundred thousand mcf/day to two million mcf/day depending on depth and reservoir quality. The plot below shows an example of a CSG/CBM production forecast.
Dewatering
stage
Decline
stage
Prod
ucti
on r
ate
Gas
Stableproduction
stage
Water
Time Source: U.S. Geological Survey
The type curve shows how production management for CSG production is challenging, with high initial rates for water treatment or disposal, and risking gas production. To operate a field at peak efficiency, Enersight can import the production forecast of an
entire field and compute the production of individual wells, taking into account any bottlenecks in the gathering system. The activity scheduler can model all of the steps for constructing wells and managing drilling rigs.
Company-wide visibility of continuous evolving plans
Given the long-term capital requirements of LNG to CSG projects, continuous visibility into production and forecasts is essential for economic decisions and to demonstrate capital efficiency to partners, shareholders and investors.
As operations are underway, Enersight provides daily iterations of the production forecast together with the well phasing, facility timing, capacities and capacity utilization across a total resource base of wells. After development decisions are evaluated in Enersight, the development choices made immediately impact and update schedule and corporate plan and forecasts. With Enersight accessible across corporate, asset planning, and operations teams, updated plans is continuously seen and shared.
Key capabilities of corporate analysis and forecasting:
• Continuous access to actuals versus budget versus forecast
• Daily production forecasts, up to date with drilling schedule
• Consolidated latest estimates
• Yearly-review of drilling
• Evaluate portfolio options.
In the years ahead, CSG to LNG producers in Australia must demonstrate the capital efficiency of an LNG production process loaded with operational challenge. Integrated planning and scheduling technology presents demonstrated opportunities to more profitably develop, adapt and execute an on-target development plan.
AUSTRALIA USE CASE
The efficiency challenge of LNG production 19
Summary
The next five years are forecasting certain growth in global LNG demand. With the recent drop in oil prices, the market is witnessing the inherent conflict of producers, with increasing project costs, selling to buyers that are more price sensitive.9 While no one can fully predict the future of global LNG pricing, it seems inevitable that pricing pressure will continue, and with it the pressure on global LNG producers to constrain costs of production.
As new LNG production comes online, the risk for global LNG producers has shifted from managing the costs and schedules of facility construction projects to producing large-scale field development projects.
While integrated planning and scheduling technology is only one aspect of the solution to achieve efficiency in LNG production, it will be a considerable factor in determining which energy producers gain mastery of the manufacturing variables of LNG, and gain visibility into the opportunities and avoidable issues of profitable LNG production.
About the author – Don Merritt Vice-President, Australian Operation
Don heads Enersight Corporation’s Australia operation, focusing on consulting and business devel-opment. A mechanical engineer by training, Don began his career as a reservoir engineer with
Petro-Canada. He gained experience in developing international oil and gas fiscal models through his leadership positions with Merak’s Asian office and Schlumberger in Australia, Indonesia and Canada.
About Enersight Corporation
Enersight Corporation provides planning software and expertise for the modern, complex oil and gas industry. Enersight petroleum planning software supports the most comprehensive integrated planning in the industry and helps upstream petroleum producers make competitive and cost-effective decisions at every stage of their business. Our software provides advantage to global energy leaders including QGC as well as well as other LNG players including Shell and ConocoPhillips.
For more than a decade our company has been defining the highest standard of petroleum planning with cloud-based software and expert consulting. Enersight Corporation operates from offices in the United States, Canada, and Australia, and serves more than 50 oil and gas producers globally.
Visit us at www.enersight.com.
20 Enersight Corporation August 2015
References
1 Major LNG projects: Navigating the New Terrain, KPMG International, 2014. All Rights Reserved.
2 LNG Plant Cost Escalation, The Oxford Institute for Energy Studies, University of Oxford, February 2014.
3 Global LNG: Will new demand and new supply mean new pricing? Ernst & Young, 2013.
4 Major LNG projects: Navigating the New Terrain, KPMG International, 2014. All Rights Reserved.
5 Achieving high performance in unconventional operations, Accenture, 2015. All Rights Reserved.
6 The Future of Australian LNG Exports, The Oxford Institute for Energy Studies, University of Oxford, September 2014.
7 Public speech by Roy Krzywosinski, Managing Director, Chevron Australia; Australian Petroleum Production and Exploration Association (APPEA) annual conference, Perth, April 2014.
8 Oxford Institute for Energy Studies, Op. Cit.
9 Evolving Market Dynamics of Global LNG, Ernst & Young, as published in Oil & Gas Financial Journal, May 2013.

The efficiency challenge of LNG production 21

Calgary
+1 403 246 7447
Houston
+1 832 982 1222
Brisbane
+61 (0) 434 780 403
We welcome questions—find out more
[email protected] www.enersight.com
Choice of market leaders
Enersight is the proven planning solution for the petroleum industry. We serve some of the world’s most advanced petroleum producers including industry majors and early growth innovators.
For more than a decade, our company has been defining the highest standard of petroleum planning with cloud-based software and expert consulting.