Embed Size (px)
Citation preview
Projects financed and statistics
The EIB Group in the year 2002
Activity in 2002
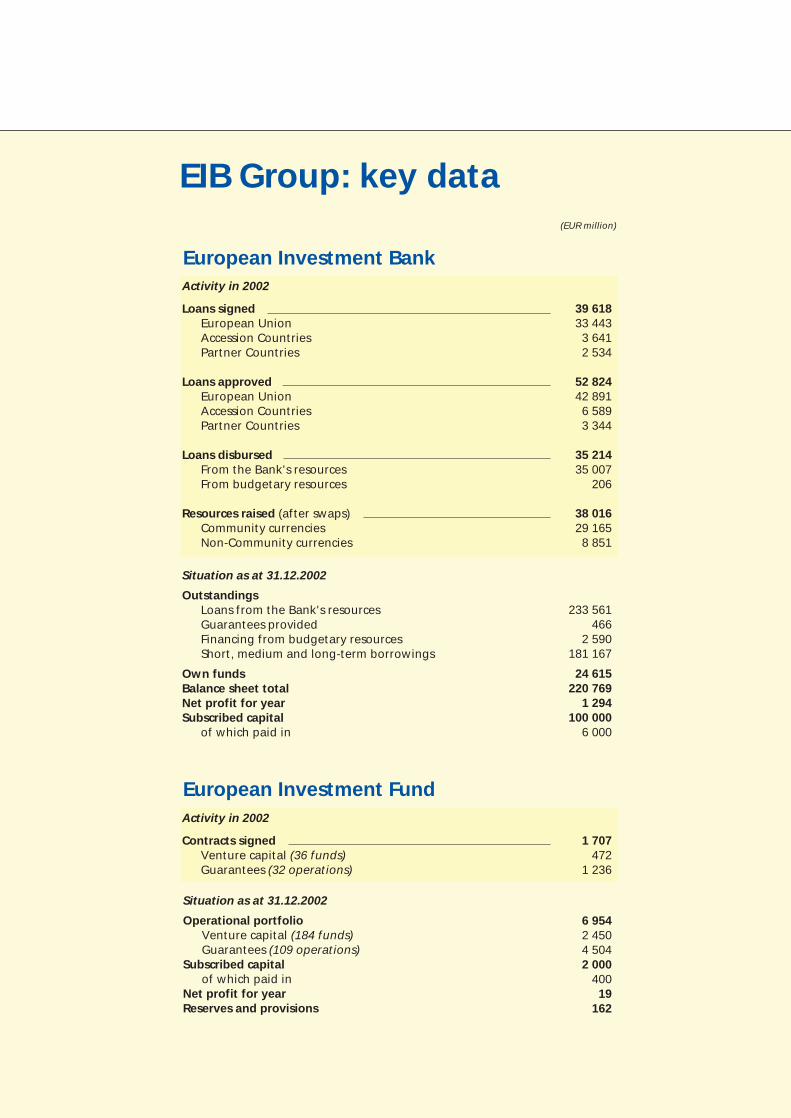
Loans signedEuropean UnionAccession CountriesPartner Countries
Loans approvedEuropean UnionAccession CountriesPartner Countries
Loans disbursedFrom the Bank's resourcesFrom budgetary resources
Resources raised (after swaps)Community currenciesNon-Community currencies
European Investment Bank
EIB Group: key data(EUR million)
Situation as at 31.12.2002
Operational portfolioVenture capital (184 funds)Guarantees (109 operations)
Subscribed capitalof which paid in
Net profit for yearReserves and provisions
Activity in 2002
Contracts signedVenture capital (36 funds)Guarantees (32 operations)
Situation as at 31.12.2002
OutstandingsLoans from the Bank's resourcesGuarantees providedFinancing from budgetary resourcesShort, medium and long-term borrowings
Own fundsBalance sheet totalNet profit for yearSubscribed capital
of which paid in
European Investment Fund
39 61833 4433 6412 534
52 82442 8916 5893 344
35 21435 007
206
38 01629 1658 851
233 561466
2 590181 167
24 615220 769
1 294100 000
6 000
1 707472
1 236
6 9542 4504 5042 000
40019
162
page
European Investment Bank
European Union
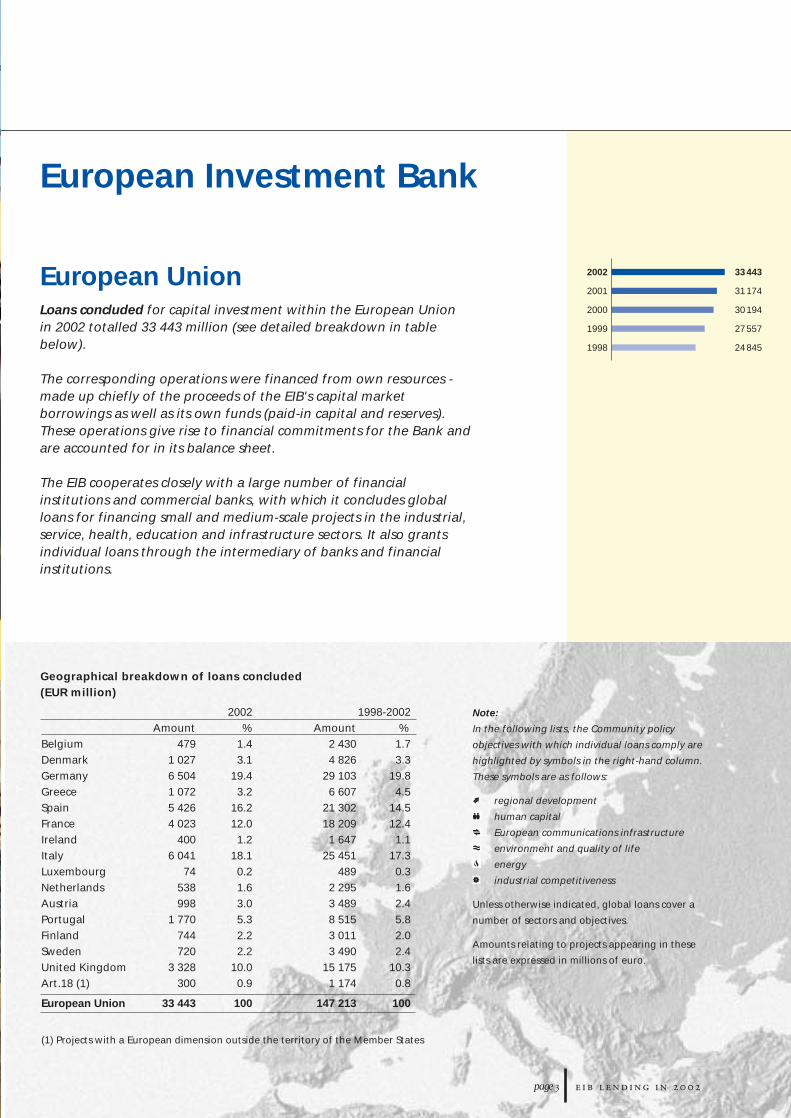
2002 1998-2002Amount % Amount %
BelgiumDenmarkGermanyGreeceSpainFranceIrelandItalyLuxembourgNetherlandsAustriaPortugalFinlandSwedenUnited KingdomArt.18 (1)
European Union
Note:
In the following lists, the Community policy
objectives with which individual loans comply are
highlighted by symbols in the right-hand column.
These symbols are as follows:
regional development
human capital
European communications infrastructure
environment and quality of life
energy
industrial competitiveness
Unless otherwise indicated, global loans cover a
number of sectors and objectives.
Amounts relating to projects appearing in these
lists are expressed in millions of euro.
(1) Projects with a European dimension outside the territory of the Member States
Geographical breakdown of loans concluded (EUR million)
Loans concluded for capital investment within the European Unionin 2002 totalled 33 443 million (see detailed breakdown in tablebelow).
The corresponding operations were financed from own resources -made up chiefly of the proceeds of the EIB's capital marketborrowings as well as its own funds (paid-in capital and reserves).These operations give rise to financial commitments for the Bank andare accounted for in its balance sheet.
The EIB cooperates closely with a large number of financialinstitutions and commercial banks, with which it concludes globalloans for financing small and medium-scale projects in the industrial,service, health, education and infrastructure sectors. It also grantsindividual loans through the intermediary of banks and financialinstitutions.
33 443
31 174
30 194
27 557
24 845
2002
2001
2000
1999
1998
479 1.4 2 430 1.71 027 3.1 4 826 3.36 504 19.4 29 103 19.81 072 3.2 6 607 4.55 426 16.2 21 302 14.54 023 12.0 18 209 12.4
400 1.2 1 647 1.16 041 18.1 25 451 17.3
74 0.2 489 0.3538 1.6 2 295 1.6998 3.0 3 489 2.4
1 770 5.3 8 515 5.8744 2.2 3 011 2.0720 2.2 3 490 2.4
3 328 10.0 15 175 10.3300 0.9 1 174 0.8
33 443 100 147 213 100
Individual loans Construction of 300 km gasline in Danish sector of North Sea DONG A/S
Upgrading and expansion of high-voltage power grid Eltra Amba
Construction of light railway network in Copenhagen Ørestadsselskabet I/S
Acquisition of rolling stock and locomotives for Copenhagen's suburban lines and line across Øresund Danske Statsbaner-DSB
Construction of container terminal and expansion of existing facilities Århus Havn
Construction of new passenger terminal and associated air and land side facilities at Billund airport (Jutland) Billund Lufthavn A/S
Modernisation and automation of mail distribution system and installation of new automatic parcels distribution system in 10 sorting centres Post Danmark
Global loans For financing small and medium-scale ventures KommuneKredit
Individual loans Construction and upgrading of high-speed rail lines between Brussels and Antwerp (northern branch) and between Brussels and Liège (eastern branch)
Société Nationale des Chemins de Fer BelgesIntegration of cable TV and telecommunications network Telenet Bidco N.V.
Telenet Vlaanderen N.V.
Construction of wastewater collection and treatment facilities in Flemish RegionAquafin N.V.
Global loans For financing small and medium-scale ventures KBC Bank N.V.
Banque Bruxelles Lambert S.A.
Finance contracts signed: 479 million of which
Individual loans: 179 million Global loans: 300 million
page
Individual loans focused on energy (325 million), transport (487 million) and services (81 million for
the modernisation and automation of the mail distribution system).
Individual loans targeted the transport (35 million), telecommunications (44 million) and water
management (100 million) sectors.
Finance contracts signed: 1 027 million of which
Individual loans: 893 million Global loans: 134 million
479
365
503
226
858
2002
2001
2000
1999
1998
1 027
1 171
984
898
745
2002
2001
2000
1999
1998
Belgium
Denmark
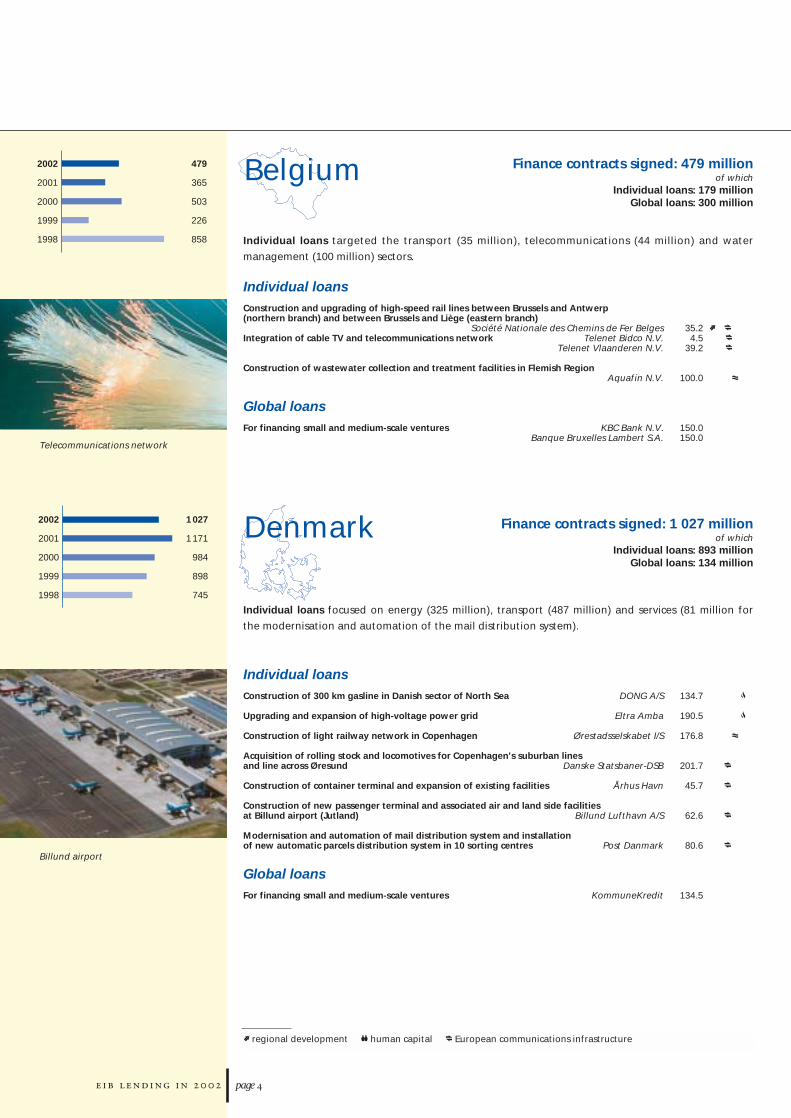
Telecommunications network
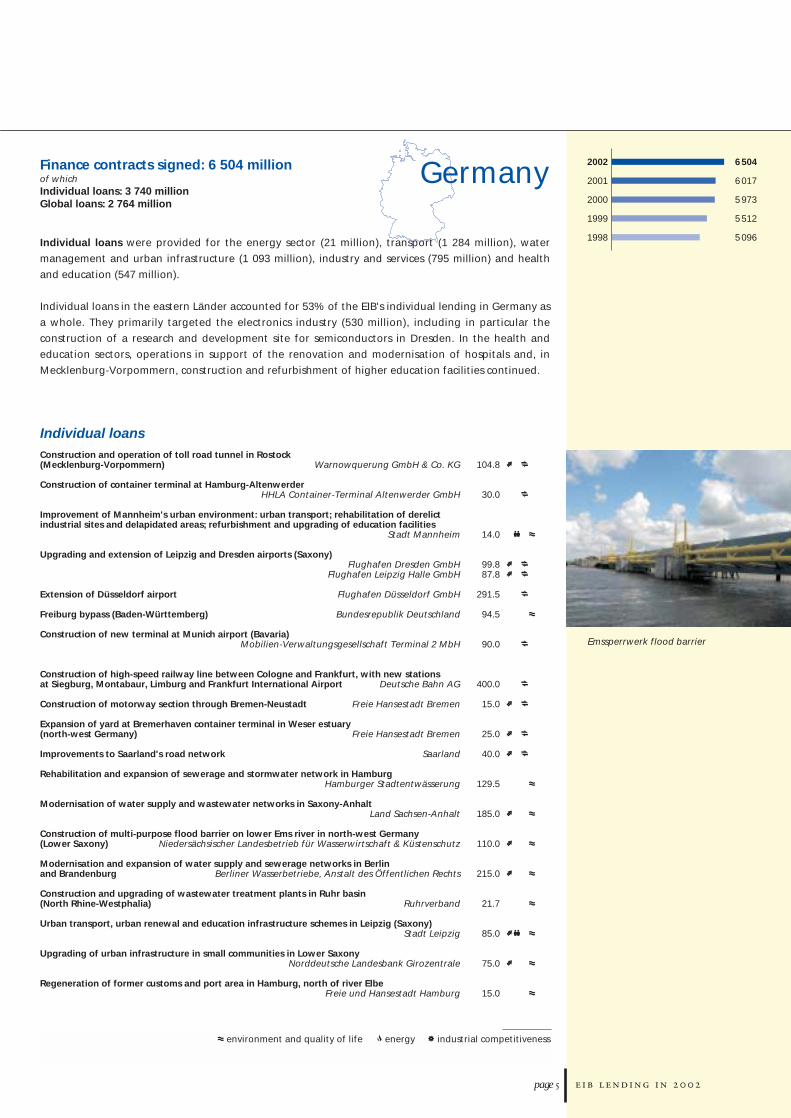
Billund airport
regional development human capital European communications infrastructure
35.24.5
39.2
100.0
150.0150.0
134.7
190.5
176.8
201.7
45.7
62.6
80.6
134.5
Finance contracts signed: 6 504 million of which Individual loans: 3 740 million Global loans: 2 764 million
Individual loans were provided for the energy sector (21 million), transport (1 284 million), water
management and urban infrastructure (1 093 million), industry and services (795 million) and health
and education (547 million).
Individual loans in the eastern Länder accounted for 53% of the EIB's individual lending in Germany as
a whole. They primarily targeted the electronics industry (530 million), including in particular the
construction of a research and development site for semiconductors in Dresden. In the health and
education sectors, operations in support of the renovation and modernisation of hospitals and, in
Mecklenburg-Vorpommern, construction and refurbishment of higher education facilities continued.
Individual loans Construction and operation of toll road tunnel in Rostock (Mecklenburg-Vorpommern) Warnowquerung GmbH & Co. KG
Construction of container terminal at Hamburg-Altenwerder HHLA Container-Terminal Altenwerder GmbH
Improvement of Mannheim's urban environment: urban transport; rehabilitation of derelict industrial sites and delapidated areas; refurbishment and upgrading of education facilities
Stadt Mannheim
Upgrading and extension of Leipzig and Dresden airports (Saxony) Flughafen Dresden GmbH
Flughafen Leipzig Halle GmbH
Extension of Düsseldorf airport Flughafen Düsseldorf GmbH
Freiburg bypass (Baden-Württemberg) Bundesrepublik Deutschland
Construction of new terminal at Munich airport (Bavaria) Mobilien-Verwaltungsgesellschaft Terminal 2 MbH
Construction of high-speed railway line between Cologne and Frankfurt, with new stations at Siegburg, Montabaur, Limburg and Frankfurt International Airport Deutsche Bahn AG
Construction of motorway section through Bremen-Neustadt Freie Hansestadt Bremen
Expansion of yard at Bremerhaven container terminal in Weser estuary (north-west Germany) Freie Hansestadt Bremen
Improvements to Saarland's road network Saarland
Rehabilitation and expansion of sewerage and stormwater network in Hamburg Hamburger Stadtentwässerung
Modernisation of water supply and wastewater networks in Saxony-AnhaltLand Sachsen-Anhalt
Construction of multi-purpose flood barrier on lower Ems river in north-west Germany (Lower Saxony) Niedersächsischer Landesbetrieb für Wasserwirtschaft & Küstenschutz
Modernisation and expansion of water supply and sewerage networks in Berlin and Brandenburg Berliner Wasserbetriebe, Anstalt des Öffentlichen Rechts
Construction and upgrading of wastewater treatment plants in Ruhr basin (North Rhine-Westphalia) Ruhrverband
Urban transport, urban renewal and education infrastructure schemes in Leipzig (Saxony) Stadt Leipzig
Upgrading of urban infrastructure in small communities in Lower Saxony Norddeutsche Landesbank Girozentrale
Regeneration of former customs and port area in Hamburg, north of river ElbeFreie und Hansestadt Hamburg
6 504
6 017
5 973
5 512
5 096
2002
2001
2000
1999
1998
Germany
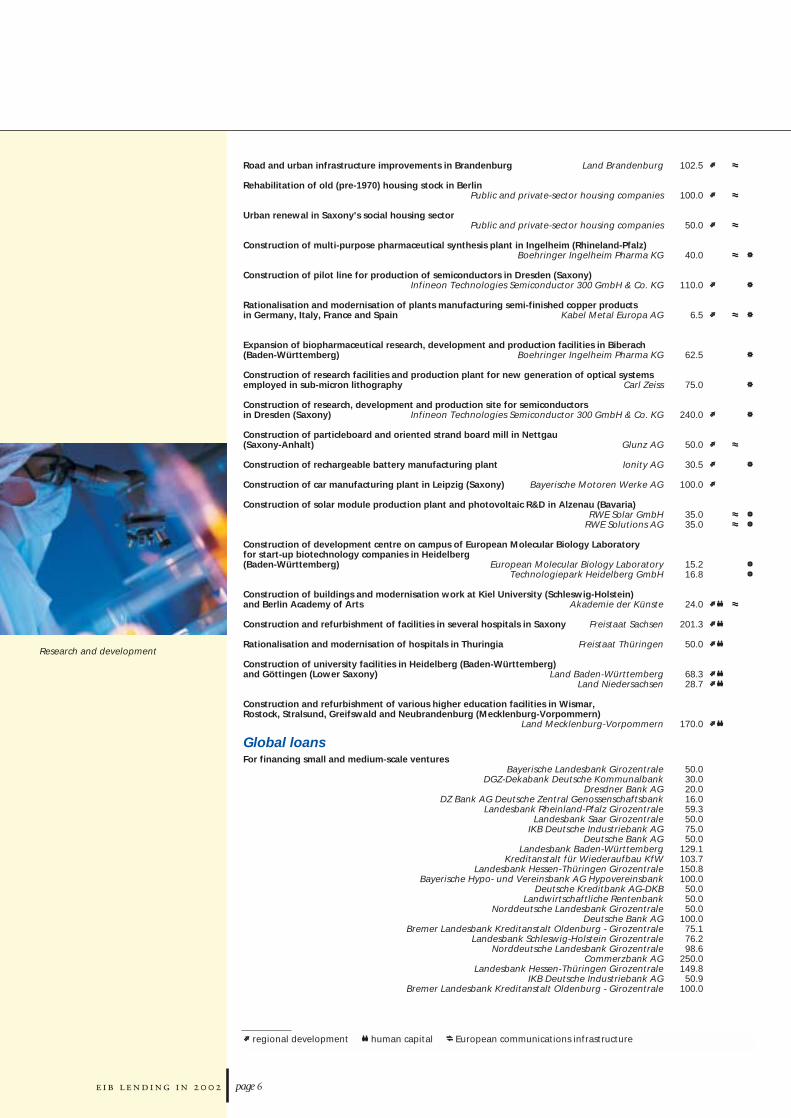
Emssperrwerk flood barrier
environment and quality of life energy industrial competitiveness
page
104.8
30.0
14.0
99.887.8
291.5
94.5
90.0
400.0
15.0
25.0
40.0
129.5
185.0
110.0
215.0
21.7
85.0
75.0
15.0
page
Road and urban infrastructure improvements in Brandenburg Land Brandenburg
Rehabilitation of old (pre-1970) housing stock in BerlinPublic and private-sector housing companies
Urban renewal in Saxony's social housing sectorPublic and private-sector housing companies
Construction of multi-purpose pharmaceutical synthesis plant in Ingelheim (Rhineland-Pfalz) Boehringer Ingelheim Pharma KG
Construction of pilot line for production of semiconductors in Dresden (Saxony) Infineon Technologies Semiconductor 300 GmbH & Co. KG
Rationalisation and modernisation of plants manufacturing semi-finished copper products in Germany, Italy, France and Spain Kabel Metal Europa AG
Expansion of biopharmaceutical research, development and production facilities in Biberach (Baden-Württemberg) Boehringer Ingelheim Pharma KG
Construction of research facilities and production plant for new generation of optical systems employed in sub-micron lithography Carl Zeiss
Construction of research, development and production site for semiconductors in Dresden (Saxony) Infineon Technologies Semiconductor 300 GmbH & Co. KG
Construction of particleboard and oriented strand board mill in Nettgau (Saxony-Anhalt) Glunz AG
Construction of rechargeable battery manufacturing plant Ionity AG
Construction of car manufacturing plant in Leipzig (Saxony) Bayerische Motoren Werke AG
Construction of solar module production plant and photovoltaic R&D in Alzenau (Bavaria) RWE Solar GmbH
RWE Solutions AG
Construction of development centre on campus of European Molecular Biology Laboratory for start-up biotechnology companies in Heidelberg (Baden-Württemberg) European Molecular Biology Laboratory
Technologiepark Heidelberg GmbH
Construction of buildings and modernisation work at Kiel University (Schleswig-Holstein) and Berlin Academy of Arts Akademie der Künste
Construction and refurbishment of facilities in several hospitals in Saxony Freistaat Sachsen
Rationalisation and modernisation of hospitals in Thuringia Freistaat Thüringen
Construction of university facilities in Heidelberg (Baden-Württemberg) and Göttingen (Lower Saxony) Land Baden-Württemberg
Land Niedersachsen
Construction and refurbishment of various higher education facilities in Wismar, Rostock, Stralsund, Greifswald and Neubrandenburg (Mecklenburg-Vorpommern)
Land Mecklenburg-Vorpommern
Global loans For financing small and medium-scale ventures
Bayerische Landesbank GirozentraleDGZ-Dekabank Deutsche Kommunalbank
Dresdner Bank AGDZ Bank AG Deutsche Zentral Genossenschaftsbank
Landesbank Rheinland-Pfalz GirozentraleLandesbank Saar Girozentrale
IKB Deutsche Industriebank AGDeutsche Bank AG
Landesbank Baden-WürttembergKreditanstalt für Wiederaufbau KfW
Landesbank Hessen-Thüringen GirozentraleBayerische Hypo- und Vereinsbank AG Hypovereinsbank
Deutsche Kreditbank AG-DKBLandwirtschaftliche Rentenbank
Norddeutsche Landesbank GirozentraleDeutsche Bank AG
Bremer Landesbank Kreditanstalt Oldenburg - GirozentraleLandesbank Schleswig-Holstein Girozentrale
Norddeutsche Landesbank GirozentraleCommerzbank AG
Landesbank Hessen-Thüringen GirozentraleIKB Deutsche Industriebank AG
Bremer Landesbank Kreditanstalt Oldenburg - Girozentrale
regional development human capital European communications infrastructure
Research and development
102.5
100.0
50.0
40.0
110.0
6.5
62.5
75.0
240.0
50.0
30.5
100.0
35.035.0
15.216.8
24.0
201.3
50.0
68.328.7
170.0
50.030.020.016.059.350.075.050.0
129.1103.7150.8100.050.050.050.0
100.075.176.298.6
250.0149.850.9
100.0
environment and quality of life energy industrial competitiveness
page
Individual loans were directed towards the energy sector (150 million), transport and
telecommunications (422 million) and urban infrastructure (500 million for the construction and
upgrading of facilities in Athens and other Greek towns hosting the 2004 Olympic Games).
Finance contracts signed: 1 072 million of which Individual loans: 1 072 million
1 072
1 651
1 712
1 436
736
2002
2001
2000
1999
1998
Greece
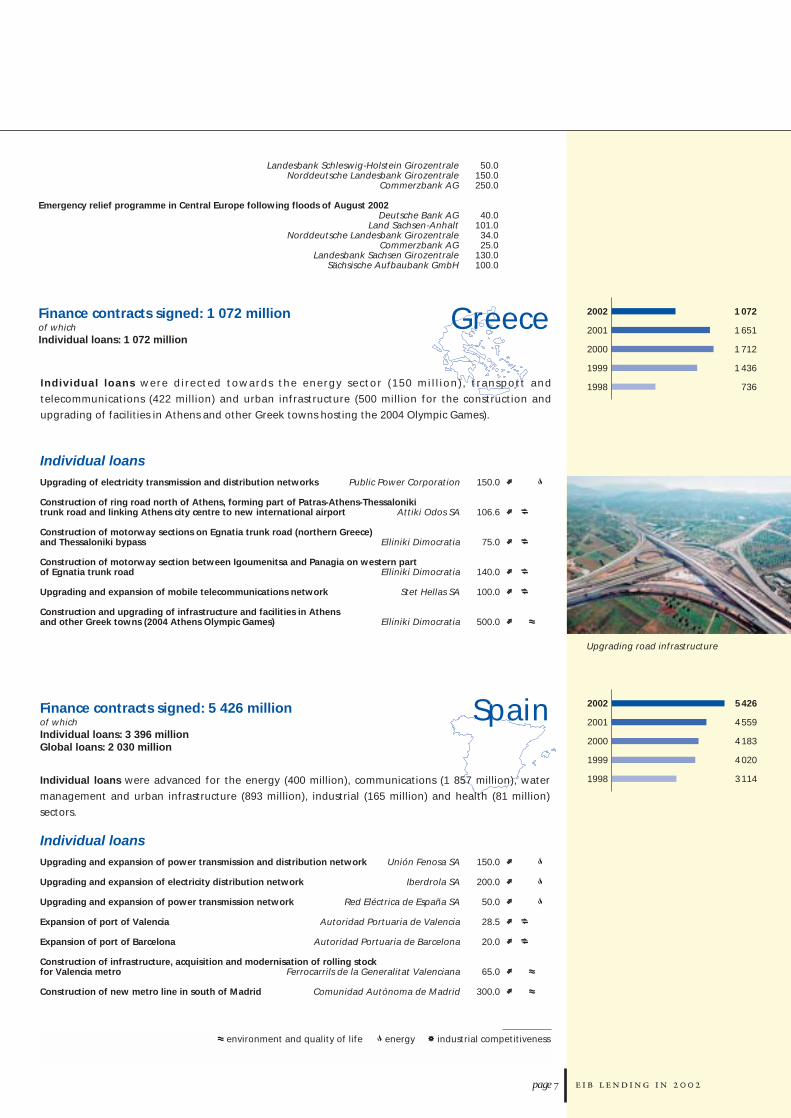
Upgrading road infrastructure
Individual loans Upgrading of electricity transmission and distribution networks Public Power Corporation
Construction of ring road north of Athens, forming part of Patras-Athens-Thessaloniki trunk road and linking Athens city centre to new international airport Attiki Odos SA
Construction of motorway sections on Egnatia trunk road (northern Greece) and Thessaloniki bypass Elliniki Dimocratia
Construction of motorway section between Igoumenitsa and Panagia on western part of Egnatia trunk road Elliniki Dimocratia
Upgrading and expansion of mobile telecommunications network Stet Hellas SA
Construction and upgrading of infrastructure and facilities in Athens and other Greek towns (2004 Athens Olympic Games) Elliniki Dimocratia
Landesbank Schleswig-Holstein GirozentraleNorddeutsche Landesbank Girozentrale
Commerzbank AG
Emergency relief programme in Central Europe following floods of August 2002 Deutsche Bank AG
Land Sachsen-AnhaltNorddeutsche Landesbank Girozentrale
Commerzbank AGLandesbank Sachsen Girozentrale
Sächsische Aufbaubank GmbH
Finance contracts signed: 5 426 million of which Individual loans: 3 396 million Global loans: 2 030 million
5 426
4 559
4 183
4 020
3 114
2002
2001
2000
1999
1998
Spain
Individual loans were advanced for the energy (400 million), communications (1 857 million), water
management and urban infrastructure (893 million), industrial (165 million) and health (81 million)
sectors.
Individual loans Upgrading and expansion of power transmission and distribution network Unión Fenosa SA
Upgrading and expansion of electricity distribution network Iberdrola SA
Upgrading and expansion of power transmission network Red Eléctrica de España SA
Expansion of port of Valencia Autoridad Portuaria de Valencia
Expansion of port of Barcelona Autoridad Portuaria de Barcelona
Construction of infrastructure, acquisition and modernisation of rolling stock for Valencia metro Ferrocarrils de la Generalitat Valenciana
Construction of new metro line in south of Madrid Comunidad Autónoma de Madrid
50.0150.0250.0
40.0101.034.025.0
130.0100.0
150.0
106.6
75.0
140.0
100.0
500.0
150.0
200.0
50.0
28.5
20.0
65.0
300.0
600.0
36.0
128.0
30.0
57.0
25.0
58.2
138.0
40.0
175.0
30.0
90.0
50.0
78.0
61.0
60.0
66.0
30.0
80.0
110.0
90.0
97.5
70.0
60.0
60.0
100.0
40.0
80.7
41.8
page
Modernisation and expansion of Madrid/Barajas airportEnte Público de Aeropuertos Españoles y Navegación Aérea
Modernisation of railway infrastructure and rolling stock Ferrocarriles de Vía Estrecha Feve
Renewal of passenger fleet Iberia Líneas Aéreas de España SA
Construction of motorway linking Madrid and Guadalajara to north east (Radial 2) and northern section of Madrid's outer ring road (M50) Infraestructuras y Radiales SA
Construction of final two sections of León-Burgos motorway between Osorno and Villanueva de Argaño (Autonomous Region of Castilla y León)
Comunidad Autónoma de Castilla y León
Extension of intermodal freight handling terminal in Barcelona port areaCentro Intermodal de Logística SA
Road and urban/interurban transport infrastructure schemes Gestió d'Infraestructures, S.A.
Construction of new tramway system in Tenerife (Canary Islands)Metropolitana de Tenerife SA
Upgrading of road and water infrastructure Comunidad Autónoma de Extremadura
Construction of motorway between Pamplona and LogroñoComunidad Autónoma de Navarra
Purchase and launch of telecommunications satellite Hispasat SA
Construction of broadband multimedia cable telecommunications network in Canary IslandsCabletelca SA
Construction of cable telecommunications network in Aragón region Aragón de Cable SA
Upgrading of water supply and wastewater treatment infrastructure in Valencia region Comunidad Autónoma Valenciana
Construction of waste processing facilities at various sites on island of Mallorca Tirme SA
Upgrading of water supply and wastewater treatment infrastructure in Seville area (Andalusia) Empresa Municipal de Abastecimiento y Saneamiento de Aguas de Sevilla
Construction of wastewater treatment facilities in Madrid region and rehabilitation of water reservoir in Madrid Canal de Isabel II
Co-financing of Andalusia's regional operational programme under 2000-2006 Community Support Framework Comunidad Autónoma de Andalucía
Co-financing of Cantabria's regional operational programme under 2000-2006Community Support Framework Gobierno de Cantabria
Co-financing of Asturias' regional operational programme under 2000-2006Community Support Framework Principado de Asturias
Urban infrastructure schemes in Besòs district of Barcelona Ayuntamiento de Barcelona
Modernisation and expansion of trade fair facilities in Valencia Feria Muestrario Internacional de Valencia
Urban infrastructure schemes in Madrid Ayuntamiento de Madrid
Urban infrastructure schemes in Valencia Ayuntamiento de Valencia
Rehabilitation and upgrading of urban infrastructure on Gran CanariaCabildo de Gran Canaria
Expansion of metal component plants throughout Spain Gestamp Automoción Sl
Renovation of several hotels located in historic buildings Paradores de Turismo de España SA
Expansion and modernisation of public university facilities in Madrid regionComunidad Autónoma de Madrid
Repair of infrastructure damaged by storm of November 2001Comunidad Autónoma de Las Islas Baleares
regional development human capital European communications infrastructure
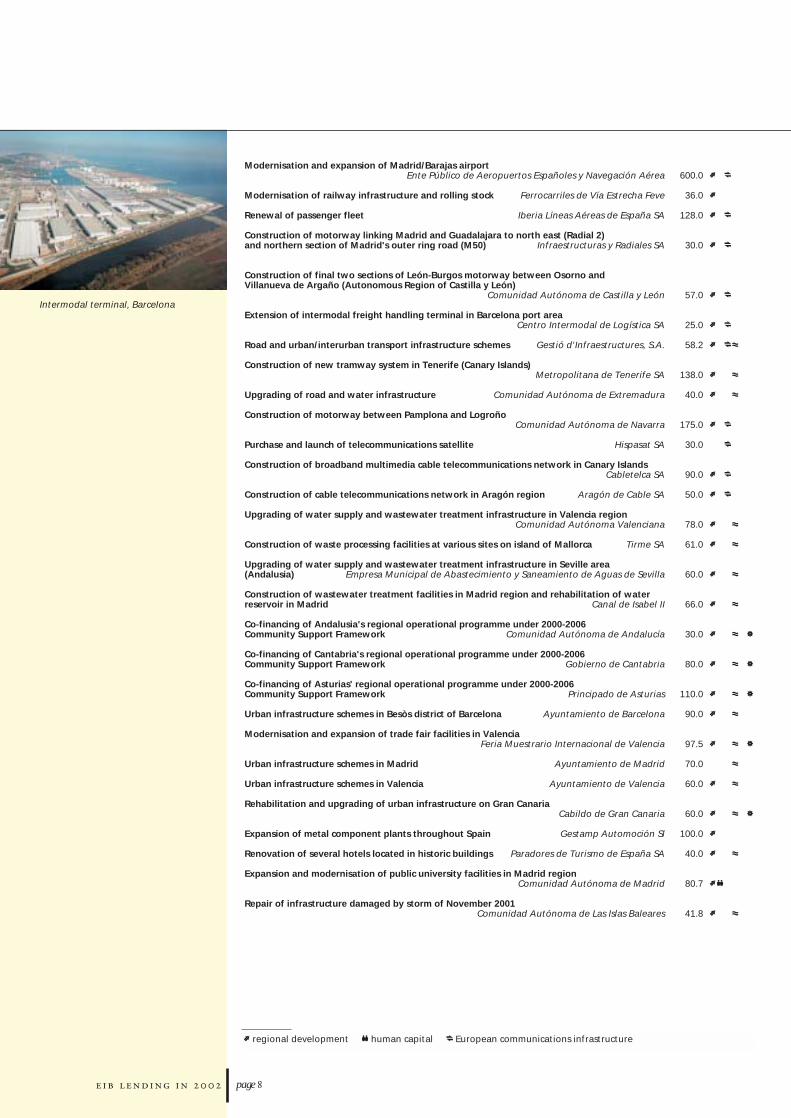
Intermodal terminal, Barcelona
page
Individual loans were provided for the transport sector (1 068 million), in particular the upgrading of
part of the French motorway network, industry and services (709 million) and waste management (62
million).
Finance contracts signed: 4 023 million of which Individual loans: 1 839 million Global loans: 2 184 million
4 023
3 825
3 279
4 284
2 799
2002
2001
2000
1999
1998
France
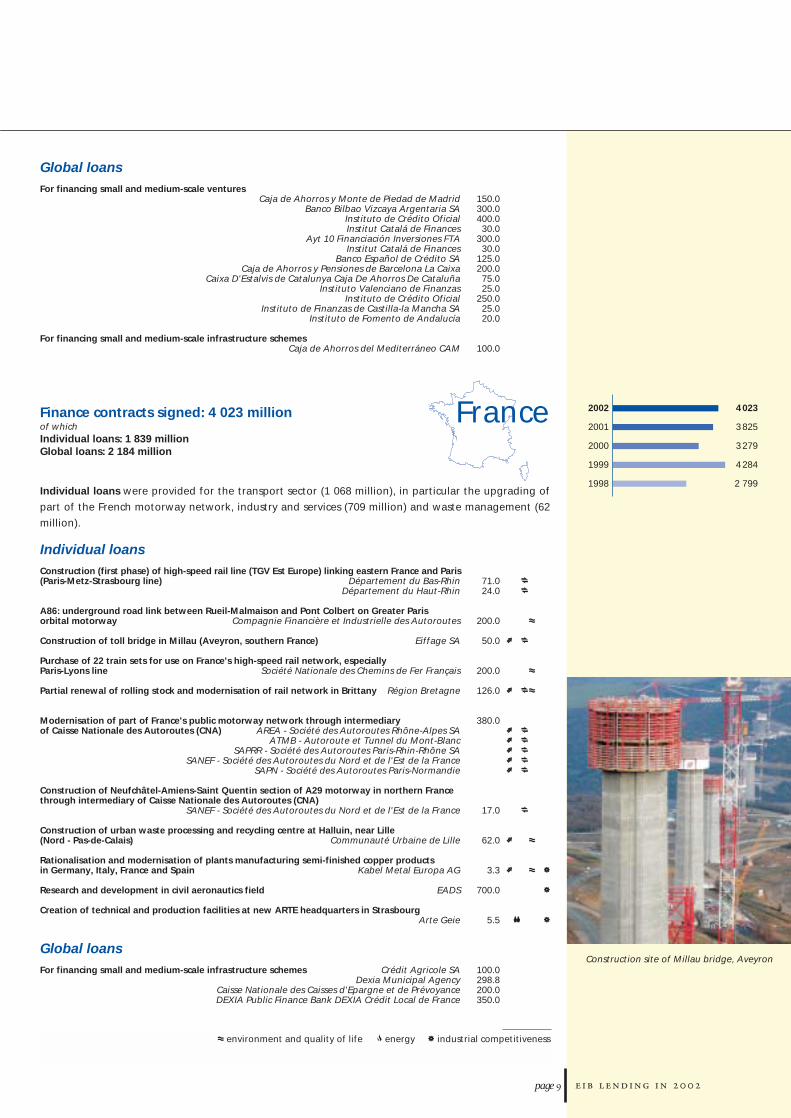
Construction site of Millau bridge, Aveyron
Global loans For financing small and medium-scale ventures
Caja de Ahorros y Monte de Piedad de MadridBanco Bilbao Vizcaya Argentaria SA
Instituto de Crédito OficialInstitut Catalá de Finances
Ayt 10 Financiación Inversiones FTAInstitut Catalá de Finances
Banco Español de Crédito SACaja de Ahorros y Pensiones de Barcelona La Caixa
Caixa D'Estalvis de Catalunya Caja De Ahorros De CataluñaInstituto Valenciano de Finanzas
Instituto de Crédito OficialInstituto de Finanzas de Castilla-la Mancha SA
Instituto de Fomento de Andalucía
For financing small and medium-scale infrastructure schemesCaja de Ahorros del Mediterráneo CAM
environment and quality of life energy industrial competitiveness
Individual loans Construction (first phase) of high-speed rail line (TGV Est Europe) linking eastern France and Paris (Paris-Metz-Strasbourg line) Département du Bas-Rhin
Département du Haut-Rhin
A86: underground road link between Rueil-Malmaison and Pont Colbert on Greater Paris orbital motorway Compagnie Financière et Industrielle des Autoroutes
Construction of toll bridge in Millau (Aveyron, southern France) Eiffage SA
Purchase of 22 train sets for use on France's high-speed rail network, especially Paris-Lyons line Société Nationale des Chemins de Fer Français
Partial renewal of rolling stock and modernisation of rail network in Brittany Région Bretagne
Modernisation of part of France's public motorway network through intermediary of Caisse Nationale des Autoroutes (CNA) AREA - Société des Autoroutes Rhône-Alpes SA
ATMB - Autoroute et Tunnel du Mont-BlancSAPRR - Société des Autoroutes Paris-Rhin-Rhône SA
SANEF - Société des Autoroutes du Nord et de l'Est de la FranceSAPN - Société des Autoroutes Paris-Normandie
Construction of Neufchâtel-Amiens-Saint Quentin section of A29 motorway in northern France through intermediary of Caisse Nationale des Autoroutes (CNA)
SANEF - Société des Autoroutes du Nord et de l'Est de la France
Construction of urban waste processing and recycling centre at Halluin, near Lille (Nord - Pas-de-Calais) Communauté Urbaine de Lille
Rationalisation and modernisation of plants manufacturing semi-finished copper products in Germany, Italy, France and Spain Kabel Metal Europa AG
Research and development in civil aeronautics field EADS
Creation of technical and production facilities at new ARTE headquarters in StrasbourgArte Geie
Global loans For financing small and medium-scale infrastructure schemes Crédit Agricole SA
Dexia Municipal AgencyCaisse Nationale des Caisses d'Epargne et de PrévoyanceDEXIA Public Finance Bank DEXIA Crédit Local de France
150.0300.0400.030.0
300.030.0
125.0200.075.025.0
250.025.020.0
100.0
71.024.0
200.0
50.0
200.0
126.0
380.0
17.0
62.0
3.3
700.0
5.5
100.0298.8200.0350.0
page
Finance contracts signed: 6 041 million of which
Individual loans: 3 496 million Global loans: 2 545 million
Italy 6 041
5 487
5 498
4 038
4 387
2002
2001
2000
1999
1998 Individual loans centred on energy (600 million), notably an investment programme for the renewable
energy sector, communications (1 714 million), water management and environmental infrastructure
(582 million), industry and services (600 million).
regional development human capital European communications infrastructure
Individual loans Investment programme for renewable energy sector Enel Green Power S.p.A.
Construction of two gas-fired combined-cycle heat and power plants, located near Ravenna (Emilia-Romagna) and Ferrera Erbognone, near Milan (Lombardy) Enipower S.p.A.
Upgrading of Milan's heat and power generating capacityAEM - Azienda Energetica Municipale AEM Milano
Construction of Milan-Bologna section of high-speed rail networkTreno Alta Velocitá - TAV S.p.A.
Acquisition of two high-speed ferries for northern Italy-Mezzogiorno routesGrandi Navi Veloci S.p.A.
Finance contracts signed: 400 million of which
Individual loans: 200 million Global loans: 200 million
Ireland
Individual loans were devoted to energy schemes (200 million).
Individual loans Upgrading and extension of power transmission and distribution networks
Electricity Supply Board
Global loans For financing small and medium-scale ventures Bank of Ireland
Allied Irish Banks p.l.c.
For financing small and medium-scale ventures promoted by SMEsBanque Fédérative du Crédit Mutuel
BNP ParibasSociété Générale
Caisse Interfédérale de Crédit MutuelCaisse Centrale de Crédit Coopératif
For financing small and medium-scale ventures promoted by SMEs through leasing and leasing finance operations Société Générale
BNP Paribas
For financing small-scale public amenities of regional or local benefit Caisse Nationale des Caisses d'Epargne et de Prévoyance
CDC Finance CDC Ixis
For financing SME ventures in agricultural, industrial and service sectors Caisse Nationale des Caisses d'Epargne et de Prévoyance
Public infrastructure rehabilitation programme following floods of September 2002 in south-east France DEXIA Public Finance Bank DEXIA Credit Local de France
400
525
412
62
248
2002
2001
2000
1999
1998
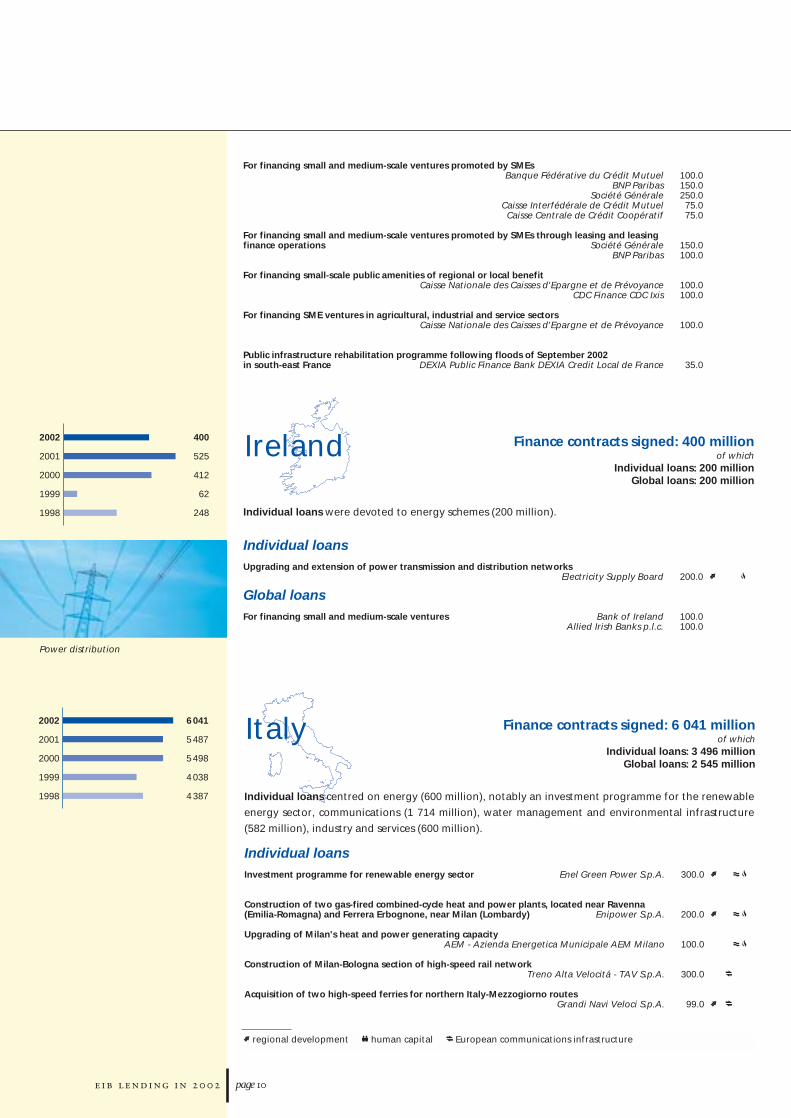
Power distribution
100.0150.0250.075.075.0
150.0100.0
100.0100.0
100.0
35.0
200.0
100.0100.0
300.0
200.0
100.0
300.0
99.0
page
Finance contracts signed: 74 million of which Individual loans: 74 million
74
10
200
105
101
2002
2001
2000
1999
1998
Luxembourg
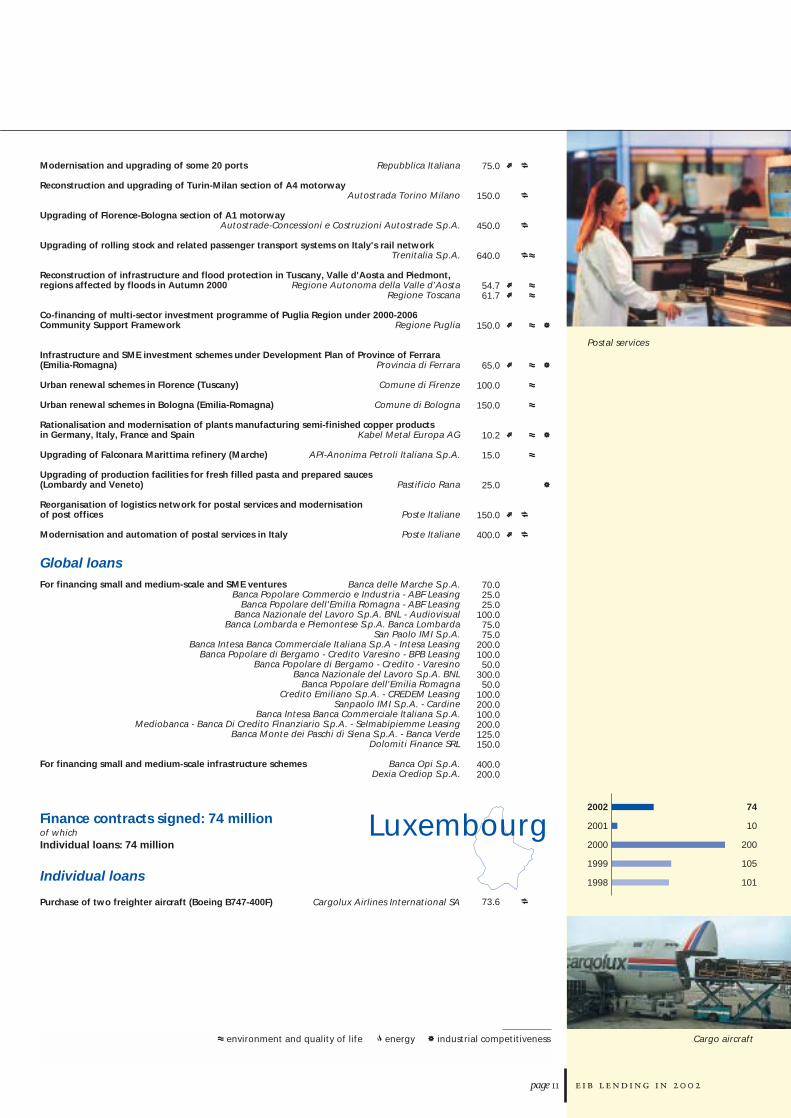
Postal services
Cargo aircraft environment and quality of life energy industrial competitiveness
Modernisation and upgrading of some 20 ports Repubblica Italiana
Reconstruction and upgrading of Turin-Milan section of A4 motorwayAutostrada Torino Milano
Upgrading of Florence-Bologna section of A1 motorwayAutostrade-Concessioni e Costruzioni Autostrade S.p.A.
Upgrading of rolling stock and related passenger transport systems on Italy's rail network Trenitalia S.p.A.
Reconstruction of infrastructure and flood protection in Tuscany, Valle d'Aosta and Piedmont, regions affected by floods in Autumn 2000 Regione Autonoma della Valle d'Aosta
Regione Toscana
Co-financing of multi-sector investment programme of Puglia Region under 2000-2006 Community Support Framework Regione Puglia
Infrastructure and SME investment schemes under Development Plan of Province of Ferrara (Emilia-Romagna) Provincia di Ferrara
Urban renewal schemes in Florence (Tuscany) Comune di Firenze
Urban renewal schemes in Bologna (Emilia-Romagna) Comune di Bologna
Rationalisation and modernisation of plants manufacturing semi-finished copper products in Germany, Italy, France and Spain Kabel Metal Europa AG
Upgrading of Falconara Marittima refinery (Marche) API-Anonima Petroli Italiana S.p.A.
Upgrading of production facilities for fresh filled pasta and prepared sauces (Lombardy and Veneto) Pastificio Rana
Reorganisation of logistics network for postal services and modernisation of post offices Poste Italiane
Modernisation and automation of postal services in Italy Poste Italiane
Global loans For financing small and medium-scale and SME ventures Banca delle Marche S.p.A.
Banca Popolare Commercio e Industria - ABF LeasingBanca Popolare dell'Emilia Romagna - ABF Leasing
Banca Nazionale del Lavoro S.p.A. BNL - AudiovisualBanca Lombarda e Piemontese S.p.A. Banca Lombarda
San Paolo IMI S.p.A.Banca Intesa Banca Commerciale Italiana S.p.A - Intesa Leasing
Banca Popolare di Bergamo - Credito Varesino - BPB LeasingBanca Popolare di Bergamo - Credito - Varesino
Banca Nazionale del Lavoro S.p.A. BNLBanca Popolare dell'Emilia Romagna
Credito Emiliano S.p.A. - CREDEM LeasingSanpaolo IMI S.p.A. - Cardine
Banca Intesa Banca Commerciale Italiana S.p.A.Mediobanca - Banca Di Credito Finanziario S.p.A. - Selmabipiemme Leasing
Banca Monte dei Paschi di Siena S.p.A. - Banca VerdeDolomiti Finance SRL
For financing small and medium-scale infrastructure schemes Banca Opi S.p.A.Dexia Crediop S.p.A.
Individual loans
Purchase of two freighter aircraft (Boeing B747-400F) Cargolux Airlines International SA
75.0
150.0
450.0
640.0
54.761.7
150.0
65.0
100.0
150.0
10.2
15.0
25.0
150.0
400.0
70.025.025.0
100.075.075.0
200.0100.050.0
300.050.0
100.0200.0100.0200.0125.0150.0
400.0200.0
73.6
page
regional development human capital European communications infrastructure
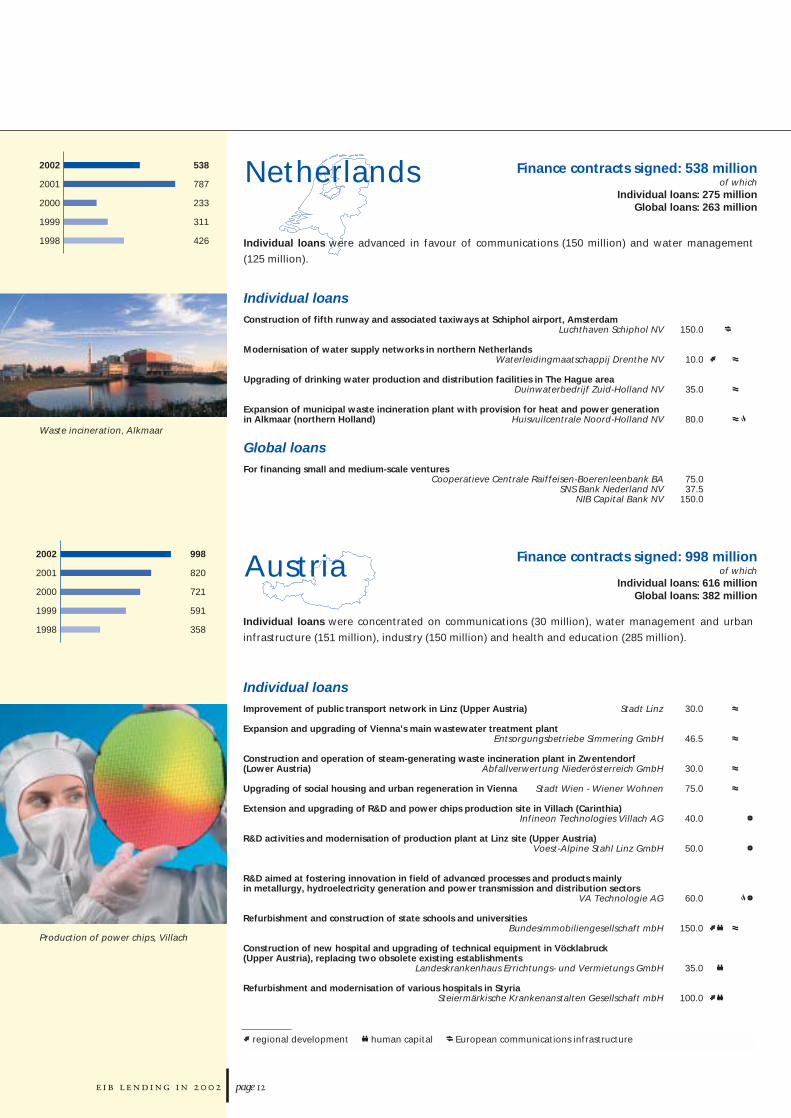
Finance contracts signed: 538 million of which
Individual loans: 275 million Global loans: 263 million
538
787
233
311
426
2002
2001
2000
1999
1998
Netherlands
Individual loans were advanced in favour of communications (150 million) and water management
(125 million).
Waste incineration, Alkmaar
Individual loans Construction of fifth runway and associated taxiways at Schiphol airport, Amsterdam
Luchthaven Schiphol NV
Modernisation of water supply networks in northern Netherlands Waterleidingmaatschappij Drenthe NV
Upgrading of drinking water production and distribution facilities in The Hague area Duinwaterbedrijf Zuid-Holland NV
Expansion of municipal waste incineration plant with provision for heat and power generation in Alkmaar (northern Holland) Huisvuilcentrale Noord-Holland NV
Global loans For financing small and medium-scale ventures
Cooperatieve Centrale Raiffeisen-Boerenleenbank BASNS Bank Nederland NV
NIB Capital Bank NV
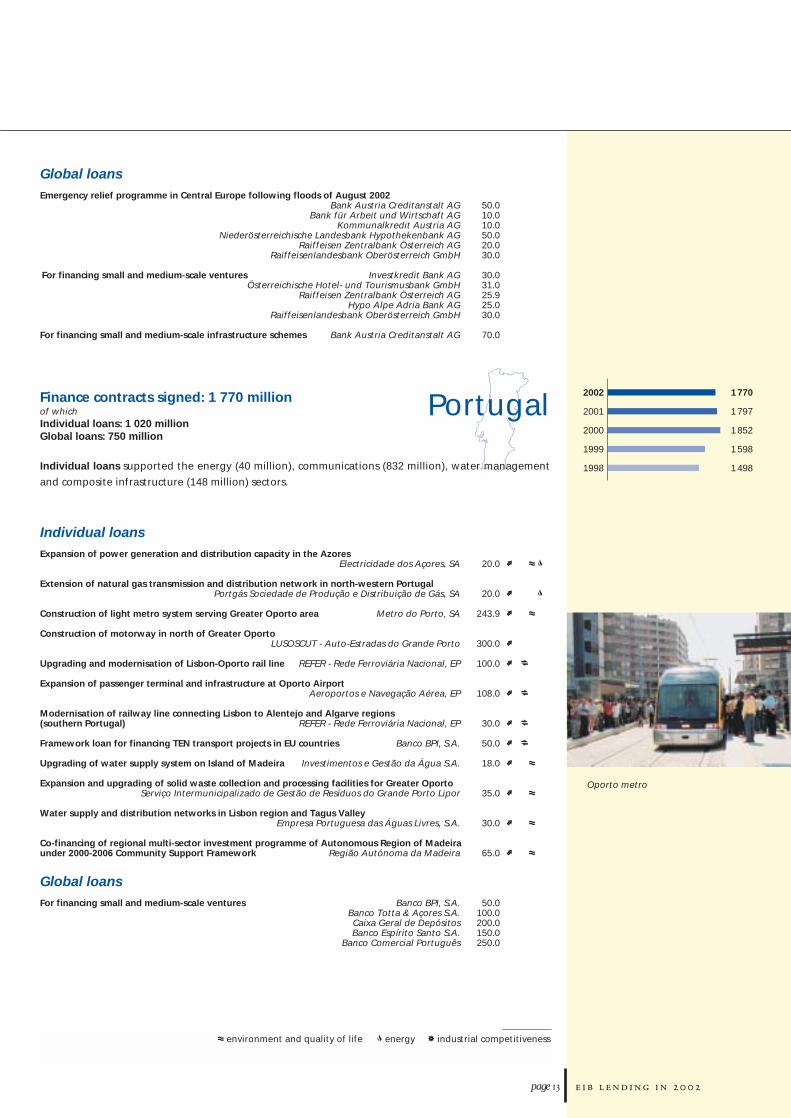
Finance contracts signed: 998 million of which
Individual loans: 616 million Global loans: 382 million
998
820
721
591
358
2002
2001
2000
1999
1998Individual loans were concentrated on communications (30 million), water management and urban
infrastructure (151 million), industry (150 million) and health and education (285 million).
Austria
Individual loans Improvement of public transport network in Linz (Upper Austria) Stadt Linz
Expansion and upgrading of Vienna's main wastewater treatment plant Entsorgungsbetriebe Simmering GmbH
Construction and operation of steam-generating waste incineration plant in Zwentendorf (Lower Austria) Abfallverwertung Niederösterreich GmbH
Upgrading of social housing and urban regeneration in Vienna Stadt Wien - Wiener Wohnen
Extension and upgrading of R&D and power chips production site in Villach (Carinthia) Infineon Technologies Villach AG
R&D activities and modernisation of production plant at Linz site (Upper Austria) Voest-Alpine Stahl Linz GmbH
R&D aimed at fostering innovation in field of advanced processes and products mainly in metallurgy, hydroelectricity generation and power transmission and distribution sectors
VA Technologie AG
Refurbishment and construction of state schools and universitiesBundesimmobiliengesellschaft mbH
Construction of new hospital and upgrading of technical equipment in Vöcklabruck (Upper Austria), replacing two obsolete existing establishments
Landeskrankenhaus Errichtungs- und Vermietungs GmbH
Refurbishment and modernisation of various hospitals in StyriaSteiermärkische Krankenanstalten Gesellschaft mbH
Production of power chips, Villach
150.0
10.0
35.0
80.0
75.037.5
150.0
30.0
46.5
30.0
75.0
40.0
50.0
60.0
150.0
35.0
100.0
page
environment and quality of life energy industrial competitiveness
Global loans Emergency relief programme in Central Europe following floods of August 2002
Bank Austria Creditanstalt AGBank für Arbeit und Wirtschaft AG
Kommunalkredit Austria AGNiederösterreichische Landesbank Hypothekenbank AG
Raiffeisen Zentralbank Österreich AGRaiffeisenlandesbank Oberösterreich GmbH
For financing small and medium-scale ventures Investkredit Bank AGÖsterreichische Hotel- und Tourismusbank GmbH
Raiffeisen Zentralbank Österreich AGHypo Alpe Adria Bank AG
Raiffeisenlandesbank Oberösterreich GmbH
For financing small and medium-scale infrastructure schemes Bank Austria Creditanstalt AG
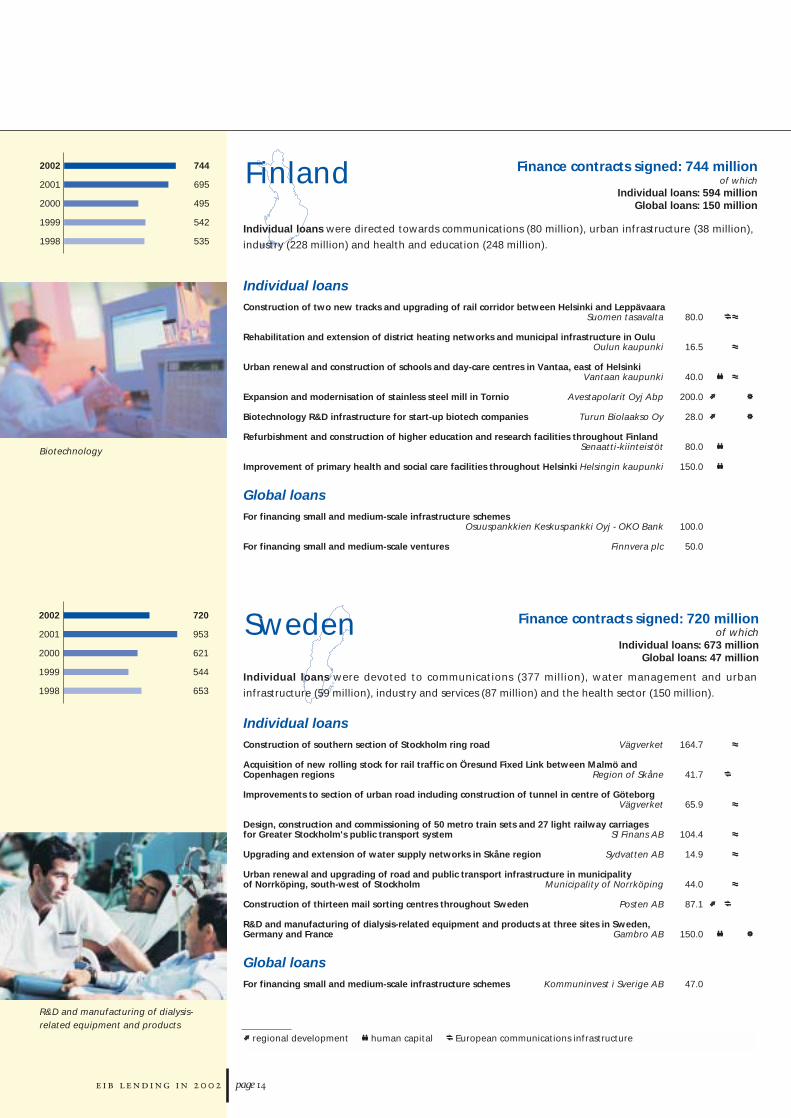
Finance contracts signed: 1 770 million of which Individual loans: 1 020 million Global loans: 750 million
1 770
1 797
1 852
1 598
1 498
2002
2001
2000
1999
1998Individual loans supported the energy (40 million), communications (832 million), water management
and composite infrastructure (148 million) sectors.
Portugal
Oporto metro
Individual loans Expansion of power generation and distribution capacity in the Azores
Electricidade dos Açores, SA
Extension of natural gas transmission and distribution network in north-western PortugalPortgás Sociedade de Produção e Distribuição de Gás, SA
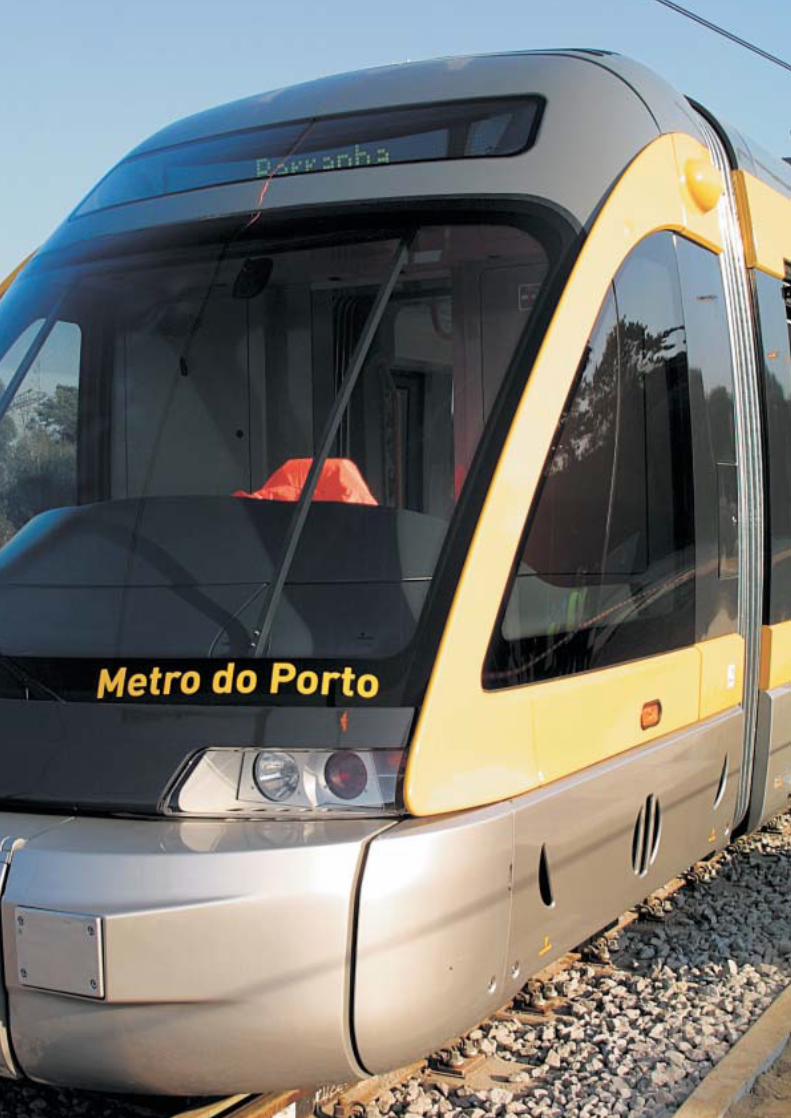
Construction of light metro system serving Greater Oporto area Metro do Porto, SA
Construction of motorway in north of Greater OportoLUSOSCUT - Auto-Estradas do Grande Porto
Upgrading and modernisation of Lisbon-Oporto rail line REFER - Rede Ferroviária Nacional, EP
Expansion of passenger terminal and infrastructure at Oporto AirportAeroportos e Navegação Aérea, EP
Modernisation of railway line connecting Lisbon to Alentejo and Algarve regions (southern Portugal) REFER - Rede Ferroviária Nacional, EP
Framework loan for financing TEN transport projects in EU countries Banco BPI, S.A.
Upgrading of water supply system on Island of Madeira Investimentos e Gestão da Água S.A.
Expansion and upgrading of solid waste collection and processing facilities for Greater Oporto Serviço Intermunicipalizado de Gestão de Resíduos do Grande Porto Lipor
Water supply and distribution networks in Lisbon region and Tagus Valley Empresa Portuguesa das Águas Livres, S.A.
Co-financing of regional multi-sector investment programme of Autonomous Region of Madeira under 2000-2006 Community Support Framework Região Autónoma da Madeira
Global loans For financing small and medium-scale ventures Banco BPI, S.A.
Banco Totta & Açores S.A.Caixa Geral de DepósitosBanco Espírito Santo S.A.
Banco Comercial Português
50.010.010.050.020.030.0
30.031.025.925.030.0
70.0
20.0
20.0
243.9
300.0
100.0
108.0
30.0
50.0
18.0
35.0
30.0
65.0
50.0100.0200.0150.0250.0
page
regional development human capital European communications infrastructure
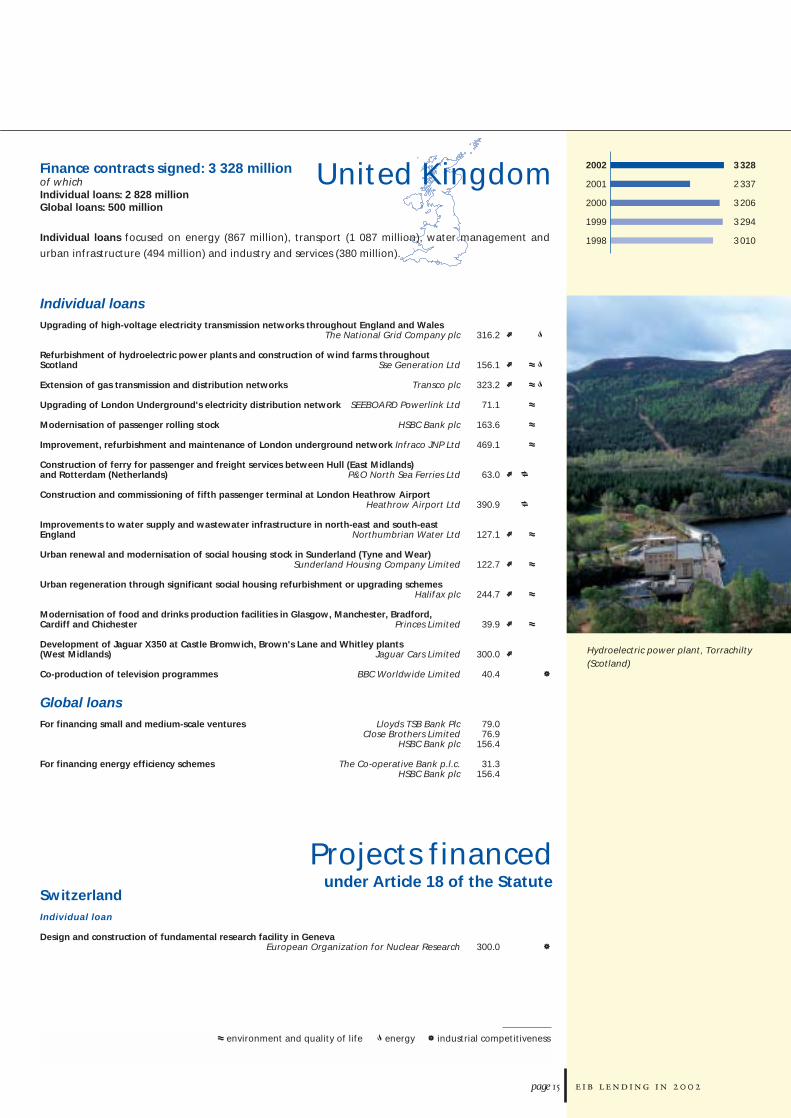
Finance contracts signed: 720 million of which
Individual loans: 673 million Global loans: 47 million
720
953
621
544
653
2002
2001
2000
1999
1998
Sweden
Individual loans were devoted to communications (377 million), water management and urban
infrastructure (59 million), industry and services (87 million) and the health sector (150 million).
Individual loans Construction of southern section of Stockholm ring road Vägverket
Acquisition of new rolling stock for rail traffic on Öresund Fixed Link between Malmö and Copenhagen regions Region of Skåne
Improvements to section of urban road including construction of tunnel in centre of Göteborg Vägverket
Design, construction and commissioning of 50 metro train sets and 27 light railway carriages for Greater Stockholm's public transport system Sl Finans AB
Upgrading and extension of water supply networks in Skåne region Sydvatten AB
Urban renewal and upgrading of road and public transport infrastructure in municipality of Norrköping, south-west of Stockholm Municipality of Norrköping
Construction of thirteen mail sorting centres throughout Sweden Posten AB
R&D and manufacturing of dialysis-related equipment and products at three sites in Sweden, Germany and France Gambro AB
Global loans For financing small and medium-scale infrastructure schemes Kommuninvest i Sverige AB
744
695
495
542
535
2002
2001
2000
1999
1998
Finance contracts signed: 744 million of which
Individual loans: 594 million Global loans: 150 million
Individual loans were directed towards communications (80 million), urban infrastructure (38 million),
industry (228 million) and health and education (248 million).
Finland
Biotechnology
R&D and manufacturing of dialysis-related equipment and products
Individual loans Construction of two new tracks and upgrading of rail corridor between Helsinki and Leppävaara
Suomen tasavalta
Rehabilitation and extension of district heating networks and municipal infrastructure in Oulu Oulun kaupunki
Urban renewal and construction of schools and day-care centres in Vantaa, east of HelsinkiVantaan kaupunki
Expansion and modernisation of stainless steel mill in Tornio Avestapolarit Oyj Abp
Biotechnology R&D infrastructure for start-up biotech companies Turun Biolaakso Oy
Refurbishment and construction of higher education and research facilities throughout Finland Senaatti-kiinteistöt
Improvement of primary health and social care facilities throughout Helsinki Helsingin kaupunki
Global loans For financing small and medium-scale infrastructure schemes
Osuuspankkien Keskuspankki Oyj - OKO Bank
For financing small and medium-scale ventures Finnvera plc
80.0
16.5
40.0
200.0
28.0
80.0
150.0
100.0
50.0
164.7
41.7
65.9
104.4
14.9
44.0
87.1
150.0
47.0
page
environment and quality of life energy industrial competitiveness
Finance contracts signed: 3 328 million of which Individual loans: 2 828 million Global loans: 500 million
3 328
2 337
3 206
3 294
3 010
2002
2001
2000
1999
1998Individual loans focused on energy (867 million), transport (1 087 million), water management and
urban infrastructure (494 million) and industry and services (380 million).
United Kingdom
Hydroelectric power plant, Torrachilty(Scotland)
Individual loans Upgrading of high-voltage electricity transmission networks throughout England and Wales
The National Grid Company plc
Refurbishment of hydroelectric power plants and construction of wind farms throughout Scotland Sse Generation Ltd
Extension of gas transmission and distribution networks Transco plc
Upgrading of London Underground's electricity distribution network SEEBOARD Powerlink Ltd
Modernisation of passenger rolling stock HSBC Bank plc
Improvement, refurbishment and maintenance of London underground network Infraco JNP Ltd
Construction of ferry for passenger and freight services between Hull (East Midlands) and Rotterdam (Netherlands) P&O North Sea Ferries Ltd
Construction and commissioning of fifth passenger terminal at London Heathrow Airport Heathrow Airport Ltd
Improvements to water supply and wastewater infrastructure in north-east and south-east England Northumbrian Water Ltd
Urban renewal and modernisation of social housing stock in Sunderland (Tyne and Wear) Sunderland Housing Company Limited
Urban regeneration through significant social housing refurbishment or upgrading schemes Halifax plc
Modernisation of food and drinks production facilities in Glasgow, Manchester, Bradford, Cardiff and Chichester Princes Limited
Development of Jaguar X350 at Castle Bromwich, Brown's Lane and Whitley plants (West Midlands) Jaguar Cars Limited
Co-production of television programmes BBC Worldwide Limited
Global loans For financing small and medium-scale ventures Lloyds TSB Bank Plc
Close Brothers LimitedHSBC Bank plc
For financing energy efficiency schemes The Co-operative Bank p.l.c.HSBC Bank plc
Projects financed under Article 18 of the Statute
Switzerland Individual loan
Design and construction of fundamental research facility in GenevaEuropean Organization for Nuclear Research
316.2
156.1
323.2
71.1
163.6
469.1
63.0
390.9
127.1
122.7
244.7
39.9
300.0
40.4
79.076.9
156.4
31.3156.4
300.0
Central EuropePoland
Modernisation of combined heat and power plant in Swiecie, northern Poland BRE Bank SA
Construction of urban expressway in Katowice region (southern Poland) Republic of Poland
Construction of second passenger terminal at Warsaw International AirportPrzedsiebiorstwo Panstwowe "Porty Lotnicze" PPL
Construction of 16 bypasses around towns and villages located along roads of national and international importance Republic of Poland
Construction and renovation of social housing throughout country Bank Gospodarstwa Krajowego
Improvements to urban environment and social housing City of Poznan
Financing for small and medium-scale ventures Bank Polska Kasa Opieki SABRE Bank SA
Raiffeisen Bank Polska S.A.Raiffeisen-Leasing Polska S.A.
Czech Republic
Extension of Prague metro network Municipality of Prague
Construction of bypass around , missing link of D5 motorway corridor between Prague and Nuremberg Czech Republic
Schemes to mitigate flood risk in four river basins (Ohre, Elbe, Oder and Morava) Czech Republic
Emergency relief programme in Central Europe following floods of August 2002 Czech Republic
Construction of manufacturing facility for refrigerators and freezers in Podborany, west of PragueConta Podborany s.r.o.
Upgrading of facilities at Masaryk University in Brno Czech Republic
Financing for small and medium-scale ventures VB Leasing spol. s.r.o.Volksbank Cz a,s
page
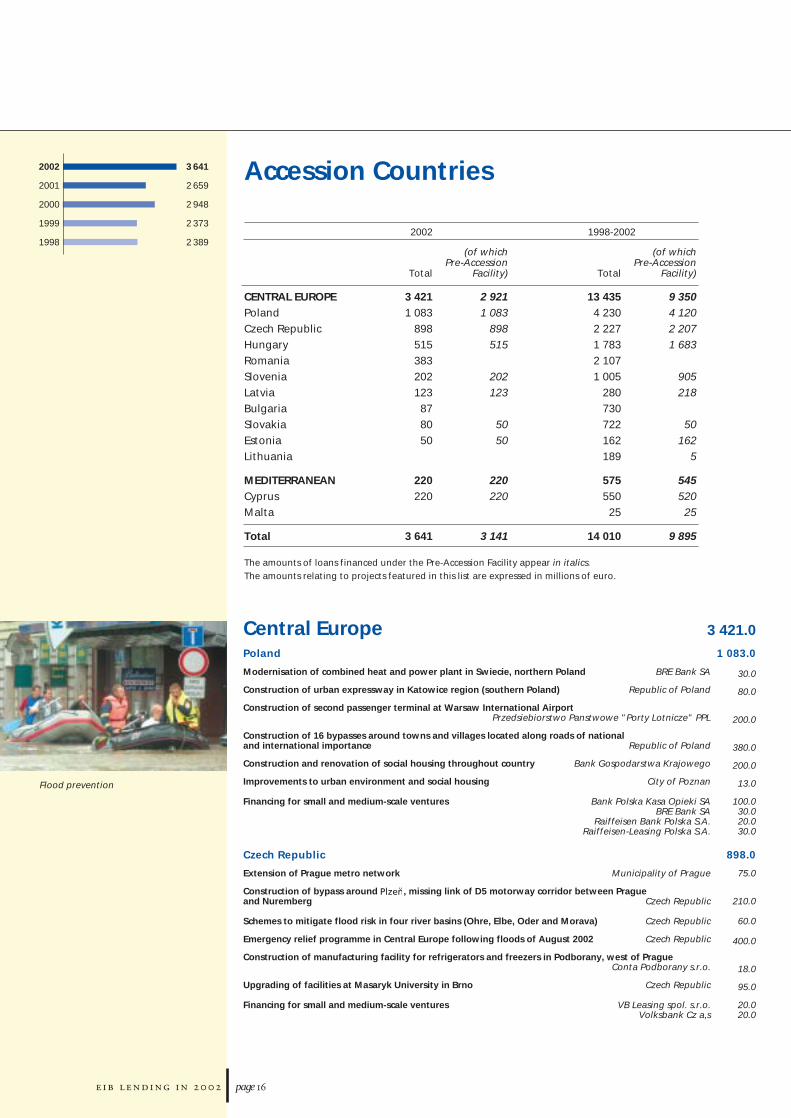
Accession Countries 3 641
2 659
2 948
2 373
2 389
2002
2001
2000
1999
19982002 1998-2002
(of which (of which Pre-Accession Pre-Accession
Total Facility) Total Facility)
CENTRAL EUROPEPolandCzech RepublicHungaryRomaniaSloveniaLatviaBulgariaSlovakiaEstoniaLithuania
MEDITERRANEAN CyprusMalta
Total
The amounts of loans financed under the Pre-Accession Facility appear in italics.The amounts relating to projects featured in this list are expressed in millions of euro.
Flood prevention
3 421 2 921 13 435 9 3501 083 1 083 4 230 4 120
898 898 2 227 2 207515 515 1 783 1 683383 2 107202 202 1 005 905123 123 280 21887 73080 50 722 5050 50 162 162
189 5
220 220 575 545220 220 550 520
25 25
3 641 3 141 14 010 9 895
3 421.0
1 083.0
30.0
80.0
200.0
380.0
200.0
13.0
100.030.020.030.0
898.0
75.0
210.0
60.0
400.0
18.0
95.0
20.020.0
515.0
110.0
40.0
75.0
80.0
90.0
50.070.0
383.0
38.0
240.0
55.0
17.06.0
27.0
202.0
120.0
52.0
20.0
10.0
123.0
80.0
33.0
10.0
87.0
60.0
17.0
10.0
80.0
30.0
50.0
50.0
30.0
20.0
220.0220.0
100.0
55.0
65.0
page
Hungary
Investment schemes in transport, health and education sectors, as well as urban regeneration in Budapest Municipality of Budapest
Modernisation of part of Budapest-Cegled-Szolnok-Lökösháza railway line (Corridor IV)Republic of Hungary
Repair and upgrading of 430 km of national roads under national road rehabilitation programme Republic of Hungary
Rehabilitation and extension of several regional waste management systems and wastewater treatment facilities throughout Hungary Republic of Hungary
Investment schemes in transport, health and education sectors, as well as urban regeneration in Budapest Municipality of Budapest
Financing for small and medium-scale ventures Central European International Bank LtdKereskedelmi és Hitelbank Rt.
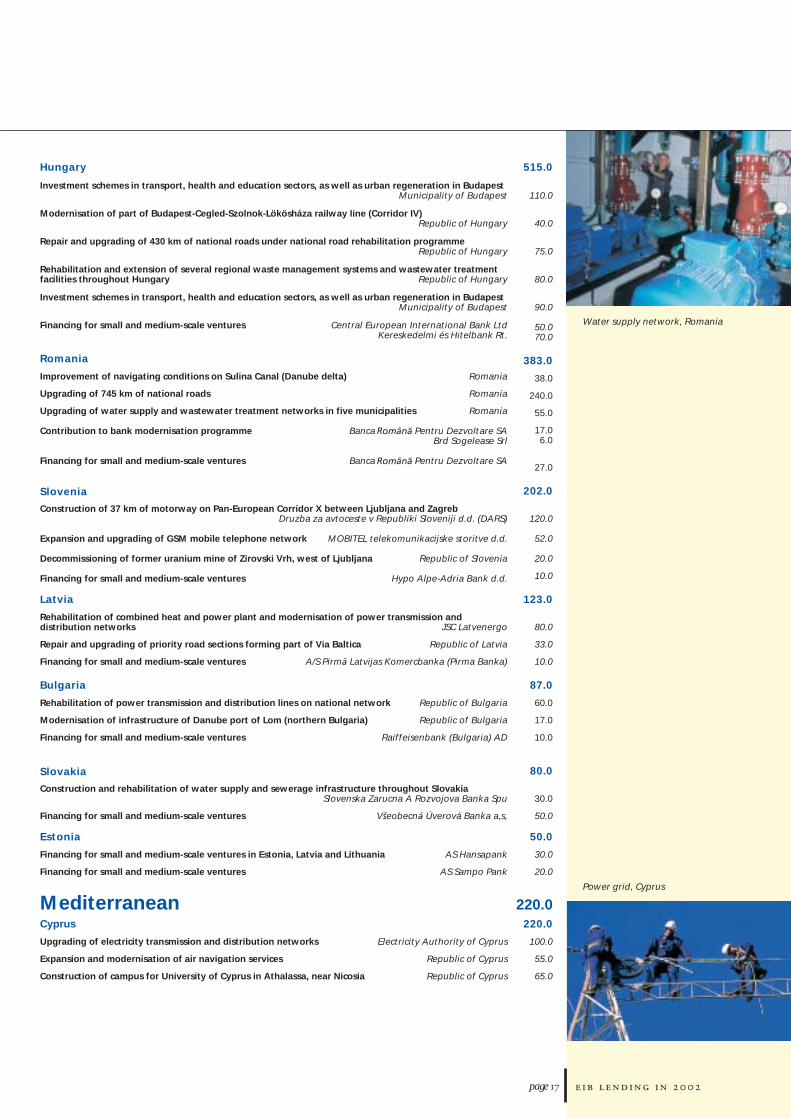
Romania
Improvement of navigating conditions on Sulina Canal (Danube delta) Romania
Upgrading of 745 km of national roads Romania
Upgrading of water supply and wastewater treatment networks in five municipalities Romania
Contribution to bank modernisation programme Banca Pentru Dezvoltare SABrd Sogelease Srl
Financing for small and medium-scale ventures Banca Pentru Dezvoltare SA
Slovenia
Construction of 37 km of motorway on Pan-European Corridor X between Ljubljana and Zagreb Druzba za avtoceste v Republiki Sloveniji d.d. (DARS)
Expansion and upgrading of GSM mobile telephone network MOBITEL telekomunikacijske storitve d.d.
Decommissioning of former uranium mine of Zirovski Vrh, west of Ljubljana Republic of Slovenia
Financing for small and medium-scale ventures Hypo Alpe-Adria Bank d.d.
Latvia
Rehabilitation of combined heat and power plant and modernisation of power transmission and distribution networks JSC Latvenergo
Repair and upgrading of priority road sections forming part of Via Baltica Republic of Latvia
Financing for small and medium-scale ventures A/S Pirmā Latvijas Komercbanka (Pirma Banka)
Bulgaria
Rehabilitation of power transmission and distribution lines on national network Republic of Bulgaria
Modernisation of infrastructure of Danube port of Lom (northern Bulgaria) Republic of Bulgaria
Financing for small and medium-scale ventures Raiffeisenbank (Bulgaria) AD
Slovakia
Construction and rehabilitation of water supply and sewerage infrastructure throughout Slovakia Slovenska Zarucna A Rozvojova Banka Spu
Financing for small and medium-scale ventures Všeobecná Úverová Banka a,s,
Estonia
Financing for small and medium-scale ventures in Estonia, Latvia and Lithuania AS Hansapank
Financing for small and medium-scale ventures AS Sampo Pank
MediterraneanCyprus
Upgrading of electricity transmission and distribution networks Electricity Authority of Cyprus
Expansion and modernisation of air navigation services Republic of Cyprus
Construction of campus for University of Cyprus in Athalassa, near Nicosia Republic of Cyprus
Power grid, Cyprus
Water supply network, Romania
page
Partner Countries 2002 1998-2002
of which of which budgetary budgetary
Total resources Total resources
Euro-Mediterranean Partnership CountriesACP/OCTSouth AfricaAsia and Latin AmericaBalkans
Total
In the following list, loans from own resources are indicated by ❖ , and financing operations from budgetary resources, in the form of either a conditional loan or anequity participation, by ◗.
The amounts relating to projects featured in this list are expressed in millions of euro.
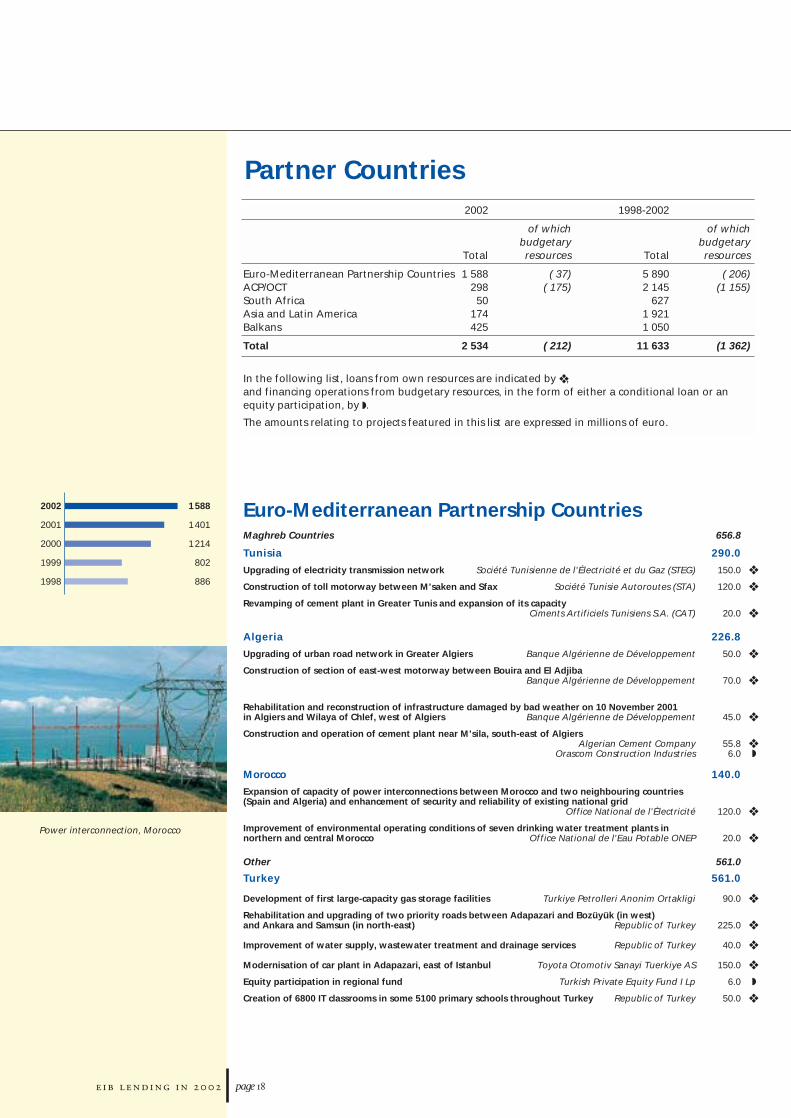
1 588
1 401
1 214
802
886
2002
2001
2000
1999
1998
Power interconnection, Morocco
Euro-Mediterranean Partnership Countries Maghreb Countries
Tunisia
Upgrading of electricity transmission network Société Tunisienne de l'Électricité et du Gaz (STEG)
Construction of toll motorway between M'saken and Sfax Société Tunisie Autoroutes (STA)
Revamping of cement plant in Greater Tunis and expansion of its capacity Ciments Artificiels Tunisiens S.A. (CAT)
Algeria
Upgrading of urban road network in Greater Algiers Banque Algérienne de Développement
Construction of section of east-west motorway between Bouira and El AdjibaBanque Algérienne de Développement
Rehabilitation and reconstruction of infrastructure damaged by bad weather on 10 November 2001 in Algiers and Wilaya of Chlef, west of Algiers Banque Algérienne de Développement
Construction and operation of cement plant near M'sila, south-east of Algiers Algerian Cement Company
Orascom Construction Industries
Morocco
Expansion of capacity of power interconnections between Morocco and two neighbouring countries (Spain and Algeria) and enhancement of security and reliability of existing national grid
Office National de l'Électricité
Improvement of environmental operating conditions of seven drinking water treatment plants in northern and central Morocco Office National de l'Eau Potable ONEP
Other
Turkey
Development of first large-capacity gas storage facilities Turkiye Petrolleri Anonim Ortakligi
Rehabilitation and upgrading of two priority roads between Adapazari and Bozüyük (in west) and Ankara and Samsun (in north-east) Republic of Turkey
Improvement of water supply, wastewater treatment and drainage services Republic of Turkey
Modernisation of car plant in Adapazari, east of Istanbul Toyota Otomotiv Sanayi Tuerkiye AS
Equity participation in regional fund Turkish Private Equity Fund I Lp
Creation of 6800 IT classrooms in some 5100 primary schools throughout Turkey Republic of Turkey
1 588 ( 37) 5 890 ( 206)298 ( 175) 2 145 (1 155)50 627
174 1 921425 1 050
2 534 ( 212) 11 633 (1 362)
656.8
290.0
150.0 ❖
120.0 ❖
20.0 ❖
226.8
50.0 ❖
70.0 ❖
45.0 ❖
55.8 ❖6.0 ◗
140.0
120.0 ❖
20.0 ❖
561.0
561.0
90.0 ❖
225.0 ❖
40.0 ❖
150.0 ❖
6.0 ◗
50.0 ❖
page
298
520
411
346
570
2002
2001
2000
1999
1998
Flour mill, Mauritania
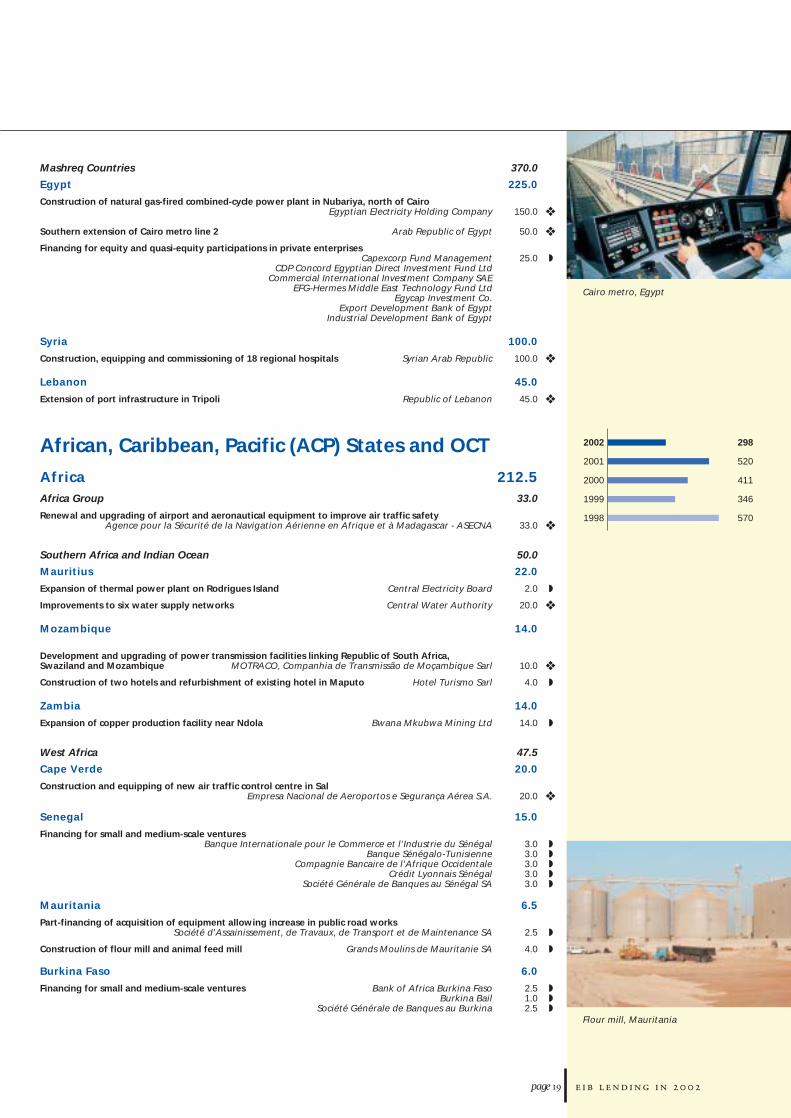
Cairo metro, Egypt
Mashreq Countries
Egypt
Construction of natural gas-fired combined-cycle power plant in Nubariya, north of CairoEgyptian Electricity Holding Company
Southern extension of Cairo metro line 2 Arab Republic of Egypt
Financing for equity and quasi-equity participations in private enterprisesCapexcorp Fund Management
CDP Concord Egyptian Direct Investment Fund LtdCommercial International Investment Company SAE
EFG-Hermes Middle East Technology Fund LtdEgycap Investment Co.
Export Development Bank of EgyptIndustrial Development Bank of Egypt
Syria
Construction, equipping and commissioning of 18 regional hospitals Syrian Arab Republic
Lebanon
Extension of port infrastructure in Tripoli Republic of Lebanon
African, Caribbean, Pacific (ACP) States and OCT
AfricaAfrica Group
Renewal and upgrading of airport and aeronautical equipment to improve air traffic safetyAgence pour la Sécurité de la Navigation Aérienne en Afrique et à Madagascar - ASECNA
Southern Africa and Indian Ocean
Mauritius
Expansion of thermal power plant on Rodrigues Island Central Electricity Board
Improvements to six water supply networks Central Water Authority
Mozambique
Development and upgrading of power transmission facilities linking Republic of South Africa, Swaziland and Mozambique MOTRACO, Companhia de Transmissão de Moçambique Sarl
Construction of two hotels and refurbishment of existing hotel in Maputo Hotel Turismo Sarl
Zambia
Expansion of copper production facility near Ndola Bwana Mkubwa Mining Ltd
West Africa
Cape Verde
Construction and equipping of new air traffic control centre in Sal Empresa Nacional de Aeroportos e Segurança Aérea S.A.
Senegal
Financing for small and medium-scale venturesBanque Internationale pour le Commerce et l'Industrie du Sénégal
Banque Sénégalo-TunisienneCompagnie Bancaire de l'Afrique Occidentale
Crédit Lyonnais SénégalSociété Générale de Banques au Sénégal SA
Mauritania
Part-financing of acquisition of equipment allowing increase in public road works Société d'Assainissement, de Travaux, de Transport et de Maintenance SA
Construction of flour mill and animal feed mill Grands Moulins de Mauritanie SA
Burkina Faso
Financing for small and medium-scale ventures Bank of Africa Burkina FasoBurkina Bail
Société Générale de Banques au Burkina
370.0
225.0
150.0 ❖
50.0 ❖
25.0 ◗
100.0
100.0 ❖
45.0
45.0 ❖
212.533.0
33.0 ❖
50.0
22.0
2.0 ◗
20.0 ❖
14.0
10.0 ❖
4.0 ◗
14.0
14.0 ◗
47.5
20.0
20.0 ❖
15.0
3.0 ◗3.0 ◗3.0 ◗3.0 ◗3.0 ◗
6.5
2.5 ◗
4.0 ◗
6.0
2.5 ◗1.0 ◗2.5 ◗
page
50
150
140
152
135
2002
2001
2000
1999
1998
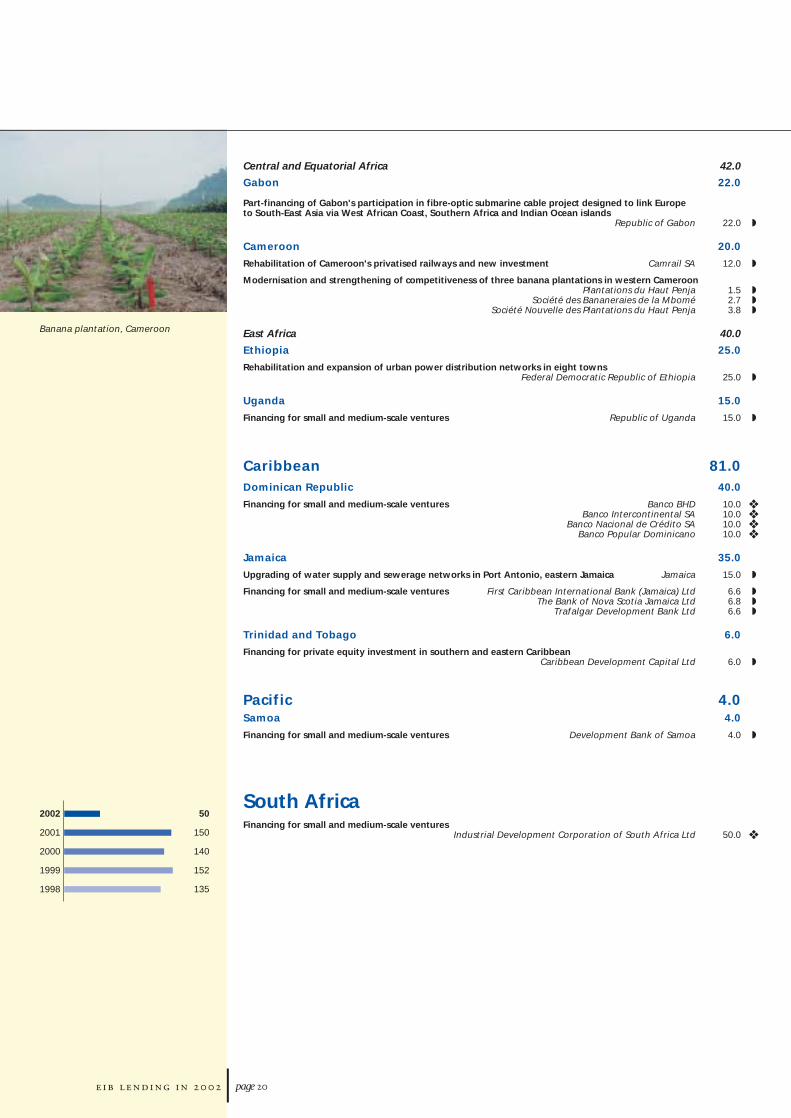
Banana plantation, Cameroon
Central and Equatorial Africa
Gabon
Part-financing of Gabon's participation in fibre-optic submarine cable project designed to link Europe to South-East Asia via West African Coast, Southern Africa and Indian Ocean islands
Republic of Gabon
Cameroon
Rehabilitation of Cameroon's privatised railways and new investment Camrail SA
Modernisation and strengthening of competitiveness of three banana plantations in western CameroonPlantations du Haut Penja
Société des Bananeraies de la MboméSociété Nouvelle des Plantations du Haut Penja
East Africa
Ethiopia
Rehabilitation and expansion of urban power distribution networks in eight townsFederal Democratic Republic of Ethiopia
Uganda
Financing for small and medium-scale ventures Republic of Uganda
CaribbeanDominican Republic
Financing for small and medium-scale ventures Banco BHDBanco Intercontinental SA
Banco Nacional de Crédito SABanco Popular Dominicano
Jamaica
Upgrading of water supply and sewerage networks in Port Antonio, eastern Jamaica Jamaica
Financing for small and medium-scale ventures First Caribbean International Bank (Jamaica) LtdThe Bank of Nova Scotia Jamaica Ltd
Trafalgar Development Bank Ltd
Trinidad and Tobago
Financing for private equity investment in southern and eastern CaribbeanCaribbean Development Capital Ltd
PacificSamoa
Financing for small and medium-scale ventures Development Bank of Samoa
South AfricaFinancing for small and medium-scale ventures
Industrial Development Corporation of South Africa Ltd
42.0
22.0
22.0 ◗
20.0
12.0 ◗
1.5 ◗2.7 ◗3.8 ◗
40.0
25.0
25.0 ◗
15.0
15.0 ◗
81.040.0
10.0 ❖10.0 ❖10.0 ❖10.0 ❖
35.0
15.0 ◗
6.6 ◗6.8 ◗6.6 ◗
6.0
6.0 ◗
4.04.0
4.0 ◗
50.0 ❖
page
174
543
532
310
362
2002
2001
2000
1999
1998
425
319
154
60
92
2002
2001
2000
1999
1998
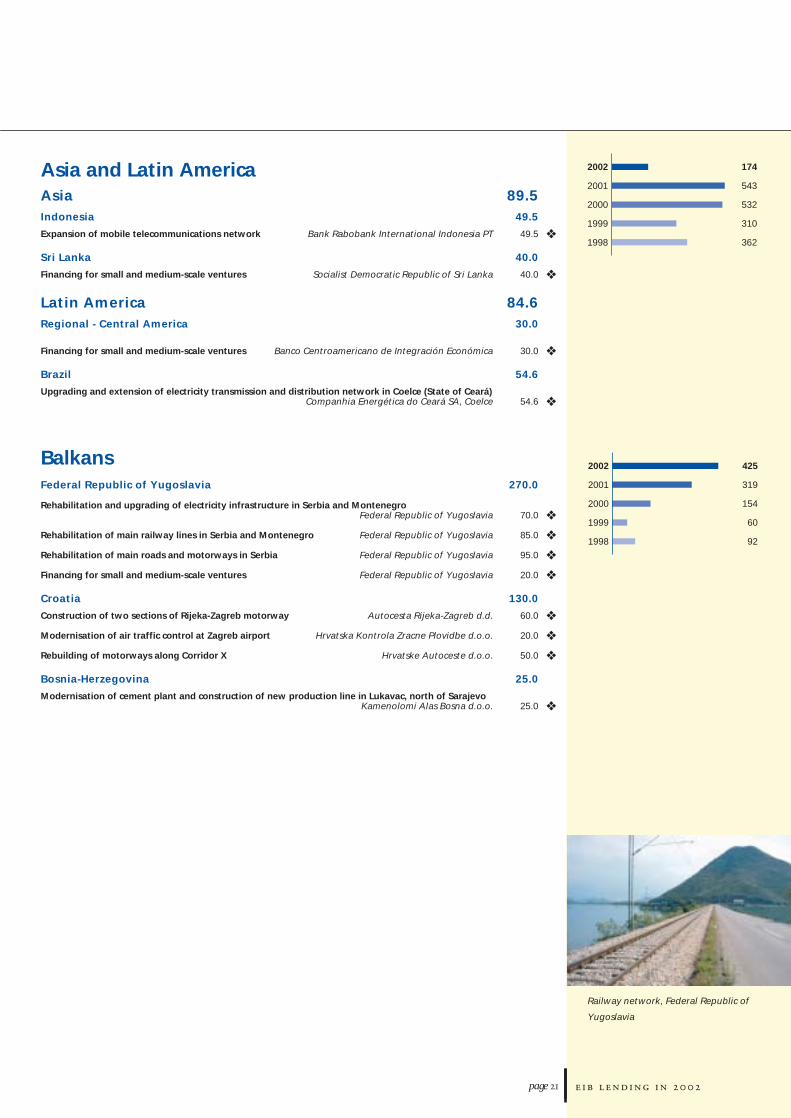
Railway network, Federal Republic of
Yugoslavia
Asia and Latin AmericaAsiaIndonesia
Expansion of mobile telecommunications network Bank Rabobank International Indonesia PT
Sri Lanka
Financing for small and medium-scale ventures Socialist Democratic Republic of Sri Lanka
Latin AmericaRegional - Central America
Financing for small and medium-scale ventures Banco Centroamericano de Integración Económica
Brazil
Upgrading and extension of electricity transmission and distribution network in Coelce (State of Ceará) Companhia Energética do Ceará SA, Coelce
BalkansFederal Republic of Yugoslavia
Rehabilitation and upgrading of electricity infrastructure in Serbia and MontenegroFederal Republic of Yugoslavia
Rehabilitation of main railway lines in Serbia and Montenegro Federal Republic of Yugoslavia
Rehabilitation of main roads and motorways in Serbia Federal Republic of Yugoslavia
Financing for small and medium-scale ventures Federal Republic of Yugoslavia
Croatia
Construction of two sections of Rijeka-Zagreb motorway Autocesta Rijeka-Zagreb d.d.
Modernisation of air traffic control at Zagreb airport Hrvatska Kontrola Zracne Plovidbe d.o.o.
Rebuilding of motorways along Corridor X Hrvatske Autoceste d.o.o.
Bosnia-Herzegovina
Modernisation of cement plant and construction of new production line in Lukavac, north of Sarajevo Kamenolomi Alas Bosna d.o.o.
89.549.5
49.5 ❖
40.0
40.0 ❖
84.630.0
30.0 ❖
54.6
54.6 ❖
270.0
70.0 ❖
85.0 ❖
95.0 ❖
20.0 ❖
130.0
60.0 ❖
20.0 ❖
50.0 ❖
25.0
25.0 ❖

page
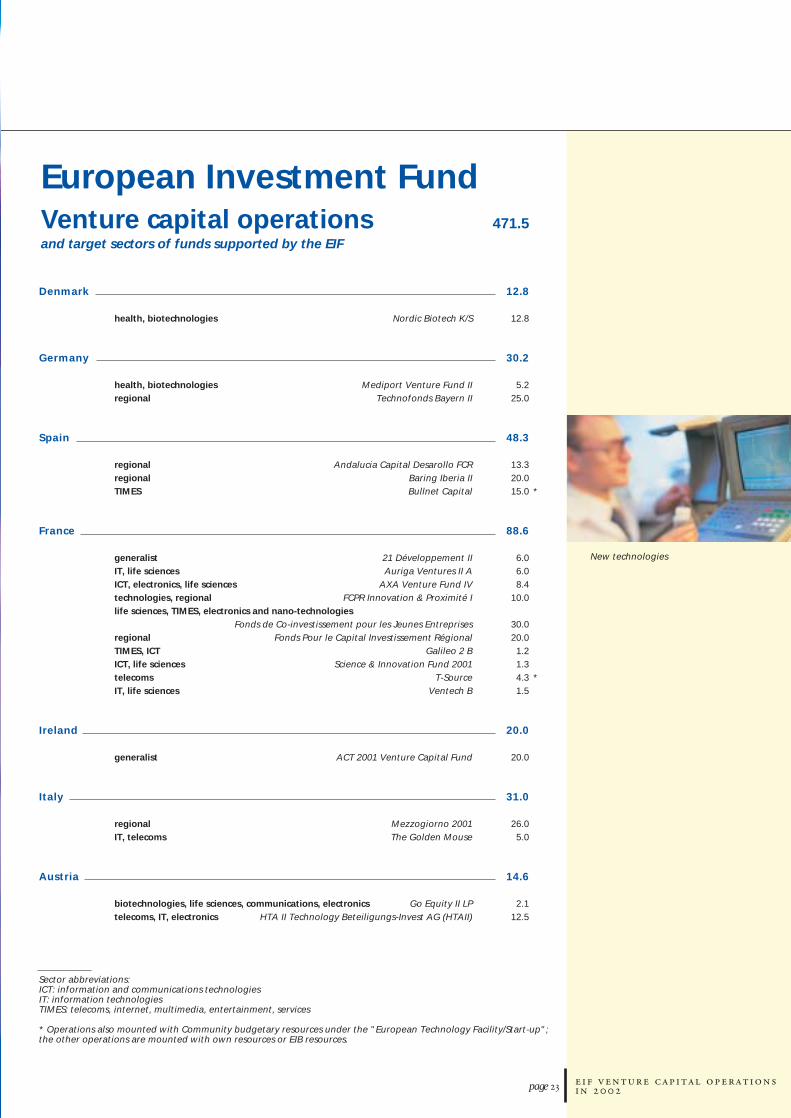
European Investment Fund Venture capital operationsand target sectors of funds supported by the EIF
Sector abbreviations: ICT: information and communications technologiesIT: information technologiesTIMES: telecoms, internet, multimedia, entertainment, services
* Operations also mounted with Community budgetary resources under the "European Technology Facility/Start-up";the other operations are mounted with own resources or EIB resources.
New technologies
Denmark
health, biotechnologies Nordic Biotech K/S
Germany
health, biotechnologies Mediport Venture Fund IIregional Technofonds Bayern II
Spain
regional Andalucia Capital Desarollo FCRregional Baring Iberia IITIMES Bullnet Capital
France
generalist 21 Développement IIIT, life sciences Auriga Ventures II AICT, electronics, life sciences AXA Venture Fund IVtechnologies, regional FCPR Innovation & Proximité Ilife sciences, TIMES, electronics and nano-technologies
Fonds de Co-investissement pour les Jeunes Entreprisesregional Fonds Pour le Capital Investissement RégionalTIMES, ICT Galileo 2 BICT, life sciences Science & Innovation Fund 2001telecoms T-SourceIT, life sciences Ventech B
Ireland
generalist ACT 2001 Venture Capital Fund
Italy
regional Mezzogiorno 2001IT, telecoms The Golden Mouse
Austria
biotechnologies, life sciences, communications, electronics Go Equity II LPtelecoms, IT, electronics HTA II Technology Beteiligungs-Invest AG (HTAII)
471.5
12.8
12.8
30.2
5.225.0
48.3
13.320.015.0 *
88.6
6.06.08.4
10.0
30.020.01.21.34.3 *1.5
20.0
20.0
31.0
26.05.0
14.6
2.112.5
page
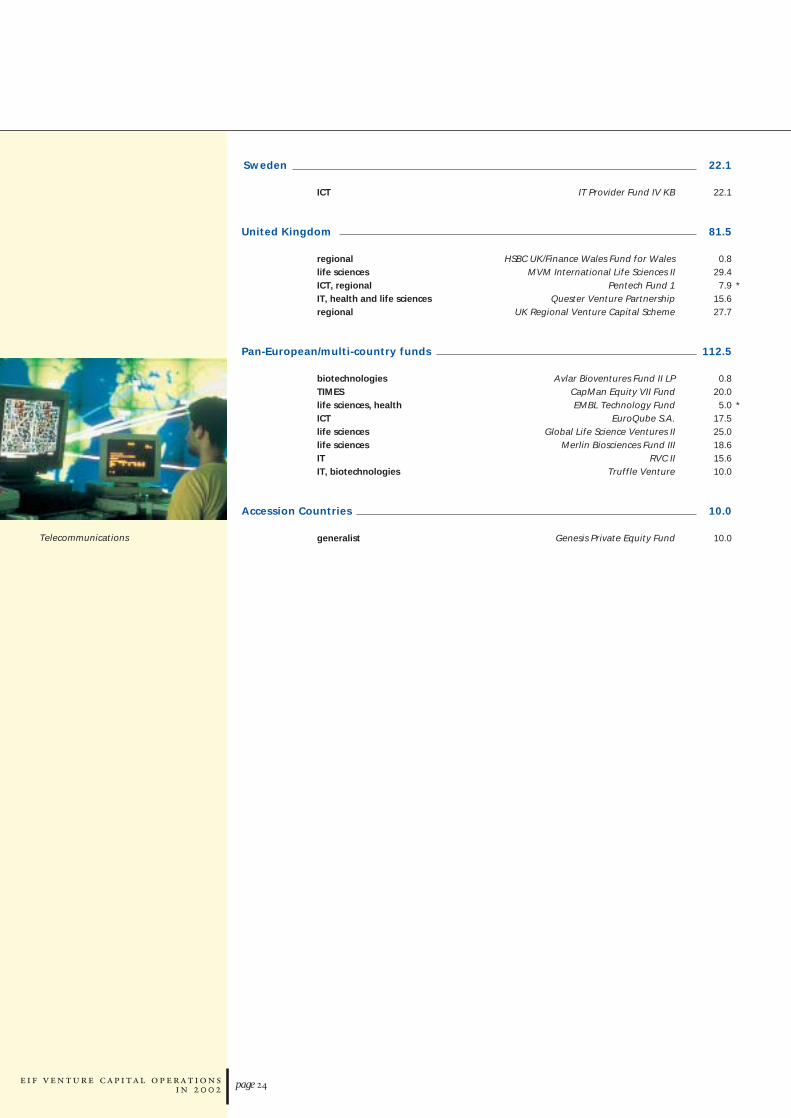
Telecommunications
Sweden
ICT IT Provider Fund IV KB
United Kingdom
regional HSBC UK/Finance Wales Fund for Waleslife sciences MVM International Life Sciences IIICT, regional Pentech Fund 1IT, health and life sciences Quester Venture Partnershipregional UK Regional Venture Capital Scheme
Pan-European/multi-country funds
biotechnologies Avlar Bioventures Fund II LPTIMES CapMan Equity VII Fundlife sciences, health EMBL Technology FundICT EuroQube S.A.life sciences Global Life Science Ventures IIlife sciences Merlin Biosciences Fund IIIIT RVC IIIT, biotechnologies Truffle Venture
Accession Countries
generalist Genesis Private Equity Fund
22.1
22.1
81.5
0.829.47.9 *
15.627.7
112.5
0.820.05.0 *
17.525.018.615.610.0
10.0
10.0
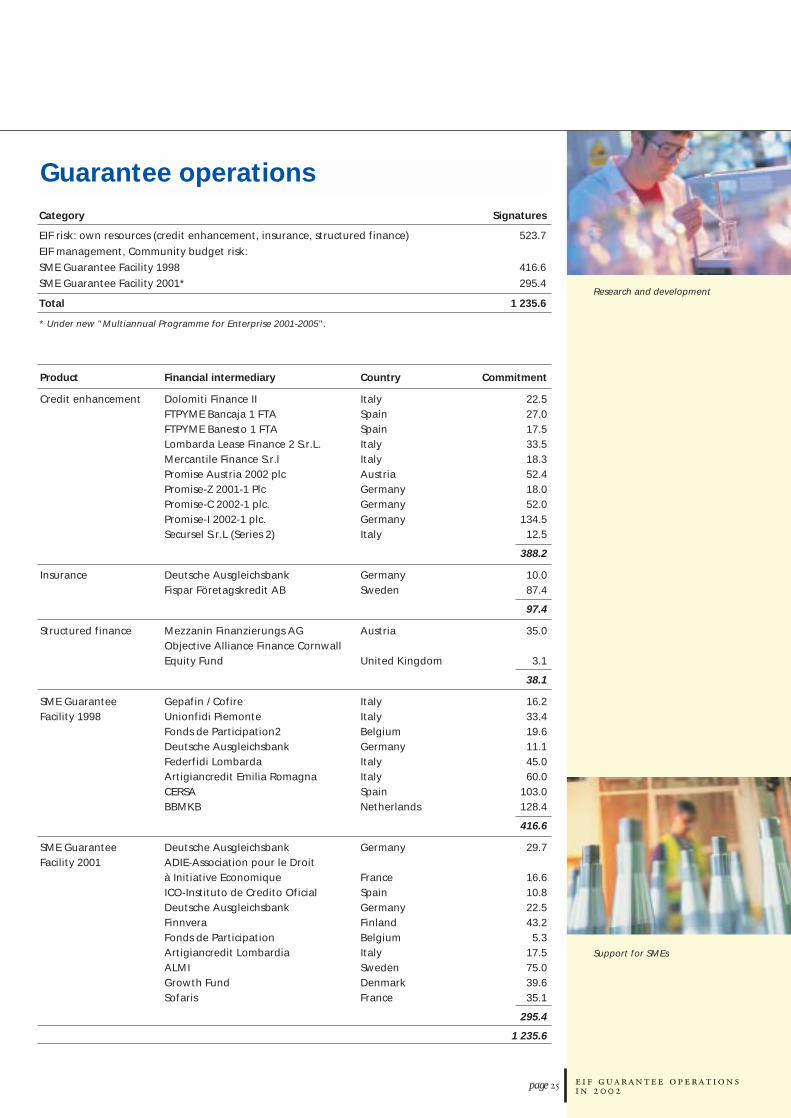
Guarantee operations Category Signatures
EIF risk: own resources (credit enhancement, insurance, structured finance)
EIF management, Community budget risk:
SME Guarantee Facility 1998
SME Guarantee Facility 2001*
Total
* Under new "Multiannual Programme for Enterprise 2001-2005".
Pro
Cr
Ins
Str
SMFa
SMFa
Research and development
523.7
416.6
295.4
1 235.6
page
duct Financial intermediary Country Commitment
edit enhancement Dolomiti Finance II ItalyFTPYME Bancaja 1 FTA SpainFTPYME Banesto 1 FTA SpainLombarda Lease Finance 2 S.r.L. ItalyMercantile Finance S.r.l ItalyPromise Austria 2002 plc AustriaPromise-Z 2001-1 Plc GermanyPromise-C 2002-1 plc. GermanyPromise-I 2002-1 plc. GermanySecursel S.r.L (Series 2) Italy
urance Deutsche Ausgleichsbank GermanyFispar Företagskredit AB Sweden
uctured finance Mezzanin Finanzierungs AG AustriaObjective Alliance Finance Cornwall Equity Fund United Kingdom
E Guarantee Gepafin / Cofire Italycility 1998 Unionfidi Piemonte Italy
Fonds de Participation2 BelgiumDeutsche Ausgleichsbank GermanyFederfidi Lombarda ItalyArtigiancredit Emilia Romagna ItalyCERSA SpainBBMKB Netherlands
E Guarantee Deutsche Ausgleichsbank Germanycility 2001 ADIE-Association pour le Droit
à Initiative Economique FranceICO-Instituto de Credito Oficial SpainDeutsche Ausgleichsbank GermanyFinnvera FinlandFonds de Participation BelgiumArtigiancredit Lombardia ItalyALMI SwedenGrowth Fund DenmarkSofaris France
Support for SMEs
22.527.017.533.518.352.418.052.0
134.512.5
388.2
10.087.4
97.4
35.0
3.1
38.1
16.233.419.611.145.060.0
103.0128.4
416.6
29.7
16.610.822.543.25.3
17.575.039.635.1
295.4
1 235.6
page
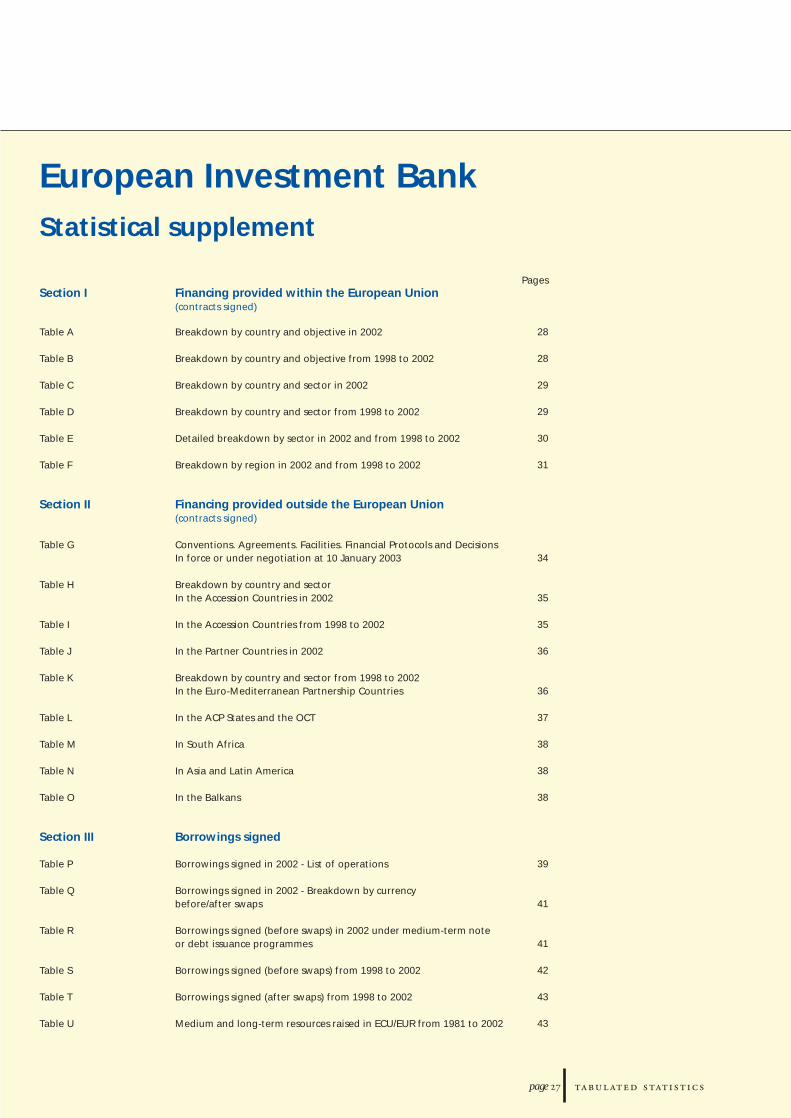
European Investment Bank Statistical supplement
Pages Section I Financing provided within the European Union
(contracts signed)
Table A Breakdown by country and objective in 2002
Table B Breakdown by country and objective from 1998 to 2002
Table C Breakdown by country and sector in 2002
Table D Breakdown by country and sector from 1998 to 2002
Table E Detailed breakdown by sector in 2002 and from 1998 to 2002
Table F Breakdown by region in 2002 and from 1998 to 2002
Section II Financing provided outside the European Union (contracts signed)
Table G Conventions. Agreements. Facilities. Financial Protocols and Decisions In force or under negotiation at 10 January 2003
Table H Breakdown by country and sector In the Accession Countries in 2002
Table I In the Accession Countries from 1998 to 2002
Table J In the Partner Countries in 2002
Table K Breakdown by country and sector from 1998 to 2002 In the Euro-Mediterranean Partnership Countries
Table L In the ACP States and the OCT
Table M In South Africa
Table N In Asia and Latin America
Table O In the Balkans
Section III Borrowings signed
Table P Borrowings signed in 2002 - List of operations
Table Q Borrowings signed in 2002 - Breakdown by currency before/after swaps
Table R Borrowings signed (before swaps) in 2002 under medium-term note or debt issuance programmes
Table S Borrowings signed (before swaps) from 1998 to 2002
Table T Borrowings signed (after swaps) from 1998 to 2002
Table U Medium and long-term resources raised in ECU/EUR from 1981 to 2002
28
28
29
29
30
31
34
35
35
36
36
37
38
38
38
39
41
41
42
43
43
page
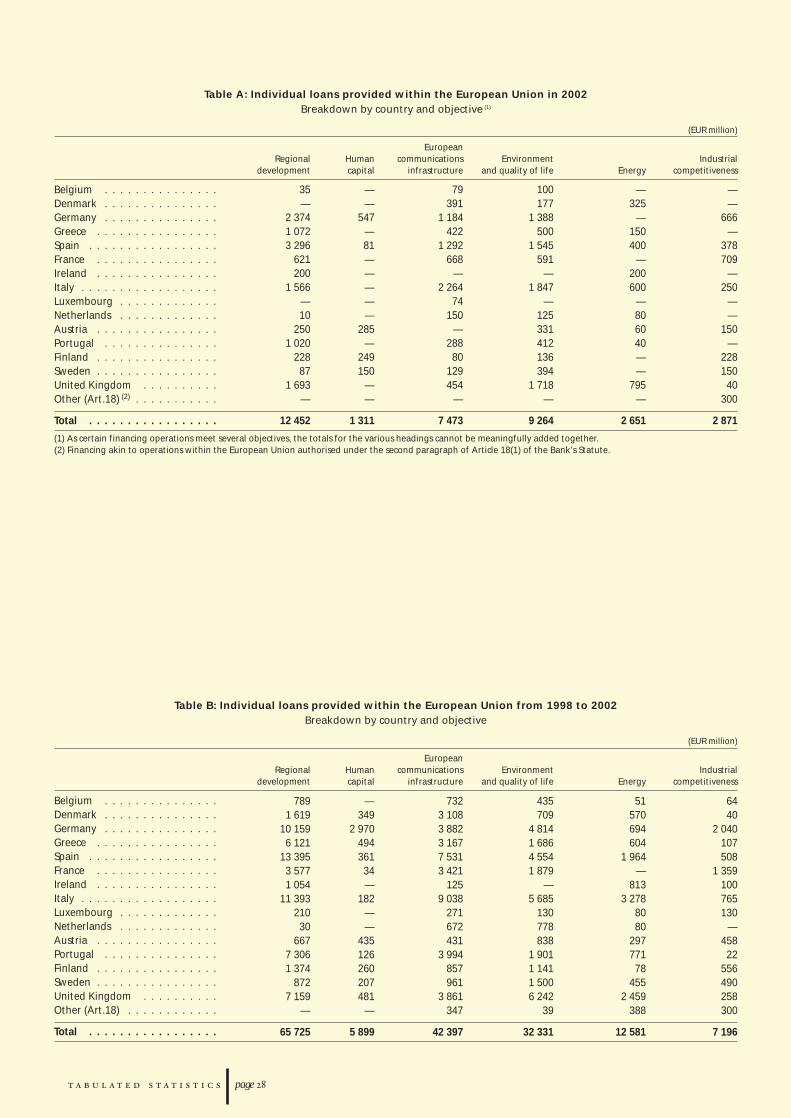
Table A: Individual loans provided within the European Union in 2002 Breakdown by country and objective (1)
(EUR million)
EuropeanRegional Human communications Environment Industrial
development capital infrastructure and quality of life Energy competitiveness
Belgium . . . . . . . . . . . . . . .Denmark . . . . . . . . . . . . . . .Germany . . . . . . . . . . . . . . .Greece . . . . . . . . . . . . . . . .Spain . . . . . . . . . . . . . . . . .France . . . . . . . . . . . . . . . .Ireland . . . . . . . . . . . . . . . .Italy . . . . . . . . . . . . . . . . . .Luxembourg . . . . . . . . . . . . .Netherlands . . . . . . . . . . . . .Austria . . . . . . . . . . . . . . . .Portugal . . . . . . . . . . . . . . .Finland . . . . . . . . . . . . . . . .Sweden . . . . . . . . . . . . . . . .United Kingdom . . . . . . . . . .Other (Art.18) (2) . . . . . . . . . . .
Total . . . . . . . . . . . . . . . . .
(1) As certain financing operations meet several objectives, the totals for the various headings cannot be meaningfully added together. (2) Financing akin to operations within the European Union authorised under the second paragraph of Article 18(1) of the Bank's Statute.
Table B: Individual loans provided within the European Union from 1998 to 2002 Breakdown by country and objective
(EUR million)
EuropeanRegional Human communications Environment Industrial
development capital infrastructure and quality of life Energy competitiveness
Belgium . . . . . . . . . . . . . . .Denmark . . . . . . . . . . . . . . .Germany . . . . . . . . . . . . . . .Greece . . . . . . . . . . . . . . . .Spain . . . . . . . . . . . . . . . . .France . . . . . . . . . . . . . . . .Ireland . . . . . . . . . . . . . . . .Italy . . . . . . . . . . . . . . . . . .Luxembourg . . . . . . . . . . . . .Netherlands . . . . . . . . . . . . .Austria . . . . . . . . . . . . . . . .Portugal . . . . . . . . . . . . . . .Finland . . . . . . . . . . . . . . . .Sweden . . . . . . . . . . . . . . . .United Kingdom . . . . . . . . . .Other (Art.18) . . . . . . . . . . . .
Total . . . . . . . . . . . . . . . . .
35 — 79 100 — —— — 391 177 325 —
2 374 547 1 184 1 388 — 6661 072 — 422 500 150 —3 296 81 1 292 1 545 400 378
621 — 668 591 — 709200 — — — 200 —
1 566 — 2 264 1 847 600 250— — 74 — — —10 — 150 125 80 —
250 285 — 331 60 1501 020 — 288 412 40 —
228 249 80 136 — 22887 150 129 394 — 150
1 693 — 454 1 718 795 40— — — — — 300
12 452 1 311 7 473 9 264 2 651 2 871
789 — 732 435 51 641 619 349 3 108 709 570 40
10 159 2 970 3 882 4 814 694 2 0406 121 494 3 167 1 686 604 107
13 395 361 7 531 4 554 1 964 5083 577 34 3 421 1 879 — 1 3591 054 — 125 — 813 100
11 393 182 9 038 5 685 3 278 765210 — 271 130 80 13030 — 672 778 80 —
667 435 431 838 297 4587 306 126 3 994 1 901 771 221 374 260 857 1 141 78 556
872 207 961 1 500 455 4907 159 481 3 861 6 242 2 459 258
— — 347 39 388 300
65 725 5 899 42 397 32 331 12 581 7 196
page
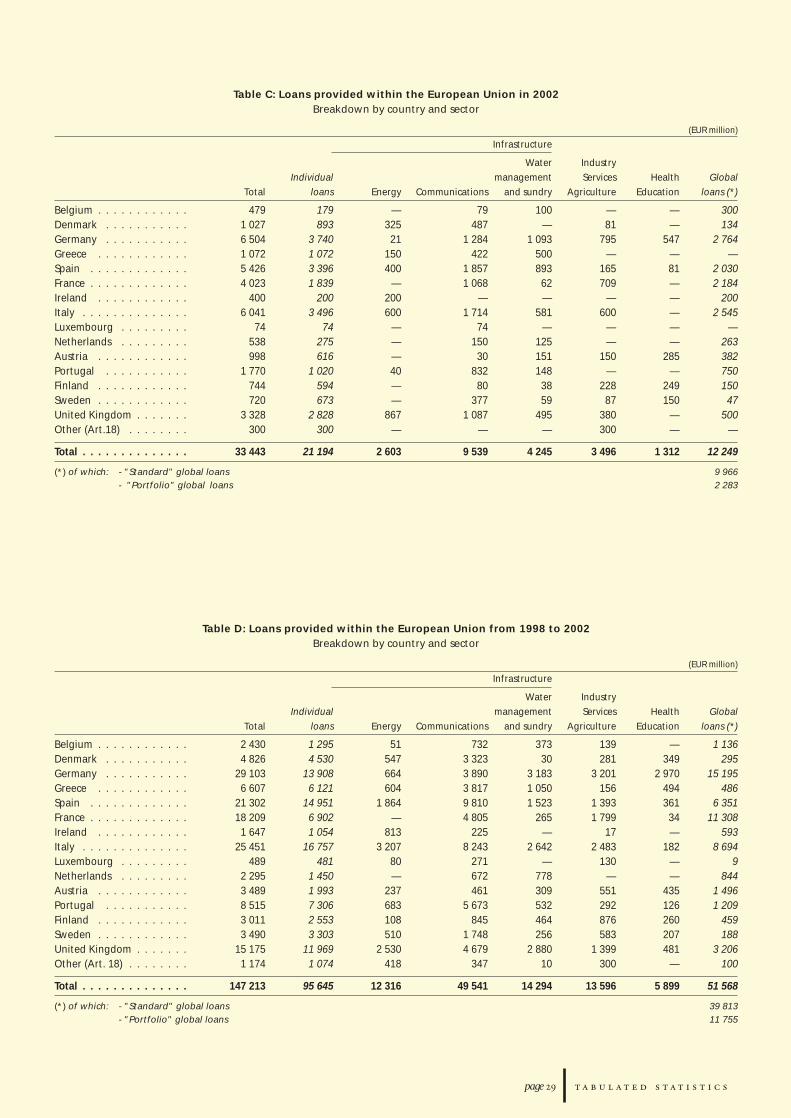
Table C: Loans provided within the European Union in 2002 Breakdown by country and sector
(EUR million)
Infrastructure
Water IndustryIndividual management Services Health Global
Total loans Energy Communications and sundry Agriculture Education loans (*)
Belgium . . . . . . . . . . . .Denmark . . . . . . . . . . .Germany . . . . . . . . . . .Greece . . . . . . . . . . . .Spain . . . . . . . . . . . . .France . . . . . . . . . . . . .Ireland . . . . . . . . . . . .Italy . . . . . . . . . . . . . .Luxembourg . . . . . . . . .Netherlands . . . . . . . . .Austria . . . . . . . . . . . .Portugal . . . . . . . . . . .Finland . . . . . . . . . . . .Sweden . . . . . . . . . . . .United Kingdom . . . . . . .Other (Art.18) . . . . . . . .
Total . . . . . . . . . . . . . .
(*) of which: - "Standard" global loans- "Portfolio" global loans
Table D: Loans provided within the European Union from 1998 to 2002 Breakdown by country and sector
(EUR million)
Infrastructure
Water IndustryIndividual management Services Health Global
Total loans Energy Communications and sundry Agriculture Education loans (*)
Belgium . . . . . . . . . . . .Denmark . . . . . . . . . . .Germany . . . . . . . . . . .Greece . . . . . . . . . . . .Spain . . . . . . . . . . . . .France . . . . . . . . . . . . .Ireland . . . . . . . . . . . .Italy . . . . . . . . . . . . . .Luxembourg . . . . . . . . .Netherlands . . . . . . . . .Austria . . . . . . . . . . . .Portugal . . . . . . . . . . .Finland . . . . . . . . . . . .Sweden . . . . . . . . . . . .United Kingdom . . . . . . .Other (Art. 18) . . . . . . . .
Total . . . . . . . . . . . . . .
(*) of which: - "Standard" global loans- "Portfolio" global loans
479 179 — 79 100 — — 3001 027 893 325 487 — 81 — 1346 504 3 740 21 1 284 1 093 795 547 2 7641 072 1 072 150 422 500 — — —5 426 3 396 400 1 857 893 165 81 2 0304 023 1 839 — 1 068 62 709 — 2 184
400 200 200 — — — — 2006 041 3 496 600 1 714 581 600 — 2 545
74 74 — 74 — — — —538 275 — 150 125 — — 263998 616 — 30 151 150 285 382
1 770 1 020 40 832 148 — — 750744 594 — 80 38 228 249 150720 673 — 377 59 87 150 47
3 328 2 828 867 1 087 495 380 — 500300 300 — — — 300 — —
33 443 21 194 2 603 9 539 4 245 3 496 1 312 12 249
9 9662 283
2 430 1 295 51 732 373 139 — 1 1364 826 4 530 547 3 323 30 281 349 295
29 103 13 908 664 3 890 3 183 3 201 2 970 15 1956 607 6 121 604 3 817 1 050 156 494 486
21 302 14 951 1 864 9 810 1 523 1 393 361 6 35118 209 6 902 — 4 805 265 1 799 34 11 3081 647 1 054 813 225 — 17 — 593
25 451 16 757 3 207 8 243 2 642 2 483 182 8 694489 481 80 271 — 130 — 9
2 295 1 450 — 672 778 — — 8443 489 1 993 237 461 309 551 435 1 4968 515 7 306 683 5 673 532 292 126 1 2093 011 2 553 108 845 464 876 260 4593 490 3 303 510 1 748 256 583 207 188
15 175 11 969 2 530 4 679 2 880 1 399 481 3 2061 174 1 074 418 347 10 300 — 100
147 213 95 645 12 316 49 541 14 294 13 596 5 899 51 568
39 81311 755
page
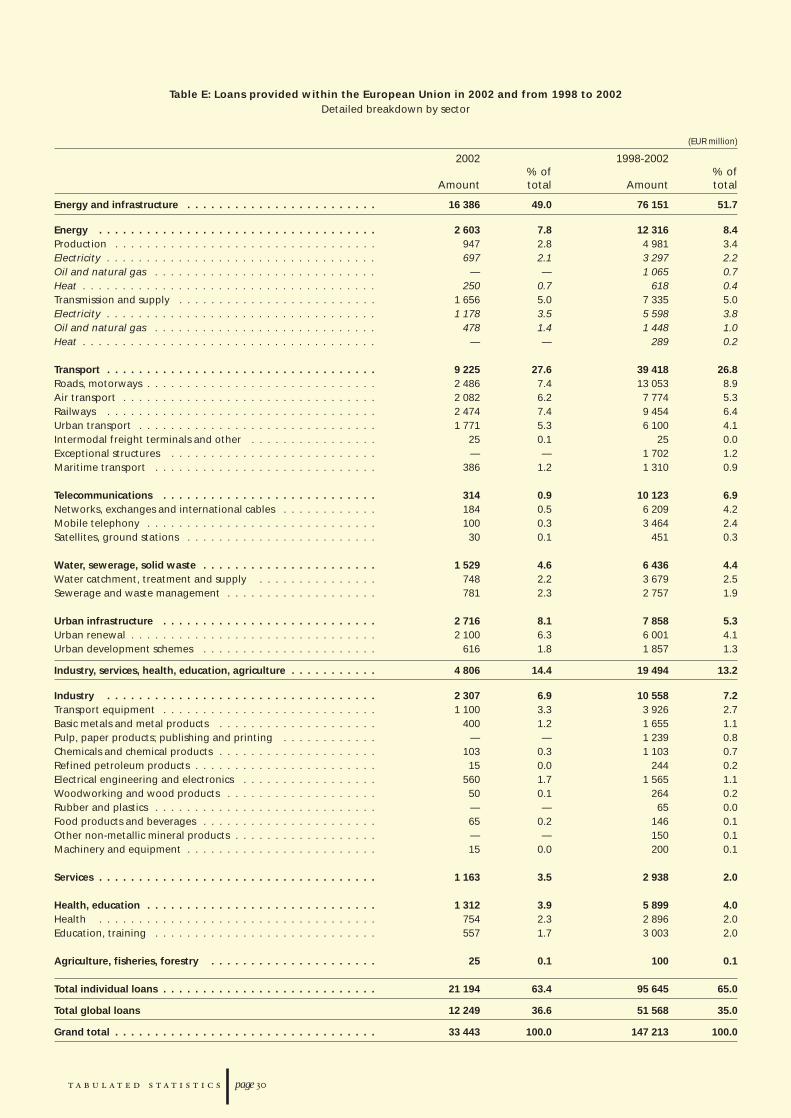
Table E: Loans provided within the European Union in 2002 and from 1998 to 2002 Detailed breakdown by sector
(EUR million)
% of % ofAmount total Amount total
Energy and infrastructure . . . . . . . . . . . . . . . . . . . . . . . .
Energy . . . . . . . . . . . . . . . . . . . . . . . . . . . . . . . . . . .Production . . . . . . . . . . . . . . . . . . . . . . . . . . . . . . . . .Electricity . . . . . . . . . . . . . . . . . . . . . . . . . . . . . . . . . .Oil and natural gas . . . . . . . . . . . . . . . . . . . . . . . . . . . .Heat . . . . . . . . . . . . . . . . . . . . . . . . . . . . . . . . . . . . .Transmission and supply . . . . . . . . . . . . . . . . . . . . . . . . .Electricity . . . . . . . . . . . . . . . . . . . . . . . . . . . . . . . . . .Oil and natural gas . . . . . . . . . . . . . . . . . . . . . . . . . . . .Heat . . . . . . . . . . . . . . . . . . . . . . . . . . . . . . . . . . . . .
Transport . . . . . . . . . . . . . . . . . . . . . . . . . . . . . . . . . .Roads, motorways . . . . . . . . . . . . . . . . . . . . . . . . . . . . .Air transport . . . . . . . . . . . . . . . . . . . . . . . . . . . . . . . .Railways . . . . . . . . . . . . . . . . . . . . . . . . . . . . . . . . . .Urban transport . . . . . . . . . . . . . . . . . . . . . . . . . . . . . .Intermodal freight terminals and other . . . . . . . . . . . . . . . .Exceptional structures . . . . . . . . . . . . . . . . . . . . . . . . . .Maritime transport . . . . . . . . . . . . . . . . . . . . . . . . . . . .
Telecommunications . . . . . . . . . . . . . . . . . . . . . . . . . . .Networks, exchanges and international cables . . . . . . . . . . . .Mobile telephony . . . . . . . . . . . . . . . . . . . . . . . . . . . . .Satellites, ground stations . . . . . . . . . . . . . . . . . . . . . . . .
Water, sewerage, solid waste . . . . . . . . . . . . . . . . . . . . . .Water catchment, treatment and supply . . . . . . . . . . . . . . .Sewerage and waste management . . . . . . . . . . . . . . . . . . .
Urban infrastructure . . . . . . . . . . . . . . . . . . . . . . . . . . .Urban renewal . . . . . . . . . . . . . . . . . . . . . . . . . . . . . . .Urban development schemes . . . . . . . . . . . . . . . . . . . . . .
Industry, services, health, education, agriculture . . . . . . . . . . .
Industry . . . . . . . . . . . . . . . . . . . . . . . . . . . . . . . . . .Transport equipment . . . . . . . . . . . . . . . . . . . . . . . . . . .Basic metals and metal products . . . . . . . . . . . . . . . . . . . .Pulp, paper products; publishing and printing . . . . . . . . . . . .Chemicals and chemical products . . . . . . . . . . . . . . . . . . . .Refined petroleum products . . . . . . . . . . . . . . . . . . . . . . .Electrical engineering and electronics . . . . . . . . . . . . . . . . .Woodworking and wood products . . . . . . . . . . . . . . . . . . .Rubber and plastics . . . . . . . . . . . . . . . . . . . . . . . . . . . .Food products and beverages . . . . . . . . . . . . . . . . . . . . . .Other non-metallic mineral products . . . . . . . . . . . . . . . . . .Machinery and equipment . . . . . . . . . . . . . . . . . . . . . . . .
Services . . . . . . . . . . . . . . . . . . . . . . . . . . . . . . . . . . .
Health, education . . . . . . . . . . . . . . . . . . . . . . . . . . . . .Health . . . . . . . . . . . . . . . . . . . . . . . . . . . . . . . . . . .Education, training . . . . . . . . . . . . . . . . . . . . . . . . . . . .
Agriculture, fisheries, forestry . . . . . . . . . . . . . . . . . . . . .
Total individual loans . . . . . . . . . . . . . . . . . . . . . . . . . . .
Total global loans
Grand total . . . . . . . . . . . . . . . . . . . . . . . . . . . . . . . . .
2002 1998-2002
16 386 49.0 76 151 51.7
2 603 7.8 12 316 8.4947 2.8 4 981 3.4697 2.1 3 297 2.2
— — 1 065 0.7250 0.7 618 0.4
1 656 5.0 7 335 5.01 178 3.5 5 598 3.8
478 1.4 1 448 1.0— — 289 0.2
9 225 27.6 39 418 26.82 486 7.4 13 053 8.92 082 6.2 7 774 5.32 474 7.4 9 454 6.41 771 5.3 6 100 4.1
25 0.1 25 0.0— — 1 702 1.2
386 1.2 1 310 0.9
314 0.9 10 123 6.9184 0.5 6 209 4.2100 0.3 3 464 2.430 0.1 451 0.3
1 529 4.6 6 436 4.4748 2.2 3 679 2.5781 2.3 2 757 1.9
2 716 8.1 7 858 5.32 100 6.3 6 001 4.1
616 1.8 1 857 1.3
4 806 14.4 19 494 13.2
2 307 6.9 10 558 7.21 100 3.3 3 926 2.7
400 1.2 1 655 1.1— — 1 239 0.8
103 0.3 1 103 0.715 0.0 244 0.2
560 1.7 1 565 1.150 0.1 264 0.2— — 65 0.065 0.2 146 0.1— — 150 0.115 0.0 200 0.1
1 163 3.5 2 938 2.0
1 312 3.9 5 899 4.0754 2.3 2 896 2.0557 1.7 3 003 2.0
25 0.1 100 0.1
21 194 63.4 95 645 65.0
12 249 36.6 51 568 35.0
33 443 100.0 147 213 100.0
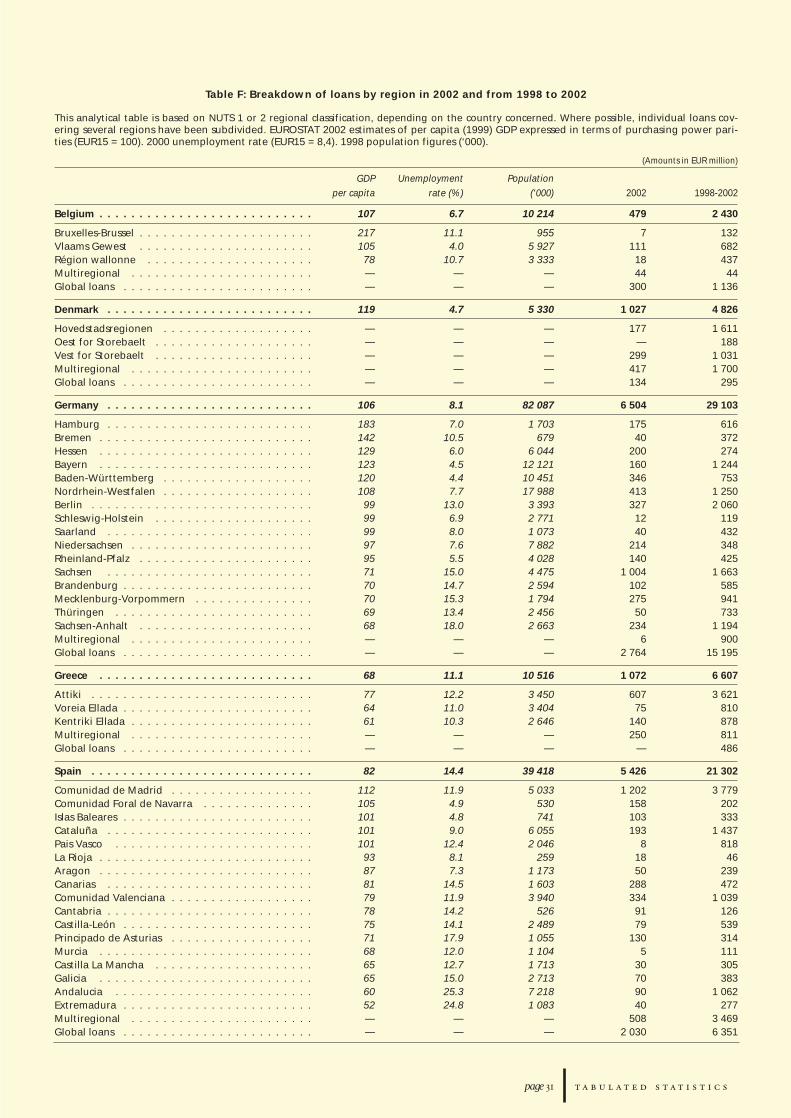
Table F: Breakdown of loans by region in 2002 and from 1998 to 2002
This analytical table is based on NUTS 1 or 2 regional classification, depending on the country concerned. Where possible, individual loans cov-ering several regions have been subdivided. EUROSTAT 2002 estimates of per capita (1999) GDP expressed in terms of purchasing power pari-ties (EUR15 = 100). 2000 unemployment rate (EUR15 = 8,4). 1998 population figures (‘000).
(Amounts in EUR million)
GDP Unemployment Population per capita rate (%) ('000)
Belgium . . . . . . . . . . . . . . . . . . . . . . . . . . .
Bruxelles-Brussel . . . . . . . . . . . . . . . . . . . . . .Vlaams Gewest . . . . . . . . . . . . . . . . . . . . . .Région wallonne . . . . . . . . . . . . . . . . . . . . .Multiregional . . . . . . . . . . . . . . . . . . . . . . .Global loans . . . . . . . . . . . . . . . . . . . . . . . .
Denmark . . . . . . . . . . . . . . . . . . . . . . . . . .
Hovedstadsregionen . . . . . . . . . . . . . . . . . . .Oest for Storebaelt . . . . . . . . . . . . . . . . . . . .Vest for Storebaelt . . . . . . . . . . . . . . . . . . . .Multiregional . . . . . . . . . . . . . . . . . . . . . . .Global loans . . . . . . . . . . . . . . . . . . . . . . . .
Germany . . . . . . . . . . . . . . . . . . . . . . . . . .
Hamburg . . . . . . . . . . . . . . . . . . . . . . . . . .Bremen . . . . . . . . . . . . . . . . . . . . . . . . . . .Hessen . . . . . . . . . . . . . . . . . . . . . . . . . . .Bayern . . . . . . . . . . . . . . . . . . . . . . . . . . .Baden-Württemberg . . . . . . . . . . . . . . . . . . .Nordrhein-Westfalen . . . . . . . . . . . . . . . . . . .Berlin . . . . . . . . . . . . . . . . . . . . . . . . . . . .Schleswig-Holstein . . . . . . . . . . . . . . . . . . . .Saarland . . . . . . . . . . . . . . . . . . . . . . . . . .Niedersachsen . . . . . . . . . . . . . . . . . . . . . . .Rheinland-Pfalz . . . . . . . . . . . . . . . . . . . . . .Sachsen . . . . . . . . . . . . . . . . . . . . . . . . . .Brandenburg . . . . . . . . . . . . . . . . . . . . . . . .Mecklenburg-Vorpommern . . . . . . . . . . . . . . .Thüringen . . . . . . . . . . . . . . . . . . . . . . . . .Sachsen-Anhalt . . . . . . . . . . . . . . . . . . . . . .Multiregional . . . . . . . . . . . . . . . . . . . . . . .Global loans . . . . . . . . . . . . . . . . . . . . . . . .
Greece . . . . . . . . . . . . . . . . . . . . . . . . . . .
Attiki . . . . . . . . . . . . . . . . . . . . . . . . . . . .Voreia Ellada . . . . . . . . . . . . . . . . . . . . . . . .Kentriki Ellada . . . . . . . . . . . . . . . . . . . . . . .Multiregional . . . . . . . . . . . . . . . . . . . . . . .Global loans . . . . . . . . . . . . . . . . . . . . . . . .
Spain . . . . . . . . . . . . . . . . . . . . . . . . . . . .
Comunidad de Madrid . . . . . . . . . . . . . . . . . .Comunidad Foral de Navarra . . . . . . . . . . . . . .Islas Baleares . . . . . . . . . . . . . . . . . . . . . . . .Cataluña . . . . . . . . . . . . . . . . . . . . . . . . . .Pais Vasco . . . . . . . . . . . . . . . . . . . . . . . . .La Rioja . . . . . . . . . . . . . . . . . . . . . . . . . . .Aragon . . . . . . . . . . . . . . . . . . . . . . . . . . .Canarias . . . . . . . . . . . . . . . . . . . . . . . . . .Comunidad Valenciana . . . . . . . . . . . . . . . . . .Cantabria . . . . . . . . . . . . . . . . . . . . . . . . . .Castilla-León . . . . . . . . . . . . . . . . . . . . . . . .Principado de Asturias . . . . . . . . . . . . . . . . . .Murcia . . . . . . . . . . . . . . . . . . . . . . . . . . .Castilla La Mancha . . . . . . . . . . . . . . . . . . . .Galicia . . . . . . . . . . . . . . . . . . . . . . . . . . .Andalucia . . . . . . . . . . . . . . . . . . . . . . . . .Extremadura . . . . . . . . . . . . . . . . . . . . . . . .Multiregional . . . . . . . . . . . . . . . . . . . . . . .Global loans . . . . . . . . . . . . . . . . . . . . . . . .
page
2002 1998-2002
107 6.7 10 214 479 2 430
217 11.1 955 7 132105 4.0 5 927 111 68278 10.7 3 333 18 437— — — 44 44— — — 300 1 136
119 4.7 5 330 1 027 4 826
— — — 177 1 611— — — — 188— — — 299 1 031— — — 417 1 700— — — 134 295
106 8.1 82 087 6 504 29 103
183 7.0 1 703 175 616142 10.5 679 40 372129 6.0 6 044 200 274123 4.5 12 121 160 1 244120 4.4 10 451 346 753108 7.7 17 988 413 1 25099 13.0 3 393 327 2 06099 6.9 2 771 12 11999 8.0 1 073 40 43297 7.6 7 882 214 34895 5.5 4 028 140 42571 15.0 4 475 1 004 1 66370 14.7 2 594 102 58570 15.3 1 794 275 94169 13.4 2 456 50 73368 18.0 2 663 234 1 194— — — 6 900— — — 2 764 15 195
68 11.1 10 516 1 072 6 607
77 12.2 3 450 607 3 62164 11.0 3 404 75 81061 10.3 2 646 140 878— — — 250 811— — — — 486
82 14.4 39 418 5 426 21 302
112 11.9 5 033 1 202 3 779105 4.9 530 158 202101 4.8 741 103 333101 9.0 6 055 193 1 437101 12.4 2 046 8 81893 8.1 259 18 4687 7.3 1 173 50 23981 14.5 1 603 288 47279 11.9 3 940 334 1 03978 14.2 526 91 12675 14.1 2 489 79 53971 17.9 1 055 130 31468 12.0 1 104 5 11165 12.7 1 713 30 30565 15.0 2 713 70 38360 25.3 7 218 90 1 06252 24.8 1 083 40 277— — — 508 3 469— — — 2 030 6 351
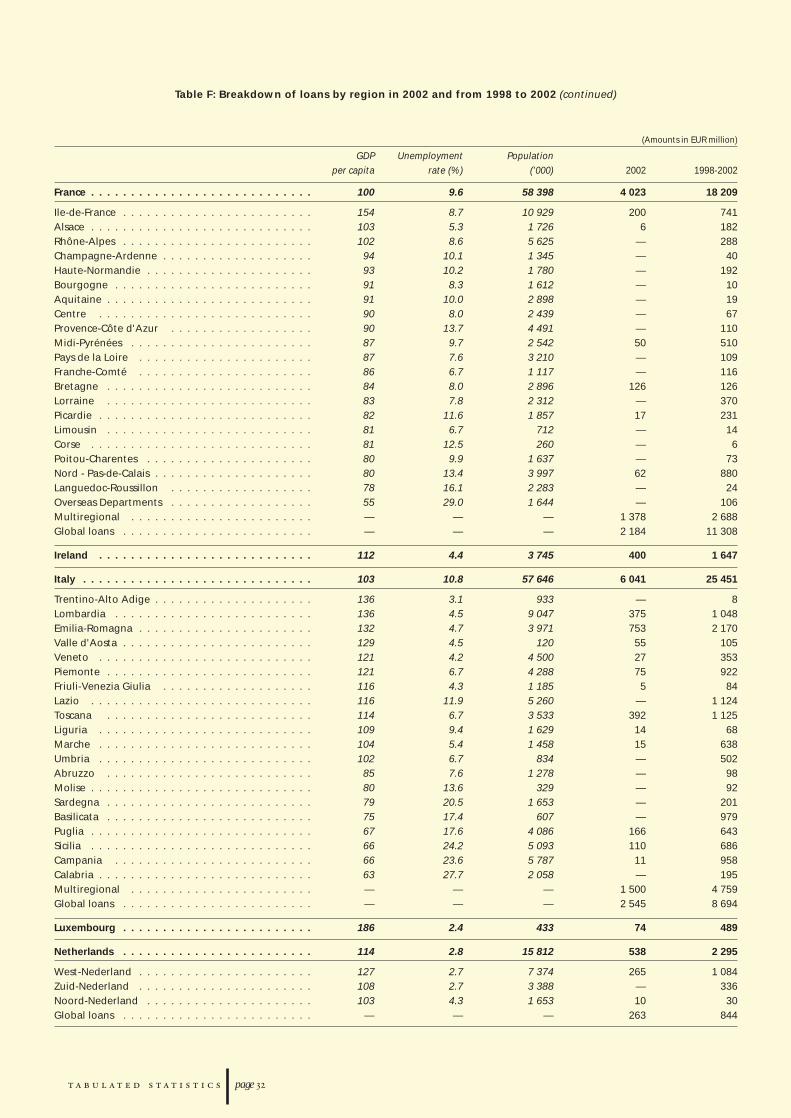
page
Table F: Breakdown of loans by region in 2002 and from 1998 to 2002 (continued)
(Amounts in EUR million)
GDP Unemployment Population per capita rate (%) ('000)
France . . . . . . . . . . . . . . . . . . . . . . . . . . . .
Ile-de-France . . . . . . . . . . . . . . . . . . . . . . . .Alsace . . . . . . . . . . . . . . . . . . . . . . . . . . . .Rhône-Alpes . . . . . . . . . . . . . . . . . . . . . . . .Champagne-Ardenne . . . . . . . . . . . . . . . . . . .Haute-Normandie . . . . . . . . . . . . . . . . . . . . .Bourgogne . . . . . . . . . . . . . . . . . . . . . . . . .Aquitaine . . . . . . . . . . . . . . . . . . . . . . . . . .Centre . . . . . . . . . . . . . . . . . . . . . . . . . . .Provence-Côte d'Azur . . . . . . . . . . . . . . . . . .Midi-Pyrénées . . . . . . . . . . . . . . . . . . . . . . .Pays de la Loire . . . . . . . . . . . . . . . . . . . . . .Franche-Comté . . . . . . . . . . . . . . . . . . . . . .Bretagne . . . . . . . . . . . . . . . . . . . . . . . . . .Lorraine . . . . . . . . . . . . . . . . . . . . . . . . . .Picardie . . . . . . . . . . . . . . . . . . . . . . . . . . .Limousin . . . . . . . . . . . . . . . . . . . . . . . . . .Corse . . . . . . . . . . . . . . . . . . . . . . . . . . . .Poitou-Charentes . . . . . . . . . . . . . . . . . . . . .Nord - Pas-de-Calais . . . . . . . . . . . . . . . . . . . .Languedoc-Roussillon . . . . . . . . . . . . . . . . . .Overseas Departments . . . . . . . . . . . . . . . . . .Multiregional . . . . . . . . . . . . . . . . . . . . . . .Global loans . . . . . . . . . . . . . . . . . . . . . . . .
Ireland . . . . . . . . . . . . . . . . . . . . . . . . . . .
Italy . . . . . . . . . . . . . . . . . . . . . . . . . . . . .
Trentino-Alto Adige . . . . . . . . . . . . . . . . . . . .Lombardia . . . . . . . . . . . . . . . . . . . . . . . . .Emilia-Romagna . . . . . . . . . . . . . . . . . . . . . .Valle d'Aosta . . . . . . . . . . . . . . . . . . . . . . . .Veneto . . . . . . . . . . . . . . . . . . . . . . . . . . .Piemonte . . . . . . . . . . . . . . . . . . . . . . . . . .Friuli-Venezia Giulia . . . . . . . . . . . . . . . . . . .Lazio . . . . . . . . . . . . . . . . . . . . . . . . . . . .Toscana . . . . . . . . . . . . . . . . . . . . . . . . . .Liguria . . . . . . . . . . . . . . . . . . . . . . . . . . .Marche . . . . . . . . . . . . . . . . . . . . . . . . . . .Umbria . . . . . . . . . . . . . . . . . . . . . . . . . . .Abruzzo . . . . . . . . . . . . . . . . . . . . . . . . . .Molise . . . . . . . . . . . . . . . . . . . . . . . . . . . .Sardegna . . . . . . . . . . . . . . . . . . . . . . . . . .Basilicata . . . . . . . . . . . . . . . . . . . . . . . . . .Puglia . . . . . . . . . . . . . . . . . . . . . . . . . . . .Sicilia . . . . . . . . . . . . . . . . . . . . . . . . . . . .Campania . . . . . . . . . . . . . . . . . . . . . . . . .Calabria . . . . . . . . . . . . . . . . . . . . . . . . . . .Multiregional . . . . . . . . . . . . . . . . . . . . . . .Global loans . . . . . . . . . . . . . . . . . . . . . . . .
Luxembourg . . . . . . . . . . . . . . . . . . . . . . . .
Netherlands . . . . . . . . . . . . . . . . . . . . . . . .
West-Nederland . . . . . . . . . . . . . . . . . . . . . .Zuid-Nederland . . . . . . . . . . . . . . . . . . . . . .Noord-Nederland . . . . . . . . . . . . . . . . . . . . .Global loans . . . . . . . . . . . . . . . . . . . . . . . .
2002 1998-2002
100 9.6 58 398 4 023 18 209
154 8.7 10 929 200 741103 5.3 1 726 6 182102 8.6 5 625 — 28894 10.1 1 345 — 4093 10.2 1 780 — 19291 8.3 1 612 — 1091 10.0 2 898 — 1990 8.0 2 439 — 6790 13.7 4 491 — 11087 9.7 2 542 50 51087 7.6 3 210 — 10986 6.7 1 117 — 11684 8.0 2 896 126 12683 7.8 2 312 — 37082 11.6 1 857 17 23181 6.7 712 — 1481 12.5 260 — 680 9.9 1 637 — 7380 13.4 3 997 62 88078 16.1 2 283 — 2455 29.0 1 644 — 106— — — 1 378 2 688— — — 2 184 11 308
112 4.4 3 745 400 1 647
103 10.8 57 646 6 041 25 451
136 3.1 933 — 8136 4.5 9 047 375 1 048132 4.7 3 971 753 2 170129 4.5 120 55 105121 4.2 4 500 27 353121 6.7 4 288 75 922116 4.3 1 185 5 84116 11.9 5 260 — 1 124114 6.7 3 533 392 1 125109 9.4 1 629 14 68104 5.4 1 458 15 638102 6.7 834 — 50285 7.6 1 278 — 9880 13.6 329 — 9279 20.5 1 653 — 20175 17.4 607 — 97967 17.6 4 086 166 64366 24.2 5 093 110 68666 23.6 5 787 11 95863 27.7 2 058 — 195— — — 1 500 4 759— — — 2 545 8 694
186 2.4 433 74 489
114 2.8 15 812 538 2 295
127 2.7 7 374 265 1 084108 2.7 3 388 — 336103 4.3 1 653 10 30
— — — 263 844
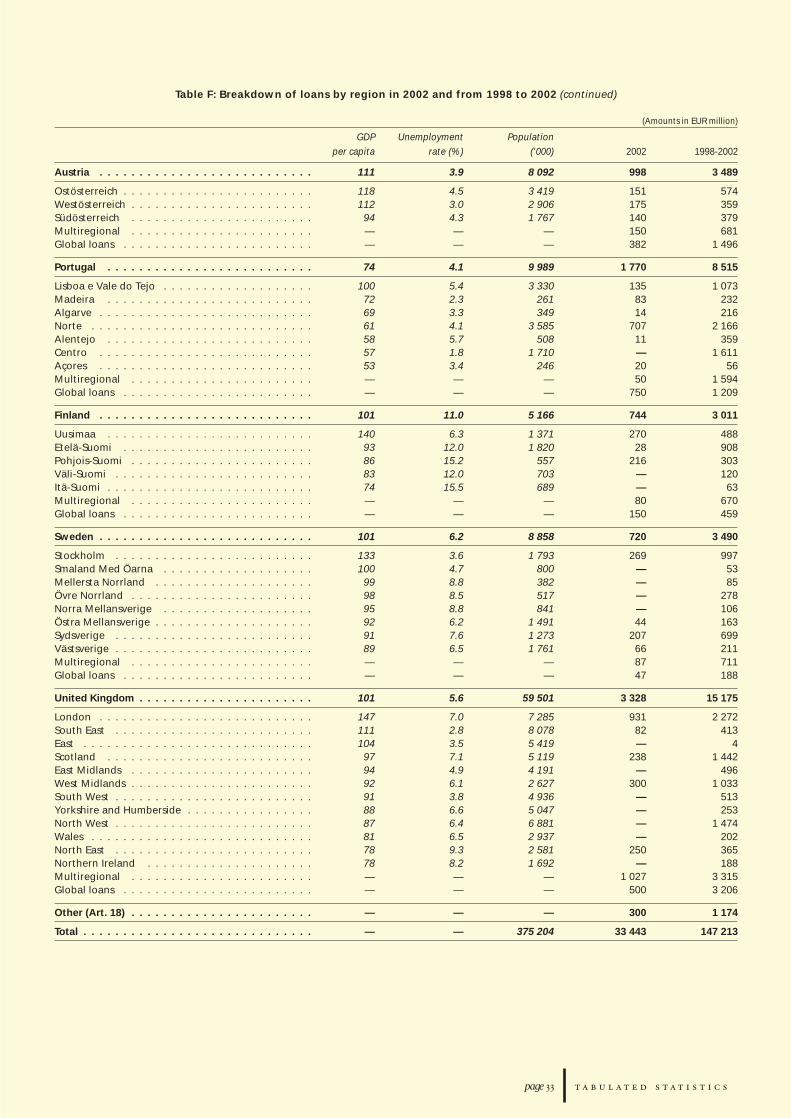
Table F: Breakdown of loans by region in 2002 and from 1998 to 2002 (continued)
(Amounts in EUR million)
GDP Unemployment Population per capita rate (%) ('000)
Austria . . . . . . . . . . . . . . . . . . . . . . . . . . .
Ostösterreich . . . . . . . . . . . . . . . . . . . . . . . .Westösterreich . . . . . . . . . . . . . . . . . . . . . . .Südösterreich . . . . . . . . . . . . . . . . . . . . . . .Multiregional . . . . . . . . . . . . . . . . . . . . . . .Global loans . . . . . . . . . . . . . . . . . . . . . . . .
Portugal . . . . . . . . . . . . . . . . . . . . . . . . . .
Lisboa e Vale do Tejo . . . . . . . . . . . . . . . . . . .Madeira . . . . . . . . . . . . . . . . . . . . . . . . . .Algarve . . . . . . . . . . . . . . . . . . . . . . . . . . .Norte . . . . . . . . . . . . . . . . . . . . . . . . . . . .Alentejo . . . . . . . . . . . . . . . . . . . . . . . . . .Centro . . . . . . . . . . . . . . . . . . . . . . . . . . .Açores . . . . . . . . . . . . . . . . . . . . . . . . . . .Multiregional . . . . . . . . . . . . . . . . . . . . . . .Global loans . . . . . . . . . . . . . . . . . . . . . . . .
Finland . . . . . . . . . . . . . . . . . . . . . . . . . . .
Uusimaa . . . . . . . . . . . . . . . . . . . . . . . . . .Etelä-Suomi . . . . . . . . . . . . . . . . . . . . . . . .Pohjois-Suomi . . . . . . . . . . . . . . . . . . . . . . .Väli-Suomi . . . . . . . . . . . . . . . . . . . . . . . . .Itä-Suomi . . . . . . . . . . . . . . . . . . . . . . . . . .Multiregional . . . . . . . . . . . . . . . . . . . . . . .Global loans . . . . . . . . . . . . . . . . . . . . . . . .
Sweden . . . . . . . . . . . . . . . . . . . . . . . . . . .
Stockholm . . . . . . . . . . . . . . . . . . . . . . . . .Smaland Med Öarna . . . . . . . . . . . . . . . . . . .Mellersta Norrland . . . . . . . . . . . . . . . . . . . .Övre Norrland . . . . . . . . . . . . . . . . . . . . . . .Norra Mellansverige . . . . . . . . . . . . . . . . . . .Östra Mellansverige . . . . . . . . . . . . . . . . . . . .Sydsverige . . . . . . . . . . . . . . . . . . . . . . . . .Västsverige . . . . . . . . . . . . . . . . . . . . . . . . .Multiregional . . . . . . . . . . . . . . . . . . . . . . .Global loans . . . . . . . . . . . . . . . . . . . . . . . .
United Kingdom . . . . . . . . . . . . . . . . . . . . . .
London . . . . . . . . . . . . . . . . . . . . . . . . . . .South East . . . . . . . . . . . . . . . . . . . . . . . . .East . . . . . . . . . . . . . . . . . . . . . . . . . . . . .Scotland . . . . . . . . . . . . . . . . . . . . . . . . . .East Midlands . . . . . . . . . . . . . . . . . . . . . . .West Midlands . . . . . . . . . . . . . . . . . . . . . . .South West . . . . . . . . . . . . . . . . . . . . . . . . .Yorkshire and Humberside . . . . . . . . . . . . . . . .North West . . . . . . . . . . . . . . . . . . . . . . . . .Wales . . . . . . . . . . . . . . . . . . . . . . . . . . . .North East . . . . . . . . . . . . . . . . . . . . . . . . .Northern Ireland . . . . . . . . . . . . . . . . . . . . .Multiregional . . . . . . . . . . . . . . . . . . . . . . .Global loans . . . . . . . . . . . . . . . . . . . . . . . .
Other (Art. 18) . . . . . . . . . . . . . . . . . . . . . . .
Total . . . . . . . . . . . . . . . . . . . . . . . . . . . . .
page
2002 1998-2002
111 3.9 8 092 998 3 489
118 4.5 3 419 151 574112 3.0 2 906 175 35994 4.3 1 767 140 379— — — 150 681— — — 382 1 496
74 4.1 9 989 1 770 8 515
100 5.4 3 330 135 1 07372 2.3 261 83 23269 3.3 349 14 21661 4.1 3 585 707 2 16658 5.7 508 11 35957 1.8 1 710 — 1 61153 3.4 246 20 56— — — 50 1 594— — — 750 1 209
101 11.0 5 166 744 3 011
140 6.3 1 371 270 48893 12.0 1 820 28 90886 15.2 557 216 30383 12.0 703 — 12074 15.5 689 — 63— — — 80 670— — — 150 459
101 6.2 8 858 720 3 490
133 3.6 1 793 269 997100 4.7 800 — 5399 8.8 382 — 8598 8.5 517 — 27895 8.8 841 — 10692 6.2 1 491 44 16391 7.6 1 273 207 69989 6.5 1 761 66 211— — — 87 711— — — 47 188
101 5.6 59 501 3 328 15 175
147 7.0 7 285 931 2 272111 2.8 8 078 82 413104 3.5 5 419 — 497 7.1 5 119 238 1 44294 4.9 4 191 — 49692 6.1 2 627 300 1 03391 3.8 4 936 — 51388 6.6 5 047 — 25387 6.4 6 881 — 1 47481 6.5 2 937 — 20278 9.3 2 581 250 36578 8.2 1 692 — 188— — — 1 027 3 315— — — 500 3 206
— — — 300 1 174
— — 375 204 33 443 147 213
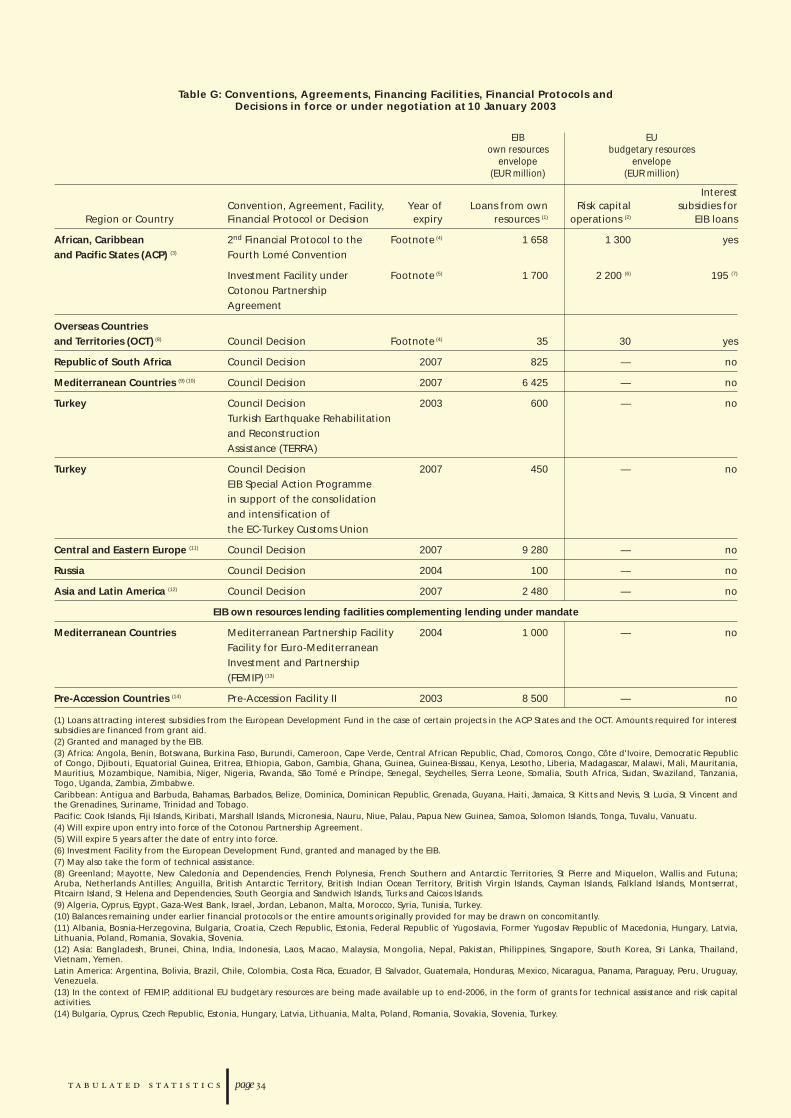
page
Table G: Conventions, Agreements, Financing Facilities, Financial Protocols andDecisions in force or under negotiation at 10 January 2003
EIB EUown resources budgetary resources
envelope envelope(EUR million) (EUR million)
InterestConvention, Agreement, Facility, Year of Loans from own Risk capital subsidies for
Region or Country Financial Protocol or Decision expiry resources (1) operations (2) EIB loans
African, Caribbean 2nd Financial Protocol to the Footnote (4) yesand Pacific States (ACP) (3) Fourth Lomé Convention
Investment Facility under Footnote (5)
Cotonou Partnership Agreement
Overseas Countries and Territories (OCT) (8) Council Decision Footnote (4) yes
Republic of South Africa Council Decision no
Mediterranean Countries (9) (10) Council Decision no
Turkey Council Decision noTurkish Earthquake Rehabilitation and ReconstructionAssistance (TERRA)
Turkey Council Decision noEIB Special Action Programme in support of the consolidation and intensification ofthe EC-Turkey Customs Union
Central and Eastern Europe (11) Council Decision no
Russia Council Decision no
Asia and Latin America (12) Council Decision no
EIB own resources lending facilities complementing lending under mandate
Mediterranean Countries Mediterranean Partnership Facility noFacility for Euro-MediterraneanInvestment and Partnership(FEMIP) (13)
Pre-Accession Countries (14) Pre-Accession Facility II no
(1) Loans attracting interest subsidies from the European Development Fund in the case of certain projects in the ACP States and the OCT. Amounts required for interestsubsidies are financed from grant aid. (2) Granted and managed by the EIB. (3) Africa: Angola, Benin, Botswana, Burkina Faso, Burundi, Cameroon, Cape Verde, Central African Republic, Chad, Comoros, Congo, Côte d'Ivoire, Democratic Republicof Congo, Djibouti, Equatorial Guinea, Eritrea, Ethiopia, Gabon, Gambia, Ghana, Guinea, Guinea-Bissau, Kenya, Lesotho, Liberia, Madagascar, Malawi, Mali, Mauritania,Mauritius, Mozambique, Namibia, Niger, Nigeria, Rwanda, São Tomé e Príncipe, Senegal, Seychelles, Sierra Leone, Somalia, South Africa, Sudan, Swaziland, Tanzania,Togo, Uganda, Zambia, Zimbabwe. Caribbean: Antigua and Barbuda, Bahamas, Barbados, Belize, Dominica, Dominican Republic, Grenada, Guyana, Haiti, Jamaica, St Kitts and Nevis, St Lucia, St Vincent andthe Grenadines, Suriname, Trinidad and Tobago. Pacific: Cook Islands, Fiji Islands, Kiribati, Marshall Islands, Micronesia, Nauru, Niue, Palau, Papua New Guinea, Samoa, Solomon Islands, Tonga, Tuvalu, Vanuatu. (4) Will expire upon entry into force of the Cotonou Partnership Agreement. (5) Will expire 5 years after the date of entry into force. (6) Investment Facility from the European Development Fund, granted and managed by the EIB. (7) May also take the form of technical assistance. (8) Greenland; Mayotte, New Caledonia and Dependencies, French Polynesia, French Southern and Antarctic Territories, St Pierre and Miquelon, Wallis and Futuna;Aruba, Netherlands Antilles; Anguilla, British Antarctic Territory, British Indian Ocean Territory, British Virgin Islands, Cayman Islands, Falkland Islands, Montserrat,Pitcairn Island, St Helena and Dependencies, South Georgia and Sandwich Islands, Turks and Caicos Islands. (9) Algeria, Cyprus, Egypt, Gaza-West Bank, Israel, Jordan, Lebanon, Malta, Morocco, Syria, Tunisia, Turkey. (10) Balances remaining under earlier financial protocols or the entire amounts originally provided for may be drawn on concomitantly. (11) Albania, Bosnia-Herzegovina, Bulgaria, Croatia, Czech Republic, Estonia, Federal Republic of Yugoslavia, Former Yugoslav Republic of Macedonia, Hungary, Latvia,Lithuania, Poland, Romania, Slovakia, Slovenia. (12) Asia: Bangladesh, Brunei, China, India, Indonesia, Laos, Macao, Malaysia, Mongolia, Nepal, Pakistan, Philippines, Singapore, South Korea, Sri Lanka, Thailand,Vietnam, Yemen. Latin America: Argentina, Bolivia, Brazil, Chile, Colombia, Costa Rica, Ecuador, El Salvador, Guatemala, Honduras, Mexico, Nicaragua, Panama, Paraguay, Peru, Uruguay,Venezuela. (13) In the context of FEMIP, additional EU budgetary resources are being made available up to end-2006, in the form of grants for technical assistance and risk capitalactivities. (14) Bulgaria, Cyprus, Czech Republic, Estonia, Hungary, Latvia, Lithuania, Malta, Poland, Romania, Slovakia, Slovenia, Turkey.
1 658 1 300
1 700 2 200 (6) 195 (7)
35 30
2007 825 —
2007 6 425 —
2003 600 —
2007 450 —
2007 9 280 —
2004 100 —
2007 2 480 —
2004 1 000 —
2003 8 500 —
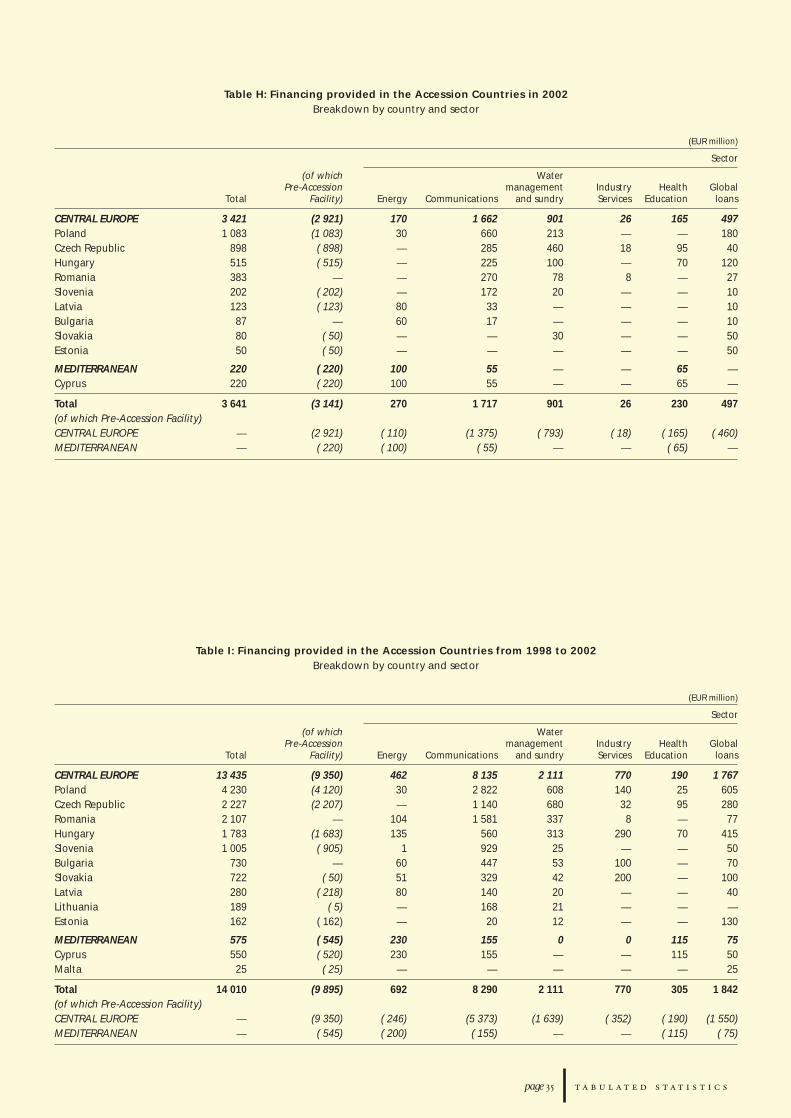
page
Table H: Financing provided in the Accession Countries in 2002 Breakdown by country and sector
(EUR million)
Sector
(of which WaterPre-Accession management Industry Health Global
Total Facility) Energy Communications and sundry Services Education loans
CENTRAL EUROPE Poland Czech Republic Hungary Romania Slovenia Latvia Bulgaria Slovakia Estonia
MEDITERRANEAN Cyprus
Total (of which Pre-Accession Facility) CENTRAL EUROPE MEDITERRANEAN
Table I: Financing provided in the Accession Countries from 1998 to 2002 Breakdown by country and sector
(EUR million)
Sector
(of which WaterPre-Accession management Industry Health Global
Total Facility) Energy Communications and sundry Services Education loans
CENTRAL EUROPE Poland Czech Republic Romania Hungary Slovenia Bulgaria Slovakia Latvia LithuaniaEstonia
MEDITERRANEAN Cyprus Malta
Total (of which Pre-Accession Facility) CENTRAL EUROPE MEDITERRANEAN
3 421 (2 921) 170 1 662 901 26 165 4971 083 (1 083) 30 660 213 — — 180
898 ( 898) — 285 460 18 95 40515 ( 515) — 225 100 — 70 120383 — — 270 78 8 — 27202 ( 202) — 172 20 — — 10123 ( 123) 80 33 — — — 1087 — 60 17 — — — 1080 ( 50) — — 30 — — 5050 ( 50) — — — — — 50
220 ( 220) 100 55 — — 65 —220 ( 220) 100 55 — — 65 —
3 641 (3 141) 270 1 717 901 26 230 497
— (2 921) ( 110) (1 375) ( 793) ( 18) ( 165) ( 460)— ( 220) ( 100) ( 55) — — ( 65) —
13 435 (9 350) 462 8 135 2 111 770 190 1 7674 230 (4 120) 30 2 822 608 140 25 6052 227 (2 207) — 1 140 680 32 95 2802 107 — 104 1 581 337 8 — 771 783 (1 683) 135 560 313 290 70 4151 005 ( 905) 1 929 25 — — 50
730 — 60 447 53 100 — 70722 ( 50) 51 329 42 200 — 100280 ( 218) 80 140 20 — — 40189 ( 5) — 168 21 — — —162 ( 162) — 20 12 — — 130
575 ( 545) 230 155 0 0 115 75550 ( 520) 230 155 — — 115 5025 ( 25) — — — — — 25
14 010 (9 895) 692 8 290 2 111 770 305 1 842
— (9 350) ( 246) (5 373) (1 639) ( 352) ( 190) (1 550)— ( 545) ( 200) ( 155) — — ( 115) ( 75)

page
Table J: Financing provided in the Partner Countries in 2002 Breakdown by country and sector
(EUR million)
Sector
Resources Water management Industry Global
Total own budgetary Energy Communications and sundry Services loans
EURO-MEDITERRANEAN PARTNERSHIP COUNTRIES . . . . .Turkey . . . . . . . . . . . . . . . .Tunisia . . . . . . . . . . . . . . . .Algeria . . . . . . . . . . . . . . . .Egypt . . . . . . . . . . . . . . . . .Morocco . . . . . . . . . . . . . . .Syria . . . . . . . . . . . . . . . . . .Lebanon . . . . . . . . . . . . . . .
ACP-OCT . . . . . . . . . . . . . . .Africa . . . . . . . . . . . . . . . . .
Southern and Indian Ocean . .West . . . . . . . . . . . . . . .Central and Equatorial . . . .East . . . . . . . . . . . . . . . .Multiregional . . . . . . . . . .
Caribbean . . . . . . . . . . . . . .Pacific . . . . . . . . . . . . . . . . .
SOUTH AFRICA . . . . . . . . . . .
ASIA, LATIN AMERICA (ALA) . . .Latin America . . . . . . . . . . . .Brazil . . . . . . . . . . . . . . . . .Regional - Central America . . . .Asia . . . . . . . . . . . . . . . . . .Indonesia . . . . . . . . . . . . . . .Sri Lanka . . . . . . . . . . . . . . .
BALKANS . . . . . . . . . . . . . .Federal Republic of Yugoslavia . .Croatia . . . . . . . . . . . . . . . .Bosnia-Herzegovina . . . . . . . .
Total . . . . . . . . . . . . . . . . .
Table K: Financing provided in the Euro-Mediterranean Partnership Countries from 1998 to 2002 Breakdown by country and sector
(EUR million)
Sector
Resources Water management Industry Global
Total own budgetary Energy Communications and sundry Services loans
Turkey . . . . . . . . . . . . . . . .Tunisia . . . . . . . . . . . . . . . .Morocco . . . . . . . . . . . . . . .Egypt . . . . . . . . . . . . . . . . .Algeria . . . . . . . . . . . . . . . .Syria . . . . . . . . . . . . . . . . . .Jordan . . . . . . . . . . . . . . . .Gaza-West Bank . . . . . . . . . . .Lebanon . . . . . . . . . . . . . . .Mediterranean Group . . . . . . .
Total . . . . . . . . . . . . . . . . .
1 588 1 551 37 510 605 60 382 31561 555 6 90 225 40 200 6290 290 — 150 120 — 20 —227 221 6 — 165 — 62 —225 200 25 150 50 — — 25140 140 — 120 — 20 — —100 100 — — — — 100 —45 45 — — 45 — — —
298 123 175 37 87 38 30 106213 83 130 37 87 23 30 3650 30 20 12 — 20 18 —48 20 28 — 20 3 4 2142 — 42 — 34 — 8 —40 — 40 25 — — — 1533 33 — — 33 — — —81 40 41 — — 15 — 664 — 4 — — — — 4
50 50 — — — — — 50
174 174 — 55 50 — — 7085 85 — 55 — — — 3055 55 — 55 — — — —30 30 — — — — — 3090 90 — — 50 — — 4050 50 — — 50 — — —40 40 — — — — — 40
425 425 — 70 310 — 25 20270 270 — 70 180 — — 20130 130 — — 130 — — —25 25 — — — — 25 —
2 534 2 323 212 672 1 052 98 437 277
1 628 1 610 18 90 297 589 200 453977 928 49 240 258 190 69 220949 902 47 305 270 163 130 81943 893 50 378 55 175 180 155625 616 9 — 305 255 65 —290 290 — 190 — — 100 —234 223 11 — — 40 183 11133 117 16 35 20 40 12 26105 105 — — 45 — — 60
6 — 6 — — — — 6
5 890 5 684 206 1 238 1 250 1 452 939 1 012
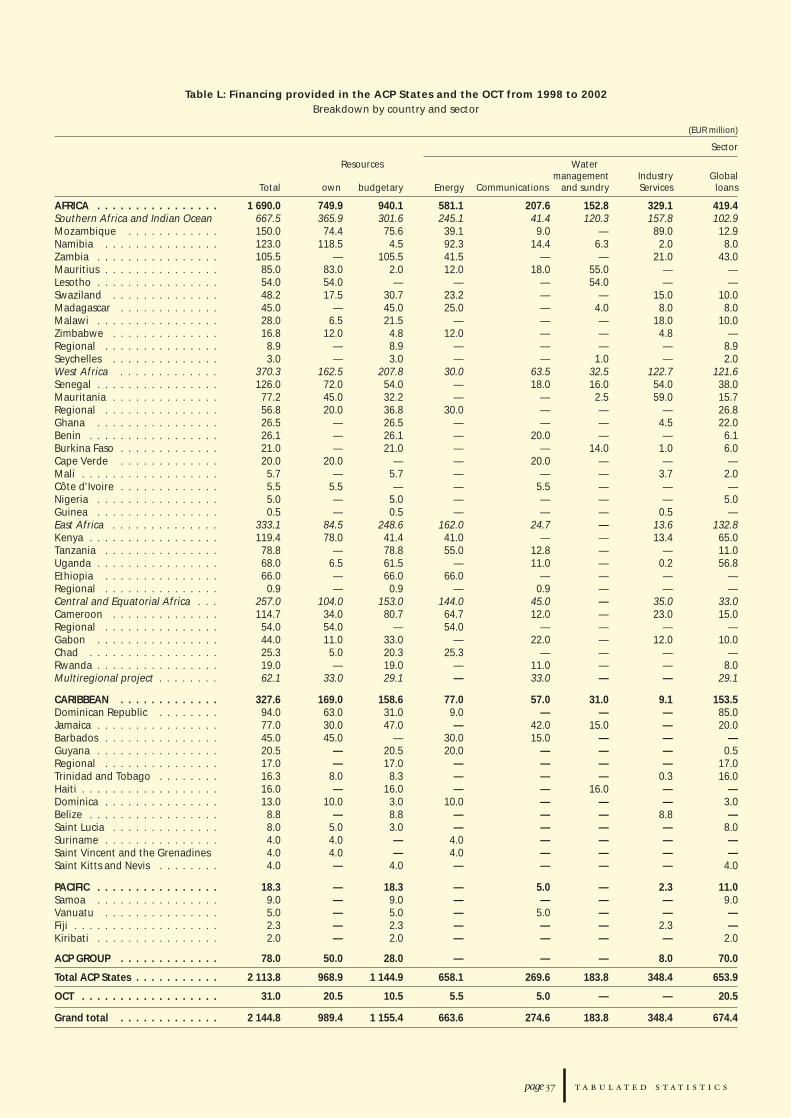
page
Table L: Financing provided in the ACP States and the OCT from 1998 to 2002 Breakdown by country and sector
(EUR million)
Sector
Resources Water management Industry Global
Total own budgetary Energy Communications and sundry Services loans
AFRICA . . . . . . . . . . . . . . . .Southern Africa and Indian OceanMozambique . . . . . . . . . . . .Namibia . . . . . . . . . . . . . . .Zambia . . . . . . . . . . . . . . . .Mauritius . . . . . . . . . . . . . . .Lesotho . . . . . . . . . . . . . . . .Swaziland . . . . . . . . . . . . . .Madagascar . . . . . . . . . . . . .Malawi . . . . . . . . . . . . . . . .Zimbabwe . . . . . . . . . . . . . .Regional . . . . . . . . . . . . . . .Seychelles . . . . . . . . . . . . . .West Africa . . . . . . . . . . . . .Senegal . . . . . . . . . . . . . . . .Mauritania . . . . . . . . . . . . . .Regional . . . . . . . . . . . . . . .Ghana . . . . . . . . . . . . . . . .Benin . . . . . . . . . . . . . . . . .Burkina Faso . . . . . . . . . . . . .Cape Verde . . . . . . . . . . . . .Mali . . . . . . . . . . . . . . . . . .Côte d'Ivoire . . . . . . . . . . . . .Nigeria . . . . . . . . . . . . . . . .Guinea . . . . . . . . . . . . . . . .East Africa . . . . . . . . . . . . . .Kenya . . . . . . . . . . . . . . . . .Tanzania . . . . . . . . . . . . . . .Uganda . . . . . . . . . . . . . . . .Ethiopia . . . . . . . . . . . . . . .Regional . . . . . . . . . . . . . . .Central and Equatorial Africa . . .Cameroon . . . . . . . . . . . . . .Regional . . . . . . . . . . . . . . .Gabon . . . . . . . . . . . . . . . .Chad . . . . . . . . . . . . . . . . .Rwanda . . . . . . . . . . . . . . . .Multiregional project . . . . . . . .
CARIBBEAN . . . . . . . . . . . . .Dominican Republic . . . . . . . .Jamaica . . . . . . . . . . . . . . . .Barbados . . . . . . . . . . . . . . .Guyana . . . . . . . . . . . . . . . .Regional . . . . . . . . . . . . . . .Trinidad and Tobago . . . . . . . .Haiti . . . . . . . . . . . . . . . . . .Dominica . . . . . . . . . . . . . . .Belize . . . . . . . . . . . . . . . . .Saint Lucia . . . . . . . . . . . . . .Suriname . . . . . . . . . . . . . . .Saint Vincent and the GrenadinesSaint Kitts and Nevis . . . . . . . .
PACIFIC . . . . . . . . . . . . . . . .Samoa . . . . . . . . . . . . . . . .Vanuatu . . . . . . . . . . . . . . .Fiji . . . . . . . . . . . . . . . . . . .Kiribati . . . . . . . . . . . . . . . .
ACP GROUP . . . . . . . . . . . . .
Total ACP States . . . . . . . . . . .
OCT . . . . . . . . . . . . . . . . . .
Grand total . . . . . . . . . . . . .
1 690.0 749.9 940.1 581.1 207.6 152.8 329.1 419.4667.5 365.9 301.6 245.1 41.4 120.3 157.8 102.9150.0 74.4 75.6 39.1 9.0 — 89.0 12.9123.0 118.5 4.5 92.3 14.4 6.3 2.0 8.0105.5 — 105.5 41.5 — — 21.0 43.085.0 83.0 2.0 12.0 18.0 55.0 — —54.0 54.0 — — — 54.0 — —48.2 17.5 30.7 23.2 — — 15.0 10.045.0 — 45.0 25.0 — 4.0 8.0 8.028.0 6.5 21.5 — — — 18.0 10.016.8 12.0 4.8 12.0 — — 4.8 —8.9 — 8.9 — — — — 8.93.0 — 3.0 — — 1.0 — 2.0
370.3 162.5 207.8 30.0 63.5 32.5 122.7 121.6126.0 72.0 54.0 — 18.0 16.0 54.0 38.077.2 45.0 32.2 — — 2.5 59.0 15.756.8 20.0 36.8 30.0 — — — 26.826.5 — 26.5 — — — 4.5 22.026.1 — 26.1 — 20.0 — — 6.121.0 — 21.0 — — 14.0 1.0 6.020.0 20.0 — — 20.0 — — —5.7 — 5.7 — — — 3.7 2.05.5 5.5 — — 5.5 — — —5.0 — 5.0 — — — — 5.00.5 — 0.5 — — — 0.5 —
333.1 84.5 248.6 162.0 24.7 — 13.6 132.8119.4 78.0 41.4 41.0 — — 13.4 65.078.8 — 78.8 55.0 12.8 — — 11.068.0 6.5 61.5 — 11.0 — 0.2 56.866.0 — 66.0 66.0 — — — —0.9 — 0.9 — 0.9 — — —
- 257.0 104.0 153.0 144.0 45.0 — 35.0 33.0114.7 34.0 80.7 64.7 12.0 — 23.0 15.054.0 54.0 — 54.0 — — — —44.0 11.0 33.0 — 22.0 — 12.0 10.025.3 5.0 20.3 25.3 — — — —19.0 — 19.0 — 11.0 — — 8.062.1 33.0 29.1 — 33.0 — — 29.1
327.6 169.0 158.6 77.0 57.0 31.0 9.1 153.594.0 63.0 31.0 9.0 — — — 85.077.0 30.0 47.0 — 42.0 15.0 — 20.045.0 45.0 — 30.0 15.0 — — —20.5 — 20.5 20.0 — — — 0.517.0 — 17.0 — — — — 17.016.3 8.0 8.3 — — — 0.3 16.016.0 — 16.0 — — 16.0 — —13.0 10.0 3.0 10.0 — — — 3.08.8 — 8.8 — — — 8.8 —8.0 5.0 3.0 — — — — 8.04.0 4.0 — 4.0 — — — —4.0 4.0 — 4.0 — — — —4.0 — 4.0 — — — — 4.0
18.3 — 18.3 — 5.0 — 2.3 11.09.0 — 9.0 — — — — 9.05.0 — 5.0 — 5.0 — — —2.3 — 2.3 — — — 2.3 —2.0 — 2.0 — — — — 2.0
78.0 50.0 28.0 — — — 8.0 70.0
2 113.8 968.9 1 144.9 658.1 269.6 183.8 348.4 653.9
31.0 20.5 10.5 5.5 5.0 — — 20.5
2 144.8 989.4 1 155.4 663.6 274.6 183.8 348.4 674.4
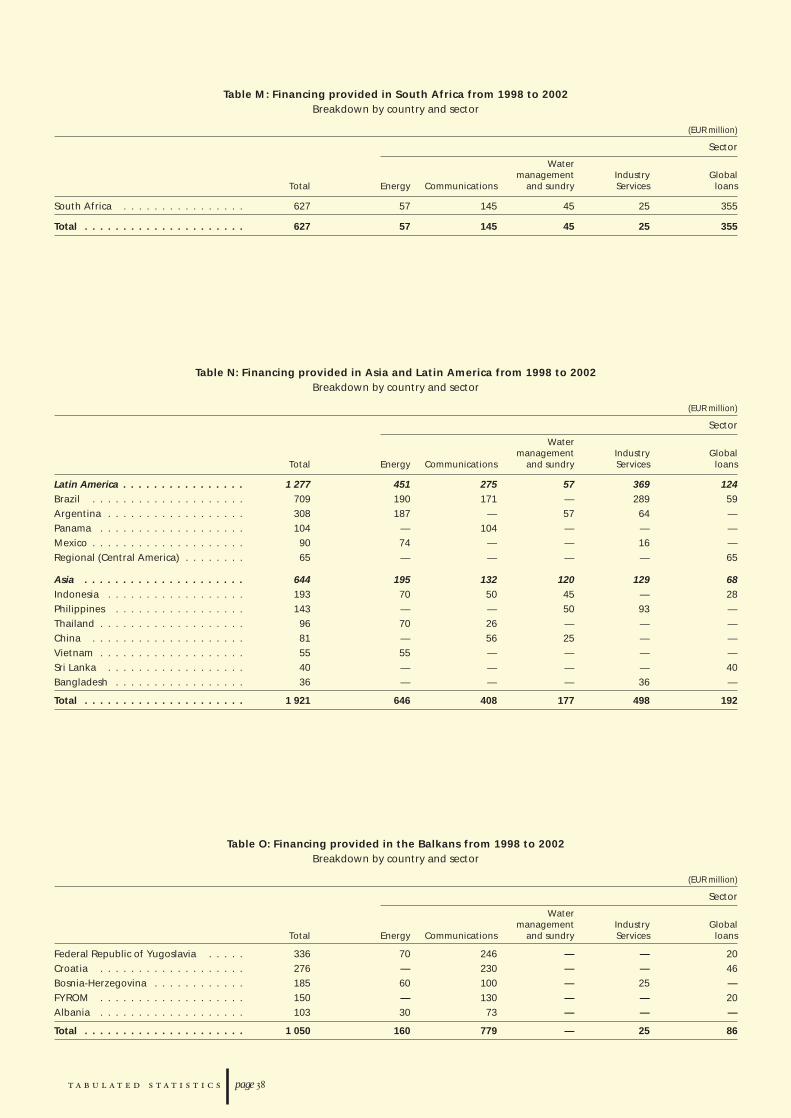
page
Table M: Financing provided in South Africa from 1998 to 2002 Breakdown by country and sector
(EUR million)
Sector
Watermanagement Industry Global
Total Energy Communications and sundry Services loans
South Africa . . . . . . . . . . . . . . . .
Total . . . . . . . . . . . . . . . . . . . . .
Table N: Financing provided in Asia and Latin America from 1998 to 2002 Breakdown by country and sector
(EUR million)
Sector
Watermanagement Industry Global
Total Energy Communications and sundry Services loans
Latin America . . . . . . . . . . . . . . . .Brazil . . . . . . . . . . . . . . . . . . . .Argentina . . . . . . . . . . . . . . . . . .Panama . . . . . . . . . . . . . . . . . . .Mexico . . . . . . . . . . . . . . . . . . . .Regional (Central America) . . . . . . . .
Asia . . . . . . . . . . . . . . . . . . . . .Indonesia . . . . . . . . . . . . . . . . . .Philippines . . . . . . . . . . . . . . . . .Thailand . . . . . . . . . . . . . . . . . . .China . . . . . . . . . . . . . . . . . . . .Vietnam . . . . . . . . . . . . . . . . . . .Sri Lanka . . . . . . . . . . . . . . . . . .Bangladesh . . . . . . . . . . . . . . . . .
Total . . . . . . . . . . . . . . . . . . . . .
Table O: Financing provided in the Balkans from 1998 to 2002 Breakdown by country and sector
(EUR million)
Sector
Watermanagement Industry Global
Total Energy Communications and sundry Services loans
Federal Republic of Yugoslavia . . . . .Croatia . . . . . . . . . . . . . . . . . . .Bosnia-Herzegovina . . . . . . . . . . . .FYROM . . . . . . . . . . . . . . . . . . .Albania . . . . . . . . . . . . . . . . . . .
Total . . . . . . . . . . . . . . . . . . . . .
627 57 145 45 25 355
627 57 145 45 25 355
1 277 451 275 57 369 124709 190 171 — 289 59308 187 — 57 64 —104 — 104 — — —90 74 — — 16 —65 — — — — 65
644 195 132 120 129 68193 70 50 45 — 28143 — — 50 93 —96 70 26 — — —81 — 56 25 — —55 55 — — — —40 — — — — 4036 — — — 36 —
1 921 646 408 177 498 192
336 70 246 — — 20276 — 230 — — 46185 60 100 — 25 —150 — 130 — — 20103 30 73 — — —
1 050 160 779 — 25 86

Table P: Borrowings signed in 2002 - List of operations
Month Subscription Amount (million) Amount (million) Life Coupon (%)/of issue currency Characteristics Currency EUR (years) Structure
Medium and long-term operations (before swaps)PUBLIC BORROWING OPERATIONSJanuary
structured
structured structured structured structured
zero coupon February structured
zero coupon March structured
floating
April zero coupon
structured
structured May
June structured
structured zero coupon
July
structured
August
page
USD (1) 200 226.9 5.0 4.750 EUR (1) 10 10.0 4.8GBP 100 164.3 3.9 6.125 PLN (1) 100 28.6 2.0 9.000 HUF (1) 7 000 28.6 2.0 7.750 USD 3 000 3 404.1 3.2 4.000
TWD 1 000 32.4 4.2 3.100 TWD 1 000 32.4 4.5 3.110 TWD 1 000 32.4 4.7 3.130 TWD 1 000 32.4 5.0 3.170 TWD 1 000 32.4 5.2 3.170 TWD 1 000 32.4 5.5 3.18 TWD 1 000 32.4 5.7 3.190 GBP (1) 150 246.5 4.9 5.000 GBP 150 246.5 2.8 6.000 ZAR (1) 150 14.4 5.9 8.500 EUR (2) 2 000 2 000.0 3.2 3.875 USD (1) 75 86.8 10.0USD (1) 20 23.2 20.0USD (1) 20 23.2 20.0USD (1) 20 23.2 20.0ZAR (1) 150 15.1 4.5 9.000 ZAR (1) 350 35.2 4.9 11.000 HUF (1) 5 000 20.5 1.0 7.500 NOK (1) 100 12.8 5.5 5.375 PLN (1) 148 41.1 9.8USD (1) 10 11.6 10.0NOK (1) 500 64.8 6.0 6.500 USD 3 000 3 473.4 5.0 4.625 PLN (1) 98 26.8 15.3USD (1) 20 23.1 2.5NOK (1) 400 51.9 4.0 6.750 USD (1) 500 578.0 6.7 5.500 GBP (1) 1 000 1 636.3 2.9AUD (1) 880 525.0 3.0 5.250 GBP (1) 150 244.7 4.7 5.000 CZK (1) 1 000 32.2 5.0 5.000 ZAR (1) 150 15.1 4.3 9.000
NOK (1) 250 32.5 5.9 6.500 EUR (1) 15 15.0 15.0PLN (1) 50 13.9 1.7 9.000 EUR 30 30.0 5.0USD (1) 500 555.1 3.6 4.250 EUR 250 250.0 8.0 5.125 NZD (1) 100 49.6 5.6 7.000 ZAR (1) 150 15.1 8.9 10.500 USD (1) 100 111.0 8.0PLN (1) 100 27.7 1.7 9.000 EUR (2) 5 000 5 000.0 10.4 5.375 DKK (1) 400 53.8 8.0 5.000 USD 3 000 3 330.4 3.3 4.000 EUR (1) 10 10.0 4.0GBP (1) 150 234.2 4.4 5.000 HUF (1) 4 000 16.5 1.5 7.750 EUR (1) 30 30.0 6.0PLN (1) 53 13.2 9.4HUF 10 000 40.8 10.2 9.500 USD (1) 285 285.7 4.0 3.600 GBP (1) 200 307.8 4.4 5.000 EUR (1) 25 25.0 10.0USD (1) 50 50.1 10.0 0.500 GBP 150 230.8 3.4 6.125 GBP (1) 150 230.8 4.4 5.000 HUF (1) 4 000 16.3 1.4 7.750 GBP 100 159.7 18.8 5.375 GBP 100 159.7 9.3 5.500 GBP (1) 100 157.4 4.2 5.000
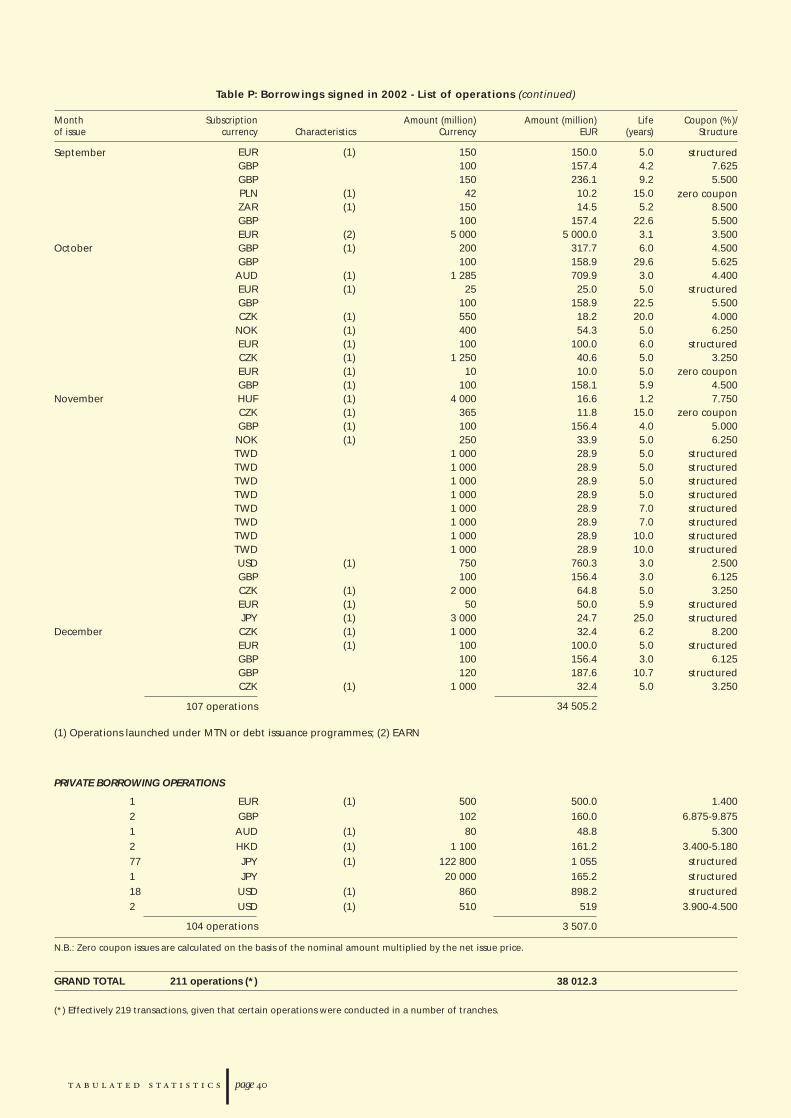
Table P: Borrowings signed in 2002 - List of operations (continued)
Month Subscription Amount (million) Amount (million) Life Coupon (%)/of issue currency Characteristics Currency EUR (years) Structure
September structured
zero coupon
October
structured
structured
zero coupon
November zero coupon
structured structured structured structured structured structured structured structured
structured structured
December structured
structured
107 operations
(1) Operations launched under MTN or debt issuance programmes; (2) EARN
PRIVATE BORROWING OPERATIONS
structured structured structured
104 operations
N.B.: Zero coupon issues are calculated on the basis of the nominal amount multiplied by the net issue price.
GRAND TOTAL 211 operations (*)
(*) Effectively 219 transactions, given that certain operations were conducted in a number of tranches.
page
EUR (1) 150 150.0 5.0GBP 100 157.4 4.2 7.625 GBP 150 236.1 9.2 5.500 PLN (1) 42 10.2 15.0ZAR (1) 150 14.5 5.2 8.500 GBP 100 157.4 22.6 5.500 EUR (2) 5 000 5 000.0 3.1 3.500 GBP (1) 200 317.7 6.0 4.500 GBP 100 158.9 29.6 5.625 AUD (1) 1 285 709.9 3.0 4.400 EUR (1) 25 25.0 5.0GBP 100 158.9 22.5 5.500 CZK (1) 550 18.2 20.0 4.000
NOK (1) 400 54.3 5.0 6.250 EUR (1) 100 100.0 6.0CZK (1) 1 250 40.6 5.0 3.250 EUR (1) 10 10.0 5.0GBP (1) 100 158.1 5.9 4.500 HUF (1) 4 000 16.6 1.2 7.750 CZK (1) 365 11.8 15.0GBP (1) 100 156.4 4.0 5.000
NOK (1) 250 33.9 5.0 6.250 TWD 1 000 28.9 5.0TWD 1 000 28.9 5.0TWD 1 000 28.9 5.0TWD 1 000 28.9 5.0TWD 1 000 28.9 7.0TWD 1 000 28.9 7.0TWD 1 000 28.9 10.0TWD 1 000 28.9 10.0USD (1) 750 760.3 3.0 2.500 GBP 100 156.4 3.0 6.125 CZK (1) 2 000 64.8 5.0 3.250 EUR (1) 50 50.0 5.9JPY (1) 3 000 24.7 25.0CZK (1) 1 000 32.4 6.2 8.200 EUR (1) 100 100.0 5.0GBP 100 156.4 3.0 6.125 GBP 120 187.6 10.7CZK (1) 1 000 32.4 5.0 3.250
34 505.2
1 EUR (1) 500 500.0 1.400 2 GBP 102 160.0 6.875-9.875 1 AUD (1) 80 48.8 5.300 2 HKD (1) 1 100 161.2 3.400-5.180 77 JPY (1) 122 800 1 0551 JPY 20 000 165.218 USD (1) 860 898.22 USD (1) 510 519 3.900-4.500
3 507.0
38 012.3
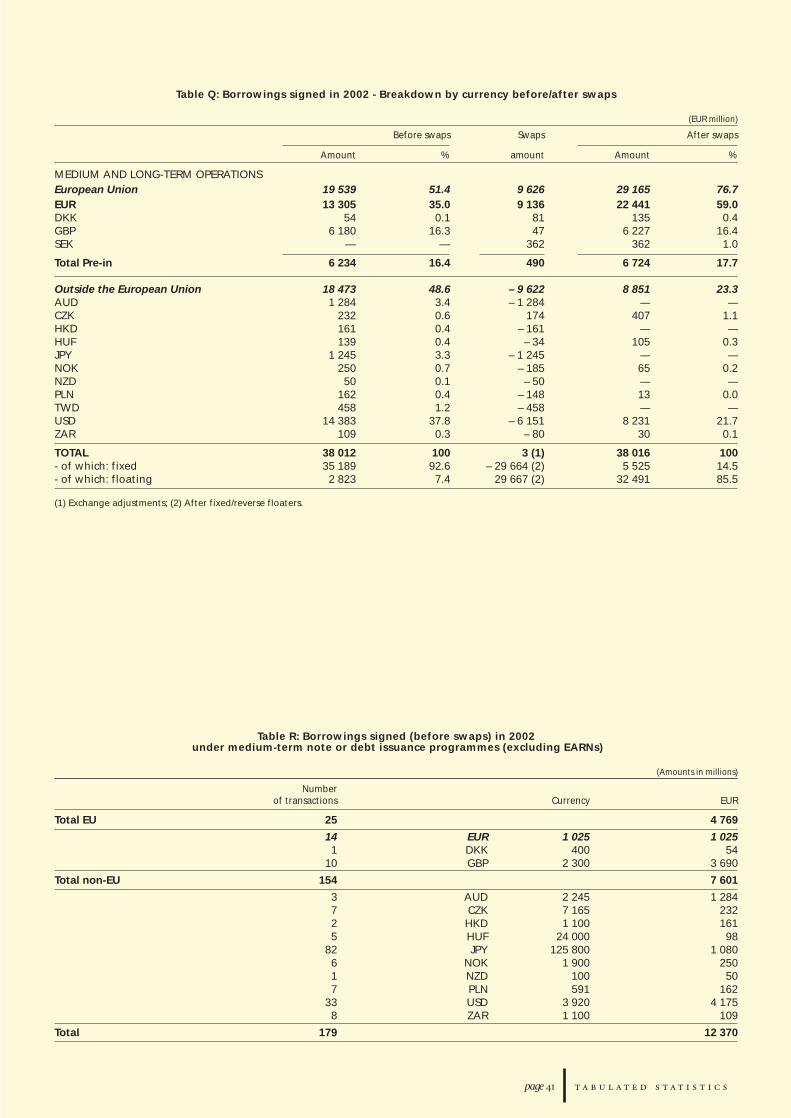
Table Q: Borrowings signed in 2002 - Breakdown by currency before/after swaps
(EUR million)
Before swaps Swaps After swaps
Amount % amount Amount %
MEDIUM AND LONG-TERM OPERATIONS European Union EUR DKK GBP SEK
Total Pre-in
Outside the European Union AUD CZK HKD HUF JPY NOK NZD PLN TWD USD ZAR
TOTAL - of which: fixed - of which: floating
(1) Exchange adjustments; (2) After fixed/reverse floaters.
Table R: Borrowings signed (before swaps) in 2002under medium-term note or debt issuance programmes (excluding EARNs)
(Amounts in millions)
Numberof transactions Currency EUR
Total EU
Total non-EU
Total
page
19 539 51.4 9 626 29 165 76.713 305 35.0 9 136 22 441 59.0
54 0.1 81 135 0.46 180 16.3 47 6 227 16.4
— — 362 362 1.0
6 234 16.4 490 6 724 17.7
18 473 48.6 – 9 622 8 851 23.31 284 3.4 – 1 284 — —
232 0.6 174 407 1.1161 0.4 – 161 — —139 0.4 – 34 105 0.3
1 245 3.3 – 1 245 — —250 0.7 – 185 65 0.250 0.1 – 50 — —
162 0.4 – 148 13 0.0458 1.2 – 458 — —
14 383 37.8 – 6 151 8 231 21.7109 0.3 – 80 30 0.1
38 012 100 3 (1) 38 016 10035 189 92.6 – 29 664 (2) 5 525 14.52 823 7.4 29 667 (2) 32 491 85.5
25 4 769
14 EUR 1 025 1 025 1 DKK 400 54
10 GBP 2 300 3 690
154 7 601
3 AUD 2 245 1 284 7 CZK 7 165 232 2 HKD 1 100 161 5 HUF 24 000 98
82 JPY 125 800 1 080 6 NOK 1 900 250 1 NZD 100 50 7 PLN 591 162
33 USD 3 920 4 175 8 ZAR 1 100 109
179 12 370
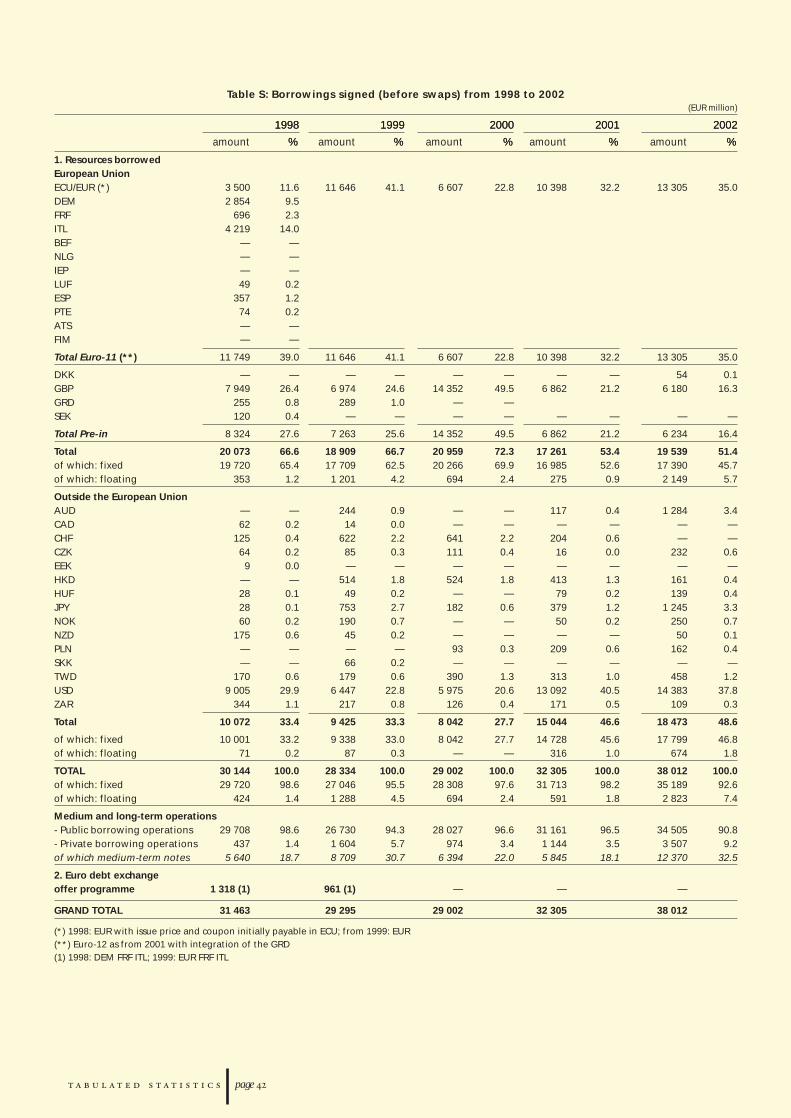
page
Table S: Borrowings signed (before swaps) from 1998 to 2002 (EUR million)
1998 1999 2000 2001 2002
amount % amount % amount % amount % amount %
1. Resources borrowedEuropean Union ECU/EUR (*) DEM FRF ITL BEF NLG IEP LUF ESP PTE ATS FIM
Total Euro-11 (**)
DKK GBP GRDSEK
Total Pre-in
Total of which: fixed of which: floating
Outside the European Union AUD CAD CHF CZK EEK HKD HUF JPY NOK NZD PLN SKK TWD USD ZAR
Total
of which: fixedof which: floating
TOTAL of which: fixedof which: floating
Medium and long-term operations - Public borrowing operations- Private borrowing operationsof which medium-term notes
2. Euro debt exchangeoffer programme
GRAND TOTAL
(*) 1998: EUR with issue price and coupon initially payable in ECU; from 1999: EUR (**) Euro-12 as from 2001 with integration of the GRD (1) 1998: DEM FRF ITL; 1999: EUR FRF ITL
1998 1999 2000 2001 2002
% % % % %
3 500 11.6 11 646 41.1 6 607 22.8 10 398 32.2 13 305 35.02 854 9.5
696 2.34 219 14.0
— —— —— —49 0.2
357 1.274 0.2— —— —
11 749 39.0 11 646 41.1 6 607 22.8 10 398 32.2 13 305 35.0
— — — — — — — — 54 0.17 949 26.4 6 974 24.6 14 352 49.5 6 862 21.2 6 180 16.3
255 0.8 289 1.0 — —120 0.4 — — — — — — — —
8 324 27.6 7 263 25.6 14 352 49.5 6 862 21.2 6 234 16.4
20 073 66.6 18 909 66.7 20 959 72.3 17 261 53.4 19 539 51.419 720 65.4 17 709 62.5 20 266 69.9 16 985 52.6 17 390 45.7
353 1.2 1 201 4.2 694 2.4 275 0.9 2 149 5.7
— — 244 0.9 — — 117 0.4 1 284 3.462 0.2 14 0.0 — — — — — —
125 0.4 622 2.2 641 2.2 204 0.6 — —64 0.2 85 0.3 111 0.4 16 0.0 232 0.69 0.0 — — — — — — — —
— — 514 1.8 524 1.8 413 1.3 161 0.428 0.1 49 0.2 — — 79 0.2 139 0.428 0.1 753 2.7 182 0.6 379 1.2 1 245 3.360 0.2 190 0.7 — — 50 0.2 250 0.7
175 0.6 45 0.2 — — — — 50 0.1— — — — 93 0.3 209 0.6 162 0.4— — 66 0.2 — — — — — —
170 0.6 179 0.6 390 1.3 313 1.0 458 1.29 005 29.9 6 447 22.8 5 975 20.6 13 092 40.5 14 383 37.8
344 1.1 217 0.8 126 0.4 171 0.5 109 0.3
10 072 33.4 9 425 33.3 8 042 27.7 15 044 46.6 18 473 48.6
10 001 33.2 9 338 33.0 8 042 27.7 14 728 45.6 17 799 46.871 0.2 87 0.3 — — 316 1.0 674 1.8
30 144 100.0 28 334 100.0 29 002 100.0 32 305 100.0 38 012 100.029 720 98.6 27 046 95.5 28 308 97.6 31 713 98.2 35 189 92.6
424 1.4 1 288 4.5 694 2.4 591 1.8 2 823 7.4
29 708 98.6 26 730 94.3 28 027 96.6 31 161 96.5 34 505 90.8437 1.4 1 604 5.7 974 3.4 1 144 3.5 3 507 9.2
5 640 18.7 8 709 30.7 6 394 22.0 5 845 18.1 12 370 32.5
1 318 (1) 961 (1) — — —
31 463 29 295 29 002 32 305 38 012
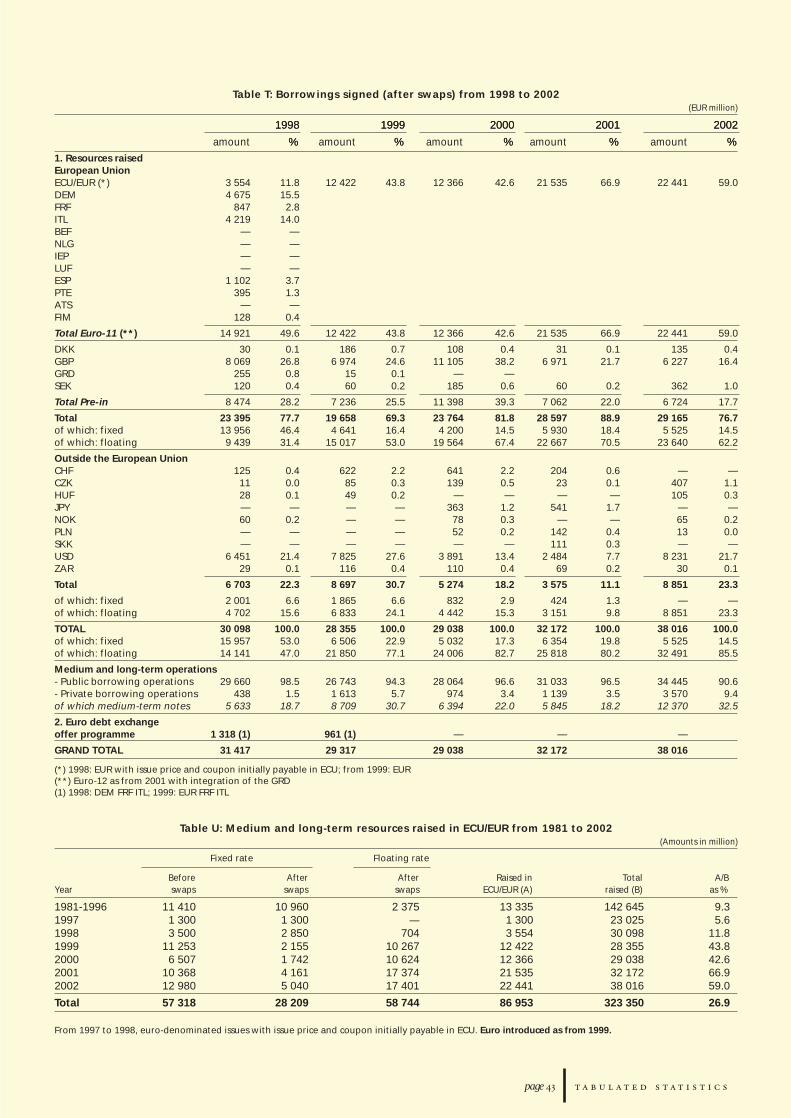
Table T: Borrowings signed (after swaps) from 1998 to 2002 (EUR million)
1998 1999 2000 2001 2002
amount % amount % amount % amount % amount % 1. Resources raisedEuropean Union ECU/EUR (*) DEMFRFITLBEFNLGIEPLUFESPPTEATSFIM
Total Euro-11 (**)
DKK GBP GRD SEK
Total Pre-in
Total of which: fixed of which: floating
Outside the European Union CHF CZK HUF JPY NOK PLN SKK USD ZAR
Total
of which: fixed of which: floating
TOTAL of which: fixed of which: floating
Medium and long-term operations - Public borrowing operations - Private borrowing operations of which medium-term notes
2. Euro debt exchange offer programme
GRAND TOTAL
(*) 1998: EUR with issue price and coupon initially payable in ECU; from 1999: EUR (**) Euro-12 as from 2001 with integration of the GRD (1) 1998: DEM FRF ITL; 1999: EUR FRF ITL
Table U: Medium and long-term resources raised in ECU/EUR from 1981 to 2002 (Amounts in million)
Fixed rate Floating rate
Before After After Raised in Total A/BYear swaps swaps swaps ECU/EUR (A) raised (B) as %
Total
From 1997 to 1998, euro-denominated issues with issue price and coupon initially payable in ECU. Euro introduced as from 1999.
page
1998 1999 2000 2001 2002
% % % % %
3 554 11.8 12 422 43.8 12 366 42.6 21 535 66.9 22 441 59.04 675 15.5
847 2.84 219 14.0
— —— —— —— —
1 102 3.7395 1.3
— —128 0.4
14 921 49.6 12 422 43.8 12 366 42.6 21 535 66.9 22 441 59.0
30 0.1 186 0.7 108 0.4 31 0.1 135 0.48 069 26.8 6 974 24.6 11 105 38.2 6 971 21.7 6 227 16.4
255 0.8 15 0.1 — —120 0.4 60 0.2 185 0.6 60 0.2 362 1.0
8 474 28.2 7 236 25.5 11 398 39.3 7 062 22.0 6 724 17.7
23 395 77.7 19 658 69.3 23 764 81.8 28 597 88.9 29 165 76.713 956 46.4 4 641 16.4 4 200 14.5 5 930 18.4 5 525 14.59 439 31.4 15 017 53.0 19 564 67.4 22 667 70.5 23 640 62.2
125 0.4 622 2.2 641 2.2 204 0.6 — —11 0.0 85 0.3 139 0.5 23 0.1 407 1.128 0.1 49 0.2 — — — — 105 0.3— — — — 363 1.2 541 1.7 — —60 0.2 — — 78 0.3 — — 65 0.2— — — — 52 0.2 142 0.4 13 0.0— — — — — — 111 0.3 — —
6 451 21.4 7 825 27.6 3 891 13.4 2 484 7.7 8 231 21.729 0.1 116 0.4 110 0.4 69 0.2 30 0.1
6 703 22.3 8 697 30.7 5 274 18.2 3 575 11.1 8 851 23.3
2 001 6.6 1 865 6.6 832 2.9 424 1.3 — —4 702 15.6 6 833 24.1 4 442 15.3 3 151 9.8 8 851 23.3
30 098 100.0 28 355 100.0 29 038 100.0 32 172 100.0 38 016 100.015 957 53.0 6 506 22.9 5 032 17.3 6 354 19.8 5 525 14.514 141 47.0 21 850 77.1 24 006 82.7 25 818 80.2 32 491 85.5
29 660 98.5 26 743 94.3 28 064 96.6 31 033 96.5 34 445 90.6438 1.5 1 613 5.7 974 3.4 1 139 3.5 3 570 9.4
5 633 18.7 8 709 30.7 6 394 22.0 5 845 18.2 12 370 32.5
1 318 (1) 961 (1) — — —31 417 29 317 29 038 32 172 38 016
1981-1996 11 410 10 960 2 375 13 335 142 645 9.31997 1 300 1 300 — 1 300 23 025 5.61998 3 500 2 850 704 3 554 30 098 11.81999 11 253 2 155 10 267 12 422 28 355 43.82000 6 507 1 742 10 624 12 366 29 038 42.62001 10 368 4 161 17 374 21 535 32 172 66.92002 12 980 5 040 17 401 22 441 38 016 59.0
57 318 28 209 58 744 86 953 323 350 26.9
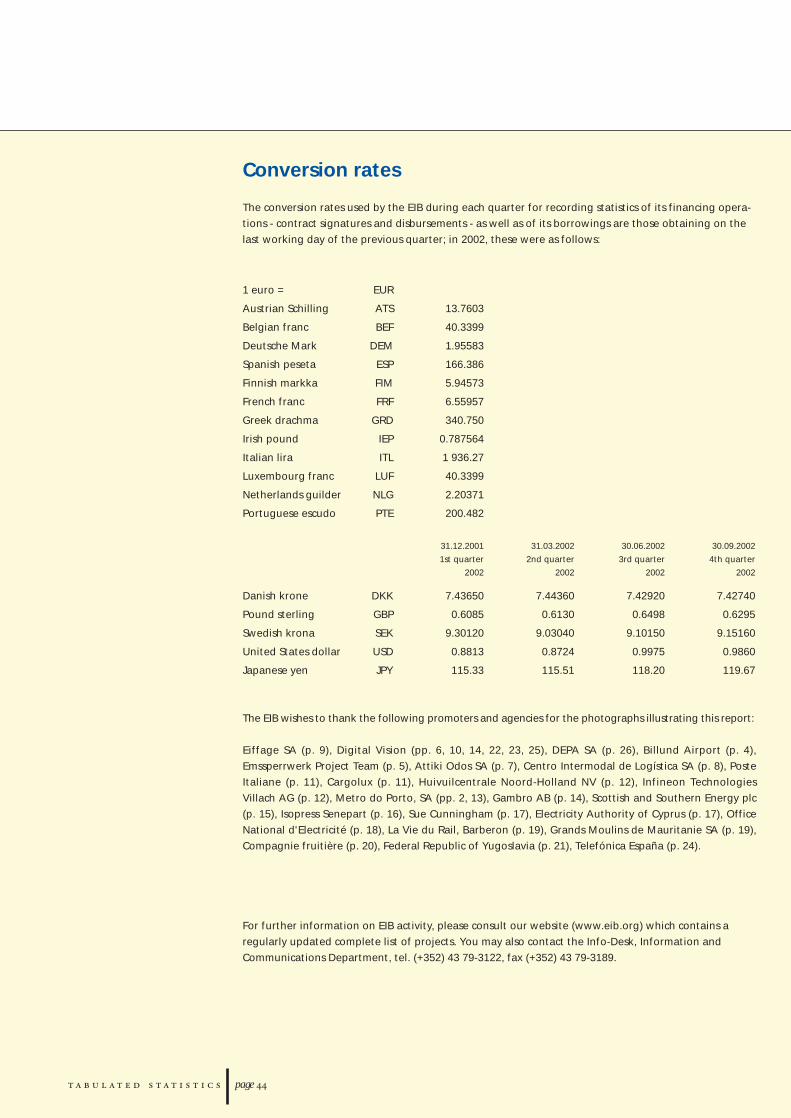
page
Conversion rates
The conversion rates used by the EIB during each quarter for recording statistics of its financing opera-
tions - contract signatures and disbursements - as well as of its borrowings are those obtaining on the
last working day of the previous quarter; in 2002, these were as follows:
1 euro = EUR
Austrian Schilling ATS
Belgian franc BEF
Deutsche Mark DEM
Spanish peseta ESP
Finnish markka FIM
French franc FRF
Greek drachma GRD
Irish pound IEP
Italian lira ITL
Luxembourg franc LUF
Netherlands guilder NLG
Portuguese escudo PTE
31.12.2001 31.03.2002 30.06.2002 30.09.2002
1st quarter 2nd quarter 3rd quarter 4th quarter
Danish krone DKK
Pound sterling GBP
Swedish krona SEK
United States dollar USD
Japanese yen JPY
The EIB wishes to thank the following promoters and agencies for the photographs illustrating this report:
Eiffage SA (p. 9), Digital Vision (pp. 6, 10, 14, 22, 23, 25), DEPA SA (p. 26), Billund Airport (p. 4),
Emssperrwerk Project Team (p. 5), Attiki Odos SA (p. 7), Centro Intermodal de Logística SA (p. 8), Poste
Italiane (p. 11), Cargolux (p. 11), Huivuilcentrale Noord-Holland NV (p. 12), Infineon Technologies
Villach AG (p. 12), Metro do Porto, SA (pp. 2, 13), Gambro AB (p. 14), Scottish and Southern Energy plc
(p. 15), Isopress Senepart (p. 16), Sue Cunningham (p. 17), Electricity Authority of Cyprus (p. 17), Office
National d'Electricité (p. 18), La Vie du Rail, Barberon (p. 19), Grands Moulins de Mauritanie SA (p. 19),
Compagnie fruitière (p. 20), Federal Republic of Yugoslavia (p. 21), Telefónica España (p. 24).
For further information on EIB activity, please consult our website (www.eib.org) which contains a
regularly updated complete list of projects. You may also contact the Info-Desk, Information and
Communications Department, tel. (+352) 43 79-3122, fax (+352) 43 79-3189.
13.7603
40.3399
1.95583
166.386
5.94573
6.55957
340.750
0.787564
1 936.27
40.3399
2.20371
200.482
2002 2002 2002 2002
7.43650 7.44360 7.42920 7.42740
0.6085 0.6130 0.6498 0.6295
9.30120 9.03040 9.10150 9.15160
0.8813 0.8724 0.9975 0.9860
115.33 115.51 118.20 119.67
EIB Group addresses
European Investment Bank100, boulevard Konrad AdenauerL-2950 LuxembourgTel. (+352) 43 79-1Fax (+352) 43 77 04
Website: www.eib.orgE-mail: [email protected]
Department for Interinstitutional AffairsBrussels Office:
Rue de la Loi 227B-1040 BruxellesTel. (+32-2) 235 00 70Fax (+32-2) 230 58 27
Athens Office:
364, Kifissias Ave & 1, DelfonGR-152 33 Halandri/AthensTel. (+30) 21 06 82 45 17Fax (+30) 21 06 82 45 20
London Office:
2 Royal Exchange BuildingsLondon EC3V 3LFUnited KingdomTel. (+44) 20 73 75 96 60Fax (+44) 20 73 75 96 99
aDepartment for Lending Operations inItaly, Greece, Cyprus and Malta:
Via Sardegna 38I-00187 RomaTel. (+39) 06 47 19-1Fax (+39) 06 42 87 34 38
Berlin Office:
Lennéstraße 11D-10785 BerlinTel. (+49-30) 59 00 47 90Fax (+49-30) 59 00 47 99
Madrid Office:
Calle José Ortega y Gasset, 29E-28006 MadridTel. (+34) 914 31 13 40Fax (+34) 914 31 13 83
Lisbon Office:
Avenida da Liberdade, 144-156, 8°P-1250-146 LisboaTel. (+351) 213 42 89 89Fax (+351) 213 47 04 87
Cairo Office:
6 Boulos Hannah Street Dokki, Giza (Cairo)EgyptTel. (+20-2) 762 00 77
European Investment Fund43, avenue J.F. KennedyL-2968 LuxembourgTel. (+352) 42 66 88-1Fax (+352) 42 66 88-200
Website: www.eif.orgE-mail: [email protected]

ISS
N 1681-4126
© EIB - EN - 03/2003