Embed Size (px)
Citation preview
Munich Personal RePEc Archive
The Effect of the Spanish Reconquest on
Iberian Cities
David, Cuberes and Rafael, González-Val
Clark University, Universidad de Zaragoza Institut d’Economia de
Barcelona
21 January 2017
Online at https://mpra.ub.uni-muenchen.de/76374/
MPRA Paper No. 76374, posted 25 Jan 2017 09:55 UTC
The Effect of the Spanish Reconquest on Iberian Cities*
David Cuberes
Clark University
Rafael González-Val Universidad de Zaragoza & Institut d’Economia de Barcelona
This paper studies the effect of the Spanish Reconquest, a military campaign against the Muslims in the medieval Iberian Peninsula that ended up with the expulsion or extermination of most of the Muslim population from this territory. We use this major historical event to study the persistence of population shocks at the city level. We find that the Reconquest had an average significant negative effect on the relative and log-scale population of the main Iberian cities even after controlling for a large set of country and city-specific geographical and economic indicators, as well as city-specific time trends. Nevertheless, our results show that this negative shock was relatively short-lived, vanishing on average within the first one hundred years after the onset of the Reconquest. These results suggest that the locational fundamentals that determined the size of Iberian cities before the Reconquest were more important determinants of the fate of these cities than the direct negative impact that the Reconquest may have had on their population. Our findings can also be interpreted as weak evidence on the negative effect that war and conflict can have on urban population.
JEL classification: R12, N9
Keywords: locational fundamentals; city growth; lock-in effects; warfare, conflict and cities
* Rafael González-Val acknowledges financial support from the Spanish Ministerio de Economía y Competitividad (ECO2013-45969-P and ECO2016-75941-R projects), the DGA (ADETRE research group) and FEDER. We thank Daniel Da Mata, William Kerr, Volker Nitsch, Leandro Prados de la Escosura, Kate Lang, Nicolai Wendland, Nuno Palma, António Henriques, and seminar participants at the Annual North American Meetings of the Regional Science Association International 2012 (Ottawa), Royal Economic Society 2013 (Royal Holloway), Darmstadt University, Annual Conference of the European Society for Population Economics 2013 (Aarhus), Meeting of the Urban Economics Association at the Congress of the European Regional Science Association 2013 (Palermo), Symposium of Economic Analysis 2013 (Santander), Applied Economics Meeting 2014 (Gran Canaria), Meeting of the Urban Economics Association at the Annual North American Meetings of the Regional Science Association International 2014 (Washington), Seventh Iberian Economic History Conference (Porto) and Jan Tinbergen European Peace Science Conference 2015 (University of Warwick) for their helpful comments. This paper was previously circulated under the title “History and Urban Primacy: The Effect of the Spanish Reconquista on Muslim Cities.”
1
1. Introduction
The persistence of negative shocks on a city’s population has long been studied in the urban
economics and economic geography literature. In most models of city formation, once random
events determine a particular initial condition (e.g., a settlement in a specific location),
subsequent population growth becomes locked-in regardless of the advantages of different
alternatives. In these theories, first-nature forces – that is, characteristics that are intrinsic to a
specific location, like proximity to navigable waters or climate – are crucial determinants of a
city’s fate.
The main implication of these models is that exogenous shocks to population should only
have temporary effects as long as the fundamental features that determined the location and size
of the city in the first place are not affected. A different—and much more scant—strand of the
literature studies the relationship between urban agglomerations and warfare or conflict. The
theoretical link between these two variables is unclear, and the few existing empirical studies
find ambiguous results.
In this paper, we use a major historical event that allows us to formally study the
behaviour of several cities after a period of conflict and warfare – the Spanish Reconquest. We
focus on the striking population shifts that took place in the Iberian Peninsula between the 700-
1500 A.D. This period of time witnessed the invasion of the peninsula by the Moors1 armies
from Northern Africa in 710 and its subsequent expulsion at the end of the Reconquest, around
1500.
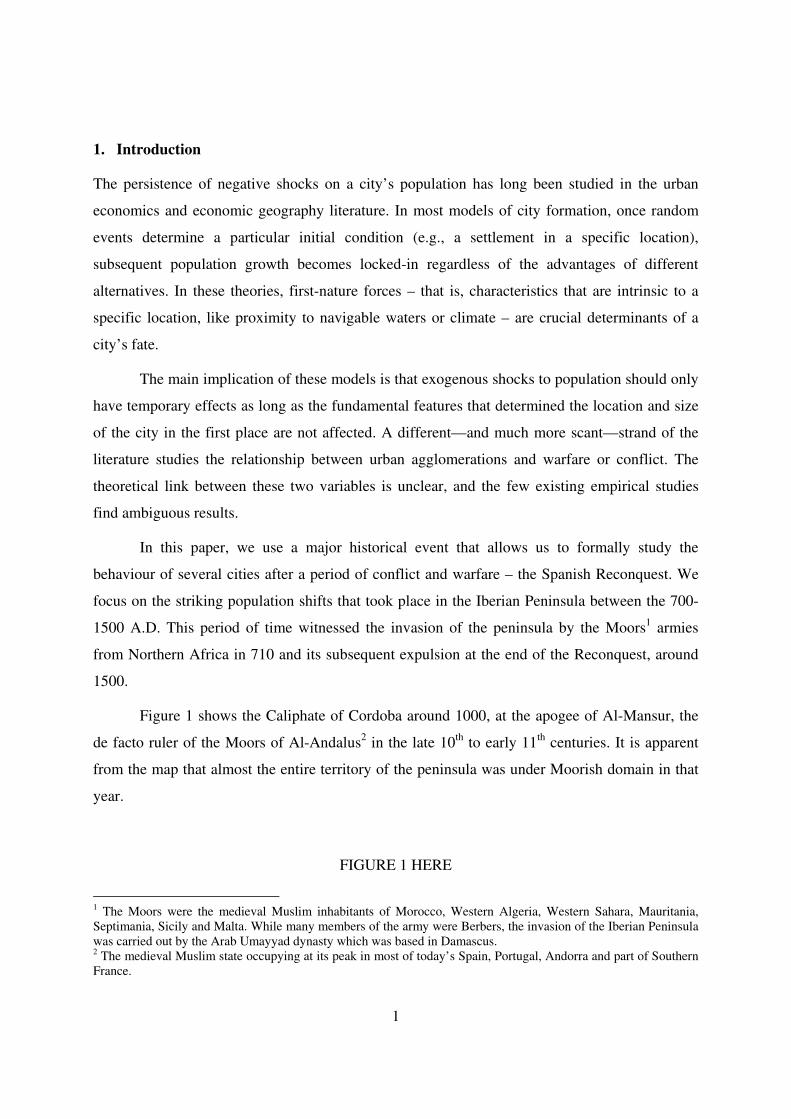
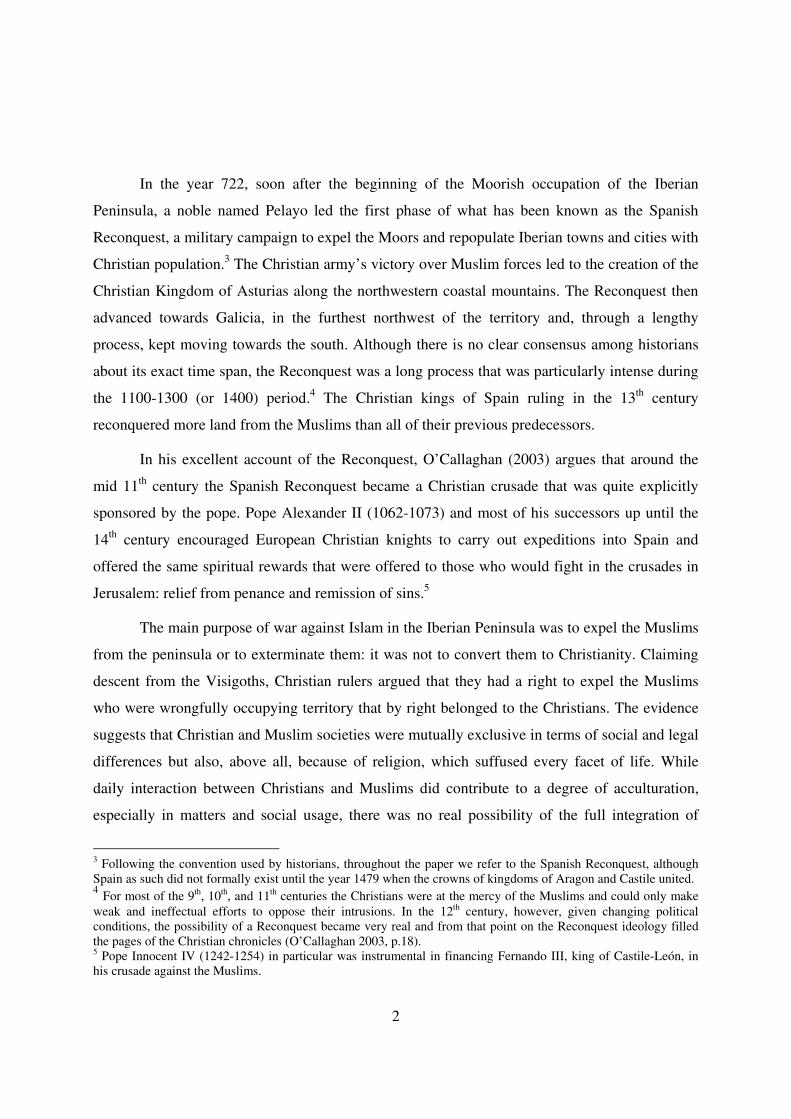
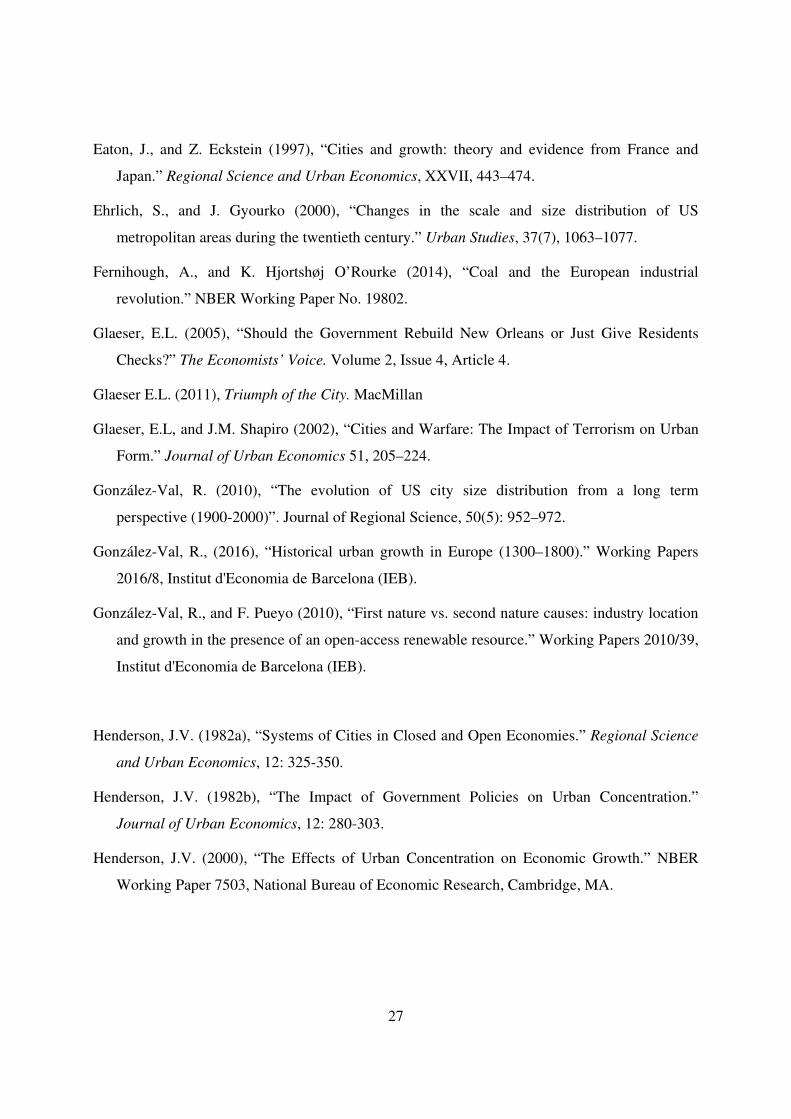
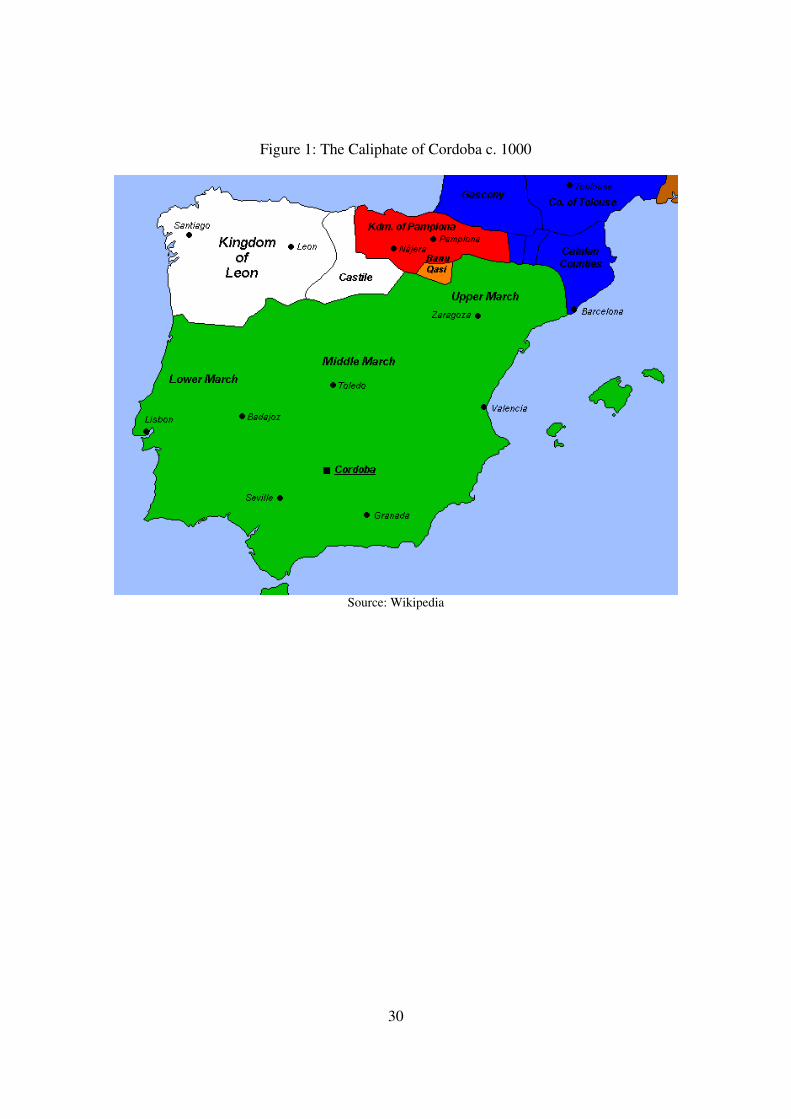
Figure 1 shows the Caliphate of Cordoba around 1000, at the apogee of Al-Mansur, the
de facto ruler of the Moors of Al-Andalus2 in the late 10th to early 11th centuries. It is apparent
from the map that almost the entire territory of the peninsula was under Moorish domain in that
year.
FIGURE 1 HERE
1 The Moors were the medieval Muslim inhabitants of Morocco, Western Algeria, Western Sahara, Mauritania, Septimania, Sicily and Malta. While many members of the army were Berbers, the invasion of the Iberian Peninsula was carried out by the Arab Umayyad dynasty which was based in Damascus. 2 The medieval Muslim state occupying at its peak in most of today’s Spain, Portugal, Andorra and part of Southern France.
2
In the year 722, soon after the beginning of the Moorish occupation of the Iberian
Peninsula, a noble named Pelayo led the first phase of what has been known as the Spanish
Reconquest, a military campaign to expel the Moors and repopulate Iberian towns and cities with
Christian population.3 The Christian army’s victory over Muslim forces led to the creation of the
Christian Kingdom of Asturias along the northwestern coastal mountains. The Reconquest then
advanced towards Galicia, in the furthest northwest of the territory and, through a lengthy
process, kept moving towards the south. Although there is no clear consensus among historians
about its exact time span, the Reconquest was a long process that was particularly intense during
the 1100-1300 (or 1400) period.4 The Christian kings of Spain ruling in the 13th century
reconquered more land from the Muslims than all of their previous predecessors.
In his excellent account of the Reconquest, O’Callaghan (2003) argues that around the
mid 11th century the Spanish Reconquest became a Christian crusade that was quite explicitly
sponsored by the pope. Pope Alexander II (1062-1073) and most of his successors up until the
14th century encouraged European Christian knights to carry out expeditions into Spain and
offered the same spiritual rewards that were offered to those who would fight in the crusades in
Jerusalem: relief from penance and remission of sins.5
The main purpose of war against Islam in the Iberian Peninsula was to expel the Muslims
from the peninsula or to exterminate them: it was not to convert them to Christianity. Claiming
descent from the Visigoths, Christian rulers argued that they had a right to expel the Muslims
who were wrongfully occupying territory that by right belonged to the Christians. The evidence
suggests that Christian and Muslim societies were mutually exclusive in terms of social and legal
differences but also, above all, because of religion, which suffused every facet of life. While
daily interaction between Christians and Muslims did contribute to a degree of acculturation,
especially in matters and social usage, there was no real possibility of the full integration of
3 Following the convention used by historians, throughout the paper we refer to the Spanish Reconquest, although Spain as such did not formally exist until the year 1479 when the crowns of kingdoms of Aragon and Castile united. 4 For most of the 9th, 10th, and 11th centuries the Christians were at the mercy of the Muslims and could only make weak and ineffectual efforts to oppose their intrusions. In the 12th century, however, given changing political conditions, the possibility of a Reconquest became very real and from that point on the Reconquest ideology filled the pages of the Christian chronicles (O’Callaghan 2003, p.18). 5 Pope Innocent IV (1242-1254) in particular was instrumental in financing Fernando III, king of Castile-León, in his crusade against the Muslims.
3
Christians into Muslim society or Muslims into Christian society. In each instance, Christians or
Muslims could only be protected minorities with limited political and legal rights (O’Callaghan
2003, p.10).
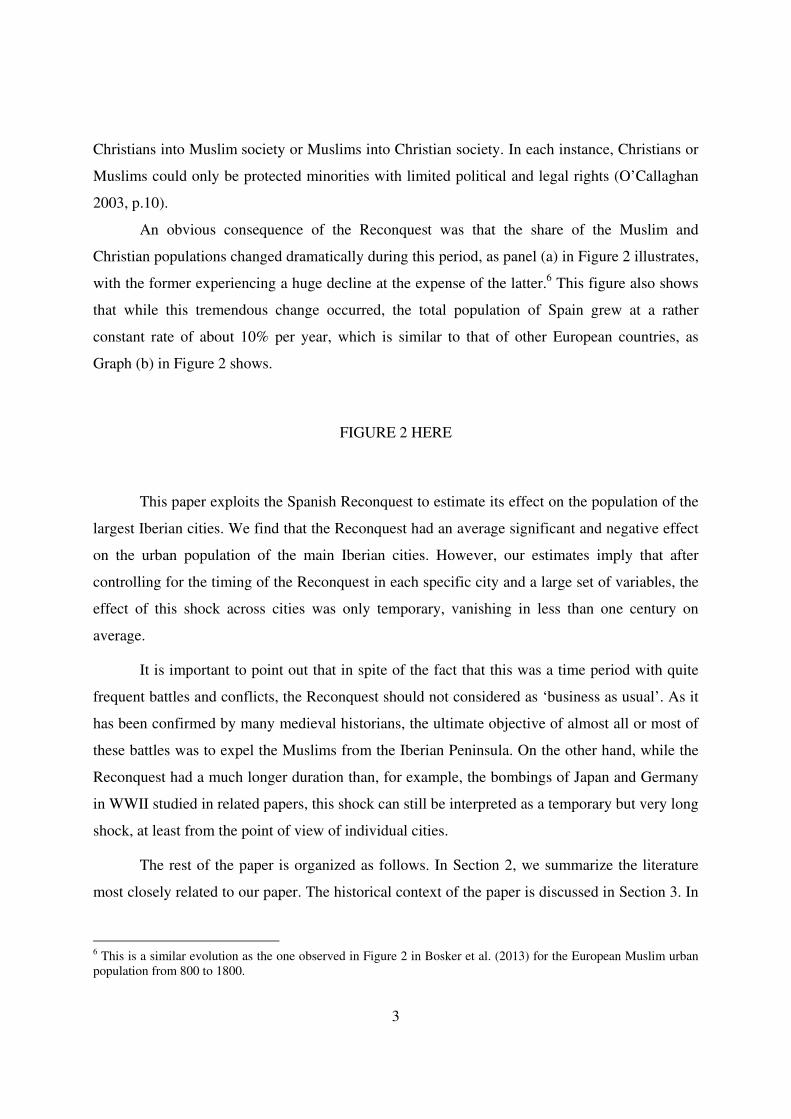
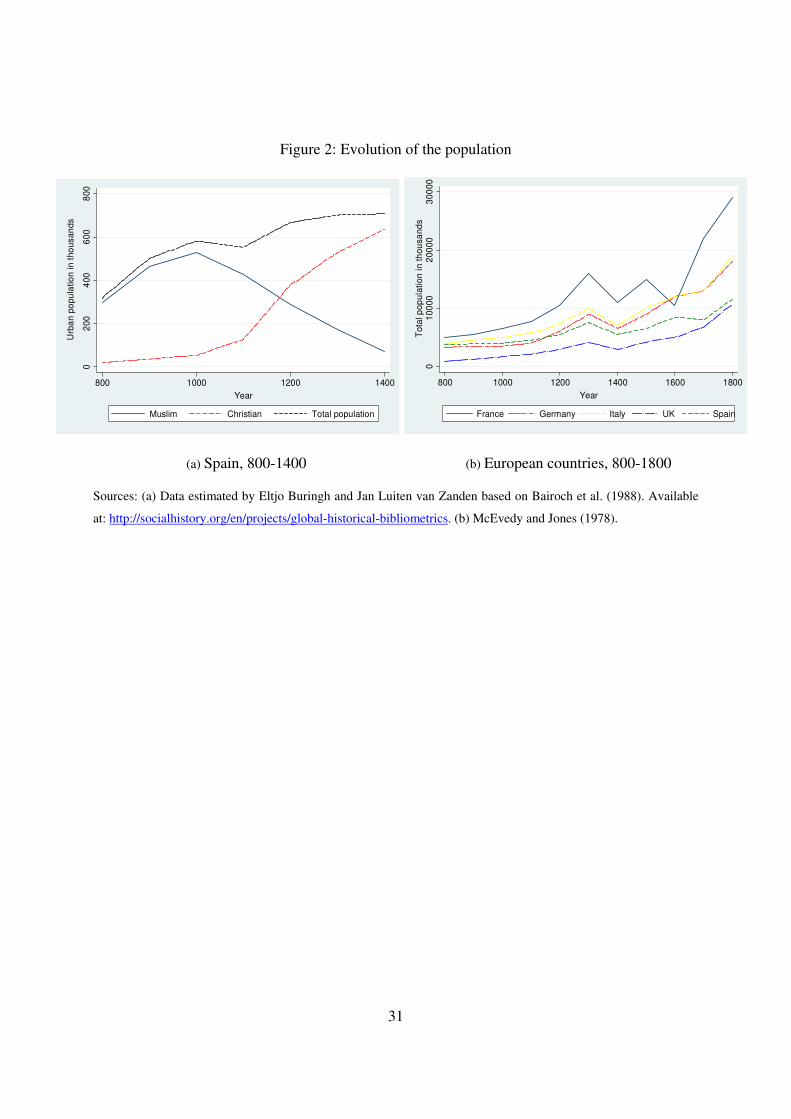
An obvious consequence of the Reconquest was that the share of the Muslim and
Christian populations changed dramatically during this period, as panel (a) in Figure 2 illustrates,
with the former experiencing a huge decline at the expense of the latter.6 This figure also shows
that while this tremendous change occurred, the total population of Spain grew at a rather
constant rate of about 10% per year, which is similar to that of other European countries, as
Graph (b) in Figure 2 shows.
FIGURE 2 HERE
This paper exploits the Spanish Reconquest to estimate its effect on the population of the
largest Iberian cities. We find that the Reconquest had an average significant and negative effect
on the urban population of the main Iberian cities. However, our estimates imply that after
controlling for the timing of the Reconquest in each specific city and a large set of variables, the
effect of this shock across cities was only temporary, vanishing in less than one century on
average.
It is important to point out that in spite of the fact that this was a time period with quite
frequent battles and conflicts, the Reconquest should not considered as ‘business as usual’. As it
has been confirmed by many medieval historians, the ultimate objective of almost all or most of
these battles was to expel the Muslims from the Iberian Peninsula. On the other hand, while the
Reconquest had a much longer duration than, for example, the bombings of Japan and Germany
in WWII studied in related papers, this shock can still be interpreted as a temporary but very long
shock, at least from the point of view of individual cities.
The rest of the paper is organized as follows. In Section 2, we summarize the literature
most closely related to our paper. The historical context of the paper is discussed in Section 3. In
6 This is a similar evolution as the one observed in Figure 2 in Bosker et al. (2013) for the European Muslim urban population from 800 to 1800.
4
Section 4, we describe our empirical strategy, while the data used are presented in Section 5. The
main results are displayed in Section 6; finally, Section 7 concludes.
2. Literature
Our paper is mostly linked to the literature that attempts to identify the importance of first-
nature forces in determining city size and city growth. These forces are usually captured by
characteristics related to the physical landscape of a given location, such as temperature, rainfall,
access to the sea, the presence of natural resources, or the availability of arable land. The
literature distinguishes between these first-nature and second-nature features, which refer to
factors directly linked to human actions and economic incentives (e.g., scale economies or
knowledge spillovers). The seminal paper by Krugman (1991), for example, offers a clear
distinction between these two forces in the context of a formal economic geography model.7
There are a number of recent empirical papers that explore the importance of natural amenities to
explain city creation and city growth but without studying natural experiments8 or that analyse
persistence in population patterns over very long periods of time.9
More closely related to our work, we now have a large literature that uses historical
natural experiments to study the location of economic activity across regions or cities. These
papers are often interpreted through the lens of three urban economics theories. The first one is
the presence of increasing returns that imply that initial advantages in specific locations
accumulate over time (Krugman, 1991). The second one is the random growth theory (Simon,
1955) that claims that cities grow independently of their initial size. Finally, the locational
fundamentals theory (Davis and Weinstein, 2002) argues that locations may have specific
geographic advantages that make them grow faster. The random growth theory predicts that a
negative population shock should have permanent effects on a location’s population. The
locational fundamentals theory, by contrast, predicts that population shocks are only temporary
as long as they do not alter the fundamentals of a location. The possibility of path dependence in
7 See also González-Val and Pueyo (2010) and Picard and Zeng (2010) for more recent references. 8 See, for example, Bleakley and Lin (2012), Fernihough and O’Rourke (2014) and Rappaport and Sachs (2003). 9 Some relevant papers are Eaton and Eckstein (1997), Ehrlich and Gyourko (2000), Beeson et al. (2001), Beeson and DeJong (2002), Ioannides and Overman (2003), Kim (2007), González-Val (2010), Cuberes (2011) and Desmet and Rappaport (2016).
5
theories of increasing returns also suggests that a temporary shock can, under some
circumstances, have permanent effects (Krugman, 1998).
The analysis of natural experiments has found both temporary and permanent effects of
population shocks.10 Among the papers that find a temporary effect, Nitsch (2003) is probably
the most similar to ours. In the context of the dissolution of the Austro-Hungarian Empire at the
end of World War I, Nitsch analyses how the population of the empire’s main city, Vienna,
adjusted to this shock and finds that although the share of Vienna’s population in the new
territory initially fell, it stabilized fairly rapidly, suggesting that lock-in effects (or path
dependence) and history were critical to understand the evolution of urban primacy in this
historical context. An important paper that also finds temporary effects of negative population
shocks is Davis and Weinstein (2002); they show how the bombing of Hiroshima and Nagasaki
during World War II affected the population of these two cities. Their main finding is that in
spite of the huge decline in population immediately after the atomic bombs were dropped, both
cities recovered very quickly, returning to their initial size in a few decades. We claim, as Davis
and Weinstein (2002) did, that the lack of long-run effect of the Reconquest shock is best
explained with the locational fundamentals theory. Their identification strategy heavily relies on
using different measures of intensity of the shocks, in particular, the number of dead and
missing city residents caused by the bombing and the percentage of the built-up area destroyed
for the 66 Japanese cities affected by the U.S. bombing.11 Lack of data on these variables
prevents us to follow the same strategy.
However, there are a few papers that show that some negative shocks can indeed have
permanent effects. Consistent with the findings of Davis and Weinstein (2002) for Japan,
Brakman et al. (2004) find no evidence of multiple equilibria when studying the bombing of
German cities during WWII. However, in a later paper, Bosker et al. (2007) re-examine this
episode to test for the presence of multiple equilibria in city growth in German cities and find
10 It is out of the scope of this paper to review this voluminous strand of the literature. Some of the related natural experiments not discussed here are Kline and Moretti (2014), Redding and Sturm (2008), Redding et al. (2011), Ahlfeldt et al. (2015) and Liu (2015). 11 Another paper that exploits an armed conflict is Miguel and Roland (2011) who analyse the long-run impact of bombing Vietnamese cities during the Vietnam War. In particular, by comparing heavily bombed districts with other districts they are able to isolate the impact of the attacks on several socioeconomic variables. One of their findings is that population density in 2002 – about five decades after the bombings - did not change much with respect to the pre-war period, suggesting that initial conditions or locational fundamentals were crucial to understand the evolution of population in these cities.
6
some evidence of permanent effects. Their evidence supports a model with two stable equilibria,
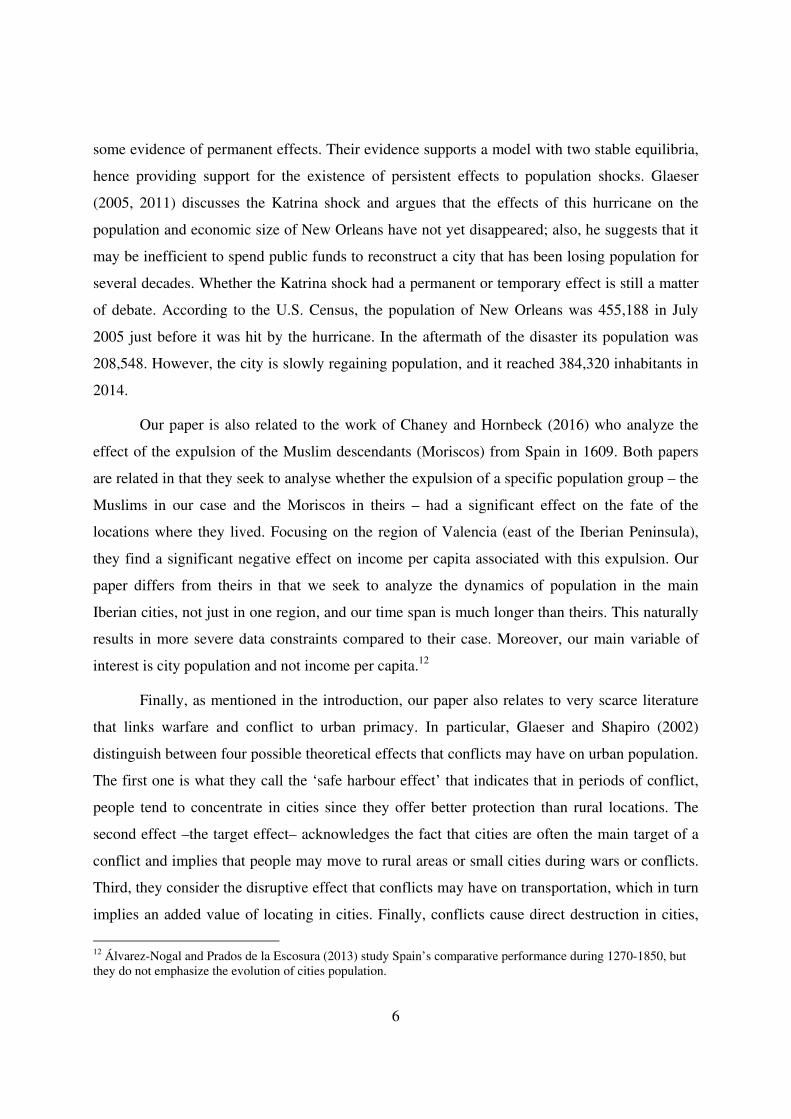
hence providing support for the existence of persistent effects to population shocks. Glaeser
(2005, 2011) discusses the Katrina shock and argues that the effects of this hurricane on the
population and economic size of New Orleans have not yet disappeared; also, he suggests that it
may be inefficient to spend public funds to reconstruct a city that has been losing population for
several decades. Whether the Katrina shock had a permanent or temporary effect is still a matter
of debate. According to the U.S. Census, the population of New Orleans was 455,188 in July
2005 just before it was hit by the hurricane. In the aftermath of the disaster its population was
208,548. However, the city is slowly regaining population, and it reached 384,320 inhabitants in
2014.
Our paper is also related to the work of Chaney and Hornbeck (2016) who analyze the
effect of the expulsion of the Muslim descendants (Moriscos) from Spain in 1609. Both papers
are related in that they seek to analyse whether the expulsion of a specific population group – the
Muslims in our case and the Moriscos in theirs – had a significant effect on the fate of the
locations where they lived. Focusing on the region of Valencia (east of the Iberian Peninsula),
they find a significant negative effect on income per capita associated with this expulsion. Our
paper differs from theirs in that we seek to analyze the dynamics of population in the main
Iberian cities, not just in one region, and our time span is much longer than theirs. This naturally
results in more severe data constraints compared to their case. Moreover, our main variable of
interest is city population and not income per capita.12
Finally, as mentioned in the introduction, our paper also relates to very scarce literature
that links warfare and conflict to urban primacy. In particular, Glaeser and Shapiro (2002)
distinguish between four possible theoretical effects that conflicts may have on urban population.
The first one is what they call the ‘safe harbour effect’ that indicates that in periods of conflict,
people tend to concentrate in cities since they offer better protection than rural locations. The
second effect –the target effect– acknowledges the fact that cities are often the main target of a
conflict and implies that people may move to rural areas or small cities during wars or conflicts.
Third, they consider the disruptive effect that conflicts may have on transportation, which in turn
implies an added value of locating in cities. Finally, conflicts cause direct destruction in cities,
12 Álvarez-Nogal and Prados de la Escosura (2013) study Spain’s comparative performance during 1270-1850, but they do not emphasize the evolution of cities population.
7
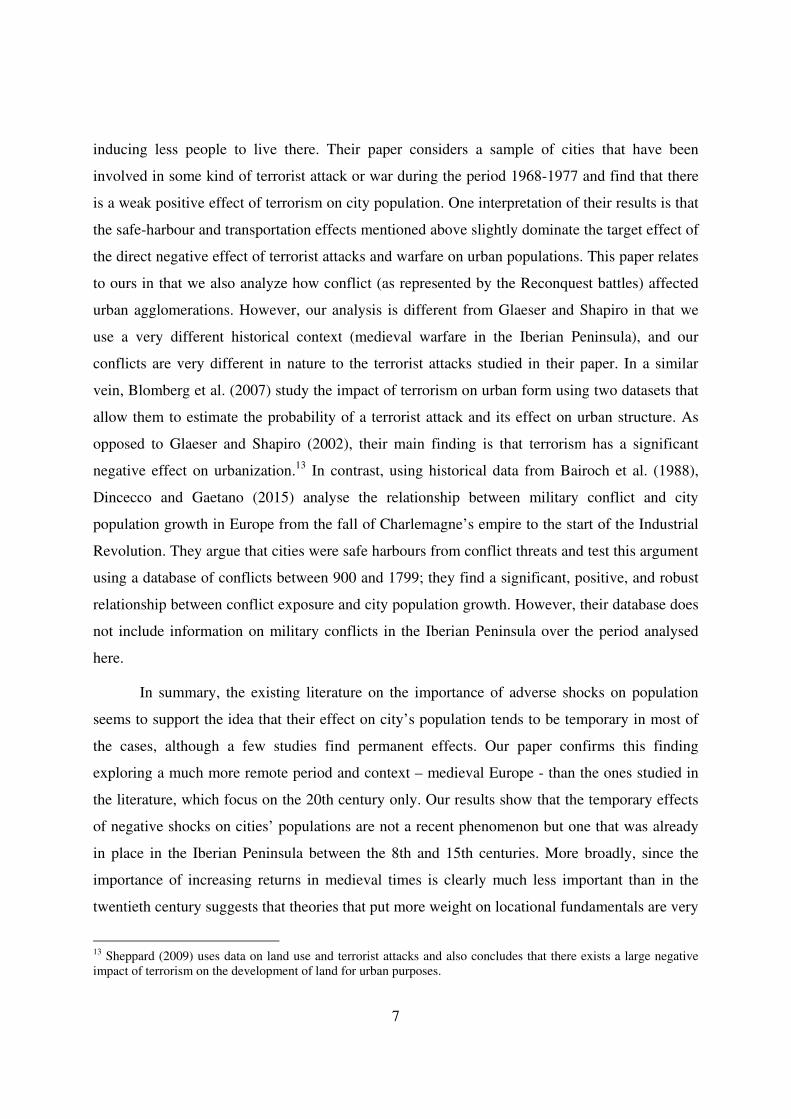
inducing less people to live there. Their paper considers a sample of cities that have been
involved in some kind of terrorist attack or war during the period 1968-1977 and find that there
is a weak positive effect of terrorism on city population. One interpretation of their results is that
the safe-harbour and transportation effects mentioned above slightly dominate the target effect of
the direct negative effect of terrorist attacks and warfare on urban populations. This paper relates
to ours in that we also analyze how conflict (as represented by the Reconquest battles) affected
urban agglomerations. However, our analysis is different from Glaeser and Shapiro in that we
use a very different historical context (medieval warfare in the Iberian Peninsula), and our
conflicts are very different in nature to the terrorist attacks studied in their paper. In a similar
vein, Blomberg et al. (2007) study the impact of terrorism on urban form using two datasets that
allow them to estimate the probability of a terrorist attack and its effect on urban structure. As
opposed to Glaeser and Shapiro (2002), their main finding is that terrorism has a significant
negative effect on urbanization.13 In contrast, using historical data from Bairoch et al. (1988),
Dincecco and Gaetano (2015) analyse the relationship between military conflict and city
population growth in Europe from the fall of Charlemagne’s empire to the start of the Industrial
Revolution. They argue that cities were safe harbours from conflict threats and test this argument
using a database of conflicts between 900 and 1799; they find a significant, positive, and robust
relationship between conflict exposure and city population growth. However, their database does
not include information on military conflicts in the Iberian Peninsula over the period analysed
here.
In summary, the existing literature on the importance of adverse shocks on population
seems to support the idea that their effect on city’s population tends to be temporary in most of
the cases, although a few studies find permanent effects. Our paper confirms this finding
exploring a much more remote period and context – medieval Europe - than the ones studied in
the literature, which focus on the 20th century only. Our results show that the temporary effects
of negative shocks on cities’ populations are not a recent phenomenon but one that was already
in place in the Iberian Peninsula between the 8th and 15th centuries. More broadly, since the
importance of increasing returns in medieval times is clearly much less important than in the
twentieth century suggests that theories that put more weight on locational fundamentals are very
13 Sheppard (2009) uses data on land use and terrorist attacks and also concludes that there exists a large negative impact of terrorism on the development of land for urban purposes.
8
relevant to understand urbanization and how it responded to different shocks much before the
Industrial Revolution when increasing returns became a more powerful force.
3. Historical Context
As mentioned above, the Reconquest started in the northern kingdom of Asturias, and it
subsequently moved towards the south of the Iberian Peninsula. The Christian struggle against
Islamic Spain can be described as “a war of both territorial aggrandizement and of religious
confrontation” (O’Callaghan 2003, p.7).
During most of the Reconquest, the Iberian Peninsula was divided into a few relatively
small kingdoms: Asturias, Castile, Navarra, Leon, Portugal, Aragon and Catalonia. The princes
and kings of these kingdoms often fought over territories and successions. The Reconquest
should therefore be seen as a very long series of battles between these kingdoms and the taifas –
independent Muslim-ruled principalities – and the subsequent Muslim territories dominated by
the Umayyads.14 Although it seems undeniable that the main goal of most of these battles was to
expel the Moors, they often lacked a coordinated standing army, and it seems fair to assume that
these military operations were often ad hoc, with many of them being planned just a few months
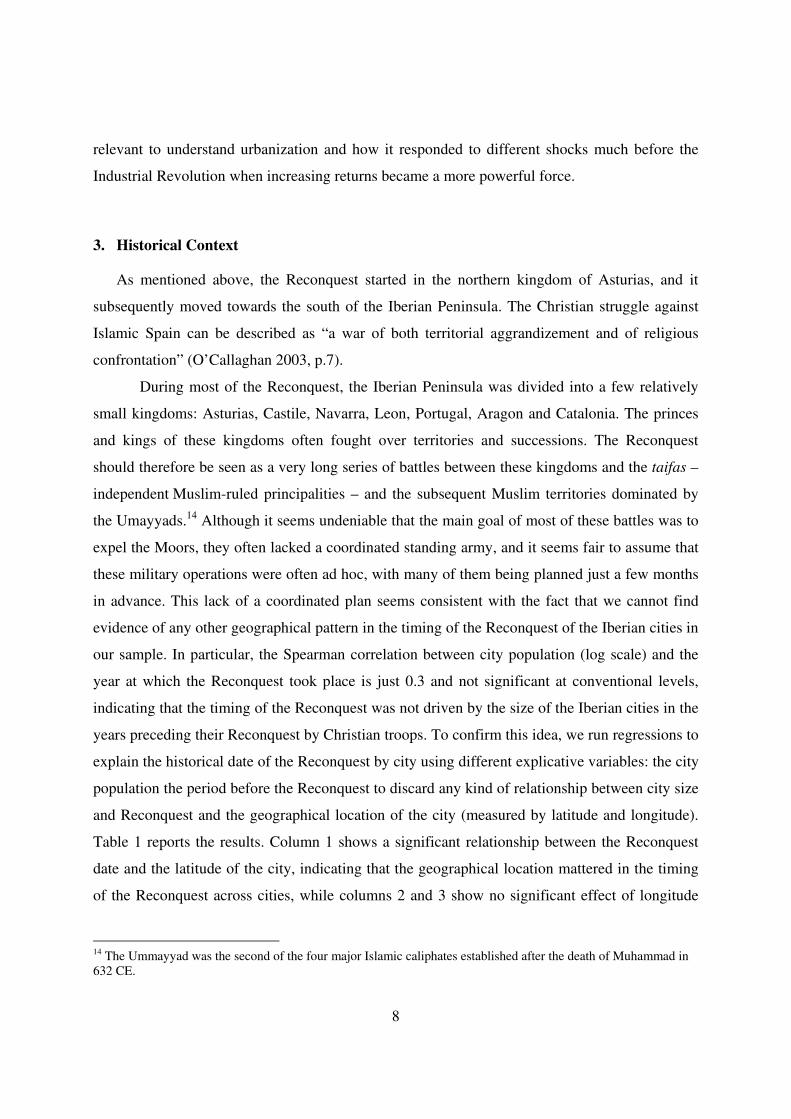
in advance. This lack of a coordinated plan seems consistent with the fact that we cannot find
evidence of any other geographical pattern in the timing of the Reconquest of the Iberian cities in
our sample. In particular, the Spearman correlation between city population (log scale) and the
year at which the Reconquest took place is just 0.3 and not significant at conventional levels,
indicating that the timing of the Reconquest was not driven by the size of the Iberian cities in the
years preceding their Reconquest by Christian troops. To confirm this idea, we run regressions to
explain the historical date of the Reconquest by city using different explicative variables: the city
population the period before the Reconquest to discard any kind of relationship between city size
and Reconquest and the geographical location of the city (measured by latitude and longitude).
Table 1 reports the results. Column 1 shows a significant relationship between the Reconquest
date and the latitude of the city, indicating that the geographical location mattered in the timing
of the Reconquest across cities, while columns 2 and 3 show no significant effect of longitude
14 The Ummayyad was the second of the four major Islamic caliphates established after the death of Muhammad in 632 CE.
9
and population on the date.15 This offers strong evidence in favour that, other than moving
towards the South, the Christian troops conquered cities in a random way.
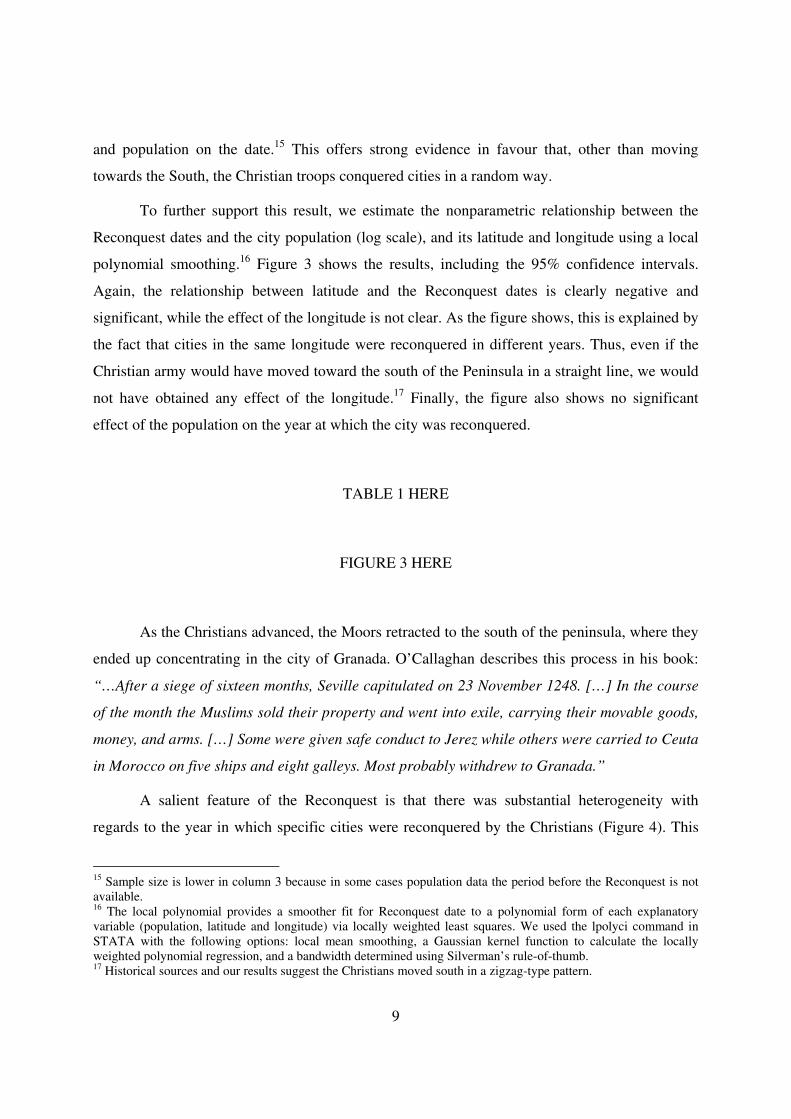
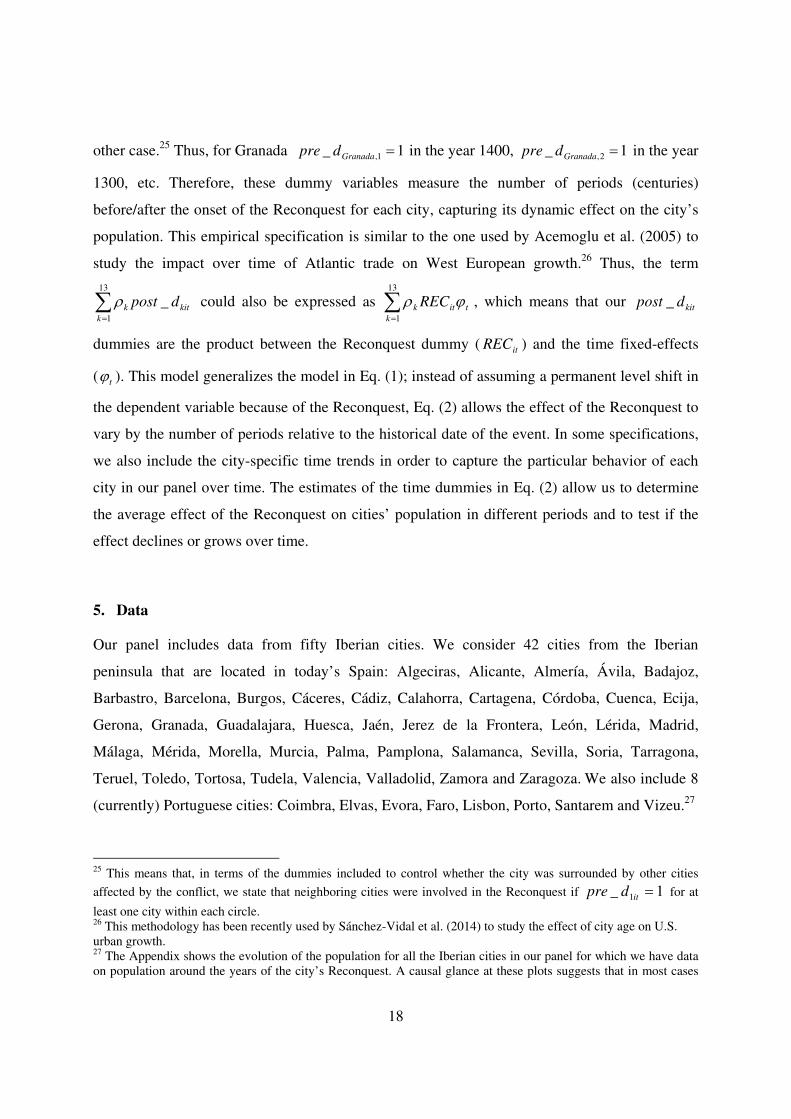
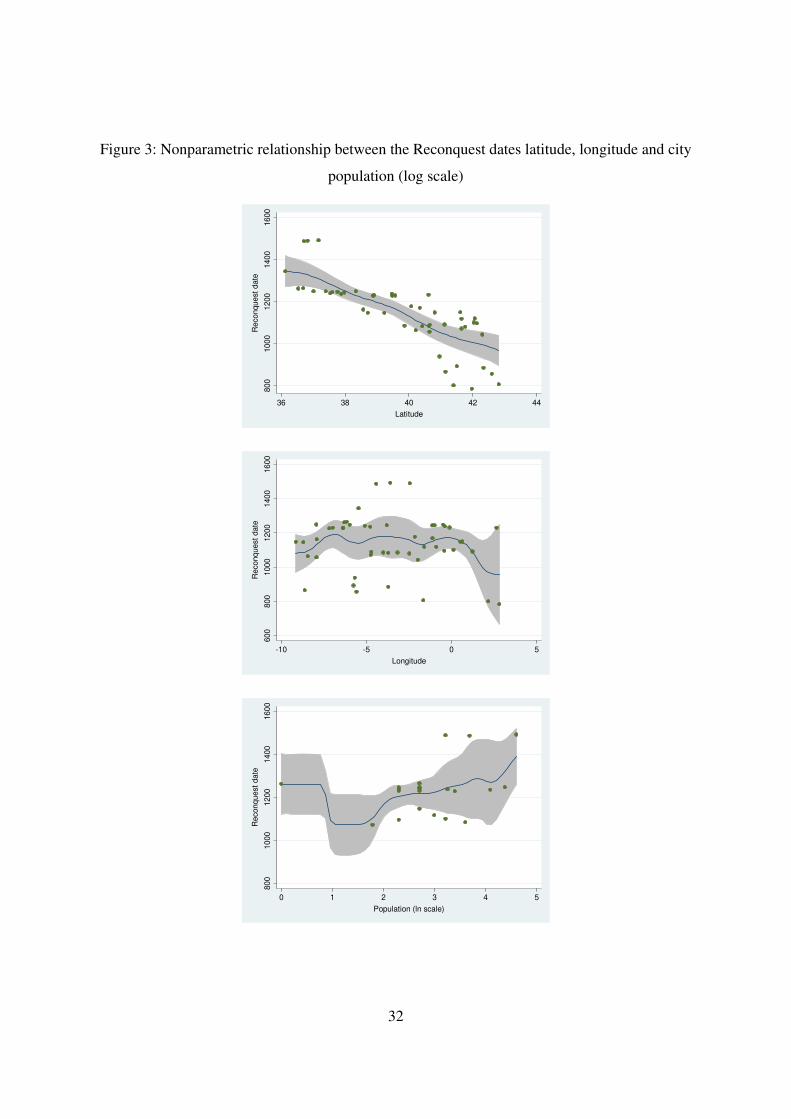
To further support this result, we estimate the nonparametric relationship between the
Reconquest dates and the city population (log scale), and its latitude and longitude using a local
polynomial smoothing.16 Figure 3 shows the results, including the 95% confidence intervals.
Again, the relationship between latitude and the Reconquest dates is clearly negative and
significant, while the effect of the longitude is not clear. As the figure shows, this is explained by
the fact that cities in the same longitude were reconquered in different years. Thus, even if the
Christian army would have moved toward the south of the Peninsula in a straight line, we would
not have obtained any effect of the longitude.17 Finally, the figure also shows no significant
effect of the population on the year at which the city was reconquered.
TABLE 1 HERE
FIGURE 3 HERE
As the Christians advanced, the Moors retracted to the south of the peninsula, where they
ended up concentrating in the city of Granada. O’Callaghan describes this process in his book:
“…After a siege of sixteen months, Seville capitulated on 23 November 1248. […] In the course
of the month the Muslims sold their property and went into exile, carrying their movable goods,
money, and arms. […] Some were given safe conduct to Jerez while others were carried to Ceuta
in Morocco on five ships and eight galleys. Most probably withdrew to Granada.”
A salient feature of the Reconquest is that there was substantial heterogeneity with
regards to the year in which specific cities were reconquered by the Christians (Figure 4). This
15 Sample size is lower in column 3 because in some cases population data the period before the Reconquest is not available. 16 The local polynomial provides a smoother fit for Reconquest date to a polynomial form of each explanatory variable (population, latitude and longitude) via locally weighted least squares. We used the lpolyci command in STATA with the following options: local mean smoothing, a Gaussian kernel function to calculate the locally weighted polynomial regression, and a bandwidth determined using Silverman’s rule-of-thumb. 17 Historical sources and our results suggest the Christians moved south in a zigzag-type pattern.
10
time variation in the onset of the Reconquest across cities is our main source of identification
since it allows us to study the effect of this shock on the population of a large number of cities
during this time period.
FIGURE 4 HERE
The historical characteristics of the Reconquest impose several constraints on the type of
data that we can use in the paper. While these data are described in detail in Section 5, we briefly
discuss these constraints here, since they shape all the analysis that follows. Ideally, given that
the Reconquest was a conflict between Christians and Muslims, one would like to collect city-
level data on the percentage of Christian and Muslim populations before and after the
Reconquest. However, this has proven impossible due to the lack of census data during most of
the period of interest.18
An alternative strategy would be to infer the percentage of Moors and Christians in each
city using estimates of the number of soldiers engaged in battles and sieges of specific cities as
well as their associated casualties. Unfortunately, this approach is in O’Callaghan (2003)’s words
“a frustrating task” due to the lack of reliable documentation. Just to cite a few examples from
his book, Muslim authors claim that the reported number killed in the Battle of Zallaqa (1086)
ranged from 10,000 to 300,000. In the Battle of Alarcos (1195), reported Christian deaths by
Muslims were 30,000, while only 500 of them seem to have been killed in reality. Or, for
example, the Christian king Jaime I claimed that he had about seventy knights and 13,000 foot
soldiers in the Mallorcan Crusade, although he also wrote elsewhere that he had embarked only
1000 men in his ships.
In the presence of open conflict between Christians and Muslims, the typical medieval
warfare strategy to take a city was to siege it for a long period of time until its population
eventually surrendered. Such sieges could be argued to cause a relatively low number of deaths
compared to open field battles. Nevertheless sieges were often complemented, or even replaced,
18 Census data appeared for the first time in Spain in the second half of the 18th century. Chaney and Hornbeck (2016) use data from the historical tithing districts recorded by the Archbishopric of Valencia on the number of Christians and Moriscos -Muslims who converted to Christianity rather than leave Spain and Portugal in the early 1500s- from 1527 to 1786. However, to our knowledge, these data are only available for the region of Valencia.
11
by assaults where the number of casualties was often much larger. “[…] while many sieges
ended with capitulation, some towns were taken by assault. This was the bloodiest outcome of a
siege and in some respects the least desirable. Men, women, and children were slaughtered
indiscriminately, and survivors were reduced to slavery. Although the defenders of Almeria
offered Alfonso VII 100,000 maravedis if he would lift the siege, the Genovese refused to agree
and took the city by assault. Some 20,000 Muslims were said to have been killed and another
30,000 taken captive; 10,000 women and children were transported to Genoa, where they were
likely sold as slaves or ransomed. Following Las Navas the Muslims of Ubeda offered Alfonso
VIII 1,000,000 maravedis to pass them by, but he refused and assaulted the city, enslaving the
survivors. Jaime I reported that 24,000 inhabitants were massacred during the assault of
Palma” (O’Callaghan 2003, p.140).
On the other hand, once a city was reconquered, the available accounts show that there
was a considerable variety of possible agreements between Christians and Moors. In some cases,
the Moors were allowed to stay with the condition that they converted to Christianity: in other
cases, they were forced to evacuate the city. O’Callaghan describes some of these pacts:
“Alfonso VI allowed the Muslims of Toledo to remain, retaining their property, worshipping
freely, and living in accordance with Islamic law; those who wished to depart with their movable
goods could do so, but they could return later if they wished. Alfonso I gave similar guarantees
to the Muslims of Zaragoza … [] Fernando III’s general policy in Andalucia was to require the
Muslims to evacuate the principal urban centers capitulating after a siege. Thus the Muslims of
Capilla, Baeza, Ubeda, Cordoba, Jaen, and Seville were allowed to depart, taking their movable
goods under safe-conduct to Muslim territory. The Muslims similarly evacuated Palma,
Borriana, and Valencia, but a significant number remained in Jaime I’s dominions, assured of
religious liberty and the observance of Islamic law” (O’Callaghan 2003, p.139-140).
A final issue to take into account is the extent to which the reconquered cities’
infrastructure was affected by military campaigns. If it was indeed the case that most cities’
infrastructure was barely affected, it is natural to expect that, even if the population loss was
significant, the recovery of the city should have been relatively fast. In his book, O’Callaghan
argues that in some cases the military campaigns involved considerable physical destruction:
“…the purpose of these raids was devastation: to destroy the enemies’ crops; trees and

12
vineyards were burned and cut down; livestock was seized; villages were pillaged; fortifications
were wrecked; …the raiders hoped to undermine the enemy’s morale and his will to
resist…Once an enemy had been softened up in this way, it was possible to besiege a stronghold
in the expectation that the defenders would have insufficient supplies and manpower to maintain
themselves for any length of time.” However, lack of data makes it once again difficult to
identify any systematic pattern across cities in relation to the extent of infrastructure damage.
The complexity of dealing with the different ways in which cities were taken, the variety
of surrender agreements as well as the difficulties in assessing the degree of infrastructure
damage leads us to follow an agnostic view in this paper in terms of how big the effect on a
city’s population was. Our approach is to let the data speak for themselves; if the Reconquest had
indeed a significant negative impact on the population size of a specific city, our estimates
should capture such effect.
As we discuss below, our results suggest that the Reconquest did have an initial negative
– although temporary – significant effect on the cities that were reconquered. A possible
interpretation of our finding is that the first-order effect of a siege – especially if it ended up in
an assault – was the decline in the city’s population, perhaps because these cities were direct
targets of Christian armies and so their dwellers may have migrated to the countryside or to
smaller cities. However, the potentially limited amount of physical destruction and the possibility
that the Muslims could sometimes remain in the city after it was taken by Christians made this
effect temporary on average. Another consistent explanation for our findings is that the
geographic characteristics that made the main Iberian cities good locations for the Moors
remained attractive for the dominant Christian population after the Reconquest; therefore, the
Muslims who died or fled these cities were roughly replaced by equal numbers of Christians who
were eager to live in these locations.
4. Empirical Strategy
Our empirical strategy consists of two steps. We first estimate a panel data model that
includes a dummy variable that takes a value of one if a city in a given period was subject to or
had already been reconquered. Figure 5 presents a histogram with the Reconquest years in our
sample of cities and shows that most cities were reconquered in the time interval 1100-1300.
13
Moreover, we also include another dummy to control for the possible effects before the
Reconquest, perhaps driven by the fact that they may have been anticipated. This regression is a
simple and clear way to identify the average effect of the Reconquest on city sizes after
controlling for several city and country covariates as well as different time and fixed effects.
Second, we estimate a modified version of the previous model that allows us to quantify the
average duration of this effect. To do so, we add as regressors city-specific time dummies that
take into account how many periods have passed until/since the start of the Reconquest in each
city. Before moving to the regression analysis, we discuss the cases of some relevant cities.
FIGURE 5 HERE
4.1. Some examples
There exists strong historical evidence that around the year 800 and before the onset of the
Reconquest, Cordoba, Granada and Seville were the three dominant urban centres in the Iberian
Peninsula. Indeed, Cordoba is often considered to be the most populated city in the world in
1000 (Chandler and Fox, 1974; Chandler, 1987). 19 Figure 6 shows the evolution of population in
these and other important Iberian cities. Similar figures for the rest of cities for which we have
data in the years around their Reconquest are shown in the Appendix.20 Figure 7 shows how the
Moorish population relocated over time to the south from Cordoba to Seville (not shown in the
map) and finally to Granada.
FIGURE 6 HERE
FIGURE 7 HERE
19 Lisbon was the largest city in Portugal in all periods but 1200, when Coimbra was the most populated one. 20 Out of 50 cities, 29 of them lack population data available around their Reconquest year. We include these cities in our main regressions but in some of the robustness checks we exclude them to test if their inclusion simply adds noise to our estimation. The main results hold; see the robustness checks in Section 6.3.
14
Cordoba was the main city of the Caliphate of Cordoba between 929 and 1031. It is apparent
that its population experienced a dramatic increase between 929 and 1200 and then a steady until
around 1700. One possible explanation for this decline is that the Muslim dwellers of Cordoba,
which were likely to have been the majority around those years, anticipated the arrival of the
Christians and left the city. After the Reconquest, Cordoba’s population stabilized. The city
experienced rapid growth around 1900, but, as it is clear from the other graphs in the Appendix,
this was a common pattern in most Spanish cities, and it was related to the unprecedented growth
in urbanization in Spain around that year. Seville experienced a re-growth period between 1400
and 1600, in large part due to the fact that it was the main port in the trade with the New World,
which is consistent with the hypothesis of Acemoglu et al (2005).
4.2. Benchmark model
We begin by estimating the following model:
ittititititjtitiit afterYearsbeforeYearsRECRECpreZXp εϕθμφγδλβα +′+++++++= ___'' .
(1)
The dependent variable itp denotes the measure of the population of city i at year t. We consider
three measures of population by city: the share of a city on the Iberian urban population, the
city’s population (log scale) and the city’s population growth. Urban shares are defined as the
fraction of the city’s population over the total Iberian urban population (Portugal and Spain),
where urban population is calculated as the population living in cities greater than 5,000
inhabitants.21 itREC is the Reconquest dummy that takes a value of one if city i in period t was
subject to or had already suffered the Reconquest, and zero otherwise. In a similar fashion,
itRpre − is a pre-Reconquest dummy that takes a value of one if city i in period t was one or two
periods (100 or 200 years) before its Reconquest, and zero otherwise. Holding constant the rest
of explanatory variables, these dummy variables capture the average level shift in the
endogenous variable before and after the Reconquest. This specification implies that (1) our
21 The 5,000 cutoff to define urban population is a standard used in historical data; see, for example, Bairoch et al. (1988). Our results are qualitatively the same using the population living in cities with more than 2,000 inhabitants.
15
dependent variables are stationary time series22 and (2) that the Reconquest had a permanent
effect. Our empirical strategy is similar to that of Nitsch (2003)’s study of the dissolution of the
Austro-Hungarian Empire, but there are several differences. First, Nitsch (2003) analyses only
changes on the population of the empire’s main city, Vienna, while we consider population
changes in all the reconquered Iberian cities in our sample. Thus, we do not focus only on the
urban primacy of the largest city, as our model allows for possible hysteresis in any city, not just
the initially largest one. Second, as all cities in our sample were reconquered at some point in
time, we cannot distinguish between treated and non-treated cities. In Section 6.3, we carry out a
robustness check including some non-reconquered European cities in our sample, so then the
model in Eq. (1) turns to a difference-in-differences approach. Third, we take advantage of the
time series dimension of our data by estimating the effects of the Reconquest several years
before and after it took place in any given city. Instead, Nitsch estimates his equation splitting
the sample before and after 1918, that is, the year in which Austria-Hungary broke up. Fourth, in
our case, the size of the ‘country’ (the Iberian Peninsula) did not change much before and after
the Reconquest, whereas in Nitsch’s paper the territory occupied by the Austro-Hungarian
Empire dramatically decreased after 1918. Moreover, the Reconquest shock spans a much longer
period of time than the one associated with the dissolution of the Austro-Hungarian Empire,
which was short-lived and occurred soon after the end of World War I. Finally, the shock we are
considering consists of the systematic expulsion of a targeted population, the Moors, who
represented a large fraction of the population in many Iberian cities.
While the Reconquest dummy captures the average effect of the Reconquest on city size
for our sample of cities, the pre-Reconquest dummy aims to capture the possible anticipated
effects; on the one hand, city dwellers could decide to run away when the Christian army
approached their city; on the other hand, these cities could have received an inflow of population
22 We consider three different dependent variables: the share of city population over the Iberian urban population, the city’s population (log scale) and the city’s population growth. Population growth is the first-difference of city’s population, so it should be a stationary series. Regarding the share and the log-population, both variables should be stationary series if city population growth is independent of initial size, i.e. if Gibrat law holds for cities. Some studies (Dittmar, 2011; González-Val, 2016) using this same historical dataset by Bairoch et al. (1988) of European city populations conclude that, although there could be convergent growth for the smallest cities, from 1500 forwards Gibrat law holds, at least for the largest cities. A casual look at the figures in the Appendix, showing the evolution of population in the cities in our sample by year, reveals that the series are quite stable, at least until the last period, when there was a significant increase in urbanization in all European countries. However, if we drop this last period from the analysis our main results hold; see the the robustness checks in Section 6.3.
16
from other previously reconquered locations.23 To explore the spatial perspective of this pre-
Reconquest effect, we also include a set of city-specific dummies to control for whether the city
was surrounded by other cities that were affected by this conflict. Then, circles of radii 50, 100,
150 and 200 km are drawn using the physical distances between cities.24 Given the long time-
span of our data, we state that neighboring cities were involved in the Reconquest if there was at
least one city within each circle with 100 or less years to its Reconquest date.
The included explanatory variables are similar to those considered by Henderson (2000) in
his account of the main determinants of urban primacy across countries and by Nitsch (2003) in
his study of Vienna. The vector Z includes the following country-specific variables: the
country’s total urban population, per capita Gross Domestic Product, the length of waterways
and a measure of road density (proxied by Roman roads density) interacted with per capita GDP
in order to capture the differential effect of infrastructure and income. X is a vector of city-
specific explanatory variables with the potential to affect a country’s degree of urban
concentration: a dummy variable for whether a city is a transportation hub (defined as the
intersection of at least two Roman roads), a dummy variable for whether a city has a port, a
dummy variable to control whether the city was taken after siege by the Christian army, and the
set of dummies to control whether the neighboring cities are involved in the Reconquest
mentioned above. City fixed effects are also included. Moreover, we add the number of years
before/after the Reconquest by city as regressors itbeforeYears _ and itafterYears _ to reduce
potential measurement error. This potential problem arises from the fact that population data
comes in 100-year intervals and some cities were reconquered at a date that was close to the year
of the observation, while others were reconquered many years earlier, having almost a century to
recover from the shock. For example, for the city of Toledo, which was reconquered in 1085, the
variable Years_before would take a value of 85 in the year 1000 and a value of 0 in the year
1100. Similarly, the variable Years_after would take a value of 0 in the year 1000 and a value of
15 in the year 1100. Finally, we also include several time controls—an overall time trend and its
23 Our pre-Reconquest dummy is defined allowing for anticipated effects only up to two periods before. A wider temporal horizon generates problems of multicollinearity. Nevertheless, we consider all the periods before the Reconquest when we estimate the dynamic effect of the Reconquest; see Section 4.3. 24 Bilateral distances calculated using the haversine distance measure based on geographical latitude-longitude coordinates.
17
square, city-specific time trends and their squares—in order to capture the particular behavior of
each city in our panel over time as well as time fixed effects. ε is a standard error term.
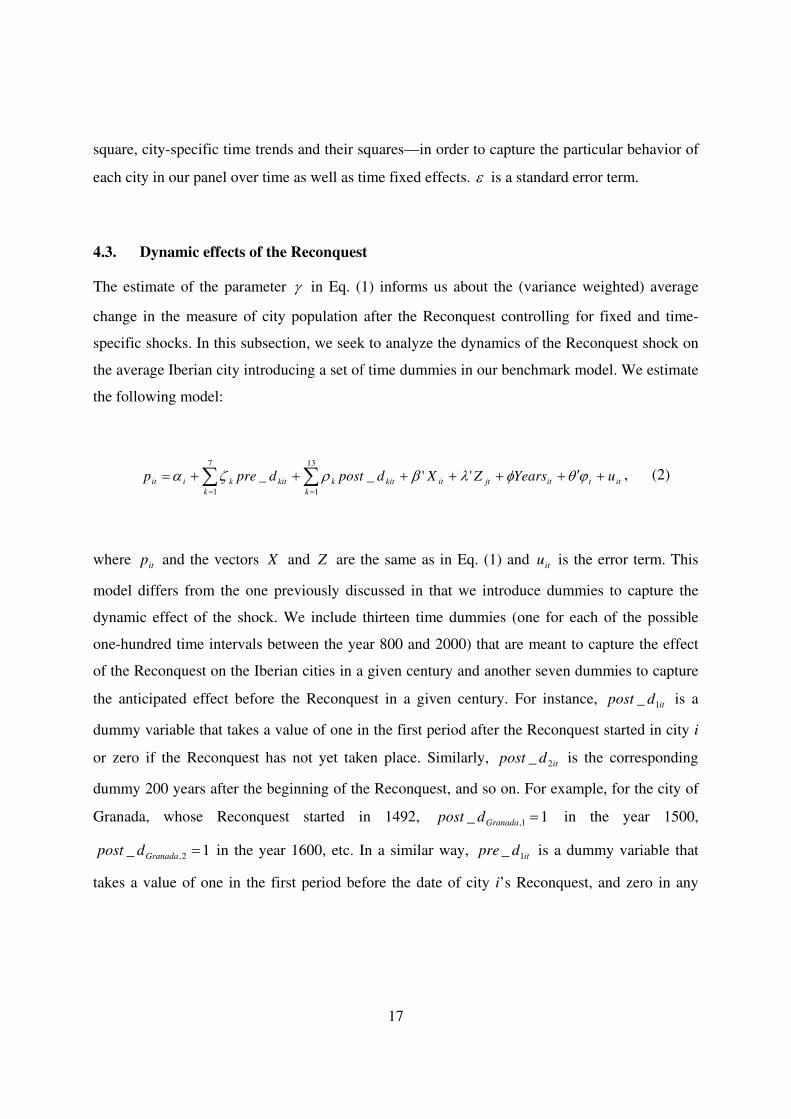
4.3. Dynamic effects of the Reconquest
The estimate of the parameter γ in Eq. (1) informs us about the (variance weighted) average
change in the measure of city population after the Reconquest controlling for fixed and time-
specific shocks. In this subsection, we seek to analyze the dynamics of the Reconquest shock on
the average Iberian city introducing a set of time dummies in our benchmark model. We estimate
the following model:
ittitjtit
k
kitk
k
kitkiit uYearsZXdpostdprep +′++++++= ∑∑==
ϕθφλβρζα ''__13
1
7
1
, (2)
where itp and the vectors X and Z are the same as in Eq. (1) and itu is the error term. This
model differs from the one previously discussed in that we introduce dummies to capture the
dynamic effect of the shock. We include thirteen time dummies (one for each of the possible
one-hundred time intervals between the year 800 and 2000) that are meant to capture the effect
of the Reconquest on the Iberian cities in a given century and another seven dummies to capture
the anticipated effect before the Reconquest in a given century. For instance, itdpost 1_ is a
dummy variable that takes a value of one in the first period after the Reconquest started in city i
or zero if the Reconquest has not yet taken place. Similarly, itdpost 2_ is the corresponding
dummy 200 years after the beginning of the Reconquest, and so on. For example, for the city of
Granada, whose Reconquest started in 1492, 1_ 1, =Granadadpost in the year 1500,
1_ 2, =Granadadpost in the year 1600, etc. In a similar way, itdpre 1_ is a dummy variable that
takes a value of one in the first period before the date of city i’s Reconquest, and zero in any
18
other case.25 Thus, for Granada 1_ 1, =Granadadpre in the year 1400, 1_ 2, =Granadadpre in the year
1300, etc. Therefore, these dummy variables measure the number of periods (centuries)
before/after the onset of the Reconquest for each city, capturing its dynamic effect on the city’s
population. This empirical specification is similar to the one used by Acemoglu et al. (2005) to
study the impact over time of Atlantic trade on West European growth.26 Thus, the term
∑=
13
1
_k
kitk dpostρ could also be expressed as ∑=
13
1k
titk REC ϕρ , which means that our kitdpost _
dummies are the product between the Reconquest dummy ( itREC ) and the time fixed-effects
( tϕ ). This model generalizes the model in Eq. (1); instead of assuming a permanent level shift in
the dependent variable because of the Reconquest, Eq. (2) allows the effect of the Reconquest to
vary by the number of periods relative to the historical date of the event. In some specifications,
we also include the city-specific time trends in order to capture the particular behavior of each
city in our panel over time. The estimates of the time dummies in Eq. (2) allow us to determine
the average effect of the Reconquest on cities’ population in different periods and to test if the
effect declines or grows over time.
5. Data
Our panel includes data from fifty Iberian cities. We consider 42 cities from the Iberian
peninsula that are located in today’s Spain: Algeciras, Alicante, Almería, Ávila, Badajoz,
Barbastro, Barcelona, Burgos, Cáceres, Cádiz, Calahorra, Cartagena, Córdoba, Cuenca, Ecija,
Gerona, Granada, Guadalajara, Huesca, Jaén, Jerez de la Frontera, León, Lérida, Madrid,
Málaga, Mérida, Morella, Murcia, Palma, Pamplona, Salamanca, Sevilla, Soria, Tarragona,
Teruel, Toledo, Tortosa, Tudela, Valencia, Valladolid, Zamora and Zaragoza. We also include 8
(currently) Portuguese cities: Coimbra, Elvas, Evora, Faro, Lisbon, Porto, Santarem and Vizeu.27
25 This means that, in terms of the dummies included to control whether the city was surrounded by other cities
affected by the conflict, we state that neighboring cities were involved in the Reconquest if 1_ 1 =itdpre for at
least one city within each circle. 26 This methodology has been recently used by Sánchez-Vidal et al. (2014) to study the effect of city age on U.S. urban growth. 27 The Appendix shows the evolution of the population for all the Iberian cities in our panel for which we have data on population around the years of the city’s Reconquest. A causal glance at these plots suggests that in most cases
19
We chose these cities based on two criteria. First, these were, on average, the most
populated cities during the period considered in the paper. This is a necessary choice since data
for smaller cities is very sparse.28 Second, from a geographical point of view this selection of
cities covers the vast majority of the peninsula, as it is apparent from Figure 4. Furthermore, this
sample of cities provides substantial variation in the timing of the Reconquest across cities.
City populations between 800 and 1800 are taken from Bairoch et al. (1988). To
construct the urban shares we use data on total urban population in the country from the same
source.29 The last two centuries included in our analysis (1900-2000) use information from the
national official censuses. Bairoch et al. (1988) emphasize that data before 1300 are less reliable
(they even skip the year 1100 due to lack of information).30 Some authors have criticized the
Bairoch et al. (1988) data because of some of their unrealistic values. In particular, the
population estimate for Córdoba in 1000 is usually considered to be excessively large.
Nevertheless, Dittmar (2011) compares the Bairoch et al. (1988) data to the database of de Vries
(1984), concluding that there is no evidence of systematic shortfalls in the populations that the
Bairoch et al. (1988) data record for large cities.
Per capita Gross Domestic Product data is taken from Maddison (2003).31 We also use
information from the CIA World Factbook on the length of waterways, which are assumed to be
constant over time. Measuring road density is problematic due to the scarcity of data in early
periods. In order to deal with this, we proxy this variable with the number of cities that were
crossed by a Roman road, following Bosker et al. (2013). The source of information for
determining the presence of a Roman road is taken from Talbert (2000).32 As in Bosker et al.
there is a marked decline in population in the years around the Reconquest (e.g., in Almería, Palma, Seville, and Valencia). 28 We exclude two relatively large Northern cities (Vigo, Coruña) because there is ample historical evidence that Muslim influence was very limited there. Moreover, data for these cities are only available for the last periods of our sample. 29 Following Bairoch et al. (1988), we consider constant boundaries over time, because some of our variables (road density, GDP, waterways, etc.) are defined according to these boundaries. Furthermore, if we allow country boundaries to change over time there could be spurious changes in the urban share. 30 Since Bairoch et al. (1988) do not provide population estimates for 1100, for this century we use the interpolated values provided by Eltjo Buringh and Jan Luiten van Zanden on their webpage (http://socialhistory.org/en/projects/global-historical-bibliometrics). 31 Maddison’s data set provides information for 1000 and from 1500 to 2000. We fill the gaps using linearly interpolated values. 32 There are two independent projects that provide geocoded data based on Talbert (2000): DARMC (Harvard, http://darmc.harvard.edu) and OmnesViae (http://omnesviae.org/). We acknowledge René Voorburg from the OmnesViae project for kindly providing his data.
20
(2013), we identify locations where two (or more) Roman roads crossed as hub locations. Port
cities are identified using maps and other geographical information. Finally, data on sieges is
collected from Sáez Abad (2009). According to this source, 18 cities in our sample were
reconquered after a siege by the Christian army. As discussed above, having been subject to a
siege may have significant effects on each city’s population.
6. Results
6.1. The average effect of the Reconquest on Iberian Cities
The estimation of Eq. (1) gives us the average effect of the Reconquest on our panel of Iberian
cities. The Appendix displays the evolution of the population for cities with data around the
Reconquest, showing a clear change around the onset of the Reconquest in some of them.33
Table 2 reports the estimates of Eq. (1). All the estimates are weighted by city population to
avoid giving a disproportionate weight to small cities.34
TABLE 2 HERE
In columns 1 to 3, we simply estimate the effect of the Reconquest on our measures of city
population controlling only for the number of years before/after the Reconquest, sieges, the
ongoing conflict in the neighbouring cities and an overall time trend. We obtain a negative and
significant effect of the Reconquest on city size, measured by either the urban share or the
population. The effect on population growth is also negative but not significant. The dummy
variable capturing the anticipated effect of the Reconquest is negative and significant in the three
regressions, indicating that, on average, our sample of Iberian cities was already losing
population before the Reconquest.
33 As a preliminary analysis, we explored the presence of structural breaks for some cities in our data using the Perron and Vogelsang (1992) test. Although these results cannot be considered robust because of the short number of temporal observations (a maximum of 13 periods), the structural breaks detected coincide or are located very close to the Reconquest dates in most of the cities. These results are available from the authors on request. 34 The qualitative results remain unchanged when the regressions are run without population weights. These results are available from the authors upon request.
21
Once we control for the different covariates discussed in the previous section (columns 4
to 6) and we include city and time fixed effects as well as city-specific time trends (linear and
square), the coefficient associated with the Reconquest dummy dramatically decreases, but it
remains significant for the urban share (at the 10% level) and the log-population (columns 4 and
5). The anticipated negative effect of the Reconquest vanishes when we control for other
covariates. The siege dummy is now significant, and its sign changes from positive (columns 4
and 5) to negative (column 6). One interpretation of this result is that in the regressions using the
urban share and the population, this dummy is acting as a proxy for large cities (small cities had
not walls and hence they were not subject to sieges), while in the regression with the population
growth the dummy reflects the negative effect of the siege on growth. These results indicate that
the Reconquest may have had an average negative effect on the populations (measured by shares
or log-populations) of the main cities in the Iberian peninsula, although the effect on the
population growth is not significant.
From the point of view of the conflict/warfare literature, one interpretation of these
results is that in this particular historical context, the negative effects of war on urban shares
seem to dominate the positive ones. Using the terminology first advanced in Glaeser and Shapiro
(2002), the target effect and the direct effects of physical destruction appear to dominate the safe
harbour and transportation effects, although we do not have accurate data to explicitly
distinguish between these effects.
6.2. Dynamic effects of the Reconquest
In the previous subsection, we found some evidence that the Reconquest had an average negative
impact on the urban shares (at the 10%) and log-populations of the main cities of the Iberian
Peninsula. One possible explanation for the effect not being very robust when we use the urban
shares or population growth is that the shock was indeed transitory. Here, we aim to identify the
persistence of this negative shock, i.e., how long it took these cities to recover from the shock
caused by their Reconquest by Christians. To address this question, we estimate the average
dynamic effect of the Reconquest using city-specific time dummies that take into account how
many years elapsed since the beginning of the Reconquest in each specific city, as explained in
Section 4. We also estimate the anticipated effect of the Reconquest by period. The results are
22
displayed in Table 3, where again all the regressions are weighted by city population to ensure
that small cities are not driving the results.
TABLE 3 HERE
Columns 1 to 3 report the results with the basic set of controls: the number of years
before/after the Reconquest, sieges, clusters of neighbouring cities involved in the conflict and
an overall time trend. Column 1 shows that all the coefficients of the dummies measuring the
number of periods before the Reconquest have a positive sign. Interestingly, these coefficients
are significant at least at the 10% level, but as we approach to the date of the Reconquest, they
decrease and become not significant. This indicates that urban shares were already declining
before the Reconquest. After the Reconquest, the time dummies have a negative sign, but the
coefficients are not significant. The coefficients increase over time and change to positive, but
they remain not significant. However, one should be cautious with the interpretation of the last
time dummies; as we move away several centuries from the Reconquest date, these dummies
could be capturing the influence of other historical factors. In the case of city population (column
2), we observe the same pattern: the pre-Reconquest time dummies are positive (but not
significant), but as we approach to the Reconquest date, they decrease. The post-Reconquest time
dummies are negative, but this time they are significant in some periods. This could suggest that
these cities were growing before they experienced the Reconquest, although this growth was
declining as the Christian troops approached, perhaps because the Muslim dwellers anticipated it.
The negative coefficients after the Reconquest are also consistent with the negative effect of the
Reconquest on city populations and its persistence. Finally, in the case of population growth
(column 3), none of the time dummies are significant.
Columns 4 to 6 show the results once we include all the controls, city and time fixed
effects and city-specific time trends. After adding all the controls and the time-specific city
trends, any pre- or post-Reconquest effect disappears (the only exceptions are the coefficients of
the time dummies 5 to 7 periods after the Reconquest in column 5, significant at the 10% level).
These final results can be interpreted as evidence that for the average Iberian city, the negative
effect of the Reconquest was at most temporary, confirming the analysis carried out in the
previous section. In terms of the economic geography literature, one interpretation of our results
23
is that in the historical episode studied here, history matters for city growth in the sense that the
locational fundamentals that made these cities some of the most populated ones in the Peninsula
for about 500 years since 800 seem to continue to be crucial growth determinants once Christians
took control of them, in spite of their initial population loss.
6.3. Robustness checks
In this section, we carry out different robustness checks.35 First, we include 23 European cities
(from the current Austria, Belgium, France, Germany, Italy, the Netherlands, Switzerland and the
UK) that were not subject to the Reconquest shock as a control group. Thus, our sample now
includes treated and non-treated cities (reconquered and non-reconquered cities), so the model in
Eq. (1) is now a proper difference-in-differences approach. We choose the cities that were the
largest ones in their country for at least one period.36 The results are displayed in Table 4. It is
apparent that these estimates are similar to those of Table 2. The Reconquest has a negative
impact on the three different measures of city’s population (columns 1-3), but this effect
becomes insignificant after adding more controls (columns 4-6). Second, we consider the 1000-
1300 period as the treatment effect, i.e. we study the effect of being reconquered in this specific
period on cities’ population. Several historical accounts state that these were the years in which
the Reconquest became more aggressive in large part due to the active role that the popes played
in promoting it. Table 5 shows that the results of estimating the average effect in this case are
quite similar to those of Table 2. With the basic controls, we observe a strong negative impact of
the Reconquest on a city’s population, although it only remains statistically significant after
controlling for other variables in the case of the share of Iberian urban population. Table 6
maintains the 1000-1300 period as the treatment effect but also includes the 23 European cities
35 We display here only robustness checks associated with the regressions on the average effect of the Reconquest. The results with the dynamic regressions are harder to interpret since many observations are lost and so several time dummies are eliminated from the estimation. The results are, however, consistent with those presented here and are available from the authors upon request. 36 These cities include Wien from Austria, Antwerpen, Brugge, Gent and Ieper from Belgium, Laon and Paris from France, Augsburg, Berlin, Hamburg, Koeln and Regensburg from Germany, Napoli, Palermo, Roma and Venezia from Italy, Amsterdam, Utrecht and Zwolle from the Netherlands, Basel, Geneve and Zuerich from Switzerland, and London from the UK.
24
that were not subject to the Reconquest and the results are barely affected.37 Third, in Table 7,
we remove cities that have no population data around the Reconquest year since it is possible
that these observations simply add noise to our regressions. This reduces our sample size to 21
cities. The main findings are robust to this omission, and estimates are similar to those shown in
Table 2. Finally, in Table 8, we remove the last period (year 2000 or 1900-2000 growth rates)
from the estimation since most Iberian cities grew very fast around this period as a result of very
rapid urbanization between 1900 and 2000. Once again, the main results of the empirical
exercises survive after this robustness check.
TABLES 4 TO 8 HERE
7. Conclusions
In this paper, we analyse the impact of the Spanish Reconquest on the population of the main
Muslim cities of the Iberian Peninsula. This was a military campaign against the Muslim state
that lasted about 700 years. As a consequence, most of the Muslim population was expelled from
the Iberian Peninsula. Naturally, this process involved dramatic changes in the composition of
the population, both in the peninsula but also across different cities.
We find that cities that were affected by the Reconquest experienced a temporary decline
in their relative and log-scale population. We also find a negative effect on population growth,
but this effect is not robust to controlling for a set of controls and city-specific time trends.
Moreover, when we analyse the duration of this negative shock, we conclude that it was short-
lived, vanishing within the first one hundred years after the onset of the Reconquest.
From a theoretical point of view, these findings are supportive of models where
locational fundamentals, or time invariant city characteristics, are the most important variable to
explain a city’s location and subsequent growth. From the perspective of the literature on city
size and conflict, we provide some weak evidence that the Reconquest had a negative impact on
the population size of the cities that were affected by it, suggesting that the target effect and the
effect of direct destruction from the war dominated the safe harbour and the transportation
effects in this historical context, at least in the short run.
37 Using 1200-1500 as the treatment period leads to very similar results.
25
We view these findings as not just relevant from a historical point of view. There are
plenty of events that recurrently affect the size of today’s cities in an exogenous way, including
wars and natural disasters. The results of this paper shed light on the future evolution of these
cities and therefore offer guidance for policymakers that seek to evaluate the need and/or the
effect of policies aimed to help planning the recovery of cities that have experienced such
shocks.
References
Acemoglu, D., S. Johnson, and J. Robinson (2005), “The Rise of Europe: Atlantic Trade,
Institutional Change, and Economic Growth.” American Economic Review, 95(3): 546–579.
Ahlfeldt, G. M., S. J. Redding, D. M. Sturm, and N. Wolf (2015), “The economics of density:
Evidence from the Berlin wall.” Econometrica, 83(6): 2127–2189.
Allen, R. C. (2001), “The Great Divergence in European Wages and Prices from the Middle
Ages to the First World War.” Explorations in Economic History, 38: 411–447.
Álvarez-Nogal, and L. Prados de la Escosura (2013), “The Rise and Fall of Spain (1270–1850).”
Economic History Review, 66(1): 1-37.
Bairoch, P., J. Batou, and P. Chevre (1988), “La population des villes européennes de 800 a
1850: Banque de donnees et analyse sommaire des resultats.”(The population of European
cities, 800–1850: Data bank and short summary of results.) Centre of International Economic
History Series, No. 2. Geneva: Librarie Droz, 1988.
Beeson, P.E., and D.N. DeJong (2002). “Divergence.” Contributions to Macroeconomics, 2(1).
Beeson, P.E., D.N. DeJong, and W. Troesken (2001). “Population growth in US counties, 1840–
1990.” Regional Science and Urban Economics, 31(6): 669–699.
Bleakley, H., and J. Lin (2012), “Portage and Path Dependence.” Quarterly Journal of
Economics, 127(2): 587–644.
Blomberg, B., S. Sheppard and E.L. Glaeser (2007), “The Impacts of Terrorism on Urban Form.”
Brookings-Wharton Papers on Urban Affairs, 257–294.
26
Bosker, M., E. Buring, and J. L. Van Zanden (2013), “From Baghdad to London: unraveling
urban development in Europe, the Middle East and North Africa, 800-1800.” Review of
Economics and Statistics, 95(4): 1418–1437.
Bosker, E. M., S. Brakman, H. Garretsen, and M. Schramm (2007), “Looking for multiple
equilibria when geography matters: German city growth and the WWII shock.” Journal of
Urban Economics, 61: 152–169.
Brakman, S., H. Garretsen, M. Schramm (2004), “The strategic bombing of German cities during
WWII and its impact on city growth,” Journal of Economic Geography, 4: 201–218.
Chandler, T. (1987), “Four Thousand Years of Urban Growth: An Historical Census.” Lewiston,
NY: The Edwin Mellen Press.
Chandler, T., and G. Fox (1974), “3000 Years of Urban Growth.” New York, NY: Academic
Press.
Chaney, E., and R. Hornbeck (2016), “Economic Growth in the Malthusian Era: Evidence from
the 1609 Spanish Expulsion of the Moriscos.” The Economic Journal, 126(594): 1404–1440.
CIA World Factbook, https://www.cia.gov/library/publications/the-world-factbook/
Cuberes, D. (2011), “Sequential City Growth: Empirical Evidence.” Journal of Urban
Economics, 69: 229–239.
Davis D. R., and D. E. Weinstein (2002), “Bones, Bombs, and Break Points: The Geography of
Economic Activity.” American Economic Review, 92(5): 1269–1289.
de Vries, J. (1984), “European Urbanization 1500–1800.” Cambridge: Harvard University Press.
Desmet, K, and J. Rappaport (2016), “The Settlement of the United States, 1800-2000: The Long
Transition to Gibrat’s Law,” Journal of Urban Economics, forthcoming.
Dincecco, M., and O. M. Gaetano (2015), “Military Conflict and the Rise of Urban Europe.”
SSRN working paper, available at SSRN: http://ssrn.com/abstract=2341713
Dittmar, J. (2011), “Cities, markets, and growth: the emergence of Zipf’s law.” Working Paper.
Mimeo, London School of Economics.
27
Eaton, J., and Z. Eckstein (1997), “Cities and growth: theory and evidence from France and
Japan.” Regional Science and Urban Economics, XXVII, 443–474.
Ehrlich, S., and J. Gyourko (2000), “Changes in the scale and size distribution of US
metropolitan areas during the twentieth century.” Urban Studies, 37(7), 1063–1077.
Fernihough, A., and K. Hjortshøj O’Rourke (2014), “Coal and the European industrial
revolution.” NBER Working Paper No. 19802.
Glaeser, E.L. (2005), “Should the Government Rebuild New Orleans or Just Give Residents
Checks?” The Economists’ Voice. Volume 2, Issue 4, Article 4.
Glaeser E.L. (2011), Triumph of the City. MacMillan
Glaeser, E.L, and J.M. Shapiro (2002), “Cities and Warfare: The Impact of Terrorism on Urban
Form.” Journal of Urban Economics 51, 205–224.
González-Val, R. (2010), “The evolution of US city size distribution from a long term
perspective (1900-2000)”. Journal of Regional Science, 50(5): 952–972.
González-Val, R., (2016), “Historical urban growth in Europe (1300–1800).” Working Papers
2016/8, Institut d'Economia de Barcelona (IEB).
González-Val, R., and F. Pueyo (2010), “First nature vs. second nature causes: industry location
and growth in the presence of an open-access renewable resource.” Working Papers 2010/39,
Institut d'Economia de Barcelona (IEB).
Henderson, J.V. (1982a), “Systems of Cities in Closed and Open Economies.” Regional Science
and Urban Economics, 12: 325-350.
Henderson, J.V. (1982b), “The Impact of Government Policies on Urban Concentration.”
Journal of Urban Economics, 12: 280-303.
Henderson, J.V. (2000), “The Effects of Urban Concentration on Economic Growth.” NBER
Working Paper 7503, National Bureau of Economic Research, Cambridge, MA.
28
Ioannides, Y.M., and H.G. Overman (2003), “Zipf’s law for cities: an empirical examination.”
Regional Science and Urban Economics, 33: 127–137.
Kim, S. (2007), “Changes in the nature of urban spatial structure in the United States, 1890–
2000.” Journal of Regional Science, 47(2): 273–287.
Kline, P., and E. Moretti (2014), “Local Economic Development, Agglomeration Economies,
and the Big Push: 100 Years of Evidence from the Tennessee Valley Authority.” Quarterly
Journal of Economics, 129(1): 275-331.
Krugman, P. (1991), “Increasing returns and economic geography.” Journal of Political
Economy, 99: 483-499.
Krugman, P. (1998), “What’s New about the New Economic Geography?” Oxford Review of
Economic Policy, Summer, 14(2), pp. 7–17.Krugman, P. (1991), “Increasing Returns and
Economic Geography.” Journal of Political Economy, 99(3): 483–499.
Liu, S. (2015), “Spillovers from Universities: Evidence from the Land-Grant Program,” Journal
of Urban Economics, 87: 25-41.
Maddison (2003), “The World Economy: Historical Statistics.” Paris: OECD.
McEvedy, C., and R. Jones (1978), “Atlas of world population history.” Harmondsworth:
Penguin.
Miguel, E., and G. Roland (2011), “The Long-Run Impact of Bombing Vietnam.” Journal of
Development Economics, 96:1: 1–15.
Nitsch, V. (2003), “Does History Matter for Urban Primacy? The Case of Vienna.” Regional
Science and Urban Economics, 33: 401–418.
O'Callaghan, J. F. (2003), “Reconquest and Crusade in Medieval Spain.” Philadelphia:
University of Pennsylvania Press.
Perron, P., and T. Vogelsang (1992), “Nonstationarity and level shifts with an application to
purchasing power parity.” Journal of Business and Economic Statistics, 10: 301–320.
Picard, P. M., and D.-Z. Zeng (2010), “A Harmonization of First and Second Natures.” Journal
of Regional Science, 50(5): 973–994.
29
Rappaport, J., and J. D. Sachs (2003), “The U.S. as a Coastal Nation.” Journal of Economic
Growth 8(1), 5-46, March.
Redding, S. J., and D. M. Sturm (2008), “The costs of remoteness: Evidence from German
division and reunification.” American Economic Review, 98(5): 1766–1797.
Redding, S. J., D. M. Sturm, and N. Wolf (2011), “History and Industry Location: Evidence
From German Airports.” Review of Economics and Statistics, 93(3): 814-831.
Sáez Abad, R. (2009). “Los grandes asedios en la Reconquista de la Península Ibérica.” Madrid:
Almena.
Sánchez-Vidal, M., R. González-Val and E. Viladecans-Marsal (2014), “Sequential city growth
in the US: Does age matter?”. Regional Science and Urban Economics, 44: 29–37.
Sheppard, B. (2009), “Urban Structure in a Climate of Terror.” Chapter 7 in Guns and Butter:
The Economic Causes and Consequences of Conflict, edited by Gregory D. Hess,
Cambridge: MIT Press.
Simon, H. (1955), “On a Class of Skew Distribution Functions.” Biometrika, 42: 425-440.
Talbert, R. J. A., (2000), “Barrington atlas of the Greek and Roman world.” Princeton: Princeton
University Press.
30
Figure 1: The Caliphate of Cordoba c. 1000
Source: Wikipedia
31
Figure 2: Evolution of the population
02
00
40
06
00
80
0
Urb
an
po
pu
latio
n in
th
ou
sa
nd
s
800 1000 1200 1400
Year
Muslim Christian Total population
01
00
00
20
00
03
00
00
To
tal p
op
ula
tio
n in
th
ou
sa
nd
s
800 1000 1200 1400 1600 1800
Year
France Germany Italy UK Spain
(a) Spain, 800-1400 (b) European countries, 800-1800
Sources: (a) Data estimated by Eltjo Buringh and Jan Luiten van Zanden based on Bairoch et al. (1988). Available
at: http://socialhistory.org/en/projects/global-historical-bibliometrics. (b) McEvedy and Jones (1978).
32
Figure 3: Nonparametric relationship between the Reconquest dates latitude, longitude and city
population (log scale)
800
1000
1200
1400
1600
Reconquest
date
36 38 40 42 44
Latitude
600
800
1000
1200
1400
1600
Reconquest
date
-10 -5 0 5
Longitude
800
1000
1200
1400
1600
Reconquest
date
0 1 2 3 4 5
Population (ln scale)
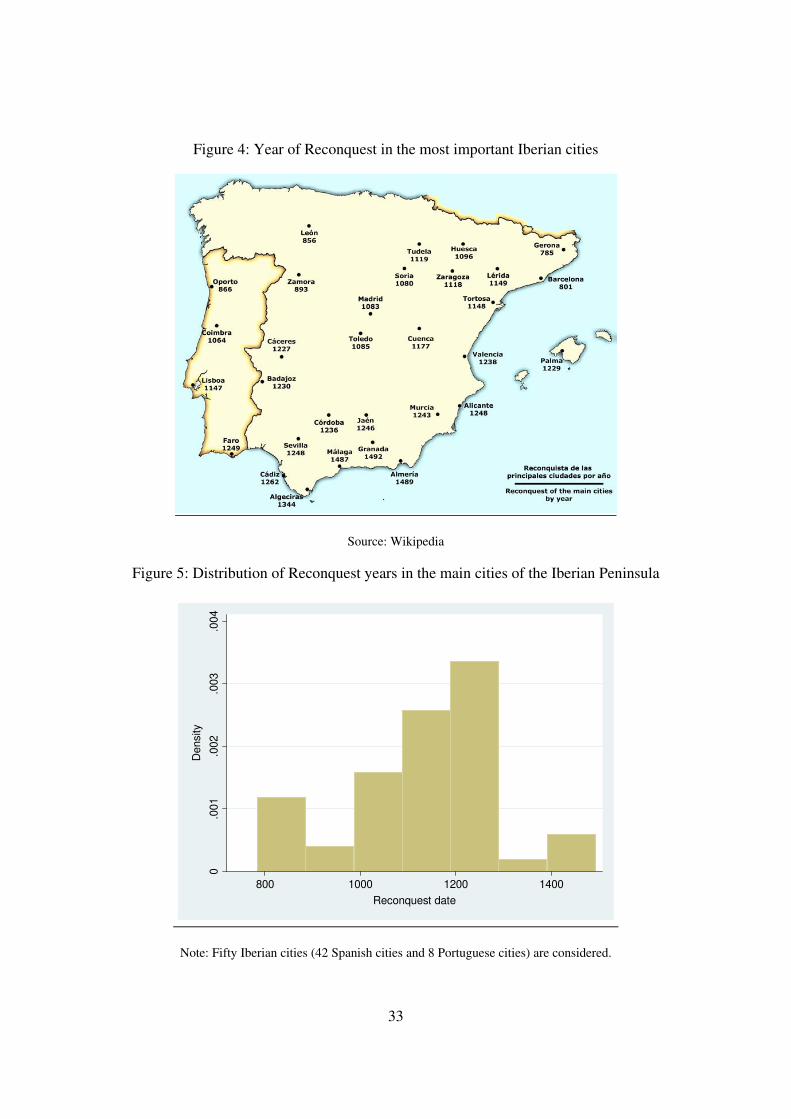
33
Figure 4: Year of Reconquest in the most important Iberian cities
Source: Wikipedia
Figure 5: Distribution of Reconquest years in the main cities of the Iberian Peninsula
0.0
01
.002
.003
.004
Density
800 1000 1200 1400
Reconquest date
Note: Fifty Iberian cities (42 Spanish cities and 8 Portuguese cities) are considered.
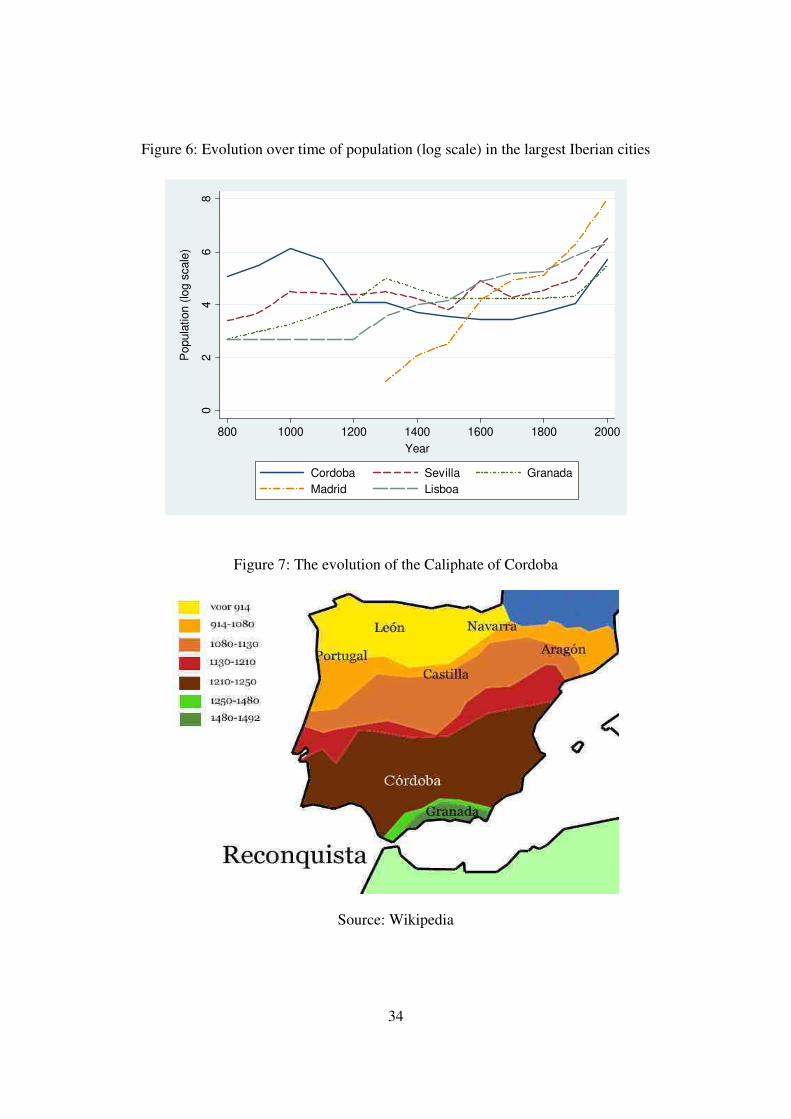
34
Figure 6: Evolution over time of population (log scale) in the largest Iberian cities
02
46
8
Popula
tion (
log s
cale
)
800 1000 1200 1400 1600 1800 2000
Year
Cordoba Sevilla Granada
Madrid Lisboa
Figure 7: The evolution of the Caliphate of Cordoba
Source: Wikipedia
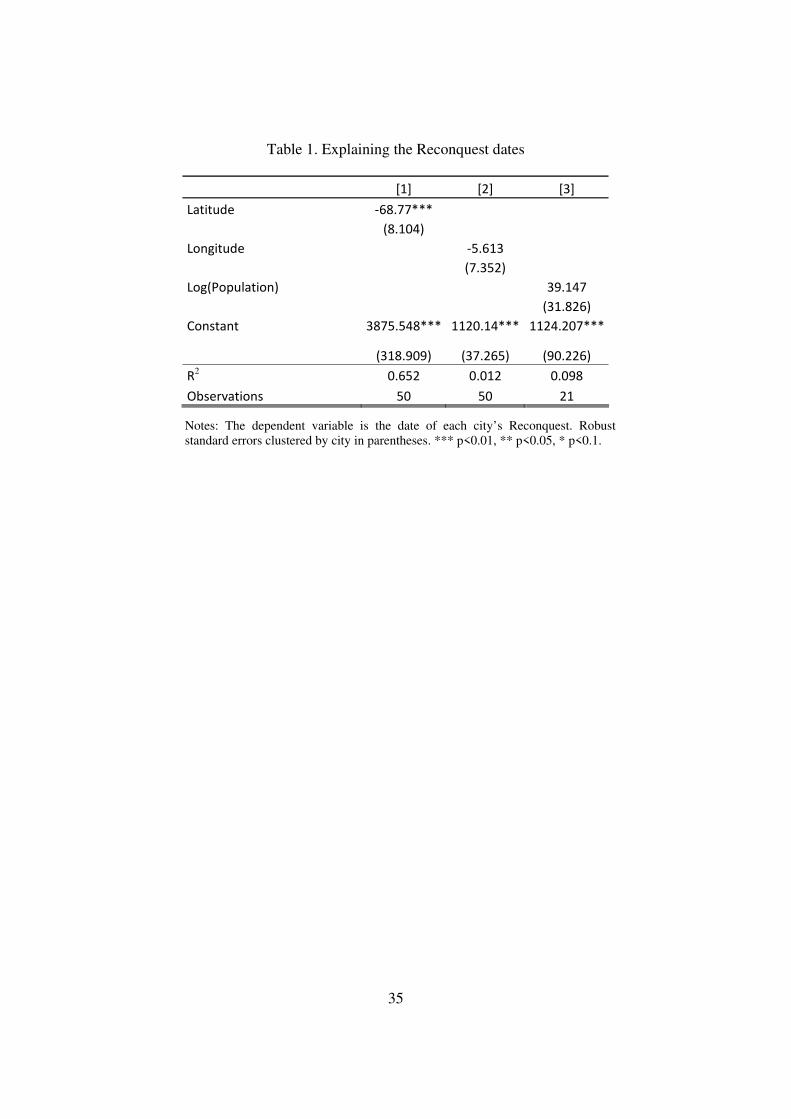
35
Table 1. Explaining the Reconquest dates
[1] [2] [3]
Latitude ‐68.77*** (8.104) Longitude ‐5.613 (7.352) Log(Population) 39.147 (31.826) Constant 3875.548*** 1120.14*** 1124.207*** (318.909) (37.265) (90.226) R
2 0.652 0.012 0.098
Observations 50 50 21
Notes: The dependent variable is the date of each city’s Reconquest. Robust standard errors clustered by city in parentheses. *** p<0.01, ** p<0.05, * p<0.1.
ρ
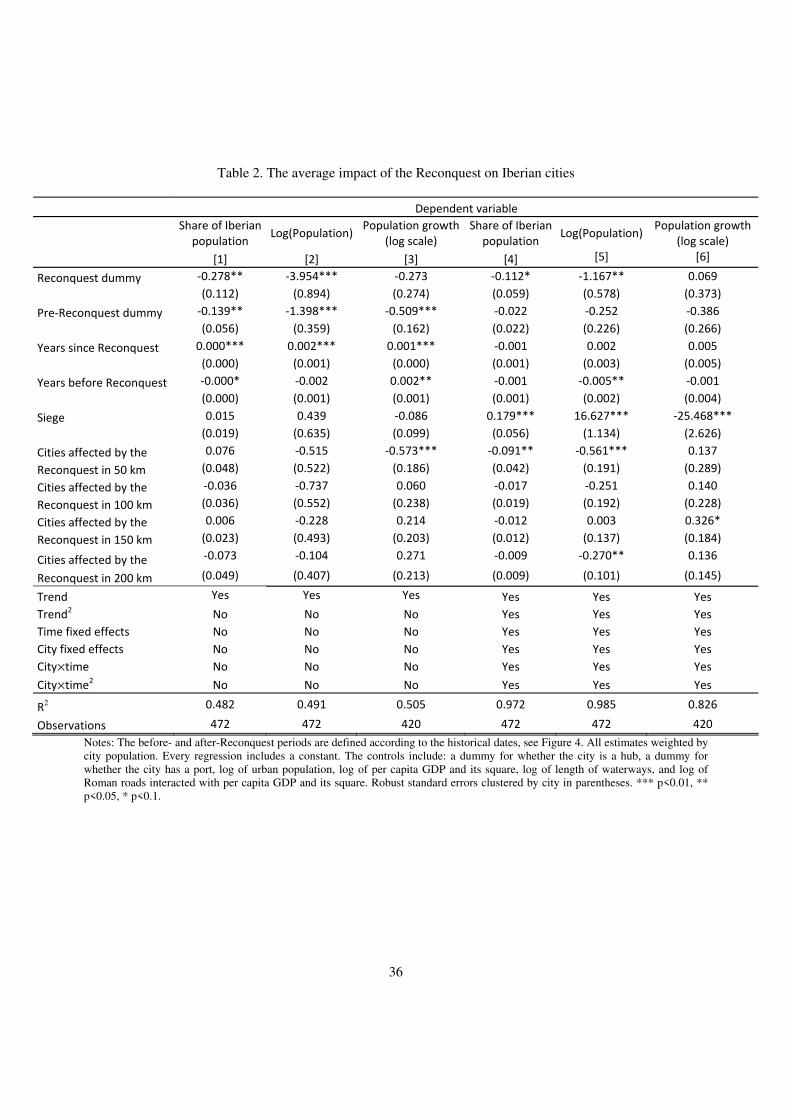
36
Table 2. The average impact of the Reconquest on Iberian cities
Dependent variable
Share of Iberian population
Log(Population)Population growth
(log scale) Share of Iberian population
Log(Population) Population growth
(log scale) [1] [2] [3] [4] [5] [6]
Reconquest dummy ‐0.278** ‐3.954*** ‐0.273 ‐0.112* ‐1.167** 0.069
(0.112) (0.894) (0.274) (0.059) (0.578) (0.373)
Pre‐Reconquest dummy ‐0.139** ‐1.398*** ‐0.509*** ‐0.022 ‐0.252 ‐0.386
(0.056) (0.359) (0.162) (0.022) (0.226) (0.266)
Years since Reconquest 0.000*** 0.002*** 0.001*** ‐0.001 0.002 0.005
(0.000) (0.001) (0.000) (0.001) (0.003) (0.005)
Years before Reconquest ‐0.000* ‐0.002 0.002** ‐0.001 ‐0.005** ‐0.001
(0.000) (0.001) (0.001) (0.001) (0.002) (0.004)
Siege 0.015 0.439 ‐0.086 0.179*** 16.627*** ‐25.468***
(0.019) (0.635) (0.099) (0.056) (1.134) (2.626)
Cities affected by the 0.076 ‐0.515 ‐0.573*** ‐0.091** ‐0.561*** 0.137
Reconquest in 50 km (0.048) (0.522) (0.186) (0.042) (0.191) (0.289)
Cities affected by the ‐0.036 ‐0.737 0.060 ‐0.017 ‐0.251 0.140
Reconquest in 100 km (0.036) (0.552) (0.238) (0.019) (0.192) (0.228)
Cities affected by the 0.006 ‐0.228 0.214 ‐0.012 0.003 0.326*
Reconquest in 150 km (0.023) (0.493) (0.203) (0.012) (0.137) (0.184)
Cities affected by the ‐0.073 ‐0.104 0.271 ‐0.009 ‐0.270** 0.136
Reconquest in 200 km (0.049) (0.407) (0.213) (0.009) (0.101) (0.145)
Trend Yes Yes Yes Yes Yes Yes Trend
2 No No No Yes Yes Yes Time fixed effects No No No Yes Yes Yes City fixed effects No No No Yes Yes Yes Cityμtime No No No Yes Yes Yes
Cityμtime2 No No No Yes Yes Yes
R2 0.482 0.491 0.505 0.972 0.985 0.826
Observations 472 472 420 472 472 420 Notes: The before- and after-Reconquest periods are defined according to the historical dates, see Figure 4. All estimates weighted by city population. Every regression includes a constant. The controls include: a dummy for whether the city is a hub, a dummy for whether the city has a port, log of urban population, log of per capita GDP and its square, log of length of waterways, and log of Roman roads interacted with per capita GDP and its square. Robust standard errors clustered by city in parentheses. *** p<0.01, ** p<0.05, * p<0.1.
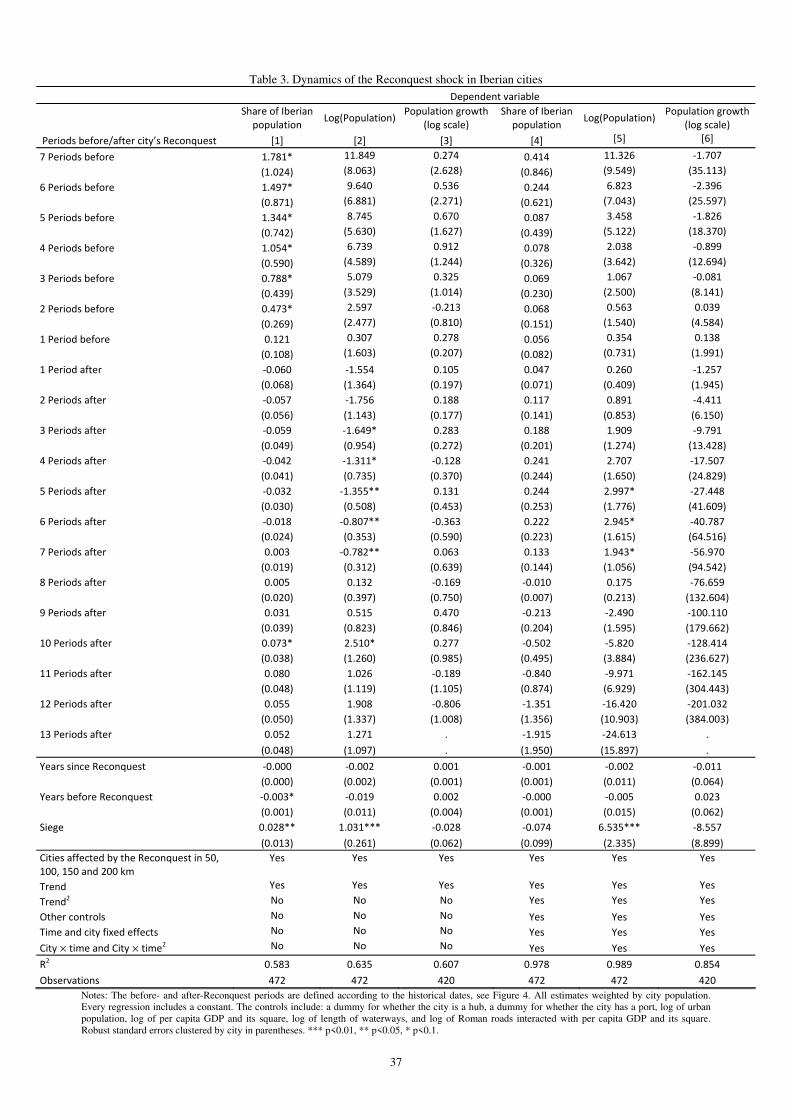
37
Table 3. Dynamics of the Reconquest shock in Iberian cities Dependent variable
Share of Iberian population
Log(Population)Population growth
(log scale) Share of Iberian population
Log(Population)Population growth
(log scale) Periods before/after city’s Reconquest [1] [2] [3] [4] [5] [6]
7 Periods before 1.781* 11.849 0.274 0.414 11.326 ‐1.707
(1.024) (8.063) (2.628) (0.846) (9.549) (35.113)
6 Periods before 1.497* 9.640 0.536 0.244 6.823 ‐2.396
(0.871) (6.881) (2.271) (0.621) (7.043) (25.597)
5 Periods before 1.344* 8.745 0.670 0.087 3.458 ‐1.826
(0.742) (5.630) (1.627) (0.439) (5.122) (18.370)
4 Periods before 1.054* 6.739 0.912 0.078 2.038 ‐0.899
(0.590) (4.589) (1.244) (0.326) (3.642) (12.694)
3 Periods before 0.788* 5.079 0.325 0.069 1.067 ‐0.081
(0.439) (3.529) (1.014) (0.230) (2.500) (8.141)
2 Periods before 0.473* 2.597 ‐0.213 0.068 0.563 0.039
(0.269) (2.477) (0.810) (0.151) (1.540) (4.584)
1 Period before 0.121 0.307 0.278 0.056 0.354 0.138
(0.108) (1.603) (0.207) (0.082) (0.731) (1.991)
1 Period after ‐0.060 ‐1.554 0.105 0.047 0.260 ‐1.257 (0.068) (1.364) (0.197) (0.071) (0.409) (1.945) 2 Periods after ‐0.057 ‐1.756 0.188 0.117 0.891 ‐4.411 (0.056) (1.143) (0.177) (0.141) (0.853) (6.150) 3 Periods after ‐0.059 ‐1.649* 0.283 0.188 1.909 ‐9.791 (0.049) (0.954) (0.272) (0.201) (1.274) (13.428) 4 Periods after ‐0.042 ‐1.311* ‐0.128 0.241 2.707 ‐17.507 (0.041) (0.735) (0.370) (0.244) (1.650) (24.829) 5 Periods after ‐0.032 ‐1.355** 0.131 0.244 2.997* ‐27.448 (0.030) (0.508) (0.453) (0.253) (1.776) (41.609) 6 Periods after ‐0.018 ‐0.807** ‐0.363 0.222 2.945* ‐40.787 (0.024) (0.353) (0.590) (0.223) (1.615) (64.516) 7 Periods after 0.003 ‐0.782** 0.063 0.133 1.943* ‐56.970 (0.019) (0.312) (0.639) (0.144) (1.056) (94.542) 8 Periods after 0.005 0.132 ‐0.169 ‐0.010 0.175 ‐76.659 (0.020) (0.397) (0.750) (0.007) (0.213) (132.604) 9 Periods after 0.031 0.515 0.470 ‐0.213 ‐2.490 ‐100.110 (0.039) (0.823) (0.846) (0.204) (1.595) (179.662) 10 Periods after 0.073* 2.510* 0.277 ‐0.502 ‐5.820 ‐128.414 (0.038) (1.260) (0.985) (0.495) (3.884) (236.627) 11 Periods after 0.080 1.026 ‐0.189 ‐0.840 ‐9.971 ‐162.145 (0.048) (1.119) (1.105) (0.874) (6.929) (304.443) 12 Periods after 0.055 1.908 ‐0.806 ‐1.351 ‐16.420 ‐201.032 (0.050) (1.337) (1.008) (1.356) (10.903) (384.003) 13 Periods after 0.052 1.271 . ‐1.915 ‐24.613 . (0.048) (1.097) . (1.950) (15.897) .
Years since Reconquest ‐0.000 ‐0.002 0.001 ‐0.001 ‐0.002 ‐0.011 (0.000) (0.002) (0.001) (0.001) (0.011) (0.064) Years before Reconquest ‐0.003* ‐0.019 0.002 ‐0.000 ‐0.005 0.023 (0.001) (0.011) (0.004) (0.001) (0.015) (0.062) Siege 0.028** 1.031*** ‐0.028 ‐0.074 6.535*** ‐8.557
(0.013) (0.261) (0.062) (0.099) (2.335) (8.899) Cities affected by the Reconquest in 50, 100, 150 and 200 km
Yes Yes Yes Yes Yes Yes
Trend Yes Yes Yes Yes Yes Yes
Trend2 No No No Yes Yes Yes
Other controls No No No Yes Yes Yes Time and city fixed effects No No No Yes Yes Yes
City μ time and City μ time2 No No No Yes Yes Yes
R2 0.583 0.635 0.607 0.978 0.989 0.854
Observations 472 472 420 472 472 420 Notes: The before- and after-Reconquest periods are defined according to the historical dates, see Figure 4. All estimates weighted by city population. Every regression includes a constant. The controls include: a dummy for whether the city is a hub, a dummy for whether the city has a port, log of urban population, log of per capita GDP and its square, log of length of waterways, and log of Roman roads interacted with per capita GDP and its square. Robust standard errors clustered by city in parentheses. *** p<0.01, ** p<0.05, * p<0.1.
ρ
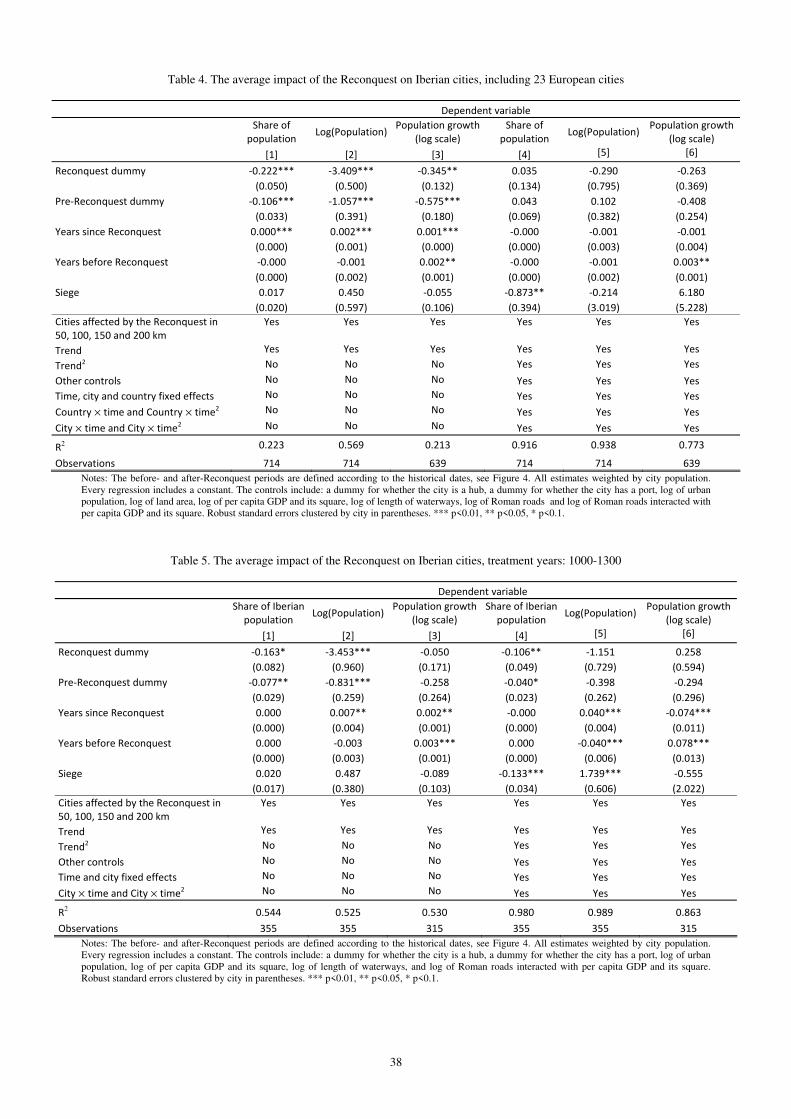
38
Table 4. The average impact of the Reconquest on Iberian cities, including 23 European cities
Dependent variable
Share of
population Log(Population)
Population growth (log scale)
Share of population
Log(Population) Population growth
(log scale)
[1] [2] [3] [4] [5] [6]
Reconquest dummy ‐0.222*** ‐3.409*** ‐0.345** 0.035 ‐0.290 ‐0.263 (0.050) (0.500) (0.132) (0.134) (0.795) (0.369) Pre‐Reconquest dummy ‐0.106*** ‐1.057*** ‐0.575*** 0.043 0.102 ‐0.408 (0.033) (0.391) (0.180) (0.069) (0.382) (0.254) Years since Reconquest 0.000*** 0.002*** 0.001*** ‐0.000 ‐0.001 ‐0.001 (0.000) (0.001) (0.000) (0.000) (0.003) (0.004) Years before Reconquest ‐0.000 ‐0.001 0.002** ‐0.000 ‐0.001 0.003** (0.000) (0.002) (0.001) (0.000) (0.002) (0.001) Siege 0.017 0.450 ‐0.055 ‐0.873** ‐0.214 6.180 (0.020) (0.597) (0.106) (0.394) (3.019) (5.228) Cities affected by the Reconquest in 50, 100, 150 and 200 km
Yes Yes Yes Yes Yes Yes
Trend Yes Yes Yes Yes Yes Yes
Trend2 No No No Yes Yes Yes
Other controls No No No Yes Yes Yes Time, city and country fixed effects No No No Yes Yes Yes
Country μ time and Country μ time2 No No No Yes Yes Yes
City μ time and City μ time2 No No No Yes Yes Yes
R2 0.223 0.569 0.213 0.916 0.938 0.773
Observations 714 714 639 714 714 639 Notes: The before- and after-Reconquest periods are defined according to the historical dates, see Figure 4. All estimates weighted by city population. Every regression includes a constant. The controls include: a dummy for whether the city is a hub, a dummy for whether the city has a port, log of urban population, log of land area, log of per capita GDP and its square, log of length of waterways, log of Roman roads and log of Roman roads interacted with per capita GDP and its square. Robust standard errors clustered by city in parentheses. *** p<0.01, ** p<0.05, * p<0.1.
Table 5. The average impact of the Reconquest on Iberian cities, treatment years: 1000-1300
Dependent variable
Share of Iberian population
Log(Population)Population growth
(log scale) Share of Iberian population
Log(Population) Population growth
(log scale) [1] [2] [3] [4] [5] [6]
Reconquest dummy ‐0.163* ‐3.453*** ‐0.050 ‐0.106** ‐1.151 0.258 (0.082) (0.960) (0.171) (0.049) (0.729) (0.594) Pre‐Reconquest dummy ‐0.077** ‐0.831*** ‐0.258 ‐0.040* ‐0.398 ‐0.294 (0.029) (0.259) (0.264) (0.023) (0.262) (0.296) Years since Reconquest 0.000 0.007** 0.002** ‐0.000 0.040*** ‐0.074*** (0.000) (0.004) (0.001) (0.000) (0.004) (0.011) Years before Reconquest 0.000 ‐0.003 0.003*** 0.000 ‐0.040*** 0.078*** (0.000) (0.003) (0.001) (0.000) (0.006) (0.013) Siege 0.020 0.487 ‐0.089 ‐0.133*** 1.739*** ‐0.555 (0.017) (0.380) (0.103) (0.034) (0.606) (2.022) Cities affected by the Reconquest in 50, 100, 150 and 200 km
Yes Yes Yes Yes Yes Yes
Trend Yes Yes Yes Yes Yes Yes
Trend2 No No No Yes Yes Yes
Other controls No No No Yes Yes Yes Time and city fixed effects No No No Yes Yes Yes
City μ time and City μ time2 No No No Yes Yes Yes
R2 0.544 0.525 0.530 0.980 0.989 0.863
Observations 355 355 315 355 355 315 Notes: The before- and after-Reconquest periods are defined according to the historical dates, see Figure 4. All estimates weighted by city population. Every regression includes a constant. The controls include: a dummy for whether the city is a hub, a dummy for whether the city has a port, log of urban population, log of per capita GDP and its square, log of length of waterways, and log of Roman roads interacted with per capita GDP and its square. Robust standard errors clustered by city in parentheses. *** p<0.01, ** p<0.05, * p<0.1.
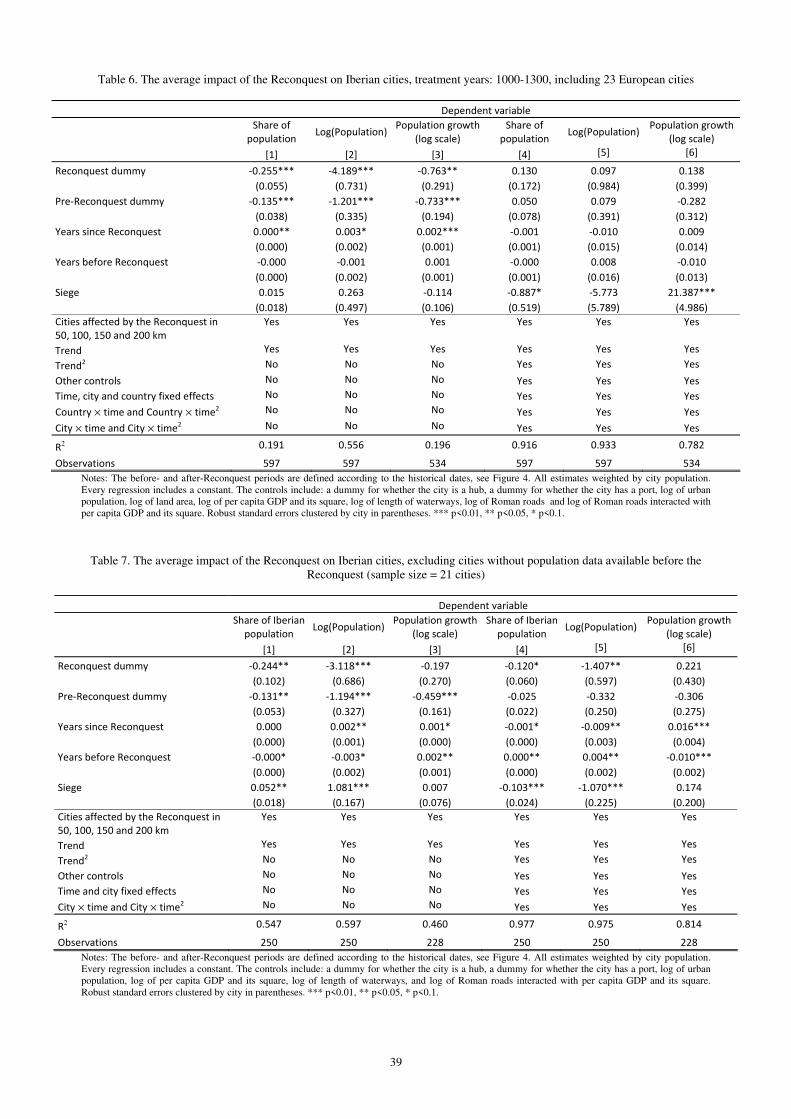
39
Table 6. The average impact of the Reconquest on Iberian cities, treatment years: 1000-1300, including 23 European cities
Dependent variable
Share of
population Log(Population)
Population growth (log scale)
Share of population
Log(Population) Population growth
(log scale)
[1] [2] [3] [4] [5] [6]
Reconquest dummy ‐0.255*** ‐4.189*** ‐0.763** 0.130 0.097 0.138 (0.055) (0.731) (0.291) (0.172) (0.984) (0.399) Pre‐Reconquest dummy ‐0.135*** ‐1.201*** ‐0.733*** 0.050 0.079 ‐0.282 (0.038) (0.335) (0.194) (0.078) (0.391) (0.312) Years since Reconquest 0.000** 0.003* 0.002*** ‐0.001 ‐0.010 0.009 (0.000) (0.002) (0.001) (0.001) (0.015) (0.014) Years before Reconquest ‐0.000 ‐0.001 0.001 ‐0.000 0.008 ‐0.010 (0.000) (0.002) (0.001) (0.001) (0.016) (0.013) Siege 0.015 0.263 ‐0.114 ‐0.887* ‐5.773 21.387*** (0.018) (0.497) (0.106) (0.519) (5.789) (4.986) Cities affected by the Reconquest in 50, 100, 150 and 200 km
Yes Yes Yes Yes Yes Yes
Trend Yes Yes Yes Yes Yes Yes
Trend2 No No No Yes Yes Yes
Other controls No No No Yes Yes Yes Time, city and country fixed effects No No No Yes Yes Yes
Country μ time and Country μ time2 No No No Yes Yes Yes
City μ time and City μ time2 No No No Yes Yes Yes
R2 0.191 0.556 0.196 0.916 0.933 0.782
Observations 597 597 534 597 597 534 Notes: The before- and after-Reconquest periods are defined according to the historical dates, see Figure 4. All estimates weighted by city population. Every regression includes a constant. The controls include: a dummy for whether the city is a hub, a dummy for whether the city has a port, log of urban population, log of land area, log of per capita GDP and its square, log of length of waterways, log of Roman roads and log of Roman roads interacted with per capita GDP and its square. Robust standard errors clustered by city in parentheses. *** p<0.01, ** p<0.05, * p<0.1.
Table 7. The average impact of the Reconquest on Iberian cities, excluding cities without population data available before the Reconquest (sample size = 21 cities)
Dependent variable
Share of Iberian population
Log(Population)Population growth
(log scale) Share of Iberian population
Log(Population) Population growth
(log scale) [1] [2] [3] [4] [5] [6]
Reconquest dummy ‐0.244** ‐3.118*** ‐0.197 ‐0.120* ‐1.407** 0.221 (0.102) (0.686) (0.270) (0.060) (0.597) (0.430) Pre‐Reconquest dummy ‐0.131** ‐1.194*** ‐0.459*** ‐0.025 ‐0.332 ‐0.306 (0.053) (0.327) (0.161) (0.022) (0.250) (0.275) Years since Reconquest 0.000 0.002** 0.001* ‐0.001* ‐0.009** 0.016*** (0.000) (0.001) (0.000) (0.000) (0.003) (0.004) Years before Reconquest ‐0.000* ‐0.003* 0.002** 0.000** 0.004** ‐0.010*** (0.000) (0.002) (0.001) (0.000) (0.002) (0.002) Siege 0.052** 1.081*** 0.007 ‐0.103*** ‐1.070*** 0.174 (0.018) (0.167) (0.076) (0.024) (0.225) (0.200) Cities affected by the Reconquest in 50, 100, 150 and 200 km
Yes Yes Yes Yes Yes Yes
Trend Yes Yes Yes Yes Yes Yes
Trend2 No No No Yes Yes Yes
Other controls No No No Yes Yes Yes Time and city fixed effects No No No Yes Yes Yes
City μ time and City μ time2 No No No Yes Yes Yes
R2 0.547 0.597 0.460 0.977 0.975 0.814
Observations 250 250 228 250 250 228 Notes: The before- and after-Reconquest periods are defined according to the historical dates, see Figure 4. All estimates weighted by city population. Every regression includes a constant. The controls include: a dummy for whether the city is a hub, a dummy for whether the city has a port, log of urban population, log of per capita GDP and its square, log of length of waterways, and log of Roman roads interacted with per capita GDP and its square. Robust standard errors clustered by city in parentheses. *** p<0.01, ** p<0.05, * p<0.1.
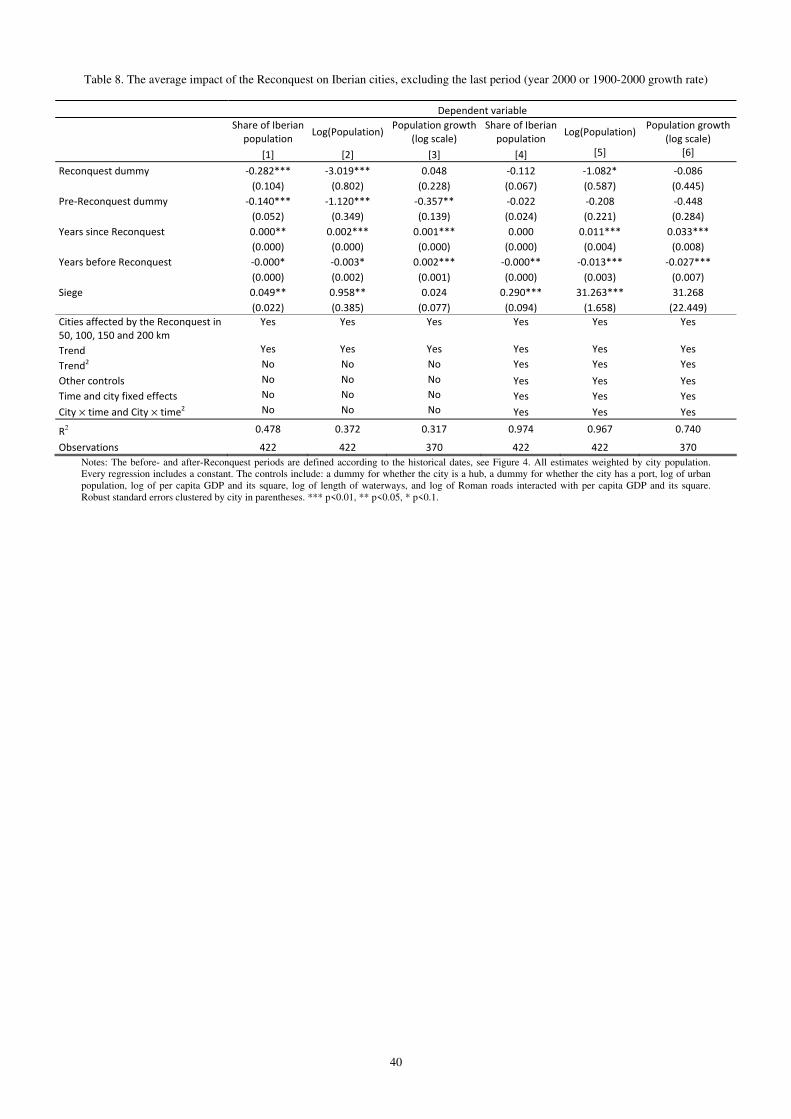
40
Table 8. The average impact of the Reconquest on Iberian cities, excluding the last period (year 2000 or 1900-2000 growth rate)
Dependent variable
Share of Iberian population
Log(Population)Population growth
(log scale) Share of Iberian population
Log(Population) Population growth
(log scale)
[1] [2] [3] [4] [5] [6]
Reconquest dummy ‐0.282*** ‐3.019*** 0.048 ‐0.112 ‐1.082* ‐0.086 (0.104) (0.802) (0.228) (0.067) (0.587) (0.445) Pre‐Reconquest dummy ‐0.140*** ‐1.120*** ‐0.357** ‐0.022 ‐0.208 ‐0.448 (0.052) (0.349) (0.139) (0.024) (0.221) (0.284) Years since Reconquest 0.000** 0.002*** 0.001*** 0.000 0.011*** 0.033*** (0.000) (0.000) (0.000) (0.000) (0.004) (0.008) Years before Reconquest ‐0.000* ‐0.003* 0.002*** ‐0.000** ‐0.013*** ‐0.027*** (0.000) (0.002) (0.001) (0.000) (0.003) (0.007) Siege 0.049** 0.958** 0.024 0.290*** 31.263*** 31.268 (0.022) (0.385) (0.077) (0.094) (1.658) (22.449) Cities affected by the Reconquest in 50, 100, 150 and 200 km
Yes Yes Yes Yes Yes Yes
Trend Yes Yes Yes Yes Yes Yes
Trend2 No No No Yes Yes Yes
Other controls No No No Yes Yes Yes Time and city fixed effects No No No Yes Yes Yes
City μ time and City μ time2 No No No Yes Yes Yes
R2 0.478 0.372 0.317 0.974 0.967 0.740
Observations 422 422 370 422 422 370 Notes: The before- and after-Reconquest periods are defined according to the historical dates, see Figure 4. All estimates weighted by city population. Every regression includes a constant. The controls include: a dummy for whether the city is a hub, a dummy for whether the city has a port, log of urban population, log of per capita GDP and its square, log of length of waterways, and log of Roman roads interacted with per capita GDP and its square. Robust standard errors clustered by city in parentheses. *** p<0.01, ** p<0.05, * p<0.1.
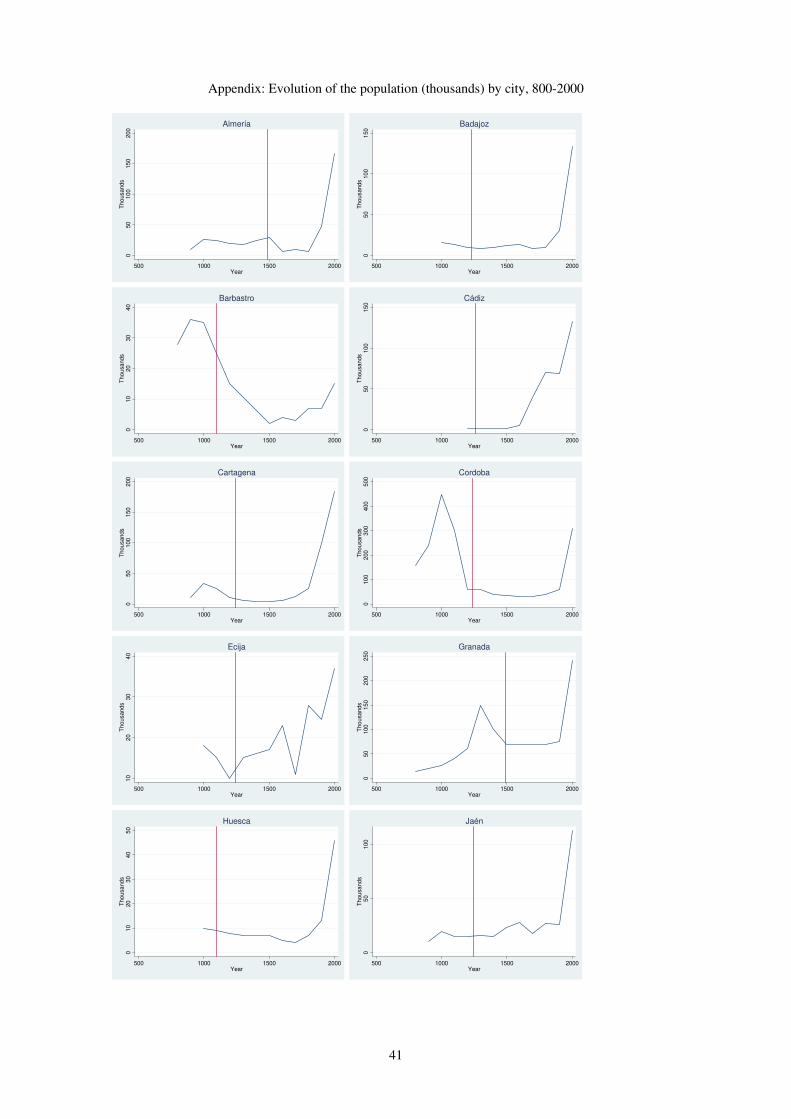
41
Appendix: Evolution of the population (thousands) by city, 800-2000
050
100
150
200
Thousands
500 1000 1500 2000Year
Almería
050
100
150
Thousands
500 1000 1500 2000Year
Badajoz0
10
20
30
40
Thousands
500 1000 1500 2000Year
Barbastro
050
100
150
Thousands
500 1000 1500 2000Year
Cádiz
050
100
150
200
Thousands
500 1000 1500 2000Year
Cartagena
0100
200
300
400
500
Thousands
500 1000 1500 2000Year
Cordoba
10
20
30
40
Thousands
500 1000 1500 2000Year
Ecija
050
100
150
200
250
Thousands
500 1000 1500 2000Year
Granada
010
20
30
40
50
Thousands
500 1000 1500 2000Year
Huesca
050
100
Thousands
500 1000 1500 2000Year
Jaén
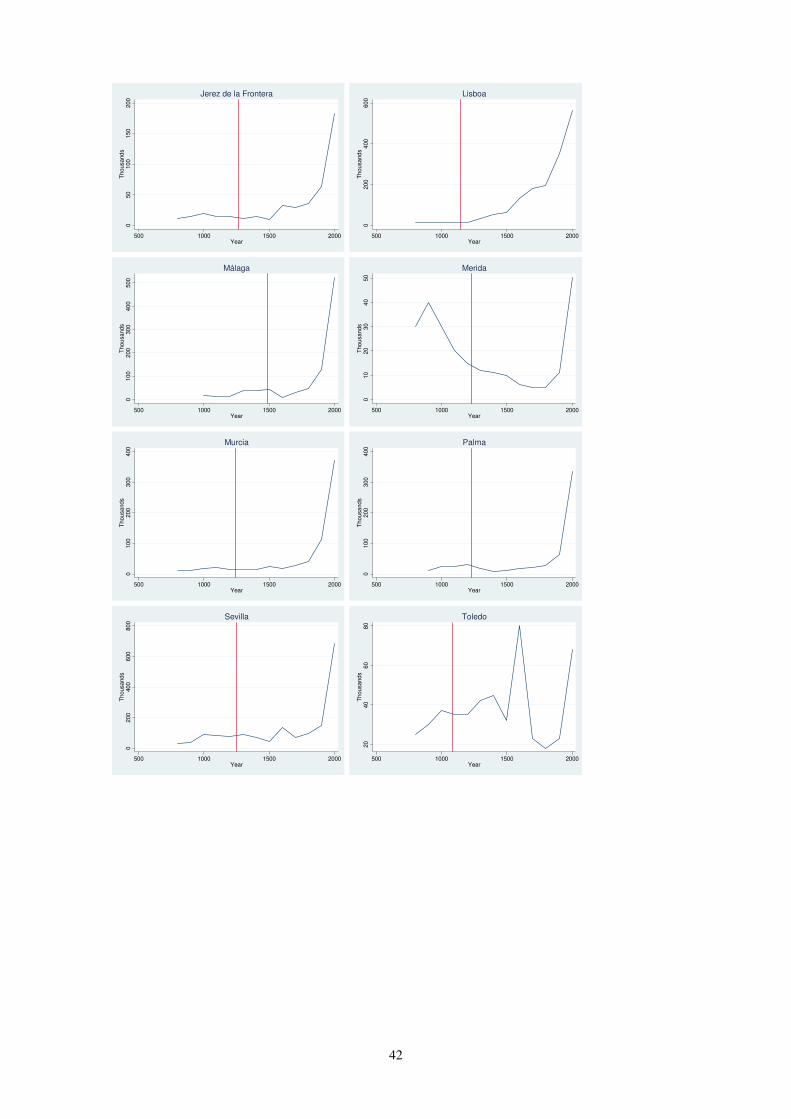
42
050
100
150
200
Thousands
500 1000 1500 2000Year
Jerez de la Frontera
0200
400
600
Thousands
500 1000 1500 2000Year
Lisboa
0100
200
300
400
500
Thousands
500 1000 1500 2000Year
Málaga
010
20
30
40
50
Thousands
500 1000 1500 2000Year
Merida
0100
200
300
400
Thousands
500 1000 1500 2000Year
Murcia
0100
200
300
400
Thousands
500 1000 1500 2000Year
Palma
0200
400
600
800
Thousands
500 1000 1500 2000Year
Sevilla
20
40
60
80
Thousands
500 1000 1500 2000Year
Toledo
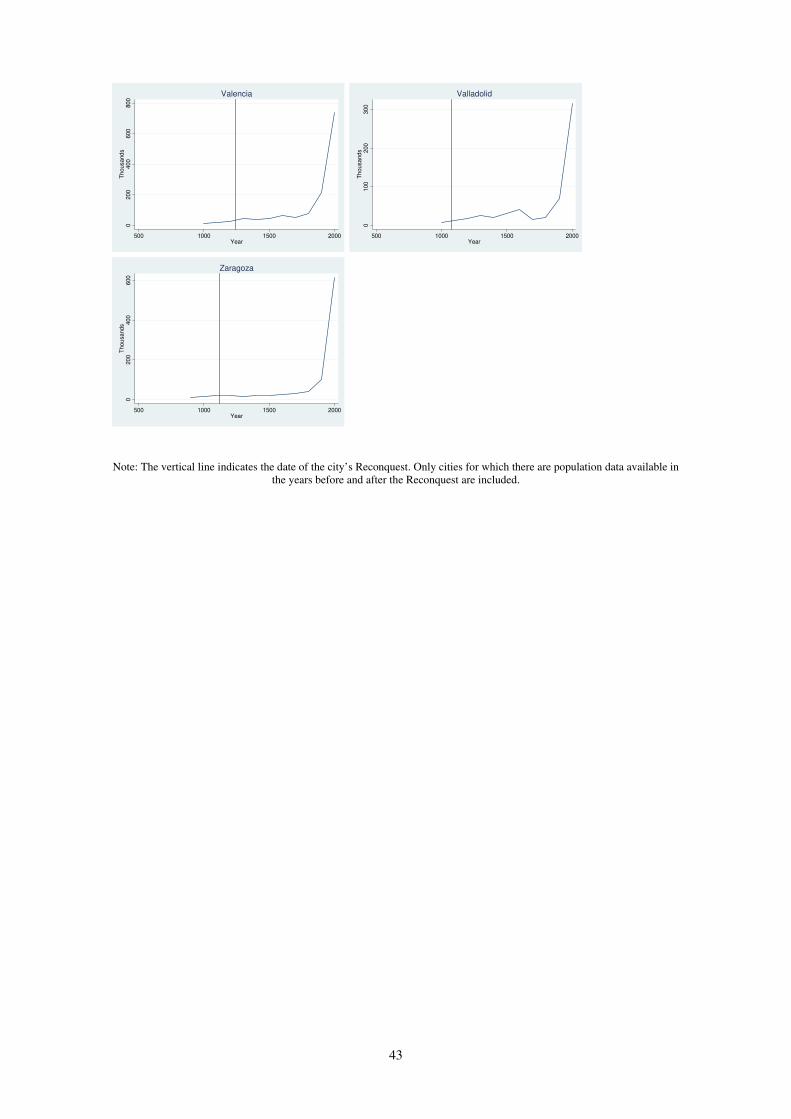
43
0200
400
600
800
Thousands
500 1000 1500 2000Year
Valencia
0100
200
300
Thousands
500 1000 1500 2000Year
Valladolid
0200
400
600
Thousands
500 1000 1500 2000Year
Zaragoza
Note: The vertical line indicates the date of the city’s Reconquest. Only cities for which there are population data available in
the years before and after the Reconquest are included.