Embed Size (px)
Citation preview

By: Mark T. Leyton ([email protected])
The Electrical Load List
IEEE-CED
Houston, Texas
January 26, 2016 (One night only)

Presentation Objectives
2
• Understand why we need electrical Load Lists (ELL).
• Where does the date come from to populate an ELL?
• Why are we stuck with spreadsheets?
• What is the data used for?
• How accurate is the ELL anyway?
Sometimes the objectives that I think are important are not necessarily the same that you think are important. Oops… Lets discuss so I can do better next time.

In the Beginning
3
In the big scheme of things there is a natural progression to every Petro-Chem project. First on the project is always the Process Engineer.
In a greenfield project, the Process Engineer has to create the process from input of basic ingredients, to mix everything together, to finished output. Until the Process Engineer if finished, nothing can happen.
The Process Engineer designs the process with a specific maximum process capacity (MPC) in mind. This means the plant has a nameplate capacity of XX mbd.
Important concept!

Questions.
4
Question #1 Do we ever design a process that can be pushed to a higher capacity than nameplate capacity???
Question #2 Does the end users ever “push” the plant beyond nameplate capacity? I.E. get more throughput than what the nameplate says??? How does he do it?
Question #3 What does it mean to say the plant is running at 95% capacity?

In the Beginning… Cont.
5
The Process Engineer creates the process flow diagrams (PFD’s) and the process and instrumentation diagrams (P&ID’s). The Electrical Engineer has no hand in this work.
Once the PFD’s and P&ID’s are signed off / accepted / approved, does the Electrical Engineer start his work.
Let’s make it clear, in Petro/Chem work, Electrical Engineers follow, they do not lead.
In the big scheme of things, Process Engineers are first, EE’s are second to last, and in last place is the I&C Engineer. This is the Petro/Chem order that will never change.

Our Job.
6
The data to populate an ELL comes from two sources. They are as follows.
1. The P&ID’s
2. Process Support Equipment and ancillary items.

P&ID’s
7
The Process Engineer has selected pumps to do the work of moving product about. The pump selection is based on flow and head. Driving the pump is an electric motor. Hopefully the motor is started DOL as against a VFD starter. Motor starting and control method should be on the P&ID’s.
The size could be in BHP or HP Either way, we handle the data and move on.
BHP = Break Horse Power
HP = Horse Power
The difference being, BHP is the calculated requirements needed to keep the process at maximum process capacity. HP is the size of a standard 460V NEMA frame motor.
Electric Load List.pdf

Process Support Equipment
8
The process support equipment consists of everything electrical to support and keep the facility running. The usual items are as follows. 1. Buildings including the PCR 2. Inst. rack power 3. Lighting, Inst. & Misc. field power panels 4. Heat tracing panels 5. Motor & equipment heaters 6. 120V normal and 480V welding receptacles 7. Gai-Tronics power 8. CCTV power 9. Card readers 10. UPS & DC power 11. Etc.,

Questions
9
Question #4 If the process support equipment list is not on the P&ID’s, where does it come from?
Question #5 What design guide should we use?
Question #6 Is it safe?

Pitfall
10
The pitfall is to do with panels.
It is usual to put on the ELL the xfmr feeding the panel. For example, in the PCR is a lighting panel with a 30KVA xfmr feeding it. So I put 30KVA on the ELL and on I go.
Looking at the wiring diagram all I have is 7 lighting ckts out of a 36 ckt panel. How much of that 30KVA am I actually using???
The same PCR has a 15 KVA xfmr feeding 5 recept ckts out of a 30 ckt panel?
Or five areas of a new facility each assigned 1 X Lighting, 1 X recept & 1 X Misc. panels and xfmrs. All done for conservatism and CYA to order the MCC’s.

ELL Basics
11
One of the few good places to go for ELL fundamental guidance is the Handbook of Electrical Engineers, chapter 1. and
http://www.openelectrical.org/wiki/index.php?title=Load_Schedule
ELL Basics… Cont.
12
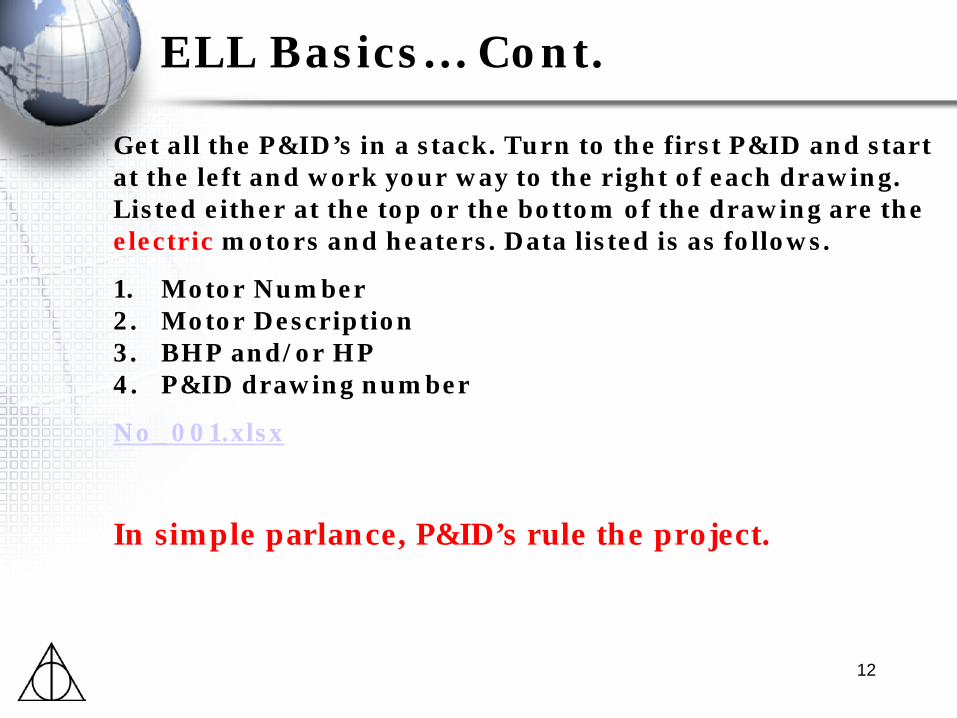
Get all the P&ID’s in a stack. Turn to the first P&ID and start at the left and work your way to the right of each drawing. Listed either at the top or the bottom of the drawing are the electric motors and heaters. Data listed is as follows.
1. Motor Number 2. Motor Description 3. BHP and/or HP 4. P&ID drawing number
No_001.xlsx
In simple parlance, P&ID’s rule the project.

ELL Basics… Cont.
13
The goal is to have some semblance of order in the ELL making it simple and easy to locate equipment items.
1. Keep the equipment in P&ID drawing order
2. Put the equipment in alphanumerical order
3. Put the equipment in MCC then numerical order
4. Put P&ID above process support equipment
5. Put motors then heaters followed by process support equipment
Straight away we are facing the limitations of spreadsheets as against data base (Access, dBase, etc.,) work.
Spreadsheets are so 1980’s. When will we progress on???

ELL Basics… Cont.
14
The customary approach for equipment separations is the following.
1. If an ‘A’ & ‘B’ motor - All ‘A’ motors on ‘A’ MCC/SWGR line-up and all ‘B’ motors on ‘B’ MCC/SWGR line-up.
2. If an ‘A’, ‘B’ & ‘C’ motor - ‘A’ & ‘C’ motors on ‘A’ MCC/SWGR line-up and ‘B’ motors on ‘B’ MCC/SWGR line-up.
3. If an ‘A’, ‘B’, ‘C’ & ‘D’ motor - ‘A’ & ‘C’ motors on ‘A’ MCC/SWGR line-up and ‘B’ & ‘D’ motors on ‘B’ MCC/SWGR line-up.
4. Single loads spread equally between ‘A’ & ‘B’ MCC/SWGR to balance out the overall loads.
Follow company design procedure, if not document it.
Important concept!

Questions… More of Them!
15
Question #7. Who actually sizes the motor based on the P&ID data of process flow and head? Is it the Electrical Engineer? Electrical Designer? Process Engineer? If not this lot then who?
Question #8. When is the preliminary and final data available?
Question #9. Can motor size change between preliminary and final data?

Our Job
16
Our job is to assemble the ELL as quickly as possible since we have to order long lead items such as a fully populated and functioning PCR with associated SWGR, MCC’s, bus duct for the various step-down transformers, relays, etc.,
To do our job we need the data to create an ELL that will feed data into the electrical studies that will ensure we are buying the correctly sized and rated equipment.

Our Job… Cont.
17
Greenfield – Since everything is new we are going to create a new electrical system all the way from power source to the lowest user. That means creating an ELL and doing studies from scratch.
Brownfield – Blending new work into an existing facility is always more challenging. Too often ELL’s and studies are usually old, out of date and highly suspect.
Regardless of location type, we have a job to do. And to do that job we revert to good engineering practices and procedures which include default assumptions based upon sound justifiable judgment.
The key point is, it is documented.

Our Job… Cont.
18
Therefore, the ELL is usually started with default data, default calculations, default assumptions.
The key point is, it is documented.
As the job progresses the data will change as the P&ID’s change. Once the P&ID’s are issued for construction, more than likely, the ELL will not change much until final certified data is received and the ELL is updated along with the studies.
The key point is, it is documented.
This preliminary and final approach falls in line with the preliminary and the final electrical studies.
BHP
19
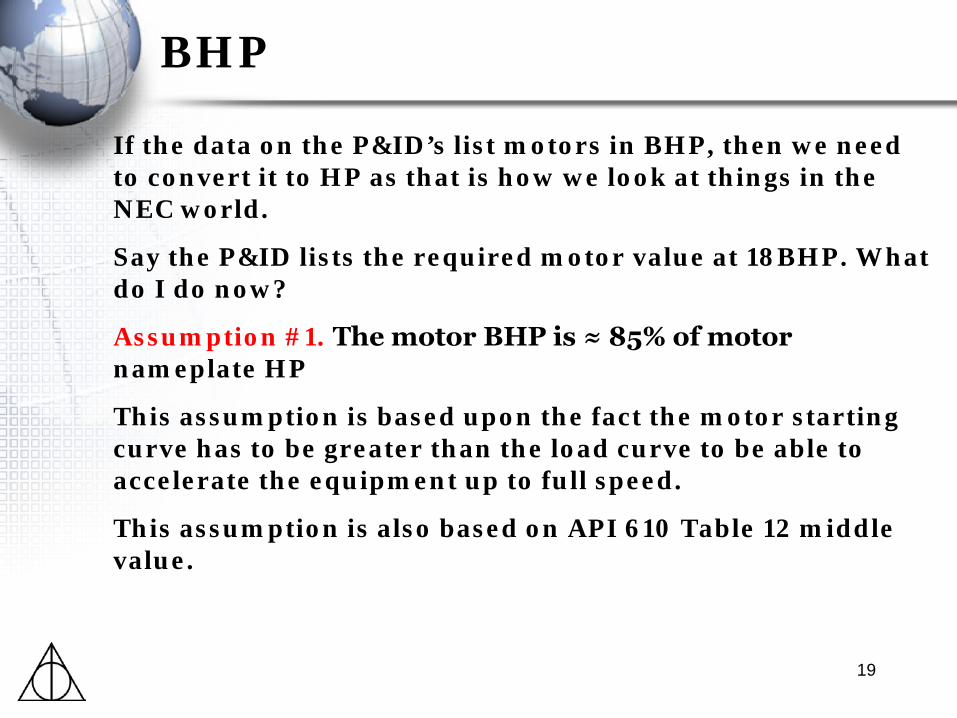
If the data on the P&ID’s list motors in BHP, then we need to convert it to HP as that is how we look at things in the NEC world.
Say the P&ID lists the required motor value at 18BHP. What do I do now?
Assumption #1. The motor BHP is ≈ 85% of motor nameplate HP
This assumption is based upon the fact the motor starting curve has to be greater than the load curve to be able to accelerate the equipment up to full speed.
This assumption is also based on API 610 Table 12 middle value.

HP
20
The rule of thumb is the motor nameplate HP should be about 10 – 15% above process required BHP.
HP
21
The corollary is:-
Assumption #2. The motor nameplate HP is ≈ 115% of BHP
This assumption is based upon the fact the motor starting curve has to be greater than the load curve to be able to accelerate the equipment up to full speed.
This assumption is also based on API 610 Table 12 middle value.
Assumption 1 & 2 are valid since we do not size motors: the pump vendor does. They tell us the correct size after the PO is placed and certified data is received. Until then everything is preliminary and all we are trying to do is get into the ballpark.

BHP
22
Say the P&ID lists the required motor value at 18BHP. What do I do now?
Assumption #2. The motor nameplate HP is ≈ 115% of BHP
Therefore 18BHP X 1.15 = 20.7HP
Our preliminary NEMA frame motor would be 25HP as it is the nearest standard NEMA frame motor above the calculated 20.7 value.
However, I would be willing to bet that there is some vendor out there that could use a 20HP motor to do the job. But I do the 25HP as that is per our design guidelines.

ELL… More Columns
23
Pushing along. I’m taking the equipment data off the P&ID’s in drawing order.
TAG #
load STATUS
DESCRIPTION FLOWSHT type HP/KVA C I S LOAD DIVERS hp/kva VALUE X X X FCTR FCTR
P-421102A ORF FEED PUMP 20-0032-01 HP 40.0 X 0.85 1.00 P-421102B ORF FEED PUMP 20-0032-01 HP 40.0 X 0.85 0.10 P-421103A GF RECYCLE PUMP 20-0032-01 HP 15.0 X 0.85 1.00 P-421103B GF RECYCLE PUMP 20-0032-01 HP 15.0 X 0.85 0.10 P-421104A GF FROTH PUMP 20-0032-01 HP 3 X 0.85 1.00 P-421104B GF FROTH PUMP 20-0032-01 HP 3 X 0.85 0.10
New terms: 1. CIS 2. Load Factor 3. Diversity (yep, I’m dropping the word ‘factor’)
A & B motors

Mode
24
It is customary to classify all electrical loads as either Continuous, Intermittent or Standby mode. This mode classification is purely arbitrary and is not based on any recognized or approved standard. However, continuous and intermittent modes are remarkably similar to the NFPA 70 definitions. But NFPA 70 has nothing remotely close for standby mode. The practice of classifying items as Continuous, Intermittent or Standby has become entrenched in the Petro/Chem world without any clear guidance or understanding.
Continuous Load
25
Continuous loads are usually defined as those that normally operate continuously for long periods of time. Connection Practices If there is an ‘A’, ‘B’ & ‘C’ motor, it is typical to consider the ‘A’ & ‘B’ motors as continuous and the ‘C’ motor as standby. If there is an ‘A’ & ‘B’ motor, it is typical to consider all ‘A’ motors as continuous loads and all ‘B’ motors as standby loads. If there is a single motor or load, after consultation with process, it shall be designated as continuous or intermittent load. Single motors or loads cannot be in standby mode.

Intermittent Load
26
Intermittent loads are usually defined as those loads that normally operate a fraction of a 24 hour period. The exact period of time is usually not defined or noted. Don’t get mixed up with Intermittent duty motors.
In the Petro/Chem world we always go with continuous duty motors for all motor operations.

Standby Load
27
Standby loads are usually defined as those loads that are off but ready to run. The most common standby use being illustrated as follows. If there is an ‘A’ & ‘B’ motor, it is typical to consider all ‘A’ motors as continuous loads and all ‘B’ motors as standby loads. Operation Practices Under normal circumstances, the only time an ‘A’ & ‘B’ motor would run at the same time is during transition from using the ‘A’ pump to using the ‘B’ pump: as in the following example. ‘A’ pump is running; turn on ‘B’ pump resulting in ‘A’ & ‘B’ pump running at the same time; then shutting down the ‘A’ pump leaving only the ‘B’ pump running. The time period that ‘A’ & ‘B’ pumps are running at the same time is usually of a very short duration.
Load Factor (LF)
28
IEEE Std 141-1993 (Red Book) Clause 2.4.1.3.6 says “Load Factor: The ratio of the average load over a designated period of time to the peak load occurring in that period. Note that although not part of the official definition, the term load factor is used by some utilities and others to describe the equivalent number of hours per period of the peak or average demand must prevail in order to produce the total energy consumption for the period.” In the Petro/Chem world the LF definition is modified/changed to read as follows. The ratio of the process BHP value to the motor HP nameplate value. For other loads the load factor is assumed to be 100%. NOTE: This document uses the “unofficial” Petro/Chem version of load factor (LF).

Load Factor (LF)… Cont.
29
Say the P&ID lists the required motor value of 18BHP to achieve maximum process capacity, and our calculation says the provided motor will be 25HP, then the following applies.
Load Factor (LF) = (18/25) = 0.72
This LF value shall continue to be used until final certified data is provided. But by then the electrical equipment is bought, installed and close to full operation.
Load Factor (LF)… Cont.
30
Say the P&ID lists the motor as 25HP to achieve maximum process capacity . Then we assume the Load factor (LF) is 0.85. Which means we are assuming the motor to be operating at 21.25BHP.
Our default approach is to use a load factor (LF) of 0.85. This goes back to Assumption 1 & 2 previously stated.
Therefore, having the BHP can make a difference to the calculations.

Diversity (D)
31
IEEE Std 141-1993 (Red Book) Clause 2.4.1.3.5 says “Diversity Factor: The ratio of the sum of the individual non-coincident maximum demands of various subdivisions of the system to the maximum demand of the complete system. The diversity factor is always 1 or greater. The (unofficial) term diversity, as distinguished from diversity factor refers to the percent time available that a machine, piece of equipment, or facility has its maximum or normal load or demand (i.e. a 70% diversity means that the device in question operates at its nominal or maximum load level 70% of the time that it is connected and turned on).” NOTE: This document uses the “unofficial” term and definition of diversity (D)
Diversity (D)… Cont.
32
At the moment there is no technical agreement as to the value of D, or to its application across Continuous, Intermittent and Standby loads, or to the values used during Feasibility (FEP-1), Concept (FEP-2) and Detailed Scope (FEP-3).
The problem is the EPC company is trying to get long lead electrical equipment on order based on preliminary and best guess data. If the EPC company selects high D values, they will be safe and conservative. But more than likely incurring higher CAPEX and ongoing OPEX costs. Both not good for the client. So, what do you do??? Ask the client or make it up and document it.

Diversity (D)… Cont.
33
Continuous Mode - Diversity (DC) Continuous loads have a pretty clear definition as it has to do with loads that are continuously running. Therefore, continuous loads are assigned a diversity of 100% as follows. DC = 1.00

Diversity (D)… Cont.
34
Intermittent Mode - Diversity (DI) Intermittent loads are a challenge. The two referenced documents use a intermittent diversity of 50%. 1. So, where does 50% come from? 2. What is the underlying justification? 3. Or, what operating mode at the plant would have all
intermittent loads at 50%? 4. Are we doing a copy without thinking? 5. Or, is it all about conservatism and CYA? I’m thinking this way…
Diversity (D)… Cont.
35
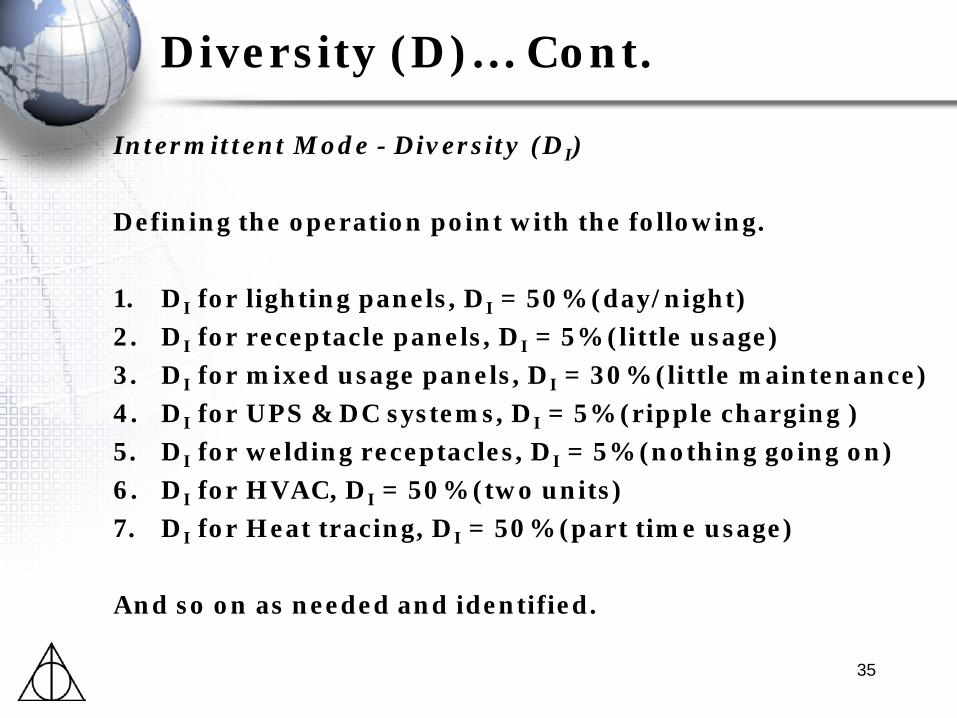
Intermittent Mode - Diversity (DI) Defining the operation point with the following. 1. DI for lighting panels, DI = 50% (day/night) 2. DI for receptacle panels, DI = 5% (little usage) 3. DI for mixed usage panels, DI = 30% (little maintenance) 4. DI for UPS & DC systems, DI = 5% (ripple charging ) 5. DI for welding receptacles, DI = 5% (nothing going on) 6. DI for HVAC, DI = 50% (two units) 7. DI for Heat tracing, DI = 50% (part time usage) And so on as needed and identified.
Diversity (D)… Cont.
36
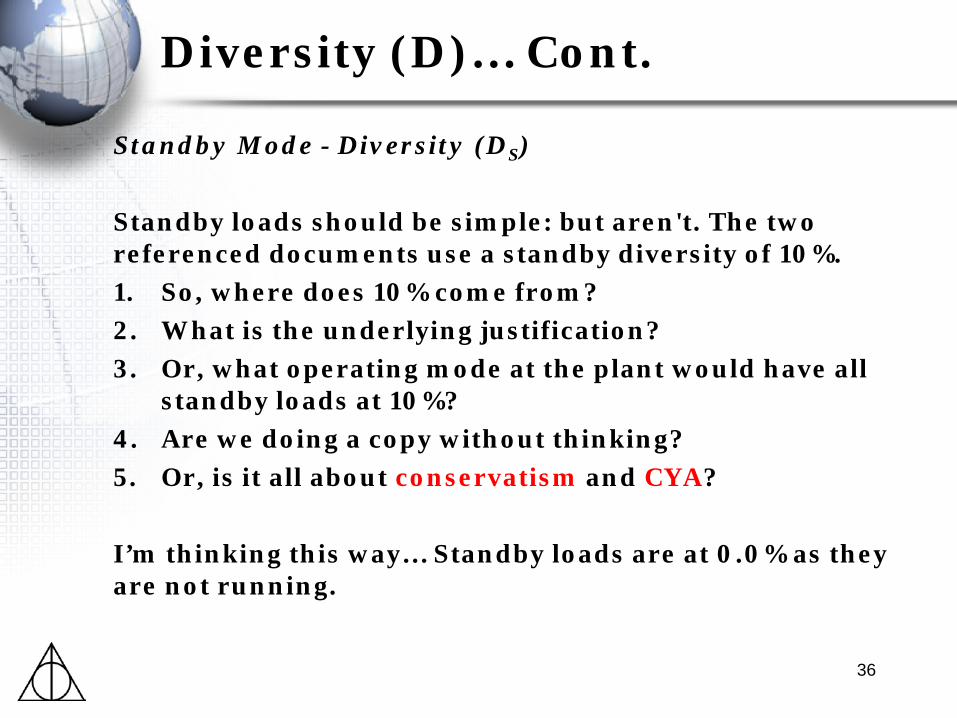
Standby Mode - Diversity (DS) Standby loads should be simple: but aren't. The two referenced documents use a standby diversity of 10%. 1. So, where does 10% come from? 2. What is the underlying justification? 3. Or, what operating mode at the plant would have all
standby loads at 10%? 4. Are we doing a copy without thinking? 5. Or, is it all about conservatism and CYA? I’m thinking this way… Standby loads are at 0.0% as they are not running.
Load Criticality
37
You will notice that I am avoiding the topic of Load Criticality which are normally considered to be as follows.
1. Normal Loads
2. Essential Loads
3. Critical Loads

Stepping Back a Moment
38
Let’s step back a moment. What are we trying to do?
1. We are trying to size electrical equipment to provide a safe operating environment for the personnel using the equipment.
2. And provide a cost effective solution to the problem at hand.

Load Formulas (MNRL) #1
39

Load Formulas (MNRL) #2
40
More conservatism, more CYA, more cost.

Load Formulas (MD)
41

Load Formulas (CD)
42
Motor Data
43
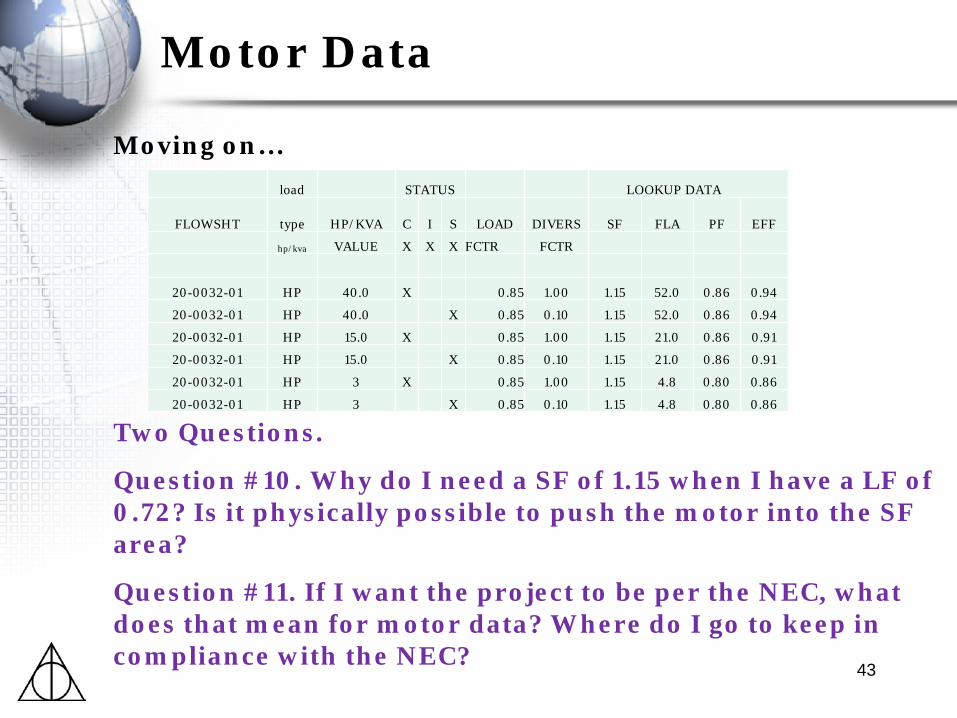
Moving on…
Two Questions.
Question #10. Why do I need a SF of 1.15 when I have a LF of 0.72? Is it physically possible to push the motor into the SF area?
Question #11. If I want the project to be per the NEC, what does that mean for motor data? Where do I go to keep in compliance with the NEC?
load STATUS LOOKUP DATA
FLOWSHT type HP/KVA C I S LOAD DIVERS SF FLA PF EFF hp/kva VALUE X X X FCTR FCTR
20-0032-01 HP 40.0 X 0.85 1.00 1.15 52.0 0.86 0.94
20-0032-01 HP 40.0 X 0.85 0.10 1.15 52.0 0.86 0.94
20-0032-01 HP 15.0 X 0.85 1.00 1.15 21.0 0.86 0.91
20-0032-01 HP 15.0 X 0.85 0.10 1.15 21.0 0.86 0.91
20-0032-01 HP 3 X 0.85 1.00 1.15 4.8 0.80 0.86
20-0032-01 HP 3 X 0.85 0.10 1.15 4.8 0.80 0.86

Motor Data… Cont.
44
The following is per the 2014 NEC. Note, no Eff or PF.
460V MOTOR FLA FROM NEC TABLE 430-250 VOLTAGE HP FLA
460 1/2 1.1
460 3/4 1.6
460 1 2.1
460 1 1/2 3.0
460 2 3.4
460 3 4.8
460 5 7.6
460 7 1/2 11.0
460 10 14.0
460 15 21.0
460 20 27.0
460 25 34.0
460 30 40.0
460 40 52.0
460 50 65.0
460 60 77.0
460 75 96.0
460 100 124.0
460 125 156.0
460 150 180.0
460 200 240.0
Electrical Design Criteria says to comply with NEC. But is this really what I shall be buying? If my standard is to get API 841 motors, what values do I use? And how close are they to the NEC?
Motor Data… Cont.
45
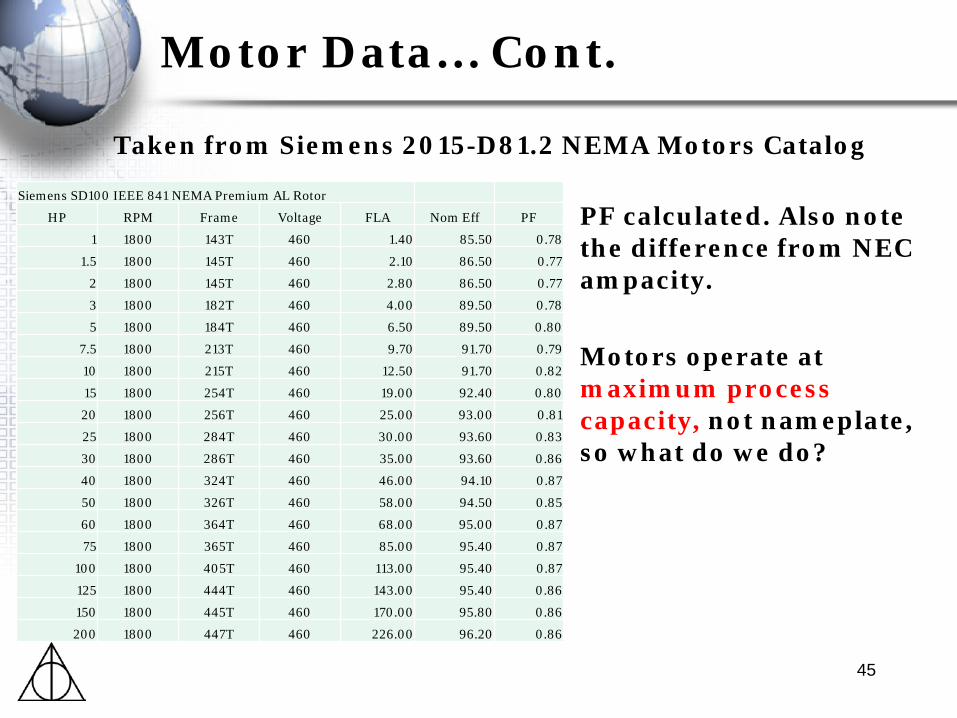
Taken from Siemens 2015-D81.2 NEMA Motors Catalog
Siemens SD100 IEEE 841 NEMA Premium AL Rotor HP RPM Frame Voltage FLA Nom Eff PF
1 1800 143T 460 1.40 85.50 0.78 1.5 1800 145T 460 2.10 86.50 0.77
2 1800 145T 460 2.80 86.50 0.77 3 1800 182T 460 4.00 89.50 0.78 5 1800 184T 460 6.50 89.50 0.80
7.5 1800 213T 460 9.70 91.70 0.79 10 1800 215T 460 12.50 91.70 0.82 15 1800 254T 460 19.00 92.40 0.80 20 1800 256T 460 25.00 93.00 0.81 25 1800 284T 460 30.00 93.60 0.83 30 1800 286T 460 35.00 93.60 0.86 40 1800 324T 460 46.00 94.10 0.87 50 1800 326T 460 58.00 94.50 0.85 60 1800 364T 460 68.00 95.00 0.87 75 1800 365T 460 85.00 95.40 0.87
100 1800 405T 460 113.00 95.40 0.87 125 1800 444T 460 143.00 95.40 0.86 150 1800 445T 460 170.00 95.80 0.86 200 1800 447T 460 226.00 96.20 0.86
PF calculated. Also note the difference from NEC ampacity. Motors operate at maximum process capacity, not nameplate, so what do we do?

Motor Data… Cont.
46
Linear Interpolation… If the two known points are given by the coordinates and , the linear interpolant is the straight line between these points. For a value x in the interval , the value y along the straight line is given from the equation
The key point being along the straight line. If the line is not straight, then this formula is of no use. Some people use linear interpolation when calculating motor power factor and efficiency at maximum process capacity. Since the power factor and efficiency curve are not straight, then a degree of error is introduced.

Motor Data… Cont.
47
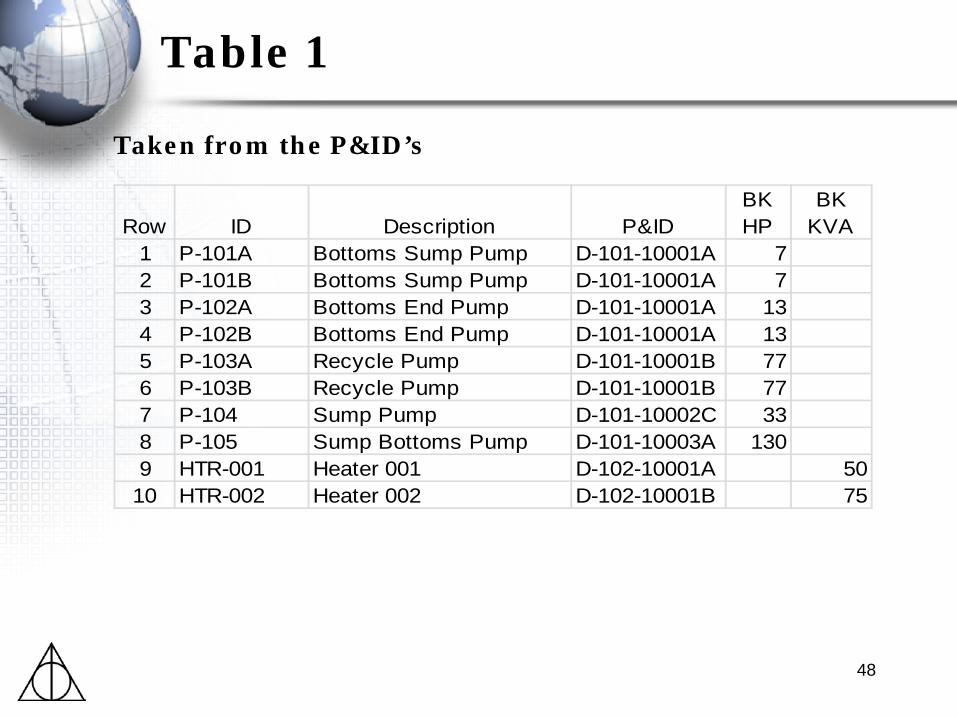
Table 1
48
Taken from the P&ID’s
Row ID Description P&IDBK HP
BK KVA
1 P-101A Bottoms Sump Pump D-101-10001A 72 P-101B Bottoms Sump Pump D-101-10001A 73 P-102A Bottoms End Pump D-101-10001A 134 P-102B Bottoms End Pump D-101-10001A 135 P-103A Recycle Pump D-101-10001B 776 P-103B Recycle Pump D-101-10001B 777 P-104 Sump Pump D-101-10002C 338 P-105 Sump Bottoms Pump D-101-10003A 1309 HTR-001 Heater 001 D-102-10001A 50
10 HTR-002 Heater 002 D-102-10001B 75

Table 2
49
Add in Non-P&ID data
Row ID Description P&IDBK HP
BK KVA KVA
1 P-101A Bottoms Sump Pump D-101-10001A 72 P-101B Bottoms Sump Pump D-101-10001A 73 P-102A Bottoms End Pump D-101-10001A 134 P-102B Bottoms End Pump D-101-10001A 135 P-103A Recycle Pump D-101-10001B 776 P-103B Recycle Pump D-101-10001B 777 P-104 Sump Pump D-101-10002C 338 P-105 Sump Bottoms Pump D-101-10003A 1309 HTR-001 Heater 001 D-102-10001A 50
10 HTR-002 Heater 002 D-102-10001B 7511 LP-001 Lighting Panel 5012 LP-002 Lighting Panel 5013 UPS-001 Inst UPS 4514 DC-001 DC Power 3015 FDR-001A Control Building Power 50016 FDR-001B Control Building Power 50017 LP-003 Lighting Panel 2018 LP-004 Lighting Panel 2019 HVAC-001 HVAC Unit #1 10020 HVAC-002 HVAC Unit #2 100
Table 2… Cont.
50
For non-process loads it is customary to use the transformer size associated with the load.
Again, this customary method can result in a large electrical load associated with panels. This load will not be known until the design is done and the panel loads are summated.
This summation usually occurs long after the equipment PO is placed resulting in oversized electrical equipment.

Linear Interpolation
51
See the difference between eyeballing and calculated linear interpolation.
BK PF PF PF PF PF Eff Eff Eff Eff Eff GuarHP HP RPM 50% 60% 75% 80% 100% 50% 60% 75% 80% 100% Min
7 10 1755 63.80 68.76 76.20 78.40 81.70 91.70 91.90 92.20 92.40 91.70 90.2013 20 1770 65.30 69.54 75.90 77.74 80.50 93.10 93.22 93.40 93.56 93.00 91.7033 40 1780 75.00 78.20 83.00 84.20 86.00 94.30 94.38 94.10 94.10 94.10 93.6077 100 1780 80.00 82.40 86.00 86.40 87.00 95.80 95.88 96.00 96.24 95.40 95.00
130 200 1785 76.00 79.20 84.00 84.80 86.00 96.20 96.32 96.50 96.62 96.20 95.80
BK HP HP RPM
PF 50%
PF 60%
PF 75%
PF 80%
PF 100%
Eff 50%
Eff 60%
Eff 75%
Eff 80%
Eff 100%
Guar Min
7 10 1755 63.80 67.00 76.20 78.00 81.70 91.70 91.95 92.20 91.95 91.70 90.2013 20 1770 65.30 69.00 75.90 76.50 80.50 93.10 93.25 93.40 93.25 93.00 91.7033 40 1780 75.00 78.00 83.00 83.50 86.00 94.30 94.18 94.10 94.10 94.10 93.6077 100 1780 80.00 82.50 86.00 86.40 87.00 95.80 95.95 96.00 95.70 95.40 95.00
130 200 1785 76.00 78.50 84.00 84.80 86.00 96.20 96.35 96.50 96.37 96.20 95.80
Eyeballing
Linear Interpolation

Non-Rotating Loads
52
For non-rotating loads we are assuming Eff = 100% and the PF is assumed to be 85%. The assumed 85% PF could be too low as it is easy to find PF references as follows. Incandescent lamps & heaters ------------ 1.0 Fluorescent & Merc. Vapor lamps ------ 0.5 - 0.95 Therefore it might be more accurate to use a PF of 90% or higher depending on the number and size of lights and heaters.

ELL… Cont.
53
Adding in more data to the load list.
Row ID Description P&ID Voltage BK HP KVA HP MODE D LF PF EFF 1 P-101A Bottoms Sump Pump D-101-10001A 460 7 10 C 100% 70.00% 76.20% 92.20% 2 P-101B Bottoms Sump Pump D-101-10001A 460 7 10 S 0% 70.00% 76.20% 92.20% 3 P-102A Bottoms End Pump D-101-10001A 460 13 20 C 100% 65.00% 79.22% 92.75% 4 P-102B Bottoms End Pump D-101-10001A 460 13 20 S 0% 65.00% 76.22% 92.75% 5 P-103A Recycle Pump D-101-10001B 460 77 100 C 100% 77.00% 86.40% 95.78% 6 P-103B Recycle Pump D-101-10001B 460 77 100 S 0% 77.00% 86.40% 95.78% 7 P-104 Sump Pump D-101-10002C 460 33 50 I 10% 66.00% 85.22% 93.08% 8 P-105 Sump Bottoms Pump D-101-10003A 460 130 200 I 15% 65.00% 88.10% 96.76% 9 HTR-001 Heater 001 D-102-10001A 480 50 I 20% 100% 85% 100% 10 HTR-002 Heater 002 D-102-10001B 480 75 I 25% 100% 85% 100% 11 LP-001 Lighting Panel 480 50 I 50% 100% 85% 100% 12 LP-002 Lighting Panel 480 50 I 50% 100% 85% 100% 13 UPS-001 Inst UPS 480 45 C 3% 100% 85% 100% 14 DC-001 DC Power 480 30 C 3% 100% 85% 100% 15 FDR-001A Control Building Power 480 400 I 40% 100% 85% 100% 16 FDR-001B Control Building Power 480 400 I 40% 100% 85% 100% 17 LP-003 Lighting Panel 480 20 I 100% 100% 85% 100% 18 LP-004 Lighting Panel 480 20 I 100% 100% 85% 100% 19 HVAC-001 HVAC Unit #1 480 100 I 75% 100% 85% 100% 20 HVAC-002 HVAC Unit #2 480 100 I 75% 100% 85% 100%

480V MCC’s
54
480V MCC’s, bus duct/or feeder cables are sized by following NEC 430:24 Several Motors or a Motor(s) and Other Load(s) for the feeder conductors. That also dictates the 480V step-down xfmr. It better be able to provide for the load. 480V MCC’s come in standard sizes (depending on vendor). 600A ,800A, 1200A, 1600A, 2000A, 2500A, 3200A, & 4000A On a greenfield project I would go up to 80% of ampacity rating. Brownfield is up to 90% of ampacity rating. Also depends on available physical space.

480V MCC’s… Cont.
55
So, what is your design criteria? What value are you going to use to size the 480V MCC? Below are two possible options. What does your design criteria document say? Note: Totally Connected Load (TCL) is not part of this calculation.

480V SWGR
56
Say I have four 480V MCC’s, each with a MD of 880A. The EPC people say go with 1200A MCC’s, I selected 1600A because that is standard at the facility. The EPC says the standard approach is to use 480V swgr in a M-T-M configuration to power the MCC’s. The EPC people put 2 X MCC’s on side ‘A’ and 2 X MCC’s on side ‘B’ of the 480V swgr. The goal is to continue balancing out the loads. Now, how to size the swgr bus?
a. Bus = 4 * 1600A = 6,400A - do they make this??? b. Bus = 4 * 1200A = 4,800A - go with 5,000A bus c. Bus = 4 * 880A = 3,520A - 3,600A is close so go with 4,000A bus

The End.
57
Thank you for your attention and
are there any questions?