Embed Size (px)
Citation preview
ARAB REPUBLIC OF EGYPT
EGYPT AND THE GLOBAL ECONOMIC CRISIS: A PRELIMINARY
ASSESSMENT OF MACROECONOMIC IMPACT AND RESPONSE
(In Two Volumes) Volume I: Main Report June 16, 2009
Document of the World Bank
Social and Economic Development Group Middle East and North Africa Region The World Bank
Currency Equivalents
(Exchange Rate as of June 16, 2009)
Currency Unit
LE 1
US$ 1
=
=
=
Egyptian Pound (LE)
0.1779
5.6224
Fiscal Year
July 1- June 30
VICE PRESIDENT: DANIELA GRESSANI
COUNTRY DIRECTOR: EMMANUEL MBI
SECTOR DIRECTOR: RITVA REINIKKA
SECTOR MANAGER: FARRUKH IQBAL
TASK TEAM LEADER: SANTIAGO HERRERA
CO-TASK MANAGER: SHERINE AL-SHAWARBY
ACKNOWLEDGMENTS This Note was prepared by Santiago Herrera (Lead Economist, MNSED) and Sherine Al-
Shawarby (Senior Economist, MNSED). The background material presented in Volume II was
prepared by a team of external consultants and Bank staff : Francesco Giavazzi (Consultant,
Bocconi University and MIT); Carlo Favero (Consultant, Bocconi University); Alessandro
Missale (Consultant, University of Milan); Edgardo Favaro (Lead Economist, PRMED); Andrew
Stone (Lead Private Sector Development Specialist, MNSED); Hoda Selim (Research Analyst,
MNSED);Leonardo Garrido (Consultant, PRMED); Tihomir Stucka (Consultant, PRMED); and
Maria Foumelis (Consultant, MNSED). The team also benefited from comments by Marcelo
Giugale (Sector Director, LCSPR); Farrukh Iqbal (Sector Manager, MNSED); Norman Loayza
(Lead Economist, DECRG); Lars Jessen (Lead Financial Officer/Sovereign Debt, BDM); and
Kevin Carey (Senior Country Economist, MNSED).
The team benefited from discussions and insights provided by H.E. Dr Youssef B. Ghali
(Minister of Finance) and H.E. Dr Mahmoud Mohieldin (Minister of Investment) throughout the
preparation of the report. Technical teams from the government and the Central Bank of Egypt
(CBE) also provided valuable comments: Mr. Hany Dimian, (Advisor to the Minister of Finance);
Ms. Amina Ghanem (Deputy Minister of Finance); Ms. Rania El_Mashat (Assistant Sub-
Governor, Monetary Policy Unit); Dr. Tarek Moursi, (Professor of Economics at Cairo
University, and Consultant at the IDSC); Dr. Mohamed Fathi Sakr (Professor at Cairo University,
and Advisor to the Minister of Economic Development); Dr. Ezzat El Sadek (Board Member and
Director, Suez Canal Authority); Dr. Adla Ragab( Advisor to Minister of Tourism); Dr. Aly
Awni, (Head of QIZ Section, Ministry of Trade and Industry); Mr.Ahmed Rostom (Senior
Economist, Minister of Investment); and Ms. Ghada Waheed (Economist, Ministry of
Investment); as well as officials at the Ministry of Petroleum. Egyptian academics and research
centers were generous with their time and insights. In particular, Dr. Hanaa Kheir-El-Din
(Professor at Cairo University, and Executive Director, Egyptian Center for Economic Studies)
and Dr. Ahmed Galal, Managing Director, Economics Research Forum).
Finally, the team is grateful to Emmanuel Mbi, World Bank Country Director (Egypt, Yemen,
and Djibouti) for his continued guidance and support. The background technical work was
partially funded by the Egypt Dutch Public Expenditure Review Trust Fund.
TABLE OF CONTENTS
EXECUTIVE SUMMARY ............................................................................................................................... 1
I- THE IMPACT OF THE CRISIS ON GDP AND EMPLOYMENT ................................................................. 3
II. STABILIZATION PACKAGE ADOPTED BY THE GOVERNMENT ........................................................... 8
A. The impact of the fiscal stimulus package on GDP ................................................................ 8
B. The sustainability of the fiscal scenario .................................................................................. 9
C. Other stabilization policies ................................................................................................... 12
III. POLICY RECOMMENDATIONS ........................................................................................................... 13
A. Immediate and short-term measures: .................................................................................... 13
1. To increase productivity and stabilize growth: ............................................................ 13
2. To protect work conditions of employment and avoid increases in unemployment: ... 14
B. Medium-term ........................................................................................................................ 15
FIGURES
Figure 1: Correlation between Egypt and OECD growth………………………………………….1
Figure 2: Changes in Egyptian Growth and NBER dating of US Recessions ................................. 3
Figure 3: Trend of the Marginal Productivity of Capital in Egypt (1975-2008) ............................. 6
Figure 4: Difference in Public Debt Accumulation under Plans that Target the Overall Deficit, but
have Mildly Different Inflation Rates .................................................................................. 10
EXECUTIVE SUMMARY
The global economic slowdown that began in 2008 has reversed the favorable international
environment that supported Egyptian growth during the last three years. The friendly
international environment (i.e. favorable terms of trade, rapid growth of external demand and
abundant international liquidity), together with domestic economic reforms and prudent macro
management, helped Egypt’s economy grow at a yearly average of 7 percent during FY06- FY08.
The ongoing global downturn is bound to have an adverse impact on Egypt’s growth during
FY09-10, though its scope will be determined by its duration and by Egypt’s policy responses.
The objective of this note is to provide a preliminary assessment of the impact of the crisis on
Egypt and of the policy response to it. It is based on three technical background documents. The
first one quantifies the overall impact using sector and long term growth data.1 The second one
analyzes the short term fiscal, monetary and exchange rate policy choices that Egypt faces.2 The
third piece reports on the results of a survey of 200 Egyptian firms probing their sales,
employment, capacity utilization, and investment in recent months.3 The present note provides an
integrative synthesis of the background work.
Regarding the impact of the crisis, our main findings are:
1) There exists a high correlation between the rates of economic growth in Egypt and the OECD
countries; this correlation tends to be even higher during global recessions. Indeed, the sharpest
falls in Egyptian growth tend to occur following US recessions. Based on these correlations, we
expect economic growth to be just above 4 percent during FY 2009 and around the same level, or
marginally lower, in FY 2010.
2) The survey of private firms reveals a fall in output but not a corresponding reduction, so far, in
labor or capital utilization. Hence, the initial impact of the decrease in demand is showing up as a
decrease in labor and capital productivity. Real production costs per unit of output have
increased.
3) Our analysis of the employment elasticity of growth suggests that unemployment will rise to
about 10 percent during 2009-10.
4) Public debt sustainability exercises are very sensitive to nominal GDP growth assumptions,
and, in the near term, the factors that led to the rapid fall in public debt in the past few years are
not likely to operate.
5) The main constraint to Egypt’s growth in the short run is more likely to arise from the balance
of payments.
6) Factor productivity falls during periods of unsustainable policies (excessive public spending,
public deficits relying on inflation tax financing, overvalued currencies and large current account
deficits) while it tends to increase in periods of economic reform that lead to higher private
investment.
1 See Annex 1 for this background paper. It is referred to in this note as the PREMED paper.
2 See Annex 2 for this paper, prepared by external consultants Favero, Giavazzi and Missale, and referred
to in this note as the FGM paper. 3 See Annex 3 for a note on the private sector survey prepared by Andrew Stone.
2
Regarding the initial policy response, the main findings are as follows:
1) The government adopted a fiscal stimulus package of additional spending equivalent to 1.3
percent of GDP. This is not likely to offset the full impact of the decline in aggregate demand.
Our analysis suggests that an increase of between 2 to 4 points in the public investment rate is
needed to lift growth by 1 point.
2) However, the initial response has been prudent given that Egypt already has a high public debt
ratio of around 60 percent of GDP. A much higher level of stimulus would risk macroeconomic
instability and the gains achieved so far in creating a friendly environment for private sector
investment. As long as the stimulus is temporary, the fiscal situation will be sustainable.
3) Other non-spending measures, such as the freezing of the energy prices adjustment program,
are the right short-term intervention giving firms some room to accommodate the rise in the costs
of production originated by factor rigidity upon the demand shock. However, over time, this
policy needs revision to ensure long-run sustainability and development of labor-intensive
industries rather than energy or capital-intensive activities
Going forward, we suggest the policy package aims at enhancing both labor productivity and
fiscal sustainability in the medium term, which will be supportive of sustainable growth. In
particular, we suggest:
a) Gearing additional spending towards activities that increase labor productivity or facilitate job
creation. Appropriate programs could include measures to reduce transportation and congestion
costs.
b) Adopting a medium-term fiscal framework that ensures public sector solvency. Such a
framework could include a plan that targets a public debt level in the medium term and uses the
primary balance instead of the overall balance as the policy tool. In countries with high and
volatile inflation, such as Egypt, targeting the overall balance is not a guarantee of debt
stabilization. The medium-term fiscal framework should include a public debt management
strategy.
c) Managing public debt within a comprehensive strategy that incorporates the changing external
situation of the country. Besides extending maturities, public debt management could benefit
from rebalancing external and domestic sources of funding, given the existing medium-term
balance of payments projections.
d) Allowing the exchange rate to absorb more of the external shock. This will support export
diversification and allow wages, measured in terms of tradable goods, to remain flexible. At
present, the exchange rate has fluctuated very little, at the expense of a significant decline in the
international liquidity of the CBE.
e) Extending credit and non financial services to SME to facilitate job creation in firms that
absorb almost 40 percent of the total employment, but have little flexibility to adjust given there
limited access to finance. Our survey shows that small firms have reduced sales more than large
ones and have not been able to smooth a shock that may be perceived as transitory. Access of
non-financial services that lead to enhanced productivity is also critical for the small and micro
enterprises.
f) Undertaking further reforms that improve the investment climate and are supportive of real
cost reduction at the enterprise level. For instance, promoting free trade in services with the EU
would reduce transport costs for exports to the EU by 10 percent and import costs by 15 percent.
Such trade agreements would also attract foreign direct investment.
3
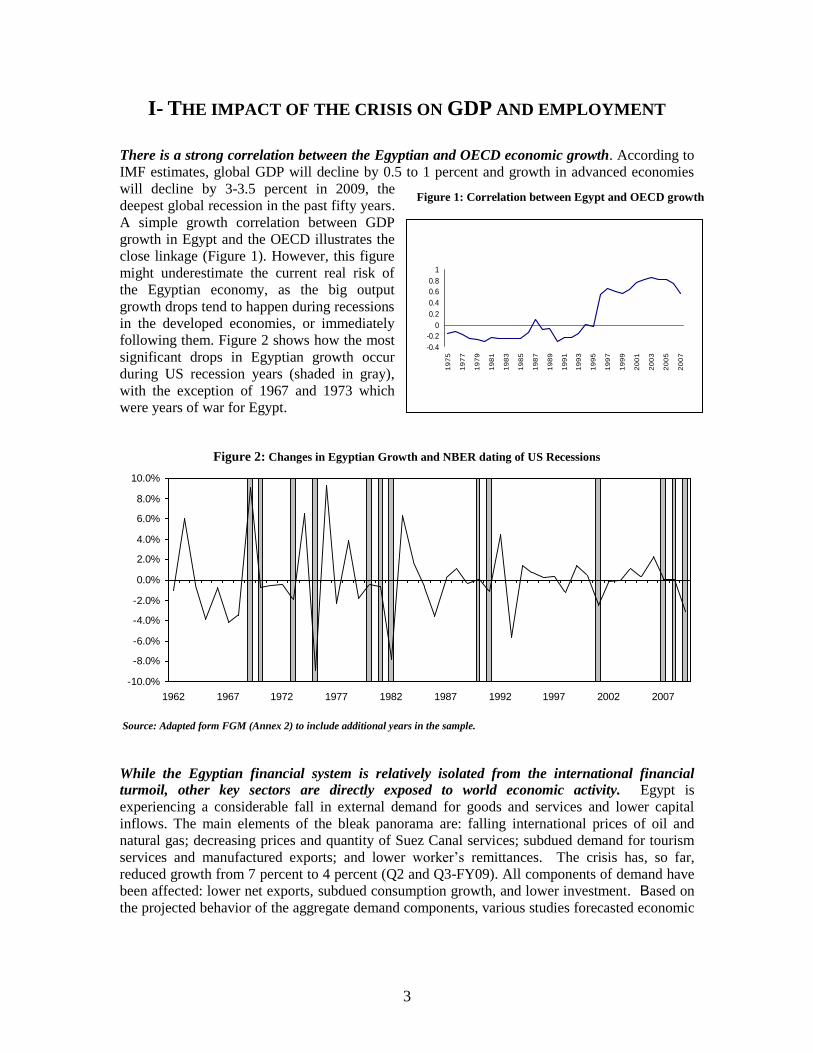
I- THE IMPACT OF THE CRISIS ON GDP AND EMPLOYMENT
There is a strong correlation between the Egyptian and OECD economic growth. According to
IMF estimates, global GDP will decline by 0.5 to 1 percent and growth in advanced economies
will decline by 3-3.5 percent in 2009, the
deepest global recession in the past fifty years.
A simple growth correlation between GDP
growth in Egypt and the OECD illustrates the
close linkage (Figure 1). However, this figure
might underestimate the current real risk of
the Egyptian economy, as the big output
growth drops tend to happen during recessions
in the developed economies, or immediately
following them. Figure 2 shows how the most
significant drops in Egyptian growth occur
during US recession years (shaded in gray),
with the exception of 1967 and 1973 which
were years of war for Egypt.
Figure 2: Changes in Egyptian Growth and NBER dating of US Recessions
-10.0%
-8.0%
-6.0%
-4.0%
-2.0%
0.0%
2.0%
4.0%
6.0%
8.0%
10.0%
1962 1967 1972 1977 1982 1987 1992 1997 2002 2007
Source: Adapted form FGM (Annex 2) to include additional years in the sample.
While the Egyptian financial system is relatively isolated from the international financial
turmoil, other key sectors are directly exposed to world economic activity. Egypt is
experiencing a considerable fall in external demand for goods and services and lower capital
inflows. The main elements of the bleak panorama are: falling international prices of oil and
natural gas; decreasing prices and quantity of Suez Canal services; subdued demand for tourism
services and manufactured exports; and lower worker’s remittances. The crisis has, so far,
reduced growth from 7 percent to 4 percent (Q2 and Q3-FY09). All components of demand have
been affected: lower net exports, subdued consumption growth, and lower investment. Based on
the projected behavior of the aggregate demand components, various studies forecasted economic
Figure 1: Correlation between Egypt and OECD growth
-0.4
-0.2
0
0.2
0.4
0.6
0.8
1
19
75
19
77
19
79
19
81
19
83
19
85
19
87
19
89
19
91
19
93
19
95
19
97
19
99
20
01
20
03
20
05
20
07
4
growth falling in FY09 to a range between 2 percent and 4.0 percent.4 Given that growth
averaged 4.7 percent in the first nine months of FY09, it is almost certain that it will be
moderately above 4 percent in FY09. Given the lag with which world recessions operate on the
Egyptian economy, we expect slightly lower growth rates for FY10, of between 3.5 and 4
percent.
The impact of the crisis is falling squarely on the activities which grew fast in recent years. Our
forecast scenario disaggregated by economic sector projects that only two sectors’ output will
fall: Restaurant and Hotels (-4.0 percent) and Suez Canal Services (-8.0 percent). Other sectors
will keep growing, though at a slower pace, especially Construction and Communications (both
up by 10 percent this year compared to 15 percent in FY08), Manufacturing and Trade, transport
and financial services (each up by about 4.0 percent compared to around 8 percent in FY08).
Given these individual sector forecasts, GDP would grow by 3.9 percent in FY09, slightly lower
than what aggregate macro modeling predicts.5
The external demand shock has resulted in lower output while input utilization, especially of
labor, has been slow to react, implying lower factor productivity or, alternatively, higher real
costs per unit of output.6 To track the effects of the crisis with micro data, the Bank conducted a
Rapid Survey of 200 firms to “take the pulse” of their sales, employment, capacity utilization, and
perception of macro constraints. The sample of firms was a subset of the Investment Climate
Assessment (ICA) sample and it is representative of the composition of Egyptian firms (Annex
3). The survey shows that the median firm decreased its sales by 29 percent7, while employment
fell only by 5.6 percent. The most severely affected sectors were: plastic, tourism services, non-
metal industries, metal industries, and hotels. Capacity utilization fell by 21 percent on average,
from 70 percent utilization level to 55 percent.8 Hence, while output (measured by sales) fell
quickly, employment has been slow to adjust, and the capital stock remains fixed, increasing the
cost per unit of output. The fall in measured productivity resulting from external shocks has been
documented before. For instance, Calvoet. al. (2006) documented it in countries that suffered
sudden stops in capital flows.9
The cyclical fall in productivity must be framed within a longer-term perspective. The
procyclical behavior of productivity along the business cycle has been well documented and
researched in developed economies (Bernanke, 2000). In these economies, productivity has a
stable long-run trend, and deviations from it are reversed through time. The shocks are transitory,
and they explain most of the volatility of the series. Hence, a productivity rebound could take
place after the global economy recovers in these circumstances. However, in emerging
economies, the productivity trend is more volatile, and hence shocks tend to be more persistent.
In these economies, the volatility of productivity and growth is explained mostly by changes in
the trend. In these circumstances, shocks will be more persistent. For instance, in Mexico, factor
4 Other estimates include those of Abou-Aly, 2008 (4 percent in FY09), the IMF, 2009 (3.6 and 3 percent in FY09 and
FY10, respectively), and the Ministry of Economic Development, 2009 (4.4 and 4.0 percent in the same years). 5 The discrepancy between the two, less than half of a percentage point, lies well within the margin of statistical error
that the aggregate macro-econometric models have, or that arise from aggregating growth forecasts from 10 different
sectors. 6 Harberger (2005) uses interchangeably the terms productivity growth and real cost reduction (RCR) arguing that
growth and production take place at the enterprise level, and the second term is better understood by entrepreneurs. 7 This figure drops to 20 percent when sales- weighted results are considered. Inventories increased moderately by 4%,
hence the drop in sales implies a fall in output. 8 The largest falls occurred in Chemicals,(fell from 80 percent to 50 percent) and in Metallic Industries (fell from 79
percent to 60 percent). 9 Other studies are: Conesa et. al. (2007) studied the case of Finland after the collapses of its mayor trading partner, the
Soviet Union. Also, Bergoeing et.al. analyzed the case of Chile and Mexico after the interest rate shock of the 1980s.
5
productivity recovered its pre-Tequila level only five to six years after the shock (Aguiar and
Gopinath, 2007).
The crisis may have a long-lasting impact on factor productivity for several reasons. First,
reduced spending levels in developed economies in the years to come will generate a subdued
global demand for Egyptian goods and services. Consequently, exports will grow at a slower
pace, reducing long-run growth prospects, as export growth has been one of the engines and traits
of the “growth champions” across the world in the last four decades (Harberger, 2005). Second,
as aggregate demand shifts from tradable producing sectors towards non-tradable sectors, such as
construction and retail trade, resources will be reallocated to the latter, which generate less value
added per worker. Therefore, aggregate productivity will decrease. Due to costly labor mobility10
,
resources will not be reallocated in tandem with the global recovery. Third, limited and more
expensive access to finance for international corporations will slow down foreign direct
investment, resulting in subdued capital formation. These expected outcomes imply slower
technology transfer and lower capital/labor ratios, and hence, lower labor productivity. Fourth,
the return of migrants from the GCC countries will imply less worker remittances, which are used
productively by households (Assad et.al., 2009a) and have a positive effect on schooling (Assaad,
et.al.2009b). Therefore, to mitigate these likely productivity-depressing long-lasting effects of the
recent crisis, structural reform policies that support real cost reduction must be resumed.
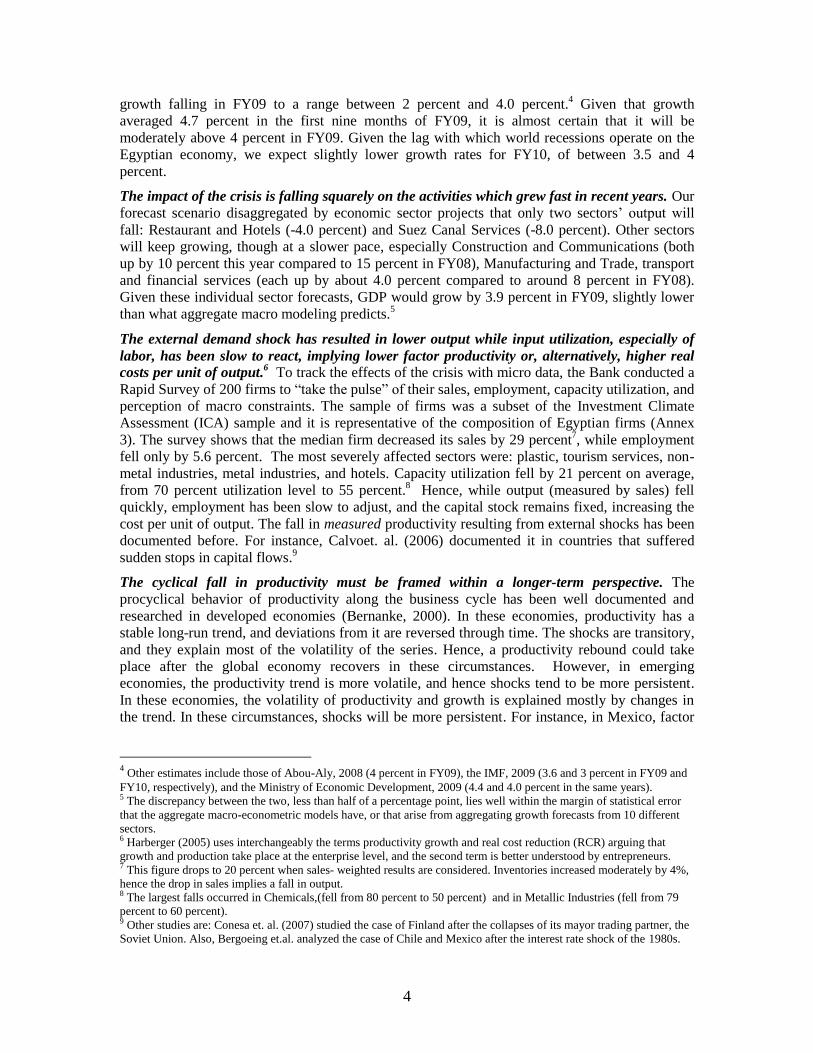
Evidence for Egypt shows that factor productivity falls when unsustainable policies are
adopted and rises during periods of market-oriented reform. Figure 3 illustrates the medium-
term trend of the marginal productivity of capital.11
Periods of falling productivity, such as in the
eighties, were characterized by rising public spending (the ratio of public investment to private
investment doubled), fiscal deficits that relied on the inflation tax to be financed12
, and currency
pegs leading to overvalued currencies that, jointly with the excessive spending, resulted in large
current account deficits. The rise in productivity registered during the nineties can be associated
with two factors: First, the trade policy reform that reduced the simple average tariff from 42
percent in 1991 to 26 percent in 1998. The reform process stalled in the early 2000s: during 2000-
2004, the trade-weighted tariff rose to 20 from 15.4 percent in the period 1995-1999. In 2005-
2007, it was reduced to 13 percent. Macro aggregate data confirms a positive impact of trade on
growth (Loayza, 2009). And microeconomic evidence from firm level data across countries
shows that firms that engage in trade are more productive (Teal, 1997; Escribano, 1997).
Evidence for Egypt supports this hypothesis by showing that exporting firms grow faster than
non-exporting units (Stone, 2009). The second factor associated with rising productivity during
the nineties is the growing importance of private investment in overall capital formation (World
Bank, 2008). The ratio of private investment to public reached a low of .34 in the early nineties
that rose to 1.0 by the end of the decade. Studies have estimated that aggregate productivity has
been depressed by 30 percent due to the lower productivity of public production of goods and
services and the widespread government participation in production; these facts also explain
about 20 percent of Egypt’s labor productivity gap with the United States (Schmitz, 2001).
Hence, the longer term perspective of factor productivity indicates that trade facilitation and
reduction of the size of public sector activities relative to the private sector should be essential
elements of any policy package to increase productivity.
10 The 2008 Doing Business indicators show that Egypt tops the list of countries on the ending employment costs: the
cost of firing, in terms of week’s wages, is 132, while in India it is 56, in Tunisia 17, in Morocco 85, and in Brazil 37. 11 It is shown in PRMED (Annex 1) that the marginal productivity of capital can be approximated by the ratio between
the rate of growth of GDP and the investment share in GDP. 12 The inflation tax in the late eighties in Egypt was estimated at almost 12 percent of GDP (Dinh and Giugale, 1991)
6
Figure 3: Trend of the Marginal Productivity of Capital in Egypt (1975-2008)
The impact of the shock on employment will depend on its effect on industries that are labor
intensive and produce mainly for the domestic market. Two sectors are directly affected by the
global crisis and will register contraction in their employment: Restaurants and Hotels (down by
2.4 percent), and Suez Canal (down by 2.6 percent). Egypt has important sectors that generate
value added that are natural resource based (Oil extraction and Natural gas) or capital intensive
(Suez Canal Services). For this reason, the effect of the crisis on aggregate employment will be
smaller than in East Asian countries, where the crisis has resulted in virtual collapse of labor
intensive manufacturing exports, or in Eastern European countries where credit disruption is
severe and unemployment widespread. Labor earnings are buffered by the low labor share in
value added in these activities; in contrast, profits and rents are expected to suffer
disproportionately.
The crisis also affects employment indirectly by reducing demand for labor in activities that
supply inputs to the natural resource based sectors. Except for tourism, all non-natural resource
based sectors will keep positive growth rates of employment, though at a much slower pace.
Sectors with largest contribution to jobs generation are Government (30 percent of the total),
Construction and building (18.3 percent), Manufacturing and Agriculture (each with around 13
percent), and Trade, transport and financial services (13 percent). It is worth mentioning that
approximately 40 percent of the employed population is in the informal sector, and one half of the
wage worker population is in the public sector.13
13 El Mahdi and Rasheed (2009) show figures based on the 2005 labor Force Survey. Informality is calculated as the
sum of employers, self-employed, and unpaid family workers. They report 6.4 million public sector employees, and the
total wage worker population was 13.9 million.
-1.6
-1.2
-0.8
-0.4
0.0
0.4
0.8
1.2
1.6
2.0
2.4
1975 1980 1985 1990 1995 2000 2005
Source: Adapted from PRMED, Annex 1. Series normalized to make
the average of the entire period equal to zero
7
Overall employment growth will likely decelerate over the next two years. Based on our
forecasted sector growth rates and each sector’s elasticity of demand for labor, we estimate that
the employment growth rate will fall to around 2.3 percent (PRMED), down from the 4.6 percent
average registered between 1998 and 2006. This growth estimate is similar to that of El-Ehwany
and El-Megharbel (2008).14
The downward trend of unemployment will reverse and the adjustment might be protracted. If
the labor force maintains the average growth rate of the past two years (4.3 percent) and
employment growth falls to 2.3 percent as indicated above, the unemployment rate would rise to
10 percent by the end of 2009, up from 8.9 percent in FY08. This rate could increase up to 10.5
percent depending on the specific assumptions on the returning migrants from the Gulf
countries.15
This estimate coincides with econometric calculations based on the historical relation
between economic growth and unemployment in Egypt for the period 1980-2007. An
autoregressive distributed lag (ARDL) model yields a short-run coefficient of the changes in
growth of close to 0.3, implying that a drop of 3 percentage points in growth (from 7 to 4 percent)
would be associated with an increase in unemployment of about 1 percentage point (Annex 4).
Employment growth will vary greatly across sectors. The final employment outcome will be
heavily influenced by developments in two sectors due to their relative importance in
employment generation: Manufacturing Industry, with 13.2 percent of total employment, and
Building and Construction with 7.9 percent. To get an early read on how employment would
likely be affected in each sector, the Bank conducted a rapid survey of 200 firms. The survey
shows that the largest falls in sales were in plastic, tourism services, non-metal industries, metal
industries, and hotels (see Annex 3.) Hence, the manufacturing and services sectors, that are
labor-intensive activities, were certainly being affected.
The labor market will be a cause of concern; we anticipate lower job creation, higher job
destruction, and increases in the size of the informal labor market. International evidence
shows that sudden stops in capital flows result in higher job destruction and lower job creation,
with the impact being stronger in countries with more onerous labor regulation (Gallego and
Tessada, 2008). In addition to the effect of the sudden stop on job flows, the Bank’s Rapid Survey
(Annex 3) shows that large manufacturing firms are reducing employment more than small firms,
making it likely that informal employment will increase. In emerging economies, the informal
labor market expands as economic activity contracts, and hence it is countercyclical in nature
(Perry, et.al. 2008). The expected increase in informality is the result of two factors: a) wages are
more flexible in the informal sector, and hence when productivity falls, the hiring drop in the
formal sector will be larger; and b) the shock has been primarily to the tradable sector, composed
mostly of formal sector firms. The rise in informality is worrisome because the quality of the jobs
is, in general, lower than in the formal sector.
The private sector survey also shows that small enterprises’ sales (a proxy for output) fell more
than in large ones. Sales of small enterprises fell by 32 percent, while those of large firms
dropped by 19 percent. This implies that either the demand shock was larger for smaller
enterprises, or that they had a lower initial level of productivity and profit margin that forced
them to adjust quicker upon the fall in demand. Given that the shock was mostly to the tradable
sector, and large firms make the large part of the exporting units, it is unlikely that smaller firms
14 El-Ehwany and EL-Megharbel, 2008 found that a one percentage point change in the economic growth would lead to
0.53 percentage points change in employment in the same direction. 15 This is based on the assumptions that 15 percent of the Egyptians working in the Gulf will return in 2009, and 50
percent of them will seek jobs in the Egyptian market while the remaining will be self-employed. Our base calculations
use a conservative estimate (by Nassar, 2009) of 2 million Egyptians working in the Gulf. Other estimates are as high
as 4 million. Using this higher number would increase the unemployment forecast to 10.5 percent.
8
suffered the blunt of the initial shock, making more plausible the hypothesis of their lower initial
productivity level. Maybe the small firms’ lack of access to credit renders them unable to smooth
out shocks perceived as transitory and are forced to adjust more and quicker than larger firms.
Whether it is credit constraints forcing small firms to adjust or their lower productivity level
driving them out of the market requires further research. But if output contraction in small
enterprises continues, the rise in unemployment will be larger than anticipated.16
Any policy
should, however, be directed towards increasing productivity in these units rather than artificially
maintaining unproductive ones in operation.
II. STABILIZATION PACKAGE ADOPTED BY THE GOVERNMENT
The Government of Egypt adopted a series of measures with the aim of stabilizing output
growth around 5.5 percent, which is the level consistent with a constant unemployment rate
and a reasonable estimate of the potential growth rate of the Egyptian economy. 17
The
government increased its spending by LE 13 billion on infrastructure (mainly sewage and
drinking water) and supporting manufacturing. Another LE-15 billion investment plan under the
modality of public private partnerships (PPP) is directed towards infrastructure projects in
education, health, wastewater treatment, and transport. In addition to the fiscal stimulus package,
the Central Bank of Egypt (CBE) cut its lending interest rate by 250 basis points by May 2009.18
Also, it eased reserve requirements by counting commercial banks’ loans to small and medium
size enterprises (SMEs) as reserve requirement holdings. Other measures include a one year-
freeze of the energy subsidy phase-out plan until December-09, lowering tariffs on over 250
items of imported intermediate and capital goods, and offering sales tax exemptions on capital
goods. This section discusses the medium term sustainability of the policy mix adopted to
confront the crisis.
Regarding the fiscal stimulus package, there are two major issues to address: a) its impact on
GDP, and b) its effect on fiscal sustainability given the country’s relatively high debt.
A. The impact of the fiscal stimulus package on GDP
Most fiscal stimulus packages feature increasing government spending to offset the fall in
other components of aggregate demand. They are effective if they result in production of goods
and services valuable to the consumer via employing labor and capital that are idle or being used
in activities that render a lower marginal productivity. At the other extreme, stimulus packages
may be ineffective if the additional government spending results in an identical increase in
imports, if they produce goods and services of zero value to the consumer and do not affect net
employment or if they imply contraction of private sector activities with higher marginal
productivity of the resources drawn towards the public sector. The non-spending part of stimulus
packages, such as transitory exemptions of labor tax obligations and delays in implementing the
phase out of the energy subsidy have two problems: a) in the short term, the direction of these
changes is correct but they clash with long term objectives of economic efficiency and
16
El Mahdi and Rasheed estimate that 39% of total employment is in small and medium size enterprises
(SME), or enterprises with less than 50 workers. 17
A simple regression of the change in unemployment on (non-hydrocarbon) GDP growth during 1998-
2007 shows a natural rate close to 5.5 percent (see FGM). Also PRMED has in Annex 1 a detailed
discussion. 18
The CBE deposit rates were lowered by 200 basis points in the same period.
9
sustainability; and, b) these programs are more ad-hoc, difficult to assess and imply high
governance costs.
The stimulus implied in the Government’s spending package is lower than what would be
needed to offset the full impact of the fall in external demand. Econometric analysis shows that
the increase in public investment necessary to achieve a 1 percent growth in Egypt ranges
between 2 and 4 percent of GDP (see FGM, Annex 2 and Herrera, 2008). So the stimulus
package of 1.5 percent of GDP (which includes public investment as well as other categories of
public spending) will not be sufficient to restore growth to the 2008 level.
The low impact of public investment on GDP is explained by the leakage of resources between
investment and capital, and because there is some substitution between public and private
capital in the short run. It is important to differentiate between investment and public capital, as
not every dollar of investment effort is translated into a dollar of capital stock. There are leakages
or “inefficacy” of investment, and given accounting practices, some current expenditures may be
included as investment. Additionally, there is evidence of strong substitutability between public
and private capital in the short run in Egypt. In the long run, however, these two factors may be
complements (Herrera, 2008 and Fawzy et.al, 2006; World Bank, 2008). Both points imply the
need of rigorous economic analysis of individual projects to ensure the rationale of public sector
intervention, and to minimize the leakage from public investment to public capital. Otherwise, the
increase in public spending will not have the desired impact on growth and will leave the
economy worse-off due to the increased indebtedness or higher taxation required to pay for it.
B. The sustainability of the fiscal scenario
The case for higher public spending must be balanced by a concern for sustainability given
that Egypt’s public debt is already high at around 60 percent of GDP. Egypt’s public debt is
currently around 60 percent of GDP, down from about 80 percent in 2005. This fall has been the
result of the reduction in primary deficits, high nominal GDP growth, and the appreciation of the
currency. These factors will not persist in the near future: primary deficits will remain stable,
inflation and real GDP growth will decline significantly, and the currency will not continue
appreciating. Hence, the rapid fall in the debt to GDP ratio will be stopped, though this should not
be a matter of concern in the medium term (for more details, see FGM, Annex 2).
As long as the stimulus program is temporary, Egypt’s fiscal situation will continue to be
sustainable. The results of our debt sustainability analysis under multiple scenarios of growth,
inflation and exchange rate depreciation show that, as long as the primary deficit does not exceed
the 2009 observed level by too much, and goes back to the planned reduction path, fiscal
sustainability should not be a real concern. The most likely event will be a small and temporary
rise in the debt ratio of no more than 1 percent of GDP by 2010, reverting to a downward trend.
Even in the extreme case of zero growth in 2010, debt would increase by 2 percentage points of
GDP by the end of that year, and then would resume its downward trend. The key driver of debt
dynamics in Egypt is the high potential growth rate of the economy with relatively low cost of
servicing the debt.
A credible medium term fiscal plan is essential to reduce stabilization costs associated with
agents’ misperception of the overall policy direction. Our analysis shows that a fiscal plan which
targets the overall deficit in a volatile inflation environment- as in Egypt could be very
misleading. Our sustainability simulations shows that changes in the inflation rate (more precisely
in nominal growth) may lead to sizeable differences in debt accumulation for the same overall
budget deficits. Figure 4 illustrates the difference in debt accumulation between fiscal plans that
target the same overall deficit (the sum of the primary deficit plus interest payments), but
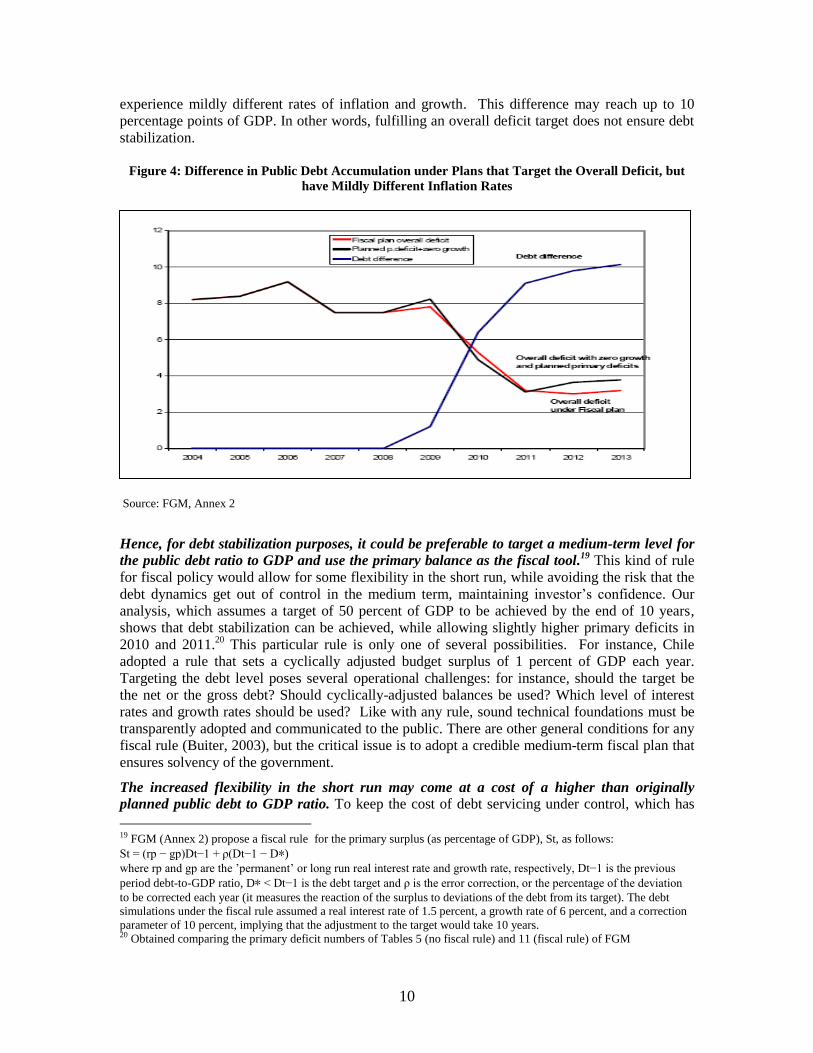
10
experience mildly different rates of inflation and growth. This difference may reach up to 10
percentage points of GDP. In other words, fulfilling an overall deficit target does not ensure debt
stabilization.
Figure 4: Difference in Public Debt Accumulation under Plans that Target the Overall Deficit, but
have Mildly Different Inflation Rates
Source: FGM, Annex 2
Hence, for debt stabilization purposes, it could be preferable to target a medium-term level for
the public debt ratio to GDP and use the primary balance as the fiscal tool.19
This kind of rule
for fiscal policy would allow for some flexibility in the short run, while avoiding the risk that the
debt dynamics get out of control in the medium term, maintaining investor’s confidence. Our
analysis, which assumes a target of 50 percent of GDP to be achieved by the end of 10 years,
shows that debt stabilization can be achieved, while allowing slightly higher primary deficits in
2010 and 2011.20
This particular rule is only one of several possibilities. For instance, Chile
adopted a rule that sets a cyclically adjusted budget surplus of 1 percent of GDP each year.
Targeting the debt level poses several operational challenges: for instance, should the target be
the net or the gross debt? Should cyclically-adjusted balances be used? Which level of interest
rates and growth rates should be used? Like with any rule, sound technical foundations must be
transparently adopted and communicated to the public. There are other general conditions for any
fiscal rule (Buiter, 2003), but the critical issue is to adopt a credible medium-term fiscal plan that
ensures solvency of the government.
The increased flexibility in the short run may come at a cost of a higher than originally
planned public debt to GDP ratio. To keep the cost of debt servicing under control, which has
19 FGM (Annex 2) propose a fiscal rule for the primary surplus (as percentage of GDP), St, as follows:
St = (rp − gp)Dt−1 + ρ(Dt−1 − D∗)
where rp and gp are the ’permanent’ or long run real interest rate and growth rate, respectively, Dt−1 is the previous
period debt-to-GDP ratio, D∗ < Dt−1 is the debt target and ρ is the error correction, or the percentage of the deviation
to be corrected each year (it measures the reaction of the surplus to deviations of the debt from its target). The debt
simulations under the fiscal rule assumed a real interest rate of 1.5 percent, a growth rate of 6 percent, and a correction
parameter of 10 percent, implying that the adjustment to the target would take 10 years. 20 Obtained comparing the primary deficit numbers of Tables 5 (no fiscal rule) and 11 (fiscal rule) of FGM
11
been one of the key drivers of the past successful debt reduction strategy, it is important to
consider international evidence that shows a direct relationship between fiscal variables and the
cost of debt service (Caselli, et.al, 1998: Drudi and Pratti, 2001; Herrera and Salman, 2008).
Based on this evidence, we estimate that an increase of the debt ratio by one percentage point of
GDP would raise the cost of funding by up to 40 basis points.21
To mitigate the immediate impact
on the cost, it is essential to have a medium term fiscal plan to reassure investors that the
governments will fulfill its debt servicing commitments. Hence, a medium-term fiscal plan that is
transparent and easily monitored would reassure investors of the government’s sound fiscal
fundamentals. A public debt management strategy should be part of the medium-term fiscal
planning.
Public debt management has seen significant improvement, but more is still needed. In general,
the government has followed sound borrowing policies in recent years; however, coordination
among the parties involved in debt management is limited, with the risk that possible cost savings
and efficiency gains from taking an overall portfolio view are overlooked. Specifically, no
formal strategy for debt management, covering both domestic and external debt and outlining the
preferred debt composition in the medium term, is in place. A comprehensive debt management
plan would explicitly take the macro-economic environment into account, including potential
needs for external borrowing to fund external imbalances
More specifically, there is a need for continued effort in development of capital markets in
Egypt so that public debt managers can extend maturities and diversify the debt holders base.
Of the total public debt, 70 percent is domestic and 30 percent is external. Within the domestic
debt, the marketable component (T-Bills and T-Bonds) has increased over time: in June 2005 it
was 31 percent of gross consolidated government domestic debt, and by December 2008 it had
risen to 66 percent. This progress is welcomed and allows more market determination in prices.
However, the marketable debt is relatively short term, and ownership is concentrated on banks. In
terms of duration, T-bills’ relative importance within the marketable portfolio was decreasing in
favor of bonds until 2007/2008 when it reached a low of 32 percent of the total. However, this
ratio increased to 49 percent by December 2008. In terms of ownership, in February 2009, public
banks held 46 percent of outstanding T-Bills, up from 31 percent in 2005.
There is also a need for a debt management that reassesses the risk of external finance. The
foreign currency denominated debt has had a declining importance within the overall government
debt at least since 2003 when it was about 43 percent of the total. The composition between
external and domestic (marketable) debt shows that in the debt management model, the implicit
rate at which US dollars are traded for LE is significantly higher than the market price (nominal
exchange rate). The ratio of marketable debt to external debt has increased significantly since
2005. That ratio was LE 5.9/US$ in 2005, very similar to the nominal exchange rate, but by
December 2008 it had risen to 11. Hence, the rate at which dollars are traded for Egyptian pounds
in the public debt portfolio reveals a price of the dollar substantially higher than the market price.
Given the fall in the external cost of finance, and the changed perspective of the balance of
21 A panel of developing countries shows that sovereign spreads are a function of the debt ratio (Herrera and Salman,
2008). The coefficient of the lagged debt ratio in the homogenous panel estimation is around 0.4, or 40 basis points.
Allowing heterogeneity in the spread’s response to debt, the range of estimates goes from 13 basis points to almost 60
basis points. The lowest estimate had an average primary surplus of over 4 percent of GDP during the period, which is
far from Egypt’s situation. A different method, employed by Suescun (2007) calibrates a general equilibrium model
for Latin American countries. Adopting his same formulation for the cost of debt, but scaling the initial level of
interest rates in Egypt by the ratio of the marginal productivity of capital in Egypt to the LAC countries estimated by
Caselli and Freyer (2006), yields a very similar estimate of close to 40 basis points. Our estimate of 40 basis points is
higher than the 10 basis points estimated by Casseli, Giovannini, and Lane for the OECD economies, which, we think,
is an intuitive result.
12
payments in the medium term, it would be useful to develop a model that reassess the risk of
external finance, and that balances the lower financial cost and any additional perceived risk.
C. Other stabilization policies
In the past few years, monetary and exchange rate policies have been intertwined due to the
increased demand for LE-denominated assets and international capital flows. During the
capital inflows period (2004- mid 2008), international reserves increased from US$15 billion to
US$35 billion. The nominal exchange rate appreciated from LE6.2/US$ to LE5.4/US$. The
expectation of currency appreciation fueled additional capital inflows. As a result, domestic
money (M1) growth rates increased from 15 percent to 35 percent in the period. The ratio of M2
in local currency to GDP increased from 64 percent to 69 percent, where it stabilized until June
2008. With higher monetary growth rates, GDP growing above its potential growth rate22
, and
external supply shocks (international commodity price increases), inflation rose. The increased
demand for LE-denominated assets, and higher inflation, generated fiscal revenues that were used
to accumulate international reserves.
The sudden stop in capital flows, and the exit of foreign investors from the stock market and
the Government T-Bills market, completely changed the panorama. At the end of April 2009,
net international reserves were US$ 31.2 billion, down by US$3 billion from the December 08
level (US$ 34.1 billion). This fall understates the decrease in international liquidity for two
reasons: a) it does not include other CBE’s foreign currency assets that fell by US$600 million in
January and February (most updated figures on this variable); and b) it includes non-liquid assets,
like gold, SDR and loans to the IMF. At the end of July 2008 total liquidity (international
reserves plus other foreign currency assets) stood at US$ 46 billion, so the loss of liquidity during
the second semester of 2008 was close to US$12 billion. The fall in international reserves
responds to a fall in demand for LE-denominated assets: M2 in local currency fell to 56 percent
of GDP in the last quarter of 2008, and foreigner’s holdings of T-Bills fell from LE 32 billion to
LE 11 billion, approximately US$ 4 billion. In addition, foreigner’s nets sales in the stock market
are estimated at about US$ 1 billion during the period August-March 09. This indicates that the
capital outflow has other sources beside foreigners stampeding out in times of crisis. The
observed fall of international reserves, the uncertainty regarding the duration of the international
global crisis, and existing projections of the current account for the medium term, call for more
exchange rate flexibility.
Medium term balance of payments (BoP) projections indicate that this will be the major
constraint to the Egyptian economy in the near future, implying the need for changes in
exchange rate policy and public dent management strategy. The IMF WEO 2009 forecasts a
current account deficit of about 3 percent of GDP in 2009 and 4 percent of GDP for 2010.
Hence, in the medium term, policymakers should expect increased pressure on international
reserves. Part of it can be relieved by letting the currency float more freely and by modifying the
public debt management strategy. Both of the technical background papers in Annexes 1 and 2
coincide on the need of securing external finance in the medium term.
Though allowing the currency to absorb part of the shock could have an impact on inflation
and inflation expectations and, hence, become a destabilizing factor accelerating capital
outflows (FGM), we believe that the risks of not letting the currency absorb part of the external
shock outweigh the benefits of continued intervention. The main empirical difficulty lies in
assessing the impact of currency depreciation on inflation and expected inflation. A recent paper
estimated the exchange rate pass-through at about 20 percent (Kraay, 2006). However, the entire
22 Both background technical papers estimate at about 5.5 percent the potential growth rate through different methods.
13
impact of the exchange rate operates through food prices: separating the price of food and
working with a core price index completely mutes the impact of the exchange rate on inflation.
Hence, the impact of the exchange rate on core prices is limited, making likely that its effect on
inflation expectations would be limited. Given the subdued level of world demand, and the
observed recent trend in producer prices in Egypt, it is unlikely that currency depreciation would
affect inflation expectations significantly.
Allowing more flexibility in the exchange rate would have multiple benefits: a) it would support
the export diversification and development of a modern non-traditional economy occurred in the
recent past (PREM): b) it would compensate the negative impact of the sudden stop on job
creation and destruction. Evidence shows that the impact of the sudden stop on capital flows is
smaller in countries that simultaneously have an adjusting currency in real terms (Gallego and
Tessada, 2008). Yet, some argue that the currency adjustment would have a limited effect given
that external demand is subdued (FGM). Similarly, they argue that given that other countries are
allowing their currencies to depreciate, this wouldn’t be a solution from the global perspective.
However, Egypt might be caught in the prisoner’s dilemma: though the most efficient outcome
would be for no emerging economy to depreciate its currency, Egypt would be losing ground if it
does not react as other market players are adjusting. In addition to the improved resource
allocation derived from the nominal exchange rate flexibility, the country would maintain
adequate international liquidity which is essential to attract foreign direct investment when global
conditions return to normalcy.
III. POLICY RECOMMENDATIONS
Overall, the stabilization package has been prudent. The scale of the proposed stimulus has
respected the concern that Egypt still has a relatively high public debt ratio. The policy package
has also focused on transitory measures that can be scaled down when necessary. Still, it would
be appropriate to complement the stabilization package by maintaining a focus on improving the
investment climate and enhancing labor productivity to support real cost reduction in the medium
term through some of the following measures.
A. Immediate and short-term measures:
1. To increase productivity and stabilize growth:
Include in the fiscal stimulus package investment that enables quick recovery as soon as the
global context improves. As the size of the fiscal stimulus package is not enough to fully
compensate for the impact of the external shock, its composition becomes even more crucial in
the medium term. Though shovel-ready programs may have benefits, any additional spending has
to be subject to technical scrutiny that justifies public intervention and ensures it will not crowd-
out private investment. For example, the transport sector has projects well advanced in the
appraisal process that would contribute the reduction of congestion costs, which, as discussed
below, affect labor productivity and job creation.
Gear spending and policy towards improving labor mobility. Improving the quality of education
in Egypt is essential towards having an adaptable labor force and worker base that learns quickly
new activities. However, this is a long-term agenda with limited impact in the near term. In the
short run, improving vocational training or on-the-job training may have a stronger impact. But
the rate of return of vocational training in the context of low-wages and low-productivity jobs in
14
the private sector is not crystal clear (Kahyarara and Teal, 2008), nor is the rationale for the use of
public resources in promoting on-the-job-training. On the other hand, international evidence is
quite clear on the relationship between congestion costs and labor productivity and employment:
congestion costs are negatively related to labor productivity and job creation. Rice and Venables
(2004) show that a 10 percent reduction in commuting cost will increase labor productivity by 1
percent to 2 percent. Similarly, employment growth is negatively associated with congestion,
with reported elasticities ranging between 0.25 and 0.47 (Hymel 2009): a 10 percent reduction in
travel times will increase job creation by 2.5 percent to 4.7 percent.
Although reducing congestion is a long-term plan23
, there are a series of policy actions and
relatively inexpensive investment components that need urgent implementation and that can
reduce congestion costs. For instance, the creation of a Metropolitan Urban Transport Authority
to coordinate, regulate and prioritize urban transport activities would be conducive to reducing
congestion in the medium term with almost no budget impact. Other policies could include: 1)
transforming the existing obsolete Metro Heliopolis into a modern and fast Light Rail Transit
(LRT) and its extension to New Cairo City; 2) replacing old buses and minibuses with new large
capacity buses operating with energy efficient clean technology; 3) Putting in operation 3 major
Bus Rapid Transit (BRT) corridors (dedicated bus lanes); and 4) increasing gradually users
tariffs and reduce gasoline subsidies so that equivalent funds can be spent on improving transport
conditions while reducing the economic costs of congestion.24
Continuing trade reform is essential to support factor productivity growth in the medium term.
In particular, reduction of effective protection rates (World Bank, 2008) and acceleration of the
negotiation of the free trade in services with the European Union will have significant effects on
reducing transport costs and increasing growth. For instance, it is estimated that removing
barriers to trade in transport services would reduce the export costs to the EU by 10 percent and
import costs from the EU by 16 percent. This efficiency gains could imply up to 1 percent of
additional growth per year (World Bank, 2009)
The exchange rate should be allowed to reflect the changed short-term and medium-term
market conditions. More exchange rate flexibility would have multiple benefits: a) it would
support the export diversification and development of a modern non-traditional economy
occurred in the recent past (PREM): b) it would compensate the negative impact of the sudden
stop on job creation and destruction. Evidence shows that the impact of the sudden stop on
capital flows is smaller in countries that simultaneously have a depreciating currency in real terms
(Gallego and Tessada, 2008). To maintain inflation expectations under control, the CBE could
continue its prudent strategy of reducing only gradually the policy rates. Given the uncertain
impact of interest rates on economic activity (Al-Mashat and Billmeier, 2007), the benefit of a
more lax monetary policy is not clear. Instead, the benefits of a more depreciated currency will
last over time. In addition to allowing exchange rate flexibility, a more transparent market
intervention mechanism would be beneficial. This policy should be coupled with a public debt
management which prices the currency more aligned with the market, and that balances the risk
of additional lending in foreign currency with the benefit of lower financial cost.
2. To protect work conditions of employment and avoid increases in unemployment:
Reduce firms’ labor costs by exempting them temporarily from their social insurance
contributions. Given that these contributions are based on wages that are downwardly rigid, and
23 The full implementation of the Greater Cairo Transportation Master Plan (GCTMP) will cost US$17.4 billions and
will take many years to be implemented 24 There are no updated estimates of the economic costs of congestion in Cairo. In developed economies, this cost
oscillates between 1% of GDP to 3% of GDP (Scottish Government, 2006)
15
profits are falling, the effective marginal taxation rate will rise. This is the opposite direction in
which tax rates should move to facilitate recovery from a negative shock to investment. The
exemption of payment would be temporary, and applicable only to firms that do not cut
employment. The government would give automatic credit to the firms, and when the labor tax
holiday is over, firms would repay the social contributions in monthly installments.
Expand credit and non-financial services to small and medium enterprises. Given the expected
rise in informality25
, and as the previous recommendation affects mostly the formal sector, this
component of the policy package is vital. Although the CBE already moved in this direction, this
will mostly affect the formal sector SMEs. There is evidence that the informal firms receive their
loans from suppliers, the Social Fund for Development (SFD), or public banks. But banks are
hoarding liquidity in Egypt. Hence, expansion of activities of the SFD is critical to reach the
informal sector, as long as the service is decentralized, close to the client and service-oriented
(World Bank, 2009). This recommendation requires some caveat: Given that more successful and
profitable firms tend to grow, the risk exists that smaller informal firms concentrate less
productive units. International evidence shows that informality is associated with lower
productivity (Perry, et. al., 2007), and for Egypt, there is some evidence that, within the formal
sector, larger firms are more efficient than smaller ones (Stone, 2009). Hence, the credit and non-
financial services should be oriented towards firms that have strict profitability analysis of the
projects being undertaken and robust expansion plans.
B. Medium-term measures
Phase out energy subsidy. While the government decision to interrupt the scheduled program of
energy price adjustments for large firms is appropriate only as a temporary solution, the energy
subsidy phase-out is a major macroeconomic consistency requirement in the medium term. This
will allow Egypt’s development strategy to be consistent with its comparative advantage in labor-
intensive activities. Historical evidence shows that countries that adopt comparative-advantage
defying strategies are doomed to fail in the long run.
Facilitate labor reallocation. Here, reducing the cost of firing personnel, training laid-off
workers, will facilitate taking advantage of the recovery in the world economy. The ICA 2009
results show that firms in Egypt would hire 22 percent more workers in the absence of onerous
labor regulations (Stone, 2009).
Other measures to increase productivity. Given the uncertain productivity of small informal
firms, a prudent strategy would include, in addition to a well-monitored expansion of credit to the
small informal firms, a) continuing reducing the cost of formalization; and b) continuing
promoting productivity growth through improvement in the investment climate and quality of
human capital accumulation. Egyptian evidence shows that during periods of sound and
sustainable economic reform, in which private investment increase relative to public investment,
overall factor productivity increases.
Adopt a medium-term fiscal plan that ensures government solvency. Such a plan could target
the debt ratio in the medium term and use the primary balance as the fiscal tool to achieve the
objective. While a fiscal plan which targets the overall deficit in a volatile inflation environment-
as the case is in Egypt, could be very misleading, targeting the debt level would allow for some
flexibility in fiscal policy while avoiding the risk that the dynamics of the debt gets out of control,
maintaining investor’s confidence.
25 The informal sector represents 37 percent of total employment. This number includes self employed, employers and
unpaid family workers (El Mahdi, 2009)

16
Gear the necessary safety net towards accommodating the rise in unemployment to levels of
about 10 percent. The global financial crisis revealed how the increased volatility can expose
large shares of the population to the risk of downward mobility. Even though the coverage,
adequacy and targeting of safety nets have improved over 2005-2008, they remain too weak to
prevent falls into poverty and respond to the increased volatility of the global economy. Keeping
people from becoming the new poor, via introducing unemployment insurance scheme, and
public works programs, should be as an important part of poverty reduction strategy as helping
those who are currently poor to get out of poverty.
17
References
Abou Aly, Soltan, 2008. The Global Financial Crisis and its Implications for Egypt, ECES
Working Paper No.142, December, The Egyptian Center for Economic Studies
Aguiar,M. and G. Gopinath (2007) “Emerging market business cycles: the cycle is the trend”,
Journal of Polictical Economy, February.
Al Mashat and Billmer 2007. The monetary transmission mechanism in Egypt. IMF Working
Paper.
Assad, R. and C. Binzel (2009a) The Impact of International Migration and Remittances on
Domestic Labor Markets:Evidence from Egypt
Assad, R., C. Binzel, A. El-Badawy, R. Roushdy, A. Rashed. (2009b) The impact of migration
and remittances on those left behind.
Bergoeing, R. P. Kehoe, T. Kehoe, and R. Soto “A decade lost and found: Maxico and Chile in
the 1980s”, in T. kehoe and E. Precott, eds. Great Depresions of the Twentieth Century, Fedreal
reserve Bank of Minneapolis.
Bernanke,B.(2000) “Procyclical labor productivity and competing theories of the business cycle:
some evidence from interwar US manufacturing industries”, in B. Bernanke ed. Essays on the
Great Depression Princeton University Press. Princeton, New Jersey.
Buiter, W. (2003) Ten commandments for a fiscal rule in the EMU. Mimeo.
Calvo, G., E. Talvi and A. Izquierdo (2006) Phoenix miracles in emerging markets: recovering
without credit in systemic financial crises”, NBER paper 12101
Caselli, F., A. Giovannini, and T. Lane (1998) Fiscal discilpline and the cost of public debt
service: some estimations for OECD countriews. IMF Working Paper. April
Caselli and Freyer 2006 . The marginal product of capital. IMF Working Paper. November
Conesa, J. T. Kehoe, and K. Ruhl (2007) “Modelling great depressions: the depression in Finland
in the 1990s” Federal Reserve Bank of Minneapolis Quarterly Review. November.
Dinh, H. and M. Giugale (1991) Inflation tax and deficit financing in Egypt. The World Bank.
Working Paper Series 0668. May.
Drudi, F. and A. Pratti (2000) “Signaling fiscal regime sustainability”, European Economic
Review, 44.
El-Ehwany, Naglaa and Nehal El-Megharbel, 2008. Employment Intensity in the Egyptian
Economy: with a focus on Manufacturing Industries. ECES Working Paper No. 130, March, The
Egyptian Center for Economic Studies.
El-Mahdi, A. and A. Rasheed (2009) Egypt’s changing economic environment and the
development of micro and small enterprises :1998-2006. Mimeo.
Escribano, A. (2007) Investment Climate Surveys and Productivity (TFP) in Middle Income
Countries: Can we Identify Bottlenecks? World Bank workshop on Using Investment Climate
Assessments (ICAs) for Growth Diagnostics. PREM February
Fawzy, S. and N. El Megharbel (2006) “Public and private investment in Egyp: crowding out or
crowding in?” Fiscal Sustainability in Emerging Markets, A. Galal and N. Ul Haque eds. The
American University in Cairo Press.
18
Gallego, and J. Tessada (2008) “Sudden stops and labor reallocation: evidence from labor market
flows in Latin America”. Mimeo.
Harberger, A. (2005) On the Process of Growth and Economic Policy in Developing Countries.
USAID. PPC Issue paper No. 13. December.
Herrera, S (2008) Notes on the use of public investment as a counter-cyclical tool in Egypt.
Mimeo. World Bank. October.
Herrera, S. and F. Salman (2009): “Tangos, sambas or belly dancing: Or do spreads dance to
their own rhythm?. Mimeo. Presented at the Economists Forum. The World Bank. 2009.
Hymel, K. (2009) Does traffic congestion reduce employment growth? Journal of Urban
Economics, 65, pp.127-135
Kahyarara, G. and F. Teal (2008) “The returns to vocational training and academic education:
evidence from Tanzania” World Development, vol. 36 no. 11, pp. 2223-2242.
Loayza, N. and R. Odawara (2009) Infrastructure and economic growth in Egypt. Mimeo. World
Bank. June.
Nassar, Heba, 2009. presentation made at the Egyptian Federation of Industries
Perry, G. W. Maloney,, O. Arias, P . Fajnzylber, A. Mason, J. Saavedra (2007) Iformality: Exit
and Exclusion. The World Bank
Radwan, Samir, 2009. The International Financial and Economic Crisis: The Impact on the
Egyptian economy and Labor Market, presentation made at the Egyptian Federation of Industries.
Rice, P. and AJ Venables (2004) Spatial determinants of productivity : analysis for the regions of
great Britain. Centre for Economic Perormance paper 0642, LSE.
Schmitz, J.(2001) “Government production of investment goods and aggregate labor
productivity”, Journal of Monetary Economics, 47, pp. 163-187.
Scottish Government (2006) Costs of Congestion: Literature Based Review of Methodologies and
Analytical Approaches.
Stone, A. (2009) Egypt ICA 2009: Learning from the enterprise surveys. Mimeo. The World
Bank.
Suescun, R. (2007) The role of fiscal policy in human development and growth. LAC Regional
Study.
Teal, F. (2007) Using Firm Surveys for Policy Anlysis in Low Income Countries. World Bank
workshop on Using Investment Climate Assessments (ICAs) for Growth Diagnostics. PREM
February.
World Bank (2008) Transforming Egypt: A Development Policy Review. July.
World Bank (2009a) Growth in Upper Egypt. The World Bank. Mimeo.
World Bank (2009b). Transport and Logistics in a Free Trade Agreement between Egypt and the
Uropena Union. Mimeo.